
Investigation of Home Energy Management with Advanced Direct Load Control and Optimal Scheduling of Controllable Loads


 ,
,  ,
,  , ,
, ,  and
and 
Abstract
:1. Introduction
2. Advanced Direct Load Control (ADLC)
3. Smart House Model
4. Formulation of Optimization Problem
4.1. Objective Function
4.2. Constraints
- (a)
- Power flow variation constraint:where is the power flow at the point of connection one time step ago and is the maximum fluctuation of the power flow at the point of connection (300 W).
- (b)
- Storage battery charging/discharging power constraint:where is the charging/discharging power of the stationary storage battery and is the maximum charging/discharging power of the stationary storage battery. The positive direction of the current in the storage battery implies discharge.
- (c)
- State of charge (SOC) constraint on storage batteries:where is the SOC of the storage battery, is the minimum storage battery capacity (20%), and is the maximum storage battery capacity (90%).
- (d)
- SOC constraint on storage batteries at the end of the day:In this paper, to shorten the simulation time, the weather classification introduced in Section 5.2 was performed and the operating cost for one month was calculated. Therefore, it was necessary to reconcile the charge rate of the storage battery because the operation for one year was not continuously simulated. Therefore, the problem was solved by setting the constraint conditions as described above.
- (e)
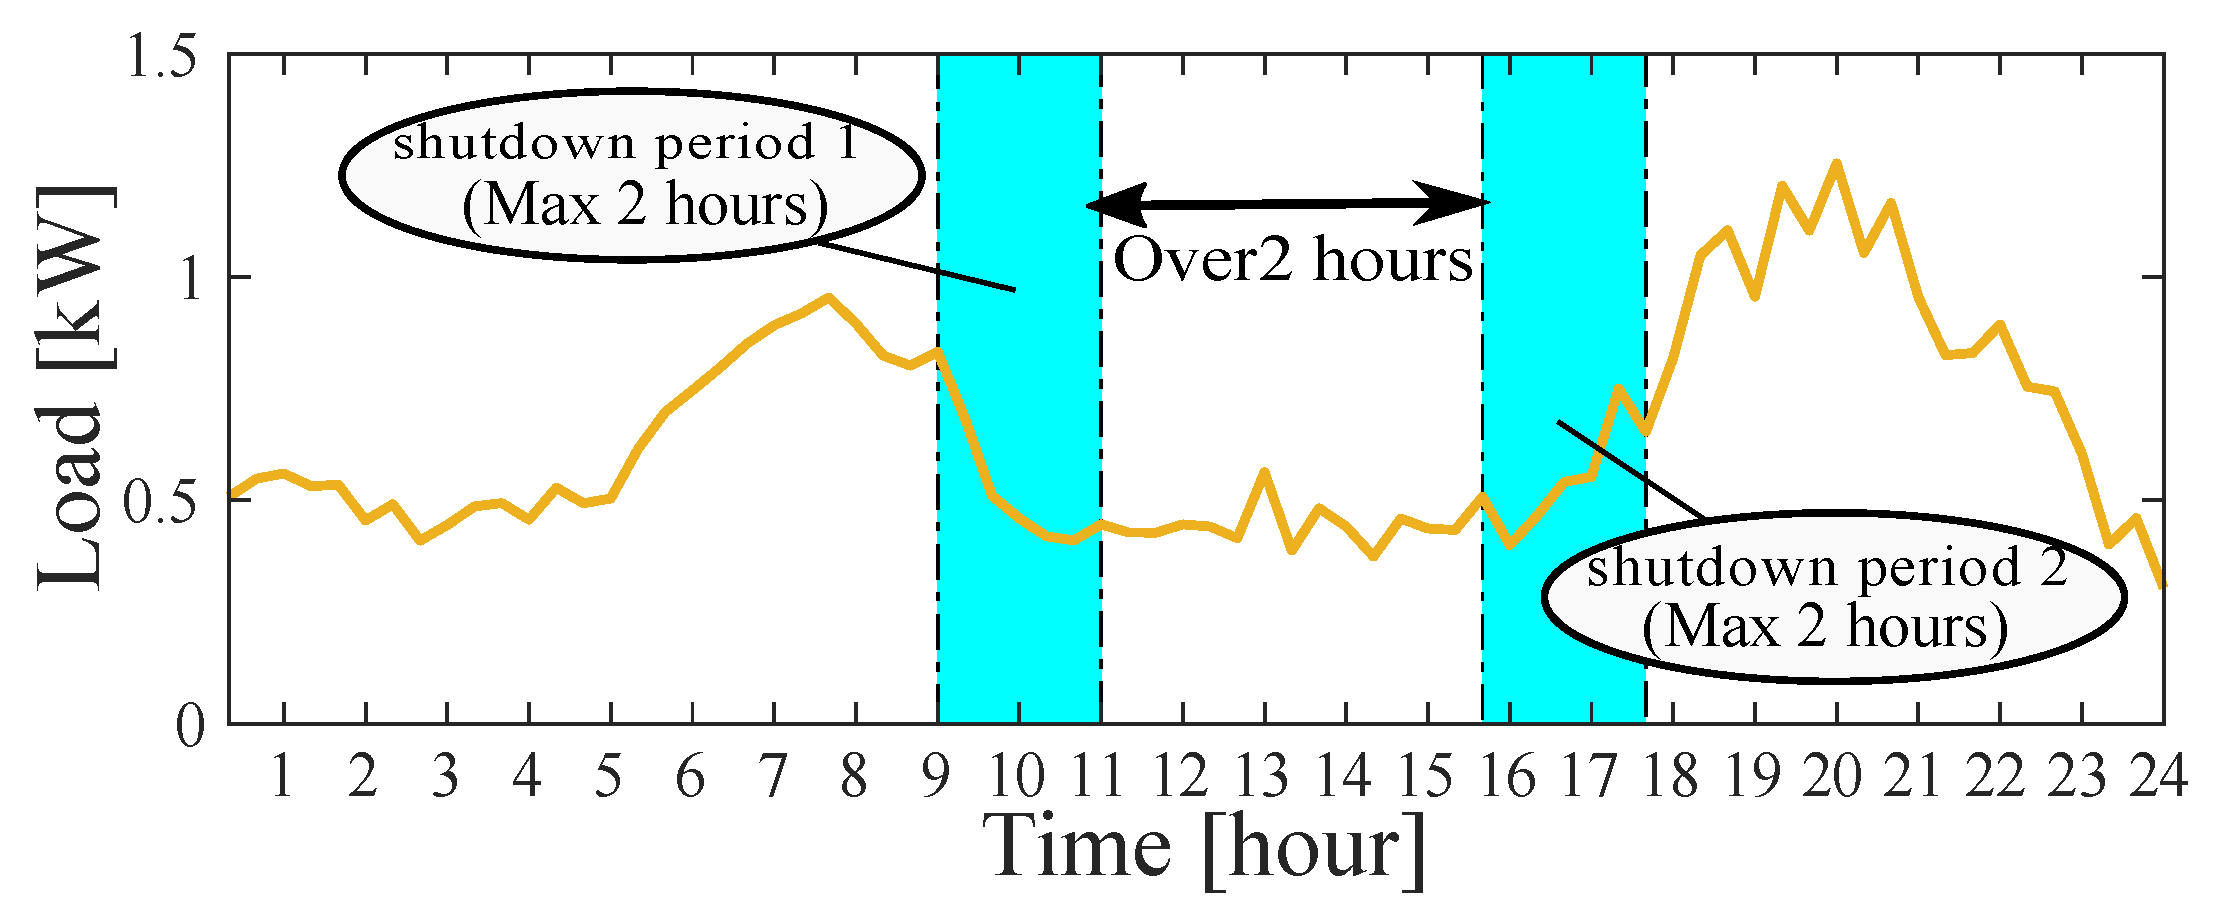
- Shutdown constraint:where is the load power consumption other than controllable load during the shutdown period, is the PV power output during the shutdown period, and is the storage battery charge/discharge power during the shutdown period. Since it was necessary to avoid power flow during the shutdown period, the power consumption in the smart house was satisfied by the PV output and the discharge of the storage battery. In addition, when surplus power was generated, the difference between the load of the smart house and the PV output was eliminated by charging the storage batteries.
- (f)
- Constraints on the time of the shutdown period:where indicates the first shutdown start time, indicates the first shutdown end time, indicates the second shutdown start time, indicates the second shutdown end time, indicates the maximum shutdown time, and indicates the minimum shutdown interval.
5. Operating Conditions
5.1. Hot Water Demand
5.2. Weather Classification
5.3. Application of ADLC
- The shutdown would be performed twice a year, once during the day when PV output was high and once at night when peak load occurred.
- The shutdown time per time shall be 2 h (6 time steps).
- The interval between the first and second shutdown periods must be at least 2 h.
6. Simulation Results
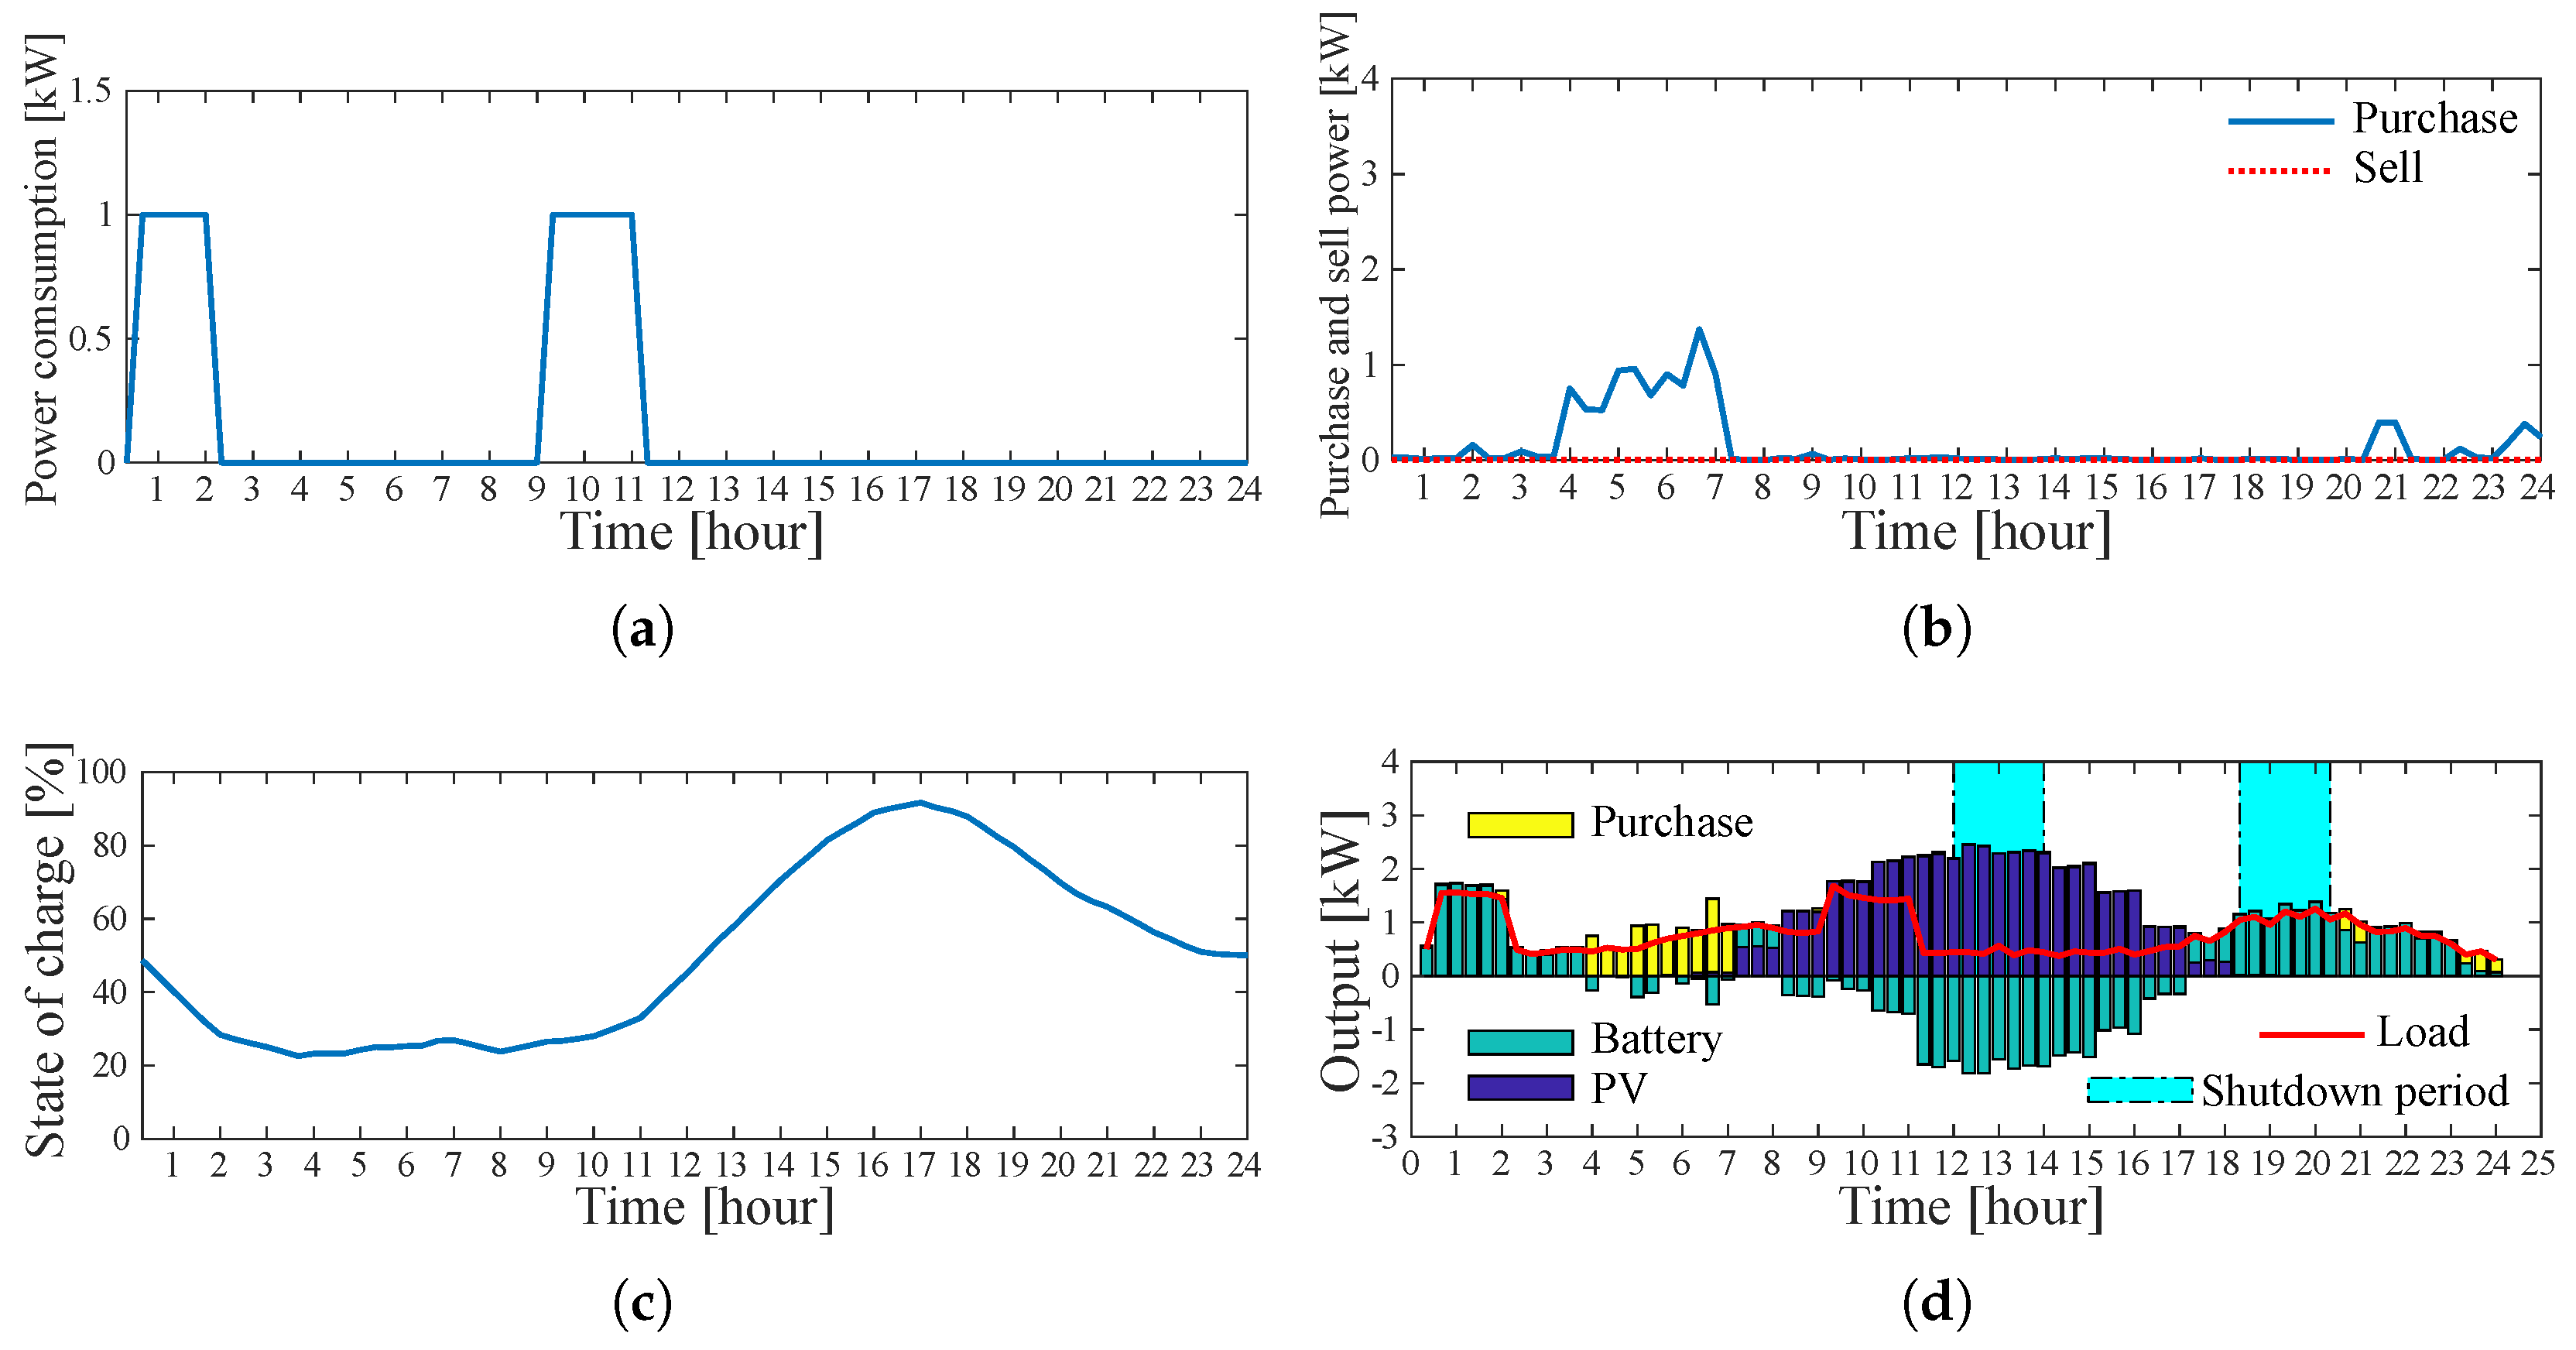
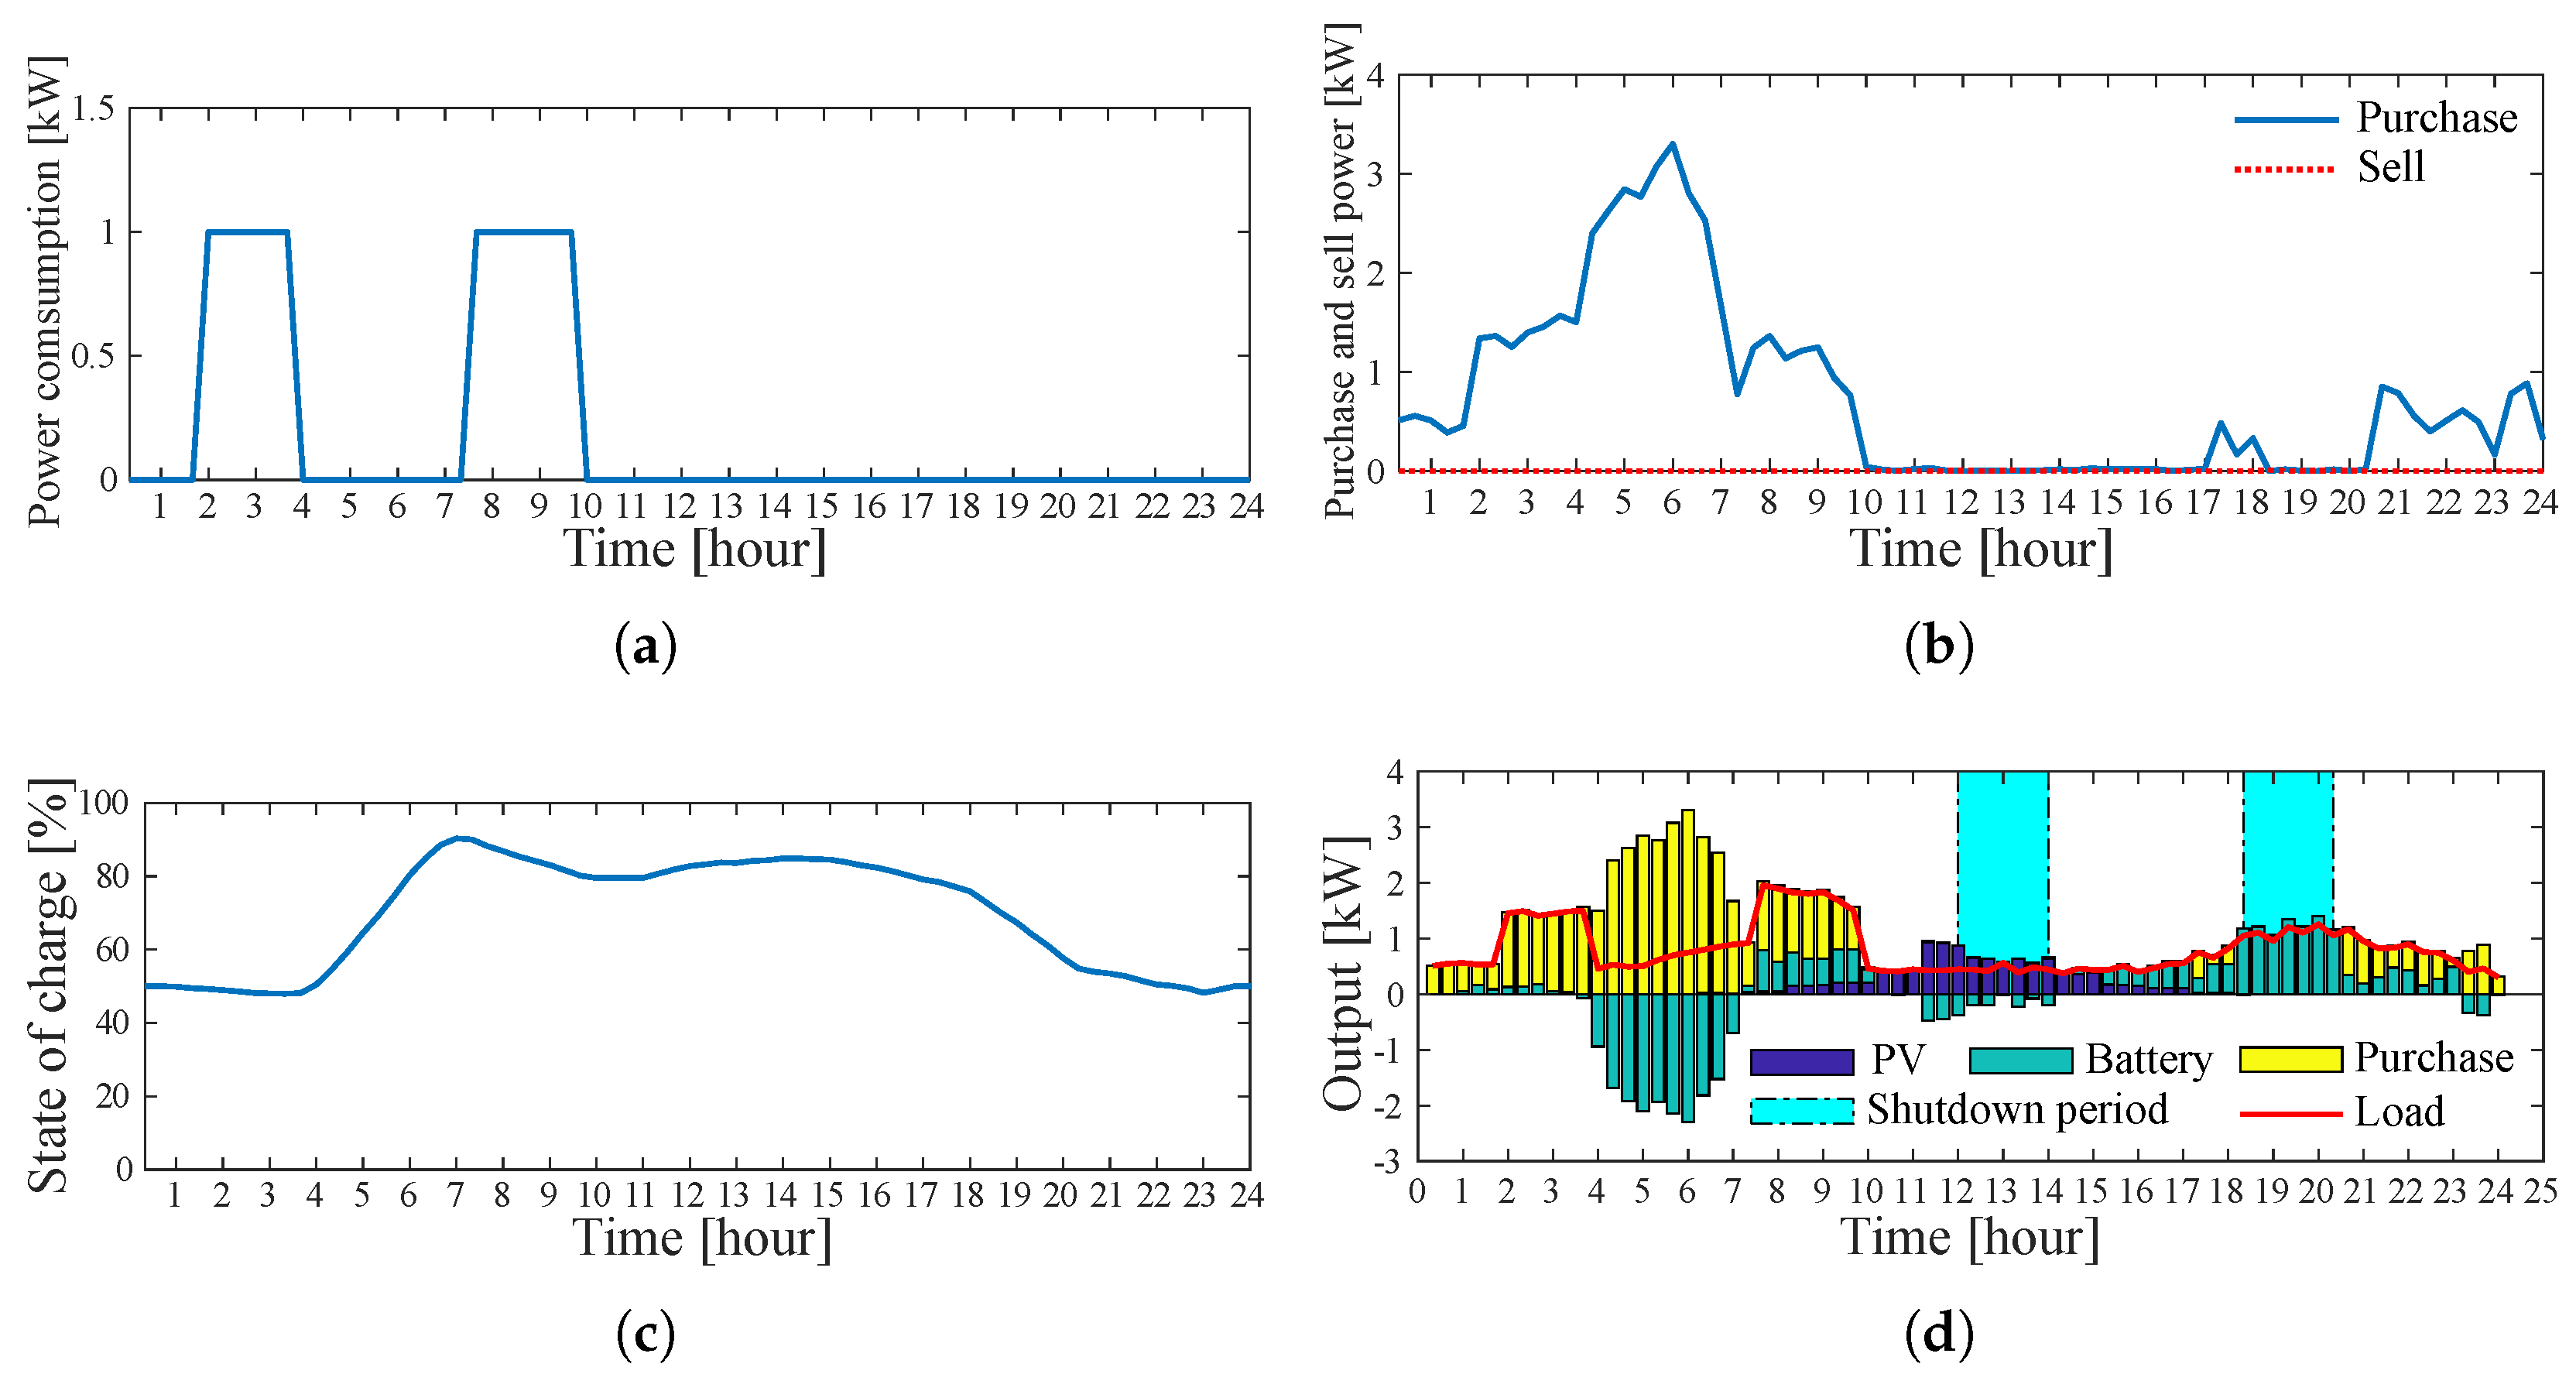
6.1. Operation of SH
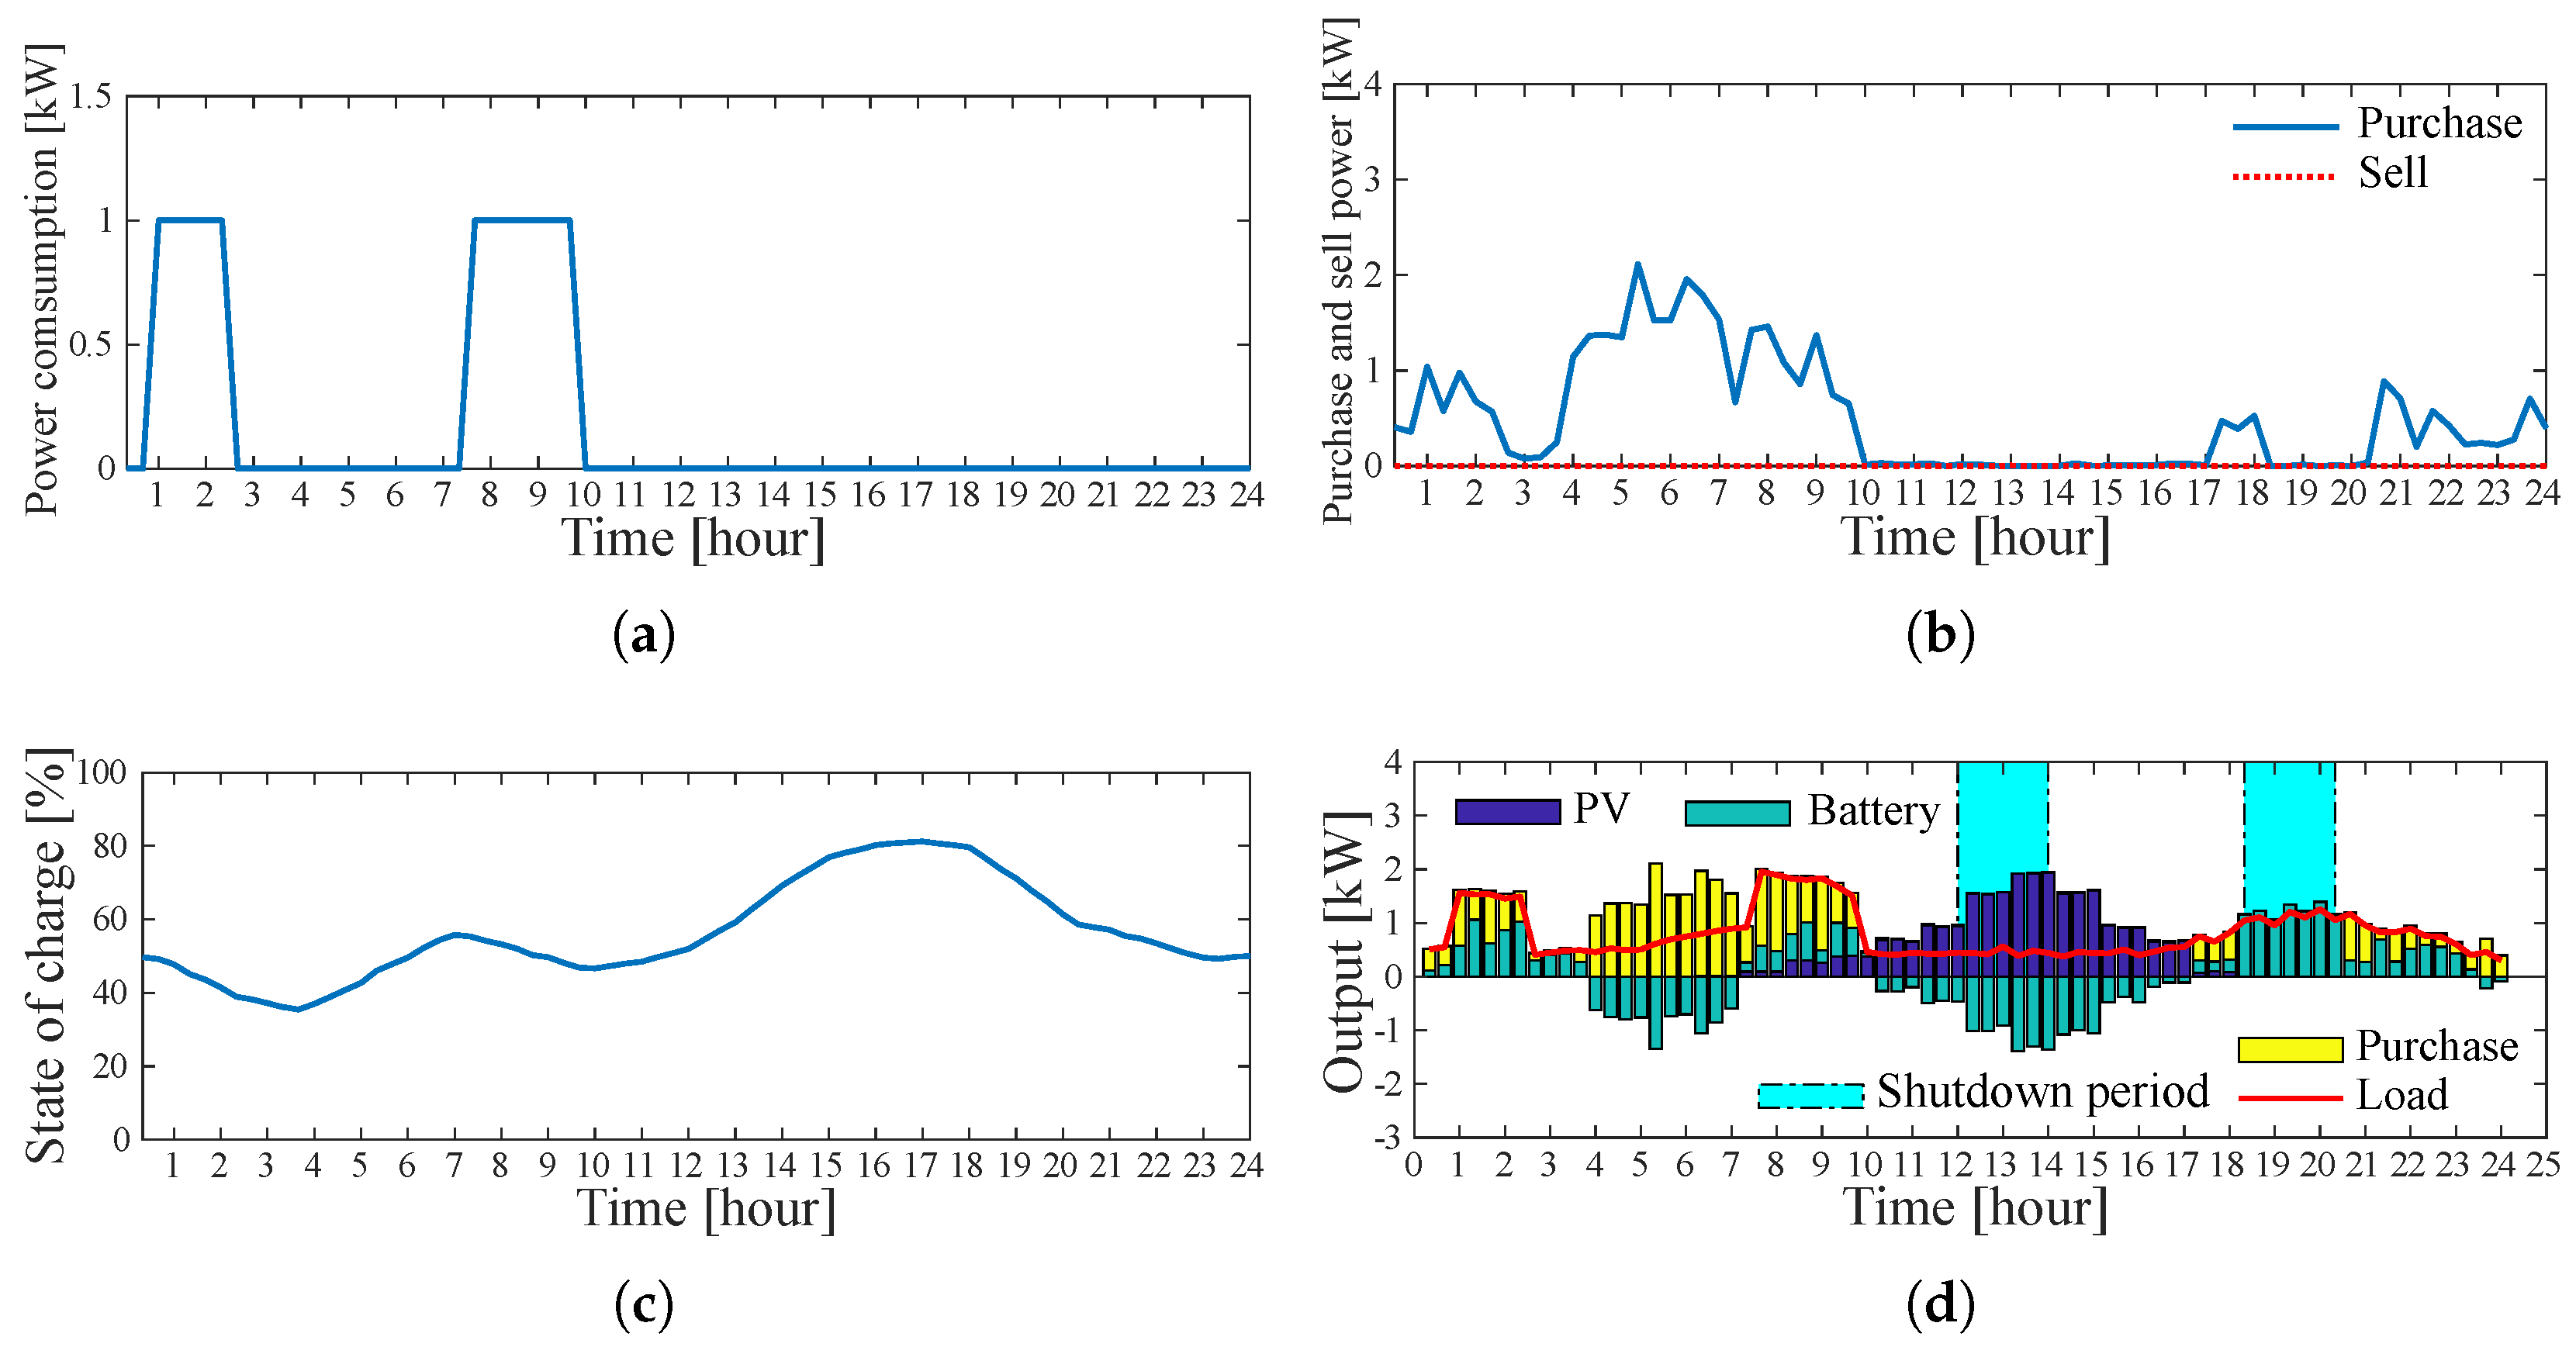
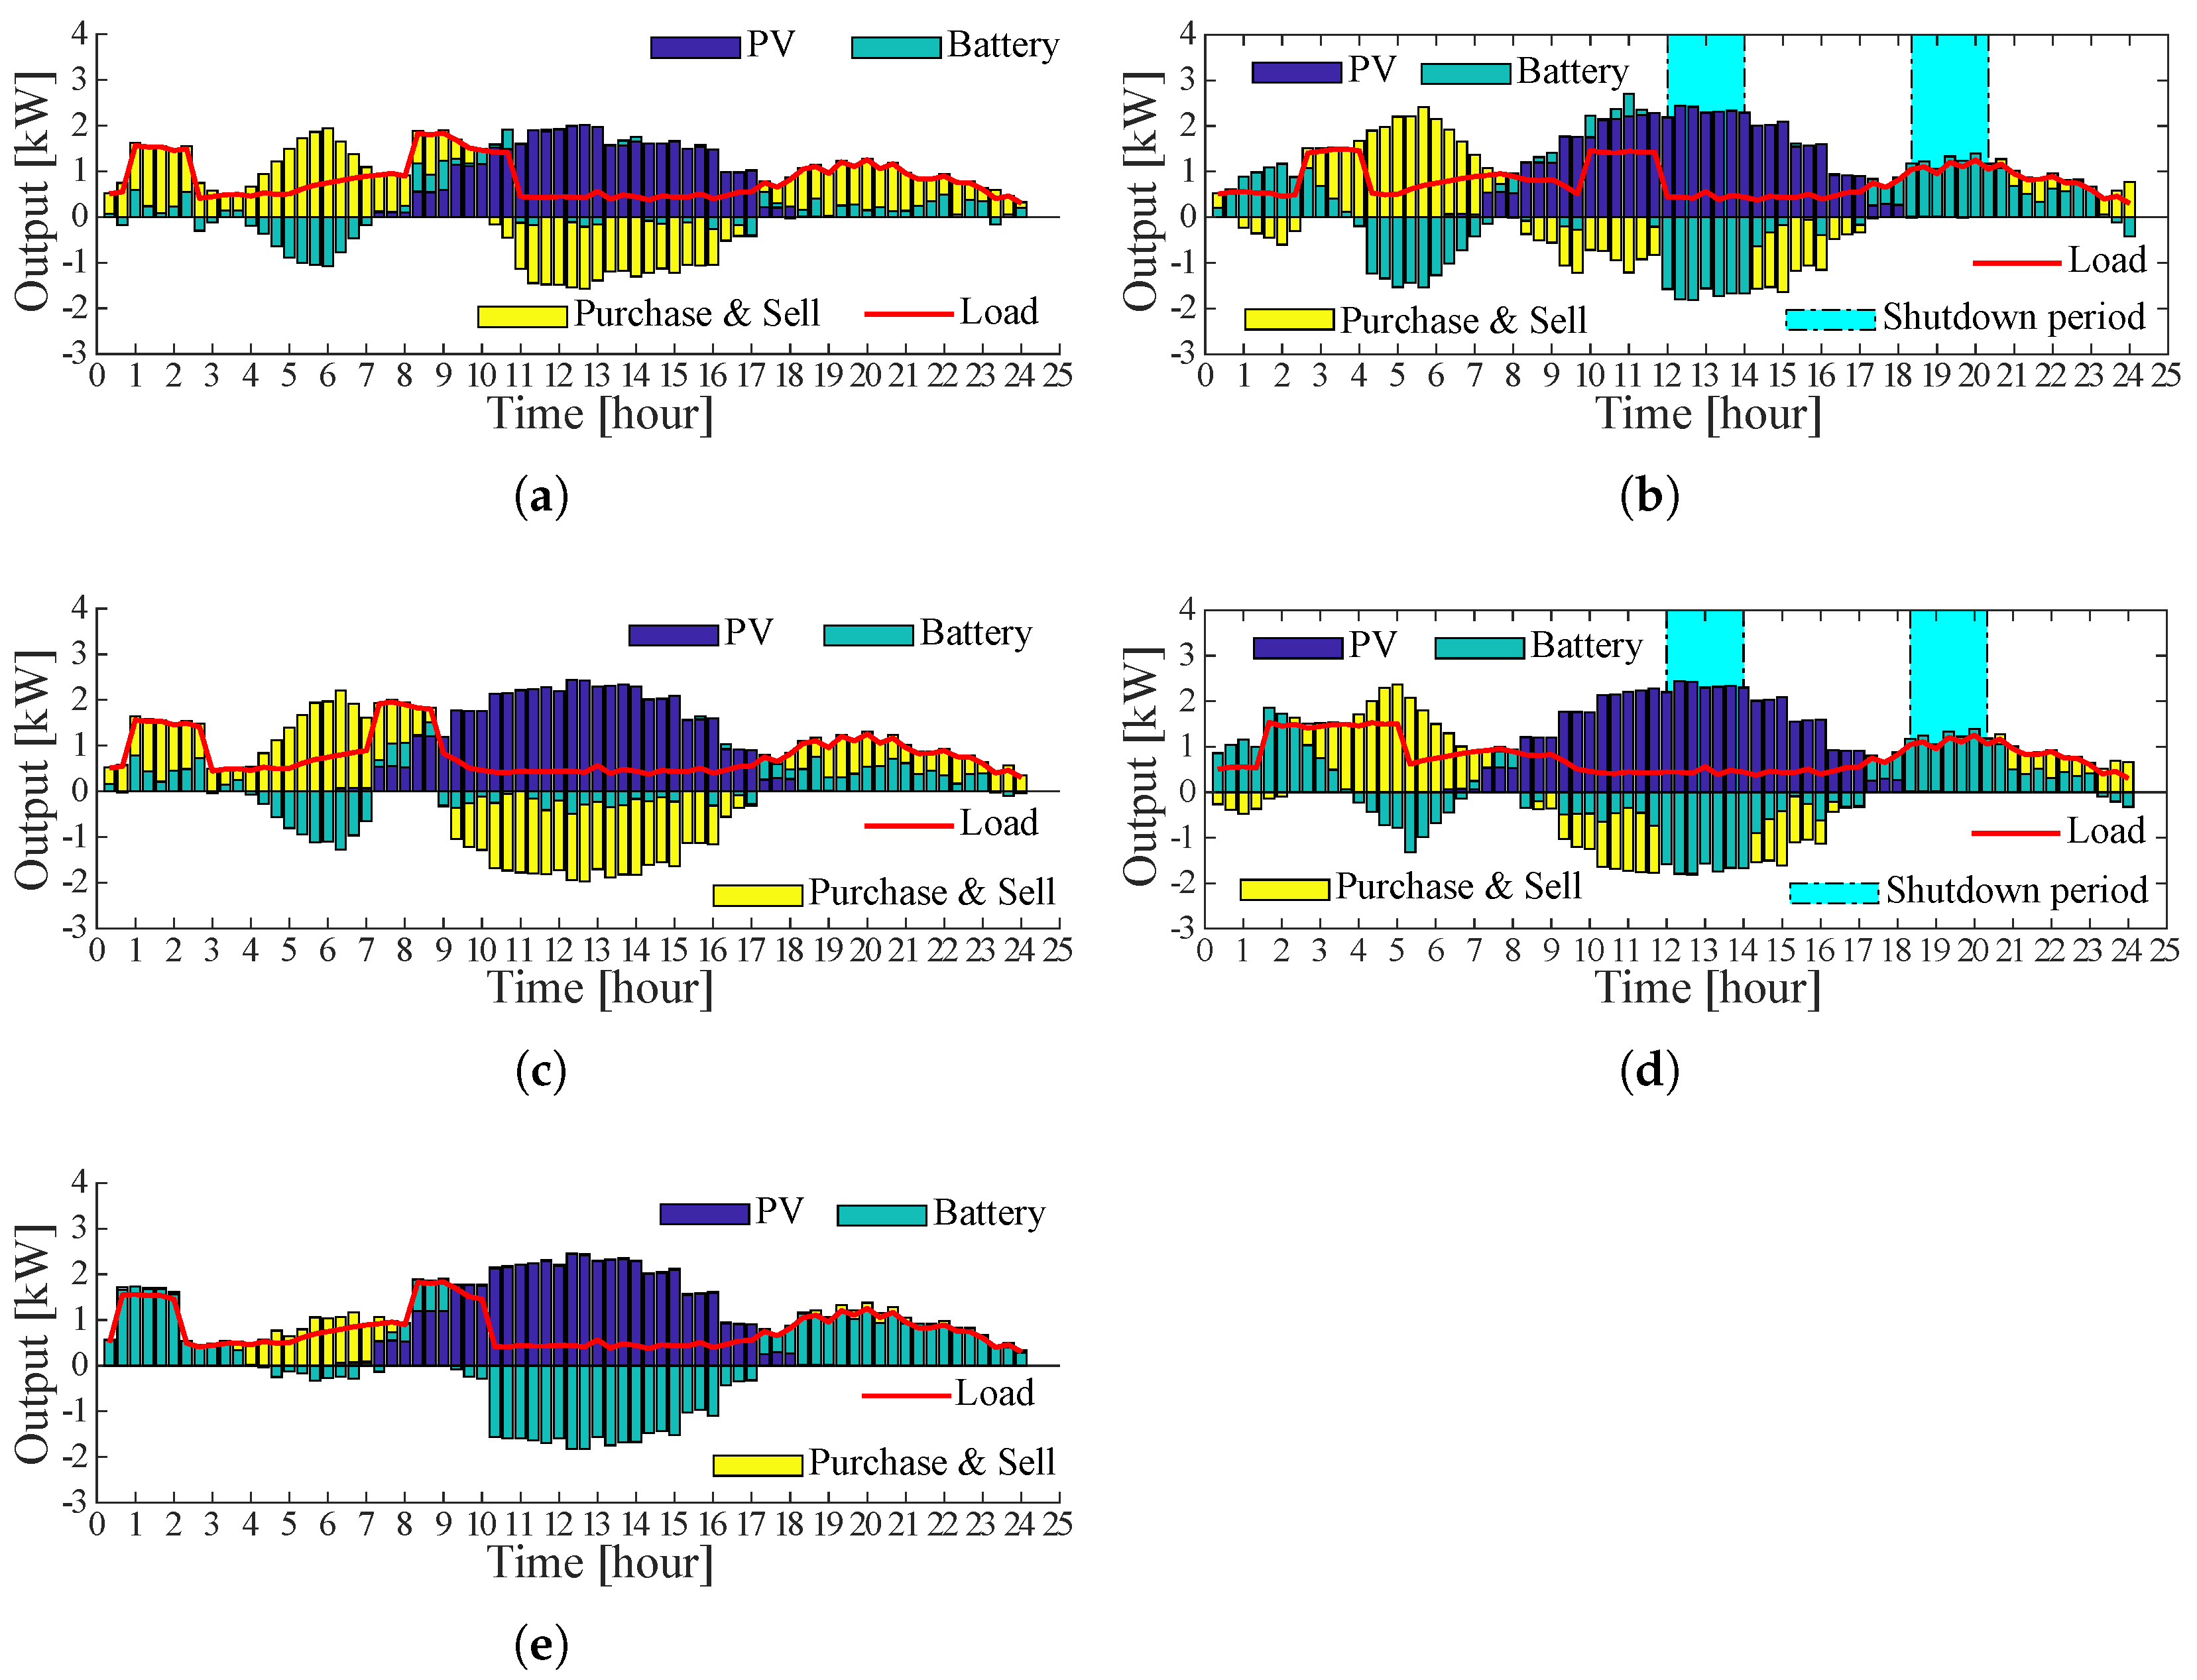
6.2. Operational Results of Other Case Studies
6.3. Comparison and Discussion of Operating Costs and CO Emissions
7. Conclusions
Author Contributions
Funding
Conflicts of Interest
Abbreviations
| SH | Smart House |
| HP | Heat Pump |
| ToU | Time-of-Use |
| DR | Demand Response |
| DSM | Demand-side Management |
| RTP | Real-time Pricing |
| SOC | State of charge |
| ADLC | Advanced Direct Load Control |
| Variables in the manuscript: | |
| t | Time |
| Variables in shutdown period | |
| PV output | |
| Conversion efficiency | |
| Number of PV panels | |
| Area per PV panel | |
| Solar radiation | |
| Outdoor air temperature | |
| Power flow at the connection point | |
| Power consumption except the controllable load | |
| PV output | |
| Charging/discharging power | |
| Power consumption of HP | |
| Daily operating cost of SH | |
| Electricity purchased | |
| Electricity sold | |
| Maximum fluctuation of the power flow | |
| Maximum charging/discharging power | |
| SOC of battery | |
| Minimum storage capacity | |
| Maximum storage capacity | |
| First shutdown start time | |
| First shutdown finish time | |
| Second shutdown start time | |
| Second shutdown finish time | |
| Maximum shutdown time | |
| Minimum shutdown interval | |
References
- Liang, B.; Liu, W.; Sun, L.; He, Z.; Hou, B. Economic MPC-Based Smart Home Scheduling With Comprehensive Load Types, Real-Time Tariffs, and Intermittent DERs. IEEE Access 2020, 8, 194373–194383. [Google Scholar] [CrossRef]
- Tanaka, K.; Uchida, K.; Ogimi, K.; Goya, T.; Yona, A.; Senjyu, T.; Funabashi, T.; Kim, C. Optimal Operation by Controllabel Loads based on Smart Grid Topology Considering Insolation Forecasted Error. IEEE Trans. Smart Grid 2011, 2, 438–444. [Google Scholar] [CrossRef]
- Somma, M.D.; Graditi, G.; Heydarian-Forushnai, E.; Shafie-khah, M.; Siano, P. Stochastic optimal scheduling of distributed energy resources with renewables considering economic and enviromental aspects. Renew. Energy 2018, 116, 272–287. [Google Scholar]
- Shimoji, T.; Tahara, H.; Matayoshi, H.; Yona, A.; Senjyu, T. Comparison and Validation of Operational Cost in Smart Houses with Introduction of a Heat Pump or a Gas Engine. Int. J. Emerg. Electr. Power Syst. 2015, 16, 59–74. [Google Scholar] [CrossRef]
- Oprea, S.V.; Bâra, A.; Ifrim, G. Flattening the electricity consumption peak and reducing the electricity payment for residential consumers in the context of smart grid by means of shifting optimization algorithm. Comput. Ind. Eng. 2018, 122, 125–139. [Google Scholar] [CrossRef]
- Pallonetto, F.; Oxizidis, S.; Milano, F.; Finn, D. The effect of time-of-use tariffs on the demand response flexibility of an all-electric smart-grid-ready dwelling. Energy Build. 2016, 128, 56–67. [Google Scholar] [CrossRef]
- Hou, Q.; Zhang, N.; Du, E.; Miao, M.; Peng, F.; Kang, C. Probabilistic duck curve in high PV penetration power system: Consept, modeling, and empirical analysis in China. Appl. Energy 2019, 242, 205–215. [Google Scholar] [CrossRef]
- Howlader, H.O.R.; Sediqi, M.M.; Ibrahimi, A.M.; Senjyu, A.T. Optimal Thermal Unit Commitment for Solving Duck Curve Problem by Introducing CSP, PSH and Demand Response. IEEE Access 2018, 6, 4834–4844. [Google Scholar] [CrossRef]
- Lu, Q.; Zhang, Z.; Lu, S. Home energy management in smart households: Optimal appliance scheduling model with photovoltaic energy storage system. Energy Rep. 2020, 6, 2450–2462. [Google Scholar] [CrossRef]
- Hosseini, S.M.; Carli, R.; Dotoli, M. Model predictive control for real-time residential energy scheduling under uncertainties. In Proceedings of the 2018 IEEE International Conference on Systems, Man, and Cybernetics (SMC), Miyazaki, Japan, 7–10 October 2018; pp. 1386–1391. [Google Scholar]
- Javadi, M.S.; Gough, M.; Lotfi, M.; Nezhad, A.E.; Santos, S.F.; Catalao, J.P.S. Optimal self-scheduling of home energy management system in the presence of photovoltaic power generation and batteries. Energy 2020, 210, 118568. [Google Scholar] [CrossRef]
- Tumuluru, V.K.; Tsang, D.H.K. A two-stage approach for network constrained unit commitment problem with demand response. IEEE Trans. Smart Grid 2016, 9, 1175–1183. [Google Scholar] [CrossRef]
- Rastegar, M.; Fotuhi-Firuzabad, M. Outage management in residential demand response programs. IEEE Trans. Smart Grid 2014, 6, 1453–1462. [Google Scholar] [CrossRef]
- Luo, F.; Zhao, J.; Wang, H.; Tong, X.; Chen, Y.; Dong, Z.Y. Direct load control by distributed imperialist competitive algorithm. J. Mod. Power Syst. Clean Energy 2014, 2, 385–395. [Google Scholar] [CrossRef] [Green Version]
- Jiang, X.; Wu, L. A Residential Load Scheduling Based on Cost Efficiency and Consumer’s Preference for Demand Response in Smart Grid. Electr. Power Syst. Res. 2020, 186, 106410. [Google Scholar] [CrossRef]
- Kong, X.; Sun, B.; Kong, D.; Li, B. Home energy management optimization method considering potential risk cost. Sustain. Cities Soc. 2020, 62, 102378. [Google Scholar] [CrossRef]
- Zhu, H.; Gao, Y.; Hou, Y.; Wang, Z.; Feng, X. Real-time pricing considering different type of smart home appliances based on Markov decision process. Int. J. Electr. Power Energy Syst. 2019, 107, 486–495. [Google Scholar] [CrossRef]
- Wang, Q.; Chang, P.; Bai, R.; Liu, W.; Dai, J.; Tang, Y. Mitigation Strategy for Duck Curve in High Photovoltaic Penetration Power System Using Concentrating Solar Power Station. Energies 2019, 12, 3521. [Google Scholar] [CrossRef] [Green Version]
- Hernandez, J.C.; Medina, A.; Jurado, F. Optimal Allocation and sizing for profitability and voltage enhancement of PV systems on feeders. Renew. Energy 2007, 32, 1768–1789. [Google Scholar] [CrossRef]
- Ning, J.; Tang, Y.; Chen, Q.; Wang, J.; Zhou, J.; Gao, B. A Bi-Level Coordinated Optimization Strategy for Smart Appliances Considering Online Demand Response Potentail. Energies 2017, 10, 525. [Google Scholar] [CrossRef] [Green Version]
- Golmohamadi, H.; Keypour, R.; Bak-Jensen, B.; Pillai, J.R. Optimization of household energy consumption towards day-ahead retail electricity price in home energy management systems. Sustain. Cities Soc. 2019, 47, 101468. [Google Scholar] [CrossRef]
- Panichella, A.; Oliveto, R.; Penta, M.D.; DeLucia, A. Improving Multi-Objective Test Case Selection by Injecting Diversity in Genetic Algorithms. IEEE Trans. Softw. Eng. 2015, 41, 358–383. [Google Scholar] [CrossRef]
- Ee-Home Holiday, The Okinawa Electric Power Company, Incorporated. Available online: https://www.okiden.co.jp/en/customer/erm/holiday.html (accessed on 3 September 2021).
- An, J.; Mikhaylov, A.; Jung, S.-U. A Linear Programming Approach for Robust Network Revenue Management in the Airline Industry. J. Air Transp. Manag. 2021, 91, 101979. [Google Scholar] [CrossRef]
- Mikhaylov, A. Development of Friedrich von Hayek’s theory of private money and economic implications for digital currencies. Terra Econ. 2021, 19, 53–62. [Google Scholar] [CrossRef]
- An, J.; Mikhaylov, A.; Richter, U.H. Trade War Effects: Evidence from Sectors of Energy and Resources in Africa. Heliyon 2020, 6, e05693. [Google Scholar] [CrossRef]


| Case | ADLC | Electricity Sales Price (JPY/kWh) | SH Model |
|---|---|---|---|
| Case 1 | w/o | 19.0 | Traditional |
| Case 2 | w/ | 19.0 | |
| Case 3 | w/o | 7.7 | |
| Case 4 | w/ | 7.7 | |
| Case 5 | w/o | - | Self-consumption |
| Case 6 | w/ | - |
| Parameters | Set Value |
|---|---|
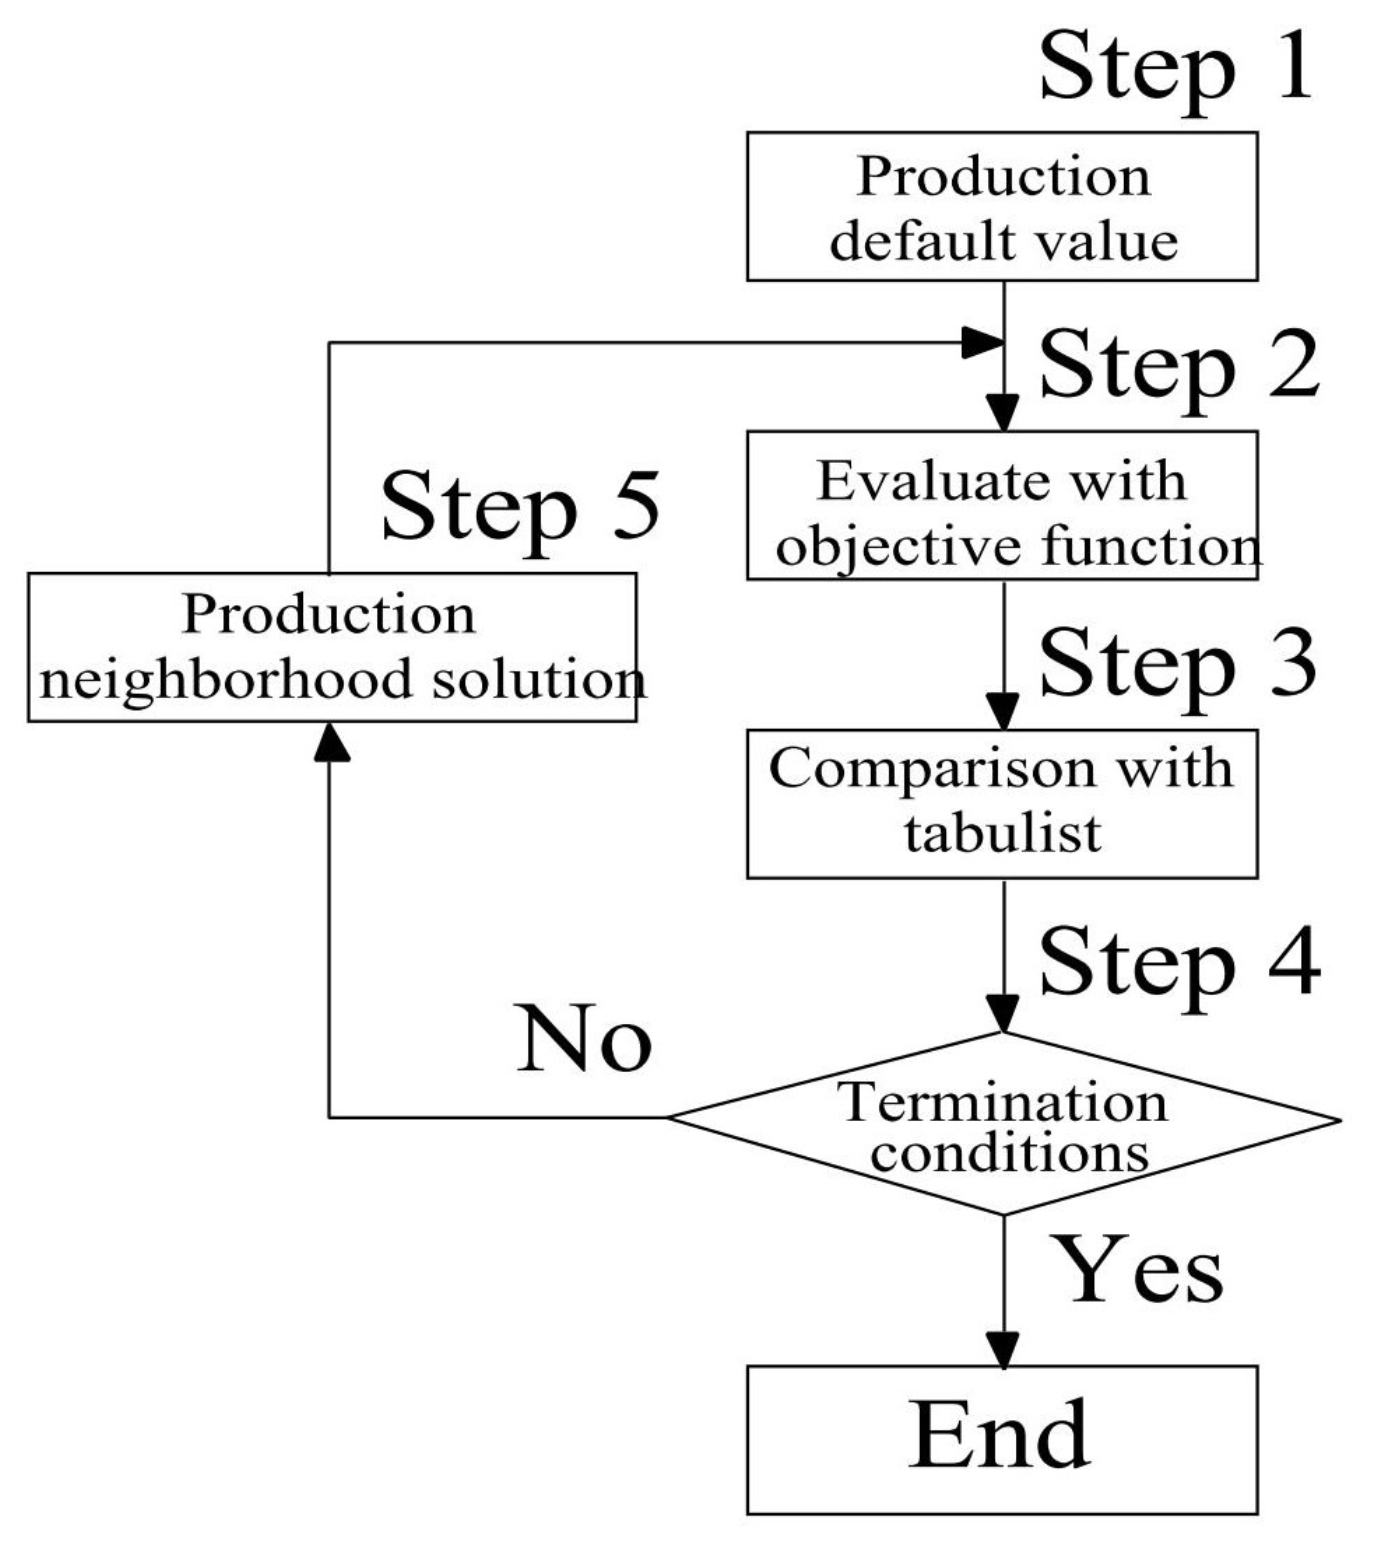
| Number of searches | 2000 |
| Storage capacity of tab list | 500 |
| Parameters | The Morning | The Evening |
|---|---|---|
| Use time | 7:00∼8:00 | 20:00∼23:00 |
| Supply completion time | 7:00 | 20:00 |
| Target temperature | 50 C | 60 C |
| Amount used | 30 L | 150 L |
| Type of Service | Type of Service | Unit | Unit Charge (JPY) | |
|---|---|---|---|---|
| Basic Charge | — | — | 1620.00 | |
| Energy Charge | Daytime | Summer | 1 kWh | 38.65 |
| Others | 35.23 | |||
| Living Time | 26.71 | |||
| Night Time | 10.97 | |||
| Sales price | FIT price | 19.00 | ||
| Non-FIT price | 7.70 | |||
| Case | Purchase | Sell | Operation Cost | CO Emission |
|---|---|---|---|---|
| (JPY) | (JPY) | (JPY) | (t-CO) | |
| Case 1 | 100,680 | 85,695 | 14,985 | 4.62 |
| Case 2 | 78,666 | 77,141 | 1525 | 3.98 |
| Case 3 | 81,289 | 14,757 | 66,532 | 3.69 |
| Case 4 | 67,444 | 12,953 | 54,491 | 2.84 |
| Case 5 | 70,131 | 0 | 70,131 | 2.56 |
| Case 6 | 67,398 | 0 | 67,398 | 2.53 |
Publisher’s Note: MDPI stays neutral with regard to jurisdictional claims in published maps and institutional affiliations. |
© 2021 by the authors. Licensee MDPI, Basel, Switzerland. This article is an open access article distributed under the terms and conditions of the Creative Commons Attribution (CC BY) license (https://creativecommons.org/licenses/by/4.0/).
Share and Cite
Tamashiro, K.; Alharbi, T.; Mikhaylov, A.; Hemeida, A.M.; Krishnan, N.; Lotfy, M.E.; Senjyu, T. Investigation of Home Energy Management with Advanced Direct Load Control and Optimal Scheduling of Controllable Loads. Energies 2021, 14, 7314. https://doi.org/10.3390/en14217314
Tamashiro K, Alharbi T, Mikhaylov A, Hemeida AM, Krishnan N, Lotfy ME, Senjyu T. Investigation of Home Energy Management with Advanced Direct Load Control and Optimal Scheduling of Controllable Loads. Energies. 2021; 14(21):7314. https://doi.org/10.3390/en14217314
Chicago/Turabian StyleTamashiro, Kanato, Talal Alharbi, Alexey Mikhaylov, Ashraf M. Hemeida, Narayanan Krishnan, Mohammed Elsayed Lotfy, and Tomonobu Senjyu. 2021. "Investigation of Home Energy Management with Advanced Direct Load Control and Optimal Scheduling of Controllable Loads" Energies 14, no. 21: 7314. https://doi.org/10.3390/en14217314
APA StyleTamashiro, K., Alharbi, T., Mikhaylov, A., Hemeida, A. M., Krishnan, N., Lotfy, M. E., & Senjyu, T. (2021). Investigation of Home Energy Management with Advanced Direct Load Control and Optimal Scheduling of Controllable Loads. Energies, 14(21), 7314. https://doi.org/10.3390/en14217314