Abstract
Understanding elastic properties of reservoir rocks is essential for seismic modeling under different saturation conditions as well as lithology discrimination. Experiments on elastic properties of limestones are significantly less published compared to siliciclastic sedimentary rocks. The current study presents the results of laboratory measurements on Pannonian Basin limestone cores. The research was carried out for the first time for a hydrocarbon reservoir in the Bjelovar Depression, located in the southern part of the Pannonian Basin. Ultrasonic velocity measurements and determination of dynamic elastic properties were performed on limestone plugs, in dry and saturated condition under different confining pressure steps. Based on the results obtained in laboratory conditions, an empirical relationship between shear wave velocity (Vs) and compressional wave velocity (Vp) has been defined. The saturated samples show an effect of shear modulus weakening, while three samples have a shear modulus strengthening effect. Two models were used in the interpretation of the measured data, the Kuster and Toksöz and the Xu-Payne model. The results show that the Xu-Payne model describes the data well and the dominant pore type system in the limestone samples can been identified. The interpretation revealed an interparticle pore system with a fraction of microcracks from 20% to 35%. The results have helped to understand the elastic properties of limestones from the southern part of the Pannonian Basin, which are necessary for any process of reservoir characterization, such as porosity distribution and permeability variation.
1. Introduction
The elastic property of rock is useful information for oil or gas reservoir characterization, especially for carbonate reservoirs. Elastic parameters are essential for the reservoir seismic response modeling under different saturation conditions, also for lithology discrimination. Carbonates contain 60% of the world’s oil reserves [1], but there are only a few experiments dealing with elastic properties of carbonates compared to siliciclastic sedimentary rocks.
This paper presents the results of laboratory measurements of ultrasonic wave velocities on limestone cores, which were performed for the first time for a hydrocarbon reservoir located in the Pannonian Basin, Croatia. The ultrasonic velocity measurements were performed on the Bjelovar Depression gas reservoir core samples. Laboratory measurements of porosity and velocity under different confining pressures were analyzed.
According to previously published papers, e.g., [2,3,4,5] laboratory measurements have shown that velocity in water-saturated carbonates is influenced by porosity and pore shape. These studies have shown that velocity generally decreases with increasing porosity. Moreover, large velocity variability in carbonates has been observed.
Rafavich et al., (1984) [2] analyzed the ultrasonic velocities of P- and S-waves in carbonate samples from four wells with different porosity and mineralogy, such as limestones, dolomites and anhydrites. The tests were performed for 98 dry and water-saturated samples under effective stress up to 40 MPa. They concluded that porosity and density are the main factors affecting velocity. According to Anselmetti and Eberli, (1993) [6], who studied the P- and S-wave velocities in carbonate samples from different reservoirs, the influence of mineral composition in carbonates is minimal. Moreover, rocks with primary porosity have lower velocity values compared to rocks with secondary porosity.
Bakhorji, (2010) [7] compared the velocity results in carbonates with the theoretical Gassmann and Biot models [8,9] and concluded that the Gassmann model consistently overestimates the velocity values of saturated samples at low effective pressure and the samples at high effective velocities are approximately equal. The Biot model overestimates the values of saturated samples in most of the analyzed samples.
The saturation state of the samples affects the elastic parameters, and accordingly the bulk modulus values of the saturated samples are higher than those of the dry samples. The shear modulus of water is zero and theoretically the shear modulus of the saturated sample should remain unchanged. However, many published papers, e.g., [5,6,10] report that the shear modulus values of saturated samples are lower than the shear moduli of dry samples, and this phenomenon is called the “shear weakening effect”. According to Baechle et al., (2009) [5] and Khazanehdari and Sothcott, (2003) [11] the causes of a shear weakening effect are viscosity, reduction of free surface energy on mineral grains, and velocity dispersion due to local flow.
The present study follows and complements the research performed so far on cores from different basins around the world and presents the first measurements of ultrasonic wave velocities on limestone cores under different effective stress values in the southern part of the Pannonian Basin. Based on the results of laboratory measurements, an empirical relationship between shear wave velocities (Vs) and compressional wave velocities (Vp) has been defined. Moreover, an analysis of the elastic parameters of the limestone cores is presented.
2. Geological Settings of the Bjelovar Depression
The research area belongs to the Bjelovar Depression, located in the southern part of the Pannonian Basin (Figure 1). The geological and structural development of the research area is related to the geological development of the Pannonian Basin.
The opening of the Pannonian Basin starts in the Lower Miocene during the continental collision and subduction of the European and African plate. Extension of the Pannonian Basin is enabled by two geodynamic processes: subduction of the European plate under the Carpathians, followed by slab retreat and collision of the Adriatic microplate and the European plate [12,13,14]. The syn-rift phase presented with the formation of half-graben lasted from the Ottnangian to the Middle Badenian [15].
Extension tectonics and the opening of a series of listric faults formed four elongated basins which represented the main depositional area, such as the Drava Depression and the Bjelovar Depression, which together with the Požega Valley formed a single half-graben, as well as the Sava Depression and the Karlovac Depression [16]. The extensional tectonics continued until the Middle Badenian, when regional marine transgression occurred [17,18].
During the Pliocene, new and older fault systems were activated and reactivated in the Bjelovar Depression area, resulting in the uplift of the Bilogora Mt and partly the Slavonian Mt. (Figure 1). Due to the convergence of the Adriatic microplate during the Quaternary, with counterclockwise rotation [19,20,21], tectonic activity continues.
Unlike the other parts of the Drava Depression and the Sava Depression, the Bjelovar Depression was not on the main path of material distribution during the post-extension phase, so the sediment supply was significantly lower. The entire depositional area of the Bjelovar Depression was more stagnant than the Drava Depression, and accordingly the thickness of Neogene-Quaternary deposits is significantly smaller than that of the Drava Depression [22].
The research area consists of Pliocene and Quaternary clastic sediments which transgressively overlay on Neogene limestone basement. The limestone was deposited on a carbonate platform, but it is not a classical platform carbonate. The depositional area included shallow water with higher water energy and higher biogenic material input as well as the area with lower water energy and constant influence of the open sea. Barrier reefs in the shallower part do not represent a significant barrier and formation of a lagoon, but present shelter from tidal currents, rough swell of waves and occasional storms. Around such reefs, water circulation is much easier, so facies features are often mixed. Limestone is defined as recrystallized grainstone with included bioclastic detritus presented with shallow marine fossils. A stylolite and irregularly oriented cracks are evident on the samples. According to SEM (Scanning Electron Microscopy) carbonate component consist exclusively of limestone in the form of rhombohedral calcite crystals and the stylolites are mainly filled with clay minerals such as sericite, illite and chlorite [23].
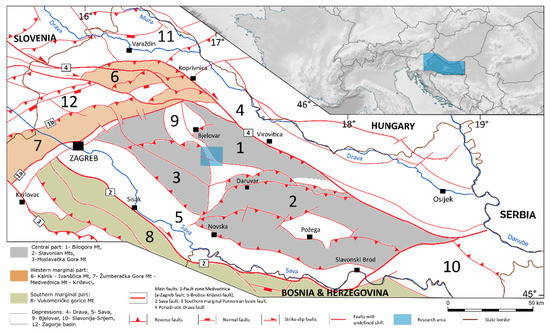
Figure 1.
Location map of the research area showing Bjelovar Depression on tectonic map with major tectonic units of N and NW Croatia (modified after [24]).
3. Methodology
Ultrasonic velocity measurement is based on measuring the travel time of an ultrasonic wave passing through a sample. A typical ultrasonic measuring system consists of a wave source, a transducer, a receiver, and a recording and display device (Figure 2). The wave source generates a high-voltage electrical pulse that is converted into compressional wave or polarized shear waves by the piezoelectric crystals in the transducer. The piezoelectric crystals in the receivers are used to convert acoustic energy into voltage. Ultrasonic velocity measurements were performed with a device that enables velocity measurements and determination of dynamic elastic parameters at triaxial loading of samples up to 70 MPa, using two piezoelectric crystals with a frequency of 1 MHz that generate P-waves and polarized S-waves.
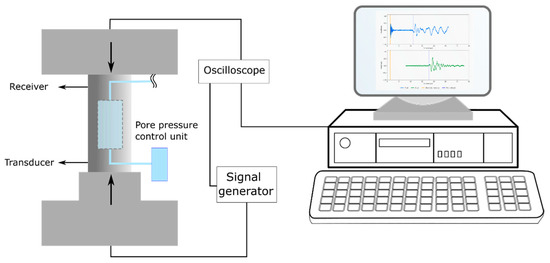
Figure 2.
Illustration of the ultrasonic velocity measurement device.
High-frequency ultrasonic waves are generated at one end of the sample. The wave propagating through the sample is detected by a receiver on the other side of the sample. The wave is converted into an electrical signal at the opposite end of the sample by a transformer and recorded with a digital oscilloscope.
Prior to velocity measurements in the laboratory, it is necessary to define the correction parameters that should be used to accurately calculate the dynamic elastic parameters of the sample. The correction parameters correspond to the travel time of waves through copper plugs with constant P- and S-wave propagation velocities.
The research was performed on 8 samples of core plugs with a diameter of 1″ (2.54 cm) from two boreholes which penetrated the Bjelovar Depression limestone gas reservoir (Figure 3). The depth range of the investigated core samples is from 805.24 to 974.11 m below the surface which is taken into account during the definition of the applied values of effective pressure.
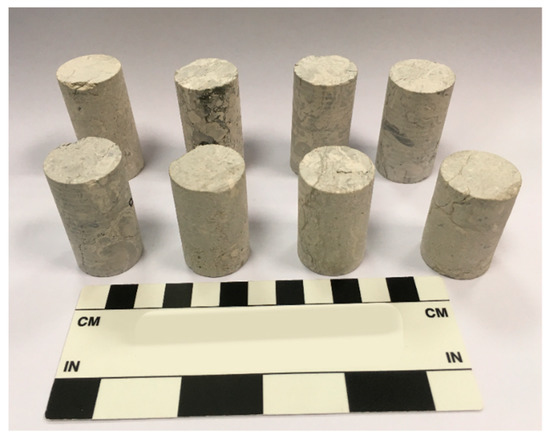
Figure 3.
Core plugs used in laboratory measurements.
Prior to the measurement the samples were subjected to a cleaning process which involved organic solvent extraction and drying. Following the sample preparation [25], the effective porosity of the plugs was determined with the Helium expansion method at different confining stress values, namely 5, 7, 9, 11, and 13 MPa.
The ultrasonic velocity measurements were performed on the dry samples in the first place, then the plugs were vacuum saturated with 10 g/L NaCl solution which corresponds to the reservoir brine salinity. The tests were performed at multiple isostatic confining pressure values in both cases, and the applied stresses were identical with the ones used in the porosity determination. A pore pressure was not applied during measurements of the saturated samples, so the applied effective pressure values can be considered as overburden stress. During the measurements effective pressure was increased from lower to higher values (up-going cycles). The determination of wave arrivals and overall evaluation of results was done using specialized software [26].
During the implementation of the program, the arrival time of the P- and S-wave was determined at each pressure step (Figure 4). Based on the sample dimensions, mass, and density, the device automatically calculates the P- and S-wave velocity, Vp/Vs ratio, and other dynamic elastic parameters such as Poisson’s ratio, Young’s modulus, shear modulus, Lamé constant and acoustic impedance.
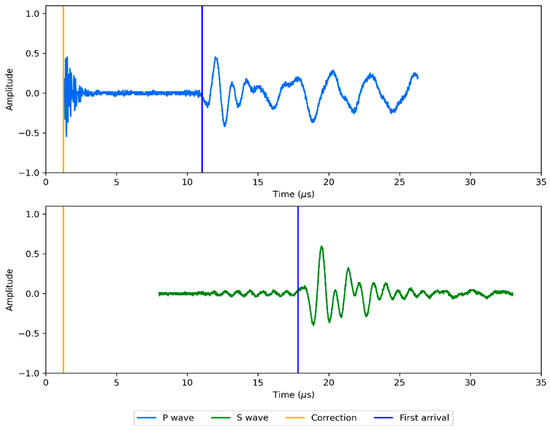
Figure 4.
P-wave and S-wave signal of dry sample No. 6.
4. Results and Interpretation
The P- and S-wave velocities of the Bjelovar Depression limestones were measured as a function of effective pressure under dry and saturated conditions (Figure 5). An analysis of the measurement results (Table 1) was made with respect to saturation, porosity and effective stress. The correlation of P-wave and S-wave velocities and elastic parameters were also analyzed.
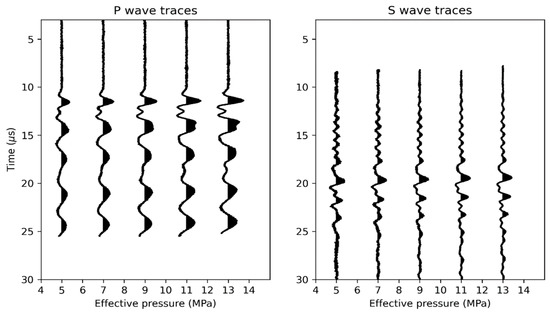
Figure 5.
Normalized P-wave and S-wave traces of saturated sample No. 1 for different values of effective stress. The difference between the P-wave and S-wave first arrival times is clearly recognizable on a time scale.

Table 1.
Results of laboratory measurements in the Pannonian Basin limestone cores.
4.1. Correlation of Velocity and Porosity
The measured velocities on dry and water saturated samples are correlated to porosity and presented in Figure 6. The porosity under different load pressures is the greatest for sample No. 2 and ranges from 14.81% to 15.06 %, while sample No. 6 exhibits the lowest porosity, 5.79–8.19%. The variation of velocities with respect to porosity shows the decreasing trend of P-wave and S-wave velocities with increasing porosity regardless of effective stress. The P-wave velocities (Vp) of dry samples (Figure 6a) decrease with increasing porosity and have a range of values from 3900 to 5000 m/s. The values of S-velocity (Vs) follow a similar trend as P-wave velocities with a range of values from 2200 to 2800 m/s.
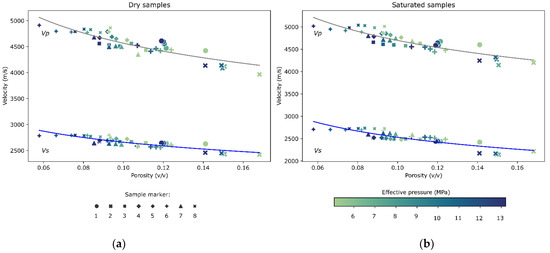
Figure 6.
Velocity versus porosity crossplot of dry (a) and saturated (b) samples under different effective pressures.
The velocities of saturated samples (Figure 6b) also decrease with increasing porosity, but the P-wave velocities have higher values compared to dry samples with a range of values from 4000 to 5200 m/s. The S-wave velocities have the same range (from 2000 to 2800 m/s) as dry samples, but the values are slightly lower. The specific change in S-wave velocity is explained by the density change when replacing the pore fluid from air to water.
Although the velocities decrease uniformly with increasing porosity regardless of the effective stress, the velocities oscillate with increasing effective stress. The reason for these oscillations is the sudden decrease in porosity during the application of the lowest effective stress and the activation of the predefined crack system with a further increase in the effective stress, e.g., some samples at 13 MPa have lower velocities and higher porosity values than expected (Figure 6a,b).
Laboratory results were also interpreted and verified using two theoretical rock physics models, the Kuster and Toksöz model [27] and the Xu-Payne model [28]. The Kuster and Toksöz (1974) model presented randomly oriented pores with the assumption of low inclusion concentration. The model implies only one pore type and in the present study results are interpreted assuming penny shaped pores. Pore shape is defined by pore aspect ratio (α) which represents ratio of the perpendicular axis of the pore (Figure 7 and Figure 8).
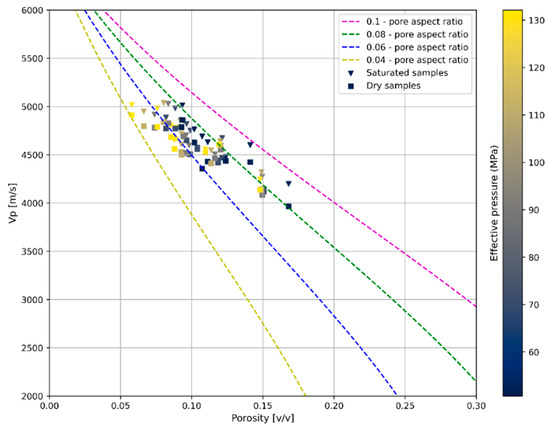
Figure 7.
P-wave velocity and porosity crossplot with defined Kuster and Toksöz model. Penny shaped pores are assumed. Data are colored according to the value of effective pressure. Input elastic parameters are calcite: K = 76.8 GPa, μ = 32 Gpa; water K = 2.1 Gpa.
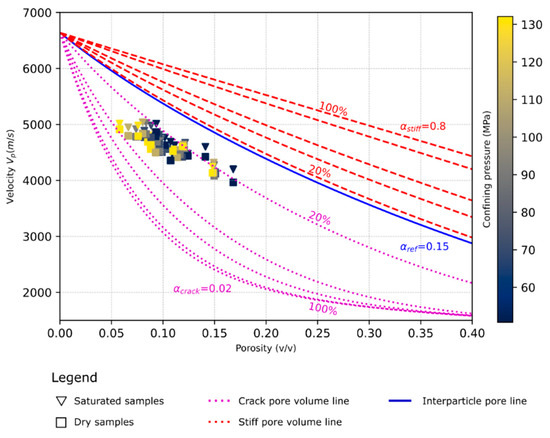
Figure 8.
P-wave velocity and porosity crossplot with defined Xu-Payne model. Data are colored by value of effective pressure. Input elastic parameters are calcite: K = 76.8 Gpa, μ = 32 Gpa; water K = 2.1 Gpa.
Xu and Payne, (2009) presented a rock physics model for carbonates based on the Xu White model [29] for clastic rocks. The rock physics model includes three pore types, characteristic for carbonate rocks: moldic pores (the rounded stiff pores), interparticle pores and microcracks.
Xu and Payne, (2009) [28] assumed that the interparticle pore system is the most common for carbonates and pore aspect ratio trend of 0.15 presents reference velocity—porosity trendline. Lines below the reference trendline present the pore system with the increasing volume of microcracks with best fit aspect ratio of 0.02 while lines above the reference trendline present the increasing volume of stiff pores with an aspect ratio of 0.8 (Figure 8).
The Kuster and Toksöz model indicates penny shaped pore distribution between aspect ratios 0.04 and 1 (Figure 7). The results are mainly constrained between 0.06 and 0.08 values of aspect ratio. Figure 7 shows that the Kuster and Toksöz model cannot describe the data well enough since it is not possible to use a unique pore aspect ratio for all results.
On the other hand, the interpretation of the study results with the Xu-Payne model enables the definition of the pore system of the studied Pannonian Basin limestone. In Figure 8, the P-wave velocity is plotted versus porosity for both dry and saturated samples. The crossplot indicates that the interparticle pore system dominates with a fraction of microcracks since all the data fall below the reference line. Most of the data points are grouped below the 20% crack pore volume line, so according to the interpretation of the results in the Xu-Payne model the fraction of microcracks is between 20% and 35% of the total pore space.
The interpretation is in accordance with the velocity and porosity results and supports the explanation of the presence of predominant fractures as the cause of the velocity oscillation with increasing effective stress.
4.2. Correlation of P-Wave and S-Wave Velocities
Measured P- and S-wave velocities were also compared with each other (Figure 9). Generally, the correlation of P and S velocities is significant for quantitative interpretation and characterization of reservoirs and many authors have published empirical relations for different lithologies, e.g., [30].
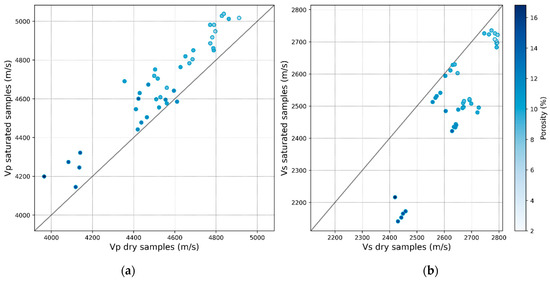
Figure 9.
Correlation between P-wave velocities of dry and saturated samples (a) and S-wave velocities of dry and saturated samples (b).
The results indicate that P-wave velocities of dry samples are lower than velocities of saturated ones, from 15 m/s to 330 m/s or 0.3% to 7.7% (Figure 9a). S-wave velocities of dry samples are lower than saturated (Figure 9b). Although theoretically S-wave velocities should not change during fluid replacement, changes in velocity values are due to density change of the medium by replacing the pore fluid, air to water with 10 g/L NaCl, and moreover because of shear modulus weakening or strengthening. The results show that S-wave velocities of saturated limestone samples are 3 m/s to 290 m/s or 0.1% to 11.6% lower than dry samples.
Since the velocity-porosity crossplot indicates uniform velocity trend regardless of effective pressure, correlation between Vp and Vs is analyzed together for all values of effective pressure (Figure 10).
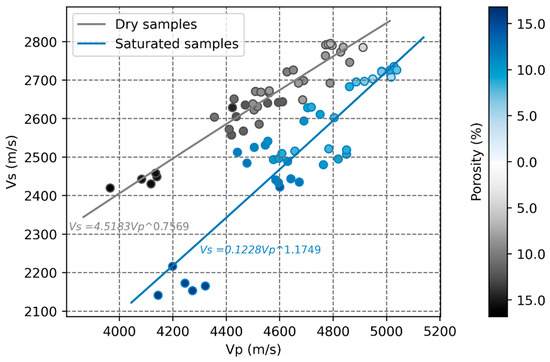
Figure 10.
Correlation of P-wave velocities and S-wave velocities of dry samples (grey dots) and saturated samples (blue dots).
The diagram in Figure 10. Indicates uniform trend of Vp and Vs for all values of the confining pressure. Based on the measured velocities, the correlation between the Vp and Vs of dry limestone can be defined by empirical relation:
while correlation between the Vp and Vs of water saturated limestone can be defined by empirical relation:
Vs = 4.51831Vp 0.7569 (m/s); R2 = 0.91
Vs = 0.1228Vp 1.1749 (m/s); R2 = 0.82
4.3. Elastic Parameters
Besides seismic velocities elastic moduli were determined for all dry and water saturated samples (Table 2). All analyzed samples show an increase in bulk modulus after water saturation which is expected according to many earlier published results, e.g., [5,6,10]. The maximum increase in value is 32.9% and the minimum is 8.6%. The results indicate that the bulk modulus increase with increasing effective stress (Figure 11a).
Table 2.
Elastic parameters of the Pannonian Basin limestone cores. (CP—confining pressure; K—Bulk modulus; G—Shear modulus; E—Young’s modulus; ν—Poisson ratio).
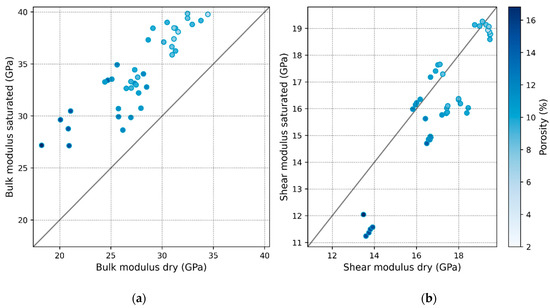
Figure 11.
Crossplot of elastic moduli between dry and saturated samples: (a) bulk modulus and (b) shear modulus.
On the other hand, the effect of shear modulus weakening with water saturation is visible on the studied samples (Figure 11b). The greatest shear modulus weakening of the saturated samples is 19% for sample No. 2. But some samples such as No. 4, No. 7 and No. 8 show an almost linear (theoretical trend). These samples have a slight increase in the shear modulus of saturated samples from 0.20 to 1.3%. Although, their porosity is low with values from 8 to 10%, the relationship between porosity and shear modulus increase was not observed because other samples with the same porosity show the effect of shear modulus weakening. Results in Figure 11b show that three samples have a shear modulus strengthening effect, with pronounced secondary porosity which is consistent with the conclusions of Baechle et al. (2009) [5].
The values of the Poisson’s ratio vary with porosity and depend on the state of saturation, i.e., water saturated or dry sample (Figure 12). The Poisson ratio of dry samples is between 0.203 and 0.269 (Table 2) generally showing decreasing trend with increasing porosity. For saturated samples the trend is opposite presenting increasing Poisson’s ratio with porosity (Figure 12). The Poisson ratio of water saturated samples is 0.273–0.332 (Table 2). The variance of the Poisson’s ratio with effective stress is not significant because the Poisson’s ratio depends on the Vp/Vs values which also do not show dispersion with the change of effective stress. The Vp/Vs values of dry samples decrease slightly, while those of saturated samples increase slightly with increasing porosity. The mean value of Vp/Vs of dry samples is 1.72 and saturated 1.86 (Table 1).
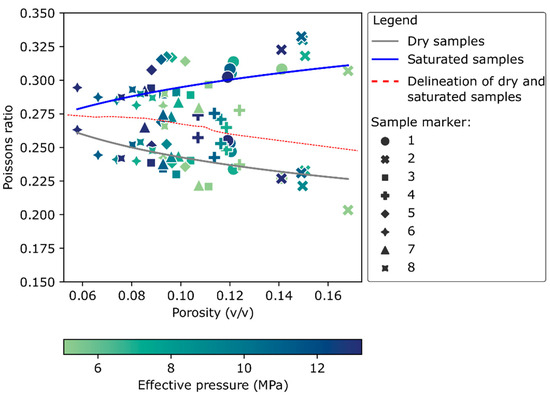
Figure 12.
Crossplot between Poisson ratio and porosity of dry (dark gray line) and saturated samples (blue line). Sample marker indicates different sample number.
To understand and interpret the elastic property of the samples, we performed Gassmann fluid substitution using directly the dry rock results and compared them to results of saturated samples. Gegenhuber (2015) [31] presented the direct implication of dry rock laboratory results into the Gassmann formula for Austrian carbonates.
The bulk modulus resulting from the test on dry samples (Table 1) was used directly in the Gassmann equation. This method assumes uniform pore pressure in the rock [32]. The calculation on dry rock gives an overall good agreement with the saturated samples, but the Gassmann equation gives slightly overestimated results. Figure 13 presents detailed values of the difference between modeled and measured bulk modulus, and the highest value of overestimation is 4 GPa.
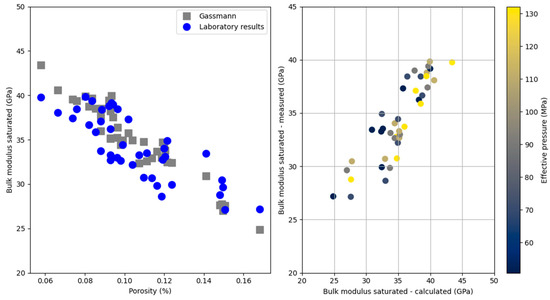
Figure 13.
Relationship between porosity and bulk modulus for saturated samples–measured and calculated by Gassmann equation (left), and relationship of bulk modulus and calculated bulk modulus (right). Input elastic parameters are calcite: K = 76.8 GPa, water K = 2.1 GPa.
Following the velocity dispersion analysis of Regnet et al. (2015) [32] we performed a dispersion analysis of the saturated bulk modulus (Figure 14) which showed that samples 2 and 4 have dispersion values over 10%.
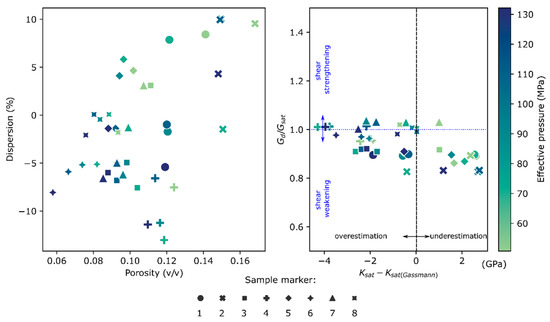
Figure 14.
Crossplot of porosity versus saturated bulk modulus dispersion calculated using the Gassmann equation (left) and crossplot of changes in shear modulus versus the difference between measured and Gassmann-predicted bulk modulus.
5. Discussion
Current study results help to understand the elastic properties of limestones in the southern Pannonian Basin, based on core samples from the Bjelovar Depression, which is necessary for any process of reservoir characterization (e.g., seismic, geomechanics).
The results of the Vp−Vs velocity relationship can be compared with published papers and results. So far, the most detailed analysis of carbonate ultrasonic velocities has been published by Rafavich et al. (1984) [2] based on the laboratory analysis of cores from 4 wells and a total of 93 samples, but here only limestone samples were considered. Ultrasonic velocities were analyzed under an effective stress of 6000 psi, or 40 MPa, on water-saturated samples. Study of Assefa et al. (2003) [33] was performed on limestone core samples from Southern England under in situ conditions at confining pressure of 50 MPa and demonstrated generally slightly lower both P- and S-wave velocities.
Figure 15 shows a comparison of Vp and Vs velocities and porosity based on the results of Rafavich et al. (1984) [2], Assefa et al., (2003) [33] with the results of current research. Rafavich et al. (1984) [2] concluded that the major influence on velocity has porosity and bulk density, while the influence of calcite and dolomite is minor compared to the first two parameters. Our observations show the same trend of decreasing velocities with increasing porosity. It is important to emphasize that there is a difference in laboratory measurements conditions. The results of Rafavich et al. (1984) [2] are based on cores from a depth range of 1200 to 3100 m from the surface with confining pressure of 40 MPa, while the results of the current study are based on cores from a depth range of 805.24 to 974.11 m from the surface with different effective pressures.
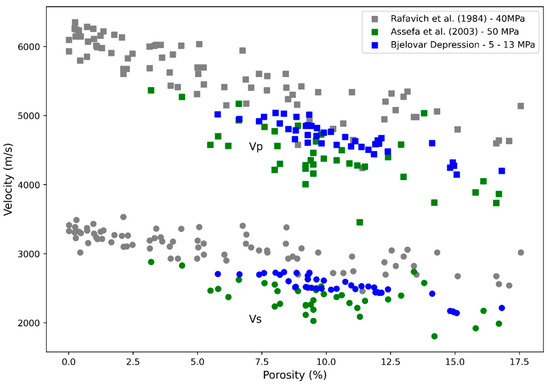
Figure 15.
Relationship of velocities and porosity (Rafavich et al. (1984.) [2]—40 MPa, Assefa et al., (2003) [33]—50 MPa, and Bjelovar Depression—5–13 MPa).
Such consistency in velocity—porosity trends have been discussed by [34] on studied wireline data of chalk despite very large distance to reservoir location. They conclude that diagenetic trends are universal in carbonates. If we consider also results given by [5,7,33] correlation of Vp and Vs (Figure 16) with different confining pressure have credibility for defining the empirical relation defined with formula 1 and 2.
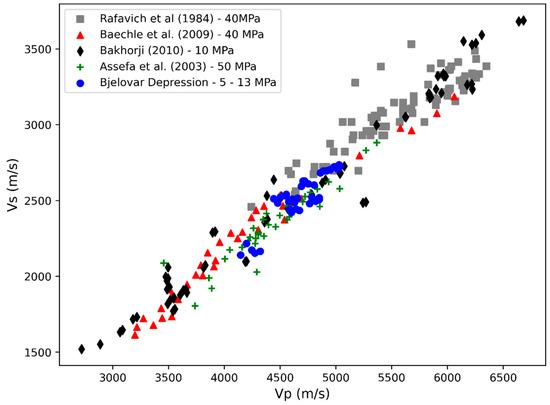
Figure 16.
Comparison of Vp-Vs correlation results in the current study with previous results of [2,5,7,33] obtained for different effective pressures.
Baechle et al., (2009) [5] have studied elastic properties of limestone samples under dry and water saturated conditions with confining pressure from 2 to 80 MPa, but they presented results only for 40 MPa. They concluded that velocities have an inverse relationship to porosity. Elastic properties and prediction models for fully saturated carbonate from Saudi Arabia and Canada are presented by Bakhorji, (2010) [7] study. Laboratory measurements were obtained with different effective pressure steps (2–25 MPa) which overlaps with effective pressure of the current study.
The results of Baechle et al. (2009) [5] and Assefa et al. (2003) [33] indicated decrease in shear modulus for saturated samples. Baechle et al. (2009) [5] imply that Gassmann theory [8] does not consider a constant shear modulus with fluid substitution, but this is considered by numerous Gassmann assumptions for porous media. Therefore, using the Gassmann equation to estimate velocities in these samples may be inaccurate.
Zhao et al. (2021) [35] have implemented an extended Gassmann equation for heterogeneous rocks with complex properties. They concluded that microcracks and patchy saturation cause attenuation.
Regnet et al. (2015) [32] state that the use of dispersion analysis excludes external source, such as cracks due to mechanical compaction and emphasizes the physical relationship. Zhao et al. (2013) [36] assume a random orientation of cracks which significantly affects the seismic wave, especially in the presence of cracks with low aspect ratio. Also, if rocks have two pore systems, cracks and stiff pores, velocity dispersion may occur as a result of elastic pore heterogeneity.
Dispersion affects the velocity-porosity relationship, but according to our results the velocity-porosity relationship is uniform, even for samples with higher dispersion values (2 and 4). Still, considering the defined two-pore system and the presence of stylolite filled with clay minerals, we cannot exclude the influence of anisotropy on our results.
Although, this research gives insight into limestone properties, it also gives an opportunity for further research. Elastic parameters presented in this study can be correlated with static elastic parameters performed on the same samples. Such results would provide correction factors that can be applied on well logs directly and would acquire scientific and industrial benefits (e.g., reservoir workovers as fracking).
6. Conclusions
In the lack of published limestone elastic properties in the Pannonian Basin, especially in Croatia, this paper presents results of ultrasonic velocity measurements, porosity measurements and dynamic elastic properties determination carried out for the first time on the limestone core samples in this part of the Pannonian Basin. The research was performed on 8 core plugs from two boreholes in the Bjelovar Depression, which were in two states, dry and brine saturated. The tests were done at multiple isostatic confining pressure values in both cases.
The porosity under different load pressures range from 5.79% to 15.06%. The variation of velocities with respect to porosity shows the decreasing trend of P- and S-wave velocities with increasing porosity regardless of the effective stress, in a dry and saturated states. Although the velocities decrease uniformly with increasing porosity some samples show velocity scattering with increasing effective stress. The reason for these oscillations is a sudden decrease in porosity during the application of the lowest effective stress and the activation of a predefined crack system with further increase in the effective stress. Based on the Xu-Payne model, the pore type of limestone samples is defined as interparticle pore system with a fraction of cracks from 20% to 35%.
The results show that the P-wave velocities of dry samples are 0.3% to 7.7% lower than those of saturated samples, while the S-wave velocities of saturated limestone samples are 0.1% to 11.6% lower than those of dry samples. The results indicate uniform trend of Vp and Vs for all values of confining pressure, and are consistent with the results in similar published papers [2,5,7,33]. Therefore, an empirical relationship between Vp and Vs for dry and brine saturated limestones has been defined.
All analyzed samples show an increase in bulk modulus after water saturation with a maximum increase in value of 32.9% and a minimum increase of 8.6%. Though, the effect of shear modulus weakening due to water saturation is observed. The greatest shear modulus weakening of the saturated sample is 19% for sample No. 2, although some samples show an almost linear (theoretical) trend.
We performed Gassmann fluid substitution using directly the dry rock results and compared them to the results of saturated samples. The calculation results based on dry rock gives an overall good fit to the saturated samples, but the Gassmann equation gives slightly overestimated results.
The major benefits of this research are the first insights on elastic properties of the Pannonian Basin limestones which provides the basis for further study beneficial for science and industry. The defined empirical relationship allows transformation of Vp to Vs from well log data considering the modified Gassmann workflow.
Author Contributions
Conceptualization, D.V.; Data Curation, D.V.; Formal Analysis, D.V. and C.K.; Methodology, D.V.; Validation, J.O.; Writing—Original Draft, D.V., J.O. and C.K.; Writing—Review and Editing, D.V. and J.O. All authors have read and agreed to the published version of the manuscript.
Funding
This research received no external funding.
Institutional Review Board Statement
Not applicable.
Informed Consent Statement
Not applicable.
Data Availability Statement
Exclude this statement please.
Acknowledgments
Authors thank INA- Rock and Fluid Analysis laboratory, especially Marko Gaćina, Adaleta Perković and Jasmina Jelić-Balta for plug samples preparation, porosity measurements and support. Also, we thank MOL Hungary laboratory for providing ultrasonic velocity measurements.
Conflicts of Interest
The authors declare no conflict of interest.
References
- Sayers, C.M. The elastic properties of carbonates. In The Leading Edge; SEG Library: Tulsa, OK, USA, 2008; Volume 27, pp. 1020–1024. [Google Scholar] [CrossRef]
- Rafavich, F.; Kendall, C.H.S.C.; Todd, T.P. The relationship between acoustic properties and the petrographic character of carbonate rocks. Geophysics 1984, 49, 1622–1636. [Google Scholar] [CrossRef]
- Wang, Z. Seismic properties of carbonate rocks. In Carbonate Seismology; Palaz, I., Marfurt, K.J., Eds.; Geophysical Development Series; Society of Exploration Geophysicists: Tulsa, OK, USA, 1997; Volume 6, pp. 29–52. [Google Scholar]
- Anselmetti, F.S.; von Salis, G.A.; Cunningham, K.; Eberli, G.P. Acoustic properties of Neogene carbonates and siliciclastics from the subsurface of the Florida Keys: Implications for seismic reflectivity. Mar. Geol. 1997, 144, 9–31. [Google Scholar] [CrossRef]
- Baechle, G.T.; Eberli, G.P.; Weger, R.J.; Massaferro, J.L. Changes in dynamic shear moduli of carbonate rocks with fluid substitution. Geophysics 2009, 74, E135–E147. [Google Scholar] [CrossRef]
- Anselmetti, F.S.; Eberli, G.P. Controls on sonic velocity in carbonates. Pure Appl. Geophys. PAGEOPH 1993, 141, 287–323. [Google Scholar] [CrossRef]
- Bakhorji, A.M. Laboratory Measurements of Static and Dynamic Elastic Properties in Carbonate. Ph.D. Thesis, University of Alberta, Edmonton, AB, Canada, 2010; 189p. [Google Scholar]
- Gassmann, F. Uber die Elastizitat Poroser Medien. Vierteljahr. Nat. Ges. Zürich 1951, 96, 1–23. [Google Scholar]
- Biot, M.A. Theory of propagation of elastic waves in a fluid saturated porous solid. I: Low Frequency Range, and II: Higher Frequency Range. J. Acoust. Soc. Am. 1956, 28, 168–191. [Google Scholar] [CrossRef]
- Gegenhuber, N.; Pupos, J. Rock physics template from laboratory data for carbonates. J. Appl. Geophys. 2015, 114, 12–18. [Google Scholar] [CrossRef]
- Khazanehdari, J.; Sothcott, J. Variation in dynamic elastic shear modulus of sandstone upon fluid saturation and substitution. Geophysics 2003, 68, 472–481. [Google Scholar] [CrossRef]
- Royden, L.; Horváth, F.; Rumpler, J. Evolution of the Pannonian Basin System: 1. Tectonics. Tectonics 1983, 2, 63–90. [Google Scholar] [CrossRef]
- Royden, L.H.; Horváth, F. The Pannonian Basin. A Study in Basin Evolution. AAPG Memoir; American Association of Petroleum Geologists: Tulsa, OK, USA, 1988; Volume 45. [Google Scholar] [CrossRef]
- Royden, L.; Burchfiel, B.C. Are systematic variations in thrust belt style related to plate boundary processes? (The western Alps versus the Carpathians). Tectonics 1989, 8, 51–61. [Google Scholar] [CrossRef]
- Saftić, B.; Velić, J.; Sztanó, O.; Juhász, G.; Ivković, Ž. Tertiary subsurface facies, source rocks and hydrocarbon reservoirs in the SW part of the Pannonian Basin (Northern Croatia and south-western Hungary). Geol. Croat. 2003, 56, 101–122. [Google Scholar] [CrossRef]
- Pavelić, D. Tectonostratigraphic model for the North Croatian and North Bosnian sector of the Miocene Pannonian Basin System. Basin Res. 2001, 13, 359–376. [Google Scholar] [CrossRef]
- Čorić, S.; Pavelić, D.; Roegl, F.; Mandić, O.; Vrabac, S.; Avanic, R.; Jerković, L.; Vranjković, A. Revised Middle Miocene datum for initial marine flooding of North Croatian Basins (Pannonian Basin System, Central Paratethys). Geol. Croat. 2009, 62, 31–43. [Google Scholar] [CrossRef]
- Mandić, O.; de Leeuw, A.; Bulić, J.; Kuiper, K.F.; Krijgsman, W.; Jurišić-Polšak, Z. Paleogeographic evolution of the Southern Pannonian Basin: Ar-40/Ar-39 age constraints on the Miocene continental series of Northern Croatia. Int. J. Earth Sci. 2012, 101, 1033–1046. [Google Scholar] [CrossRef] [Green Version]
- Horváth, F.; Cloetingh, S. Stress-induced late-stage subsidence anomalies in the Pannonian basin. Tectonophysics 1996, 266, 287–300. [Google Scholar] [CrossRef] [Green Version]
- Fodor, L.; Bada, G.; Csillag, G.; Horváth, E.; Ruszkiczay-Rüdiger, Z.; Palotás, K.; Síkhegyi, F.; Timár, G.; Cloetingh, S.; Horváth, F. An outline of neotectonic structures and morphotectonics of the western and central Pannonian Basin. Tectonophysics 2005, 410, 15–41. [Google Scholar] [CrossRef]
- Balázs, A.; Matenco, L.; Magyar, I.; Horváth, F.; Cloetingh, S. The link between tectonics and sedimentation in back-arc basins: New genetic constraints from the analysis of the Pannonian Basin. Tectonics 2016, 35, 1526–1559. [Google Scholar] [CrossRef] [Green Version]
- Matoš, B. Neotectonic and Recently Active Faults in Bilogora Mountain Area and Assessment of their Seismogenic Potential. Ph.D. Thesis, University of Zagreb, Zagreb, Croatia, 2014; 256p. Available online: https://urn.nsk.hr/urn:nbn:hr:169:547627 (accessed on 1 September 2021).
- Matošević, M.; Krizmanić, K.; Španić, D.; Perković, A. Petrophysical, Mineralogical-Petrographic, Sedimentological, SEM and Geochemical Analysis of Well Core Samples; Technical Report; INA Database Zagreb: Zagreb, Croatia, 2017; 27p. [Google Scholar]
- Prelogović, E.; Saftić, B.; Kuk, V.; Velić, J.; Dragaš, M.; Lučić, D. Tectonic activity in the Croatian part of the Pannonian basin. Tectonophysics 1998, 297, 283–293. [Google Scholar] [CrossRef]
- API (American Petroleum Institute). Recommended Practices for Core Analysis, 2nd ed.; API: Washington, DC, USA, 1998; 227p. [Google Scholar]
- Koroncz, P.; Fedor, F. Experimental investigation of stress-dependent petrophysical behaviour of reservoir rocks. In Proceedings of the 8th Croatian-Hungarian and 19th Hungarian Geomathematical Congress, Trakošćan, Croatia, 26–28 May 2016; Croatian Geological Society: Zagreb, Croatia, 2016. ISBN 978-9535903611. [Google Scholar]
- Kuster, G.T.; Toksöz, M.N. Velocity and Attenuation of Seismic Waves in Two-Phase Media: Part 1, 2. Geophysics 1974, 39, 587–618. [Google Scholar] [CrossRef]
- Xu, S.; Payne, M.A. Modeling elastic properties in carbonate rocks. Lead. Edge 2009, 28, 98–108. [Google Scholar] [CrossRef]
- Xu, S.; White, R.E. A new velocity model for clay-sand mixtures 1. Geophys. Prospect. 1995, 43, 91–118. [Google Scholar] [CrossRef]
- Greenberg, M.L.; Castagna, J.P. Shear-wave velocity estimation in porous rocks: Theoretical formulation, preliminary verification and applications. Geophys. Prospect. 1992, 40, 195–209. [Google Scholar] [CrossRef]
- Gegenhuber, N. Application of Gassmann’s equation for laboratory data from carbonates from Austria. Austrian J. Earth Sci. 2015, 108, 239–244. [Google Scholar] [CrossRef]
- Regnet, J.B.; Robion, P.; David, C.; Fortin, J.; Brigaud, B.; Yven, B. Acoustic and reservoir properties of microporous carbonate rocks: Implication of micrite particle size and morphology. J. Geophys. Res. Solid Earth 2015, 120, 790–811. [Google Scholar] [CrossRef]
- Assefa, S.; McCann, C.; Sothcott, J. Velocities of compressional and shear waves in limestones. Geophys. Prospect. 2003, 51, 1–13. [Google Scholar] [CrossRef]
- Dvorkin, J.; Alabbad, A. Velocity–porosity–mineralogy trends in chalk and consolidated carbonate rocks. Geophys. J. Int. 2019, 219, 662–671. [Google Scholar] [CrossRef]
- Zhao, L.; Wang, Y.; Yao, Q.; Geng, J.; Li, H.; Yuan, H.; Han, D.-H. Extended Gassmann equation with dynamic volumetric strain: Modeling wave dispersion and attenuation of heterogeneous porous rocks. Geophysics 2021, 86, MR149–MR164. [Google Scholar] [CrossRef]
- Zhao, L.; Nasser, M.; Han, D.-H. Quantitative geophysical pore-type characterization and its geological implication in carbonate reservoirs. Geophys. Prospect. 2013, 61, 827–841. [Google Scholar] [CrossRef]
Publisher’s Note: MDPI stays neutral with regard to jurisdictional claims in published maps and institutional affiliations. |
© 2021 by the authors. Licensee MDPI, Basel, Switzerland. This article is an open access article distributed under the terms and conditions of the Creative Commons Attribution (CC BY) license (https://creativecommons.org/licenses/by/4.0/).