Abstract
The justification for the construction of a wind farm depends primarily on two factors. The first one is the availability of the area with significant windiness; the second one is the environmental conditions in the selected location. The aim of this paper was to demonstrate the need for parallel noise and energy analyses during the design of a turbine location and selection of its type on the wind farm. The noise analyses were performed according to ISO 9613-2. A detailed analysis of wind conditions in a given location is a basic activity to determine the profitability of a wind power plant foundation. The main environmental impact of WF is noise emission. The examples of wind turbines’ selection optimally utilizing wind resources in two particular locations are presented. Six wind turbines were analyzed for each location. The choice of a wind turbine for the examined location was determined by the parameters of the device, the results of annual wind measurements, and acceptable noise levels in the environment. The three devices that met the acoustic criteria and the most energy efficient ones are indicated. We describe how a proper process of selecting a type of WT for a specific location should proceed.
1. Introduction
The construction of a wind farm is a complex project. It consists of many stages, such as selection of an appropriate location, wind measurement, equipment selection, turbine spacing analysis, formal and legal procedures, and construction design. A comprehensive study of many issues related to the design of wind farms can be found in the research papers of the DTU group [1], where a number of study cases as well as commonly used design methods for wind farms are presented.
The least noticed by investors, yet a very important stage, is the development of a concept for the selection of the equipment and the placement of the turbines. This process is referred to in the wind farm industry community as micrositing. Micrositing is the process of determining exactly where within the investment area particular turbines will be located. Location conditions and environmental protection requirements are taken into account while maintaining a broadly understood optimization of energy production. Decisions made at this stage determine the further course of the project and its execution. Appropriate execution of the technical concept allows minimizing the investment risk and optimizing the costs at the stage of design, construction, and operation.
By the middle of this century, global energy consumption is expected to increase by almost 50%. Although the production of energy from renewable sources (RES) is expected to increase dynamically, the production of energy from fossil fuels will also grow (although at a slower pace than in the case of RES) [2]. Due to the resignation of many countries from the production of energy from fossil raw materials, renewable forms of energy production will be subject to an increase [3,4]. One of the forms of renewable energy production is the use of wind resources by inland wind power plants. Wind farms (WF) composed of installations with a nominal capacity above 1 MW have been in operation for more than 20 years [5]. Soon, old devices will be replaced by newer and more efficient ones. The stock of areas with significant windiness will decrease due to the expansion of the acquisition of land not yet used for the construction of wind farms. The wind power plants will come closer to the residential buildings. This will result in the environmental limitations of WF construction becoming a very important criterion for the selection of wind turbines [6,7]. The appropriateness of the WF construction depends primarily on two factors. The first one is the availability of the area with significant windiness; the second one is the environmental conditions or restrictions in the selected location.
The process of selecting WF turbines usually begins with determining the availability of equipment on the market. The investor identifies a group of devices for further analysis. Then, teams of specialists proceed to the design. Since the economic aspect of the project is very important, the productivity of the future power plant is examined. Based on the above, the power engineers team selects one type of equipment and specific turbine foundation points. Then, a group of acousticians accepts the WF for analysis. Due to environmental restrictions, the acousticians’ team often makes adjustments to the turbine modes. The adjustment is made by reducing the acoustic power of the device but with the loss of its productivity.
The construction of WF is mainly financed by bank loans. The project, classified by the bank as repayable, is also based on wind expertise. The expertise includes compilation of measurement data from all sensors, the shading effect, and other analyses, such as landscape analysis, uncertainty of measurement analysis, air density analysis, wind power distribution analysis, wind turbine set efficiency analysis, and others. Bank expertise also includes data that allow assessing the investment in terms of wind turbine selection, Weibull distribution, wind directional distribution [8,9,10], and environmental impact [6].
The basic tools that determine the foundation of future wind farms are topographic maps, identification of roughness of the area and permanent barriers, assumptions concerning wind conditions, selection of height, and power of wind turbines. On-site inspection at the location of the future wind farm provides information about the real state (photographic records, GPS data, as well as a full and detailed description of all barriers occurring in a given location). Obstacles that can affect wind energy potential are typically industrial buildings, residential buildings, forests, single trees, chimneys, other wind turbines, observation towers, traffic towers, hills, mountains, heaps, bridges, etc. A correctly conducted wind conditions’ measurement campaign must take these conditions into account. Guidelines for wind measurements are given in IEC 61400-12-1 [11]. Annex G of this standard sets out the arrangements for the correct installation of the measuring equipment on a meteorological mast. The guidelines given in IEC 61400-12-1 [11] are international practice for wind measurements [12,13].
A wind farm itself has a negligible influence on the environment. However, the negative aspect of the wind farms is the noise generated while the turbines are in operation condition. Because of the noise, the decision made on a new wind farm location should be preceded by the analysis of the noise influence on the surrounding environment. Especially, the range of this noise is considerably wide and ranges from 0.1 Hz to 16,000 Hz [14,15]. The available wind turbines possess different characteristics of the acoustic power, which may also change during operation depending on the wind speed [14,16]. Having in mind the above, the wind farm composed of many wind turbines (WT) should be located the right distance from a residential area in order to provide an appropriate sound level, which would not cause an acoustic discomfort for the inhabitants. This sound level is described as a permissible sound level in the environment and varies from country to country. Individual countries define it according to WHO guidelines [17]. WHO guidelines indicate that a non-irritating, acoustic noise level in the environment for most people is about 40 dB at nighttime. According to the LAeq, the permissible noise levels are between 43 dB (Belgium, Flanders) and 55 dB (Georgia, USA).
The aim of this paper was to demonstrate the need for parallel environmental and energy analyses during the design of turbine location and selection of its type on the wind farm (WF). Due to the authors’ experience, gained while participating in many processes of determining the location and selection of wind farm equipment, a lack of coordination between project teams was observed. This problem applies to all ongoing projects. The acousticians’ team focused only on noise analysis. On the other hand, the power engineers’ team only analyzed the aspect of maximum WF productivity.
The paper presents an example of two detailed analyses performed for a small WF. On their basis, the erroneous course of action described above was proven. The proposed simultaneous consideration of the aspect of productivity and maintenance of acceptable levels of noise in the environment is more beneficial for the investor. Using simple examples, it was shown that extended analysis, including many devices, allows making investment decisions more efficiently. The results obtained allow the investor to choose or change the type of equipment at any subsequent design stage. The article attempts to indicate multidisciplinary parameters, such as the sound power level of a turbine, the location conditions, local average wind speed range, and power curve of a turbine, influencing the amount of energy generated by WF. The paper also focuses on the selection of an appropriate type of wind turbine for the studied locations, taking into account the protection of the environment against the noise.
2. Materials and Methods
Two examples of locations of wind power plants, farms A and B, were investigated. In order to ensure comparability, the construction of wind power plants of similar shapes and environmental limitations in both locations was assumed (Figure 1). The WFs consisted of four turbines with a horizontal axis of rotation and nominal power of 2.0, 2.3, or 2.5 MW. No device was excluded during the energy analyses. However, after the noise analysis, the productivity of the farms was re-evaluated. Table 1 presents the wind turbines selected for analysis.
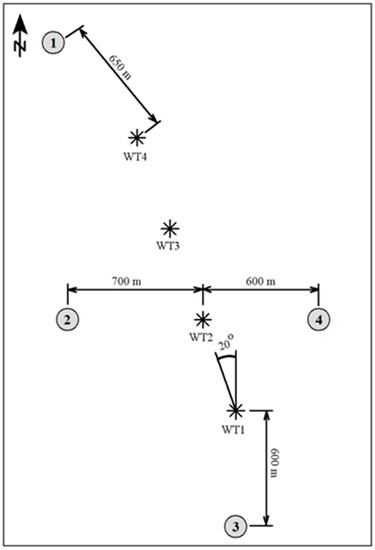
Figure 1.
Location of a wind turbines and the control points.

Table 1.
Parameters of investigated types of turbines.
Assumptions for both locations were:
- achievement of maximum energy efficiency for the entire WF;
- the maximum height of the wind turbine (tower + rotor) must not exceed 150 m above ground level;
- a single tower height of 100 m was set for all types of turbines;
- the noise in the nearest protected areas may not exceed the limit value;
- the permissible noise level for daytime is 50 dB and for nighttime, 40 dB;
- the possibility of reducing the acoustic power of a turbine at the expense of its productivity was taken into account;
- due to the appropriately selected WF shape, the impact of individual wind turbines on the neighboring ones (turbulence, delayed wake-up, etc.) was not taken into account;
- the turbines were positioned in a line inclined at an angle of 20° in the direction of N–S (Figure 1); and
- the distance between the turbines was about 500 m, which corresponded to a minimum of five rotor diameters.
To achieve the maximum WF energy efficiency, reliable wind measurements are required at the selected location. The comprehensive development of various aspects of the wind measurement procedure reduces the risk of error or uncertainty in the subsequent stages of wind turbine location design [12,13]. When measuring wind resources at a given location, land relief, natural and infrastructural barriers, slope, and other factors influencing the wind are taken into account. The wind analysis will result in a histogram of the wind speed distribution in class intervals of 1 meter/second. The duration of the measurements will be at least 1 year [12]. The selection of a wind turbine is made on the basis of the measurement results and productivity characteristics of available wind turbines. The manufacturer of the equipment presents the dependence of the turbine power on the wind speed. The characteristics of the equipment also contain information about the turbine start speed, nominal power, and maximum wind speed causing the equipment to be switched off. Based on the power plant characteristics, it is necessary to estimate the power value Pwe_i for the wind speed being the means of successive class intervals. In the next step, Ewe_i energy generated by the power plant during 1 year in the next i-th class interval should be calculated:
Summing up the component energy from all compartments, the total energy Ewe generated during 1 year by the power plant is obtained:
The maximum height of a wind turbine is the sum of the length of the supporting tower and half the diameter of the rotor. The height of the hub as well as the rotor’s diameter have a crucial influence on the power output and facility cost [18]. The construction and assembly of a high mast give the possibility to use higher wind speeds in higher air layers [19,20]. The permissible height is determined by local law or national regulations. These are the local spatial development plans or the regulations of the relevant government department. The purpose of determining the permissible height of a building is to introduce and maintain order in the landscape.
Calculations of the range of noise emitted by wind farms are being performed worldwide. The prediction of the noise emission is a starting point for each design works, enabling the assessment of an acoustic threat to the environment, required to get the building permission [21]. Local studies of the noise of wind turbines in chosen control points are conducted by various researchers in a similar way. Generally, they measure the equivalent level of sound (LAeq) or levels LA90, LA50, LA10, depending on the recommended measurement procedures and assessment criteria valid in a certain country. In these analyses, the LAeq indicator was used. The equivalent continuous sound level (Leq) is the steady sound pressure level, which, over a given period of time, has the same total energy as the actual fluctuating noise.
The main objective of wind farm design is to optimize energy efficiency. To achieve the above, one must provide the minimum energy losses while keeping the maximum of the energy generation. The largest losses are termed wake losses and are the result of mutual interference between wind turbines. The wind partially consumes its energy when passing through the rotor of a wind turbine. Its speed behind the turbine is weakened, which may result in a decrease in the power of other, further wind turbines [22,23,24]. Moreover, placing the wind turbines in a row along the main wind direction intensifies this phenomenon and significantly reduces the output power of the WF [25]. This aspect was omitted in these analyses. The turbines were positioned in a line perpendicular to the prevailing wind direction.
3. Results
3.1. Energy Analysis
The main parameter influencing the choice of wind turbine type is the available wind power and the related wind speed distribution in the tested location. These parameters influence the amount of electricity generated and the income from the investment.
3.1.1. Wind Power
The wind power, modeled as a gas, can be expressed with the following formula [14]:
The air density for the normal conditions (at temperature t = 273 K and pressure p = 105 Pa) equals ρ = 1.2759 kg/m3. In the wind power sector, the assumed temperature is t = 15 °C and the pressure is p = 1013 hPa [19] for which the air density equals to ρ = 1.225 kg/m3. Assuming the unit flow area Af = 1 m2, the unit wind power obtained in the i-th speed range Pwe_i can be expressed using the following formula:
On the basis of Equations (1), (2), (4), and (5), it is possible to determine the resources of wind power and wind energy in the examined location. The average annual wind speed in the wind farm A is vav = 6.56 m/s and in the wind farm B vav = 6.58 m/s. While making the preliminary assessment of the results it can be noticed that in the examined location a wind stream with the energy of 1962 kW/m2 per farm A and 1725 kW/m2 per farm B flowed through the area of 1 m2 in 1 year. Although in both locations the average wind speed values were almost identical, their distribution in the different speed classes was different. Detailed wind measurement results for both locations are presented in Section 3.1.2.
3.1.2. Wind Speed Distribution in Selected Locations
The following analysis used the results of wind measurements made at the site of the future location of two wind farms in northern Poland. The distance between the future wind farms is more than 100 km. Accuracy and correctness of validation and a thorough analysis of measurement data are the key elements determining the usefulness of a given location in terms of its wind potential. The primary objective of the final report on wind measurements is to summarize the measurement period and present it in a graphical or tabular form. Taking into account the assumptions presented in Section 2, the results relating to the height of the center of the wind turbine rotor were selected.
The data were counted and a Weibull fit was performed to the measured frequency distribution. It must be noted that the provided parameters were a mathematical result. The two-parameter Weibull function is the most accepted technique for fitting the wind speed curve over a time period [26].
The two-parameter Weibull probability density function is given by the following:
where v, k, and A > 0.
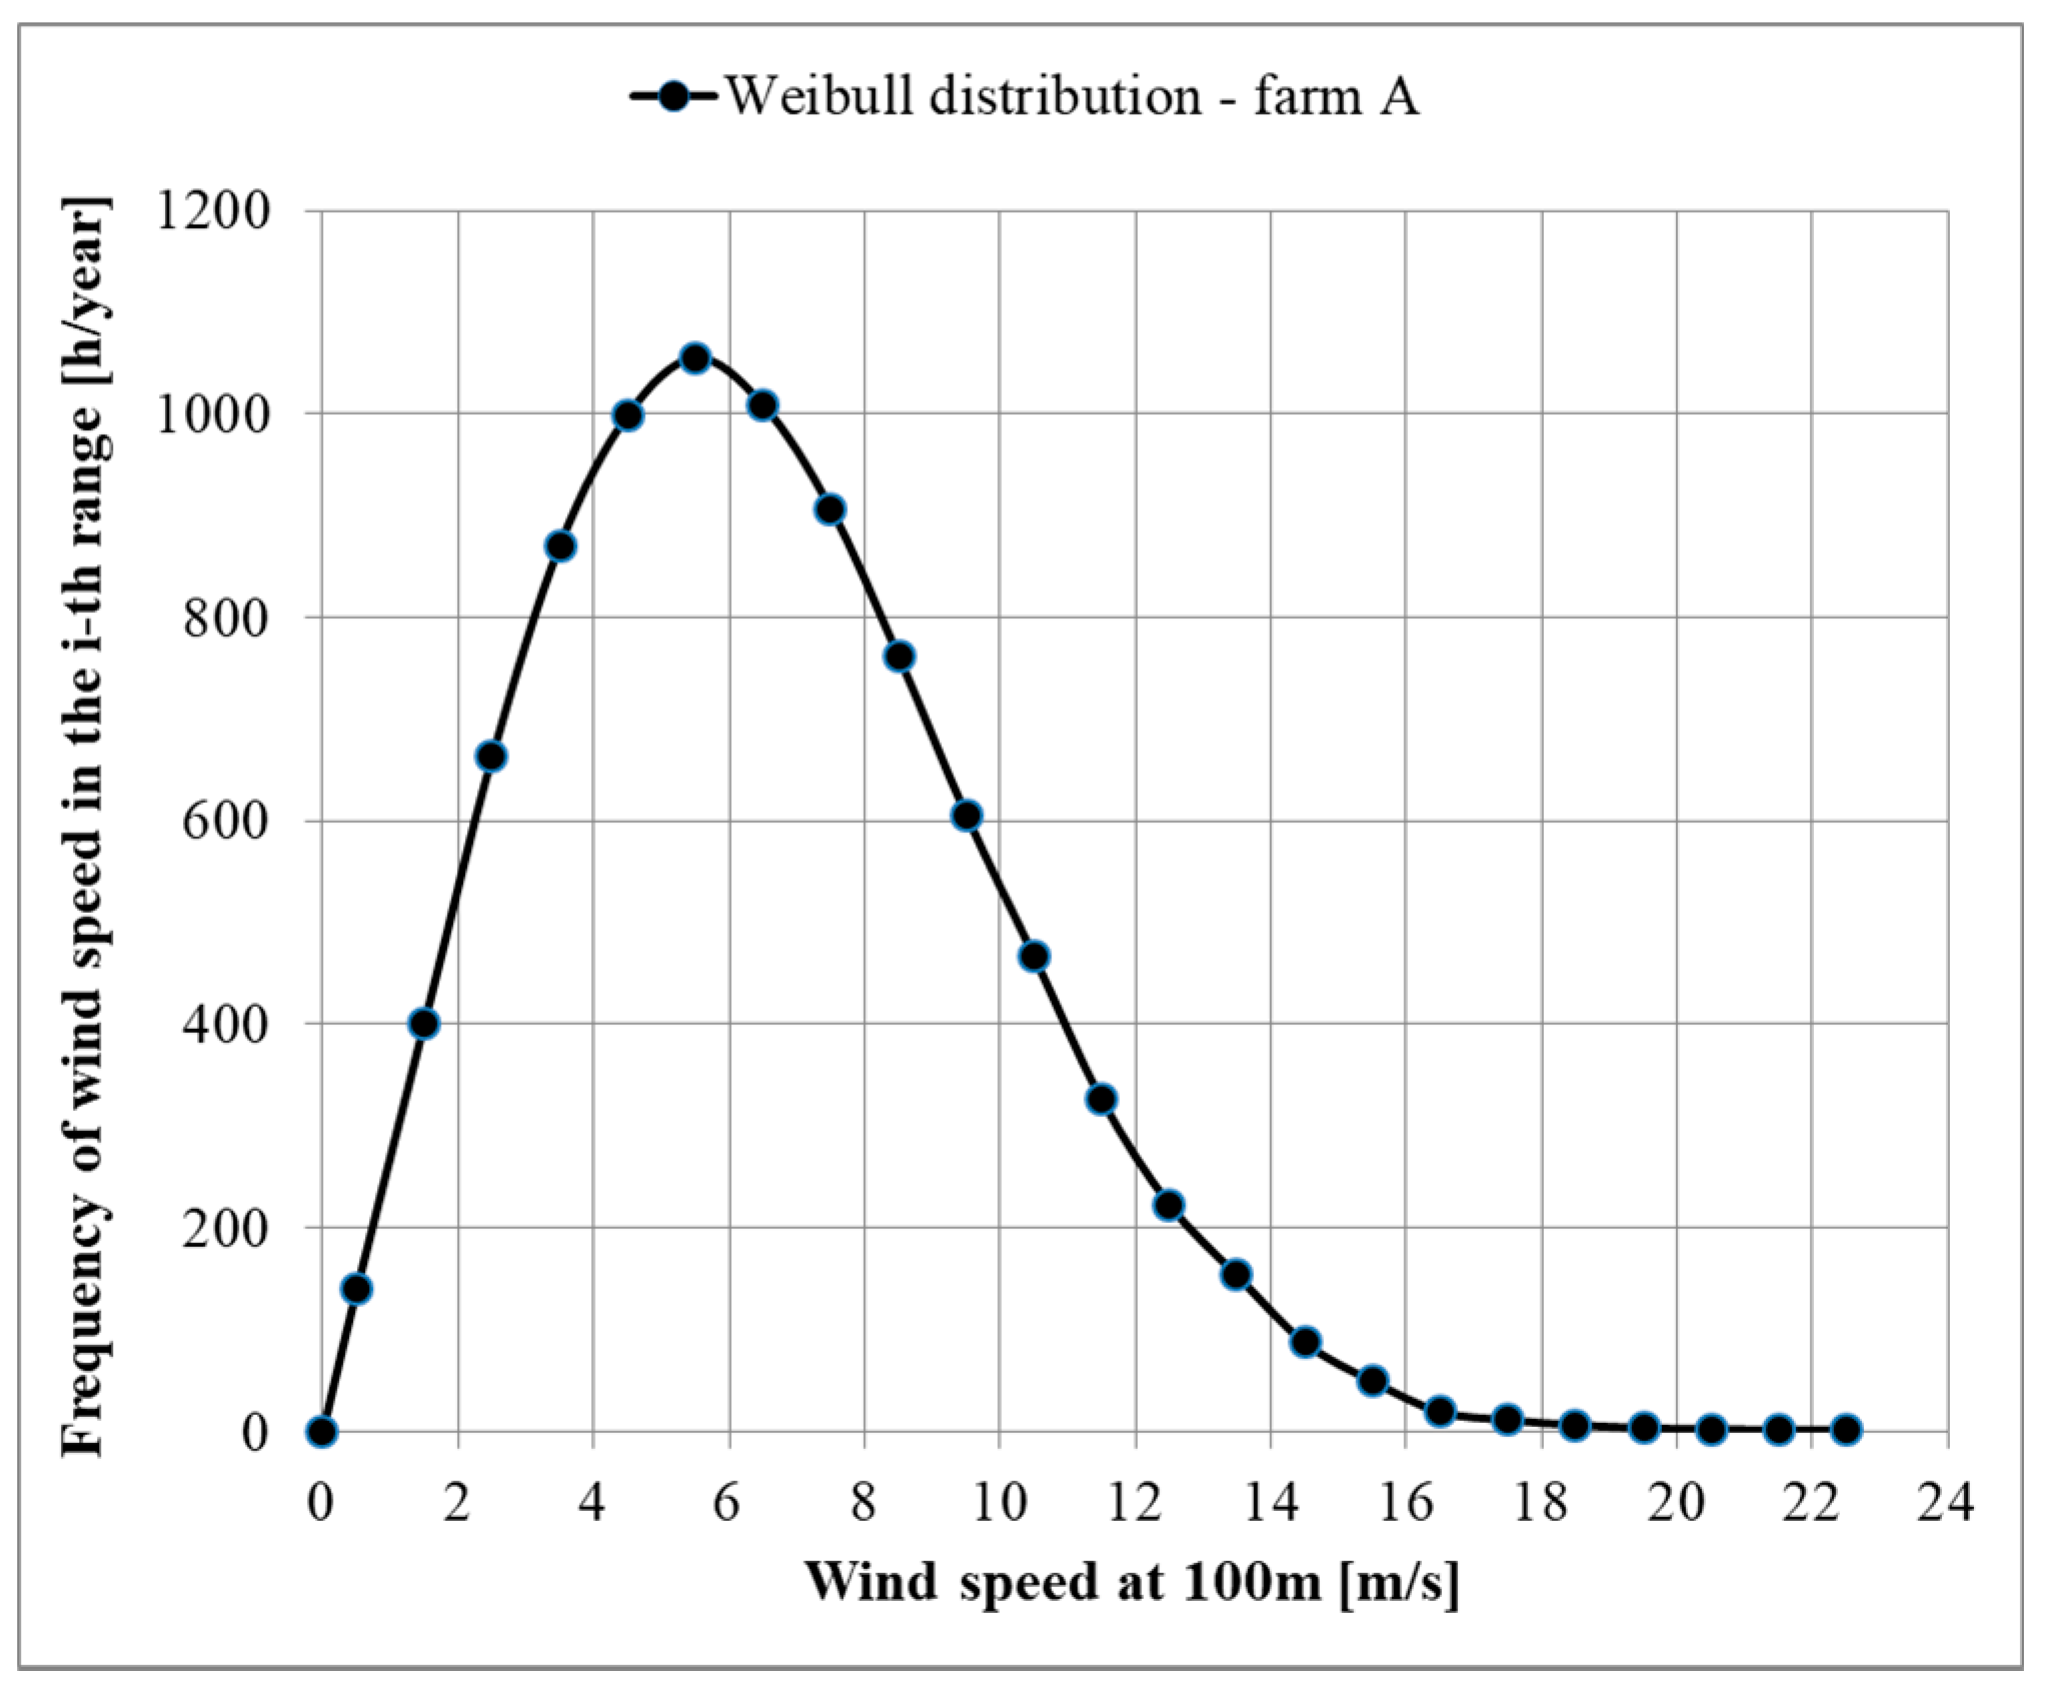
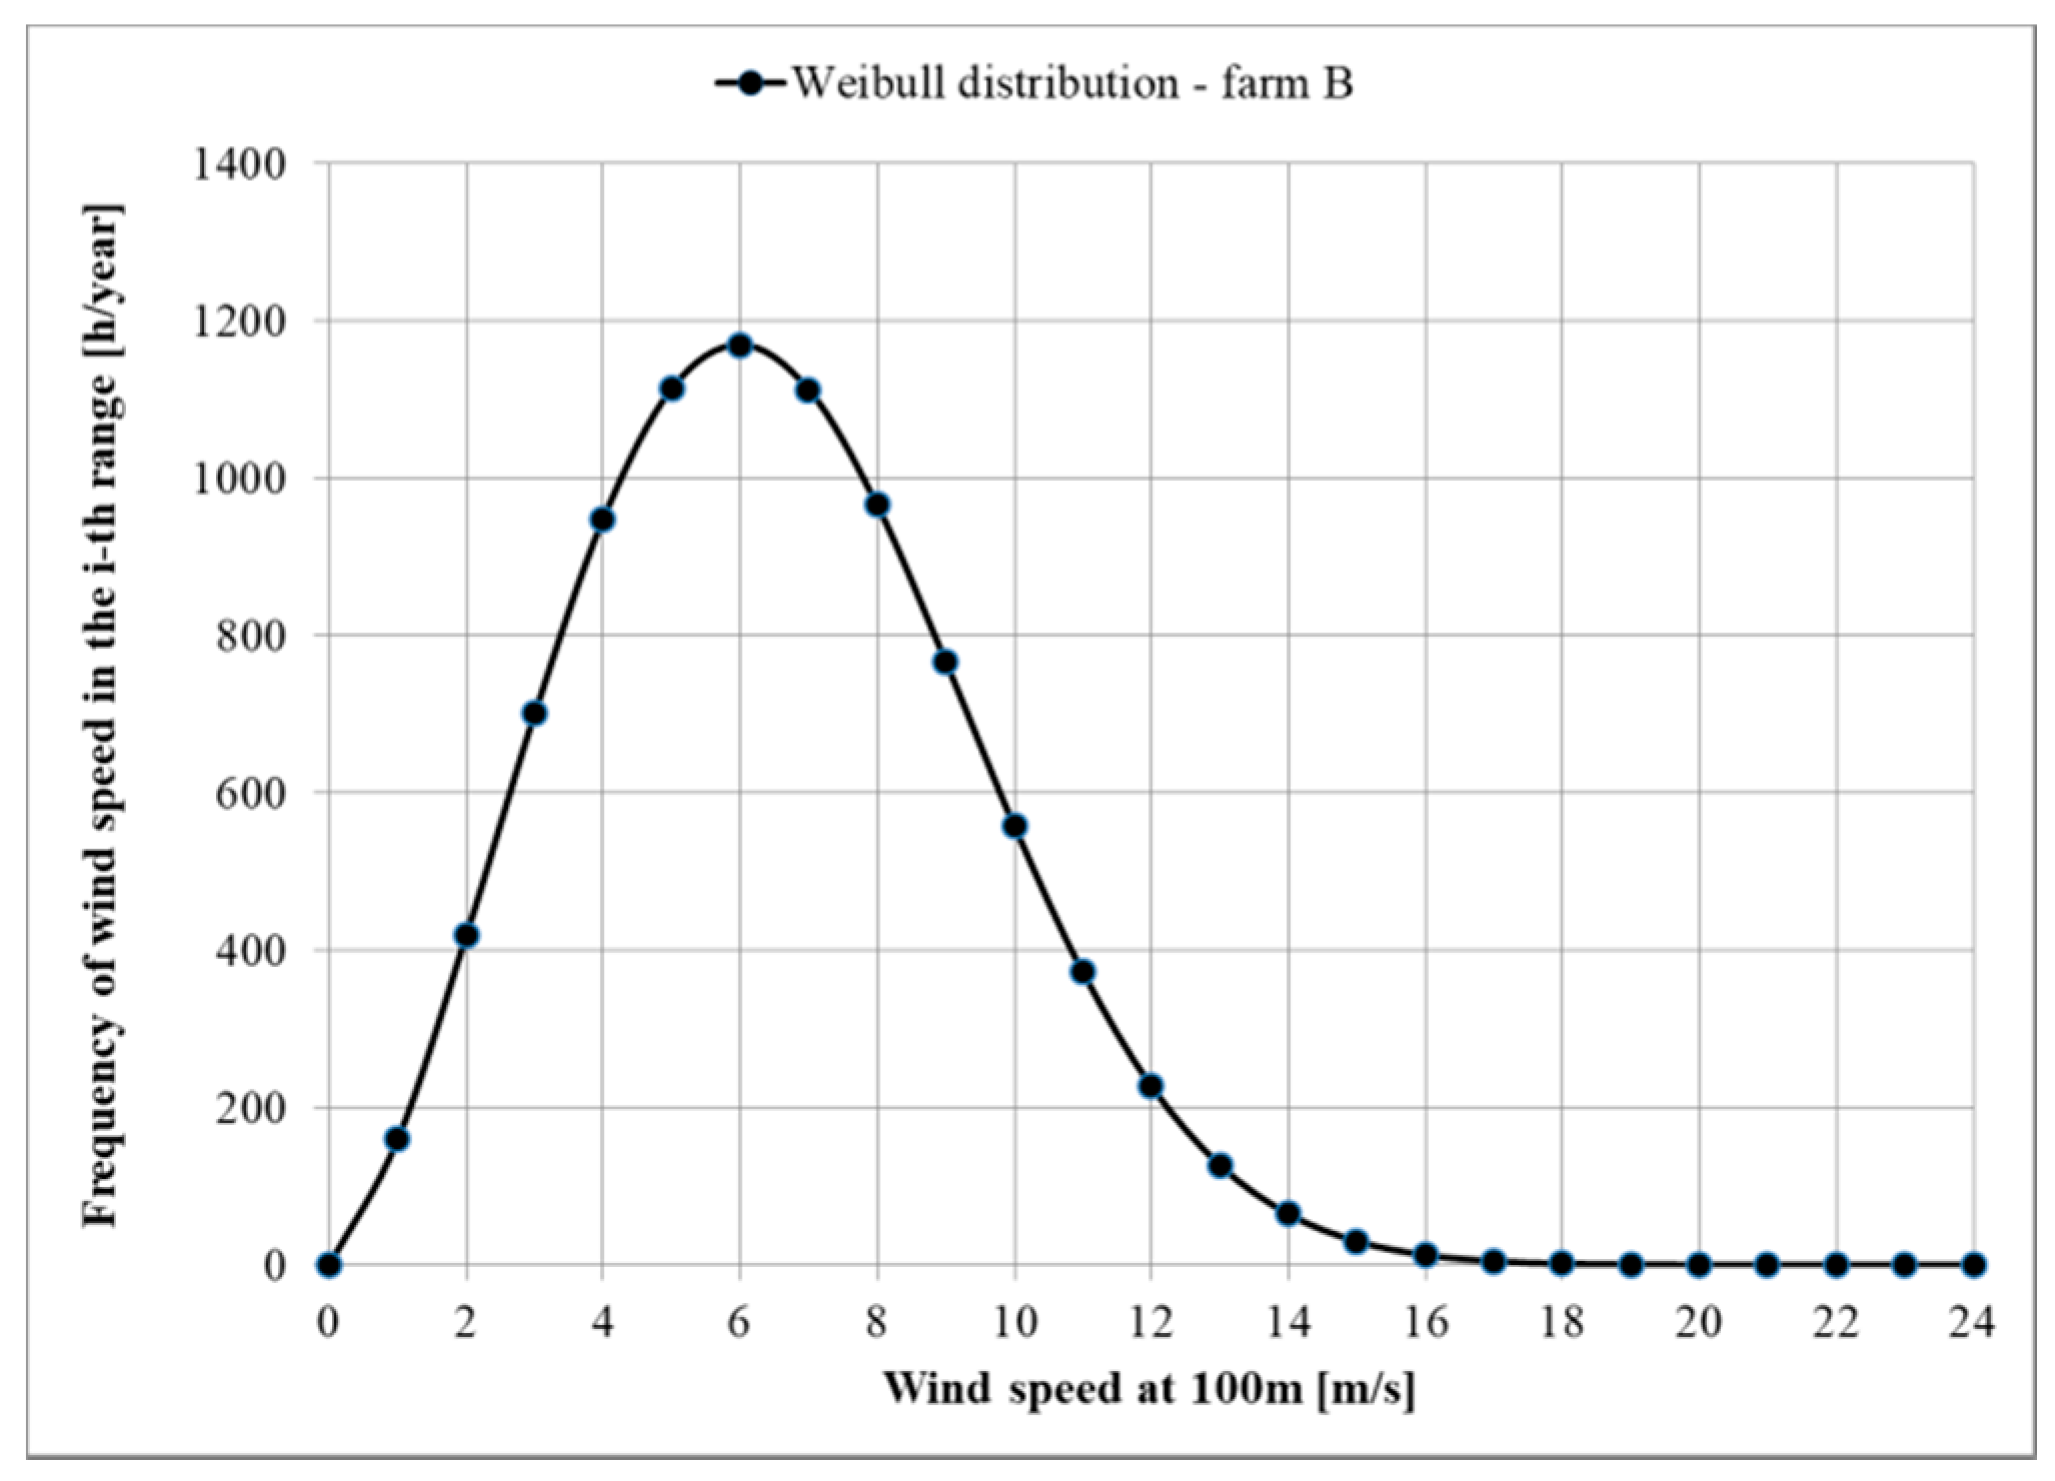
The factor k is a dimensionless quantity that determines the shape of curve. It is called a shape factor. Parameter A is the scale parameter. The distributions take different shapes with different values of k and A. For farm A, the best Weibull distribution match was obtained for k = 2.13 and A = 7.45 m/s (Figure 2), and for farm B, for k = 2.44 and A = 7.42 m/s (Figure 3). The percentage results obtained from the density function were multiplied in each speed class by 8760 (number of hours per year). The number of hours for each wind speed class was thus obtained.
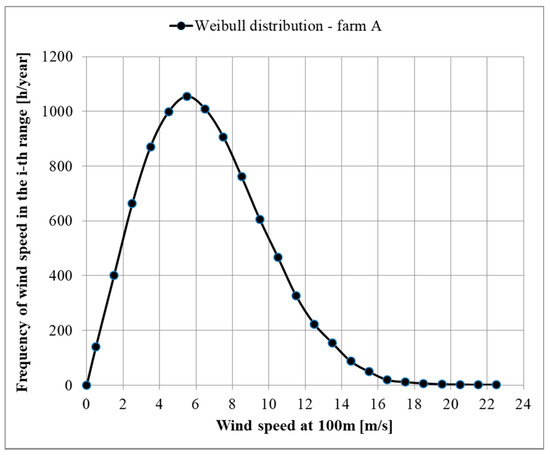
Figure 2.
The Weibull distribution for the anemometer at 100 m above ground level, farm A.
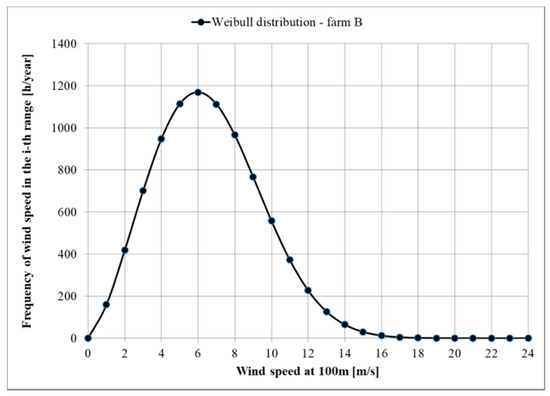
Figure 3.
The Weibull distribution for the anemometer at 100 m above ground level, farm B.
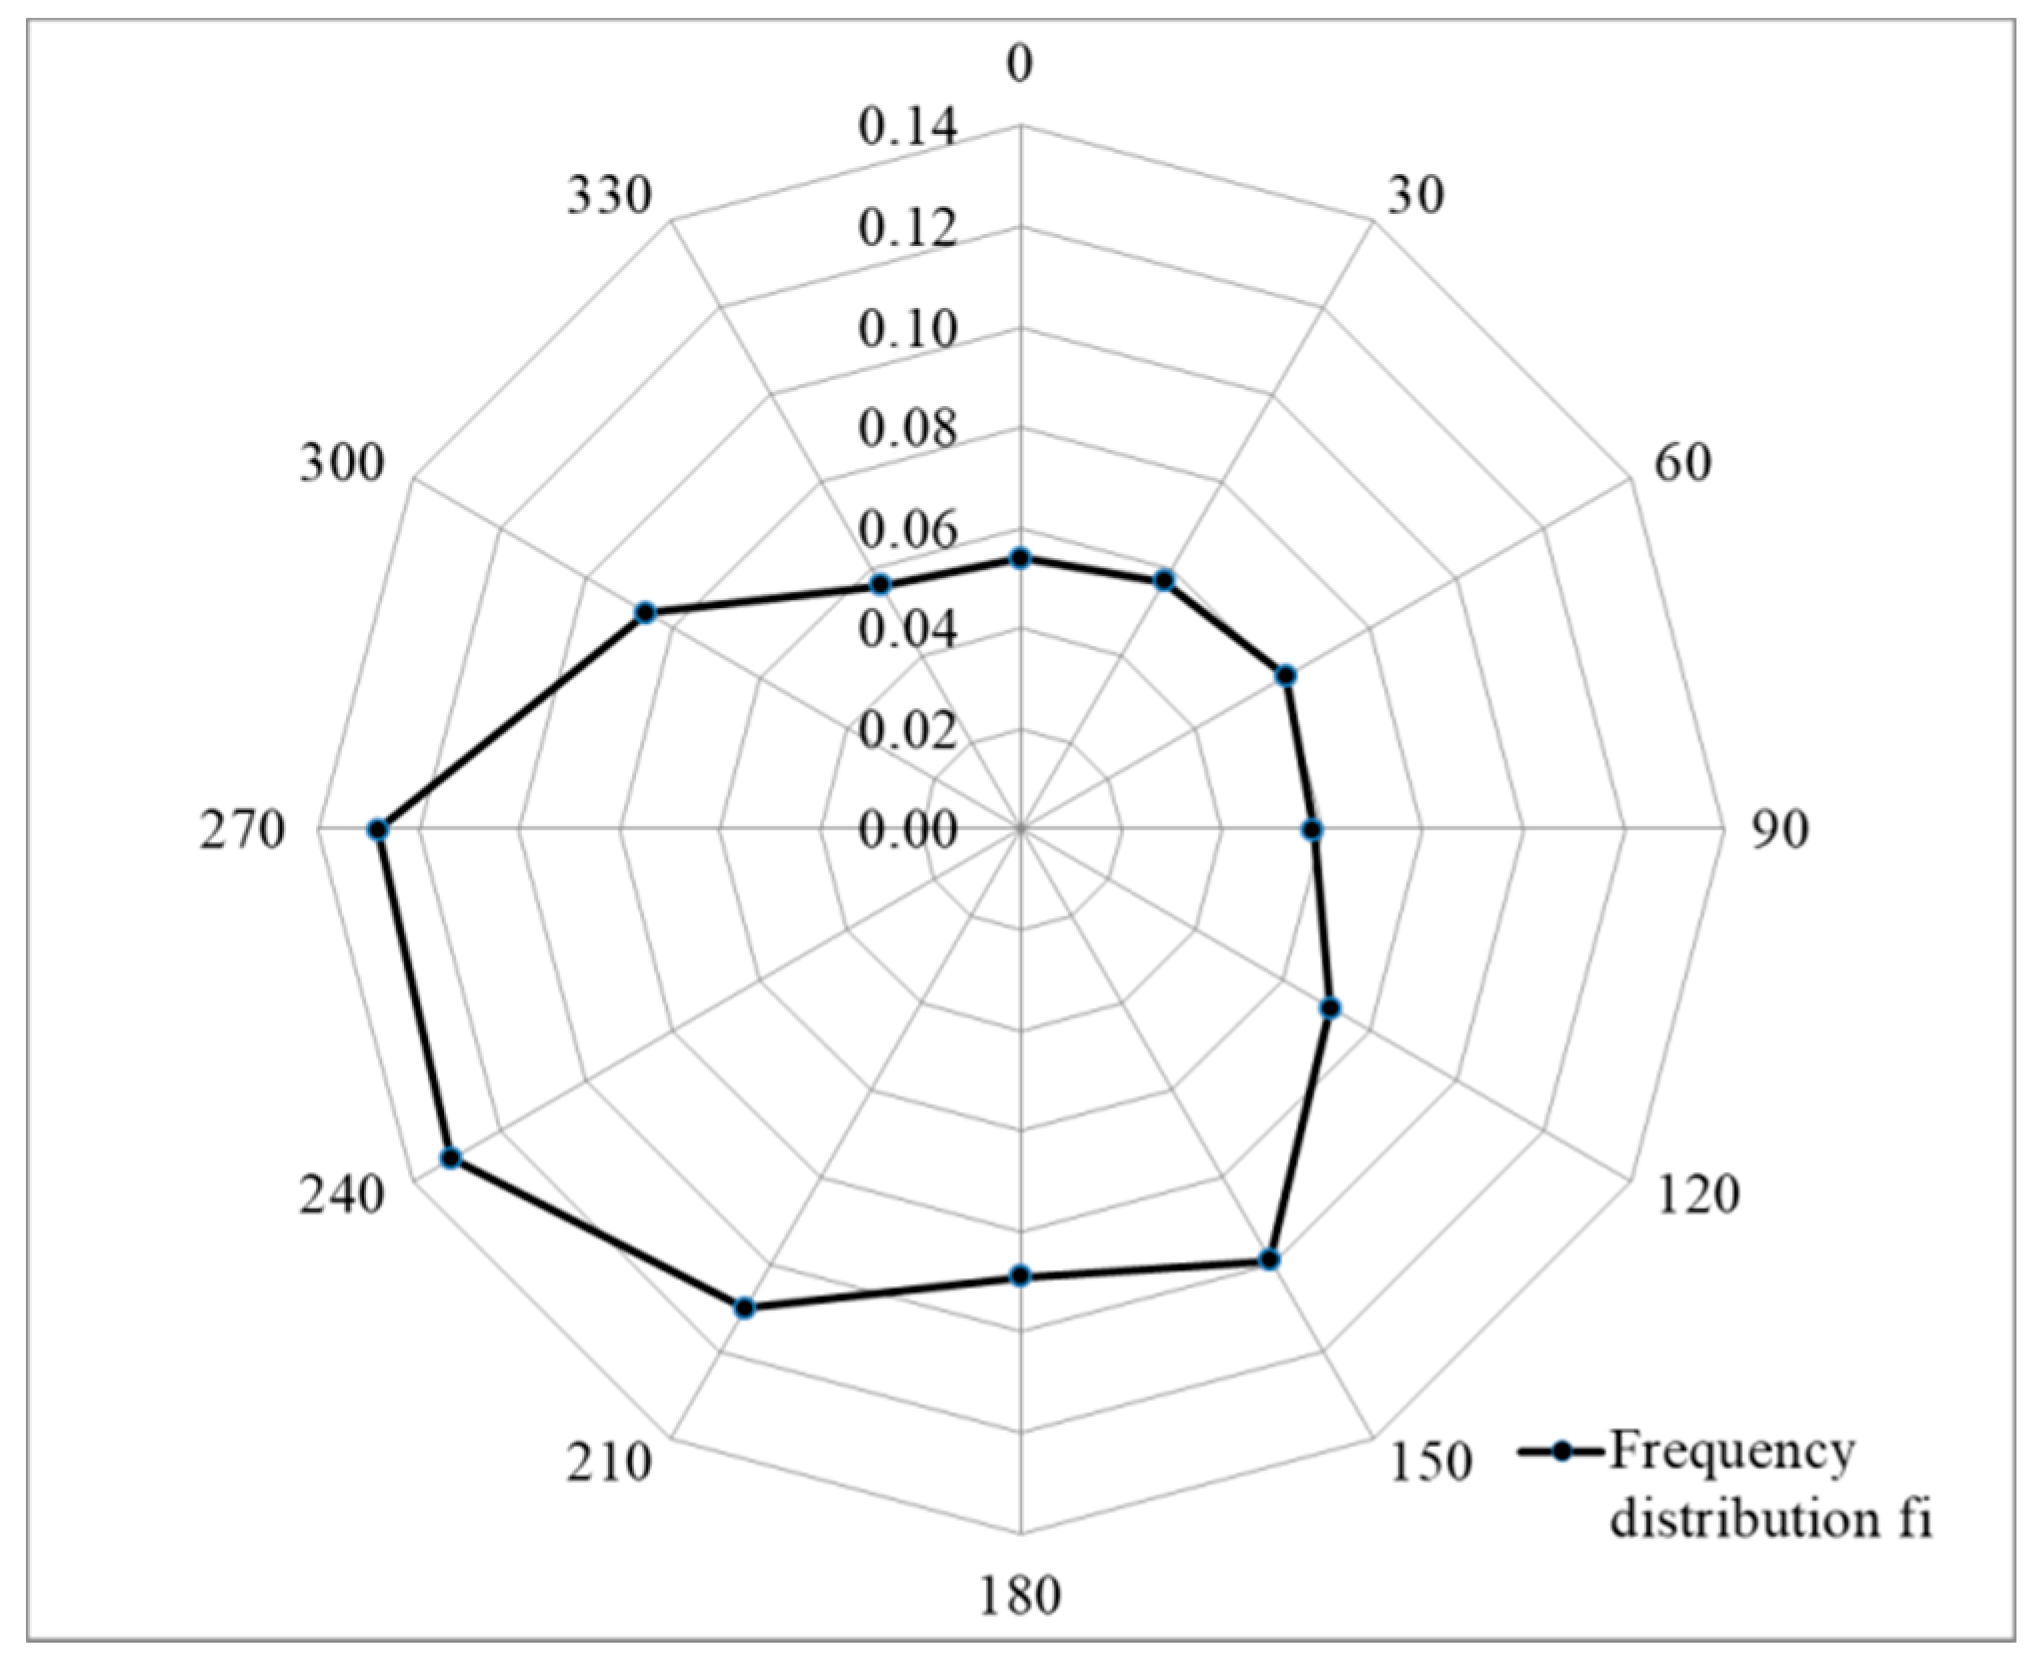
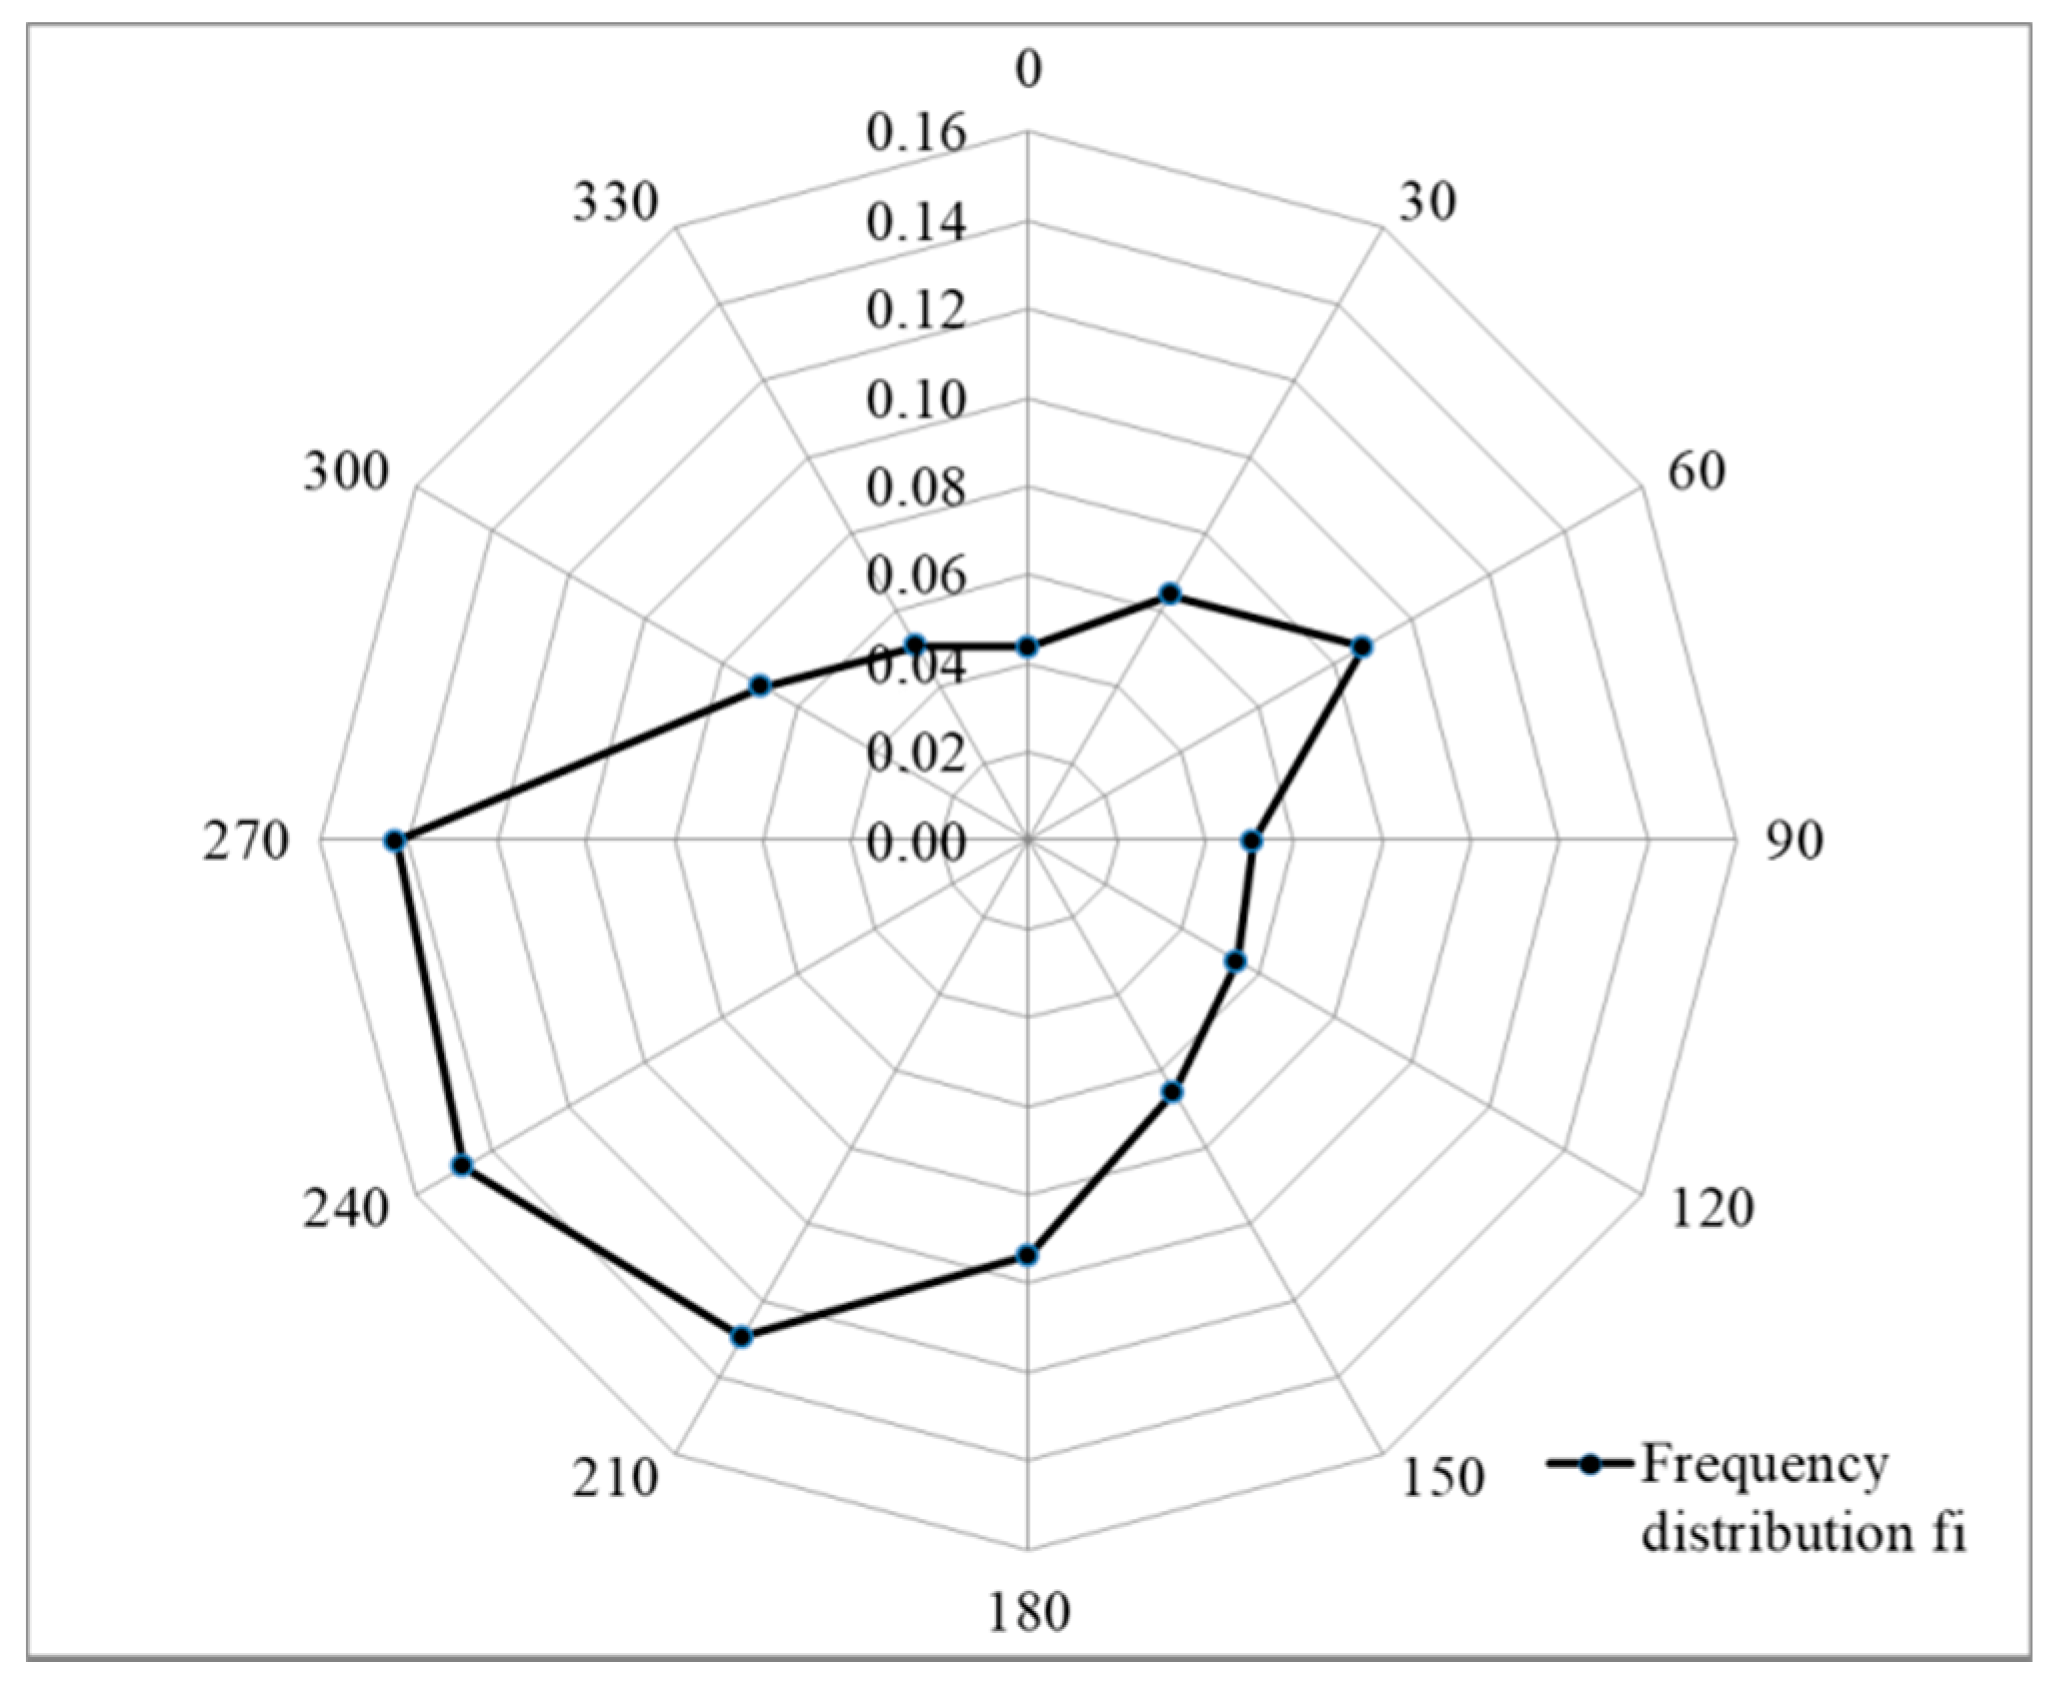
The Figure 2, Figure 3, Figure 4 and Figure 5 present the summary of selected data at selected locations in northern Poland.
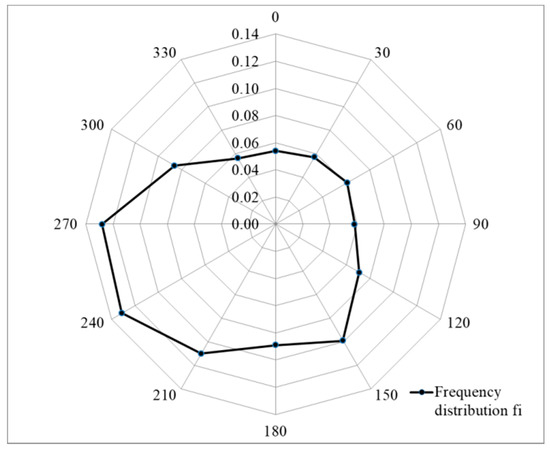
Figure 4.
Wind direction distribution in the measurement period - wind rose for farm A.
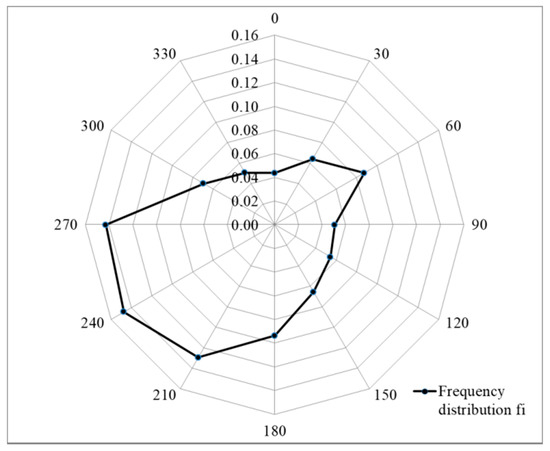
Figure 5.
Wind direction distribution in the measurement period - wind rose for farm B.
3.1.3. Wind Turbine Selection
Selection of the type of wind power plant and estimation of its energy efficiency in the tested location are made on the basis of the histogram of wind speed distribution (Figure 2 and Figure 4). Calculations are made, taking into account the characteristics of the wind power plant described by the manufacturer, which presents the dependence of the turbine power on the wind speed.
Table 2 and Table 3 contain the number of hours per year with wind speed falling within specific range of 1 m/s resolution. Basing on the productivity vs. wind speed tables available for each turbine, the yearly energy production was determined for each of the turbines.
Table 2.
Net energy produced by six different wind turbines, farm A.
Table 3.
Net energy produced by six different wind turbines, farm B.
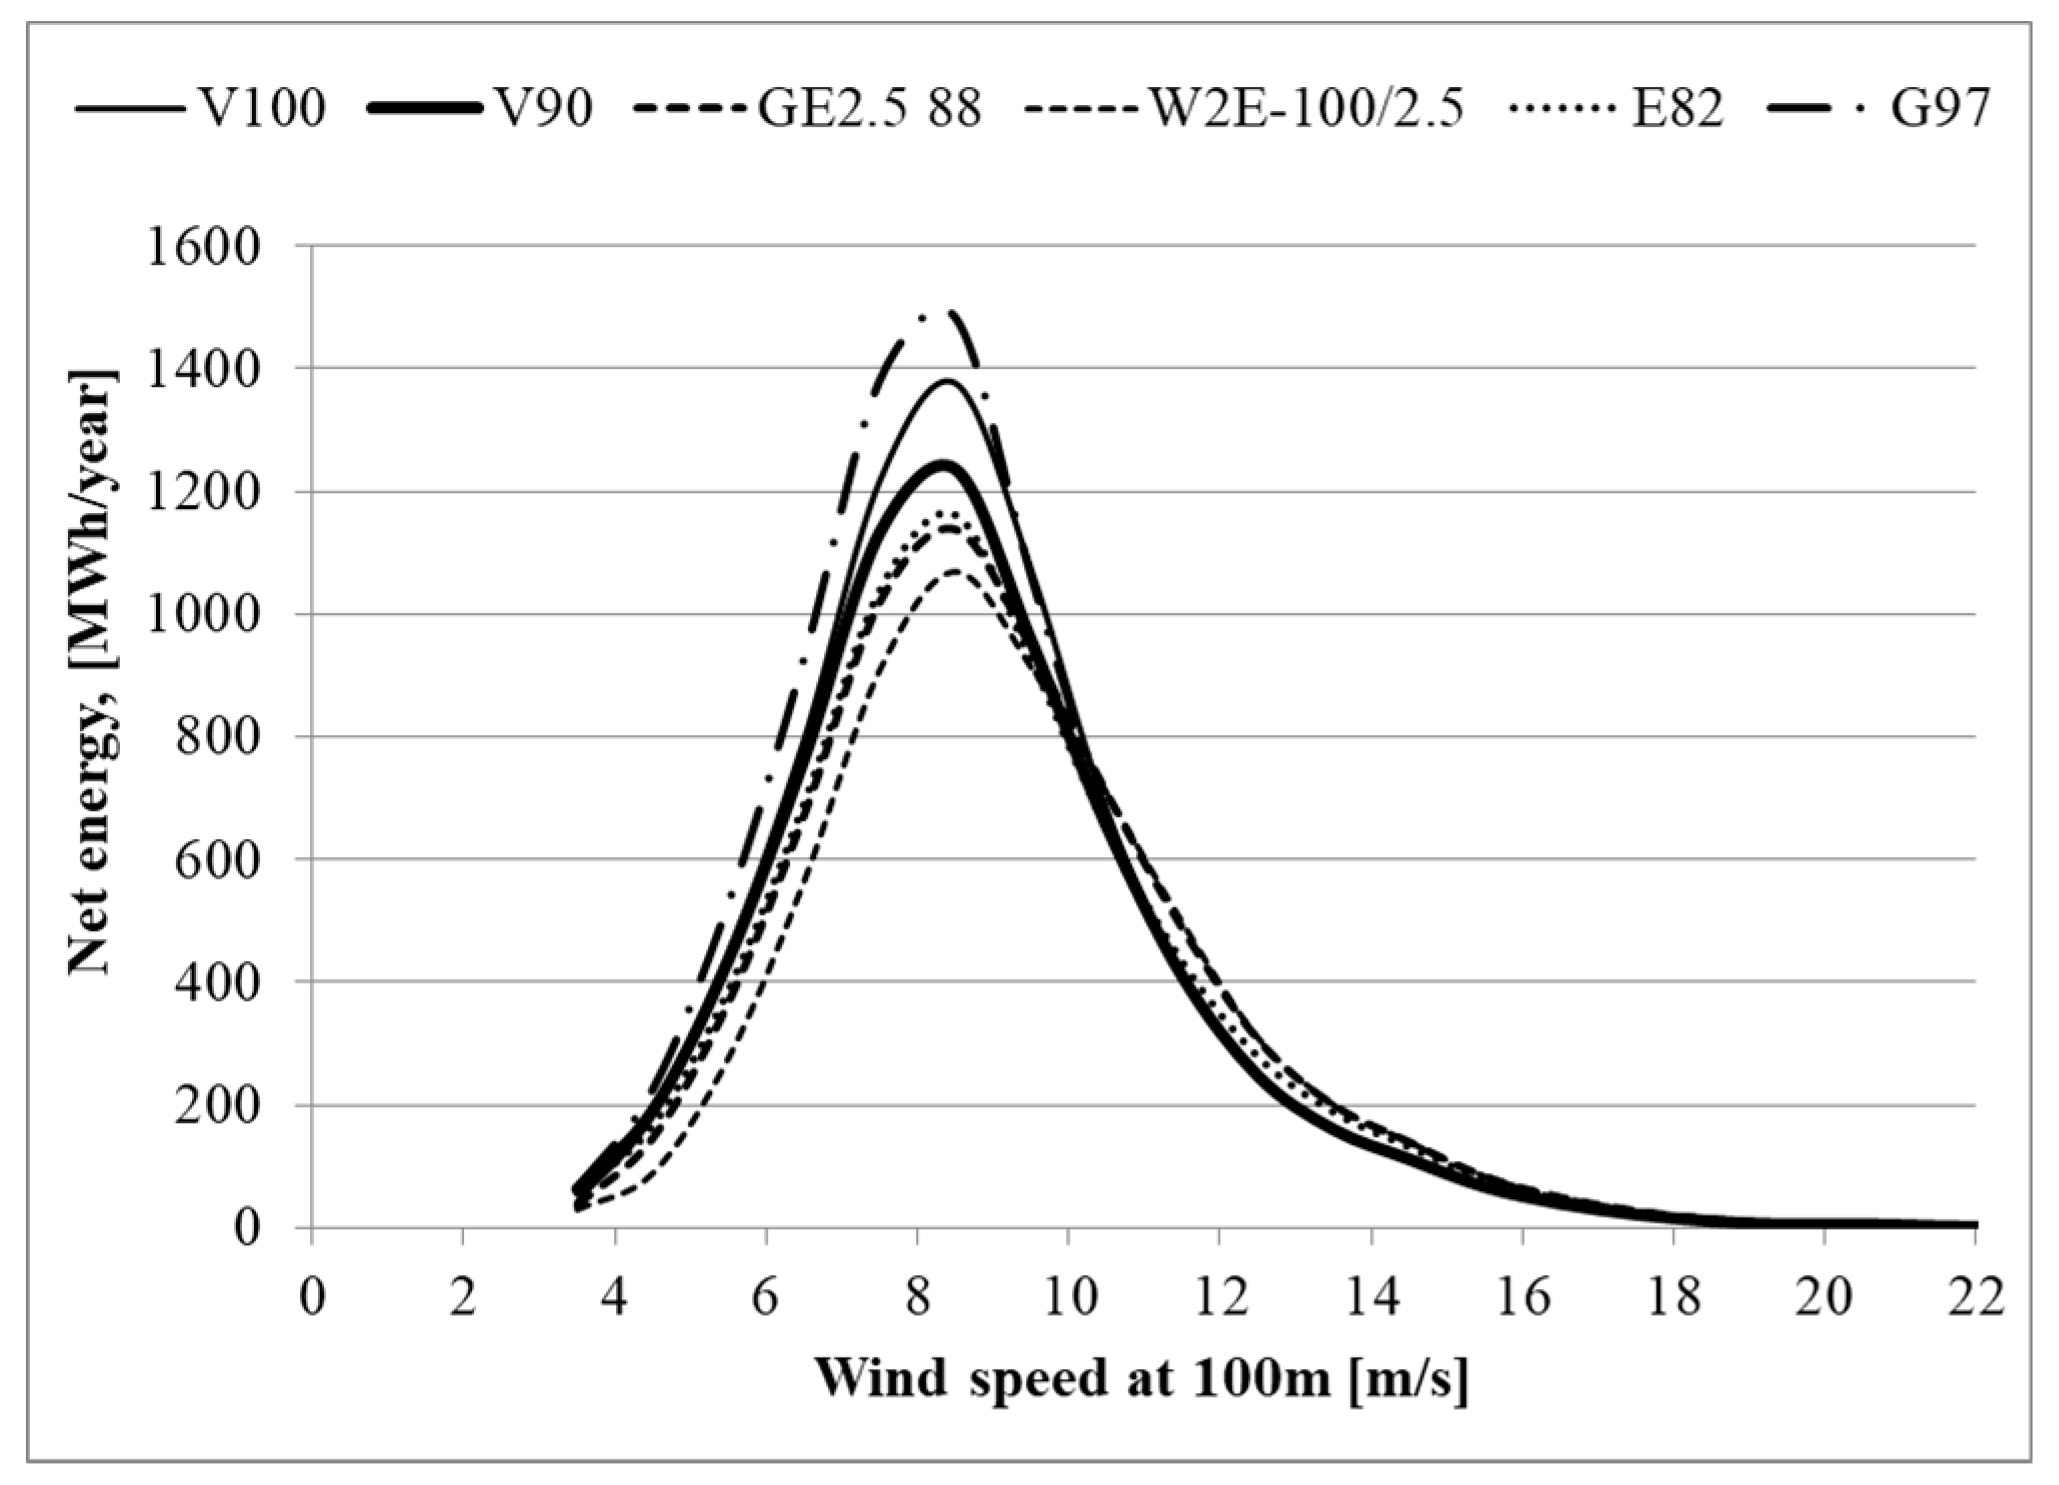
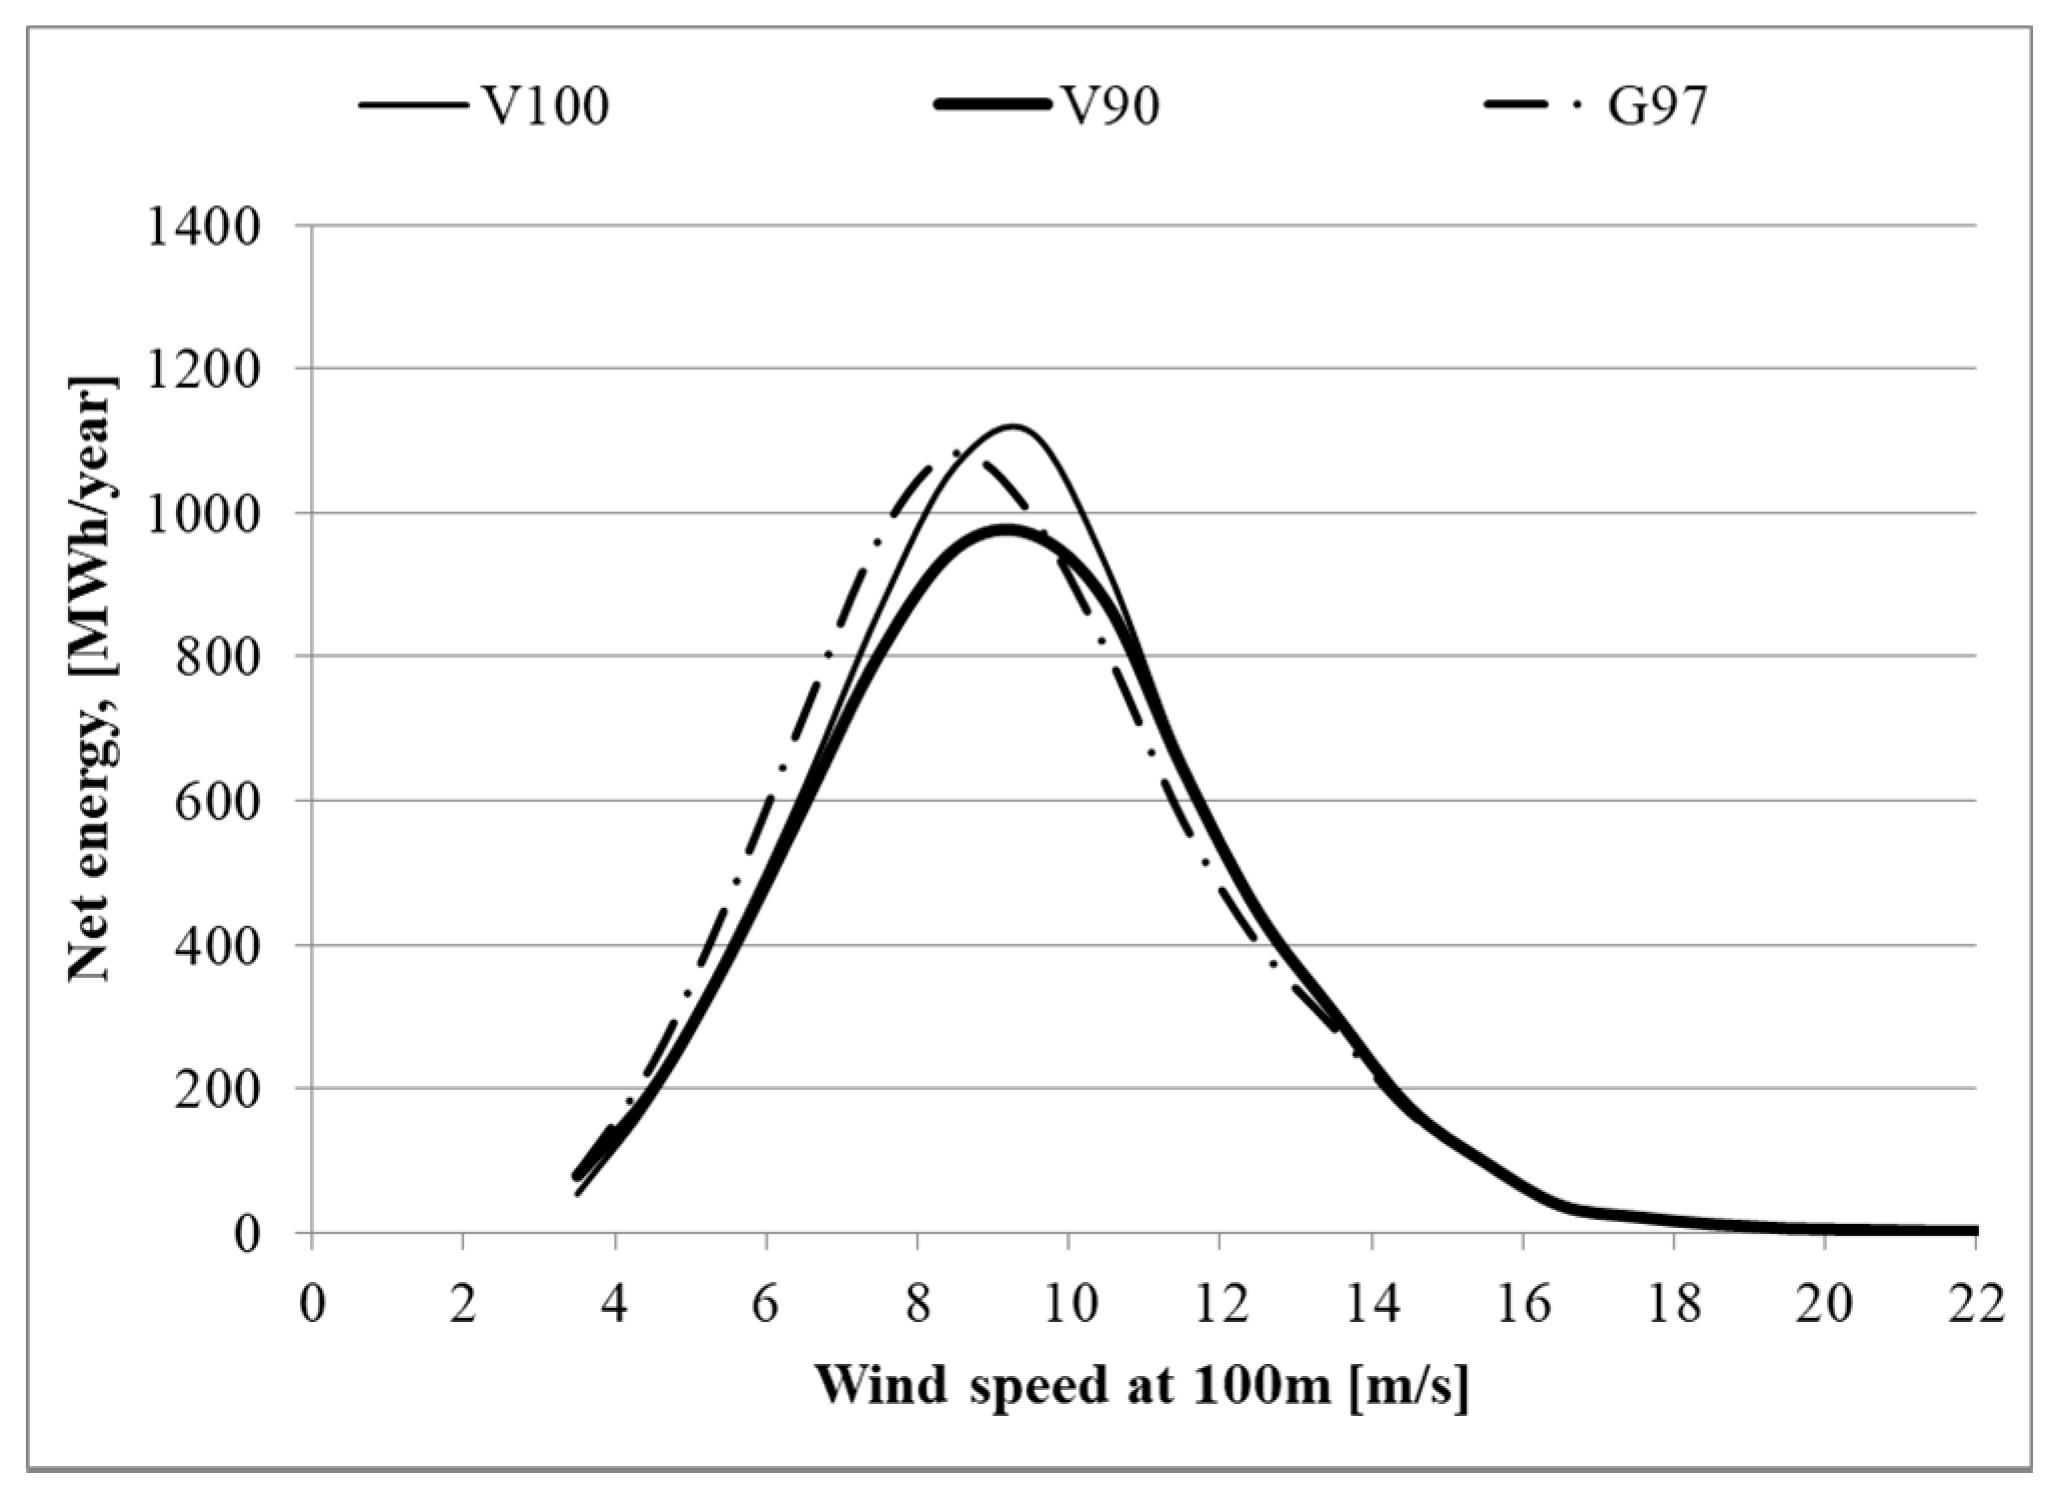
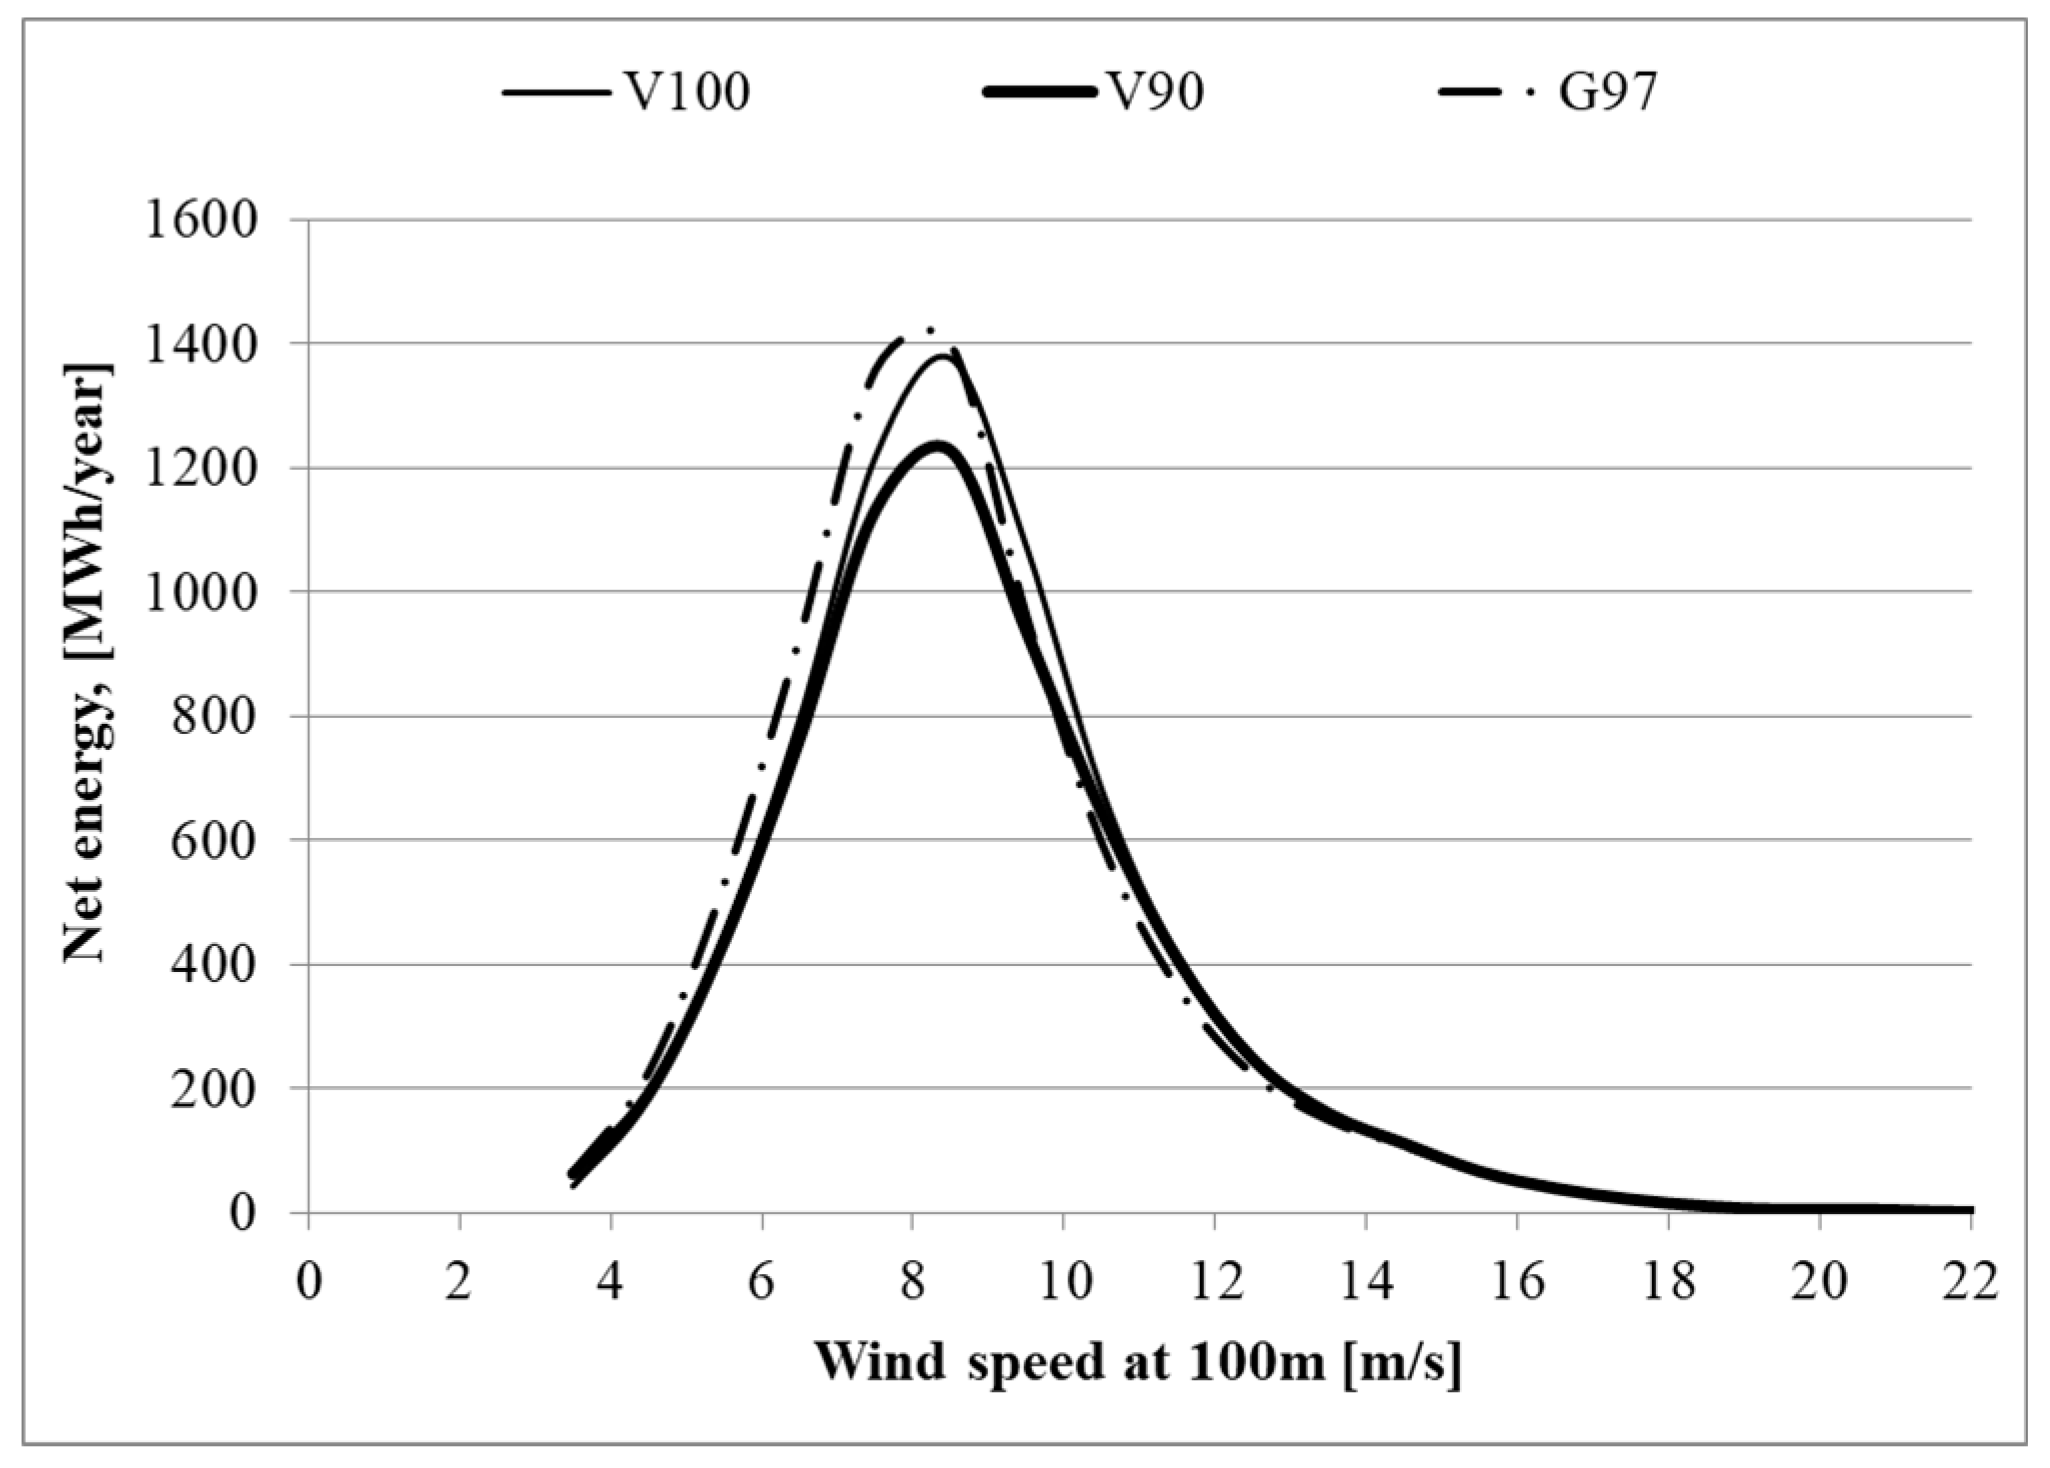
The results for individual turbines presented in Table 2 and Table 3 are shown graphically in Figure 6 and Figure 7. The figures show the productivity of turbines depending on wind speed.
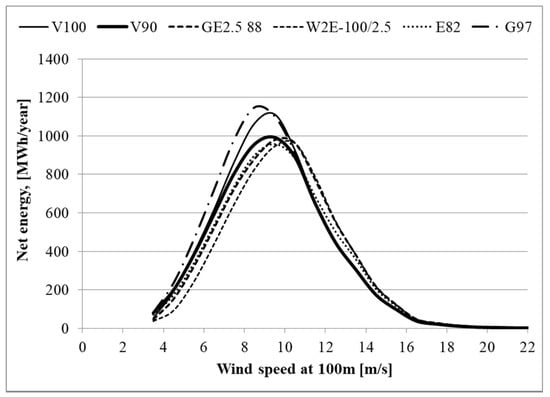
Figure 6.
Level of energy supplied to the power grid by the wind turbines as a function of the wind speed, farm A.
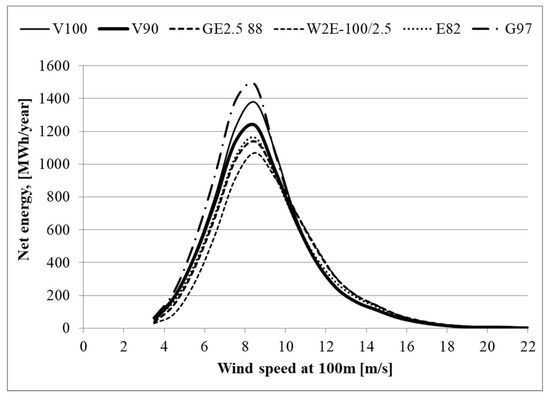
Figure 7.
Level of energy supplied to the power grid by the wind turbines as a function of the wind speed, farm B.
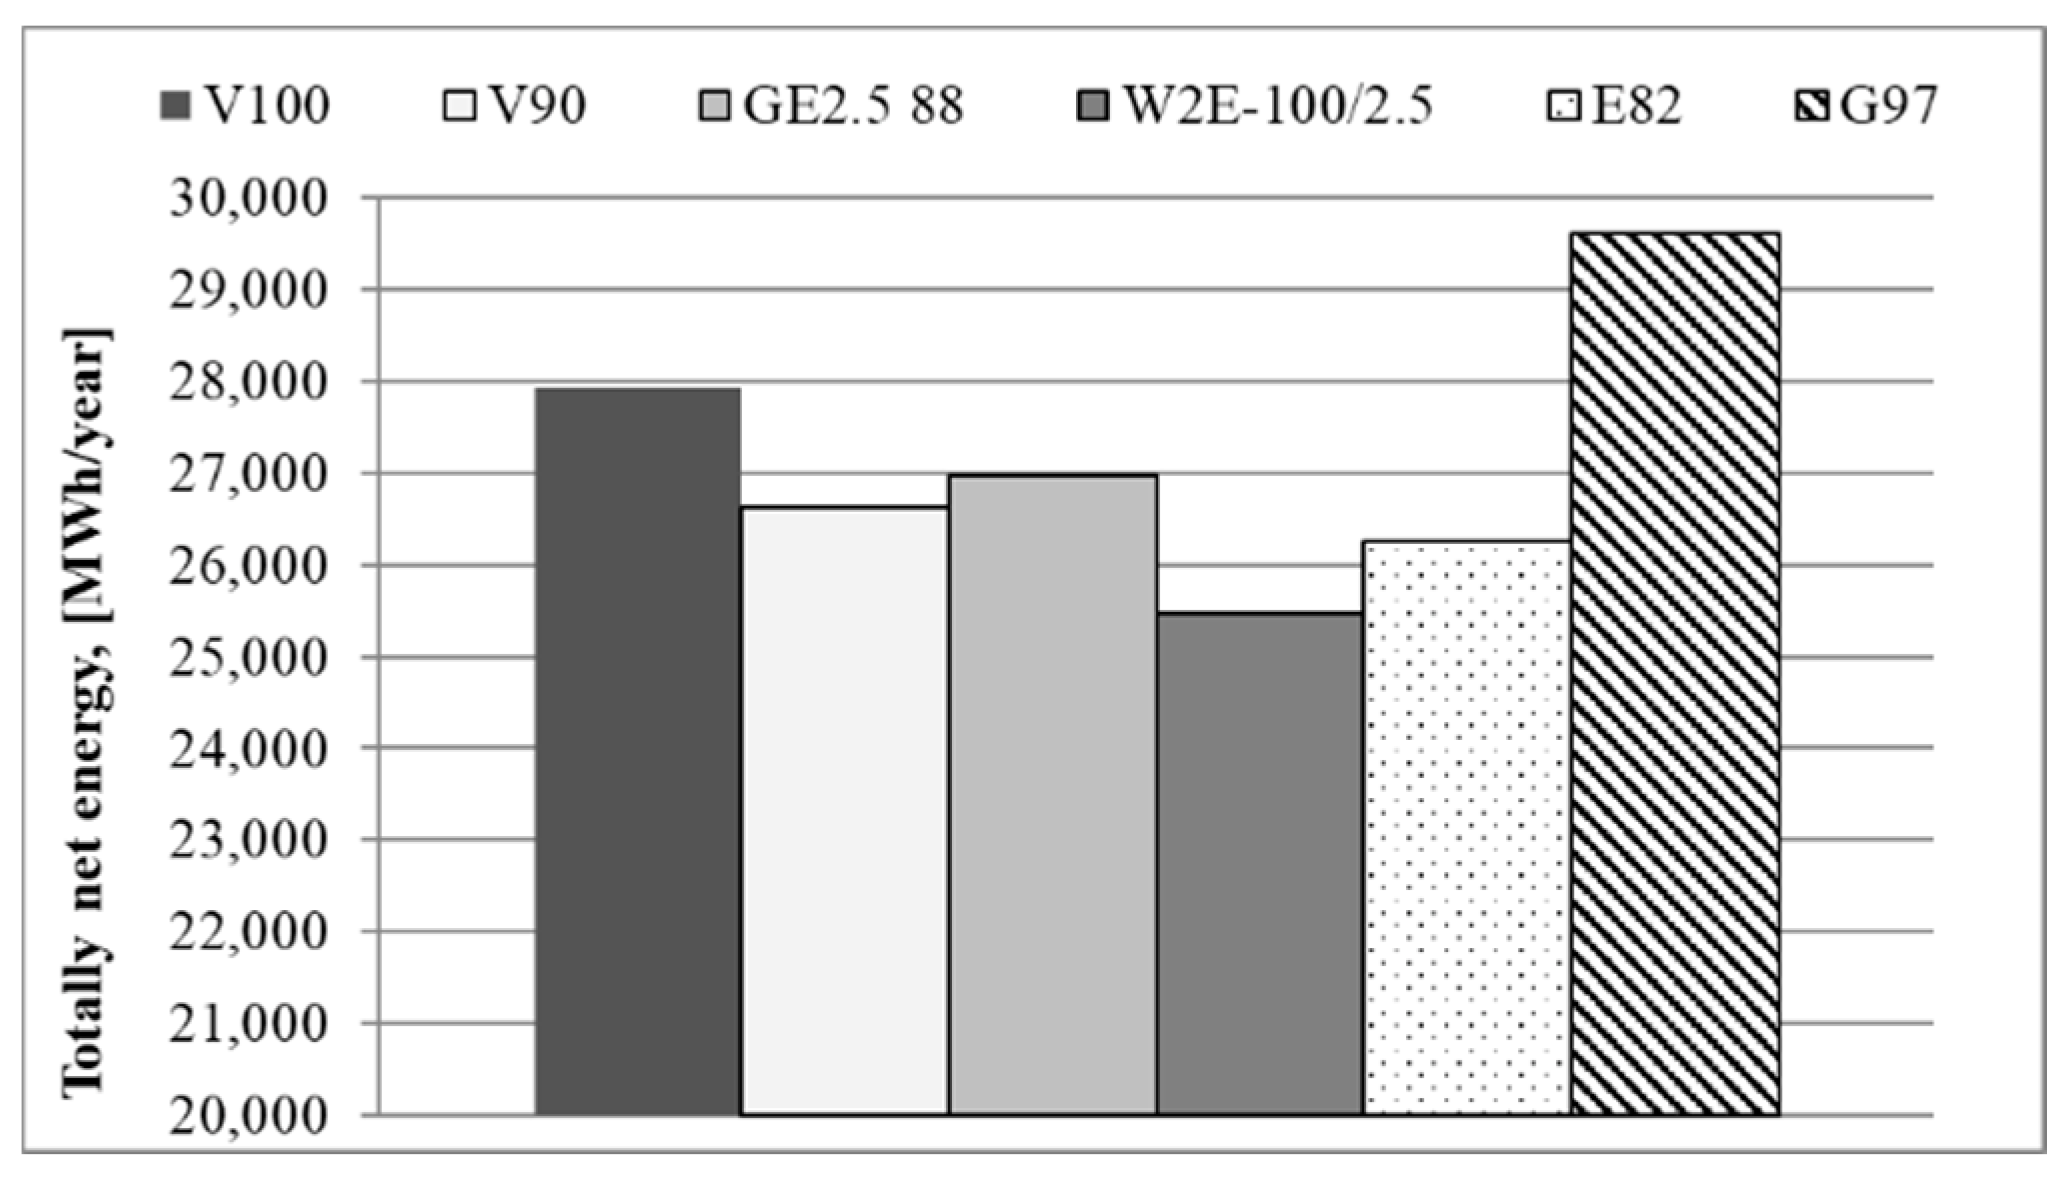
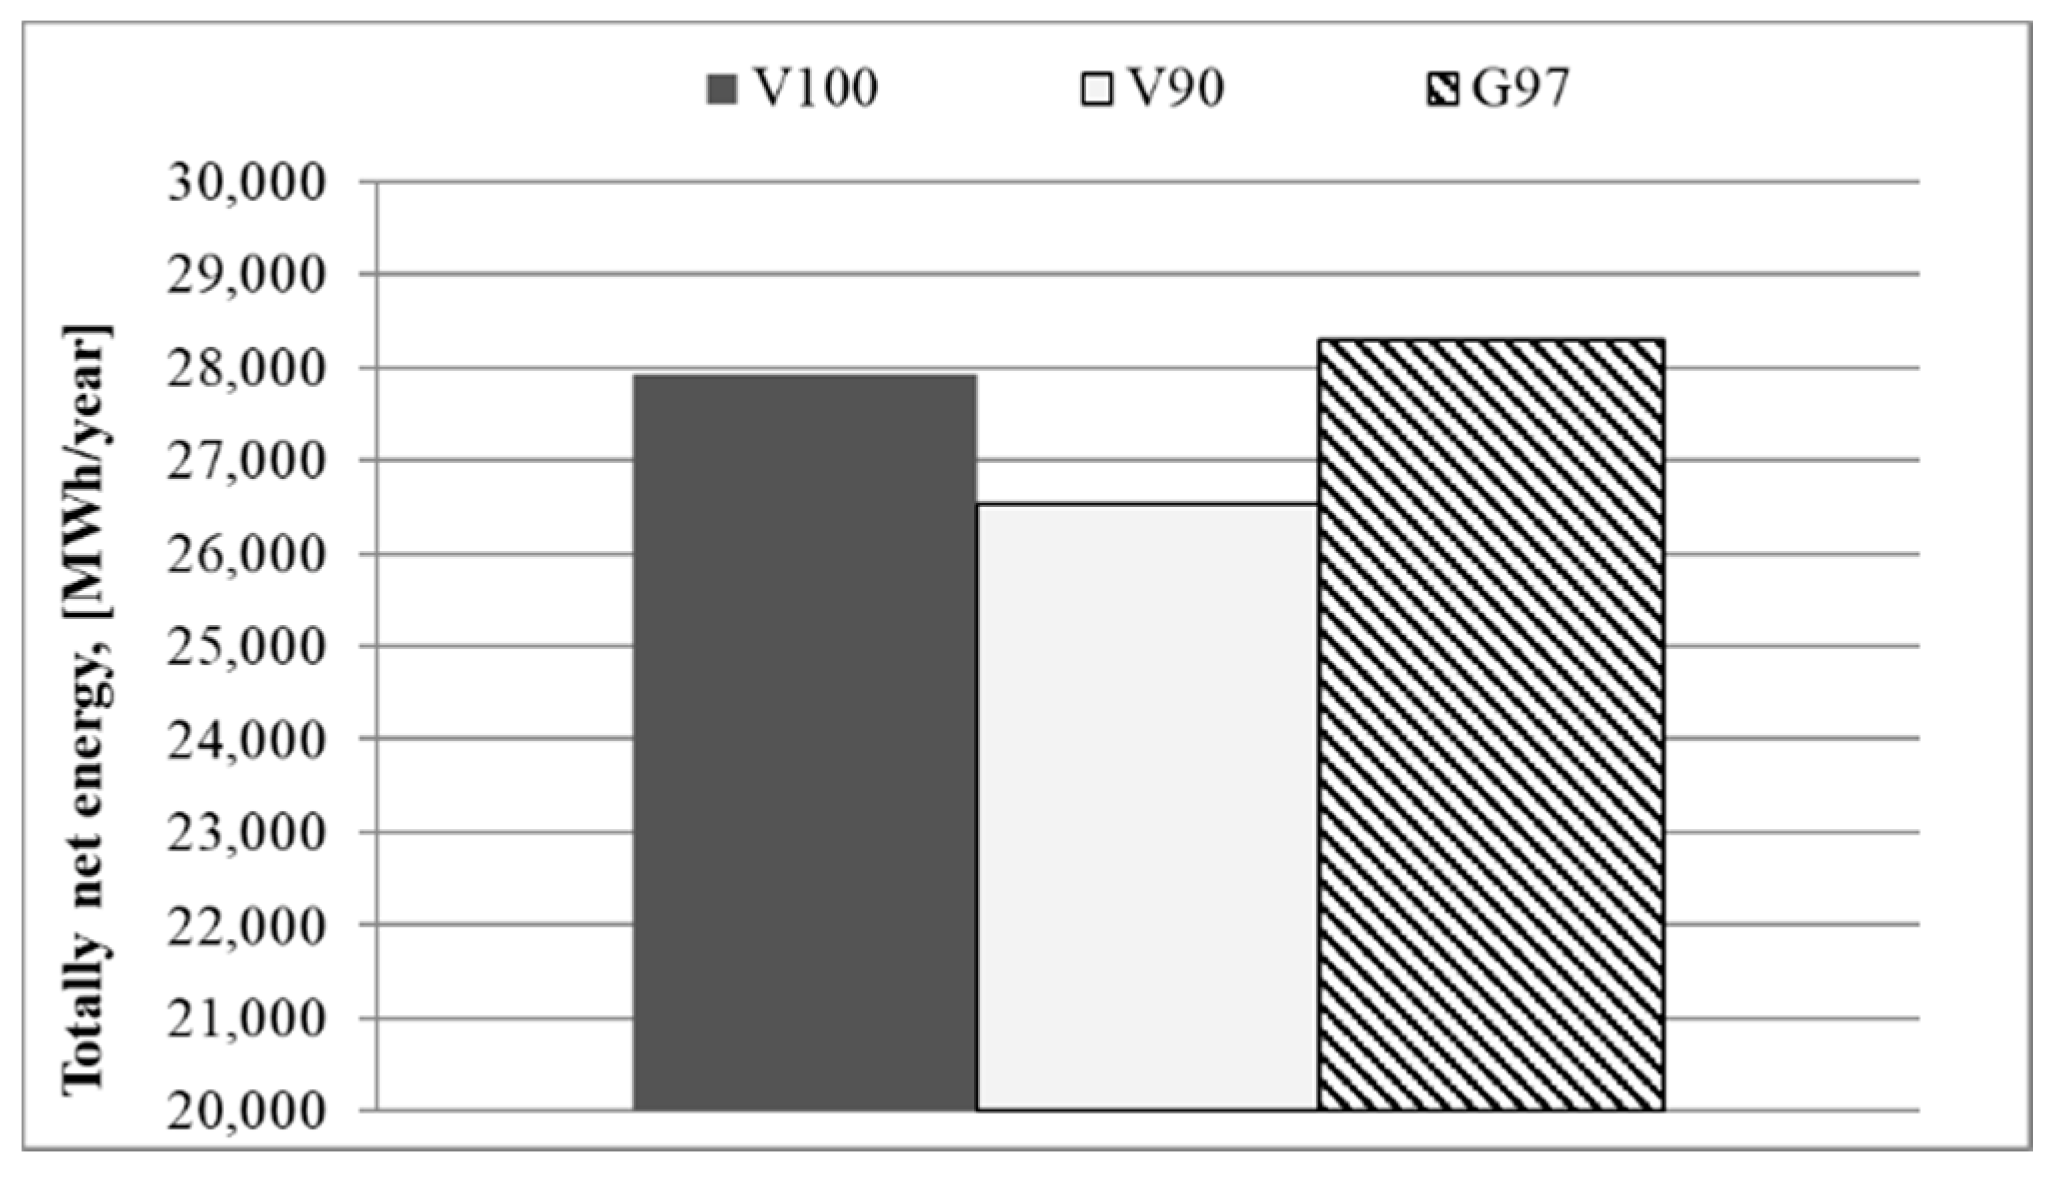
Figure 8 and Figure 9 graphically show the amount of network energy generated per year by the entire WF consisting of a specific type of turbines.

Figure 8.
Level of energy supplied to the power grid by the wind farm A.

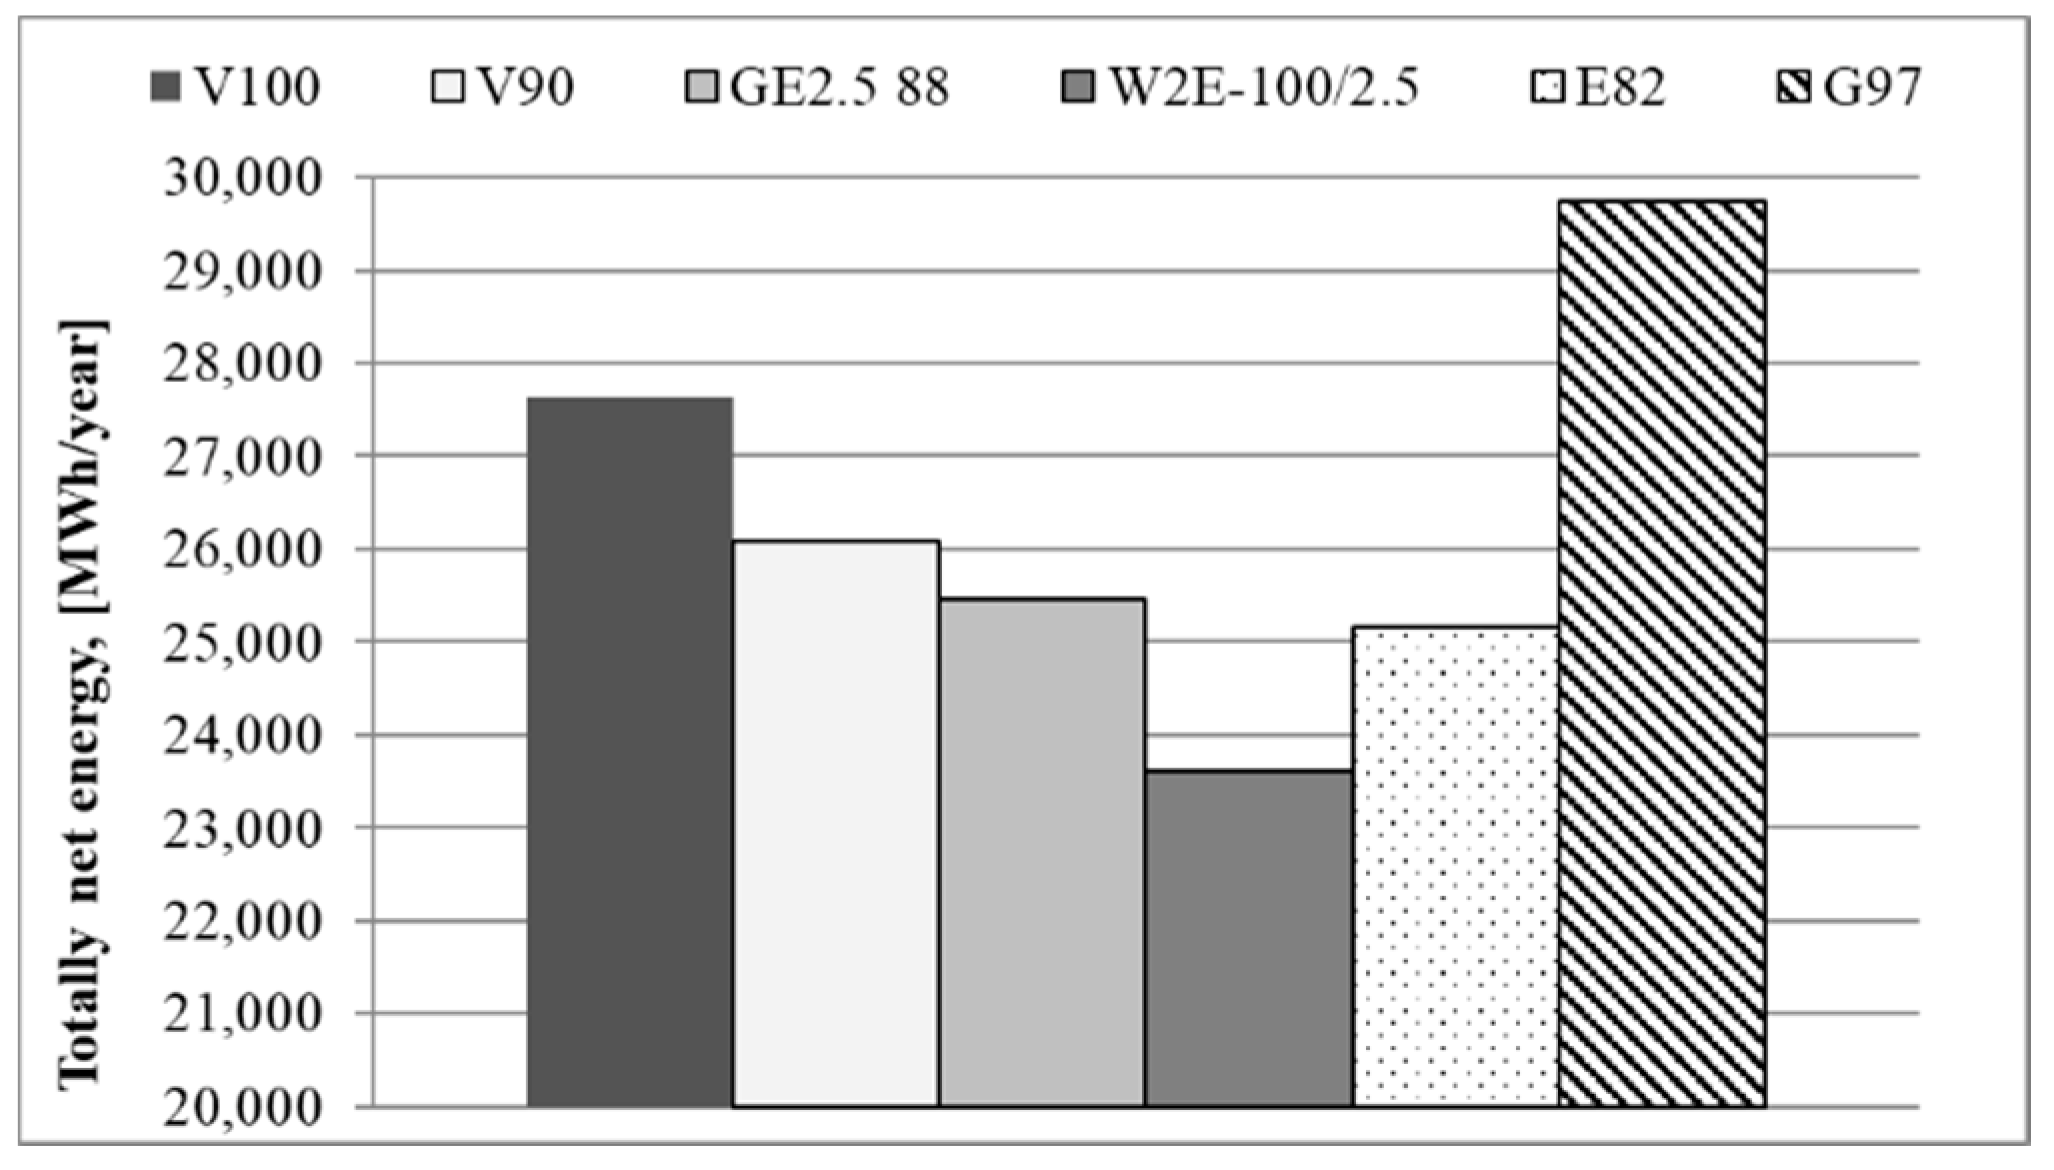
Figure 9.
Level of energy supplied to the power grid by the wind farm B.
3.2. Acoustic Analysis
The most frequently recommended calculation algorithm in various countries around the world for forecasting the noise emission of wind turbines is the one compliant with the ISO 9613-2 standard [27]. This algorithm is not dedicated directly to the simulation of noise from wind turbines; it is a universal algorithm for industrial noise sources. The results’ agreement between the noise simulation performed according to the ISO 9613-2 and the corresponding field measurements was confirmed [21]. The standard contains two calculation methods, general and alternative. The methods differ in the way the sound attenuation by the ground is taken into account. The review and comparison of many calculation algorithms for forecasting WF noise emissions have been included in many publications [21,28,29]. Domestic regulations for the noise assessment methods determine the selection of the algorithm to be used. However, irrespectively from the algorithm used, the methodology of the acoustic analysis of the WF is very similar. The rotor as well as the peripheral equipment inside the nacelle are replaced with a point source with an acoustic power established by means of measurements. Calculation points are located in the vicinity of a residential area. The results of the simulation are given in the form of isolines of the sound level as well as the values in selected points. The above quantities are presented on maps in an appropriate scale.
In the calculations an alternative method of standard [27] was used due to the unambiguous way of selecting the parameter of sound wave attenuation by the ground. Using the alternative method, the source is described by two parameters, the height above the ground level and the acoustic power. The sound power level of wind turbines depends on the wind speed. Wind turbines are characterized by an increase in acoustic power up to the wind speed of circa 10 m/s at the top of the rotor axis. After exceeding this wind speed, the acoustic power remains unchanged [30,31]. The maximum acoustic power for each type of wind turbine was assumed for calculations. Selected wind turbines were grouped into three groups of similar acoustic power (Table 4).
Table 4.
Acoustic parameters of investigated types of turbines.
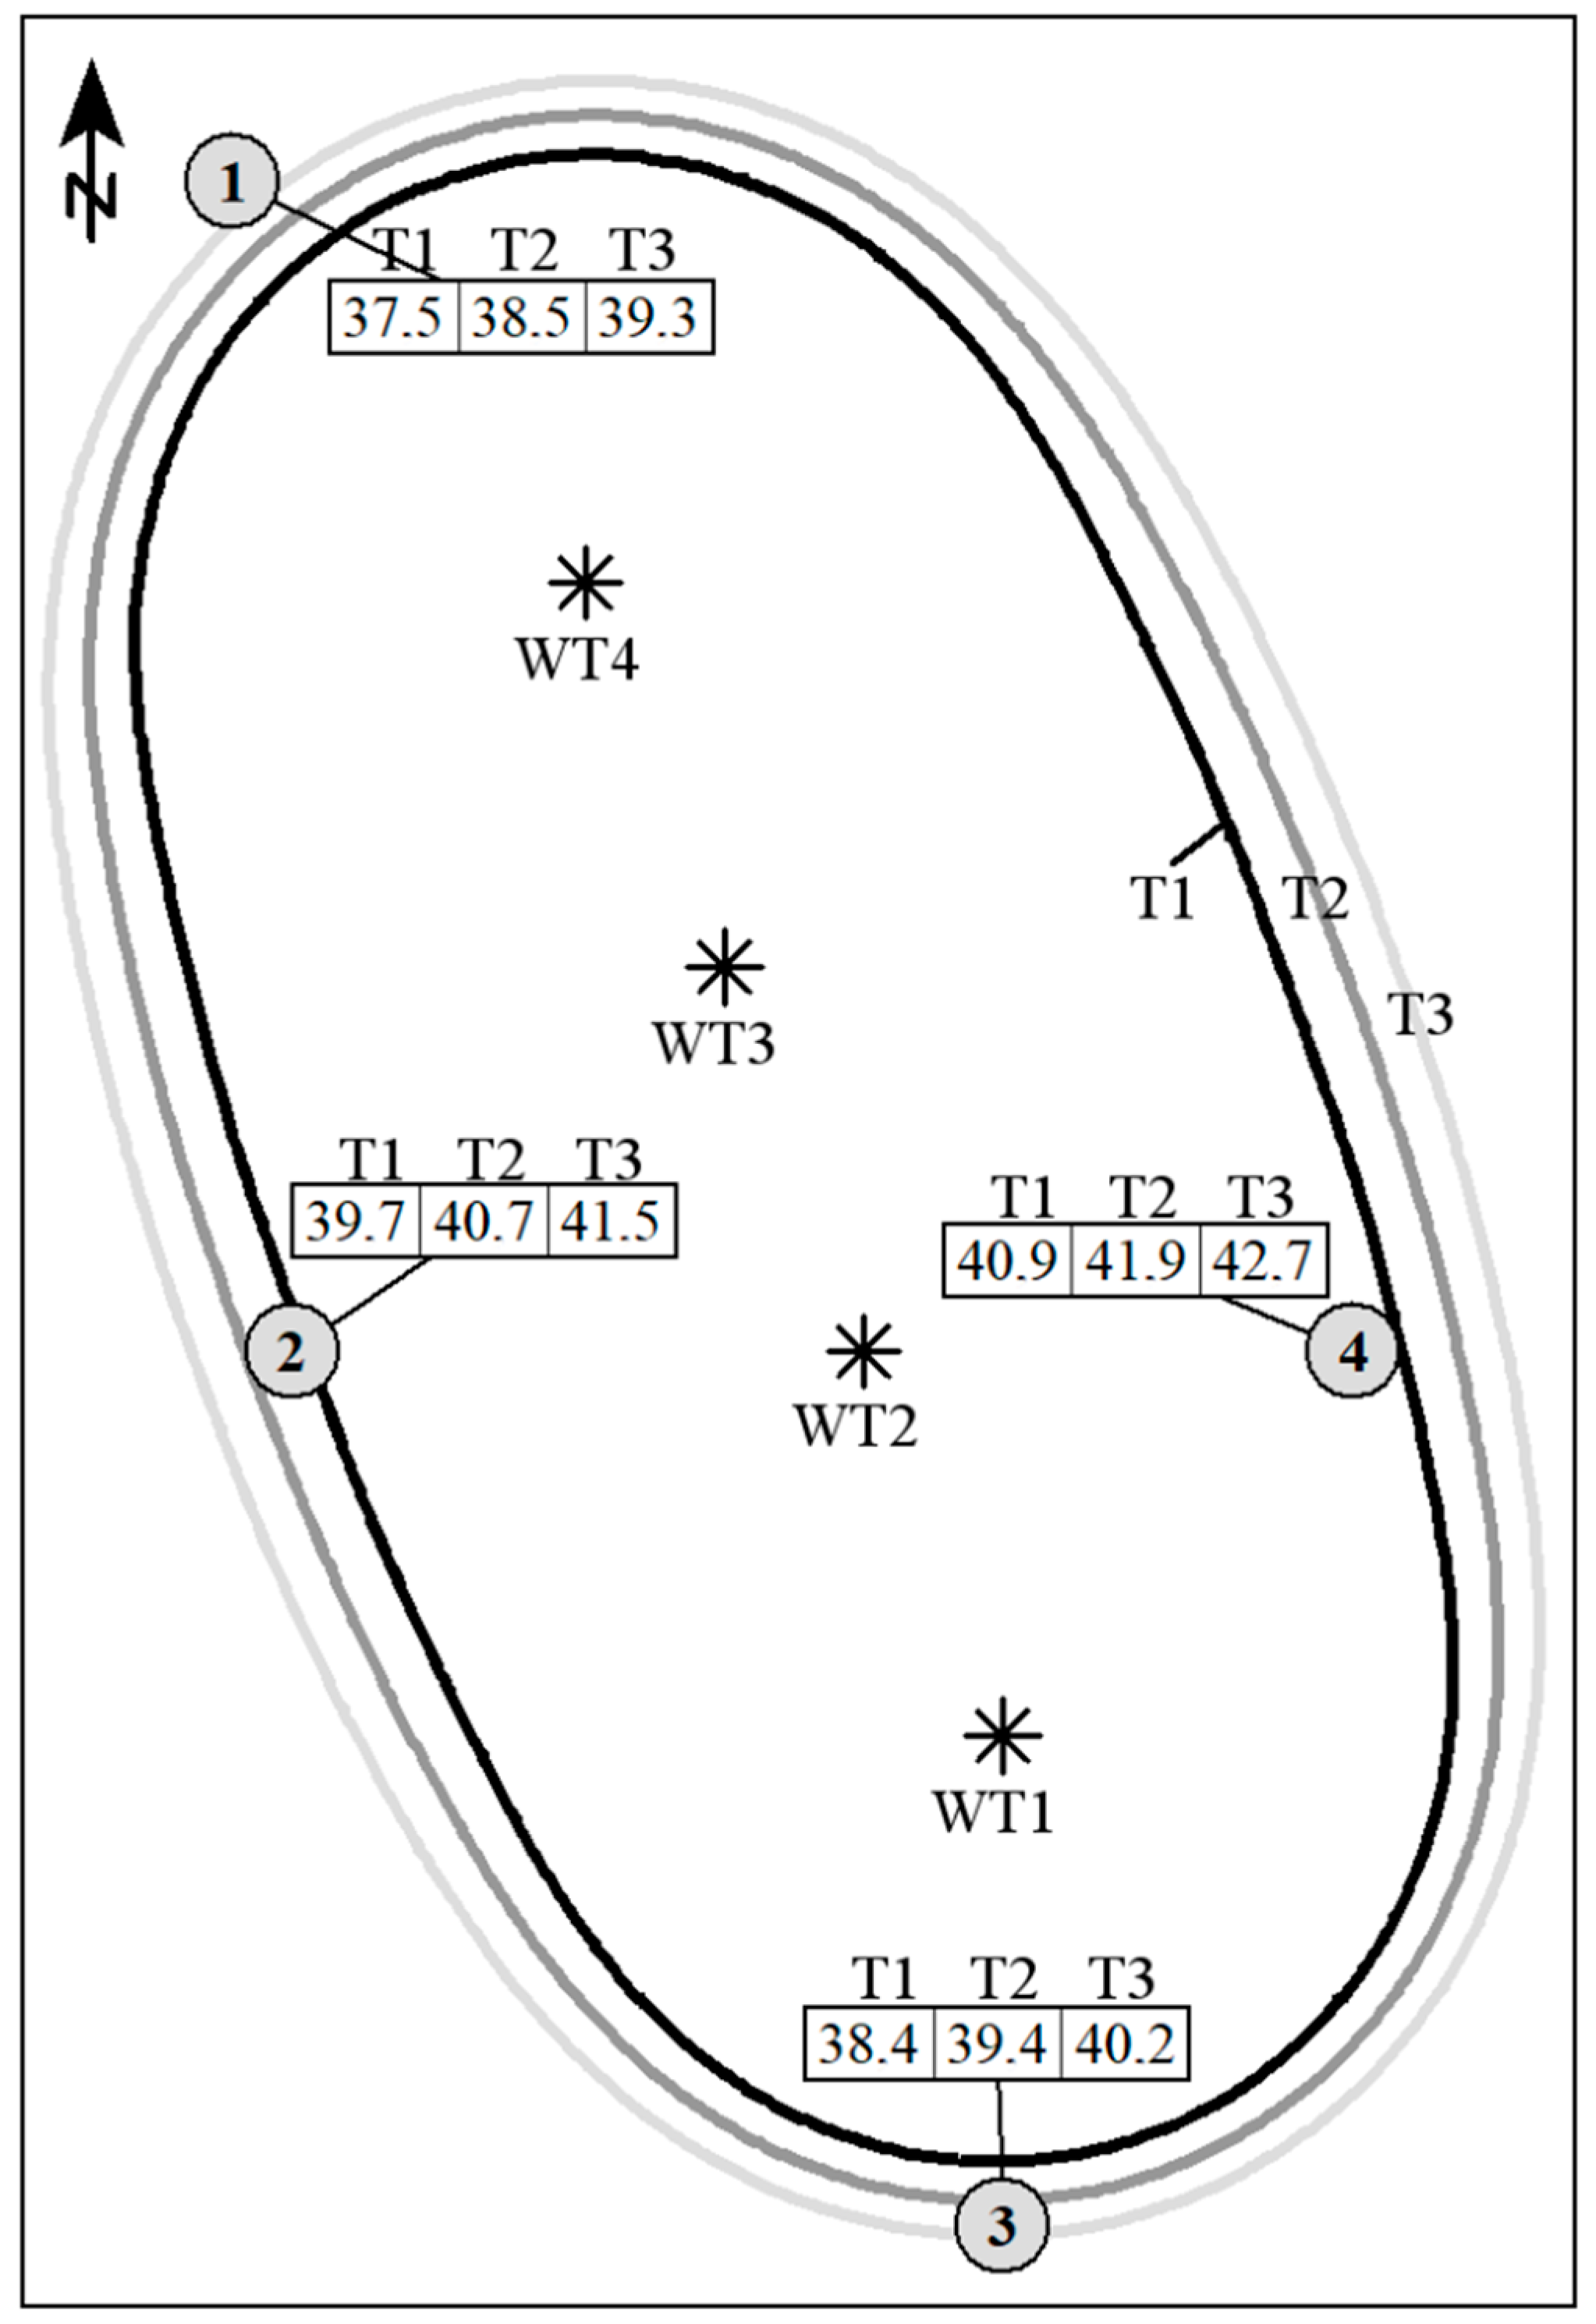
The result of the simulation is a map with the results of calculations at control points. The isolines indicate the range of noise emission of 40 dB for each group of turbines, T1 to T3. Due to the assumptions of the same system of turbines and control points in both locations, one map is presented (Figure 10). The obtained results at the points slightly exceeded the value of 40 dB for maximum acoustic power of devices. Therefore, the analysis for the daytime, in which the assumed acceptable level is 50 dB, was omitted. During the day there will be no exceeding of the permissible noise level in the acoustically protected areas.
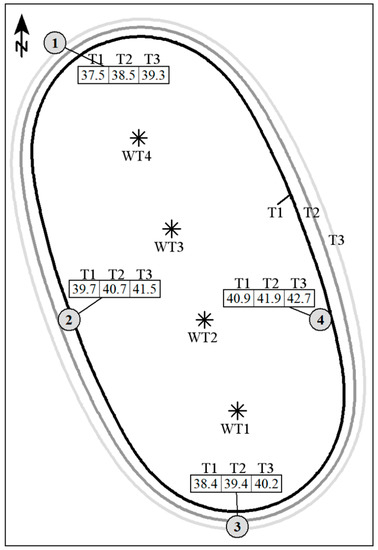
Figure 10.
Noise emission range map.
The obtained results indicated that the acceptable noise level (40 dB) was exceeded in points 2, 3, and 4 at night. All tested turbines achieving the maximum acoustic power will cause exceeding (40 dB) in point 4. The tested wind turbines have the possibility to reduce the maximum acoustic power. In general, this results in a reduction in energy productivity. Of the turbines studied, only V100 has the ability to reduce sound power by using STE (Serrated Trailing Edge) on the rotor blades without losing nominal productivity. Taking into account the results of the energy and acoustic analysis, three devices were selected for the final calculation. The choice of equipment was significantly influenced by the factory’s ability to control the acoustic power of each type of wind turbine.
The necessary technical data of the analyzed wind turbines were obtained from the manufacturers’ technical specifications [32,33,34,35,36,37].
4. Final Results and Discussion
After the analyses carried out in Section 3.1 and Section 3.2, information on productivity and the environmental impact of selected wind turbines was obtained. For further analyses, the three most energy efficient turbines were selected for both locations. Then, the order of analyses was reversed. The simulation of noise emission was carried out and, after reaching the target of not exceeding the permissible level (40 dB), the energy analysis was carried out. The acoustic target was achieved by taking the data presented in Table 5 and by shifting the WT2 turbine 50 m westward in relation to the initial setting (Figure 1).
Table 5.
Acoustic parameters of investigated types of turbines.
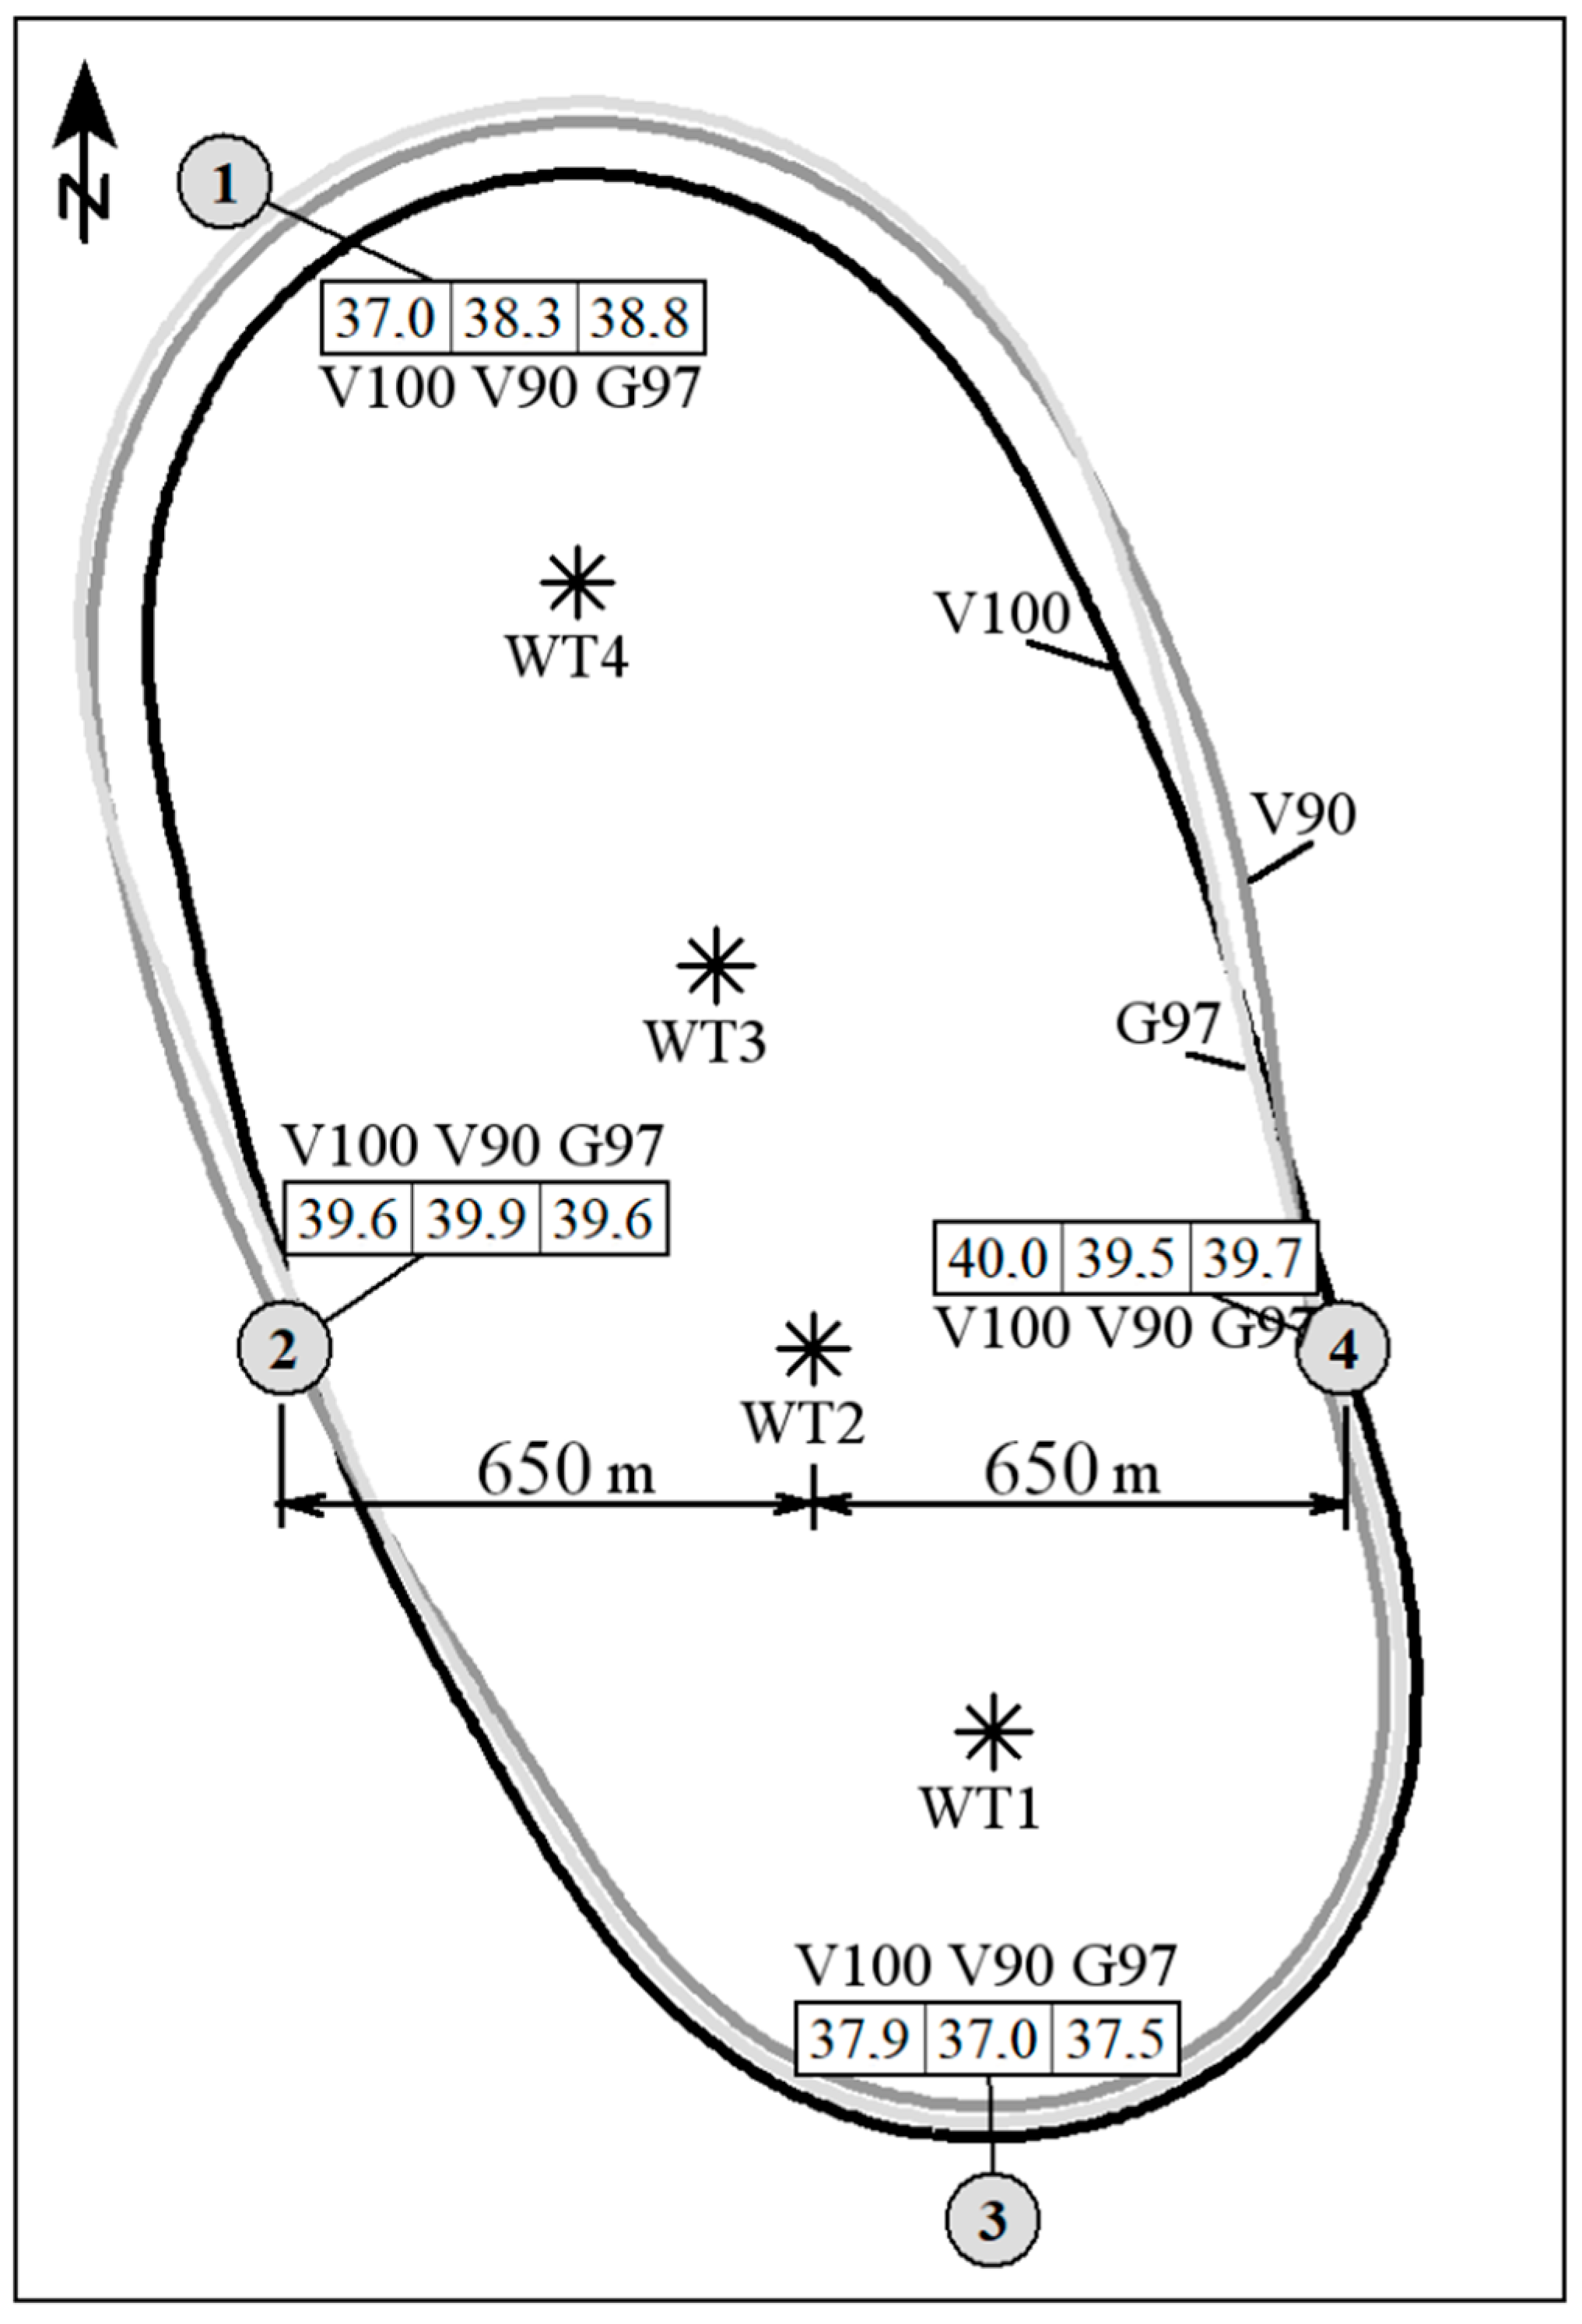
The final results of the simulation of noise emissions are shown on the map (Figure 11). To achieve the acoustic target, the acoustic power of several wind turbines had to be reduced, according to Table 5. For the V90 (WT1, WT2) and G97 (WT1, WT2, WT3) turbines, this meant a decrease in their productivity. The use of STE caps on the rotor blades of the V100 turbine did not reduce its productivity in relation to the rotor without caps.
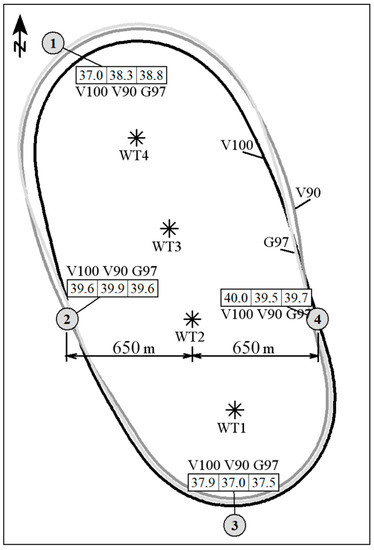
Figure 11.
The final noise emission range map.
The final energy analysis was then carried out. Figure 12 and Figure 13 show the productivity of individual turbines depending on wind speed after the applied reductions of acoustic power of the V90 and G97 turbines.
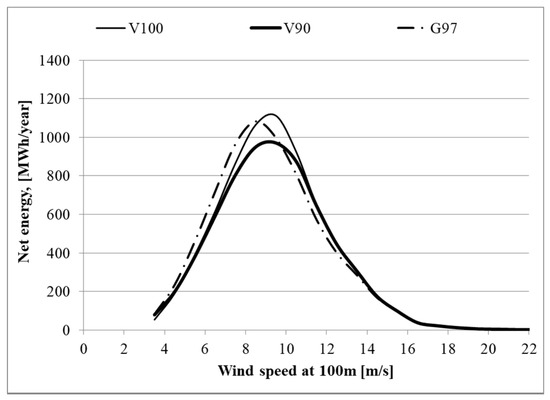
Figure 12.
The final level of energy supplied to the power grid by the wind turbines as a function of the wind speed, farm A.
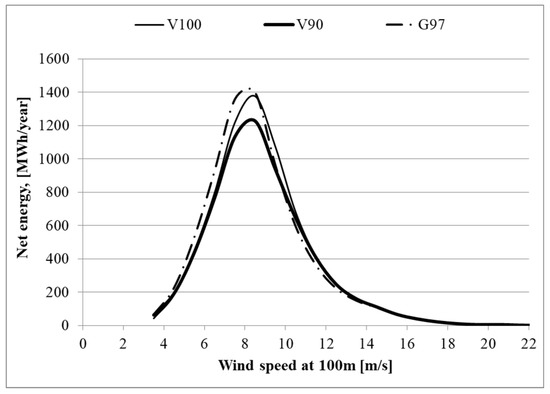
Figure 13.
The final level of energy supplied to the power grid by the wind turbines as a function of the wind speed, farm B.
Figure 14 and Figure 15 graphically show the amount of network energy generated per year by the entire WF consisting of a specific type of turbine after the reduction of the sound power. The energy productivity of the V90 (WT1, WT2) and G97 (WT1, WT2, WT3) turbines was reduced.

Figure 14.
The final level of energy supplied to the power grid by the wind farm A.

Figure 15.
The final level of energy supplied to the power grid by the wind farm B.
Analyzing Figure 14 and Figure 15, it can be concluded that in both studied WF locations the highest productivity of the whole farm was guaranteed by the G97 turbines. However, in the case of farm A location, the productivity of the G97 turbines was not significantly higher than that of the V100 turbines and amounted to about 350 MWh per year. Taking into account the average land-based energy production cost of WF [2], which was $60/MWh in 2017, the difference between the productivity of WF G97 and WF V100 is $21,000 per year. Therefore, the decisive criterion for selecting a wind turbine may be, for example, the cost of equipment purchasing, transport costs, terms of guarantee, or servicing the equipment.
The comparison of the energy analyses for the first (Section 3.1) and second (Section 4) design, showed the influence of the acoustic power reduction methods on the productivity efficiency of the selected turbines. Despite the fact that for both locations the highest productivity had WF consisting of G97 turbines, at the same time the G97 suffered from the highest loss of an annual energy generation. Figure 8 and Figure 14 as well as Figure 9 and Figure 15 show that for the four G97 turbines the energy loss was more than 10.000 MWh/year. For the case of the WF consisting of V100 turbines, no energy loss was noticed. For the case of WF consisting of V90 turbines, the energy loss was negligible in the context of the present research.
5. Conclusions
The method proposed in the paper for conducting energy and acoustic analyses together provides the investor with a lot of information about the analyzed equipment. It allows selecting or changing the type of equipment at any subsequent stage of wind farm design. The WF design process usually takes several years. At the end of the process, it may turn out that a certain turbine type is not available for sale. With the analysis proposed in this paper, the originally selected device can be changed quickly. The correct wind turbine selection process for a given site should be as follows:
- no available device is excluded during preliminary energy analyses;
- a noise impact analysis is performed for all selected devices;
- after noise analysis, WF productivity is re-evaluated; and
- a ranking list of analyzed devices is prepared as a result.
This paper presents the method of wind turbine selection on the basis of registered annual wind measurements, taking into account the environmental conditions of the investment. Wind measurements showed the usefulness of the tested locations in terms of their use for the construction of a wind farm. Six types of wind turbines of different power capacities were examined. It was indicated which turbines ensure the best use of wind resources in the studied locations. It turned out that the least efficient turbines in the studied locations would be those with a nominal capacity of 2.3–2.5 MW. Due to the hourly distribution of individual wind speeds, 2 MW turbines turned out to be the most energy efficient. The lowest productivity of the W2E100/2.55 turbine was a surprise, as it had the largest rotor and the highest nominal output. The application of the G97 turbine for both locations will result in the highest electric power generation.
A properly conducted measurement campaign minimizes uncertainty and provides high-quality information about wind conditions. Equally important is the accurate identification of environmental constraints. The influence of WT in the environment will be estimated for each design layout of the wind farm. The above will be supported by precise descriptions of the devices used. Taking into account both above criteria, it is possible to choose wind turbines that will bring the best economic and ecological effect when combined in a wind park. Based on simple designs of WFs, it was shown that an extensive analysis involving many devices (turbines) allows for more efficient investment decision making. The study showed a significant impact of environmental noise limits on the actual amount of energy generated by WF. Limiting the acoustic power of a wind turbine in most cases entails a reduction of the WF productivity. The obtained results imply that the amount of power generated to the grid may be significantly lower than originally assumed if the acoustic limitations are taken into account.
Author Contributions
Conceptualization, A.Z. and M.W.; methodology, A.Z.; software, A.Z.; validation, A.Z. and K.W.; formal analysis, A.Z. and M.W.; resources, K.W.; data curation, K.W.; writing—original draft preparation, A.Z.; writing—review and editing, M.W.; visualization, K.W.; supervision, A.Z.; project administration, M.W. All authors have read and agreed to the published version of the manuscript.
Funding
This research received no external funding.
Institutional Review Board Statement
Not applicable.
Informed Consent Statement
Not applicable.
Data Availability Statement
Data available on the request.
Conflicts of Interest
The authors declare no conflict of interest.
Nomenclature
| Af | area of air flow, m2 |
| A | Weibull scale parameter, m/s |
| wind energy for the i-th speed range, Wh | |
| total wind energy, Wh | |
| LAeq | A-weighted equivalent sound level, dB |
| LA90 | A-weighted 90th percentile of broadband sound levels, dB |
| wind power, W | |
| unit of wind power obtained in the i-th speed range, W/m2 | |
| P0 | the reference value of 2 × 10⁻⁵, Pa |
| P | the RMS value of the sound pressure, Pa |
| TY | 1 year expressed in hours, 8760 h |
| T | time interval, s |
| fi | frequency of wind speed falling within the i-th range, |
| k | Weibull shape factor, |
| ρ | air density, m3/kg |
| v | wind speed, m/s |
| vav | average wind speed range, m/s |
| vi | i-th wind speed range, m/s |
References
- WWW.dtu.dk. Available online: https://windenergy.dtu.dk/english/research/publicationslist?dtulistcode=ISTLIST46&fr=1&mr=100&ptype=all&qt=DtuPublicationQuery (accessed on 27 October 2021).
- U.S. EIA. International Energy Outlook 2019 with Projections to 2050; Office of Energy Analysis U.S. Department of Energy: Washington, DC, USA, 2019. [Google Scholar]
- ECA. Wind and Solar Power for Electricity Generation: Significant Action Needed If EU Targets to be Met; Special Report No 08/2019; Publications Office of the European Union: Luxembourg, 2019. [Google Scholar]
- Enevoldsen, P.; Permien, F.H.; Bakhtaoui, I.; von Krauland, A.K.; Jacobson, M.; Xydis, G.; Sovacool, B.; Valentine, S.; Luecht, D.; Oxley, G. How much wind power potential does europe have? Examining european wind power potential with an enhanced socio-technical atlas. Energy Policy 2019, 132, 1092–1100. [Google Scholar] [CrossRef]
- Letcher, T.M. Wind Energy Engineering: A Handbook for Onshore and Offshore Wind Turbines, 1st ed.; Academic Press: Cambridge, MA, USA; Elsevier: Amsterdam, The Netherlands, 2017. [Google Scholar]
- Ehrlich, R.; Geller, H.A. Renewable Energy: A First Course, 2nd ed.; CRC Press: Boca Raton, FL, USA, 2018. [Google Scholar]
- Zagubień, A.; Wolniewicz, K. The impact of supporting tower on wind turbine noise emission. Appl. Acoust. 2019, 5, 260–270. [Google Scholar] [CrossRef]
- Celik, A. Energy output estimation for small scale wind power generators using Weibull representative wind data. J. Wind Eng. Ind. Aerodyn. 2003, 91, 693–707. [Google Scholar] [CrossRef]
- Wais, P. Two and three-parameter Weibull distribution in available wind power analysis. Renew. Energy 2017, 103, 15–29. [Google Scholar] [CrossRef]
- Hansen, J.; Mahak, M.; Tzanakis, I. Numerical modelling and optimization of Vertical Axis Wind Turbine pairs: A scale up approach. Renew. Energy 2021, 171. [Google Scholar] [CrossRef]
- IEC 61400-12-1:2005: Wind Turbines: Part 21-1: Power Performance of Electricity Producing Wind Turbines; IEC: Geneva, Switzerland, 2005.
- Jakubowski, M.; Mech, Ł.; Wolniewicz, K. A methodology of wind turbines selection for the given wind conditions. J. Mech. Energy Eng. 2017, 1, 171–178. [Google Scholar]
- Wolniewicz, K.; Kuczyński, W.; Zagubień, A. Method for wind turbine selection basing on in-field measurements. J. Mech. Energy Eng. 2019, 3, 77–84. [Google Scholar] [CrossRef] [Green Version]
- Burton, T.; Sharoe, D.; Jenkins, N.; Bossanyi, E. Wind Energy Handbook; John Wiley & Sons Ltd.: Hoboken, NJ, USA, 2001. [Google Scholar] [CrossRef]
- Kurpas, D.; Mroczek, B.; Karakiewicz, B.; Kassolik, K.; Andrzejewski, W. Health impact of wind farms. Ann. Agric. Environ. Med. 2013, 20, 595–605. [Google Scholar] [PubMed]
- Liu, W.Y. A review on wind turbine noise mechanism and de-noising techniques. Renew. Energy 2017, 108, 311–320. [Google Scholar] [CrossRef]
- Regional WHO. Office for Europe: Burden of Disease from Environmental Noise. Quantification of Healthy Life Years Lost in Europe; World Health Organization: Copenhagen, Denmark, 2011. [Google Scholar]
- Lee, J.T.; Kim, H.G.; Kang, Y.H.; Kim, J.Y. Determining the optimized hub height of wind turbine using the wind resource map of South Korea. Energies 2019, 12, 2949. [Google Scholar] [CrossRef] [Green Version]
- Van den Berg, G.P. Wind turbine power and sound in relation to atmospheric stability. Wind Energy 2008, 11, 151–169. [Google Scholar] [CrossRef]
- Wharton, S.; Lundquist, J.K. Assessing atmospheric stability and its impacts on rotor-disk wind characteristics at an onshore wind farm. Wind Energy 2012, 15, 525–546. [Google Scholar] [CrossRef]
- Zagubień, A.; Ingielewicz, R. The analysis of similarity of calculation results and local measurements of wind farm noise. Measurement 2017, 106, 211–220. [Google Scholar] [CrossRef]
- Manwell, J.F.; McGowan, J.G.; Rogers, A.L. Wind Energy Explained: Theory, Design and Application; Wiley: Hoboken, NJ, USA, 2009. [Google Scholar]
- Yang, K.; Kwak, G.; Cho, K.; Huh, J. Wind farm layout optimization for wake effect uniformity. Energy 2019, 183, 983–995. [Google Scholar] [CrossRef]
- Wu, X.; Hu, W.; Huang, Q.; Chen, C.; Chen, Z.; Blaabjerg, F. Optimized Placement of Onshore Wind Farms Considering Topography. Energies 2019, 12, 2944. [Google Scholar] [CrossRef] [Green Version]
- Rajper, S.; Amin, I. Optimization of wind turbine micrositing: A comparative study. Renew. Sustain. Energy Rev. 2012, 16, 5485–5492. [Google Scholar] [CrossRef]
- Wais, P. A review of Weibull functions in wind sector. Renew. Sustain. Energy Rev. 2017, 70, 1099–1107. [Google Scholar] [CrossRef]
- ISO 9613-2:1996. Acoustics—Attenuation of Sound during Propagation Outdoors Part 2: General Method of Calculation; International Organization for Standardization: Geneva, Switzerland, 1996. [Google Scholar]
- Evans, T.; Cooper, J. Comparison of predicted and measured wind farm noise levels and implications for assessments of new Wind Farm. Acoust. Aust. 2012, 40, 28–36. [Google Scholar]
- Prospathopoulos, J.M.; Voutsinas, S.G. Application of a ray theory model to the prediction of noise emissions from isolated wind turbines and wind parks. Wind Energy 2007, 10, 103–119. [Google Scholar] [CrossRef]
- Van den Berg, G.P. Effects of the wind profile at night on W/T sound. J. Sound Vib. 2004, 277, 955–970. [Google Scholar] [CrossRef]
- Tonin, R. Sources of wind turbine noise and sound propagation. Acoust. Aust. 2012, 40, 20–27. [Google Scholar]
- Vestas. Document no. 0062-4192 V01; VESTAS: Copenhagen, Denmark, 2018. [Google Scholar]
- Vestas. Document no. 0062-4191 V04; VESTAS: Copenhagen, Denmark, 2017. [Google Scholar]
- GE. Commercial Documentation Wind Turbine Generator Systems GE 2.5—100 m Rotor 50 Hz & 60 Hz; GE: Fairfield, Connecticut, USA, 2010. [Google Scholar]
- W2E. General Description W2E-100/2.5; W2E: Rostock, German, 2008. [Google Scholar]
- Enercon. Document no. SIAS-04-SPL E-82 E2 OM I 2,3MW; Enercon: Berlin, German, 2010. [Google Scholar]
- Gamesa. Document no. GD086484; Gamesa: Zamudio, Spain, 2010. [Google Scholar]


Publisher’s Note: MDPI stays neutral with regard to jurisdictional claims in published maps and institutional affiliations. |
© 2021 by the authors. Licensee MDPI, Basel, Switzerland. This article is an open access article distributed under the terms and conditions of the Creative Commons Attribution (CC BY) license (https://creativecommons.org/licenses/by/4.0/).