Article

Optimization of Integrated Gasification Combined-Cycle Power Plant for Polygeneration of Power and Chemicals

Institute for Energy Systems and Technology, Mechanical Engineering Department, Technical University of Darmstadt, 64287 Darmstadt, Germany
*
Author to whom correspondence should be addressed.
Energies 2021, 14(21), 7285; https://doi.org/10.3390/en14217285
Submission received: 27 September 2021 / Revised: 22 October 2021 / Accepted: 1 November 2021 / Published: 3 November 2021

Abstract

:
Efficient and flexible operation is essential for competitiveness in the energy market. However, the CO2 emissions of conventional power plants have become an increasingly significant environmental dilemma. In this study, the optimization of a steam power process of an IGCC was carried out, which improved the overall performance of the plant. CCPP with a subcritical HRSG was modelled using EBSILON Professional. The numerical results of the model were validated by measurements for three different load cases (100, 80, and 60%). The results are in agreement with the measured data, with deviations of less than 5% for each case. Based on the model validation, the model was modified for the use of syngas as feed and the integration of heat into an IGCC process. The integration was optimized with respect to the performance of the CCPP by varying the extraction points, adjusting the steam parameters of the extractions and modifying the steam cycle. For the 100% load case, a steam turbine power achieved increase of +34.2%. Finally, the optimized model was subjected to a sensitivity analysis to investigate the effects of varying the extraction mass flows on the output.

1. Introduction

Energy is one of the most influential sectors driving political, economic and social changes in the world [1,2,3,4]. Besides the growing demand for energy, the impact on the global environment and climate is increasing [5]. Electricity generation is the largest primary energy-consuming sector, at 40%, and is responsible for 37.5% of total annual CO2 emissions [6]. The political response to counteract this increase was a United Nations agreement in 1997, the Kyoto Protocol, which was extended in 2015 by the Paris Agreement [7]. To meet the protocol goals, methods for generating electricity in a CO2-neutral process are becoming particularly important. Renewable energies (especially wind and solar energy) are particularly essential for this purpose. However, conventional power plants have to continue to be operated to compensate for the fluctuating power generation of renewable energies [8,9,10]. In this context, this opens up attractive possibilities, especially for power plants with polygeneration.
The concept of polygeneration is now being integrated with an Integrated Gasification Combined Cycle (IGCC). IGCC is characterized by the conversion of solid or liquid feedstocks into a syngas by a gasification process. The syngas can be utilized in a combined cycle power plant (CCPP) for power generation, and/or as a feedstock used in chemical synthesis applications (e.g., ammonia and methanol) [11]. A portion of the syngas produced in the IGCC is converted into clean fuels via the synthesis unit. These can either be sold or stored in the power plant to be used for peak load generation [12,13,14]. This significantly increases the flexibility of the power plant. Other advantages are the low production costs and e reduction of greenhouse gases (GHGs) [15].
The Integrated Gasification Combined Cycle (IGCC) process is based on already well-developed gas and steam power plants that achieve a thermal efficiency of 60% when fired with natural gas [16]. IGCC power plants offer the possibility of separating CO2 from the synthesis gas before combustion in the gas turbine such as Pre-Combustion Carbon Capture Storage (CCS), thus significantly reducing CO2 emissions [17,18]. The solid fuels (e.g., lignite) are gasified by various types of gasifiers (e.g., fluidized bed gasification) to make them appropriate for use in the power plant [19]. Downstream synthesis gas purification enables the separation of CO2 and other pollutants using advanced technologies [20]. Moreover, the power generation efficiency has a similar or even higher efficiency than conventional coal-fired power plants [21]. Gräbner et al. [18] performed a technical and economic evaluation of entrained-flow and fluidized-bed gasification for hard coal and lignite for the IGCC approach. Moreover, they revealed that fluidized bed gasification achieves thermal efficiencies of 51.5% without carbon capture and 41.3% with carbon capture. Contrary to entrained flow gasification, fluidized bed gasification can use a variety of difficult and low-grade fuels instead of, or alongside, coal to increase feasibility [19]. Considerable research has been done to assess the economic aspects of IGCCs [13,22,23], as well as to evaluate several suggested optimization ideas. Shi et al. [12,24] proposed four IGCC approaches based on different chemical processing units and evaluated these approaches according to net efficiency and energy storage ratio. One of their approaches achieved a net efficiency of 60.42%, and produces electricity, hydrogen, and methanol simultaneously. Another approach for enhancing IGCC efficiency was carried out by Giuffrida et al. [25], who compared two air-blown IGCC systems, the first a cold gas cleaning system and the second a hot gas cleaning system. They found that hot gas cleaning achieved a net efficiency of 51.5%, with significant improvements over cold gas cleaning.
In terms of fuel source, the majority of previous studies focused on the high quality of coal [26,27,28,29,30,31] while there are limited studies on low quality coal [28,32,33]. Lee et al. [28] deployed high quality coal in an IGCC power plant, the results showing that the concentration of CO2 was higher than when using low grade coal, while H2 was greater with high quality coal. Nevertheless, the power generated from low grade coal was low compared to high grade coal when they had the same fuel amount. On the other hand, it was claimed by another study that using coal with high carbon leads to high CO2 and H2, resulting in low CO2 emissions. Regarding the efficiency of power plants, using high grade coal resulted in 3.5% higher efficiency than using low grade coal [34]. Li et al. [35] concluded that using lignite coal reduced electricity costs by 24.4%. Mondol et al. [33] illustrated that the integration of gasification with regeneration is more beneficial in terms of efficiency increase and cost reduction compared to the conventional IGCC process. However, this procedure might increase the level of H2S in the pure CO2 product. Majoumerd et al. [34] investigated three types of power plants in their study: a natural gas combined cycle (NGCC), IGCC, and SCPC. They tried to demonstrate the performance of these power plants in terms of efficiency, electrical cost, and CO2 cost. The results confirmed that NGCC was the highest in efficiency while SCPC had the lowest efficiency among other plants.
Bonalumi et al. [36] illustrated that utilizing an air-cooled system instead of a chilling system is productive because it reduced the energy penalty of CO2 capture and increased the efficiency up to 0.7%, while CO2 emission reduction could be achieved by cofiring 60% biomass with coal. In an Australian black coal power plant, the effect of cofiring of biomass was investigated with and without CO2. The results confirmed that when the biomass was at 10%, CO2 emissions could be reduced 9% without any profound impact on the performance of the power plant. The findings that were obtained in the Australian power plants were in agreement with a Puertollano IGCC power plant [37]. Their results showed that adding small percentage of biomass did not have an impact on the performance of the IGCC while there was a linearly reduction of CO2 emissions when the percentage of biomass was increased up 60%. An increase of biomass percentage to 60% provided 50% CO2 emission reduction but the net power produced was reduced to 20% [38]. Other studies focused on an increase in the percentage of biomass up to 70% in IGCC power plants (253 MWel) [39]. It was noted that high LHV fuel blend utilization can provide this capacity with 41.5% electrical efficiency. The capacity of IGCC depends on several parameters such as quality of coal, moisture and ash content, mercury content, the amount of volatile components, and char reactivity [28].
In a coproduction plant, the impact of increasing hydrogen output was considered by Cormos [26,40]. They found that the electric efficiency and emissions were reduced. However, the overall efficiency was increased for the provided hydrogen and electricity. Descamps et al. [17] investigated the effect of changing CO2 capture level. It was noted that there was an increase in the thermal regeneration penalty when the carbon capture level was high, reducing the efficiency and IGCC power plant output. However, this impact was not significant in the case of a post combustion carbon capture plant.
Cau et al. [41] utilized two technologies for power generation: a USC steam plant and a conventional IGCC with precombustion (400 and 500 MWel). They carried out a simulation through Aspen Plus and Gate-cycle. Furthermore, NOX and SOX were reduced through pretreatment. They conducted a technical performance analysis including power generation and consumption for 70 and 90% CO2 capture. Furthermore, the results showed that the performance of USC was better than for IGCC power plants because the efficiency of the USC was 44.8% compared to 43.9% for the IGCC. Nevertheless, the IGCC had lower energy consumption when it was integrated with CO2 removal and compression. The net efficiency of the IGCC with CO2 removal was higher than that of the USC (35.3 versus 34.2%). Therefore, they stated that the IGCC is more affordable than the USC although it is very expensive and less reliable than the former, and can be effectively integrated with precombustion carbon capture to reduce CO2 emissions.
There is limited work in the literature that investigates the enhancement of heat integration between the water-steam cycle and the gas purification process within an IGCC for polygeneration of electricity and chemicals, as shown in Figure 1. Thus, this study contributes to bridging the knowledge gap by investigating various optimizations that could be applied. The steam power process is based on an existing and already validated Aspen plus model of the water-steam cycle of a natural gas-fired CCPP that was developed in our previous works [42,43,44] at the Technical University of Darmstadt. The present work is focused on the optimization of heat integration in an IGCC that uses an HTW gasifier for cogasification of lignite and refuse-derived fuels (RDF) for polygeneration of electricity and methanol. This shows promising improvements that could be implemented for better energy utilization.
The novelty and the objectives of this study are summarized as follows:
  • To build a subcritical HRSG model with three pressure stages integrated with a steam turbine using EBSILON Professional [45,46].
  • To validate the model calculations against measurement data obtained from a real natural gas-fired combined cycle power plant (NGCC).
  • To modify the model for the use of syngas by the gas turbine instead of natural gas.
  • To integrate steam extractions for the heat integration of the syngas generation process into the model.
  • To optimize the suggested modifications regarding to the output of the steam turbine.
  • To perform an energy analysis to achieve the optimal result from the proposed optimizations.
  • To conduct a sensitivity analysis to evaluate the impact of varying the mass flow rate of steam extraction on the output of the IGCC.
The remaining sections of this paper are organized as follows: Section 2 explains the setup of the reference power plant. A description of the software used, and its scope is presented in Section 3. Section 4 provides a description of the process flow model and all the assumptions adopted are summarized and discussed. Finally, validation of the model at different load cases and the proposed optimizations and modifications are presented in Section 5. The main results of this study are highlighted in the Conclusions section.

2. Reference Combined-Cycle Power Plant

The CCPP (Prai Power Station, Malaysia) employs three of General Electric’s (GE) STAG 109FA single-shaft 50 Hz gas turbines coupled with three steam generators built by Doosan Heavy Industries and Construction, which operate on the principle of heat recovery. The HRSG is fed with a flue gas temperature of 628 °C and a flow rate of 587 kg/s from the GT without auxiliary firing. In the vertical steam generator, the flue gas is diverted by ninety degrees after it leaves the GT and passes through horizontal heating surfaces positioned in the flue gas duct in an upward direction. The HRSG is vertically orientated, subcritical, and incorporates triple pressure with a reheater. The high-pressure (HP) system operates up to 100 bar. The evaporator path has forced circulation in high, medium and low-pressure circuits. The reheater combines the steam stream leaving the HP turbine with the intermediate pressure (IP) steam stream.
Figure 2 shows a schematic illustration of the CCPP. The HP circuit raises the feed-water temperature to generate superheated steam, which enters the HP steam turbine. In the IP circuit, the feedwater temperature is raised to produce superheated steam, which is mixed up with the cold reheat steam and then fed to the reheater (RH). In addition, the IP steam circuit delivers steam from the IP economizer for preheating the NG fuel. The low-pressure (LP) steam circuit raises the temperature of the feed-water to produce LP steam, which flows into the LP steam turbine. The HP and RH steam temperature is controlled and limited by using attemperators before feeding them to the HP and IP steam turbine sections, respectively. The LP economizer is operated when the GT fuel has low sulfur content, otherwise the LP economizer is by-passed. The temperature of LP economizer inlet is controlled using the recirculation circuit to about 50 °C independently of plant load. In this case, the LP economizer metal temperature does not drop below the sulfuric acid dew point, preventing corrosion. The LP main steam control valve in this configuration is closed completely so that the equilibrium pressure in the LP drum is below the minimum permissible pressure. The HRSG flue gas and water/steam side characteristics are listed in Table 1.

3. Process Simulation Software
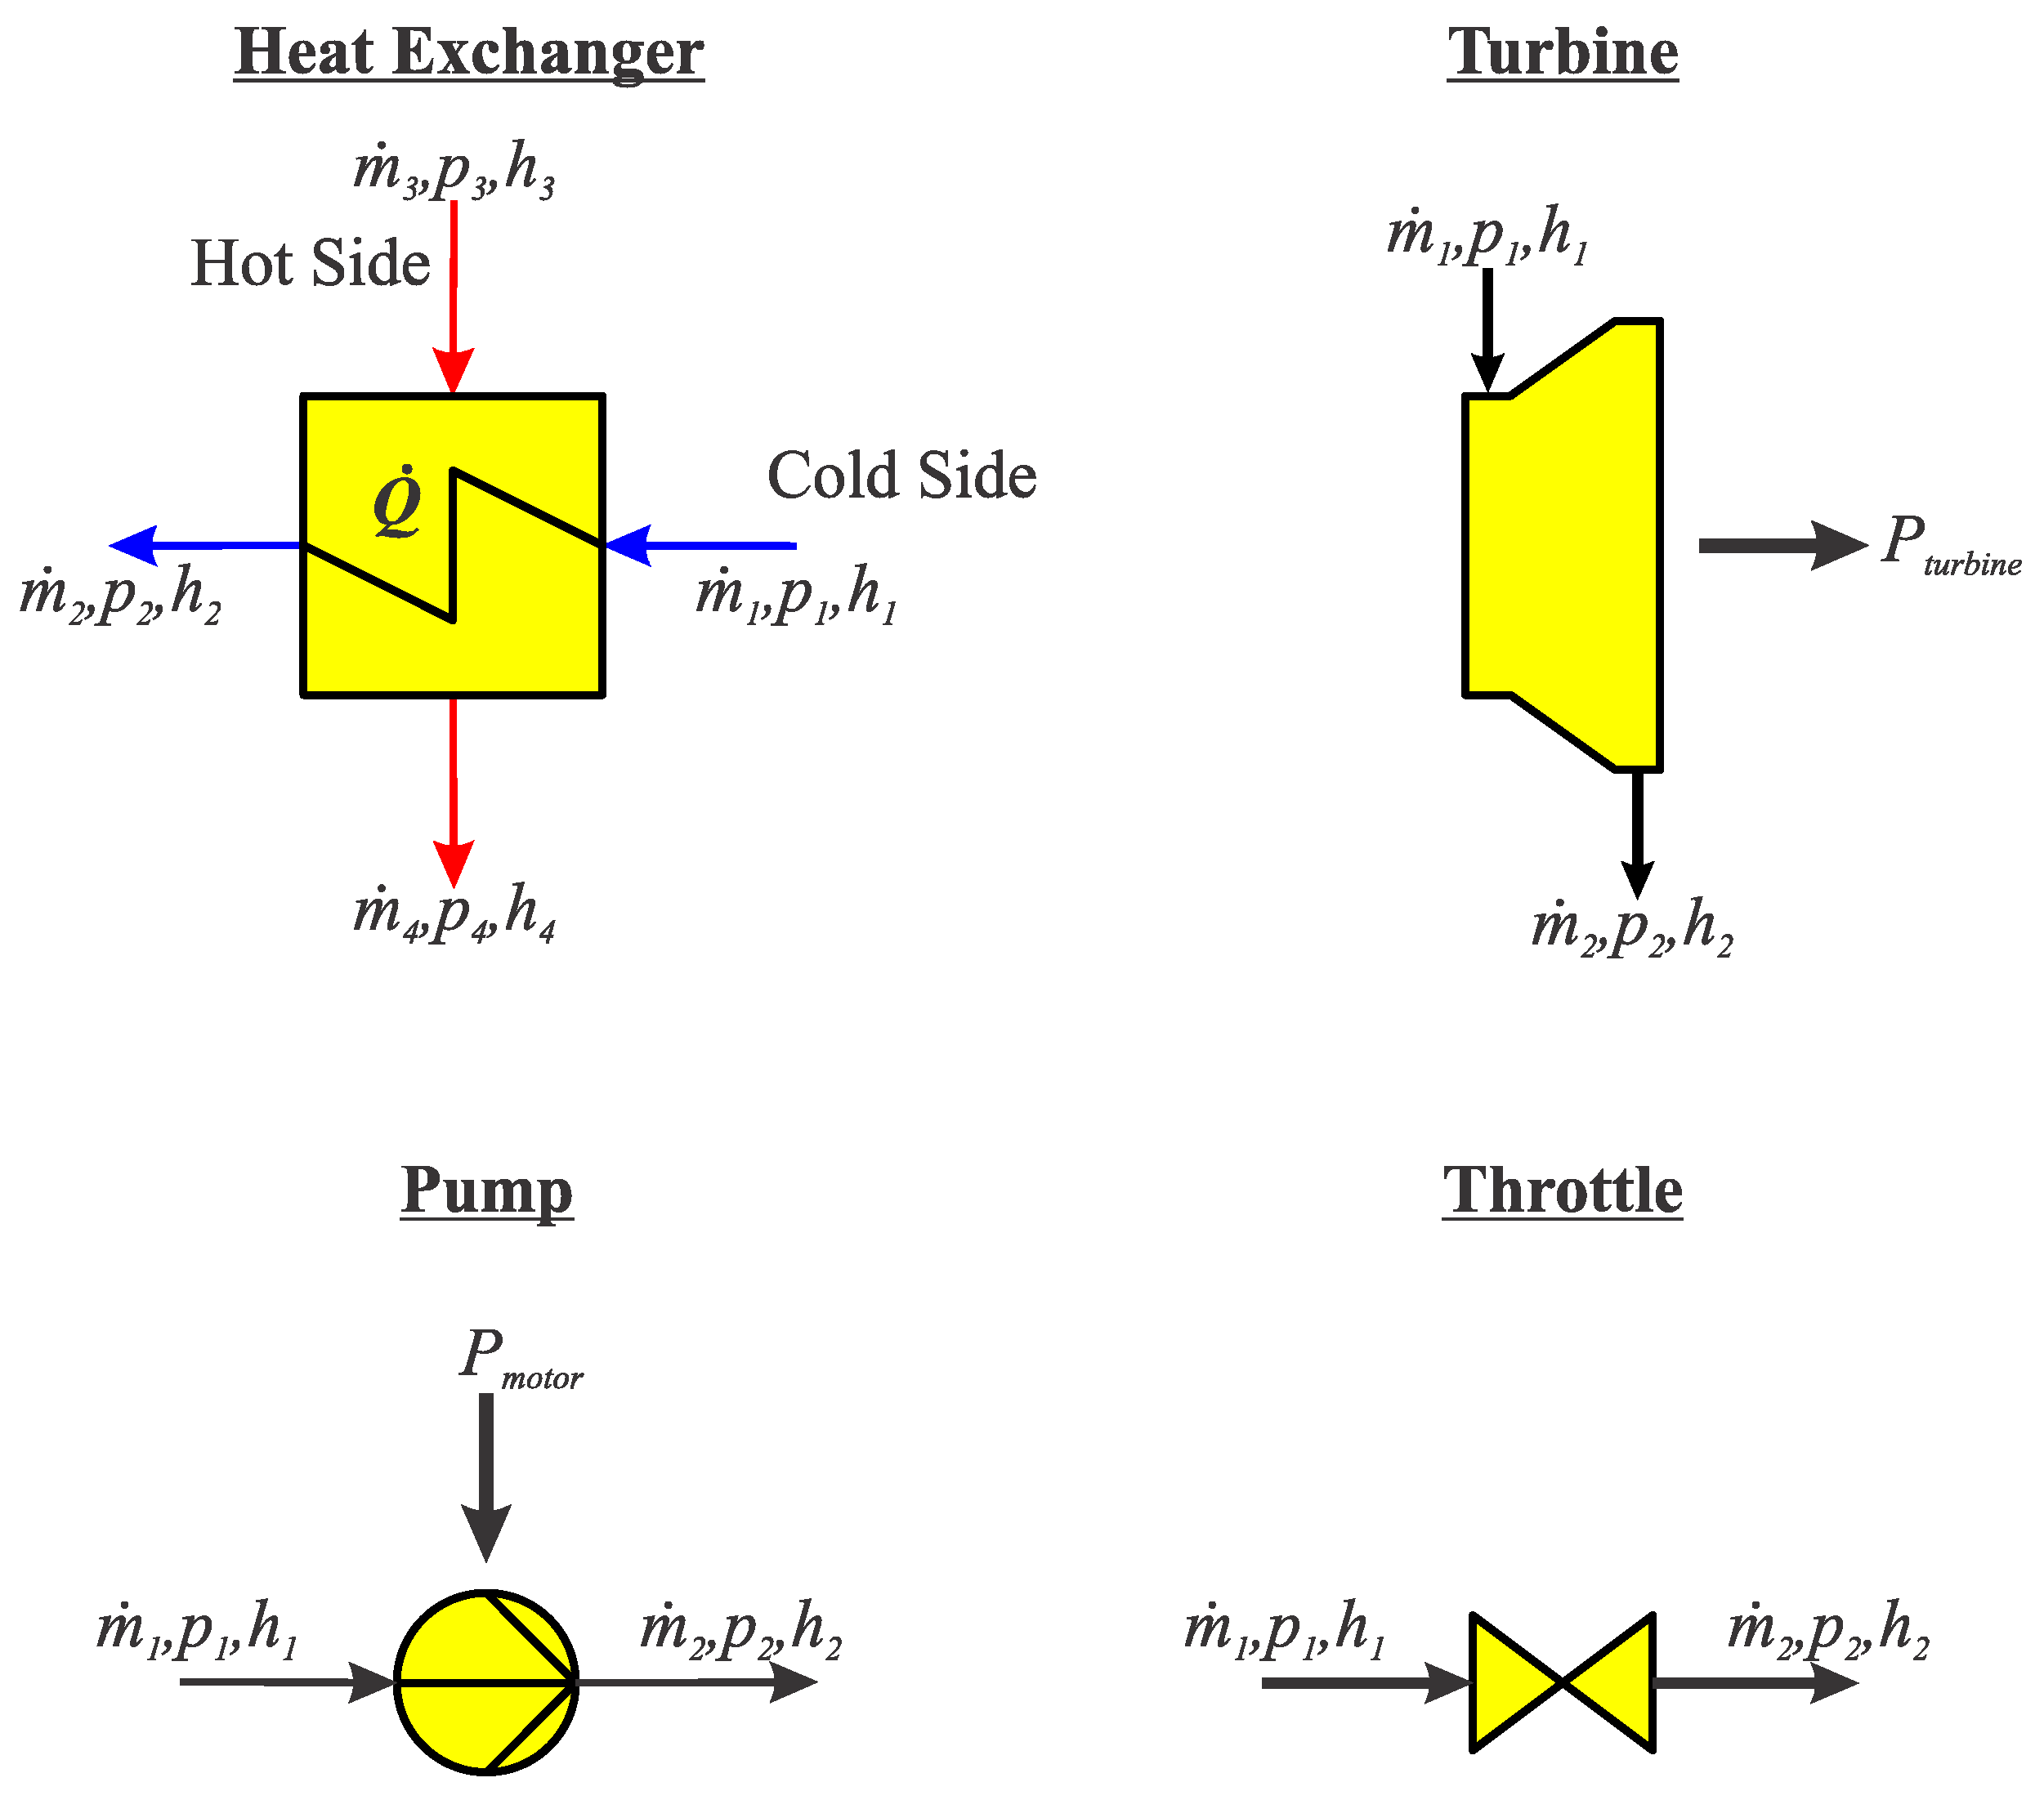
The subcritical HRSG model was made with EBSILON Professional software. EBSILON Professional has a graphical user interface (GUI) where predefined components (e.g., turbines, heat exchangers, condensers, etc.) and wide range of working fluids (coal, natural gas, oil, thermos-fluids, steam, exhaust gas, and binary mixtures) may be selected. Each component has characteristic (nonlinear) equations stored in it, which are used in a computational matrix. The equations are linearized at the threshold of simulation, and are then are solved iteratively using an implicit Gauss-Seidel algorithm. For the calculation of the fluid data, EBSILON uses standard libraries such as the water-steam table IAPWS-IF 97, the REFProp (for organic fluids), the Coolprop, and TREND. Figure 3 demonstrates the components in the process simulation of the subcritical HRSG.

3.1. Heat Exchanger

As illustrated in Figure 3, mass balance is given by m ˙ 1 = m ˙ 2; m ˙ 3 = m ˙ 4. The energy balance of a heat exchanger assumes no losses. The first law of thermodynamics simplifies to Equation (1).
Q ˙ = m ˙ 1 ( h 2 h 1 ) = m ˙ 3 ( h 3 h 4 )
For the transferred energy, the relation Q ˙ = k · A · Δ T m could be applied. Where k is the heat transfer coefficient, A is the area of the heat exchanger and Δ T m is the mean log temperature difference. EBSILON Professional calculates the part load behavior of a heat exchanger using a characteristic curve for k and a nominal value of ( k · A ) N which is cleared in Equation (2).
k · A = f ( m ˙ 1 m ˙ 1 N , m ˙ 3 m ˙ 3 N ) · ( k · A ) N
The terminal temperature difference (TTD), pressure drop of the flue gas, and the pressure drop on the water/steam side must be specified for each heat exchanger. These values were selected from the measured data of the reference power plant.

3.2. Pump

The pump is considered adiabatic because the heat flowing across the system boundary is negligible. Since it is a steady-state flow process, the mass balance of the pump is m ˙ 1 m ˙ 2 = 0. EBSILON Professional calculates the required supplied power using the first law of thermodynamics for steady-state flow processes, in a simplified form as in Equation (3).
P M o t o r = m ˙ 2 h 2 m ˙ 1 h 1
At partial load, the program calculates the outlet enthalpy taking into account the isentropic efficiency, which is given in a characteristic curve η( m ˙ ) as shown in Equation (4).
h 2 = h 1 + 1 η · ( h 2 s h 1 )

3.3. Steam Turbine

The mass balance of the steam turbine is analogous to the pump. The energy conservation is given by Equation (5).
P T u r b i n e = m ˙ 1 h 1 m ˙ 2 h 2
At partial load, h 2 is calculated analogously to pump using the isentropic efficiency. Therefore, a characteristic curve is stored in the program, which is dependent on several variables, η = η( m ˙ , p, ρ). Stodola’s law has the ability to represent the relationship between inlet and outlet pressure in partial load as in Equation (6) where the index N denotes the nominal value at full load.
( m ˙ 1 m ˙ 1 N ) 2 = p 1 p 1 N · v 1 N v 1 · 1 ( p 2 / p 1 ) 2 1 ( p 2 N / p 1 N ) 2

3.4. Throttle

The function of a throttle is to reduce pressure, with no change in mass flow or enthalpy between inlet and outlet. By pressure reduction, the pressure difference is provided by Equation (7).
Δ p 12 = p 1 p 2
In partial load, the program calculates the pressure drop using Equation (8), taking into account the nominal values and the mass flow in partial load.
Δ p 12 = ( v 1 v 1 N ) ( m ˙ m ˙ N ) 2 · Δ p 12 N
Equation (8) shows that this pressure drop also depends on the specific volume ν.

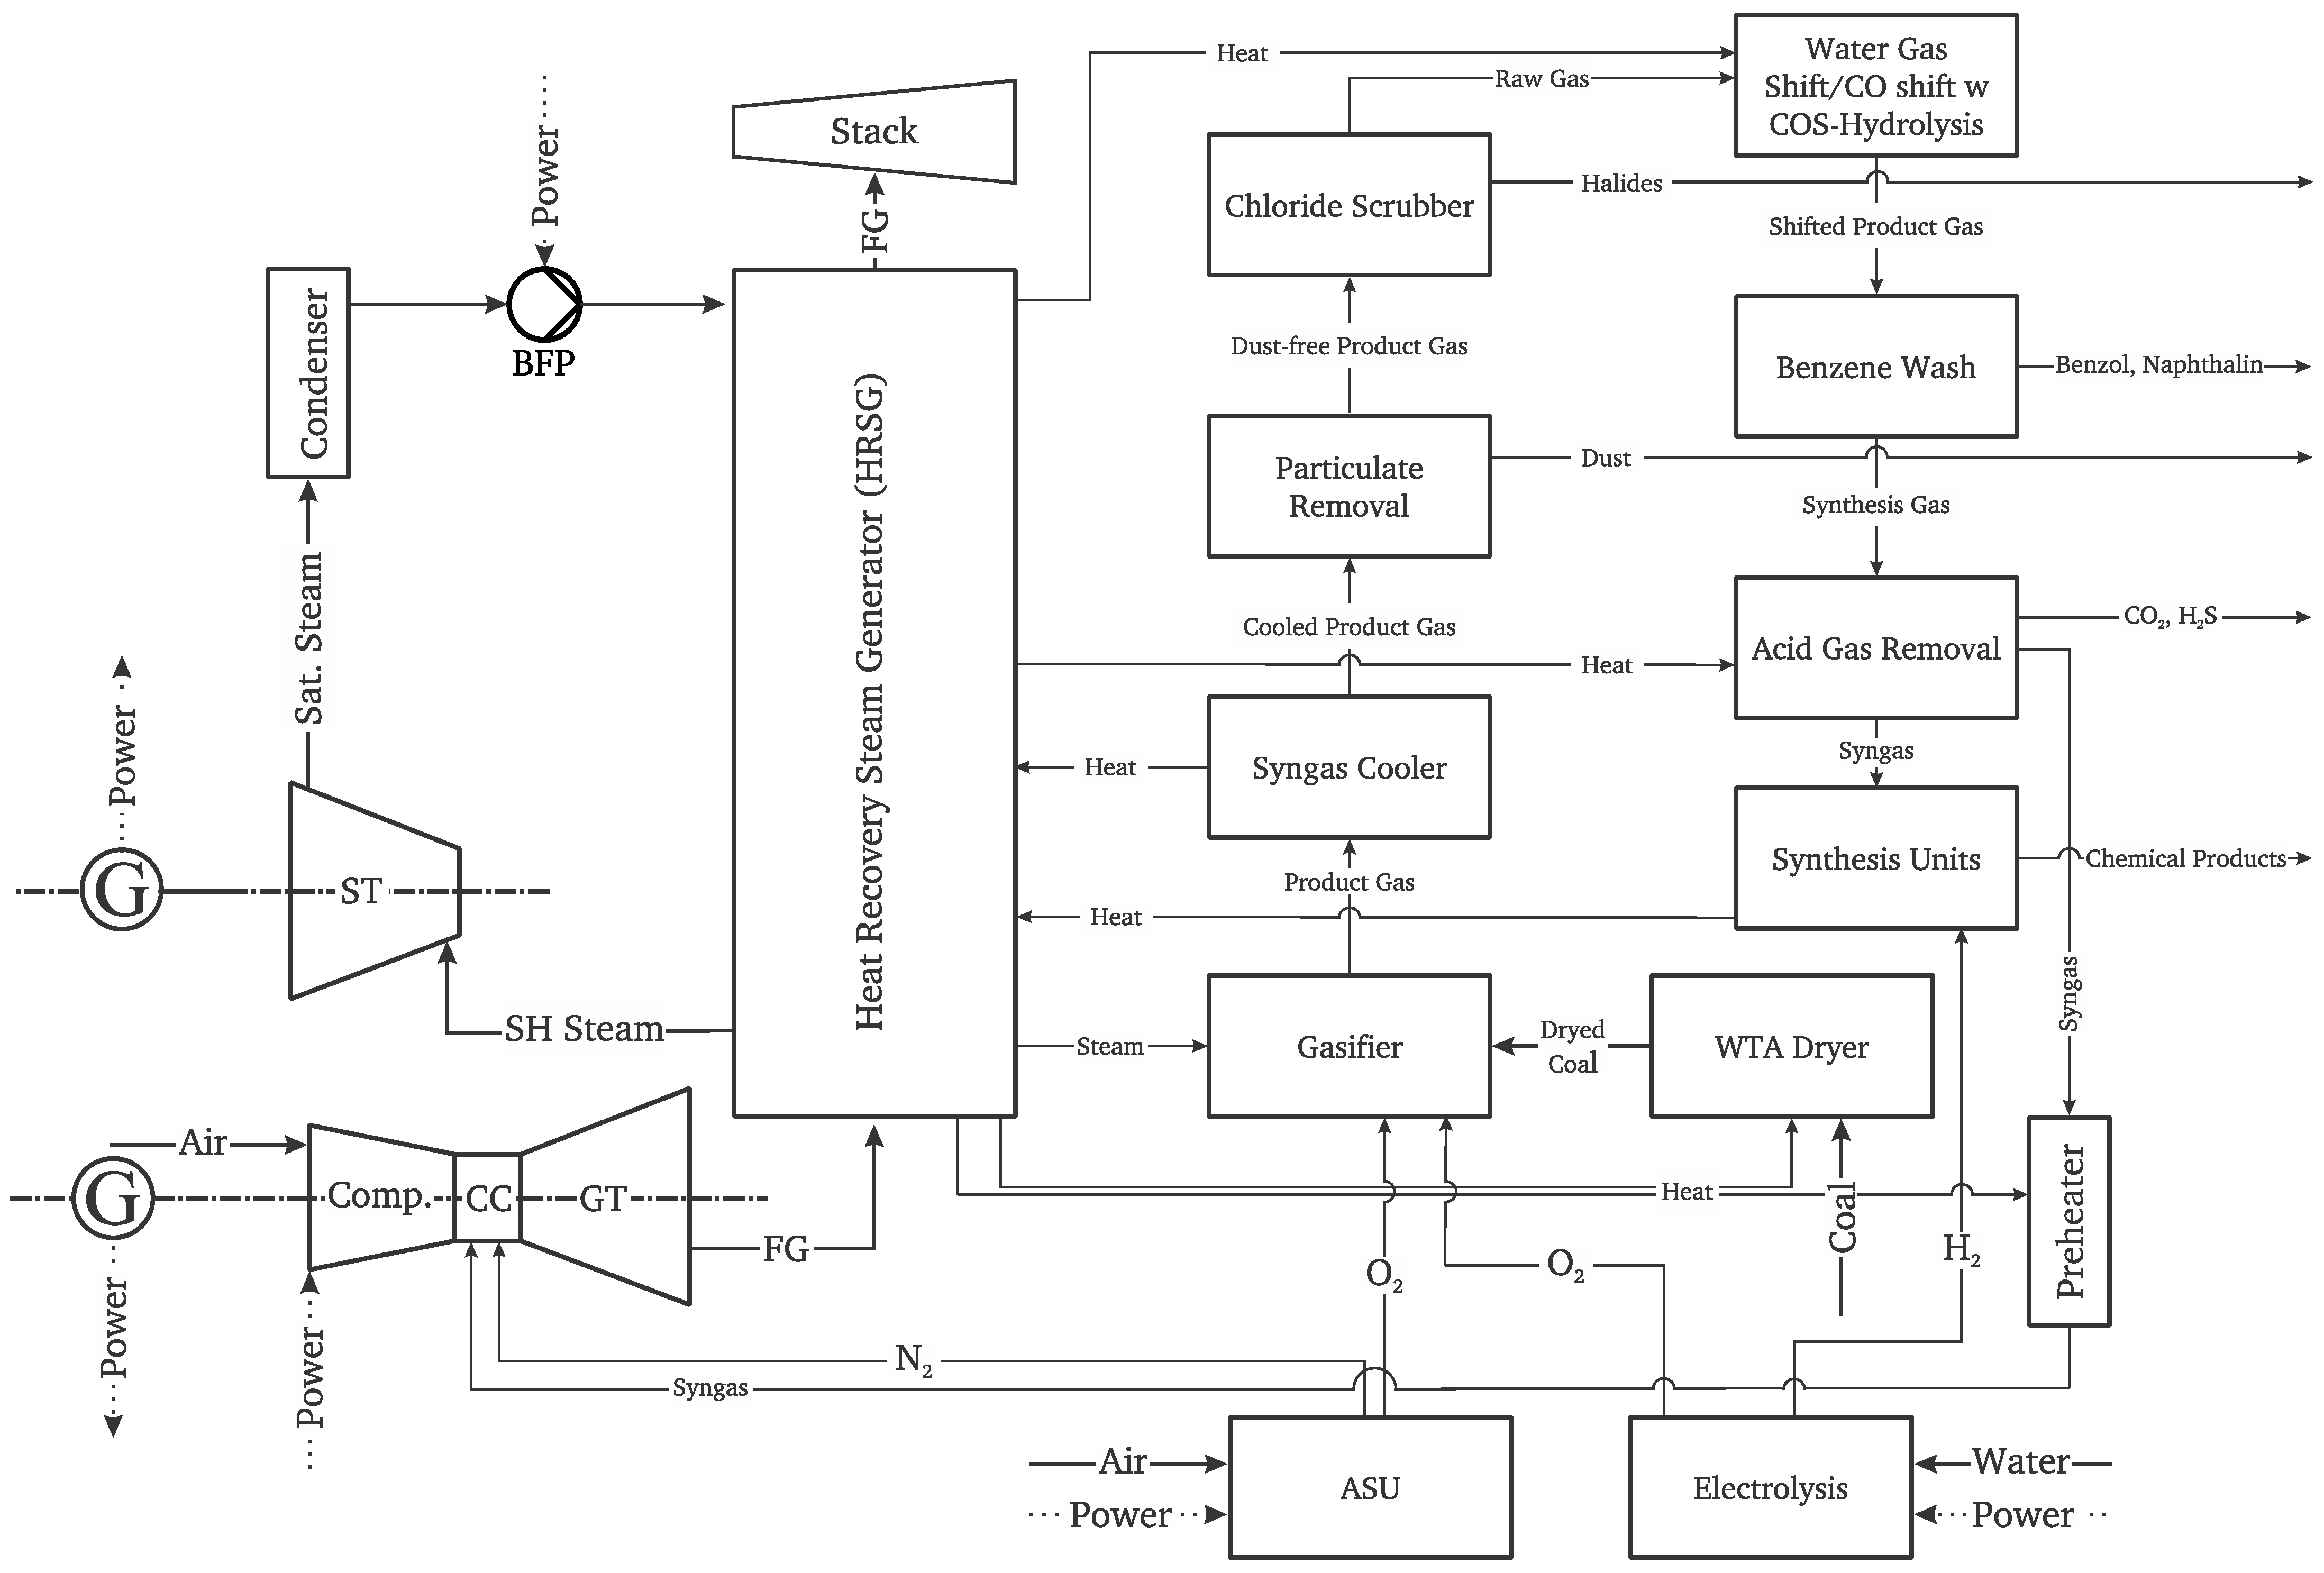
4. Description of Process Flow Simulation Model

The steam power process is based on an existing and already validated Aspen plus model of the water steam cycle of a natural gas-fired gas and steam turbine plant in the previously published work by the institute [43,44,45]. This model was transferred to EBSILON Professional where it was studied in detail. Key plant data are summarized in Table 1. Figure 2 shows the schematic diagram of plant design. The model included the flue gas path and the steam cycle with steam turbine, heat exchangers, valves and pumps.

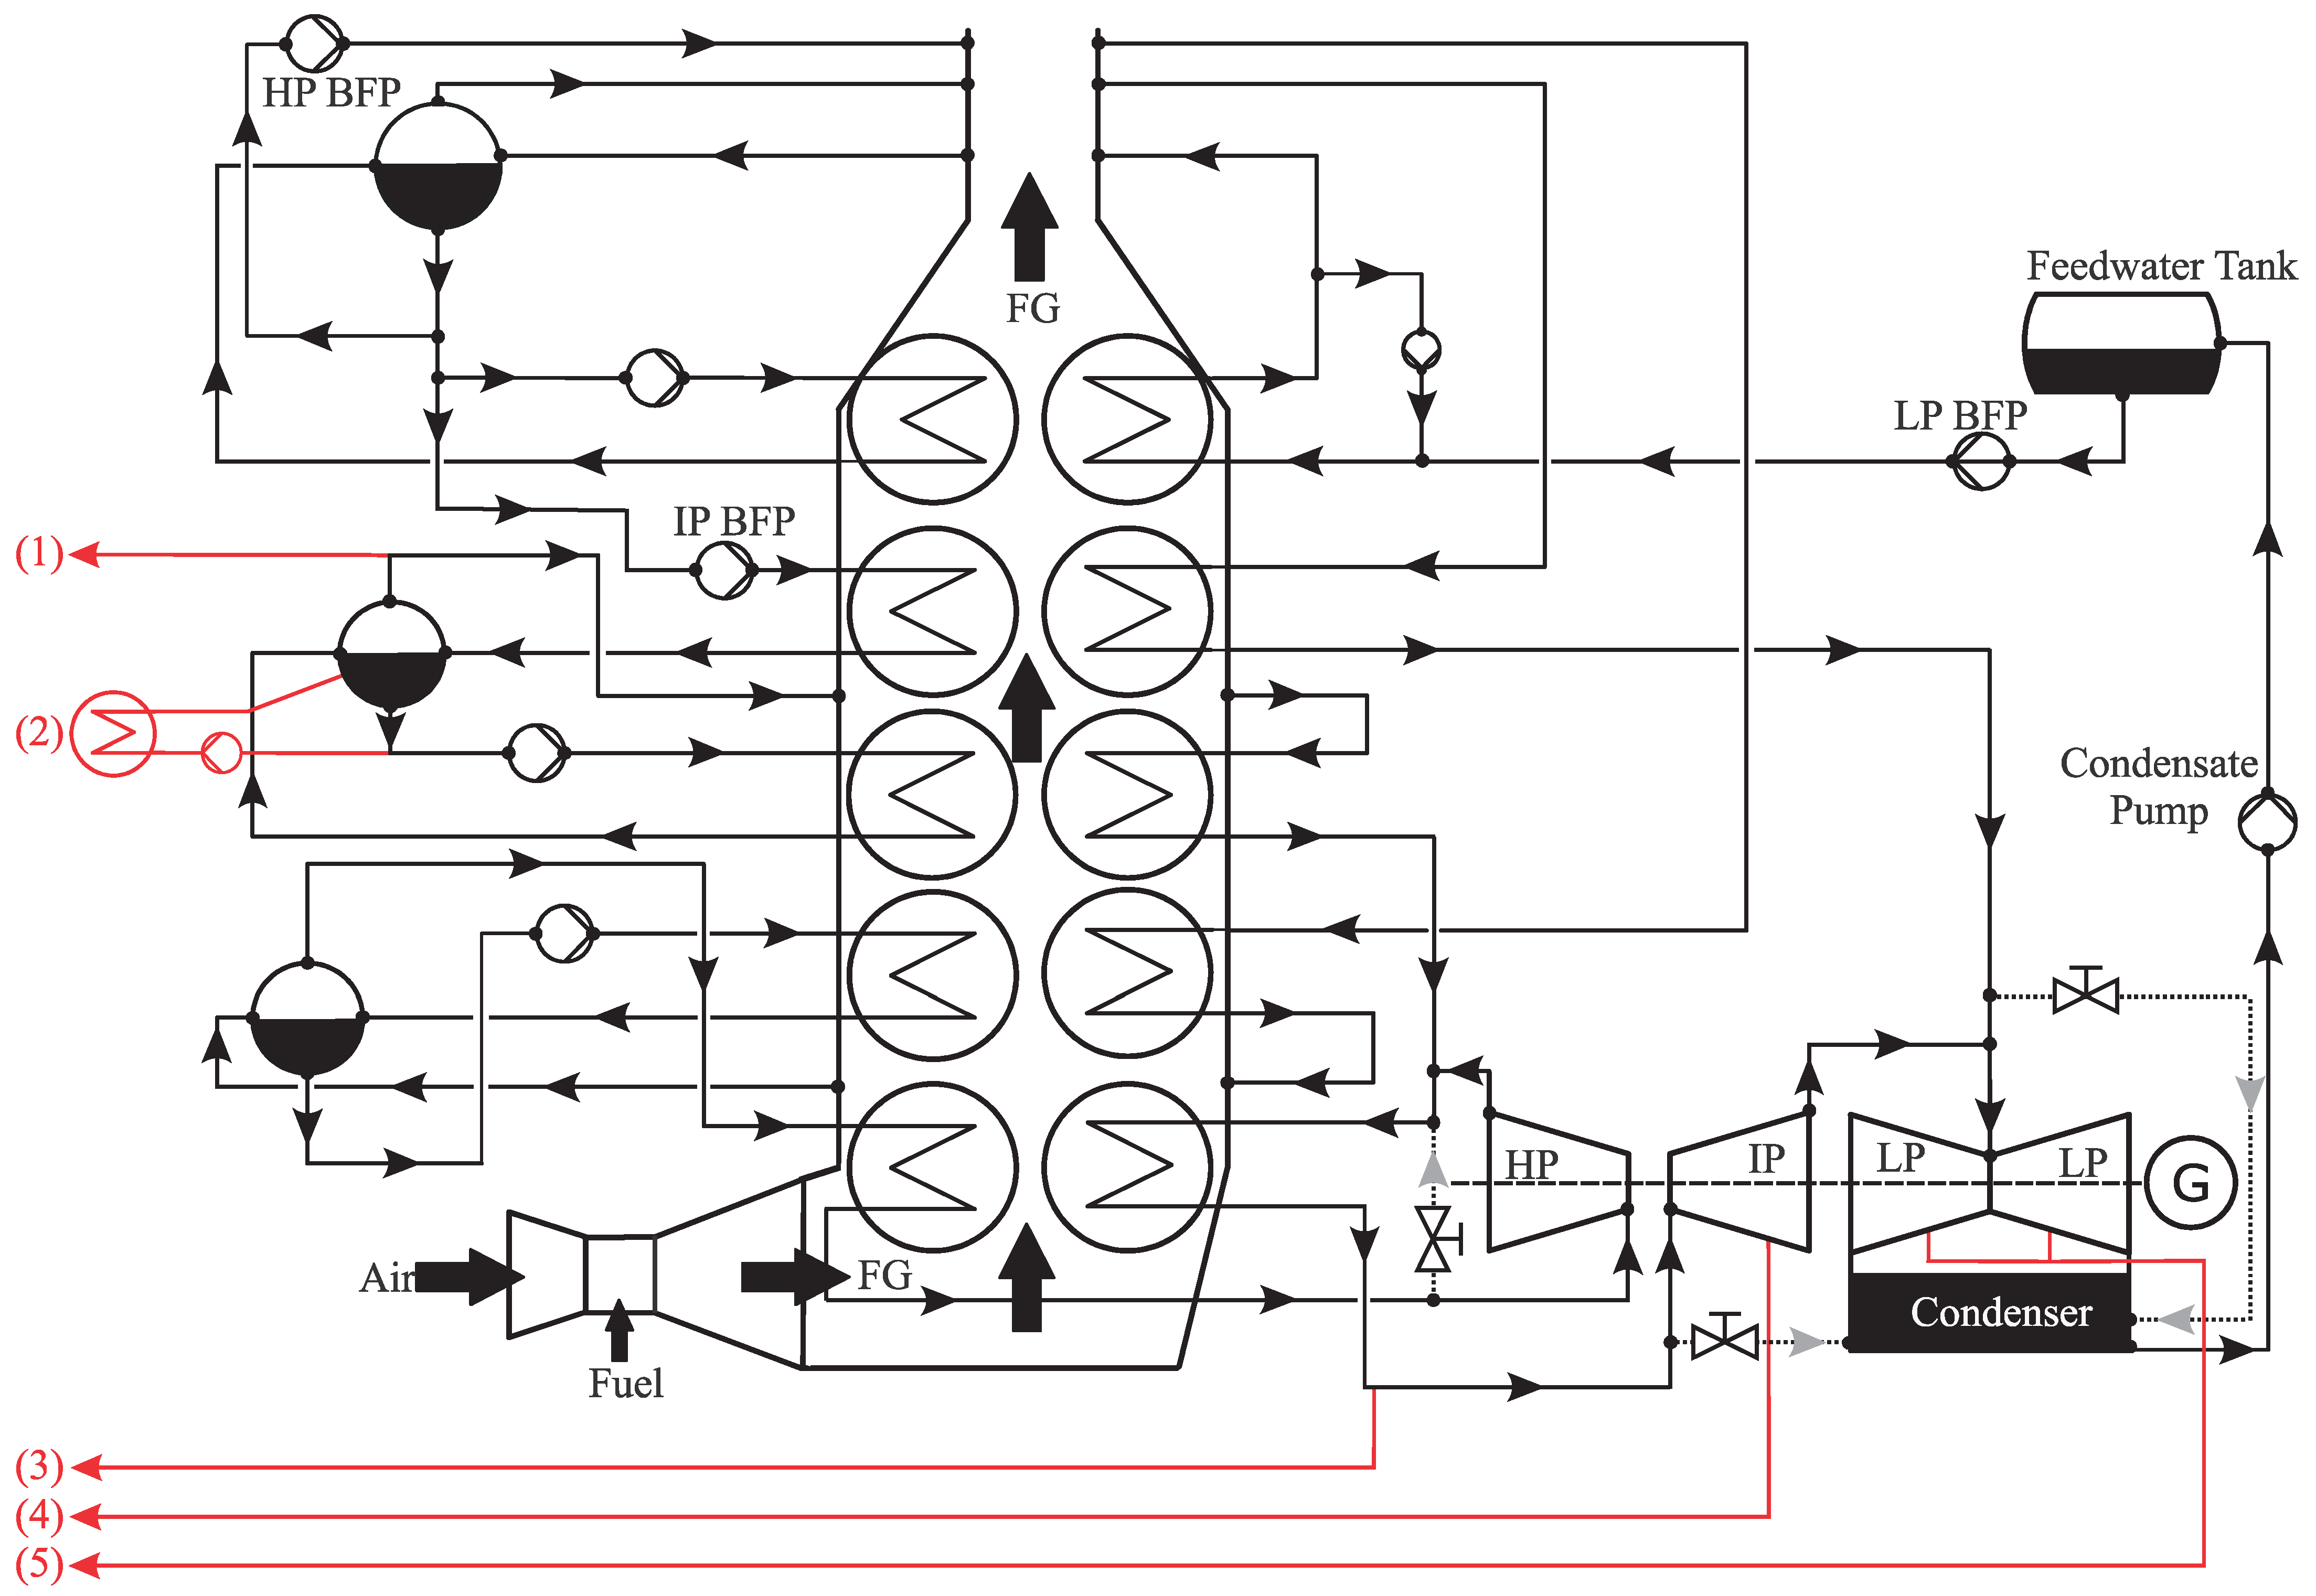
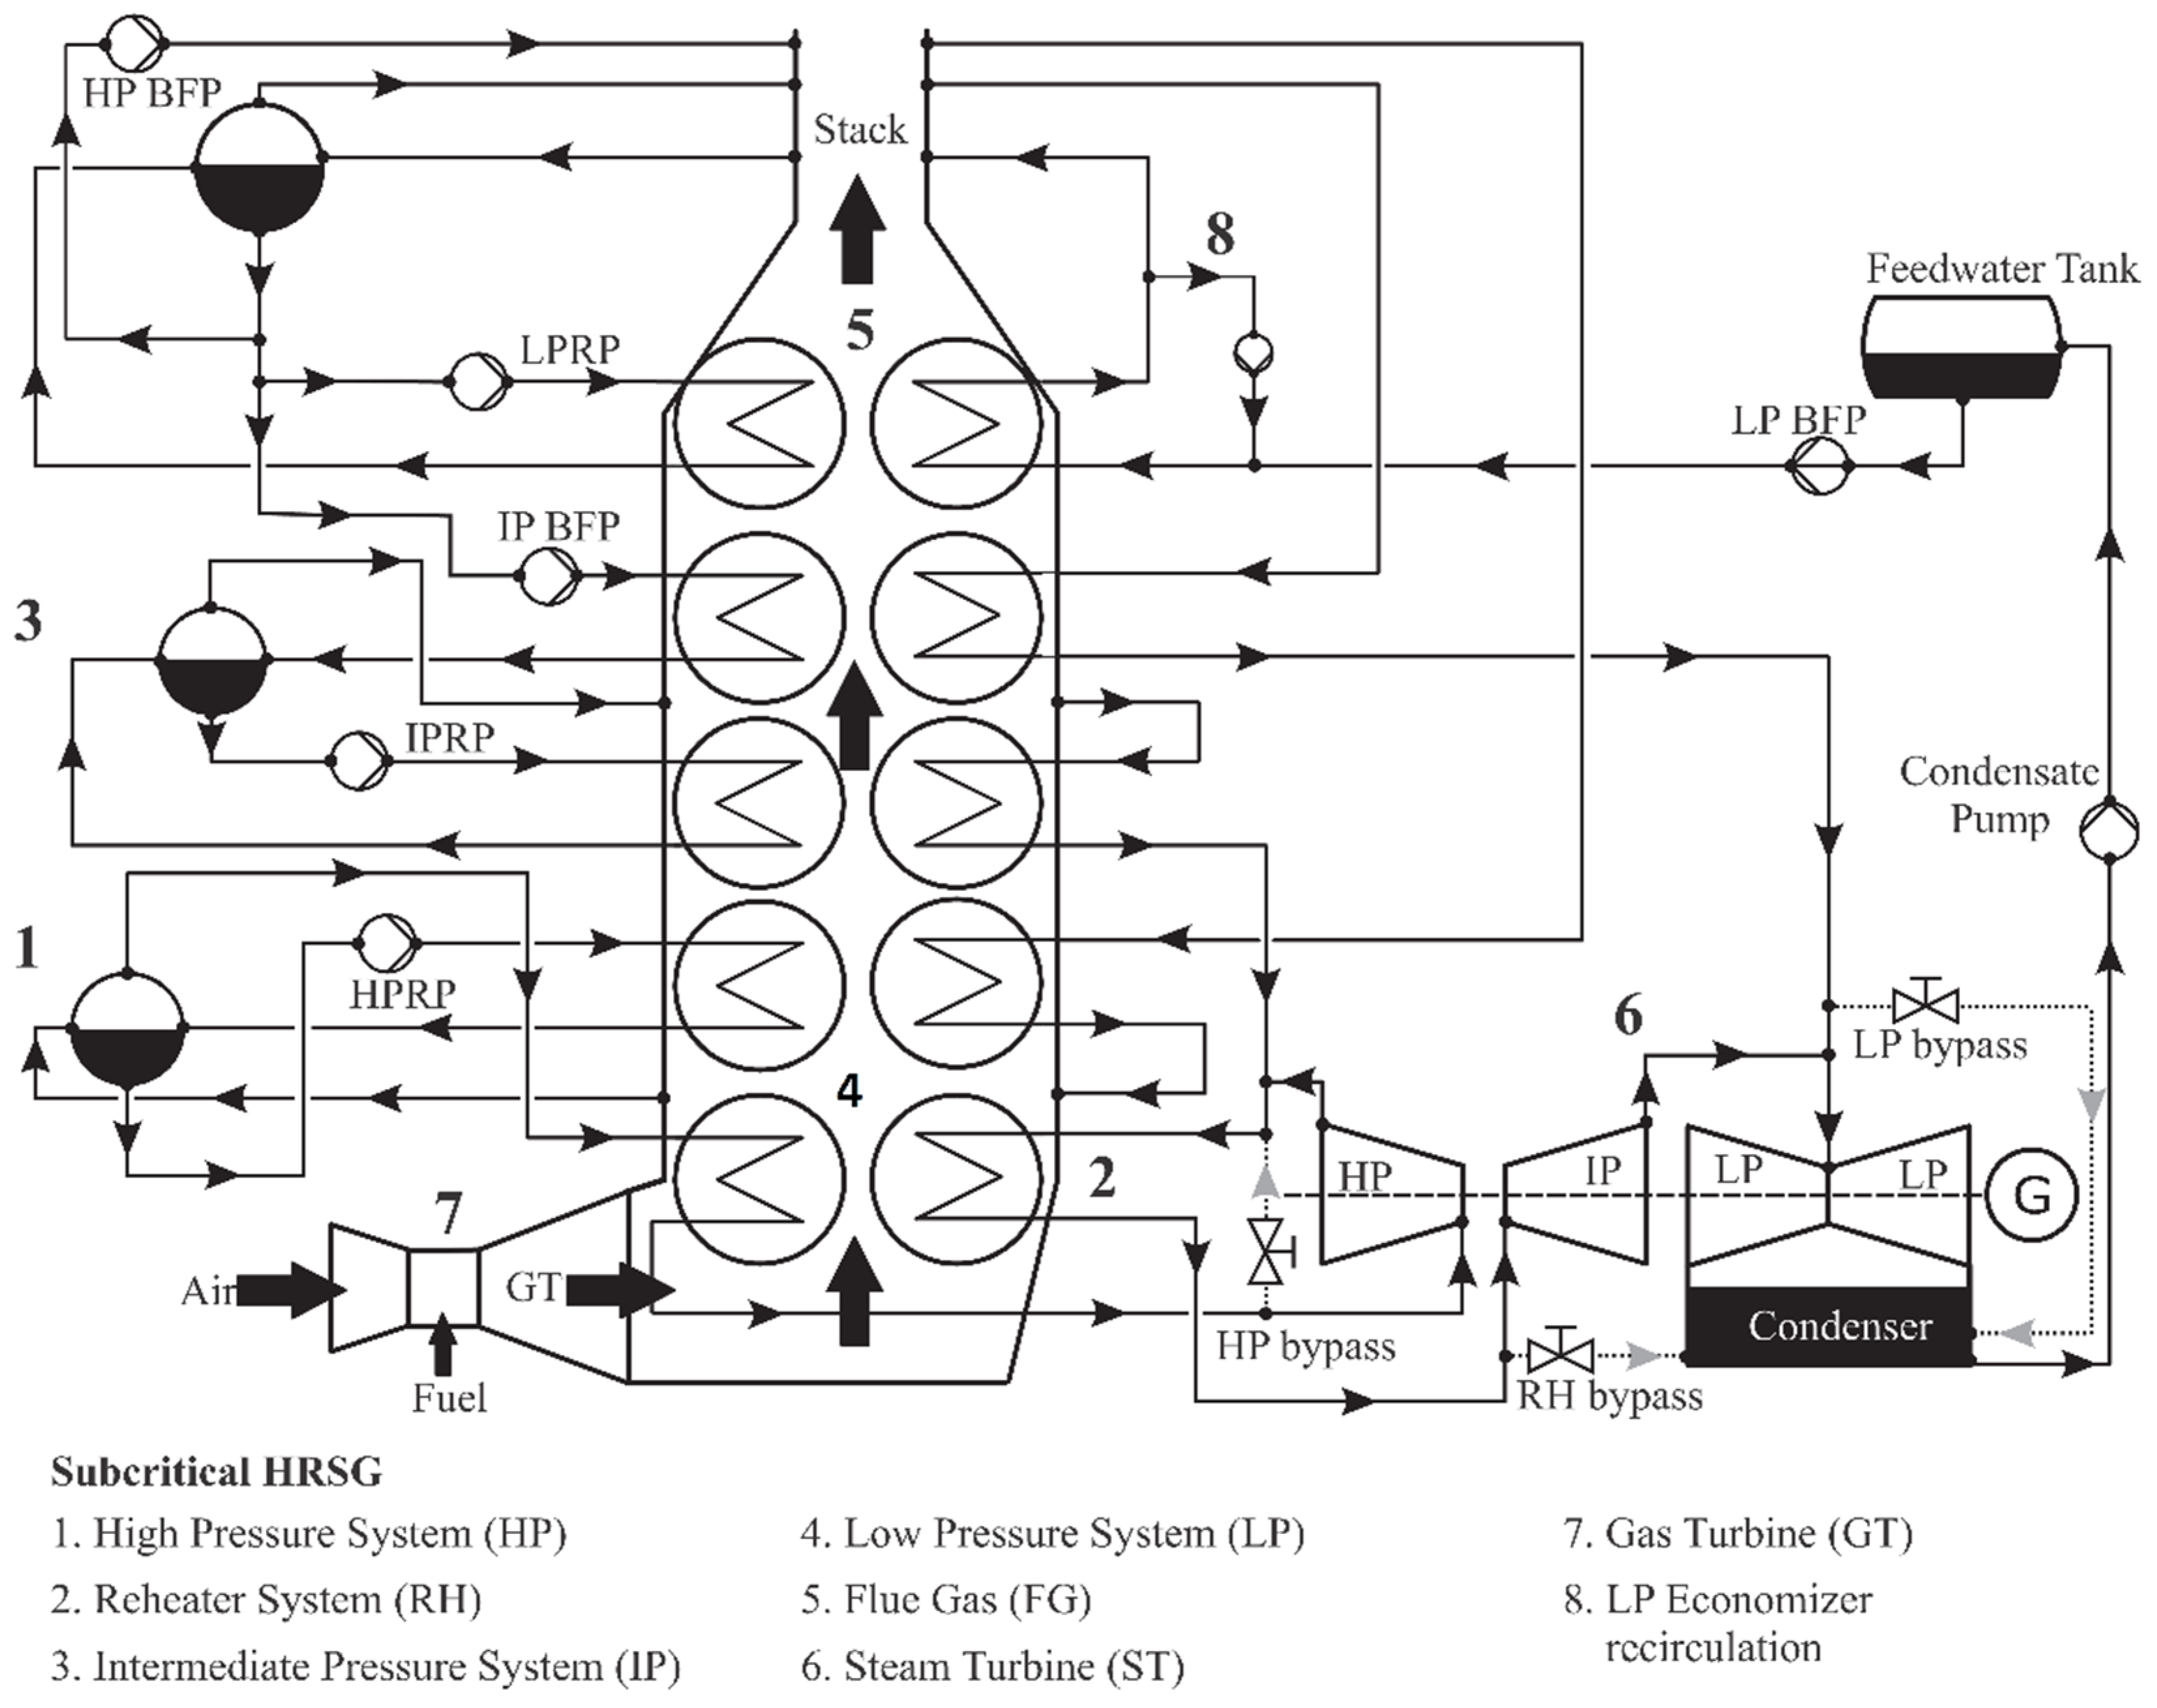
4.1. HRSG Simulation Model

The model of the subcritical HRSG including the flue gas and water/steam sections was built according to the operating data of the reference power plant. A representation of the process simulation model of the reference power plant’s HRSG is shown in Figure 4, which includes both the flue gas and the water/steam sections equipped with HP, IP, and LP circuits. The flue gas enters from the GT with a mass flow rate and temperature of 587.3 kg/s and 628 °C, respectively, into the HRSG conduit. Having passed through the conduit, the flue gas is cooled to 81 °C with a small drop in pressure amounting to approximately 15 mbar. The efficiency in relation to the lower heating value is 91.28%.
The water/steam flow route is illustrated in Figure 4 showing that the LP circuit starts at the input of the LP-ECO and ends at the output of the LP-SH. The LP feedwater is supplied to the LP-ECO using the condensate pump that is modeled as an inlet boundary condition. This feedwater leaves the LP-ECO into the LP drum at a temperature of 49.8 °C resulting from recirculation out of the LP-ECO outlet to the LP-ECO inlet, regardless of the power plant load. The water circulates through the LP evaporator tubes from the LP drum, causing an increase in temperature due to heat transfer which occurs between the flue gas and the water in the evaporator tubes, thus producing saturated steam. The majority of the saturated water is separated as it passes through the LP drum and is pumped into the LP circuit using the LP feedwater pump and then to the HP circuit using the HP feedwater pump. The saturated steam exiting the LP drum is passed into the LP-SH, which then supplies the superheated steam to the LP turbine.
In the HP circuit, which begins with the HP feedwater pump and ends with the HP SH as shown in Figure 4, the feedwater passes through the HP ECON (HPLT-ECON1, HPLT-ECON2, HPIT-ECON, and HPHT-ECON) into the HP drum at the HP pump pressure. This feed water circulates through the HP evaporator using the HP circulating pump to produce steam. As the HP drum separates steam and water, the steam leaving the drum is directed into the HP-SH. Along its path through the HP superheater (HPLT-SH and HPHT-SH), the steam is superheated by exchanging heat with the flue gas. There is an HP temperature controller (attemperator) at the inlet of the HPHT-SH regulating the HP turbine temperature at the inlet to 567 °C using quench water. The superheated steam is then fed to the HP turbine.
The IP circuit as presented in Figure 4 starts at the inlet of the IP feedwater pump and ends at the outlet of the IP-SH consisting of IP-ECON, IP-EVAP, and IP-SH. The IP feedwater flows through the IP-ECON into the IP drum using the IP feedwater pump and circulates through the IP evaporator where it is converted by heat transfer from the flue gas into saturated steam before returning to the IP drum. The generated steam is then superheated into the IP-SH. Part of the water that was heated in the economizer is taken from the IP circuit at 9 kg/s for preheating of the GT combustion chamber air, while a second stream is used for fuel gas preheating. After the IP-SH, the superheated steam is merged with the steam leaving the HP turbine, then the stream is fed to the RH (LT-RH and HT-RH) for further heating. The RH steam is supplied to the IP turbine at a temperature of 567 °C regulated using attemperator, which uses cooling water from the stream before the IP-ECON. There it is expanded and then expanded to 52 mbar together with the superheated steam from the LP-SH in the LP turbine. Finally, the saturated steam is condensed again in the condenser and brought to a pressure of 12.5 bar with the aid of the condenser pump.
The pressure of the three cycles is specified via an input pastille (start value) at the respective outlet lines from the HRSG. This determines the required steam pressure before entering the respective turbine. To achieve the specified value, EBSILON Professional uses the pressure losses on the water/steam side to calculate the pressure back to the respective pump to determine the pressure to which the pump must pressurize. The value of the pressure must be set manually for each load case. Such input pastilles (start values) are also set downstream of the high, intermediate and low-pressure turbines. This determines the pressure to which the respective turbine should expand. The junctions, which are connected to control elements, are significant. They are located upstream of the HT-RH and upstream of the HPHT-SH. The temperature downstream of the HT-RH and HPHT-SH is controlled by feeding their cooling mass flow upstream. The mass flow supplied upstream of the HT-RH is withdrawn downstream of the intermediate pressure pump, since it is at similar pressure level. The mass flow supplied upstream of the HPHT-SH is drawn off downstream of the high-pressure pump. In this case, the cooling mass flow represents the manipulated variable in order to achieve the set-point specified by the controller. In the system considered in this work, the temperature downstream of the HT-RH and the HPHT-SH should always be 567 °C.
This control is especially significant for part-load operation, because temperatures can occur downstream of the heat exchangers that deviate from the grade. However, the temperature of the steam supplied to the turbines should not be adjusted.
Without control, the temperature after the two heat exchangers, as mentioned above, increased by 2 °C at 80% partial load, and by 4 °C at 60%. The turbines are designed for an inlet temperature of 567 °C. Hence, an increase in temperature may reduce the lifetime of the turbine.

4.2. Heat Integration

For adaptation of the steam power process to the polygeneration approach, the integration of heat and steam flows in the process model was investigated. Specifically, the integrations listed in Table 2 were carried out. The indicated pressures and temperatures represent minimum requirements for the respective steam or heat flow.
In WTA drying, the pressure results from the required saturated steam temperature in the condenser. In the case of the HTW gasifier, as well as in water-gas shift, the pressure must be above the process pressure so that the steam can be fed into the process. In the case of the HTW gasifier, it is also desirable to provide as high a temperature as possible so that the oxygen demand in the gasifier remains small. The necessary temperatures for the heat consumers, acid gas removal and gas preheating of the gas turbine result from the temperature of the heated streams. In acid gas removal, the heat is utilized in the reboiler by condensation, which is why saturated steam is required here. For gas preheating, tapping of intermediate pressure process water is usually used in combined cycle processes, which are already available in the validated model. The raw gas cooler and, in the case of parallel methanol and electricity production, the waste heat of the methanol synthesis, are available as heat suppliers for the steam process. In both cases, saturated steam can be produced. The temperature of the heat input results from the gas-side temperature in the process. For the raw gas cooler, this corresponds to the outlet temperature of the synthesis gas at 265 °C. For methanol synthesis, this corresponds to the temperature of the first reactor in the mega methanol process, since this is designed as an evaporator at 265 °C. Overheating is not possible with the usual design of the apparatus.
The required pressure of the steam as a gasification agent for the HTW gasifier places high demands on the steam power process. A pressure of 35 bar can only be obtained in the steam power process of the reference plant in Malaysia by tapping the high-pressure turbine. However, a tap with the corresponding pressure only has a temperature of approx. 420 °C in the investigated steam power process. However, tapping the superheated HP steam before it enters the turbine is unfavorable from an energy point of view, as this greatly reduces turbine output. It would, therefore, be desirable to tap the steam before the IP turbine. To achieve this, the intermediate pressure must be raised. Pressure drops in the partial load case of the steam power process must also be taken into account. For modeling purposes, the pressure at the turbine inlet is, therefore, increased to 42.3 bar. An increase in the intermediate pressure also requires an increase in the high pressure at the same time, since otherwise the turbine outlet temperature from the HP turbine increases significantly compared to the reference design. This hot steam stream is then mixed in the process with only slightly superheated IP steam, resulting in high energy loss. To maintain the same turbine outlet temperature at the HP turbine, the inlet pressure of the HP turbine is increased to 178 bar in the model. The temperatures in the IP and HP superheaters are maintained, which is why these adjustments to the model result in only a minimal change in efficiency.
After increasing the pressure level in the steam process, the tapping for the water-gas shift and for the gasification agent of the gasifier can take place at the IP steam after the reheater or the evaporator. Tapping for the WTA drying is done at the IP turbine at 4.2 bar. The tapped steam is superheated and has a temperature of 259 °C. The heat for acid gas scrubbing is taken at the LP turbine at 0.8 bar and a temperature of 110 °C. The two heat suppliers are integrated as additional evaporators in parallel with the IP evaporator in the process. In Figure 5, the taps in the steam power process are drawn in red.
For the partial load operation of the plant, a sliding pressure control was implemented in the model for the power range from 60 to 100%. The pressure ratios from the reference plant were scaled according to the pressure increase. Below 60%, the plant must be operated in equal pressure mode, since otherwise the taps of the IP steam have insufficient pressure to be fed into the gasifier or the conversion reactor.

5. Validation and Modification

5.1. Validation

Validation of the model was performed at different load cases (100, 80, and 60%) using the measured data of steam mass flow, temperature, and pressure at the outlet of the HRSG, because these parameters affect the performance of the HRSG. A comparison of these parameters among the model and the operating data of the reference power plant at the outlet of the HPHT-SH is presented in Table 3. There was no change in the pressure due to the pre-setting of the pressure using the input pastille (start value) as a boundary condition. A minimum error of less than 0.1% was obtained for the temperature, as it was controlled. The mass flow was calculated numerically by the program, resulting in high deviations, with a maximum deviation of 1.65% at 60% load case and a deviation of 1.63% at 80% and 0.73% at 100% load case.
Table 4 shows a comparison between the measured data and the simulation results for the steam mass flow, pressure and temperature at the outlet of the reheater section. Indeed, the simulation results for the superheated steam mass flow and temperature at various partial loads agree very well with the measured values. The maximum relative error was 2% for the superheated steam mass flow at 60% part-load. As previously mentioned, the temperature of the superheated steam in the HP circuit was kept constant at 567 °C by the RH. Similar to the high-pressure system, the simulated reheat pressure was similar to the measurement due to presetting of the pressure using the input pastille (start value) as a boundary condition.
Table 5 compares the steam mass flow, temperature and pressure at the outlet of the LP-SH with the measurement data and the simulation results. As in the previous high and intermediate pressure cycles, the values of the pressure correspond to the measured data of the reference power plant. The simulation results show a very good agreement with the measured data. The calculated values for the reheat temperature had a maximum relative error of about 0.36% because of the control of the temperature in the IP and HP cycles. The mass flow rate of the superheated LP steam had good agreement with the measurement at 100% load, with a relative error of about 1%. At 80% part-load, the error increased to 7% before decreasing to 6% at 60% part-load. However, these high deviations had little effect on the performance of the downstream steam turbine. This is because the low-pressure steam generates significantly less power than the IP or HP steam due to the significantly poorer steam quality and the lower mass flow. Nevertheless, the good agreement of the simulated temperature at the outlet of the LP-SH for 80% and 60% part-load (maximum relative error of 0.36%) indicates that the deviation of the simulated steam mass flow was due to the uncertainty of the LP steam mass flow measurement.
The power generated in the steam turbine (ST) was compared between the simulation and the actual value of the reference power plant. Table 6 presents this comparison, which shows very good agreement at the three load cases with a maximum relative error of about 2.31%. Due to this low relative error the model was validated.

5.2. Modification for Synthesis Gas Turbine

The steam power cycle was investigated within a CCPP operated by a gas turbine that uses natural gas fuel for combustion. The IGCC operated by a synthesis gas turbine used syngas as fuel for the combustion, which means that some modifications to the gas turbine should be applied, e.g., turbine inlet temperature (TIT) and turbine outlet temperature (TOT) [47,48,49]. Accordingly, the steam power process must be modified.
With synthetic gas turbines, the flue gas temperature is lower. However, the heat delivered to the HRSG should remain constant. To calculate the heat delivered to the HRSG, Equation (9) is used.
  Q ˙ = m ˙ f l u e   g a s ( h i n h o u t )
Therefore, a model modification was considered in which the flue gas temperature at the HRSG inlet (Gas turbine outlet) is 600 °C. The transferred heat quantity of the model investigated was 364.676 MWth. To achieve a constant heat flow into the HRSG, and by using Equation (9) the flue gas mass flow must be increased by 4.313% from 587.33 to 612.66 kg/s. Moreover, it should be noted that due to the temperature decrease of 28 °C, it is not possible to increase the temperatures to 567 °C after the HPHT-SH and the HT-RH, using the same terminal temperature difference (TTD). Therefore, a temperature of 551 °C was set for the synthetic gas turbine case. For this purpose, it was necessary to adjust the TTD of the heat exchangers due to the lower flue gas temperatures. The HPHT-SH was reduced by 12 °C and the HT-RH by 18 °C. The set point value of the controller must also be reduced. The set point of the controller must be set to 551 °C. Table 7 lists the comparison between ST with synthetic GT and ST with natural gas GT. It is clear that the output decreased slightly in full load and 80% partial load. In the 60% partial load case, there was an increase in the output. This was due to a low TTD in the HT-RH. A low degree of TTD is always associated with an improvement in performance, and has a significant effect on the price of the heat exchanger.

6. Results and Evaluation

6.1. Integration of the Predefined Extractions

This section deals with the extractions required for synthesis gas generation. The steam mass flow extracted from the water-steam process is investigated in detail. The parameters of the extractions are provided at full and partial load. They were calculated using an existing model in Aspen [43,45]. They are considered guidelines but can be adapted to the boundary conditions presented in EBSILON Professional later in this work. First, a heat flow is required for coal drying, as well as another heat flow (steam) as a gasification medium. Afterwards, the raw gas is cooled, whereby this heat can be supplied to the steam power process. Heat flow from the steam power process is also required for raw gas cleaning (WGS reactor and amine scrubbing). Finally, heat flow is needed for gas preheating. Table 8 and Table 9 list the values calculated by Aspen for the respective extractions. The values shown in Table 8 are defined by required mass flow rates of saturated/superheated steam and the steam pressure. The extractions in Table 9 are defined by heat flow rates at the required minimum temperatures.
The value calculated by the Aspen model for gasifier extraction was 560 °C at 96 bar. However, maximum temperatures are required at a vapor pressure which is greater than the gasifier pressure (35 bar). These boundary conditions are only achieved before the high-pressure turbine, so that the extraction is located there. The amount of the mass flow is specified via a measured value input component.
For the water-gas shift (WGS) reaction, saturated steam at 35 bar (it can also be superheated) is required. The extraction is removed from the turbine since a pressure of 35 bar is needed. A division of the steam turbine into several segments is utilized. The outlet pressure from the first turbine component is set to 35 bar and the second turbine component of the high-pressure turbine is expanded to the outlet pressure of the high-pressure turbine. Thus, the extraction can be installed in a system at 35 bar, in which the steam has a temperature of about 400 °C.
In the Aspen model, saturated steam at a pressure of 4.2 bar is used to dry the coal. Since saturated steam is available at the required pressure after the low-pressure evaporator, this is an extraction option. However, a steam mass flow rate of 56.46 kg/s is required. The low-pressure evaporator generates considerably less steam, although this option is not applicable. Consequently, the steam for WTA dryer is removed from the intermediate pressure turbine, and the desired pressure of 4.2 bar is present there and sufficient mass flow is available. However, this is superheated steam with a temperature of about 326 °C.
The steam for the gas preheating and acid gas removal (AGR) (high-pressure CO2 reboiler, low-pressure CO2 reboiler, and H2S reboiler) can be extracted at any pressure because only heat flow can be defined at minimum temperature, as shown in Table 10. Accordingly, it makes sense to extract the steam from the low-pressure turbine at the final stages because in the final stage the more steam extracted from the steam turbine, the more power the steam can deliver to the steam turbine. However, it must also be ensured that there is always sufficient steam mass flow rate available to supply all extraction steam. This is because the higher the steam quality, the higher the steam enthalpy, and the less steam mass flow rate required to provide the heat flow. The problem of steam mass flow rate of the steam power cycle being insufficient arises especially in the 60% partial load case. In this case, less steam is generated than in the nominal load. However, the steam mass flow rate extracted from the steam cycle for synthesis gas production remains constant. Only the heat flow for gas preheating is adjusted, since as the synthesis gas mass flow rate into the gas turbine decreases, the heat flow required to preheat the gas also decreases. As can be seen from Table 10, a heat flow of 48.73 MWth is required at full load. Accordingly, a heat flow of 39.98 MWth results in the 80% load case and 29.24 MWth for the 60% load case. The extractions of the AGR are attached to the low-pressure turbine in the sequence of H2S reboiler, high-pressure CO2 reboiler, and low-pressure CO2 reboiler (at 3 bar, 2.5 bar, and 1.5 bar) (decreasing according to minimum temperature). The amount of the heat flow is determined in EBSILON Professional via a control element. For the performance of the plant, it would also be useful to remove the extracted gas preheating from the low-pressure turbine. However, if the steam is extracted in the low-pressure turbine, the problem mentioned above arises, which occurs in the 60% load case, while the low steam mass flow rate is available to supply all extractions with the predefined mass flow rates. For this reason, high-quality steam is extracted upstream of the intermediate-pressure turbine for gas preheating, since a lower mass flow rate is required, and all extractions can be supplied in any load case.
Finally, the cooling of the raw gas is integrated with the HRSG as heat input. The raw gas has to be cooled from a temperature of 950 to about 250 °C to deliver 86.96 MWth to the HRSG system. In the EBSILON professional model, the hot raw gas is fed through the IP-EVAP because the raw gas can be cooled down to 250 °C due to the steam outlet temperature of 222 °C of the intermediate pressure steam.
Therefore, the raw gas can be cooled down to the desired temperature in a single heat exchanger. To achieve the outlet temperature of 250 °C, the pinch point (outlet temperature of the raw gas minus outlet temperature of the saturated steam) is defined at 28 °C. Since the raw gas with the heat flow of 86.96 MWth generates more intermediate pressure steam than in the previous model, the value of the saturated water withdrawal in the low-pressure drum has to be adjusted. No additional heat of the gas turbine flue gas is required. As a result, the flue gas is led around the IP-EVAP and thus has more heat energy available for the heat exchangers that enter the HRSG later. This leads to an increase in the low-pressure steam mass flow rate.
The power of the steam power plant of the model in all load cases calculated numerically is shown in Table 10. These values are used as reference values for the following optimization of the extractions.

6.2. Optimization of Predefined Extractions

In the following sections, possibilities for optimizing the performance of the steam power process including the extractions are examined. The goal of the optimization is to adapt the steam of the extractions as exactly as possible to their boundary conditions since high-quality steam is extracted from the system, which is not required for the production of synthesis gas. The possibilities to optimize the model are to vary the extraction point and to adapt the mass flow of some extractions to the boundary conditions of the EBSILON Professional model. Another possibility is to modify the location of the heat input of the raw gas cooler in the HRGS. The ultimate option is modification of the three pressures system to allow new variations of the extraction points.

6.2.1. Optimization of WTA Dryer Extraction

The steam used for WTA dryer has a pressure of 4.2 bar. The Aspen plus value corresponds to the saturated steam temperature, which is 145.4 °C. In the EBSILON professional model, however, superheated steam with a temperature of 326.3 °C is removed from the turbine. A condenser is used for heat extraction in WTA dryer. In the case of superheated steam, superheating and condensation heat are available. Consequently less steam mass flow is required to provide the heat demand. As a result, the steam requirement for superheated steam is reduced from 56.46 to 46.367 kg/s. Table 11 compares the output power of the system after adjusting the steam mass flow of the WTA dryer process to the reference values. Since the steam mass reduction is approx. 10 kg/s, more mass flow is expanded into the subsequent turbine stages; hence, the capacities increase significantly in all load cases.

6.2.2. Optimization of Gas Preheating and Acid Gas Removal Extractions

Due to the reduction of the steam mass flow for WTA dryer, more steam is available for the extractions of gas preheating and the AGR. This issue solves the problem that appeared in the 60% partial load case, when there was insufficient steam available for the last extractions. Accordingly, the extractions can be installed in the low-pressure turbine without restrictions. As the steam for the gas preheating must always have a minimum temperature of 160 °C, it is taken from the low-pressure turbine at a pressure of 1.5 bar. The AGR reboiler extractions are installed at 0.8 bar in the turbine. The performance could be further improved slightly by reducing the extraction pressure of the AGR. However, if the pressure were to be lowered further, significantly larger pipe diameters would be required due to pipe friction pressure losses, which would affect economy and space. For the full-load case, this optimization resulted in a performance improvement of the steam turbine of 12.8% in contrast to the new values from Table 11 (6.9% in the 80% load case and 9.5% at 60%). This significant performance improvement is due to the optimization of the gas preheating extractions since this high-quality steam was extracted before the intermediate-pressure turbine.
The effects on output of integrating the gas preheater extraction into the HRSG instead of extracting it from the turbine were also investigated. Saturated intermediate or high-pressure steam was used for the gas preheater mass flow. This means that less mass flow was required to be superheated, so more heat was available for evaporation. However, both cases had lower performance outputs compared to the model when integrated with the gas preheating extraction installed in the low-pressure turbine, since low-pressure steam has a major effect on the turbine output. Consequently, these ideas were discarded.

6.2.3. Optimization of Gasifier and WGS Extractions

Due to the necessary boundary conditions, the extractions of the gasifier and the WGS shift reaction could not be further optimized in the existing model. The steam for the gasifier must have maximum temperatures. Saturated steam is required for the WGS. Both require a steam pressure of 35 bar. Since these boundary conditions are only present upstream or in the high-pressure turbine, the extractions must be installed there. In the present model, steam is extracted at a pressure of 97.7 bar for the gasifier and superheated steam at 35 bar and a temperature of about 400 °C for the WGS. Therefore, the goal should be to create possibilities to adapt these extractions to their boundary conditions by modifying the process. Modification of the intermediate pressure of the plant would be a viable option. The intermediate-pressure steam at the outlet of the HT-RH is at the same temperature as the high-pressure steam at the outlet of the HPHT-SH. If the intermediate pressure is modified at least 35 bar in each load case, the gasifier extraction can be installed there. This modification also provides a new extraction option for WGS extraction. Since the pressure of the intermediate-pressure steam at the outlet is always at least 35 bar, the steam at the outlet of the intermediate-pressure evaporator also has a minimum pressure of at least 35 bar. This means that the saturated steam for the WGS can be extracted at this point.

6.2.4. Modification of the Intermediate Pressure System

The aim of the modification was to increase the intermediate pressure to a value of at least 35 bar in each load case. Since the pressure decreases at partial load, the lowest load case investigated (60% partial load case) was considered. In this load case, the mean pressure of the EBSILON Professional model is 17.7 bar. This is now set to a value of 35 bar at the outlet of the HTRH. The intermediate pressure at 80% and 100% load cases can be calculated from the ratio of the pressures of the different load cases. This ratio can be calculated from the unmodified model. Accordingly, the intermediate pressure at 80% is 40.3 bar and for the 100% load case is 42.3 bar. The saturated steam at the outlet of the intermediate pressure drum has a pressure of 44.62 bar at full load. At 80%, the pressure is 42.83 bar and at 60%, 37.14 bar. However, for a gas and steam power plant with three pressure stages, there is an optimum pressure ratio of the three pressure stages at which the maximum output is achieved. Here, the pressure ratio of the original model is optimal because it was modelled based on the design data, which was designed to maximize efficiency. Accordingly, a change in the average pressure results in a degradation of the plant’s output. Table 12 compares the output of the synthesis model in Table 7 to the output after the pressure modification.
It was found that the output declined mainly at part load. This decline at part load is due to the throttling of the high-pressure steam before mixing with the intermediate-pressure steam. The outlet flow of the high-pressure turbine must always have a pressure of 44 bar. This is because the pressure of the high-pressure steam is always reduced to the pressure of the intermediate-pressure steam, which is 43.6 bar at full load. Since the pressure differences of the load cases are much larger after the modification, the pressure of the high-pressure steam must be reduced more in the partial load cases. In the 60% case, for example, the throttle reduces the pressure of the high-pressure steam approximately 8.0 bar. This leads to a large pressure reduction without using it energetically. In addition, the mass flow for WTA dryer extraction must be increased because the temperature of the superheated steam has dropped to 147 °C at 4.2 bar. A mass flow of 50.68 kg/s is now required.

6.2.5. Variation of the Gasifier and WGS Extractions

The modification that was carried out allowed the positions for the WGS and gasifier extractions to be varied. The WGS extraction was varied. After the intermediate pressure drum, the steam is extracted instead of the high-pressure turbine. A steam mass flow of 21.55 kg/s is required. This is provided in each load case as the intermediate pressure mass flow evaporates with the benefit of the raw gas cooler. Regardless of the load case, the raw gas provides 86.96 MWth of heat to the heat exchanger, evaporating 50.20 kg/s of mass flow rate. This variation in WGS extraction resulted in a further 7.7% improvement in output at full load (12.0% at 80% part-load and 12.8% at 60%), despite the drop in output due to the change in pressure. The gasifier extraction was varied. This was located after the HT-RH instead of the HPHT-SH, since the steam has maximum temperatures there. However, this variation in extraction only resulted in a further output improvement of less than 1% in all load cases. This small improvement is due to more high-pressure steam mass flow being returned to the reheater section, since the gas preheater extraction points no longer receive high-pressure steam. Consequently, more steam mass flow must be heated to the specified temperature in the reheaters, requiring more heating energy. In addition, the quality of the superheated intermediate-pressure steam is only slightly lower than that of the superheated high-pressure steam.
However, this modification of the intermediate pressure limits the plant to a partial load performance of 60%, since the pressure of 35 bar was defined for the 60% load case according to the HT-RH. If the plant were to run at less load, the pressure of the steam would drop below 35 bar, violating the boundary conditions of the gasifier extraction.

6.2.6. Optimizing the Heat Input of the Raw Gas Cooler

A high raw gas temperatures of 950 °C is the most effective to integrate the heat input of the raw gas cooler into the HRSG at the earliest possible stage. By integrating the heat of the raw gas cooler into HRSG at an early stage, higher or intermediate-pressure steam can be generated, which has a profound influence on the output of the steam turbine. The heat from the raw gas was fed into the IP-EVAP in previous cases, as the raw gas could be cooled to the desired temperature in this heat exchanger. Since the raw gas is cooled to a temperature of 250-300 °C, all the heat can be removed. Now the heat input is transferred to the HP-EVAP. There is a pressure of 102.6 bar in the HP-EVAP and, accordingly, the evaporation temperature is 312.9 °C. This means that the raw gas cannot be cooled down to the required temperature, since the raw gas temperature must not drop below the evaporation temperature. Therefore, the raw gas is then passed through the HPIT-ECON, where the saturated water has an inlet temperature of 246.1 °C. This allows the flue gas to be cooled down to 250 °C. Due to the modification, the TTD of the heat exchangers should be adjusted. Since the raw gas should provide as much heat as possible to the HP-EVAP, the pinch point of the evaporator unit is set to 4 °C. To achieve the outlet temperature of 250 °C for the flue gas in the HPIT-ECON, the TTD of this heat exchanger is set to 52 °C. As the flue gas from the steam turbine flows around the HP-EVAP, it has a temperature 100 °C higher upstream of the HPHT-ECON than in the previous model. To prevent the water in the economizer from evaporating, the efficiency of the HPHT-ECON is increased by 100 °C. This applies analogously to the LP-SH, which is why the TTD of this heat exchanger has also been increased by 100 °C. The TTD of the IP superheater does not need to be adjusted because the intermediate pressure steam in the superheated system is superheated regardless. The hotter the steam before the reheater system, the less heat required for the reheater. The much higher temperature of the flue gas is finally converted to the IP-EVAP. The higher flue gas temperature means that more intermediate-pressure steam can be generated in the IP-EVAP.
Modification of the heat input of the raw gas cooler achieved only a performance improvement of less than 0.6% in all load cases compared to the performance of the already optimized model. However, in this case, the economics of the system should be considered. When the heat input is transferred to the HP-EVAP, new requirements arise for the raw gas cooler. This must be designed for high pressures. The large wall thicknesses required for this causes increased thermal stresses that have to be controlled. Since the performance of the steam turbine could be improved only slightly, the new technical, and thus economic, requirements predominate. Therefore, an optimization of the heat input of the raw gas cooler was discarded and the heat flow continued to be integrated with the IP-EVAP.

6.2.7. Optimized Model

This section summarizes the final optimized model. Since only the steam mass flow for the WTA dryer was adjusted, it was still installed in the intermediate pressure turbine at 4.2 bar. In the model, the heat flows for gas preheating and acid gas removal are removed from the low-pressure turbine (gas preheating at 1.5 bar and acid gas removal at 0.8 bar). The gasifier extraction is located downstream of the HT-RH, while the WGS reaction saturated steam is extracted from the HRSG downstream of the intermediate pressure evaporator. The heat input of the raw gas cooler remains unchanged for the IP-EVAP. Table 13 shows the output of the optimized model compared to the output of the reference case. For all load cases, a significant relative output increase of more than 30% was achieved. The output increase in the 60% load case of 45.9% is possibly due to the adjustment of the intermediate pressure to the 60% load case.

6.3. Assessment of the Optimizations

Finally, a sensitivity analysis was carried out for the optimized model. Using a sensitivity analysis, the effects of variations in the extraction mass flows can be presented. Thus, the effects of unpredictable deviations of the extraction mass flows, as well as targeted variations of the mass flows, can be predicted. For the sensitivity analysis, the steam mass flow of the extractions was varied successively by ∓10% and the output of the steam turbine was calculated numerically. The power deviation per kg of varied steam mass flow was calculated according to the Equation (10).
P o w e r   D e v i a t i o n = | P S T ,   r e f P S T , 10 % m ˙ e x t r a c t i o n , 10 % |
The absolute value is used because only the magnitude of the deviation is relevant. Figure 6 lists the output deviations of the different extractions in the three load cases. This clearly shows that the deviations are independent of the load case, as the values of the load cases of an extraction hardly change. The largest output deviation in MWel of electrical output per kg/s of steam resulted for the gasifier extraction with a value of about 1.23 MWel/kg/s. Since both the heat contribution of the raw gas cooler and the extraction for the WGS reaction reduce the saturated intermediate pressure mass flow, they had an equal influence on the output and a value of about 0.8 MWel/kg/s. This is followed by WTA dryer with a power deviation of 0.62 MWel/kg/s, gas preheater extraction with 0.43 MWel/kg/s, and finally extraction for the reboiler with a value of 0.35 MWel/kg/s.
For the evaluation of the process, the exergetic efficiency for the taps was also determined. The approach of the exergetic evaluation allows a consideration of the influence of additional steam consumers and suppliers on the electrical power supply of the plant independent of a concrete integration of the water-steam cycle into the polygeneration process. The exergetic evaluation of the steam flows in the CCPP process was performed by deriving the gross electrical power of the plant according to the steam flow of the corresponding quality (Equation (11)). As a result, the specific electrical energy content of the steam flow can be determined.
e e l ( p , T ) = d P e l d m ˙ s t e a m ( p , T )
η e x ( p , T ) = e e l ( p , T ) e e x ( p , T )
In the process model, the derivation was approximated by the finite difference method in a range of about ±10% around the nominal values of the mass flows, which was performed for the 60% load case as well as for the 100% load case. The ambient pressure was set to standard conditions and the ambient temperature was 10 °C. The results are shown in Figure 7. The exergetic efficiency for the taps is given by Equation (12). For the tapping of the superheated steam at the intermediate pressure turbine, this was just under 80%. With decreasing steam quality, the realizable exergetic efficiency in the steam power process also decreased. Tapping the low-pressure steam for the reboiler of the acid gas scrubber had an exergetic efficiency of only 60%.
It is noticeable that the higher the quality of the extracted steam, the greater the influence on the output of the gas turbine when the extraction steam mass flow is varied. This relation is shown in Figure 8. Here, the value of the power deviation per kg/s of steam was taken over the exergy of the respective steam. There is a linear relationship between the power deviation and the exergy, and thus the quality of the steam.

7. Conclusions

IGCC power plants with polygeneration offer the possibility of flexible power production as compensation for the fluctuating power generation of renewable energies. Even an improvement of the steam power process has a major impact on the overall performance of the plant. Therefore, in this study, a model of a conventionally fired gas and steam power plant with a three-pressure system was created in the program EBSILON Professional. This was then validated at the 100% full load case as well as 80% and 60% partial load cases based on measurement data of the real plant. The validated model was modified to use synthesis gas since an IGCC is fired with synthesis gas. This was followed by the integration of the predefined extractions and their optimization concerning the performance of the steam turbine. The following essential points resulted from this study:
  • The numerical model created in EBSILON Professional can quantitatively represent the real plant in the different load cases. Especially for the values of pressure and temperature, relative errors below 1% were found. For the mass flow, there were somewhat higher deviations from the measured data. For this reason, the performance of the steam turbine of the model was compared to the performance of the steam turbine under the conditions of the measurements. This resulted in relative errors below 5% in all load cases. Thus, the model was considered valid.
  • The model was successfully modified to use synthesis gas, and predefined extractions were integrated. The output of the steam turbine of the model was 71.3 MWel at 100% load, 54.6 MWel at 80% load, and 39.6 MWel at 60% load. These values were selected as reference values for the optimization.
  • The optimization allowed the output of the steam turbine to be significantly increased in all three load cases. In the 100% load case, there was a relative increase in output of the steam turbine of 34.2% with an output value of 95.7 MWel. The output increase at 80% load was 35.9% (74.2 MWel) and at 60% load 45.9% (57.8 MWel).
Based on this work, it is interesting to examine the system in terms of economic efficiency, since in this study only the optimization of performance was examined. The optimization of the entire IGCC plant with the boundary conditions of the optimized HRSG model is a topic of further research.

Author Contributions

Conceptualization, methodology, validation, investigation, resources, writing—original draft, writing—review and editing, visualization, A.B.A.; methodology, software, validation, P.M.S.; methodology, software, investigation, resources, visualization, writing—review and editing, C.H.; conceptualization, methodology, software, investigation, resources, visualization, writing—review and editing, F.A.; resources, supervision, B.E. All authors have read and agreed to the published version of the manuscript.

Funding

The research received funding from the 6th Program on Energy Research of the Federal Ministry for Economic Affairs and Energy of Germany under grant agreement No. 03ET7048A (FABIENE; Flexible Supply of Electricity and Fuels from Gasification of Lignite in a Fluidized Bed). The funding is gratefully acknowledged.

Institutional Review Board Statement

Not applicable.

Informed Consent Statement

Not applicable.

Acknowledgments

We acknowledge support by the Deutsche Forschungsgemeinschaft (DFG–German Research Foundation) and the Open Access Publishing Fund of Technical University of Darmstadt.

Conflicts of Interest

The authors declare no conflict of interest.

Abbreviations

AGRAcid Gas Removal
CCPPCombined Cycle Power Plant
ECONEconomizer
EVAPEvaporator
FGFlue Gas
FWFeedwater
GGenerator
GTGas Turbine
GUIGraphical user interface
HPHigh Pressure
HRSGHeat Recovery Steam Generator
HTHigh Temperature
IGCCIntegrated Gasification Combined Cycle
IPIntermediate Pressure
LPLow Pressure
RHReheater
SHSuperheater
STSteam Turbine
TTDTerminal Temperature Difference
WGSWater Gas Shift
WTAFluidized-Bed Drying Process

References

  1. Arto, I.; Capellán-Pérez, I.; Lago, R.; Bueno, G.; Bermejo, R. The energy requirements of a developed world. Energy Sustain. Dev. 2016, 33, 1–13. [Google Scholar] [CrossRef] [Green Version]
  2. Klare, M.T. Rising Powers, Shrinking Planet: The New Geopolitics of Energy; Henry Holt and Co.: New York, NY, USA, 2009. [Google Scholar]
  3. Lambert, J.G.; Hall, C.A.S.; Balogh, S.; Gupta, A.; Arnold, M. Energy, EROI and quality of life. Energy Policy 2014, 64, 153–167. [Google Scholar] [CrossRef] [Green Version]
  4. Di Muzio, T. Energy, Capital as Power and World Order. In The Palgrave Handbook of Critical International Political Economy; Palgrave Macmillan: London, UK, 2016; pp. 267–287. [Google Scholar] [CrossRef] [Green Version]
  5. IEA. Global Energy Review 2020; IEA: Paris, France, 2020. [Google Scholar]
  6. IEA. CO2 Emissions from Fuel Combustion: Overview; IEA: Paris, France, 2020. [Google Scholar]
  7. Dröge, S. The Paris Agreement 2015, Turning Point for the International Climate Regime; Stiftung Wissenschaft und Politik -SWP- Deutsches Institut für Internationale Politik und Sicherheit: Berlin, Germany, 2016; Volume 4. [Google Scholar]
  8. Lund, H. Large-scale integration of wind power into different energy systems. Energy 2005, 30, 2402–2412. [Google Scholar] [CrossRef]
  9. Alshahrani, A.; Omer, S.; Su, Y.; Mohamed, E.; Alotaibi, S. The Technical Challenges Facing the Integration of Small-Scale and Large-scale PV Systems into the Grid: A Critical Review. Electronics 2019, 8, 1443. [Google Scholar] [CrossRef] [Green Version]
  10. Verzijlbergh, R.A.; De Vries, L.J.; Dijkema, G.P.J.; Herder, P.M. Institutional challenges caused by the integration of renewable energy sources in the European electricity sector. Renew. Sustain. Energy Rev. 2017, 75, 660–667. [Google Scholar] [CrossRef] [Green Version]
  11. Parraga, J.; Khalilpour, K.R.; Vassallo, A. Polyfeed and polyproduct integrated gasification systems. In Polygeneration with Polystorage: For Chemical and Energy Hubs; Elsevier: Amsterdam, The Netherlands, 2018; pp. 175–212. [Google Scholar] [CrossRef]
  12. Shi, B.; Wen, F.; Wu, W. Performance evaluation of air-blown IGCC polygeneration plants using chemical looping hydrogen generation and methanol synthesis loop. Energy 2020, 200, 117564. [Google Scholar] [CrossRef]
  13. Cocco, D.; Serra, F.; Tola, V. Assessment of energy and economic benefits arising from syngas storage in IGCC power plants. Energy 2013, 58, 635–643. [Google Scholar] [CrossRef]
  14. Liu, G.; Larson, E.D.; Williams, R.H.; Kreutz, T.G.; Guo, X. Making Fischer-Tropsch Fuels and Electricity from Coal and Biomass: Performance and Cost Analysis. Energy Fuels 2011, 25, 415–437. [Google Scholar] [CrossRef]
  15. Liu, P.; Gerogiorgis, D.I.; Pistikopoulos, E.N. Modeling and optimization of polygeneration energy systems. Catal. Today 2007, 127, 347–359. [Google Scholar] [CrossRef]
  16. Hoang, T.-D.; Pawluskiewicz, D.K.; Kazimierz Pawluskiewicz, D. The efficiency analysis of different combined cycle power plants based on the impact of selected parameters Optimization of Rotor bearing systems View project Optimal geometrics of an air cooled heat sink View project The efficiency analysis of different combined cycle power plants based on the impact of selected parameters. Artic. Int. J. Smart Grid Clean Energy 2016. [Google Scholar] [CrossRef]
  17. Descamps, C.; Bouallou, C.; Kanniche, M. Efficiency of an Integrated Gasification Combined Cycle (IGCC) power plant including CO2 removal. Energy 2008, 33, 874–881. [Google Scholar] [CrossRef]
  18. Gräbner, M.; Morstein, O.; von Rappold, D.; Günster, W.; Beysel, G.; Meyer, B. Constructability study on a German reference IGCC power plant with and without CO2-capture for hard coal and lignite. Energy Convers. Manag. 2010, 51, 2179–2187. [Google Scholar] [CrossRef]
  19. Higman, C.; van der Burgt, M. Gasification; Elsevier Inc.: Amsterdam, The Netherlands, 2008. [Google Scholar] [CrossRef]
  20. Wang, T.; Stiegel, G. Integrated Gasification Combined Cycle (IGCC) Technologies; Elsevier Inc.: Amsterdam, The Netherlands, 2016. [Google Scholar] [CrossRef]
  21. Gonzalez-Salazar, M.A.; Kirsten, T.; Prchlik, L. Review of the operational flexibility and emissions of gas- and coal-fired power plants in a future with growing renewables. Renew. Sustain. Energy Rev. 2018, 82, 1497–1513. [Google Scholar] [CrossRef]
  22. Heinze, C.; May, J.; Peters, J.; Ströhle, J.; Epple, B. Techno-economic assessment of polygeneration based on fluidized bed gasification. Fuel 2019, 250, 285–291. [Google Scholar] [CrossRef]
  23. Segurado, R.; Pereira, S.; Correia, D.; Costa, M. Techno-economic analysis of a trigeneration system based on biomass gasification. Renew. Sustain. Energy Rev. 2019, 103, 501–514. [Google Scholar] [CrossRef]
  24. Shi, B.; Xu, W.; Wu, E.; Wu, W.; Kuo, P.C. Novel design of integrated gasification combined cycle (IGCC) power plants with CO2 capture. J. Clean. Prod. 2018, 195, 176–186. [Google Scholar] [CrossRef]
  25. Giuffrida, A.; Romano, M.C.; Lozza, G. Efficiency enhancement in IGCC power plants with air-blown gasification and hot gas clean-up. Energy 2013, 53, 221–229. [Google Scholar] [CrossRef]
  26. Cormos, C.C. Evaluation of energy integration aspects for IGCC-based hydrogen and electricity co-production with carbon capture and storage. Int. J. Hydrogen Energy 2010, 35, 7485–7497. [Google Scholar] [CrossRef]
  27. Gaspar, J.; Cormos, A.M. Dynamic modeling and absorption capacity assessment of CO2 capture process. Int. J. Greenh. Gas Control. 2012, 8, 45–55. [Google Scholar] [CrossRef]
  28. Lee, J.C.; Lee, H.H.; Joo, Y.J.; Lee, C.H.; Oh, M. Process simulation and thermodynamic analysis of an IGCC (integrated gasification combined cycle) plant with an entrained coal gasifier. Energy 2014, 64, 58–68. [Google Scholar] [CrossRef]
  29. Lee, C.; Lee, S.J.; Yun, Y. Effect of air separation unit integration on integrated gasification combined cycle performance and NOx emission characteristics. Korean J. Chem. Eng. 2007, 24, 368–373. [Google Scholar] [CrossRef]
  30. Gharaie, M.; Jobson, M.; Panjeshahi, M.H.; Zhang, N.; Smith, R. Techno-economic optimization of IGCC integrated with utility system for CO2 emissions reduction—Simultaneous heat and power generation from IGCC. Chem. Eng. Res. Des. 2015, 94, 428–439. [Google Scholar] [CrossRef]
  31. Frey, H.C.; Zhu, Y. Improved System Integration for Integrated Gasification Combined Cycle (IGCC) Systems. Environ. Sci. Technol. 2006, 40, 1693–1699. [Google Scholar] [CrossRef] [PubMed]
  32. Zhang, X.; Zhang, R.; Liu, H.; Gao, H.; Liang, Z. Evaluating CO2 desorption performance in CO2-loaded aqueous tri-solvent blend amines with and without solid acid catalysts. Appl. Energy 2018, 218, 417–429. [Google Scholar] [CrossRef]
  33. Mondol, J.D.; McIlveen-Wright, D.; Rezvani, S.; Huang, Y.; Hewitt, N. Techno-economic evaluation of advanced IGCC lignite coal fuelled power plants with CO2 capture. Fuel 2009, 88, 2495–2506. [Google Scholar] [CrossRef]
  34. Majoumerd, M.M.; Raas, H.; Jana, K.; De, S.; Assadi, M. Coal Quality Effects on the Performance of an IGCC Power Plant with CO2 Capture in India. Energy Procedia 2017, 114, 6478–6489. [Google Scholar] [CrossRef]
  35. Li, Z.; Liang, X.; Xue, Y. Techno-economic comparison of IGCC systems employing bituminous and lignite. Zhongguo Dianji Gongcheng Xuebao. Chin. Soc. Electr. Eng. 2012, 32, 39–47. [Google Scholar]
  36. Bonalumi, D.; Ciavatta, A.; Giuffrida, A. Thermodynamic Assessment of Cooled and Chilled Ammonia-based CO2 Capture in Air-Blown IGCC Plants. Energy Procedia 2016, 86, 272–281. [Google Scholar] [CrossRef] [Green Version]
  37. Sheikh, H.M.; Ullah, A.; Hong, K.; Zaman, M. Thermo-economic analysis of integrated gasification combined cycle (IGCC) power plant with carbon capture. Chem. Eng. Process.-Process. Intensif. 2018, 128, 53–62. [Google Scholar] [CrossRef]
  38. Sofia, D.; Coca Llano, P.; Giuliano, A.; Iborra Hernández, M.; García Peña, F.; Barletta, D. Co-gasification of coal–petcoke and biomass in the Puertollano IGCC power plant. Chem. Eng. Res. Des. 2014, 92, 1428–1440. [Google Scholar] [CrossRef]
  39. Thallam Thattai, A.; Oldenbroek, V.; Schoenmakers, L.; Woudstra, T.; Aravind, P.V. Experimental model validation and thermodynamic assessment on high percentage (up to 70%) biomass co-gasification at the 253 MWe integrated gasification combined cycle power plant in Buggenum, The Netherlands. Appl. Energy 2016, 168, 381–393. [Google Scholar] [CrossRef] [Green Version]
  40. Cormos, C.C. Integrated assessment of IGCC power generation technology with carbon capture and storage (CCS). Energy 2012, 42, 434–445. [Google Scholar] [CrossRef]
  41. Cau, G.; Tola, V.; Deiana, P. Comparative performance assessment of USC and IGCC power plants integrated with CO2 capture systems. Fuel 2014, 116, 820–833. [Google Scholar] [CrossRef]
  42. Bany Ata, A.; Alobaid, F.; Heinze, C.; Almoslh, A.; Sanfeliu, A.; Epple, B. Comparison and validation of three process simulation programs during warm start-up procedure of a combined cycle power plant. Energy Convers. Manag. 2020, 207, 112547. [Google Scholar] [CrossRef]
  43. Alobaid, F.; Postler, R.; Ströhle, J.; Epple, B.; Kim, H.G. Modeling and investigation start-up procedures of a combined cycle power plant. Appl. Energy 2008, 85, 1173–1189. [Google Scholar] [CrossRef]
  44. Alobaid, F.; Karner, K.; Belz, J.; Epple, B.; Kim, H.G. Numerical and experimental study of a heat recovery steam generator during start-up procedure. Energy 2014, 64, 1057–1070. [Google Scholar] [CrossRef]
  45. GmbH SES. STEAG EBSILON n.d. Available online: https://www.ebsilon.com/en/ (accessed on 17 February 2021).
  46. GmbH SES. EBSILON® Professional The Planning Tool for the Power Plant Process; STEAG Energy Services GmbH: Zwingenberg, Germany, 2021. [Google Scholar]
  47. Wolfersdorf, C.; Meyer, B. The current status and future prospects for IGCC systems. In Integrated Gasification Combined Cycle (IGCC) Technologies; Woodhead Publishing: Sawston, UK, 2017; pp. 847–889. [Google Scholar] [CrossRef]
  48. Gadde, S.; Wu, J.; Gulati, A.; McQuiggan, G.; Koestlin, B.; Prade, B. Syngas capable combustion systems development for advanced gas turbines. In Proceedings of the ASME Turbo Expo, Barcelona, Spain, 6–11 May 2006; American Society of Mechanical Engineers Digital Collection: New York, NY, USA, 2006; Volume 4, pp. 547–554. [Google Scholar] [CrossRef] [Green Version]
  49. Daniel Brdar, R.; Jones, R.M. GE Power Systems GE IGCC Technology and Experience with Advanced Gas Turbines; GE Power Systems: Schenectady, NY, USA, 2000. [Google Scholar]
Figure 1. Block flow diagram of IGCC layout.
Energies 14 07285 g001
Figure 2. Process flow diagram of the reference CCPP.
Energies 14 07285 g002
Figure 3. Components of EBSILON Professional.
Energies 14 07285 g003
Figure 4. Subcritical steam cycle of reference CCPP simulation model flow sheet.
Energies 14 07285 g004
Figure 5. Steam power process with tapping and heat integration. (1) Water-gas shift; (2) raw gas cooler and methanol synthesis; (3) HTW gasifier; (4) WTA drying; (5) Acid Gas Removal.
Energies 14 07285 g005
Figure 6. Output deviations of the different extractions at the three load cases.
Energies 14 07285 g006
Figure 7. Specific electrical energy content of steam extractions.
Energies 14 07285 g007
Figure 8. Correlation between power deviation and steam exergy.
Energies 14 07285 g008
Table 1. Technical data of the HRSG of the reference CCPP.
HRSG Outlet Steam Parameters
Pressure (bar)Temperature (°C)Mass Flowrate (kg/s)
HP97.756778.2
RH/IP21.456783.2
LP4.12939.8
Condenser0.0523593
Flue gas parameters
Mass flowrate (kg/s) 587
Temperature (°C)Inlet628
Outlet81
Power generation units
Gas turbine power (MWel)220
Steam turbine power (MWel)140
Table 2. Heat and steam integration for the steam power process.
ExtractionPresser (bar)Temperature (°C)
Steam extraction
WTA drying 4.2Sat. Steam
HTW gasifier 35560
Water-gas shift 35Sat. Steam
Heat consumers
Acid gas removal (reboiler) Sat. Steam90
Preheating gas turbine 180
Heat suppliers
Raw gas cooler Sat. Steam<260
Methanol synthesisSat. Steam<260
Table 3. Comparison of Parameters at the outputs of HPHT-SH at different load cases.
Load100%80%60%
Mass flow rate
(kg/s)
Operational Data78.20 66.90 58.30
Simulation Results77.63 65.81 57.34
Relative Error−0.73%−1.63%−1.65%
Temperature
(°C)
Operational Data567.00 566.80 566.90
Simulation Results567.00 567.00 567.00
Relative Error0.00%0.04%0.02%
Pressure
(bar)
Operational Data97.70 88.00 76.20
Simulation Results97.70 88.00 76.20
Relative Error0%0%0%
Table 4. Comparison of Parameters at the outputs of HT-RH at different load cases.
Load100%80%60%
Mass flow rate
(kg/s)
Operational Data83.274.764.9
Simulation Results83.5374.8663.31
Relative Error0.40%0.21%−2.45%
Temperature
(°C)
Operational Data567567566.9
Simulation Results567567567
Relative Error0.00%0.00%0.02%
Pressure
(bar)
Operational Data21.420.617.7
Simulation Results21.420.617.7
Relative Error0%0%0%
Table 5. Comparison of parameters at the outputs of LP-SH at different load cases.
Load100%80%60%
Mass flow rate
(kg/s)
Operational Data9.87.76.4
Simulation Results9.938.316.757
Relative Error1.33%7.92%5.58%
Temperature
(°C)
Operational Data293289.9281
Simulation Results292.52289.91282
Relative Error−0.16%0.00%0.36%
Pressure
(bar)
Operational Data4.13.93.3
Simulation Results4.13.93.3
Relative Error0%0%0%
Table 6. Comparison of steam turbine power (MWel).
LoadOperational DataSimulation ResultsRelative Error
100%131.82133.831.52%
80%114.41113.26−1.01%
60%96.0893.86−2.31%
Table 7. Outputs of the steam turbine combined by synthetic GT and natural gas GT [MWel].
LoadWith Synthetic GTWith Natural Gas GTDeviation
100%128.27133.83−4.15%
80%109.62113.26−3.21%
60%94.5793.86+0.76
Table 8. Required extractions with the mass flow specification.
ExtractionsTemperature
(°C)
Pressure
(bar)
Mass Flow Rate
(kg/s)
WTA dryer145.444.256.46
Gasifier560965.02
WGS/CO shift242.583521.55
Table 9. Required extractions with the heat flow specification.
ExtractionsPower
(MWth)
Minimum Temperature
(°C)
CO2 HP Reboiler9.6626.75
CO2 LP Reboiler4.3521.35
H2S Reboiler21.4865.01
Gas preheater48.73160
Table 10. Power of the steam turbine of the reference case in all load cases.
LoadST Power (MWel)
100%71.3
80%54.6
60%39.6
Table 11. The Output of ST with new WTA dryer mass flow rate.
LoadReference OutputModified Model OutputImprovement
100%71.3178.46+10.0%
80%54.6461.71+12.9%
60%39.6746.74+17.8%
Table 12. Output of ST with the synthesis gas turbine before and after pressure modification (MWel).
LoadReference OutputModified Pressure Model OutputImprovement (%)
100%128.27125.95−1.04%
80%109.6298.79−5.62%
60%94.5783.09−9.85%
Table 13. Steam turbine output in all load cases after optimization (MWel).
LoadReference OutputModified Model OutputImprovement
100%71.395.7+34.2%
80%54.674.2+35.9%
60%39.657.8+45.9%
Publisher’s Note: MDPI stays neutral with regard to jurisdictional claims in published maps and institutional affiliations.

