1. Introduction
As the transition to a low-carbon economy is continuously being discussed at an international level, private sector industries are obliged to voluntarily reduce carbon emissions through production reduction, adaptation, financial reallocation, technology investment, and so on [
1,
2,
3]. The establishment in 1988 of the Intergovernmental Panel on Climate Change (IPCC) to discuss and find ways to mitigate climate change was followed by the adoption of the UN Framework Convention on Climate Change (UNFCCC) in 1992. With the adoption of the Kyoto Protocol in 1997, developed countries were obligated to reduce greenhouse gas (GHG) emissions [
4]. Further, in the Paris Agreement, adopted in 2015, a bottom-up method was imposed on both developed and developing countries, in which each member state sets its own targets for the nationally determined contribution (NDC), according to the country’s conditions and capabilities [
5].
National implementation of carbon neutrality has become inevitable across the world as the major participants, namely the EU, the United States, and China, have recently declared that net-zero will be achieved by 2050 [
6]. In July 2021, the European Commission (EC) announced ‘Fit for 55’, a carbon emission reduction target, which includes initiating a carbon border adjustment policy in 2026 that imposes carbon emission tax on “dirty” products (e.g., steel, aluminum, cement, etc.) imported from outside the EU [
7]. Specifically, the target is to achieve carbon neutrality by reducing the net carbon emissions of EU member states to 55% of 1990 levels by 2030 and zero by 2050. The carbon border adjustment policy is expected to significantly affect the exports of Asian countries, as a large proportion of their exports are composed of goods with relatively high carbon emissions compared to those of EU countries [
8]. In addition, the carbon border tax will also be imposed on aircraft and marine fuels used during the transportation of export goods; thus, the utilization of eco-friendly ships and the establishment of related infrastructure are inevitable. Similarly, in the United States, the Biden government has emphasized the introduction of a carbon border tax to promote renewable energy use and improve energy efficiency [
9]. Therefore, when the carbon border tax is initiated globally, industries with high carbon emissions will be subjected to relatively high taxes. In other words, countries that have a comparative advantage in production with green technology are likely to be more competitive in the international market and have the opportunity to expand their export volume. From this perspective, our study defines the climate technology industry (hereinafter, climate industry) and examines the impact of environmental agreements on bilateral trade among countries by employing a Poisson pseudo-maximum likelihood (PPML) estimation with high-dimensional fixed effects (HDFE).
Various approaches to evaluating the effects of climate policy and environmental stringency can be found in the literature. There is empirical evidence of the negative effect of climate policies on international trade; in particular, the connection between such policies and the phenomenon of carbon leakage [
10,
11,
12,
13,
14]. However, climate policy can foster green innovation by promoting investment in green technologies and improving consumer perceptions of the quality of these products and technologies [
11,
15,
16,
17,
18]. With these results in mind, we examined the impact of environmental agreements on trade in the climate industry, with a re-evaluation of the Porter Hypothesis. The Porter Hypothesis suggests that well-designed environmental policies could have positive economic effects such as motivating innovation through improving firm productivity of the brown sector industries [
19,
20].
Our results contribute to the study of climate change policy in several ways. In contrast with the trade classification methods often used in published studies, we utilized different matching techniques that characterize climate industries as technology sets. This is achieved by applying the Organisation for Economic Co-operation and Development (OECD) environment-related technologies (ENV-TECH) classification and harmonized system (HS) to international patent classification (IPC) and cooperative patent classification (CPC) concordance. These classifications are used considering that the development of science and technology is a major factor in determining an industry, and patents contain information that identifies technological and industrial activities. Furthermore, the test provides empirical evidence of the Porter Hypothesis. The results support the conclusion that properly designed environmental policies in accordance with climate change response are conducive to the trade and economic growth of the country. Therefore, it is critical that both developed and developing countries cooperate internationally to combat climate change.
The remainder of this paper is organized as follows.
Section 2 reviews the extant literature on the impact of environmental agreements and climate policies on trade.
Section 3 presents the definition and the international trade patterns of the climate change industry by classifying countries according to the OECD membership.
Section 4 describes the data and model specifications, and
Section 5 provides the empirical results. Finally, policy implications and conclusions are discussed.
2. Literature Review
As climate change has become an increasingly global threat, the international community has begun to cooperate on various regulations and policies. In a 2021 study [
8], researchers estimated the value of the carbon border tax on South Korean exports to the EU, China, and the US, respectively, by differentiating the scenarios by the tax rate. It was found that the estimated carbon border tax of the top 10 export goods in 2030 accounts for an average of 2.38% of the total export volume in the case of the EU and 0.67% in the case of the United States, assuming a carbon border tax rate of 75 US
$/tCO
2. In the case of China, the estimated carbon border tax, assuming a rate of 35 US
$/tCO
2, reaches US
$ 713.6 million in 2030, which is the equivalent of approximately 1.08% of the value of the total export volume from Korea to China.
The question arises as to whether these climate policies actually have an effect and are moving the member states closer to their targets. Many attempts have been made to evaluate the effects of climate policy and environmental stringency using various approaches. Accordingly, we reviewed the literature on international climate agreements, in particular, the Kyoto and Montreal Protocols. We found empirical evidence, from a number of published studies, of the negative impact that climate policies have had on international trade and national economies. Employing difference-in-differences (DID) estimation, Aichele and Felbermayr [
12] examined the impact of Kyoto Protocol commitment on the exports of 34 Kyoto countries by utilizing UN Comtrade data from the period 1997–2007. They suggest that the average treatment effect (ATE) of commitments in the Kyoto Protocol resulted in a decrease of approximately 15–20% in exports, on average. The average treatment effect on the treated (ATT) for a Kyoto member state represented a decrease of approximately 10–13%, of which the most energy-intensive industries (steel, iron, non-ferrous metals, machinery, equipment goods, etc.) were the most affected (Average treatment effect (ATE) was calculated by the mean difference between the outcomes of the treated and controlled groups. The average treatment effect on the treated (ATT) measures the difference between the mean outcome of the treated group and the mean outcome of the controlled group had they been treated. Refer to Khandker et al. [
21] for further explanation). Similarly, by applying the gravity model, Kim [
14] suggested that the Kyoto Protocol negatively affected the bilateral trade of the G20 countries and further reduced the purchasing power of consumers in importing countries in accordance with an increase in the cost of production in exporting countries. Aichele and Felbermayr [
13] investigated the causal relationship between the Kyoto Protocol and carbon leakage by exploiting fixed effects (FE) panel regression using data from 1995–2007. The results of the study suggest that, although the Kyoto Protocol led to more stringent climate policies in member states and reduced territorial carbon emissions, Kyoto policies also caused a shift in the production of carbon-intensive goods to non-Kyoto countries, increasing embodied carbon imports from non-Kyoto countries to Kyoto countries by 8%.
Nevertheless, there seems to be little evidence on the positive economic aspects of climate policies and environmental regulations, possibly due to the difficulty of data processing and the construction of valid indicators. Positive impacts could include green innovation through promoting investment in green technologies by producers, improvement in perceived quality by the consumer, and so on [
11,
15]. According to the Porter hypothesis, polluting firms can benefit from properly crafted environmental regulations when the innovation leads to an increase in firm productivity, which could potentially more than compensate for the cost of compliance [
19,
20]. Ambec et al. [
20] state that there is strong empirical evidence on the relationship between environmental regulation stringency and innovation, although there are conflicting arguments on the relationship between environmental regulation stringency and business performance. As an example, Bu, Qiao, and Liu [
22] proposed that voluntary environmental regulation led to firm innovation in China, and Zhang et al. [
23] reported that green credit regulation policy positively and significantly affected green total factor productivity. On the other hand, He et al. [
16] found that environmental regulation hinders the financial performance of manufacturing firms in China. Along with the Porter hypothesis, the principle of green growth asserts that economic growth and carbon emission reduction can be achieved together by promoting green investments and green infrastructure development [
23]. Kang and Lee [
17] strengthened this argument by demonstrating that environmental regulation proxied by environment-related tax and energy intensity has a positive and significant impact on green exports of high-income countries. Therefore, extending from the existing studies, we classified the climate and non-climate industries, examined the trade trends of these industries, and evaluated the impact of environmental agreements on bilateral trade in the climate industry.
3. Definition of Climate Change Industry
To assess international trade in the climate industry, we classified trade commodities based on IPC and CPC. These classifications take into account the development of science and technology as a major factor in determining an industry, and patents contain information that identifies these types of activities [
24,
25,
26].
In previous studies, analysts tended to classify the green industry based on their own subjective evaluations, and the policy implications derived from these classifications lacked strong empirical evidence. To compensate for the limitations of early studies, Kang [
27] defined green technologies and identified the number of patent registrations and citations related to a particular industry before classifying that industry as a green or green growth industry. Similarly, to construct the Green Technology Capability Index (GCI) (the Green Technology Capability Index (GCI) is constructed by quantifying and standardizing the proportions of green patent, green company, and R&D by industry. Refer to Jang et al. [
28] for further details) and examine the green technology innovation of South Korea, Jang et al. [
28] identified 77 green technologies within five sections (i.e., predictive technology, input, process, by-product, and pollution-free (knowledge-based) industrial economy activities). Using the keywords of 77 green technologies, the number of green patents and citations was derived. The green industry was then assessed using two methods: (1) the sum of common green industries defined by the Korean Employment Information Service (KEIS) and the Korea Environmental Industry and Technology Institute (KEITI) (that is 142) and the industries with more than 25 green patents (that is 237); (2) the sum of common green industries defined by KEIS and KEITI (that is 142) and the industries with more than 250 patent citations (219). Green patents and industries are matched by constructing a concordance between the IPC sub-groups and the Korean Standard Statistical Classification (KSIC) sub-classes. In accordance with IPC-KSIC concordance, 310 out of 1145 KSIC sub-classes are identified as green industries using the former definition, whereas 295 green industries are identified when using the latter definition. In either case, more than half of the classified green industries are in the manufacturing sector.
Furthermore, Kang [
29] and Kang and Lee [
17] defined and classified green and non-green industries using the Green and Goods and Services (GGS) and North American Industry Classification System (NAICS) 2012 concordance table from the Bureau of Labor Survey (U.S. BLS). Therefore, referring to prior studies, we classified climate industries based on technology and industry linkages and presented international bilateral trade flows.
Our method is similar to Kang’s [
27] green industry classification, insofar that we match the definition of climate technology with the industry code. The OECD ENV-TECH classification was used to define the climate industry related to climate change mitigation and adaptation technologies. Using the ENV-TECH classification, published by the OECD, we treat patents in environment-related technologies as a proxy measure of environmental innovation [
30] (Refer to OECD [
30] for the detailed search strategies for the identification of ENV-TECH). ENV-TECH contains a broad spectrum of technologies consisting of 10 groups. Specifically, the topics of each group are (1) environmental management, (2) climate change mitigation technologies related to energy generation, transmission, or distribution; (3) capture, storage, sequestration, or disposal of greenhouse gases; (4) climate change mitigation technologies related to transportation; (5) climate change mitigation technologies related to buildings; (6) climate change mitigation technologies related to wastewater treatment or waste management; (7) climate change mitigation technologies in the production or processing of goods; (8) climate change mitigation technologies related to information and communication technologies; (9) climate change adaptation technologies; and (10) the sustainable ocean economy. We applied the IPC and CPC codes to identify climate change mitigation activities (groups 2, 3, 4, 5, 6, 7, and 8), climate change adaptation technologies (group 9), and climate change mitigation and adaptation technologies relevant to the ocean economy (groups 10.3, 10.4, and 10.6). The classification of the groups is shown in
Table 1.
Following the patent search and technology groupings, we examined goods and services based on HS codes. To determine whether the goods and services under a particular HS code can be classified as climate technologies, the IPC/CPC code was first linked to the International Standard Industrial Classification (ISIC) code, which was then linked back to HS code to define the climate industry. We utilized the concordance information (between 4-digit IPC/CPC and 4-digit ISIC codes) proposed by Goldschlag et al. [
33] and a probabilistic linkage methodology to examine the persistence of the relationship between technology and industry. The climate industry defined based on the ISIC Rev.2 codes is listed in
Table 2. Based on ISIC Rev.2 criteria for climate technology, the proportion of climate industries is 28.8% of the total industry, which accounts for 46 out of 160 industries. Manufacturing (major division 3, 31~39) and Community, Social, and Personal Services (major division 9, 91~96) represent the largest proportion among the industries.
We present in
Table 3 a summary of the climate change and non-climate change industries based on HS92, matching the 6-digit HS92 and 4-digit ISIC Rev.2 concordance table from the UN Comtrade data. Some industries are omitted during the linkage process from ISIC Rev.2 to HS92. Therefore, the classification is supplemented by referring to the 4-digit IPC/CPC and 6-digit HS2002 concordance codes from Goldschlag et al. [
33]. Based on the 6-digit HS1992, the total number of climate industries accounted for 1202 (23.8%) of the 5040 industries. Among the industry sectors, Metals (Sector XIV, HS72–83) accounted for the highest proportion of the climate industries, at 7.5% (377 industries), followed by Vegetable (Sector II, HS06–15), at 4.7% (238 industries). The lowest share of climate industries was Chemicals (Sector VI, HS28–38) and Wood (Sector IX, HS44–49). It is possible that during the matching processes, a bias arises, such that some major commodities are not captured in the technological classifications, for example, Chemicals and Wood.
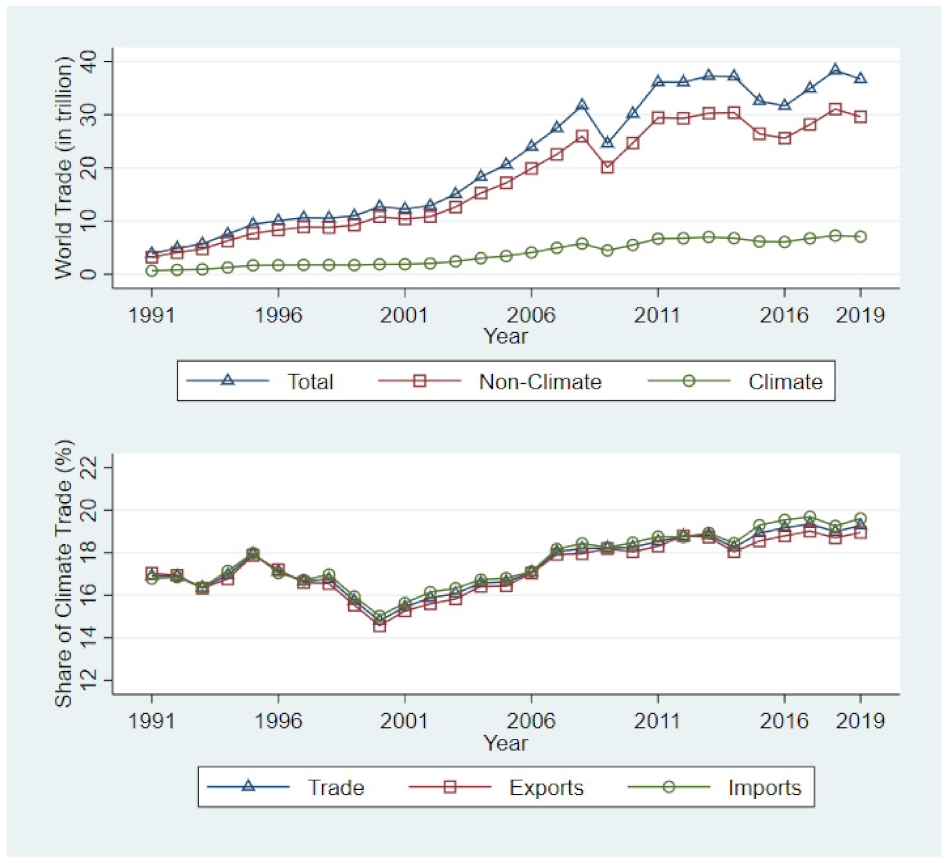
In
Figure 1, we present the climate, non-climate, and total trade patterns from 1991 to 2019. The total value of trade was estimated at US
$ 3.88 trillion in 1991 and consisted of US
$ 0.66 trillion in climate-related trade and US
$ 3.23 trillion in non-climate trade. In 2019, the total and non-climate trade volume reached US
$ 36.69 trillion and US
$ 29.61 trillion, an increase of 9.4 and 9.2 times, respectively, compared to 1991. In addition, the trends of total and non-climate trade have been shown to be similar since 1991. On the other hand, there has been a gradual increase in climate trade since 1991, although the gap with non-climate trade has not decreased. Nevertheless, the volume of climate trade was US
$ 7.07 trillion in 2019, which has increased by approximately 10.8 times since 1991, a faster rate than the non-climate and total trade.
A similar increasing trend of trade shares since 1991 can be seen in the lower plot of
Figure 1. The shares of climate trade, exports, and imports are the ratios of total trade, exports, and imports, respectively. The share of climate exports rose from 17.04% in 1991 to 17.88% in 1995, and then gradually declined until 2000. Climate exports rose by 19.01%, but then deteriorated again, beginning in 2017, although it remains higher than it was in 1991. Similarly, Kang [
29] suggested the green shares of world exports, imports, and trade had generally increased from 1980 to 2015, while he found that the green exports exhibited a higher share than the green imports during the sample period. Because we define the climate industry based on technology classifications, it is predicted that the deviation could be large depending on country characteristics. Therefore, in
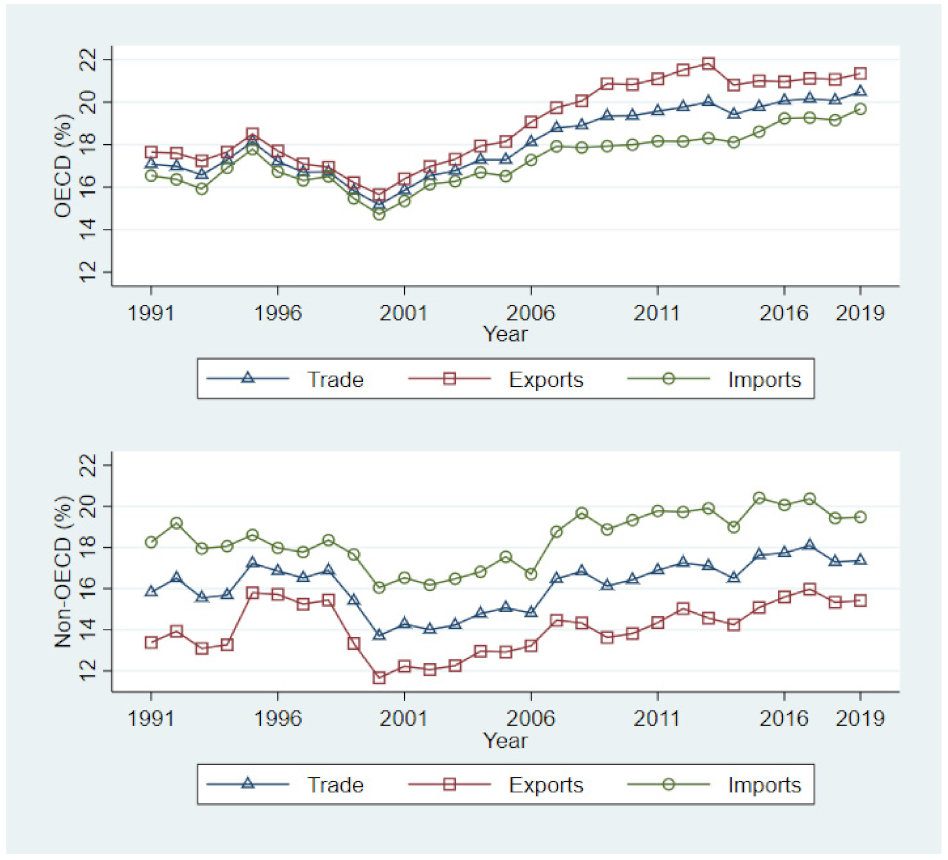
Figure 2, we provide the share patterns according to the OECD membership.
The upper plot in
Figure 2 represents the climate trade shares of OECD countries. Since 1991, the share of climate trade of OECD countries (total 17.09%, exports 17.65%, and imports 16.54%, as of 1991) has tended to increase continuously, with climate exports showing higher values than the shares of total climate and imports since the early 2000. In 2019, the shares of climate trade (total, exports, and imports) were 20.49%, 21.35%, and 19.68%, respectively. For OECD countries, Kang [
29] suggested the share of green exports and imports increased from 34.7% and 30.5% in 1980 to 41.5% and 40.3% in 2015, respectively.
In the non-OECD countries shown in the lower plot of
Figure 2, the shares of total climate trade, exports, and imports were 17.37%, 15.42%, 19.48% in 2019, respectively, compared to the corresponding values in 1991 (total 15.82%, exports 13.38%, and imports 18.26%), with shares increasing by an average of approximately 1.60%. In addition, the export share of non-OECD countries showed the lowest value among the trade shares over the sample period, in contrast to the trends of OECD countries. Kang [
29] also described the shares of green exports and imports of non-OECD countries decreased until 1999 and increased afterward with some fluctuations.
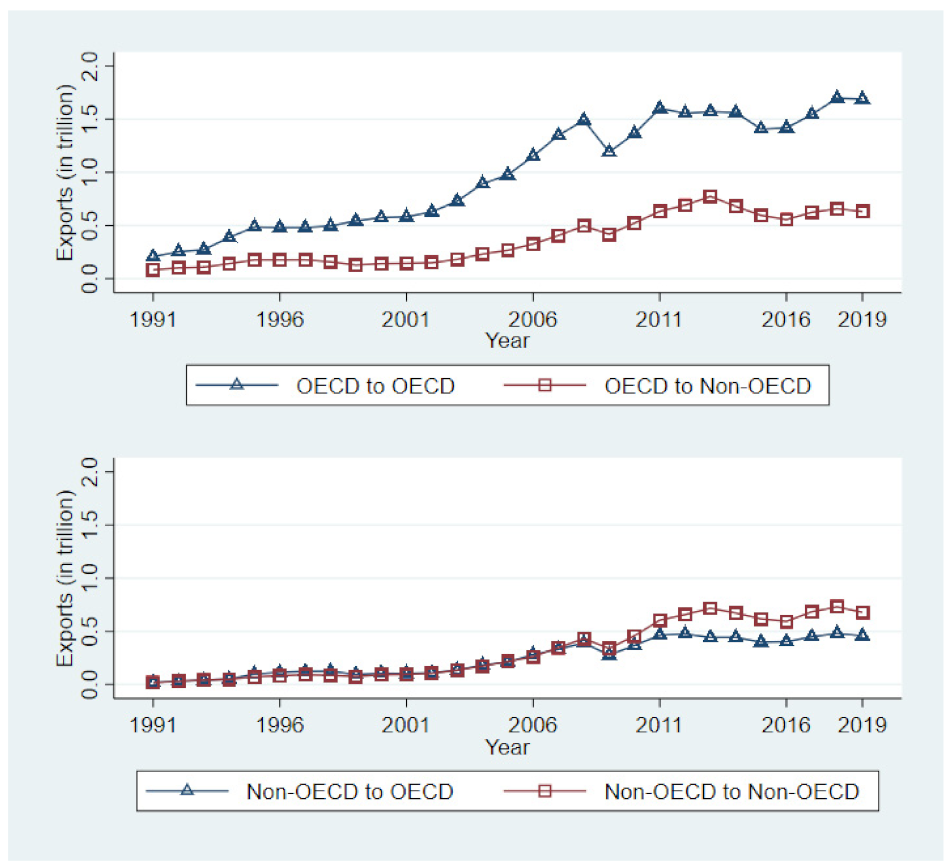
In
Figure 3, we plotted the volume of bilateral trade between OECD and non-OECD countries. On 14 December 1960, 20 countries originally signed the Convention on the Organization for Economic Cooperation and Development (OECD). There are now (as of 2021) 38 member countries in the OECD. The volumes of bilateral climate exports between countries show increasing and steady trends from 1991 to 2019. The trends in bilateral climate exports from the perspective of OECD countries are shown in the upper panel of
Figure 3. The value of climate exports of OECD to OECD countries increased from US
$ 0.21 trillion in 1991 to US
$ 1.69 trillion in 2019. The climate exports from OECD to non-OECD countries increased from US
$ 0.08 trillion in 1991 to US
$ 0.63 trillion in 2019, where the gap with the climate exports between OECDs gradually increased. This indicates that OECD countries were relatively competitive in the climate industry compared to non-OECD countries.
The lower plots in
Figure 3 depict bilateral climate exports from the perspective of non-OECD countries. The climate exports from the non-OECD to the OECD countries as well as trade between non-OECDs remained almost stable until the early 2000s; however, since then, trade in both these categories have increased. More specifically, the share of non-OECD to OECD countries increased slightly from 13.74% in 1991 to 14.59% in 2019, whereas the share of exports between the non-OECDs increased from 12.96% in 1991 to 16.04% in 2019. However, during the sample period, both trends fluctuated within the range between 11% and 16%. This implies that non-OECD countries are struggling to align their competitiveness with the climate change regime. Despite the countries being categorized according to the OECD membership, the trends of climate trade, imports, and exports vary significantly by country, possibly due to the different environmental restrictions and incentive systems [
29].
4. Data and Model Specification
In this study, we used a gravity model with the Poisson pseudo-maximum likelihood (PPML) approach, taking into account the country and year fixed effects [
37,
38,
39,
40,
41,
42,
43]. The PPML estimator is recommended in circumstances with zero trade-flow issues and heteroskedasticity in the gravity model. Our study modified the empirical methodology of Tinbergen [
37] and Anderson and Wincoop [
38]. The theoretical basic equation of the gravity model from Tinbergen [
37] is as follows:
where
is exports of country
to country
at time
,
and
are measures of economic size, namely gross national product (GNP) and gross domestic product (GDP) of countries
,
is the distance between country
and country
,
,
, and
are the coefficients of the explanatory variables, and
is a constant.
Anderson and Wincoop [
38] suggested a method that consistently and efficiently estimates a theoretical gravity equation and correctly calculates the comparative statics of trade frictions. In particular, multilateral trade resistance (MTR) is considered by controlling for endogeneity from the omitted variable bias. In addition, they suggested that bilateral trade flow should be used as the dependent variable. Equations (2) to (4) show the bilateral trade equation based on constant elasticity of substitution (CES) preferences.
where
is trade flows from exporting country
to importing country
at time
,
and
are county
’s gross product and county
’s gross expenditure, expressed as GDP, respectively.
is the world product,
is the elasticity of substitution between all commodities,
is the trade cost between countries.
is the outward MTR of county
and
is the inward MTR of county
. In this study, the country and time fixed effects are included in the empirical analysis to consider multilateral resistance, similar to previous studies.
We used the PPML approach with HDFE to obtain a consistent estimator regarding the limitations of bilateral data, such as a large number of zeros, heteroskedasticity, and clustering [
38,
39,
40,
41,
42]. In this model, general effect factors such as GDP and population are dropped out by controlling all time-varying country-specific factors. Expressed in multiplicative form and allowing the variables to vary over time, the equation is as follows:
where
is the climate change industrial exports from country
to country
at time
,
is the coefficient of explanatory variables,
represents the vector of covariates, and
and
are exporter and importer time fixed effects, respectively.
is the remainder of the error term. To control for trade cost, the vectors of standard gravity variables (
including distance, colonial history, common language, adjacency, and regional trade agreement (RTA), are used in the empirical gravity equation. In addition, the institutional quality index and the environmental regulatory gap between countries are included in the standard gravity variables.
is a country-pair signed climate-related agreement, such as the Kyoto Protocol (
) and Montreal Protocol (
) (Country status of the Montreal Protocol Ratification is updated on the UNEP website [
44]). In particular,
denotes country-pair affiliated with Annex I parties between 2008 and 2019 [
45,
46] (Refer to UNFCCC [
45,
46] for further details of the Kyoto Protocol and its amendment).
The dataset consists of a panel of 30,251 country pairs, including 169 exporting countries and 179 importing countries, between 1991–2019. The variables are described in
Table 4. First, the dependent variable (
) is the bilateral export volume of the climate industry on aggregate bilateral exports based on product level (in HS92). Second, the standard gravity variables were collected from the Center d’Études Prospectives et d’Informations Internationales (CEPII) database [
47]. Principal component analysis (PCA) was performed, using the institutional quality index (
) derived from the following WGI indicators: control of corruption (CC), government effectiveness (GE), political stability and absence of violence (VA), political stability and absence of violence/terrorism (PS), rule of law (RL), and voice and accountability (VA). In addition, we included the proxy environment policy stringency (
, which is the environmental regulatory gap between countries according to the environmental Kuznets curve hypothesis from De Santis [
16]. The proxy of two trading countries is built as
where
GDP is a measure of the relative size of a country’s economy and
POP is the population sourced from the World Bank WDI database [
48]. Furthermore, the climate-related agreement dummy variables are based on a country list from the UN Environment Programme (UNEP) and the United Nations Framework Convention on Climate Change (UNFCCC).
5. Results
As shown in Equation (6) above, the gravity model estimates the PPML with HDFE for the period 1991–2019, taking into account factors of geography, historical ties, cultural and political similarity, and agreement proximities. The results are summarized in
Table 5 and
Table 6. Regarding the heteroskedasticity-robust regression equation specification error test (RESET), shown at the bottom of the tables, most of the models do not reject the null hypothesis of collected specification, except Model (5), indicating that the model could contain certain types of neglected nonlinearities.
In
Table 5 we present the results of Model (1), which considers the Kyoto Protocol, Model (2), which considers the Montreal Protocol, and Models (3), (4), and (5), which consider both conventions but different countries. The results show that distance (
), which reflects the trade cost, has a negative impact on bilateral exports in every model, consistent with the standard gravity studies. Moreover, the colonial or dependency relation (
), representing historical ties between countries, is expected to have positive effects on bilateral trade. The results of Model (5) show that, although the RESET test has failed,
is significantly positive, indicating that stronger historical ties increase the climate exports of non-OECD countries. In addition, when countries are adjacent to each other, denoted as
, this proximity positively and significantly affects the bilateral trade of climate industry in every model. Furthermore, sharing a common RTA (
would promote the bilateral trade volumes and is positively associated with bilateral climate export flows, as expected. The impact of environment policy stringency (
, which is proxied by the relative country (economic) size, on climate exports is shown to be significantly negative in every model, in contrast to the Porter hypothesis. This result is in line among previous studies [
11,
16,
17,
49]. Meanwhile, common language (
), which reflects the ease of communication and cultural similarities, as well as institutional quality (
) are shown to be insignificant attributes of climate trade export. Furthermore, the results are quite consistent with those estimated using non-climate change industry as dependent variables except for the model specifications. In other words, it is expected that there is direct/indirect impact not only on the industry to which climate change technology is applied but also on general industries or industries to which the technology is unapplied. Especially, most of the energy-consuming industries could be indirectly affected by the climate change agreement (The results are available on request).
Interestingly, the proxy indicators of climate change agreements (
,
), the main variables of this study show contrasting effects on bilateral exports in the five Models. Among the parties included in Annex I of the Kyoto Protocol in Models (3), (4), and (5), the agreement could have a positive effect on bilateral trade between the convention countries and a consequent trade diversion effect with respect to countries that did not sign the agreements and whose products have different environmental standards [
15]. Evidence from the Montreal Protocol in Models (2), (3), and (4) present significant negative effects on bilateral exports globally and with OECD countries. The results should be interpreted carefully, as both dummy variables are multilateral agreements. Thus, their impacts on environmental stringency and spillover effects on trade vary depending on the goal of environmental protection and the target of application. In order to confirm whether the trade conversion effect is caused by the deal of the protocol when the exporting country was a member of the deal, the effect with the partner country that did join the protocol and vice versa was also estimated. As a result, when dummy variables were defined from member countries to non-members, it was analyzed that the trade diversion effect appeared in the world and non-OECD models in the case of the Kyoto dummy (
). On the other hand, the Montreal dummy (
showed significant positive values in the world and OECD models as unexpected. In addition, when dummy variables were defined as non-members to members, only the Kyoto dummy (
) of the non-OECD model showed a significant positive coefficient, indicating that the trade diversion effect appears from partner countries’ view (the results are available on request).
During the commitment periods (1st 2008–2012, 2nd 2013–2020) of the Kyoto Protocol, the obligation to reduce GHG emissions was imposed only on developed countries, and the outcome was satisfactorily attributed to the designated specific reduction targets. Specifically, Kyoto countries reduced GHG emissions in the first phase in 2012 by an average of 22.6% compared to 1990, significantly exceeding the reduction target, which was initially 5.2% [
50]. The Montreal Protocol is the landmark multilateral environmental agreement of all 198 UN countries adopted in 1987, regulating the production and consumption of nearly 100 man-made chemicals referred to as ozone-depleting substances (ODS). The major component of this agreement is the commitment by member countries to reduce the use of the regulated materials in stages from 1995, based on the consumption level in 1966, with a goal of eliminating the use of these materials by 2000. Furthermore, since 1992, import regulations on related products from non-member countries have been initiated. Therefore, the Montreal Protocol directly affected international trade flows compared to the Kyoto Protocol. UNEP [
51] stated that the Montreal Protocol was a catalyst that significantly improved the energy efficiency of appliances.
As shown in
Table 5, the climate exports of the countries increased or decreased according to the conventions signed by the country. Therefore, we analyzed the impact of environmental stringency on the climate trade of Kyoto and Montreal countries, as shown in
Table 6. Similar to the data presented in
Table 5, the coefficients of trade cost (
were negative and significant, whereas the coefficients of border adjacency (
) and sharing RTA (
were positive and significant. Interestingly, the impact of institutional quality on the climate export of Kyoto countries in Model (7) was positive at the significance level of 0.05. Furthermore, the coefficient of environmental stringency (
) was significantly negative in every model, in contrast to the Porter hypothesis [
11,
16,
17,
49]. This implies that although both agreements were international conventions, their impact on climate trade varies by goals and targets. Thus, each country should rationally decide the ratification, accession, acceptance, or succession of international agreements. The estimation results for the non-member countries are not presented in the table but are consistent with the presented results. In addition, the results by dividing dataset based on only one of the two trading countries is a member of the deal an agreement shows the negative effect of environmental stringency (
) in every model except for non-member to member according to Kyoto protocol, in contrast to the Porter hypothesis (The results are available on request). Moreover, when the estimation was conducted by using the export of the non-climate change industry as the dependent variable, the direction and significance level of the coefficients of the explanatory variables were estimated similarly to the climate industry except for the model fit test. Limitations are explained in
Section 6).
6. Discussion
From the time of the Montreal Protocol, which entered into force in 1989, to the Kyoto Protocol and the Paris Climate Agreement, countries have established a national commitment to comply with these conventions based on international consensus. In recent years, faced with the need to transition economies to carbon net-zero, various policy efforts have been made to link climate change response strategies to economic growth. Moreover, the new legal architecture of the Paris Climate Agreement entered into force on January 2021, gradually enhancing the degree of international regulation of GHG emissions. As China, which emits the most carbon in the world, has declared carbon neutrality along with the EU and United States, climate change discussions on establishing a direction for GHG reduction are attracting worldwide attention. Following the carbon neutrality declaration, new national growth strategies have been introduced, including the Green New Deal. Moreover, there is a continuous movement to foster eco-friendly technologies not only in the energy sector but also in the industries and transportation sectors. In accordance with the growing demand for sustainability, environmental protection, and implementation of policies to achieve NDCs, policies regarding climate change mitigation are being reinforced.
In this context, we investigated the effect of climate change-related multilateral agreements on climate industry trade by utilizing a gravity model of bilateral climate change exports among 30,251 country pairs from 1991 to 2019. To analyze the empirical framework, we defined the climate industry according to the concordance of OECD ENV-TECH classification, ISIC rev.2 and HS92, then investigated the trends of bilateral trade specified to the climate industry and exploited the gravity model with fixed effects by setting climate bilateral trade as the dependent variable. Two climate change-related agreement dummy variables were utilized as explanatory variables. The main finding is that the impact of standard factors on bilateral trade is consistent with the results in the existing literature, and the multilateral agreements affect the bilateral exports of the climate industry among the convention countries. Whereas the Kyoto Protocol has increased international exports in the climate industry, especially between OECD member countries, the Montreal Protocol has shown the opposite outcome. However, the results should be interpreted carefully, as both dummy variables are multilateral agreements, thus their impacts on environmental stringency and spillover effects on trade vary depending on the goal of environmental protection and the target of application. In other words, this result indicates that governments should rationally reform the existing environmental tax system and review the introduction of an environmental tax, such as carbon border tax, that aims to reduce carbon emissions in order to first promote eco-friendly industry; second, strengthen industrial and trade competitiveness in the multilateral agreement system that accompanies trade regulatory measures, and finally, construct effective mid- to long-term energy tax reformation strategies.
As inferred from the empirical results in this study, industry competitiveness and trade appear to be directly or indirectly affected by multilateral agreements and environmental policy stringency. Developed countries are implementing policies and programs, such as investment in renewable energy and review of carbon border taxes, to maintain and enhance manufacturing competitiveness in carbon-emitting industries and to secure a supply chain for related products. On the other hand, developing countries do not have sufficient resources or technologies applicable to climate change mitigation; thus, there is concern about the deterioration in the competitiveness of these countries due to the transition to a carbon-neutral system. Therefore, each country should achieve decarbonization in steps according to the country’s status, prepare an institutional basis to supply eco-friendly energy and infrastructure and implement energy transition policies that link industry sectors. To achieve and lead this climate change regime, it is necessary for governments to create a consistent industrial ecosystem through investment in decarbonization and low-carbon technology R&D, the establishment of renewable energy infrastructure, and financial incentives to induce private sector engagement.
The study’s main limitation is the classification, which employed the OECD ENV-TECH classification that contains some unacceptable non-climate commodities. Although this study classified industries according to the definition of climate technology based on several correspondence tables, it should be emphasized that the research did not consider an important aspect related to the more detailed and complex industrial side. Due to the limitation of industry classification, we are unable to analyze the effect of environmental agreements on climate and non-climate industry exports in detail. Therefore, further research should include the impact of the environmental agreements on each industry’s exports in connection with industrial-level data through climate and non-climate industries classified at the lower level. This would enable examining the differential effect of environmental agreements on each industry.


