Article

NOx Emission of a Correlation between the PEMS and SEMS over Different Test Modes and Real Driving Emission

1
Department of Automotive Engineering, Korea National University of Transportation, Chungju 27469, Korea
2
Department of Mechanical Convergence Engineering, Graduate School of Hanyang University, 222 Wangsimni-ro, Seongdong-gu, Seoul 04763, Korea
3
Department of Mechanical Engineering, Hanyang University, Seoul 426-791, Korea
*
Author to whom correspondence should be addressed.
Energies 2021, 14(21), 7250; https://doi.org/10.3390/en14217250
Submission received: 9 August 2021 / Revised: 8 October 2021 / Accepted: 1 November 2021 / Published: 3 November 2021

Abstract

:
The aim of this study is to verify the reliability of NOx emissions measured using Smart Emissions Measurement System (SEMS) equipment in comparison with the NOx emissions measured using certified Portable Emissions Measurement System (PEMS) equipment. The SEMS equipment is simple system, and it is less expensive than the PEMS equipment, as it comprises an On-Board Diagnostics (OBD) signal from the test vehicle and a NOx sensor. The SEMS equipment based on low-cost sensors has an advantage of building big data, but there are insufficient previous studies comparing of NOx emissions with certified the PEMS equipment. Therefore, this study is important in verifying the suitability of the SEMS equipment by comparing the NOx emissions measured by the various test modes and RDE using the two types of equipment. To analyze the correlation between the PEMS and SEMS equipment, the advanced diesel vehicle was equipped with the two types of equipment to simultaneously measure NOx emissions. After installing the equipment on the test vehicle, it was conducted under various test modes in the laboratory and the Real Driving Emission (RDE) test to verify the correlation of NOx emissions measured by the SEMS equipment. The correlation analysis for the NOx emissions measured by the PEMS and SEMS equipment under various test conditions and the RDE test indicated that the slope of the NOx emissions was approximately equal to 1, and the coefficient of determination was 0.9 or higher. Based on these test results, it was concluded that NOx emissions measured by the PEMS and SEMS equipment are highly similar.

1. Introduction

Since September 2017, Republic of Korea and Europe have introduced Real Driving Emission Light-Duty Vehicle (RDE-LDV) test to strengthen the emission regulations for light-duty diesel vehicles [1]. The RDE-LDV test was introduced to address the defeat device, which arbitrarily manipulates the vehicle’s Engine Control Unit (ECU) program when driving on the real road. When the RDE-LDV test was first introduced in September 2017, it was regulated such that the Euro 6b regulation with the Conformity Factor (CF) of 2.1 during the RDE test. In addition, the Euro 6d-temp regulation with the CF should be 1.5 times from 2019. Furthermore, the CF will finalize as 1.43 by January 2020 [2,3]. The CF means the Not To Exceed (NTE) for the respective pollutants such as NOx, PN, and is the ratio of exhaust emitted during RDE against the regulatory standards of the vehicle [4].
Currently, the RDE-LDV test has been regulated to be measured by the Portable Emission Measurement System (PEMS, Sensors Inc., Saline, MI, USA). The PEMS equipment must be installed outside the vehicle, as illustrated in Figure 1. However, it faces challenges relating to the operation of complex equipment, the large size of the equipment, and cost of test operations [5]. The expensive PEMS equipment is able to measure several emission components, but it is difficult to build big data of air pollution monitoring research on vehicles. To address these challenges, Nederlandse Organisatie voor toegepast-natuurwetenschappelijk onderzoek (TNO) developed the Smart Emissions Measurement System (SEMS, TNO, Den Haag, The Netherlands) equipment based on low-cost sensors and vehicle On-Board Diagnostics (OBD) data. Several studies have extensively investigated the SEMS equipment [6,7,8,9,10,11,12]. As an example, the TNO reported that a correlation test was conducted to simultaneously measure the exhaust emissions with the SEMS equipment and the Constant Volume Sampler (CVS) equipment under laboratory test modes such as the New European Driving Cycle (NEDC), World-wide harmonized Light-duty vehicles Test Cycles (WLTC) and Common Artemis Driving Cycles (CADC). Based on the reported results, the error in CO2 measurements between the SEMS and CVS equipment was 0.3%, whereas the error in NOx was 8.8%. These results confirmed that the CO2 and NOx data measured by the SEMS equipment exhibit high reliability [13]. Heepen et al. [14] presented an introduction of the difference between PEMS and SEMS equipment. In addition, this paper will give the measurement results and the functional features over long periods of time in the SEMS equipment. Vermeulen et al. [15] presented tail-pipe emissions of vehicles with Euro VI engines that were examined using the SEMS equipment under real-world conditions. To check the data measured by the SEMS equipment, the PEMS equipment has been used to measure the NOx emissions on the public road. However, the PEMS and SEMS equipment were not operated simultaneously.
As mentioned above, little is known about previous studies that simultaneously measure NOx emissions under various test modes and RDE using the two types of equipment. Therefore, to confirm data reliability, this study compared NOx emissions measured by the SEMS equipment in various test modes, on a chassis dynamometer, in a laboratory with NOx emissions measured by the PEMS equipment. After the reliability of NOx emissions measured by the SEMS equipment was verified, the advanced diesel vehicle, which meets Euro 6d-temp regulations was equipped with the PEMS and SEMS equipment to measure data from a driving route that satisfies the trip requirements suggested by European Commission-Joint Research Centre (EC-JRC). The details on the trip requirements are introduced in Section 2.3.2.
The purpose of this study is to simultaneously measure NOx emissions using PEMS and SEMS equipment on various real driving routes, considering the driving conditions in South Korea. This study attempts to verify the reliability of NOx emissions measured by the SEMS equipment by comparing the results with NOx emissions measured by the certified PEMS equipment.
Finally, after the operation based on the chassis dynamometer and Real Driving Emission (RDE) test, this study intends to apply the emission gas measurement system via the simplified SEMS equipment, instead of the complicated and the expensive PEMS equipment.

2. Experimental Method

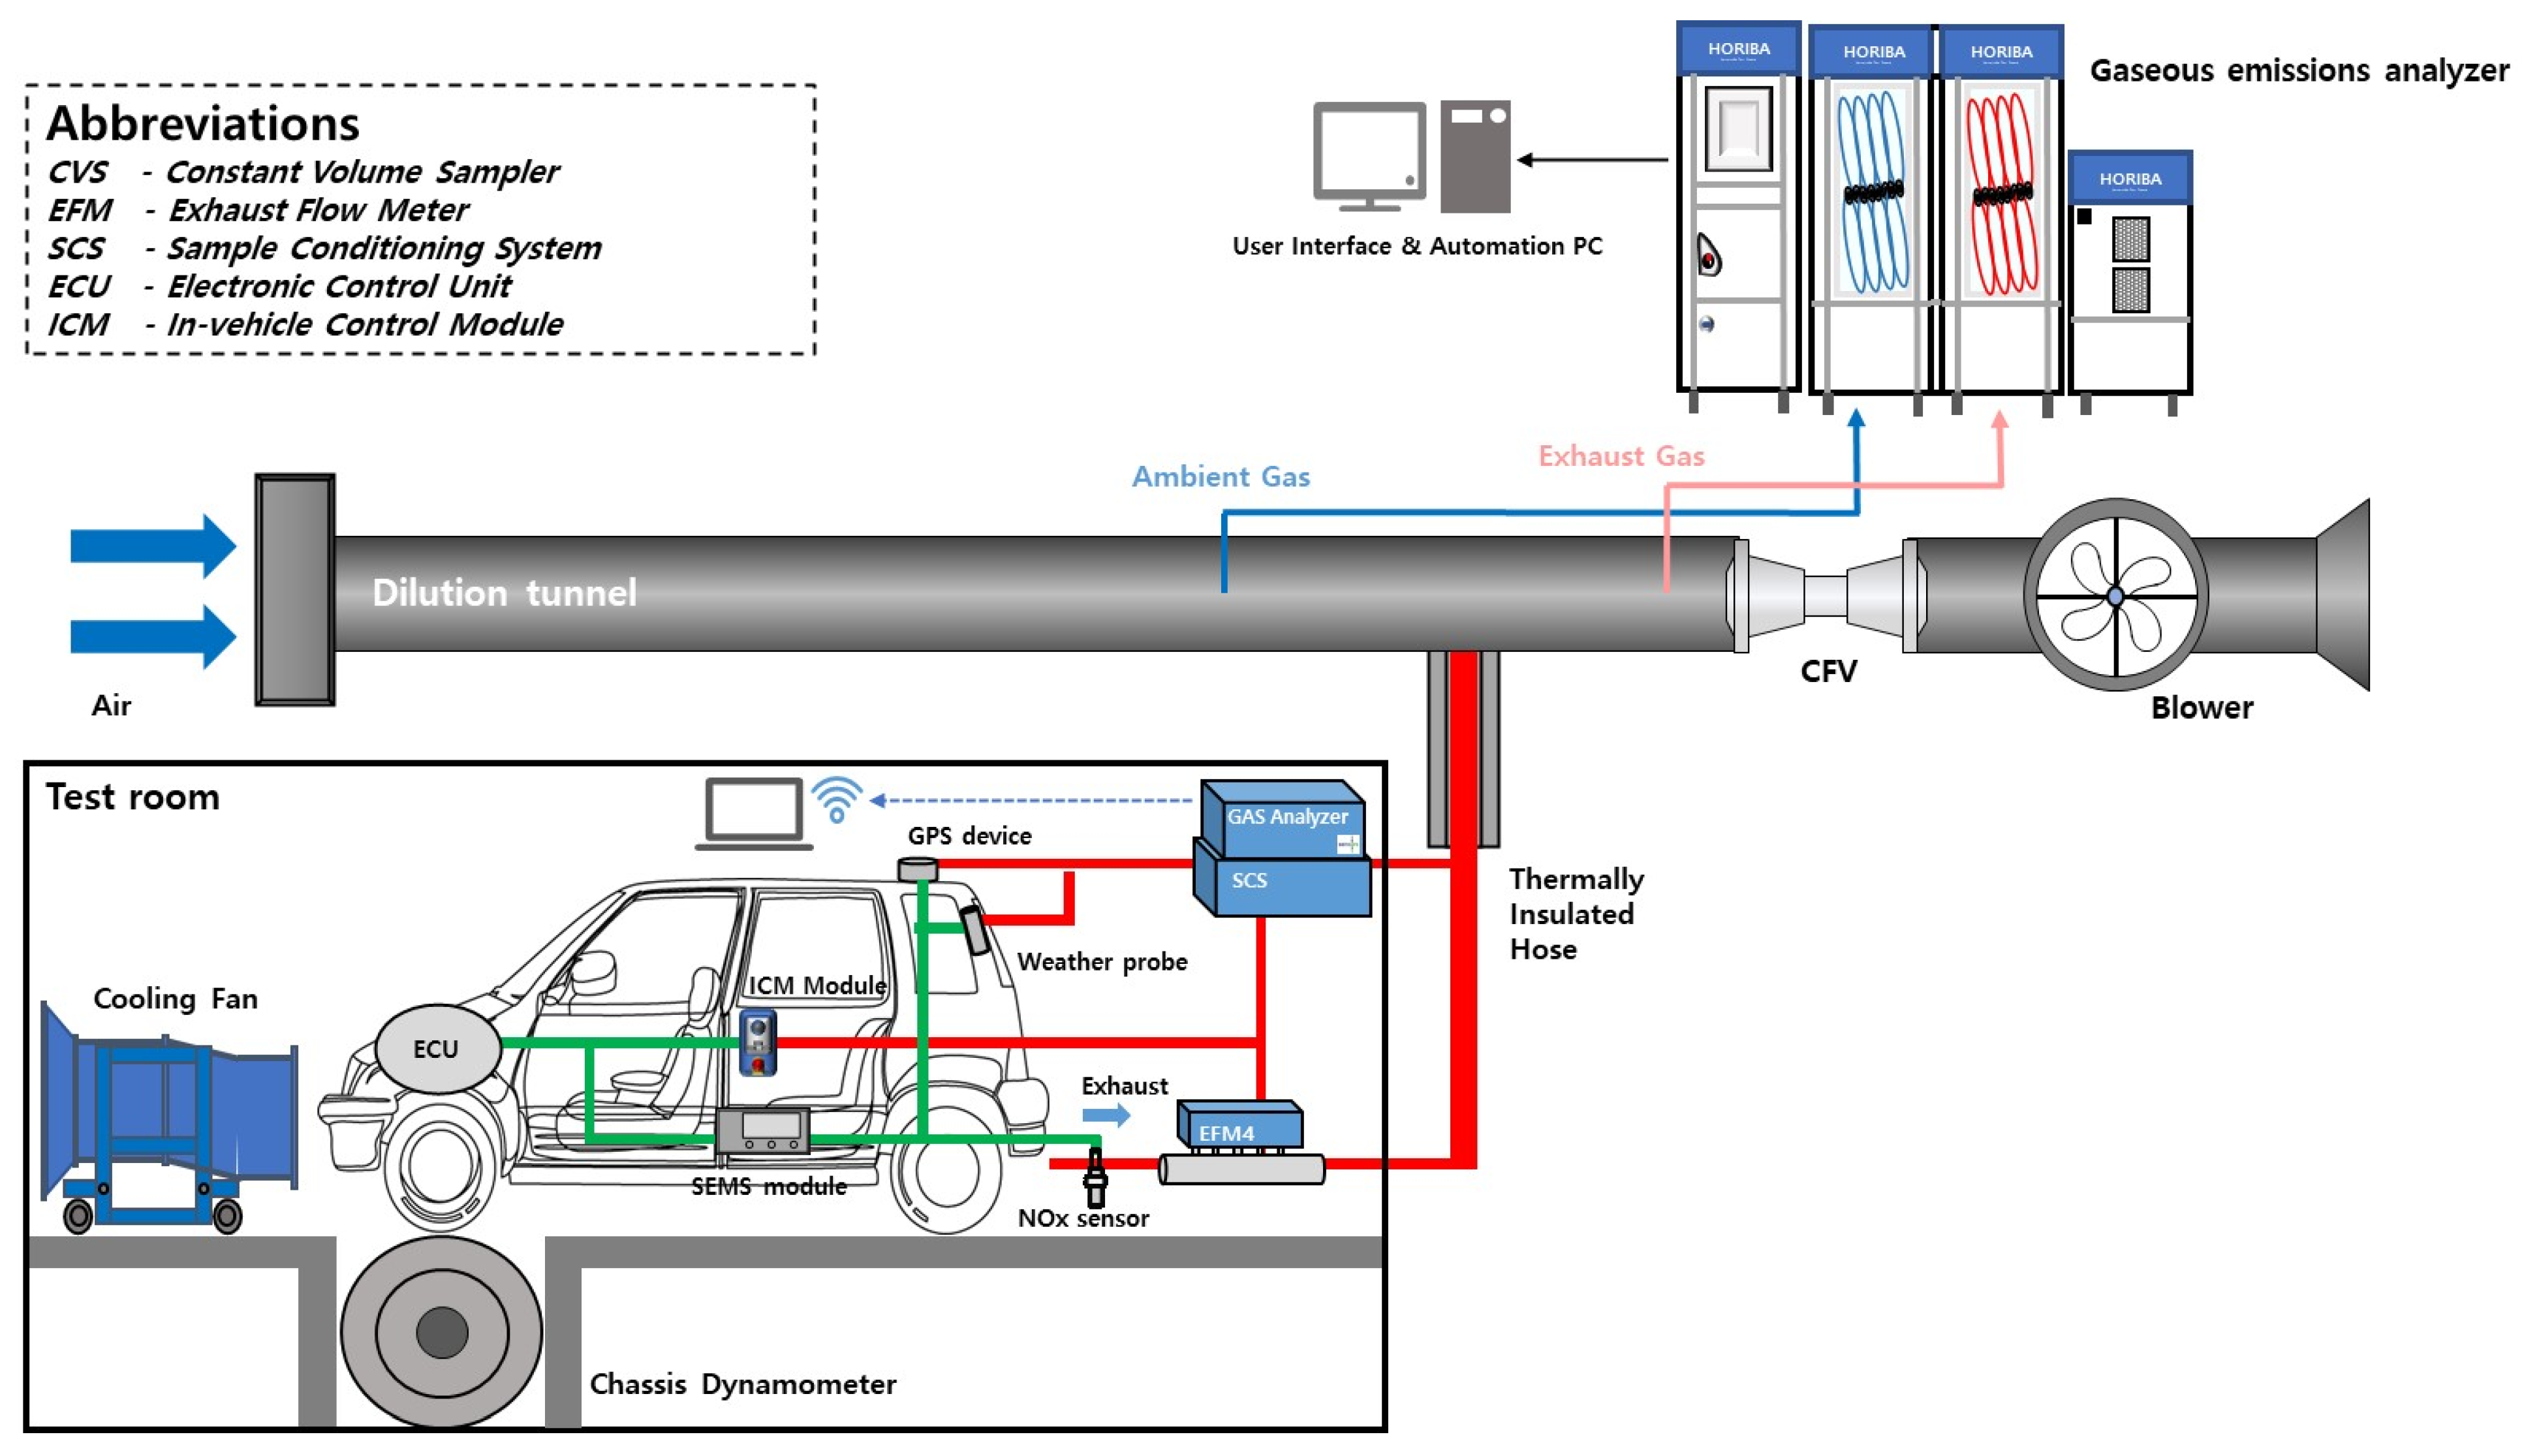
2.1. Chassis Dynamometer and Exhaust Emission Analysis System

To evaluate the various test modes on the chassis dynamometer, it is necessary to understand the chassis dynamometer and exhaust analyzer. To simulate the real driving conditions, a unique resistance value for the test vehicle needs to be input to the dynamometer system. Driving along the entered driving mode such as NEDC and WLTC, exhaust emissions occur from the test vehicle. Then, the exhaust emissions from the test vehicle were consistently collected using CVS equipment. The exhaust emissions were analyzed by appropriately diluting the air using an exhaust analyzer.
Figure 2 presents a schematic of the chassis dynamometer in the laboratory and illustrates an example for the correlation test of the PEMS, SEMS, and CVS equipment. Furthermore, the specifications of the chassis dynamometer and exhaust emissions analyzer are summarized in Table 1 and Table 2.

2.2. Various Test Modes in Laboratory

To analyze the correlation between NOx emissions measured by PEMS and SEMS equipment, this study performed various test modes on a chassis dynamometer in the laboratory. The test modes were conducted over six different chassis dynamometer modes: the NEDC; the WLTC, which reflects realistic trip conditions than the NEDC mode; the Federal Test Procedure-75 (FTP-75) mode, which is known as the representative urban driving conditions of USA; the Highway Fuel Economy Test (HWFET), which is reflecting the highway driving conditions of USA; the US06, which is an aggressive high speed and high load driving mode; the SC03, which operates the air conditioner to reflect summer environmental conditions. In addition, the driving characteristics of the test mode in this study are shown in Table 3.

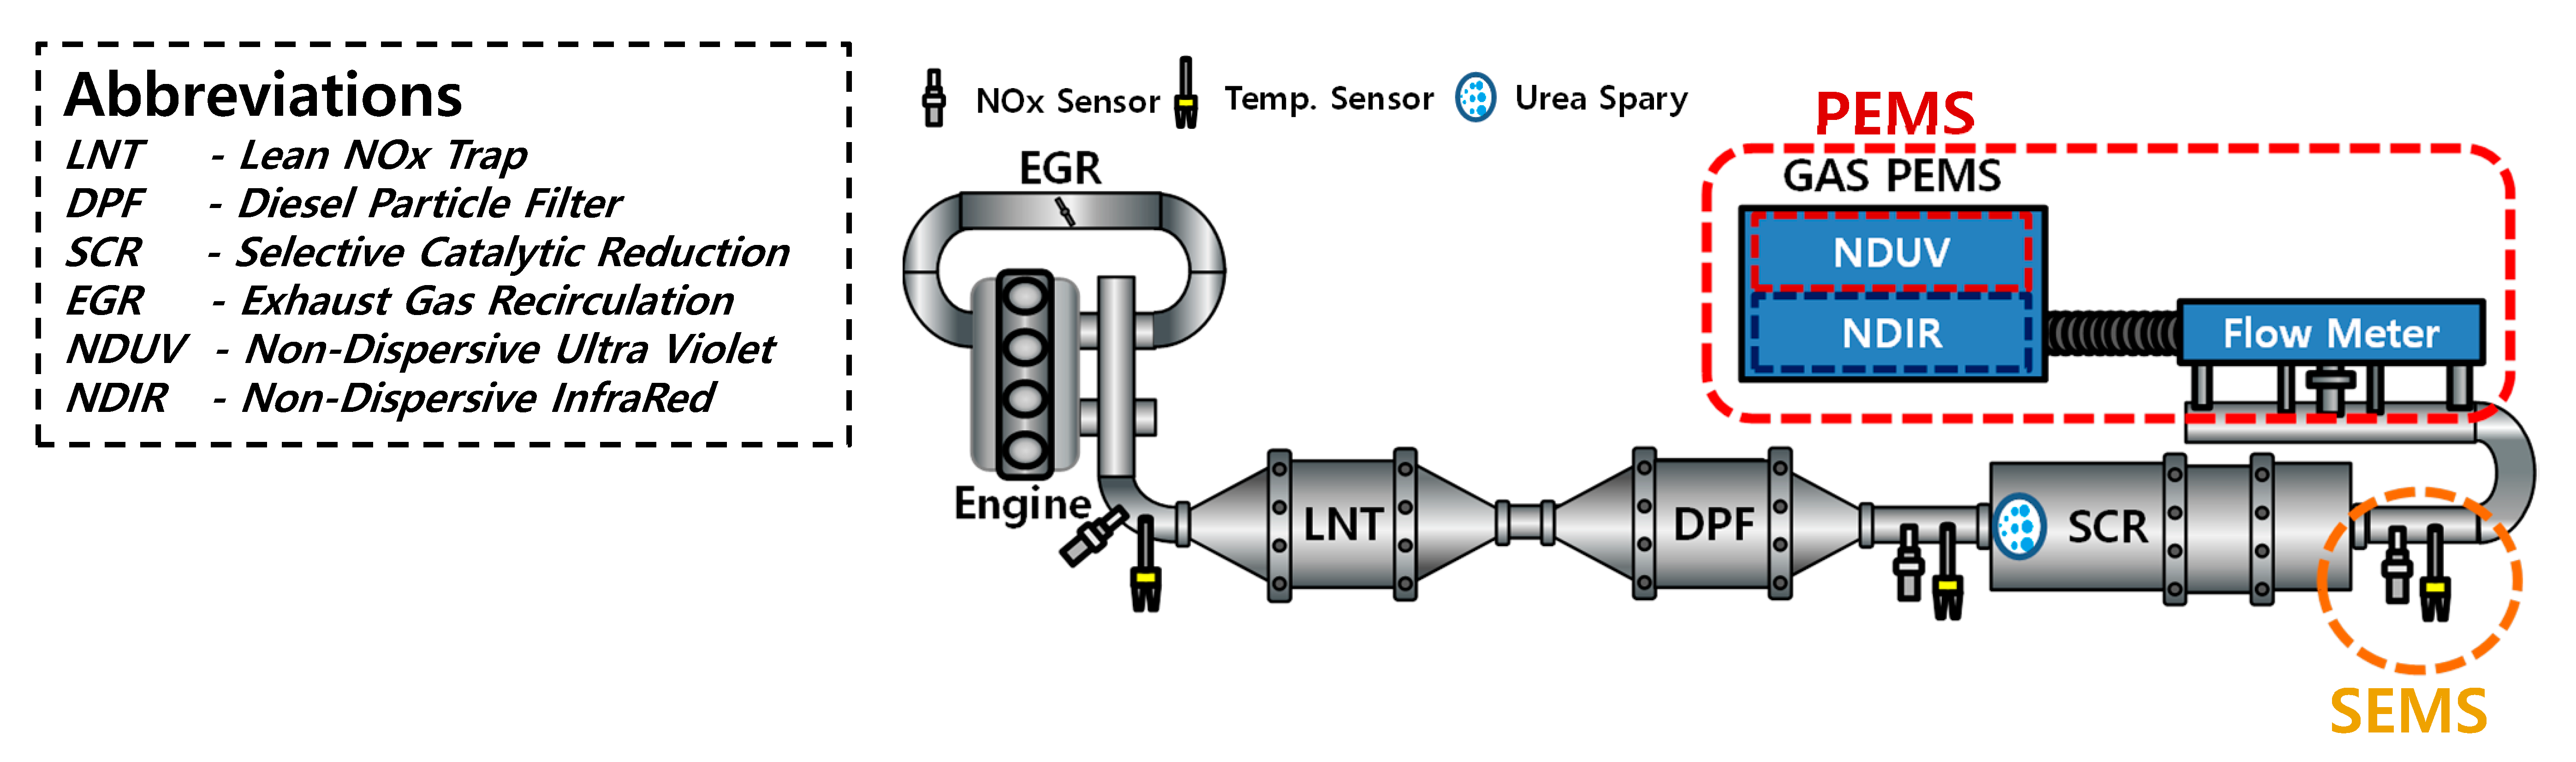
2.2.1. Test Vehicle and After-Treatment System
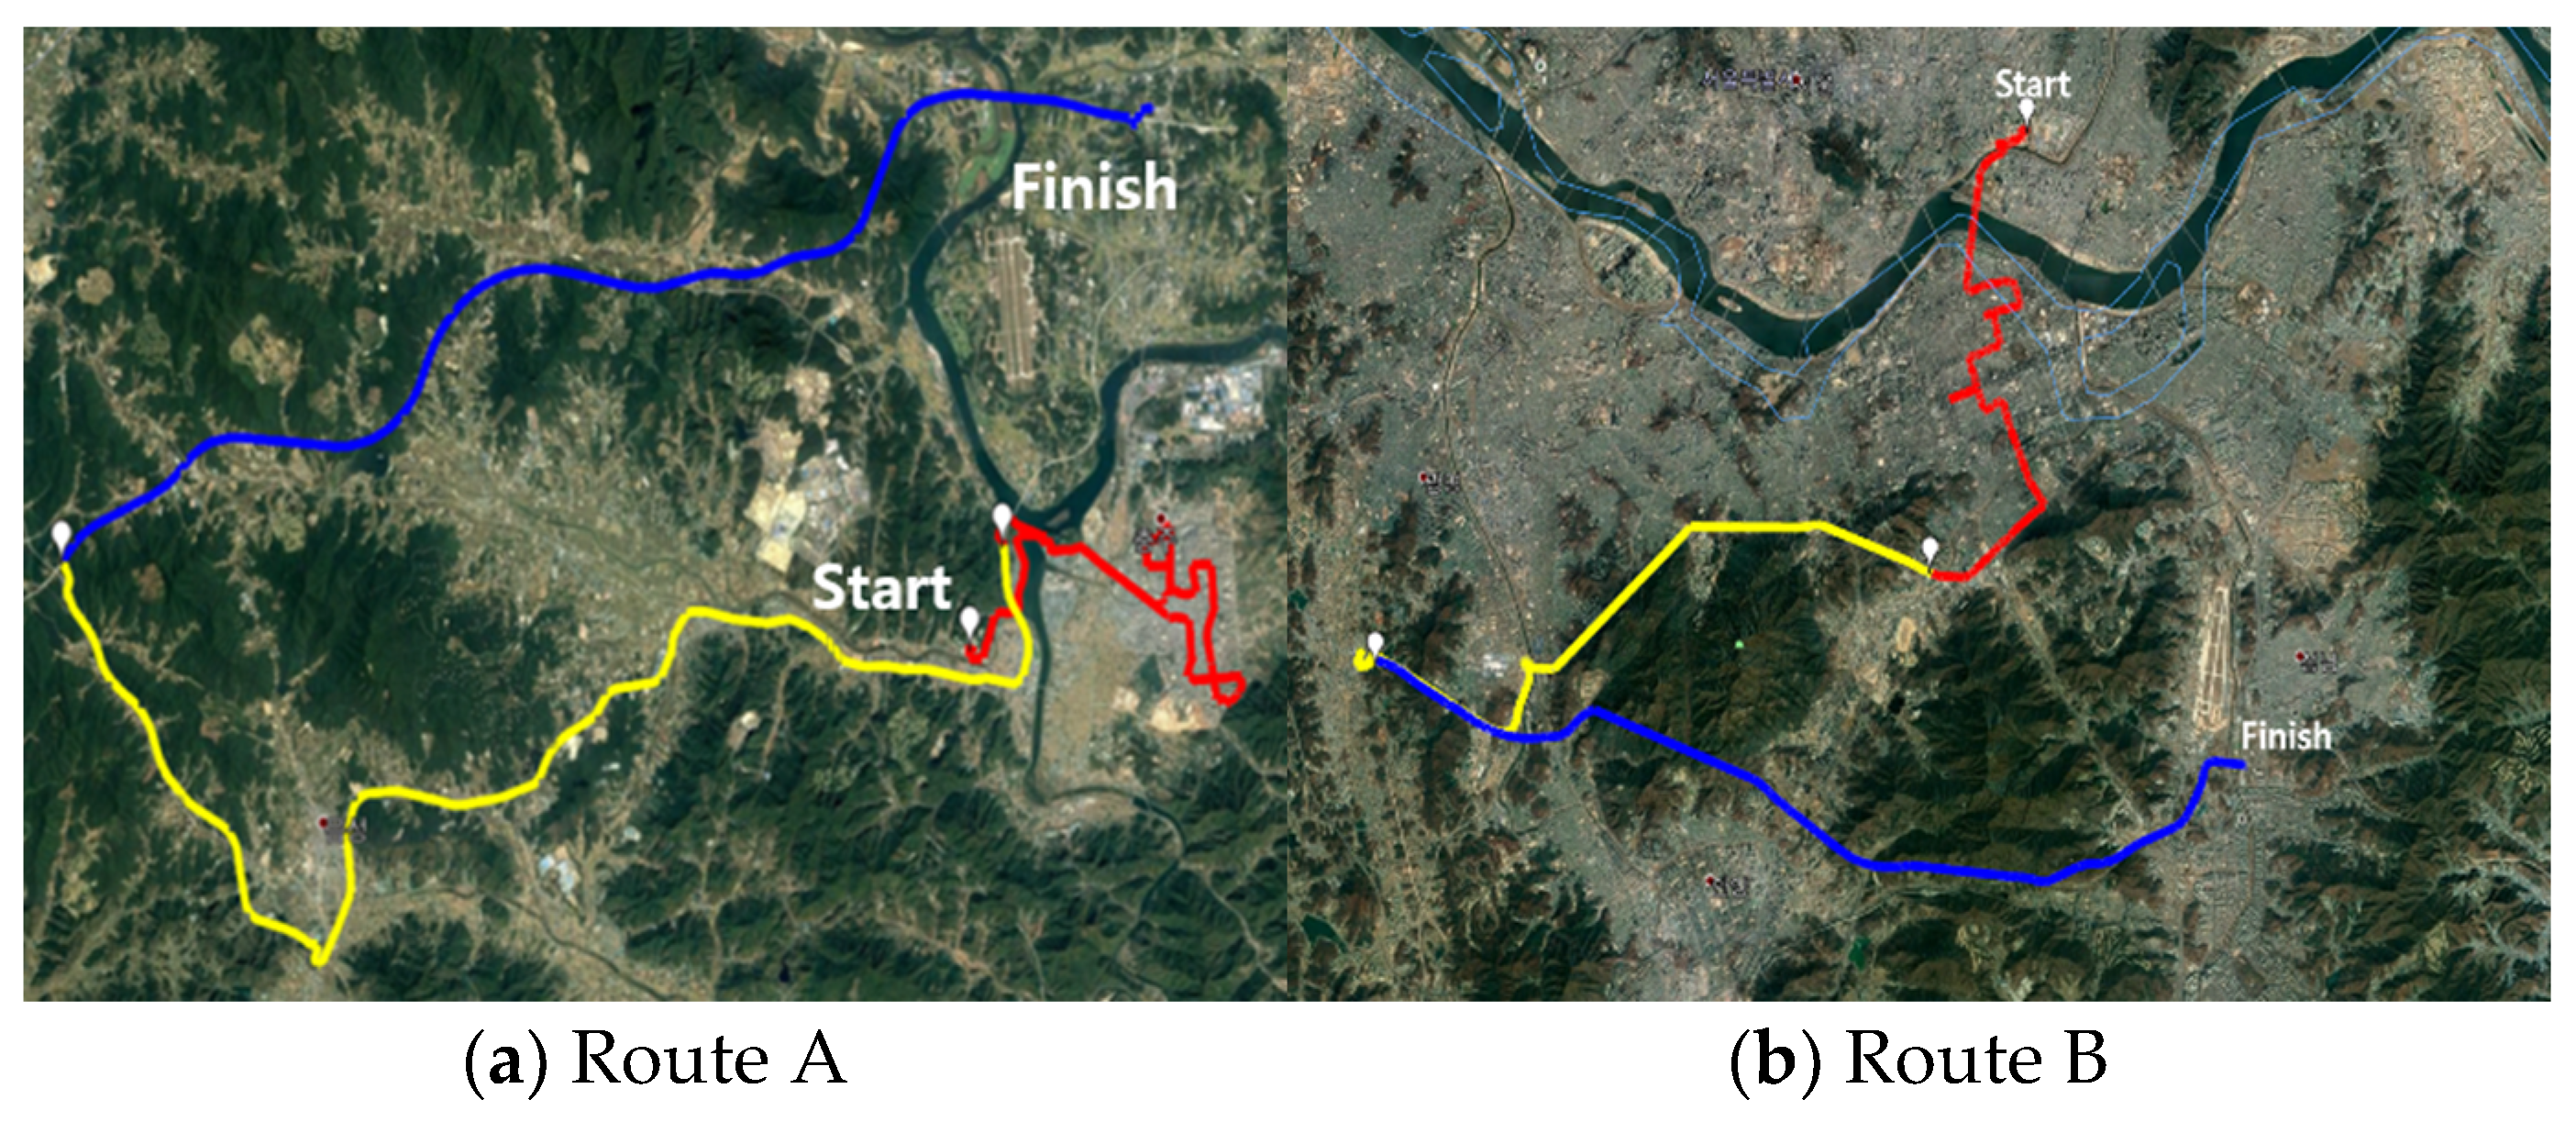
The test vehicle in this study is an SUV-type diesel vehicle (Hyundai motor group, Seoul, Korea) equipped with combination of Lean NOx Trap (LNT), Diesel Particle Filter (DPF), and Selective Catalytic Reduction (SCR) to meet the Euro 6d-temp regulations. In addition, the test vehicle features sophisticated after-treatment technology. The specifications of the test vehicle are shown in Table 4.

2.2.2. RDE Route

The RDE-LDV test route should sequentially comprise an urban, a rural, and a motorway, in accordance with the trip requirements suggested by the European Union (EU). The trip distance of each part should be at least 16 km. In addition, the urban, rural, motorway parts should account for 34, 33%, and 33% of the total trip share. In particular, the urban part should include a minimum stop ratio of 6–30% among urban driving. In addition, the total driving duration should lie between 90 and 120 min, and the difference in the route’s altitude between the start and end points should be less than 100 m [4].
In this study, the RDE tests were performed along Route A and Route B developed by satisfying the above conditions. As illustrated in Figure 3a, Route A reflects driving patterns such as low vehicle traffic in urban areas of small and medium cities in Republic of Korea, and this route has a total distance of 93.3 km, including urban, rural, motorway parts. As illustrated in Figure 3b, Route B reflects the representative traffic density and comprises a highly populated metropolitan area (Seoul) in Republic of Korea. In addition, it is a route with a total distance of 70.5 km, including urban, rural, motorway parts. The major difference between Routes A and B is the vehicle speed according to the traffic jam in the urban part.
As presented in Figure 4, it can be observed that Route B has more areas with vehicle speeds below 30 km/h than Route A. In areas where the vehicle speed is low, vehicle congestion is frequent; accordingly, this vehicle congestion triggers an increasing stop ratio in the urban part. Based on the RDE test, it can be confirmed, as shown in Table 5, that the stop ratio in the urban part of Route B was 36.39%, which is approximately 12% higher than that of Route A.
Finally, RDE tests were performed several times on the test vehicle at each driving route, and the detailed characteristics of the driving routes are summarized in Table 5.

2.3. Test Equipment

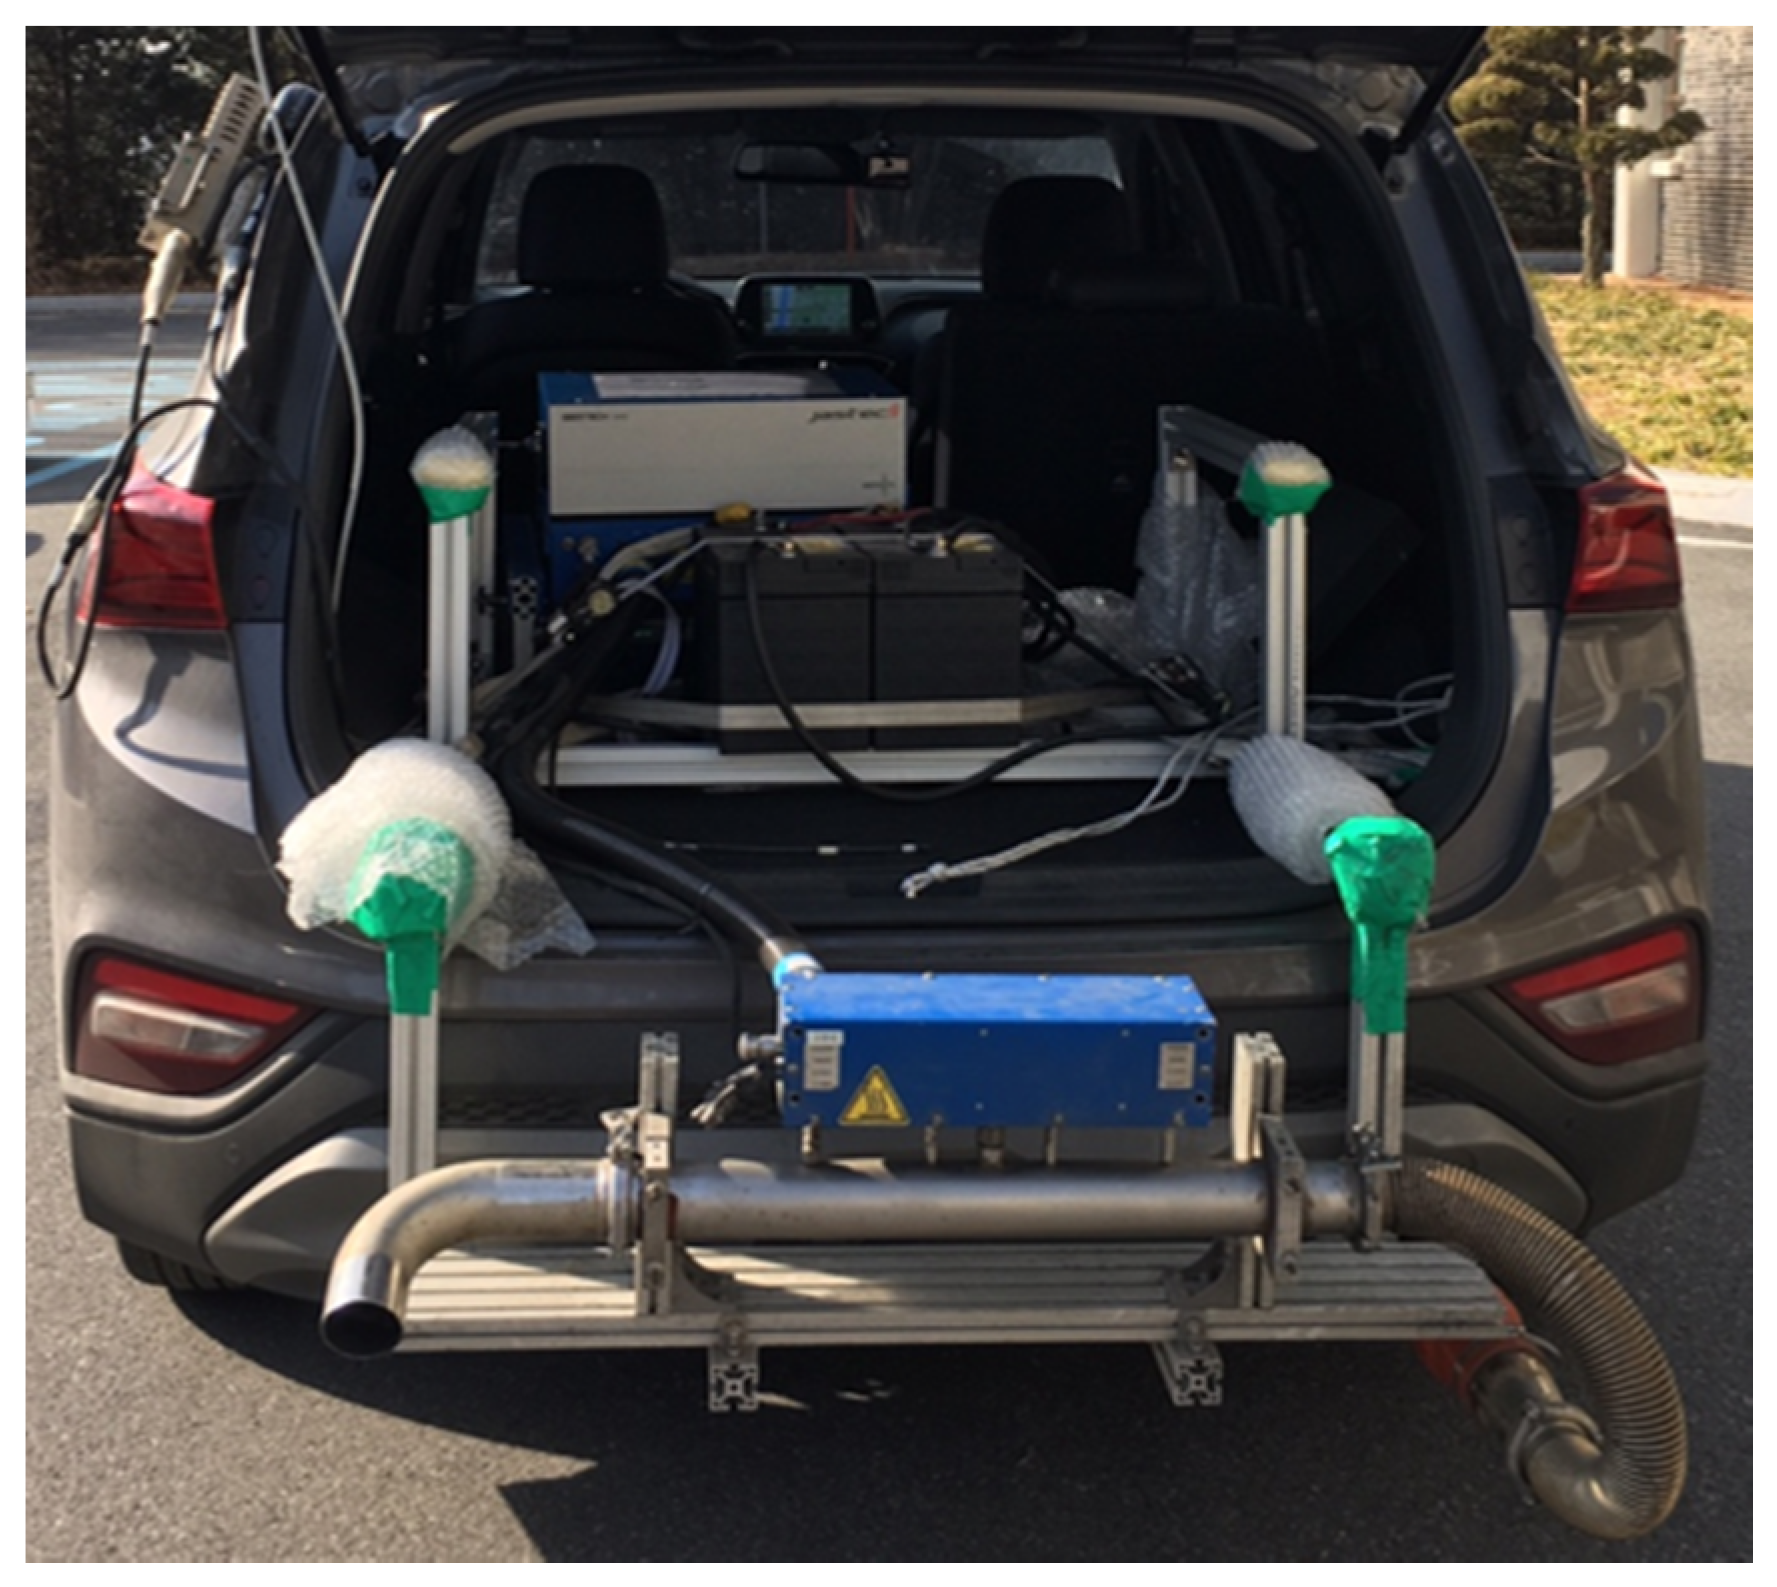
2.3.1. The PEMS Equipment

The PEMS equipment considered in this study was obtained from the SEMTECH-LDV corporation (Sensor Inc., Saline, MI, USA). The PEMS equipment comprise an exhaust gas analyzer, an exhaust gas flow meter, a GPS device, a weather probe with ambient gas and pressure, a power supply device, and an OBD data acquisition device.
The PEMS equipment measure emission concentration data (ppm) at 1 Hz. Then, the emission concentration data (ppm) are synchronized with the flow rate of the exhaust flow meter and converted to the exhaust mass data (g/s). In addition, exhaust mass data (g/s) are synchronized with the vehicle speed (km/h) measured in GPS and OBD devices and converted to emissions per mileage (g/km).
The exhaust emissions measured by the principle of Pitot tube in the exhaust flow meter were measured and analyzed by the exhaust gas analyzer inside the PEMS equipment. Specially, NO and NOx emissions were measured via the Non-dispersive ultraviolet (NDUV) principle, while CO and CO2 emissions were measured via the Non-dispersive infrared (NDIR) principle. The detailed specifications and principles of the PEMS equipment are summarized in Table 6.

2.3.2. The SEMS Equipment

The SEMS equipment used to measure exhaust emissions from the test vehicle in this study comprise NOx sensors, a GPS signal that measures vehicle speed and altitude of the driving route, an OBD signal that measures the OBD data of the test vehicle, the main module that is responsible for the operation of the sensors, data storage, and power supply of the equipment.
The detailed specifications and measurement principle of the NOx sensor are summarized in Table 7. The NOx sensors were mounted on the exhaust pipe of the test vehicle, as illustrated in Figure 5. In addition, the mass flow rate of NOx in the SEMS equipment was calculated using the concentration of NOx in the exhaust pipe, and the exhaust mass flow rate was calculated based on the intake air flow rate and the fuel flow rate measured via the OBD data of the ECU program of the test vehicle.

2.3.3. Principles of the PEMS and SEMS Equipment

NOx measure principle of PEMS equipment used the NDUV method. In NDUV method, when the exhaust emissions were sampled in the PEMS equipment, the injected exhaust emissions were passed through two cells. One cell has ultraviolet (UV) rays and the other cell has nitrogen that does not react with exhaust emissions. Among the exhaust emissions, when NOx emissions were injected in the PEMS equipment, NOx emissions absorb UV wavelengths by reaction in one cell and no reaction occurs in the other cell. At this time, NOx emissions were measured by the difference in UV rays generated from the two cells. In addition, the CO and CO2 measure principles of the PEMS equipment used the NDIR method. The NDIR method is similar to the NDUV method. The NDIR method used infrared rays instead of UV rays.
NOx measure principle of SEMS equipment used the amperometric method. In the amperometric method, the measured NOx emissions among the exhaust emissions pass through the diffusion barrier and move to the first cell. The first cell removes O2 close to 0 ppm. Then, when moving to the second cell, most of O2 is removed. Thus, NO and NO2 molecules are decomposed to measure O2 [16,17,18]. However, unlike the PEMS equipment, NO emissions measured by the SEMS equipment were increased via the urea solution. Here, the urea solution is injected to reduce NOx emissions in the SCR system. In the SEMS equipment, urea solution is decomposed as shown in equation (1) to increase NO emissions. As mentioned above, the SEMS equipment can be easily measured due to low cost and simple installation, but the limitation of the SEMS equipment is that NO emissions measured by the urea solution were also measured.
4 NH 3 + 3 O 2   4 NO + 6 H 2 O

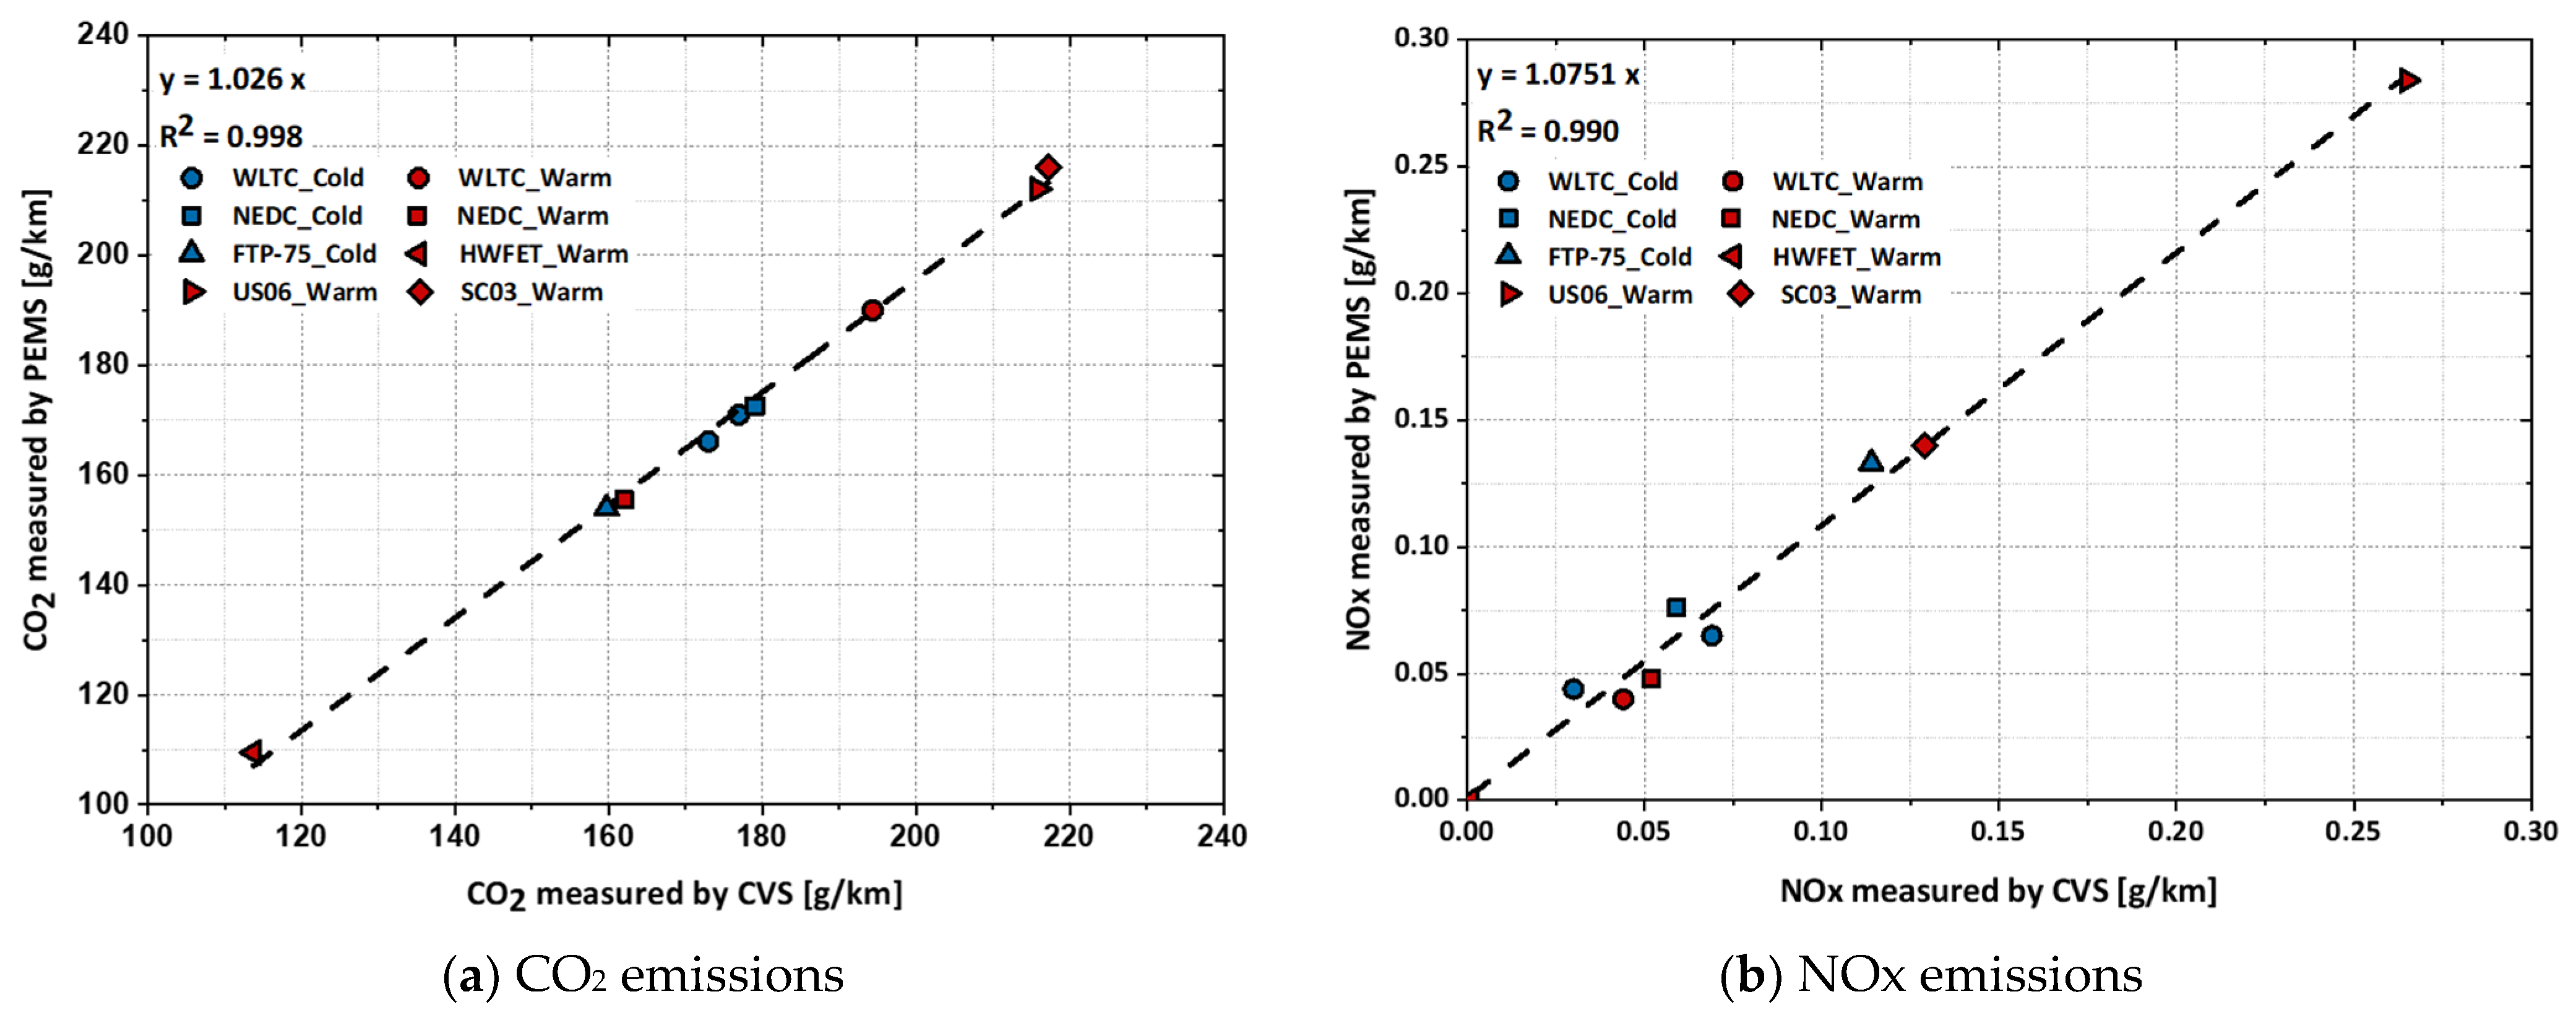
2.4. Reliability Verification of Data Measured by the PEMS Equipment

To verify the reliability of data measured by the PEMS equipment before the RDE test, the correlation test was performed to simultaneously measure the exhaust emissions emitted from the test vehicle with the PEMS and CVS on the chassis dynamometer in the laboratory.
The correlation test was performed under various test modes. The results obtained from the correlation test measurements are summarized in Figure 6. In addition, the schematic of the correlation test is presented in Figure 2. Owing to the comparison with data measured by the PEMS and CVS equipment, the slopes for NOx and CO2 corresponded to 1.08 and 1.03, respectively. Accordingly, it was confirmed that the data measured by the PEMS equipment has high reliability.

2.5. Reliability Verification of Data Measured by the SEMS Equipment

Unlike the PEMS equipment, the SEMS equipment does not have an exhaust flow meter. Hence, mass air flow and total injection quantity from the OBD data of the test vehicle are introduced to calculate the exhaust flow rate. The calculated exhaust flow rate is used to convert the NOx measured in concentration units (ppm) into mass units (g/s), as expressed in the following Equation (2) [4]. To verify the reliability of the SEMS equipment data, the exhaust flow rate measured by the exhaust flow meter of the PEMS equipment, and the exhaust flow rate calculated by introducing mass air flow and total injection quantity of the aforementioned OBD data are compared and presented in Figure 7.
m g a s = ρ g a s × c g a s × Q e x h
where:
  • m g a s   ( g / s ) : the mass of the exhaust component “gas”;
  •   ρ g a s   ( kg / m 3 ) : the density of the exhaust component “gas”;
  •   c g a s   ( ppm ) : the concentration of the exhaust component “gas”;
  •   Q e x h   ( kg / s ) : the exhaust mass flow rate.
In addition, the vehicle speed measured by GPS signal of the PEMS equipment and the vehicle speed measured by OBD data of the SEMS equipment are compared and presented in Figure 8. The comparison results indicated that the slope of the exhaust flow rate between the two types of equipment was 0.93, and the slope of the vehicle speed was significantly close to 1. Accordingly, it was possible to verify the reliability of the OBD data measured by the SEMS equipment.

3. Results

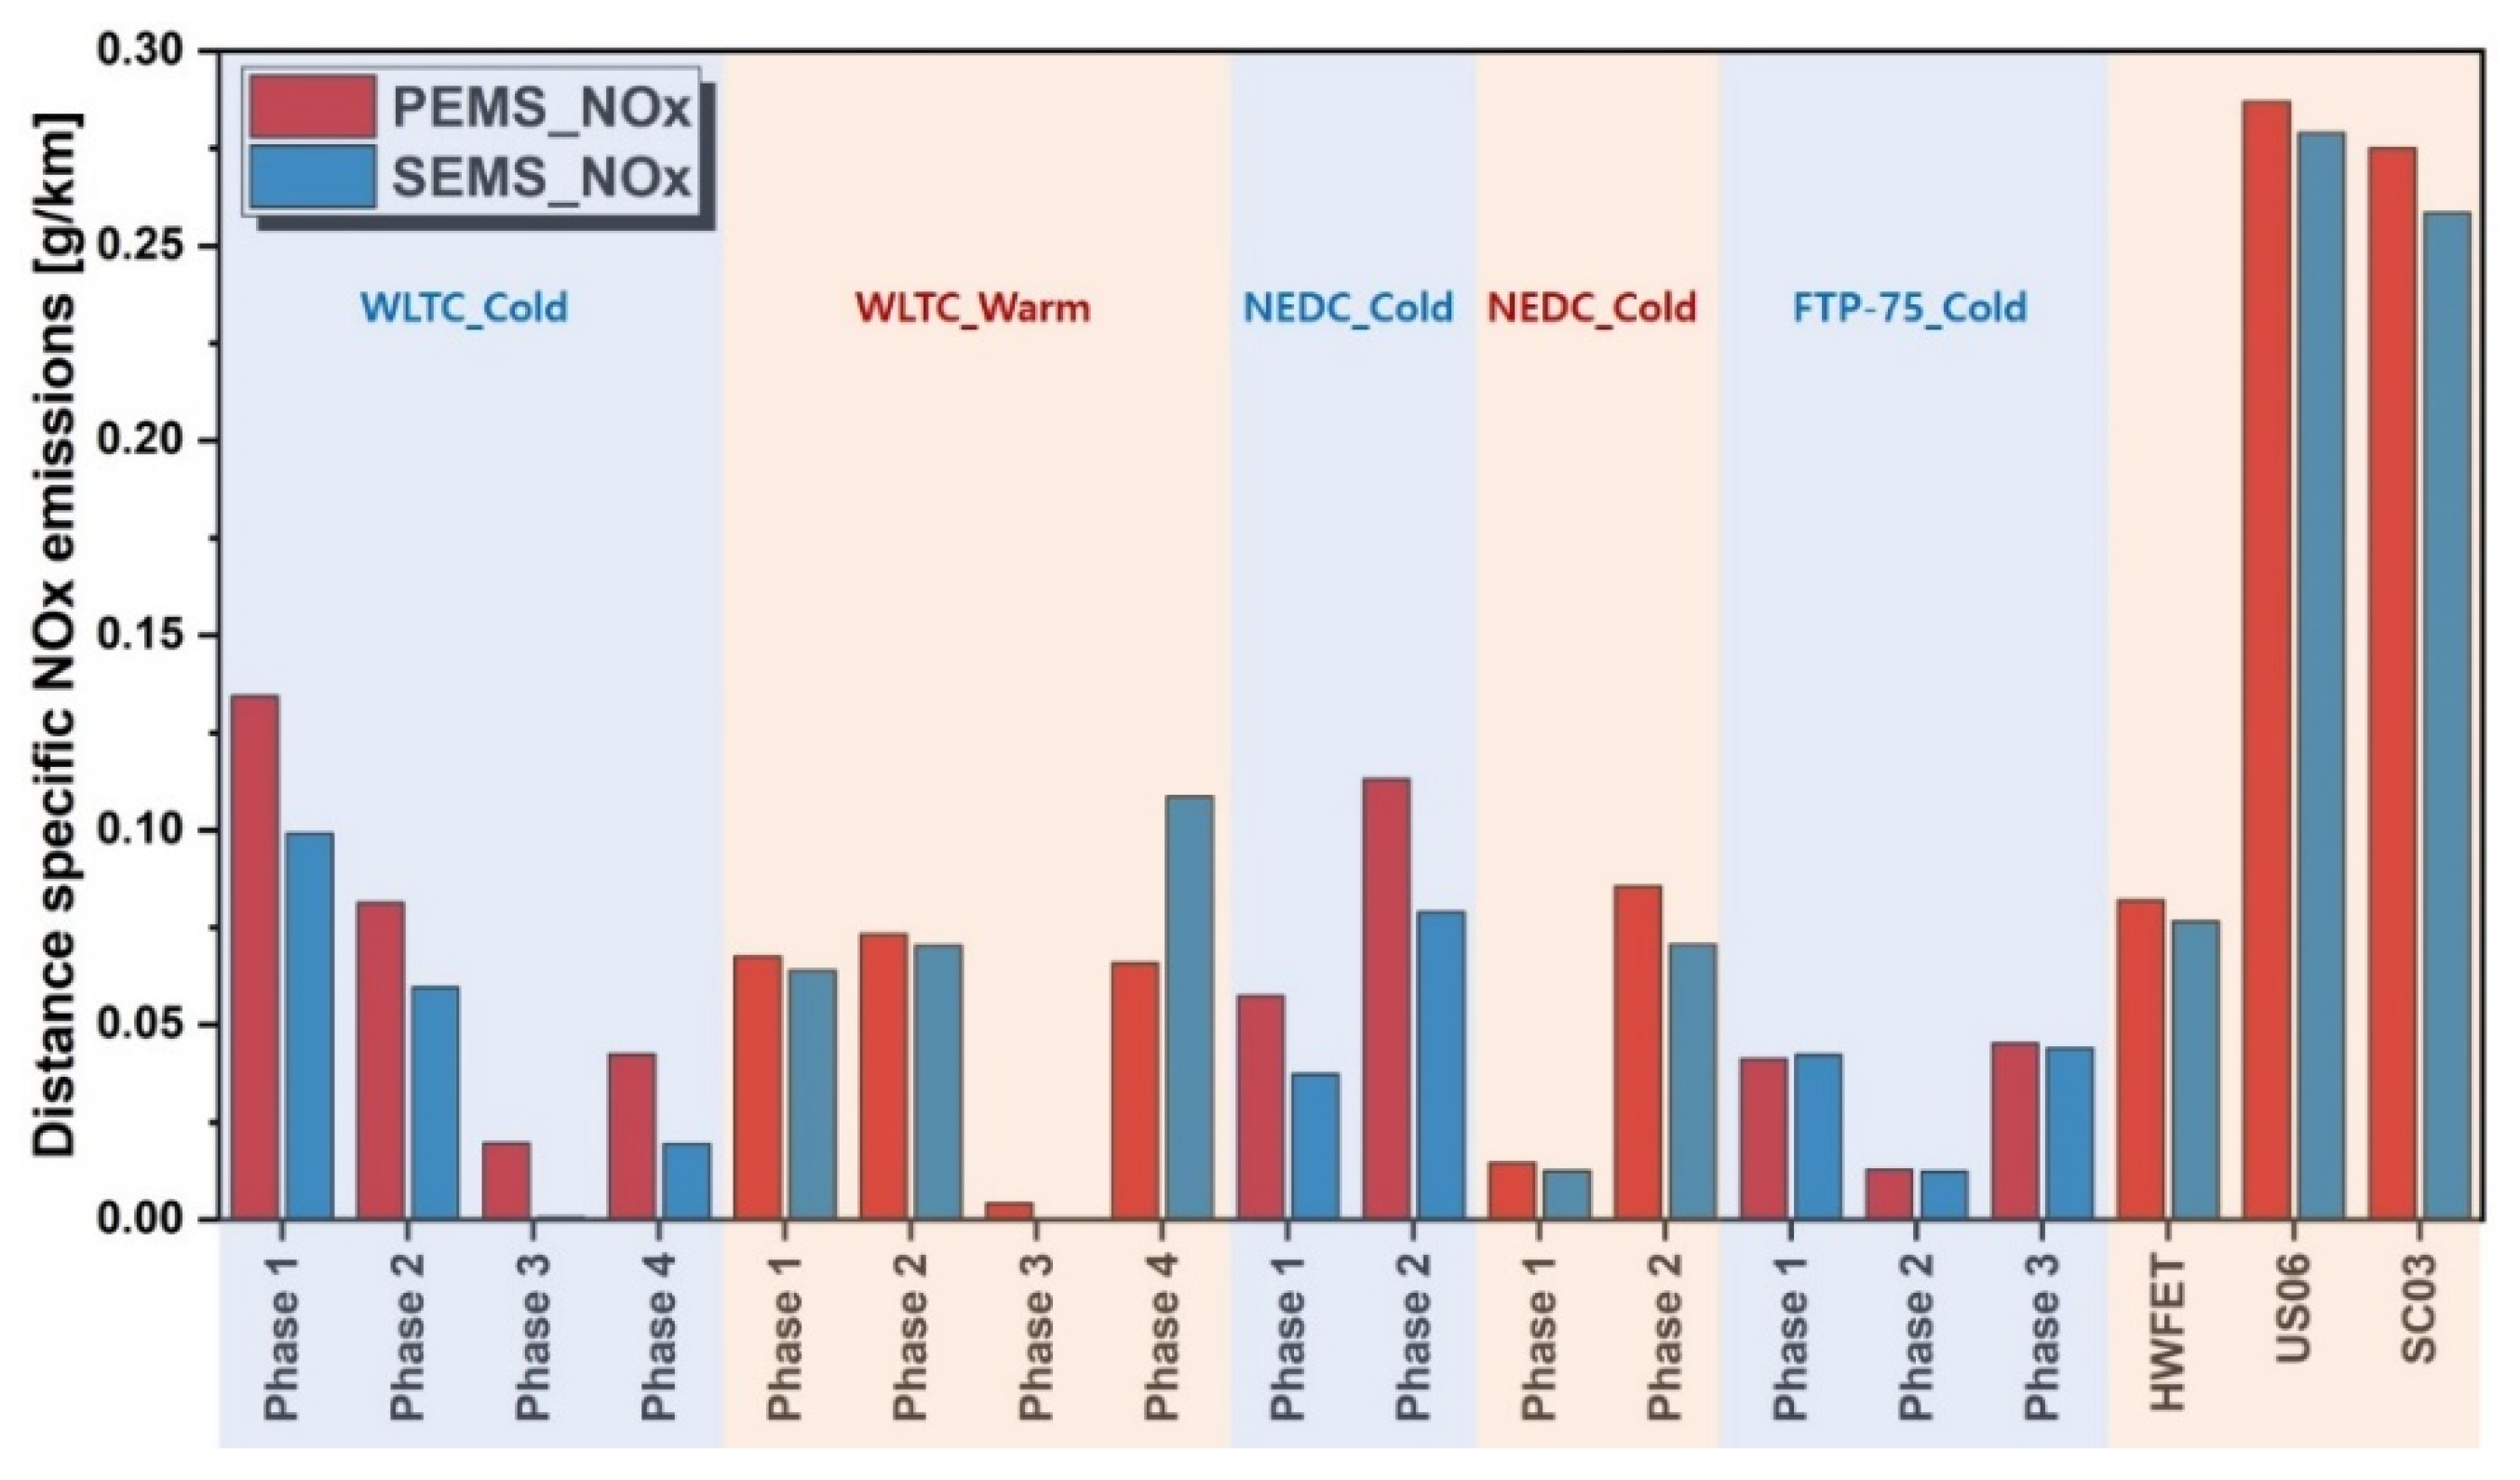
3.1. Correlation of NOx Emissions between the PEMS and SEMS Equipment in Laboratory

In this study, the reliability of the NOx emissions measured by the SEMS equipment was verified by comparing the results with the NOx emissions measured by the PEMS equipment, which was verified through correlation with the CVS equipment in a laboratory.
Various test modes were considered for the test vehicle with the chassis dynamometer in the laboratory to verify the reliability of the SEMS equipment. The test results of the exhaust emissions from the test vehicle under the cold and hot conditions for each test mode are shown in Figure 9.
A total of nine correlation tests were conducted on a chassis dynamometer in the laboratory, and most of the NOx emissions measured by the PEMS and SEMS equipment were within the current NOx emission limit (0.08 g/km). In addition, it was verified that the slope of the NOx emissions measured by the PEMS and SEMS equipment exhibited a very close linearity to 1; the coefficient of determination was 0.961, thus indicating that the results were significantly similar.
Figure 10 presents a quantitative plot of NOx emissions measured by the PEMS and SEMS equipment. In phase 3 of the WLTC mode, NOx emissions measured by the SEMS equipment were significantly lower. Consequently, NOx emissions were measured close to zero. This is an error that cannot be measured over a range, which indicates significantly lower NOx emissions measured by the SEMS equipment. Thus, a measurement error of the NOx sensor may exist.
Based on the testing under cold and hot conditions in the NEDC and WLTC modes, more NOx emissions were measured under the cold condition than of the hot condition. This is because excessive exhaust emissions are triggered by incomplete combustion owing to the low temperature in the combustion chamber of the engine at an initial start-up condition, and the catalyst of the after-treatment is not sufficiently preheated, thereby resulting in excessive exhaust emissions owing to low conversion efficiency [19,20].
Unlike the results of the other test modes, US06 and SC03 exhibited high NOx emissions. As can be deduced from Table 3, the US06 mode is significantly more aggressive than other test modes, such as in its acceleration and driving characteristics. In the case of the SC03 mode, NOx emissions are significantly high because it operates an air conditioner. If the air conditioner is operated, the engine in the test vehicle exerts an excessive load; hence, it is considered that NOx emissions are substantially high.
Figure 11 presents the time continuous NOx emissions measured by the PEMS and SEMS equipment under each test mode. It can be seen that profiles of NOx emissions measured by the PEMS and SEMS equipment follow similarly under all the test modes.
Based on the comparison of the NOx emissions measured by the PEMS and SEMS equipment under various test modes on a chassis dynamometer in the laboratory, profiles of NOx emissions measured by the PEMS and SEMS equipment follow similarly; this is because a laboratory test involves relatively fewer variables such as road grade and sharp acceleration and deceleration of dynamic conditions, as compared to real driving conditions. However, there was the difference that could not be measured by the SEMS equipment owing to the significantly low NOx emissions in the section where the test vehicle was stabilized in the driving mode, such as phase 3 of the WLTC mode. This challenge is owing to the limitation of the low-cost NOx sensor. The detailed limitation of NOx sensor means NOx tolerance. The tolerance of NOx sensor is ±20 ppm measured within 0~100 ppm. There is a limit due to NOx tolerance when measured as low as 20 ppm or less. Therefore, it was confirmed that future technology development is required.

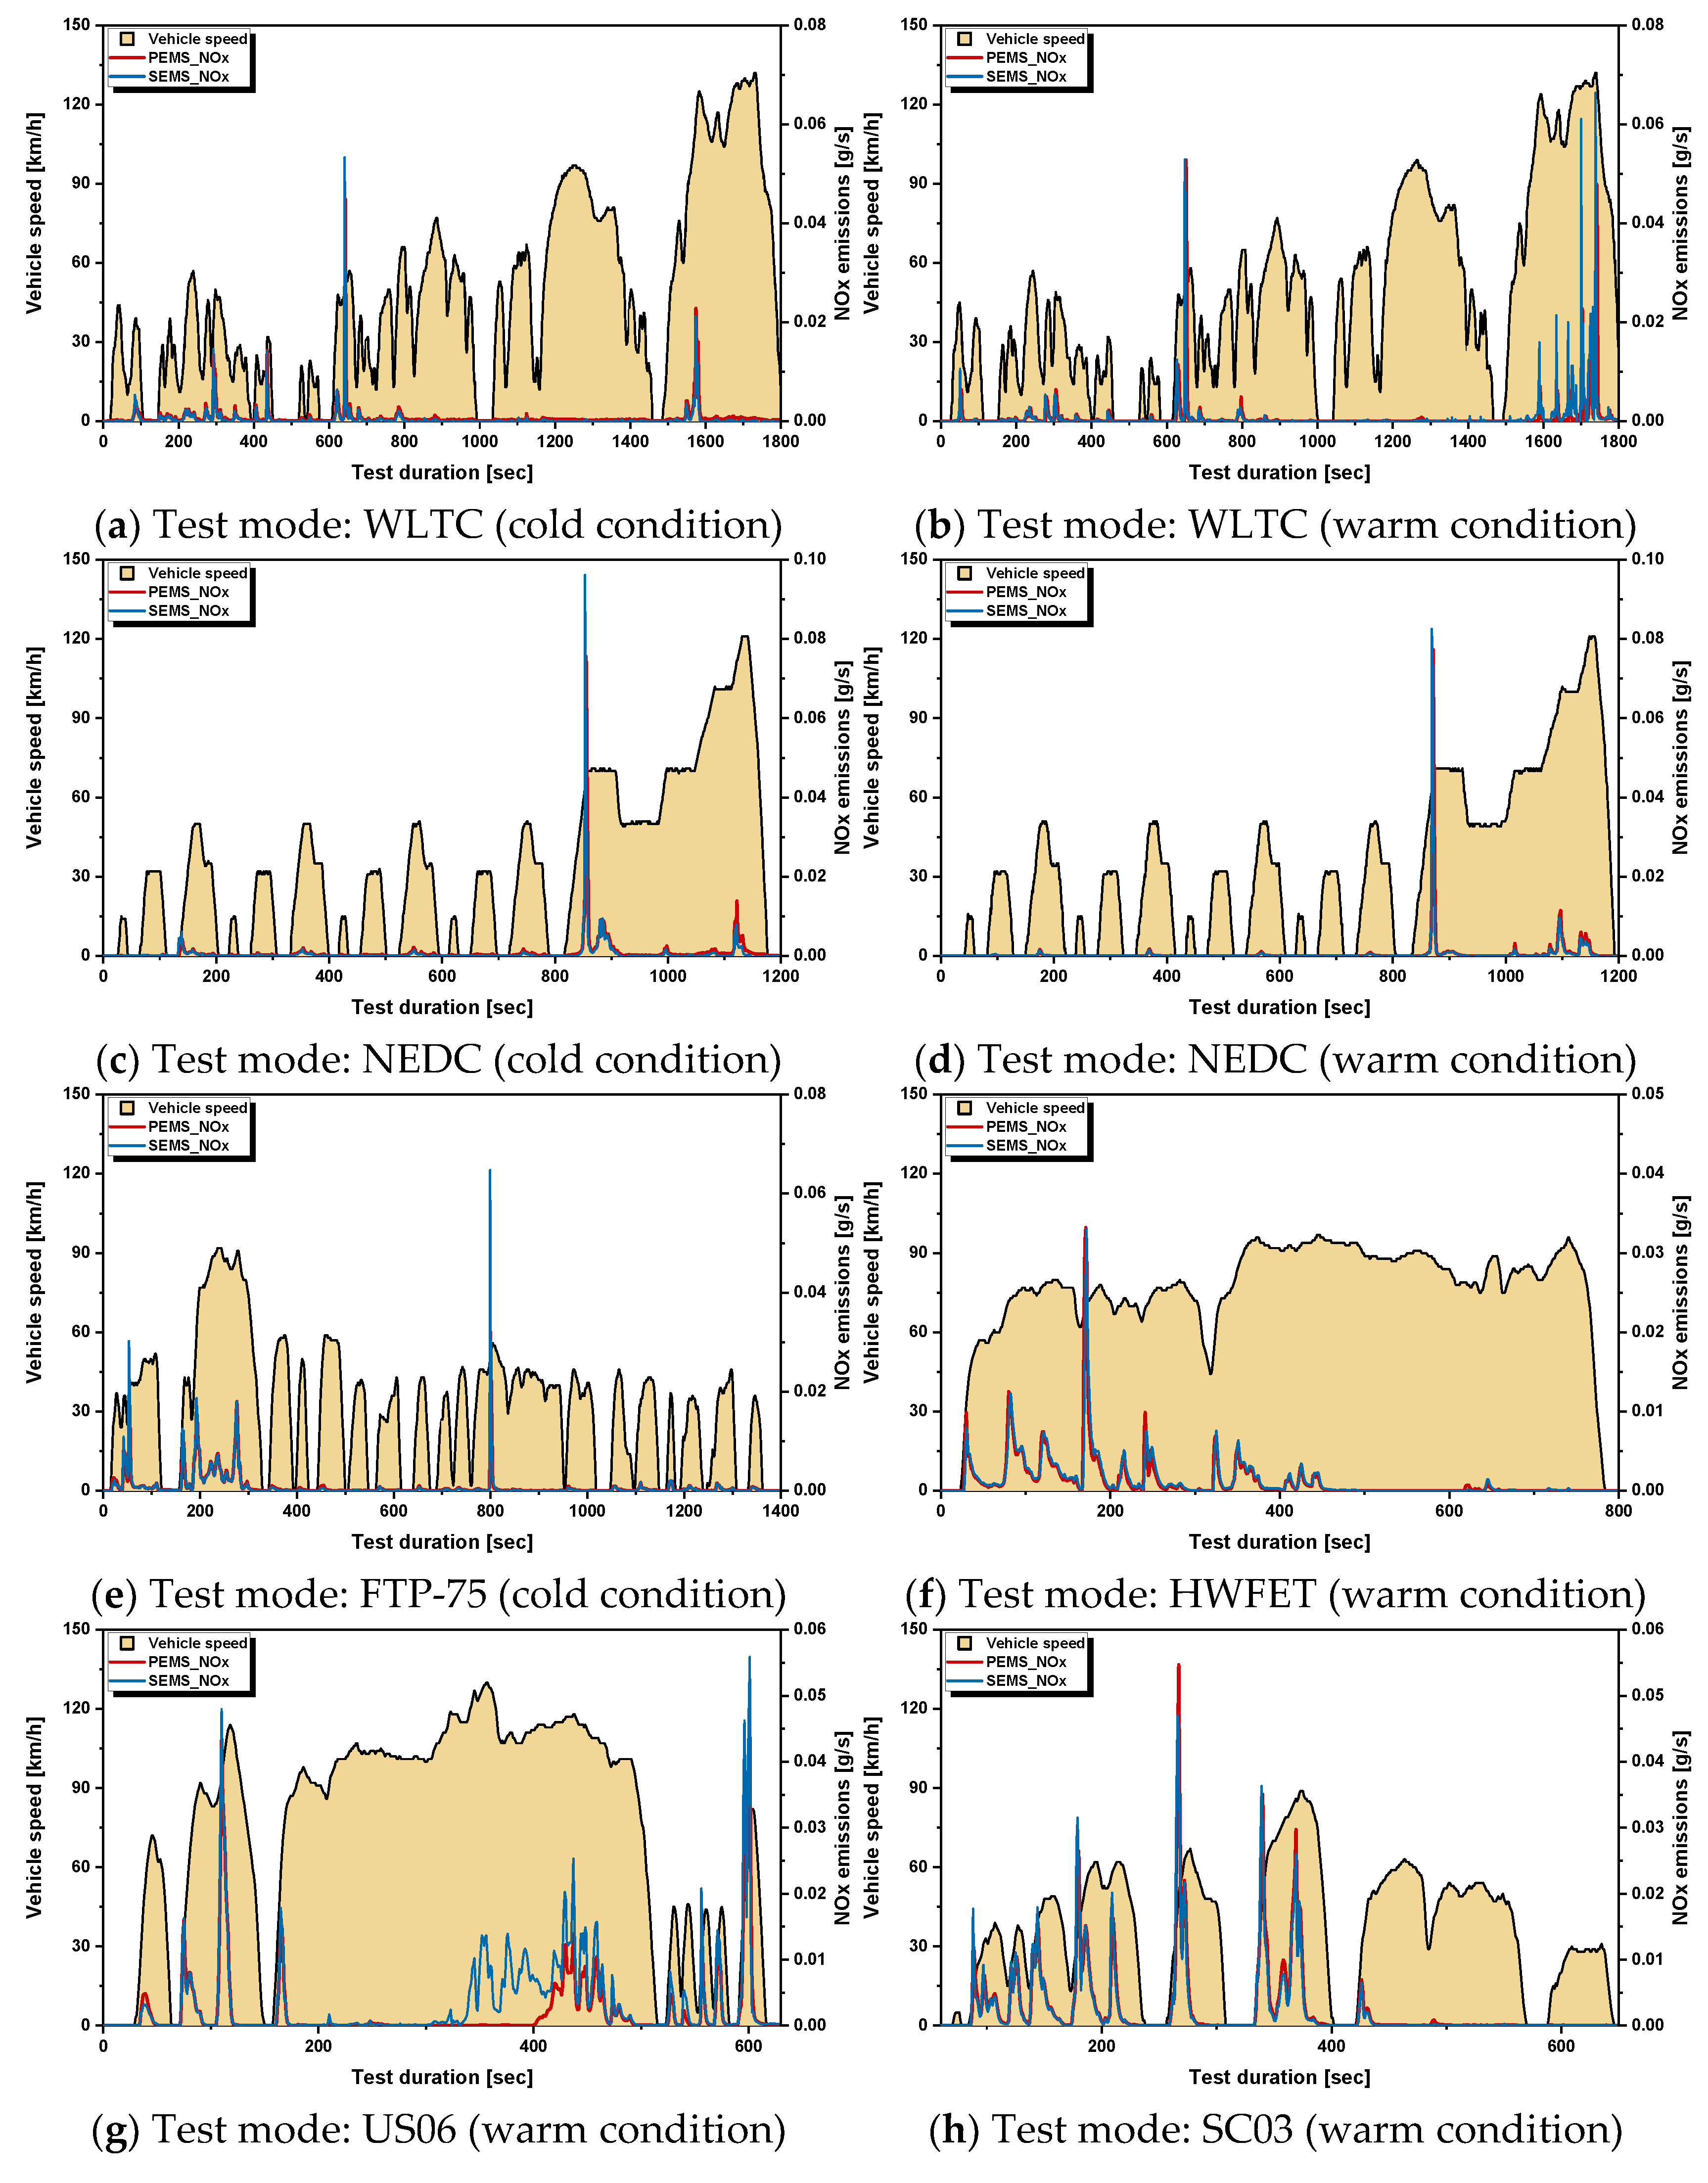
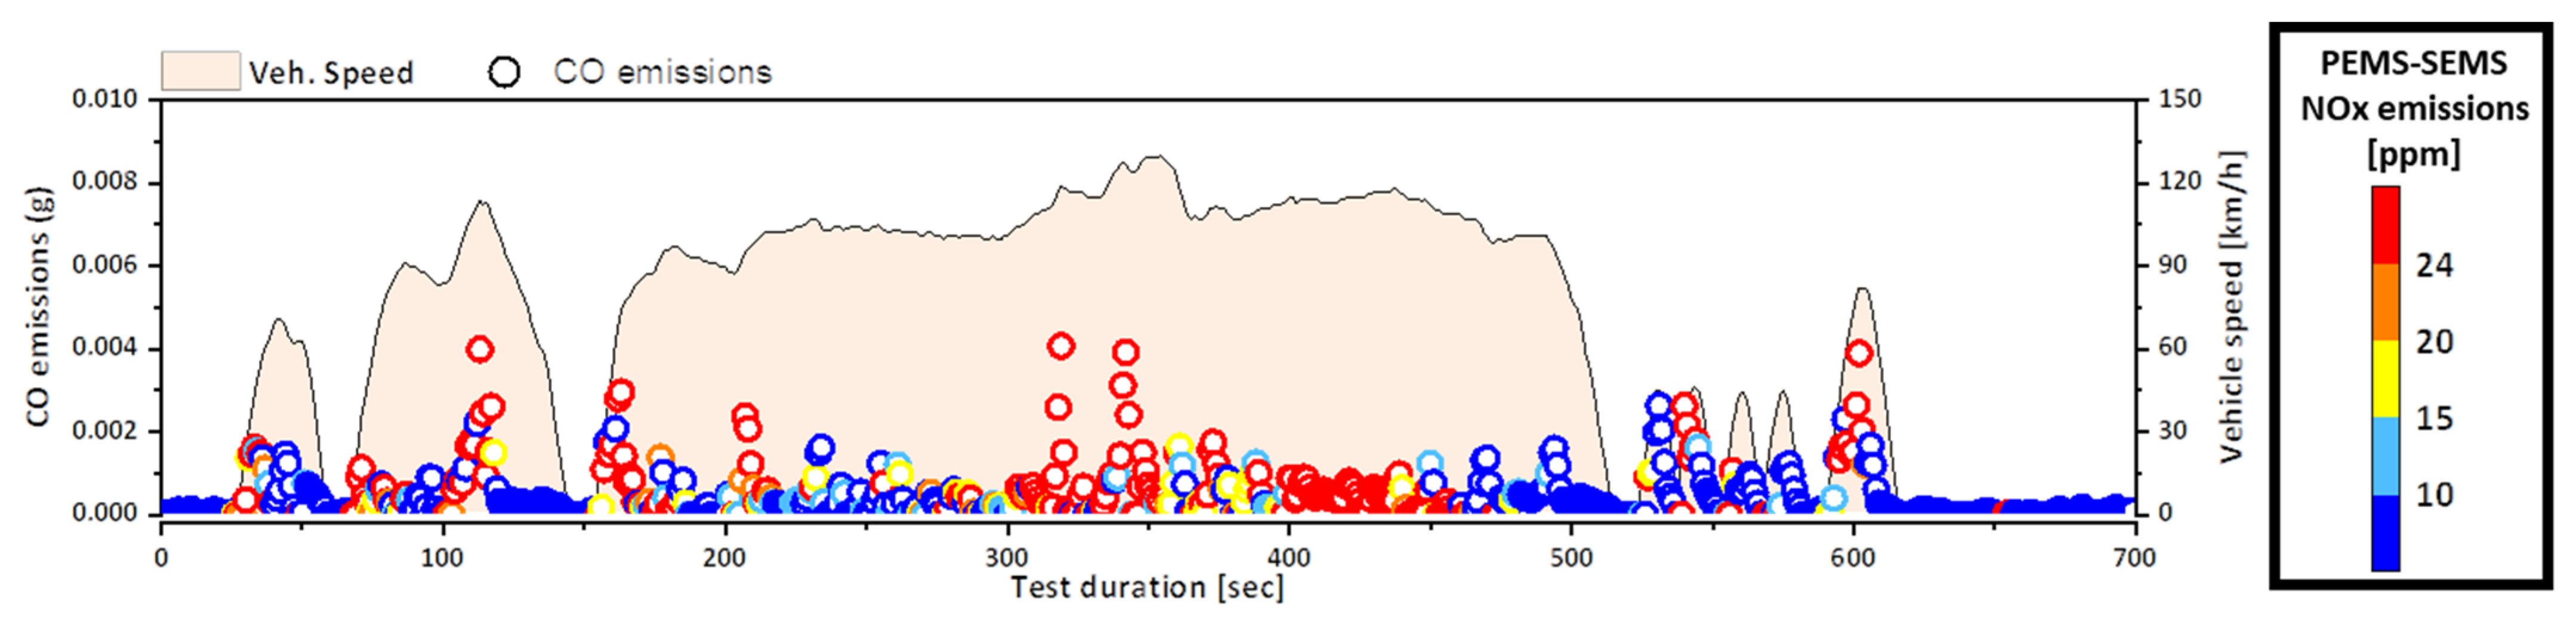
3.2. Detailed Analysis on Real-Time Profiles of NOx Emissions for Characteristics of the NOx Conversion in Laboratory

As shown in Figure 11, it can be observed that NOx emissions measured by the PEMS and SEMS equipment agree well due to strong acceleration and high speed of vehicle under the various test modes. To analyze these results, the data measured in US06, which reflects the effect of acceleration and the data measured in HWFET mode and considers high speed driving, are comprehensively presented, as illustrated in Figure 12 and Figure 13.
Figure 12 presents the measured data of the US06 mode, which reflects acceleration conditions, among the various modes on the chassis dynamometer in the aforementioned laboratory in real time. The analysis indicated that the difference between the NOx emissions measured by the PEMS and SEMS equipment was large because of the increase in CO emissions during acceleration. This is ascertained to be the effect of the LNT system installed on the test vehicle. The LNT system is a catalyst that reduces NOx emissions without a reducing agent, such as NH3. In addition, the LNT catalysts run periodically under lean (oxidizing) and rich (reducing) conditions [21].
Figure 14 illustrates the principle of the LNT system under lean and rich conditions, and there is a detailed explanation of the NOx storage and reduction behavior.
The first step is that the NO emissions were oxidized to NO2 under lean conditions, as expressed in Equation (3). Then, the NO2 emissions react with oxygen in the LNT system to reduce nitrogen oxides and generate carbon dioxide, as expressed in Equation (4). To reduce NOx emissions, CO and HC in the exhaust gases are applied as reducing agents or post-injections. The last step involves the oxidation and reduction of NOx emissions, which are converted to NO and CO2, as expressed in Equation (5) [22,23].
Oxidation of NO, and formation of NO2 (lean conditions)
2NO + O2 → 2NO2
Absorption of NOx inside the LNT system (lean conditions)
2BaCO3 + 4NO2 + O2 → 2Ba(NO3)2 + 2CO2
Release of the stored NOx from the LNT system surface (rich conditions)
Ba(NO3)2 + 3CO → BaCO3 + 2NO + 2CO2
NO + CO/HC → N2 + CO2/H2O
NO2 + CO/HC → N2 + CO2/H2O
Figure 13 illustrates the difference between the NOx emissions measured by the two equipment types in real time according to the NOx conversion efficiency of the SCR system in the HWFET mode, which simulates highway driving.
Based on the analysis, it was confirmed that when the NOx conversion efficiency of the SCR system decreases, the difference between the NOx emissions measured using the two types of equipment increases. These results need to be determined based on the SCR system. Figure 15 presents the schematic of the SCR mechanism. The NOx reduction effect of the SCR catalyst is expressed as follows in Equations (6)–(8) [24,25].
4NO + O2 + 4NH3 → 4N2 + 6H2O
NO + NO2 + 2NH3 → 2N2 + 3H2O
6NO2 + 8NH3 → 7N2 + 12H2O
In the above equation, NH3 does not react with oxygen under normal exhaust temperatures below 550 °C; hence, the most significant NOx reduction effect of SCR is 100%.
Urea solution is supplied before the SCR system, and is hydrolyzed to NH3 via two steps of the following Equations (9) and (10) by the intermediate product isocyanic acid under an exhaust temperature above 250 °C [26].
(NH2) 2CO → NH3 + HNCO (thermal decomposition)
HNCO + H2O → NH3 + CO2 (hydrolysis)
The NOx conversion is sensitive to temperature, and hydrolysis does not occur even if excess urea solution is injected under low temperatures. Therefore, the NOx conversion is possible, using the absorbed NH3 of the urea solution. However, if the temperature increases rapidly, the absorbed NH3 is released and oxidized on reacting with oxygen. Then, the NOx conversion decreases as much as the excessive NH3 [27].
Therefore, the urban part with frequent acceleration is expected to have higher NOx emissions measured by the PEMS and SEMS equipment under the effect of the LNT system, as compared to other parts. Although, in the motorway part, NOx emissions are significantly reduced by chemical reactions with NH3 inside the SCR system, it is expected that NH3 is excessively injected, thereby resulting in a difference between NOx emissions measured by PEMS and SEMS equipment. As the NOx sensor installed in the SEMS equipment measures NO and NO2 emissions from NOx and NH3 emissions, it cannot measure only NOx emissions. The details on the information are introduced in Section 2.3.3. Hence, in the motorway part, it is expected that NOx emissions measured by the SEMS equipment will be higher than the NOx emissions measured by the PEMS equipment.

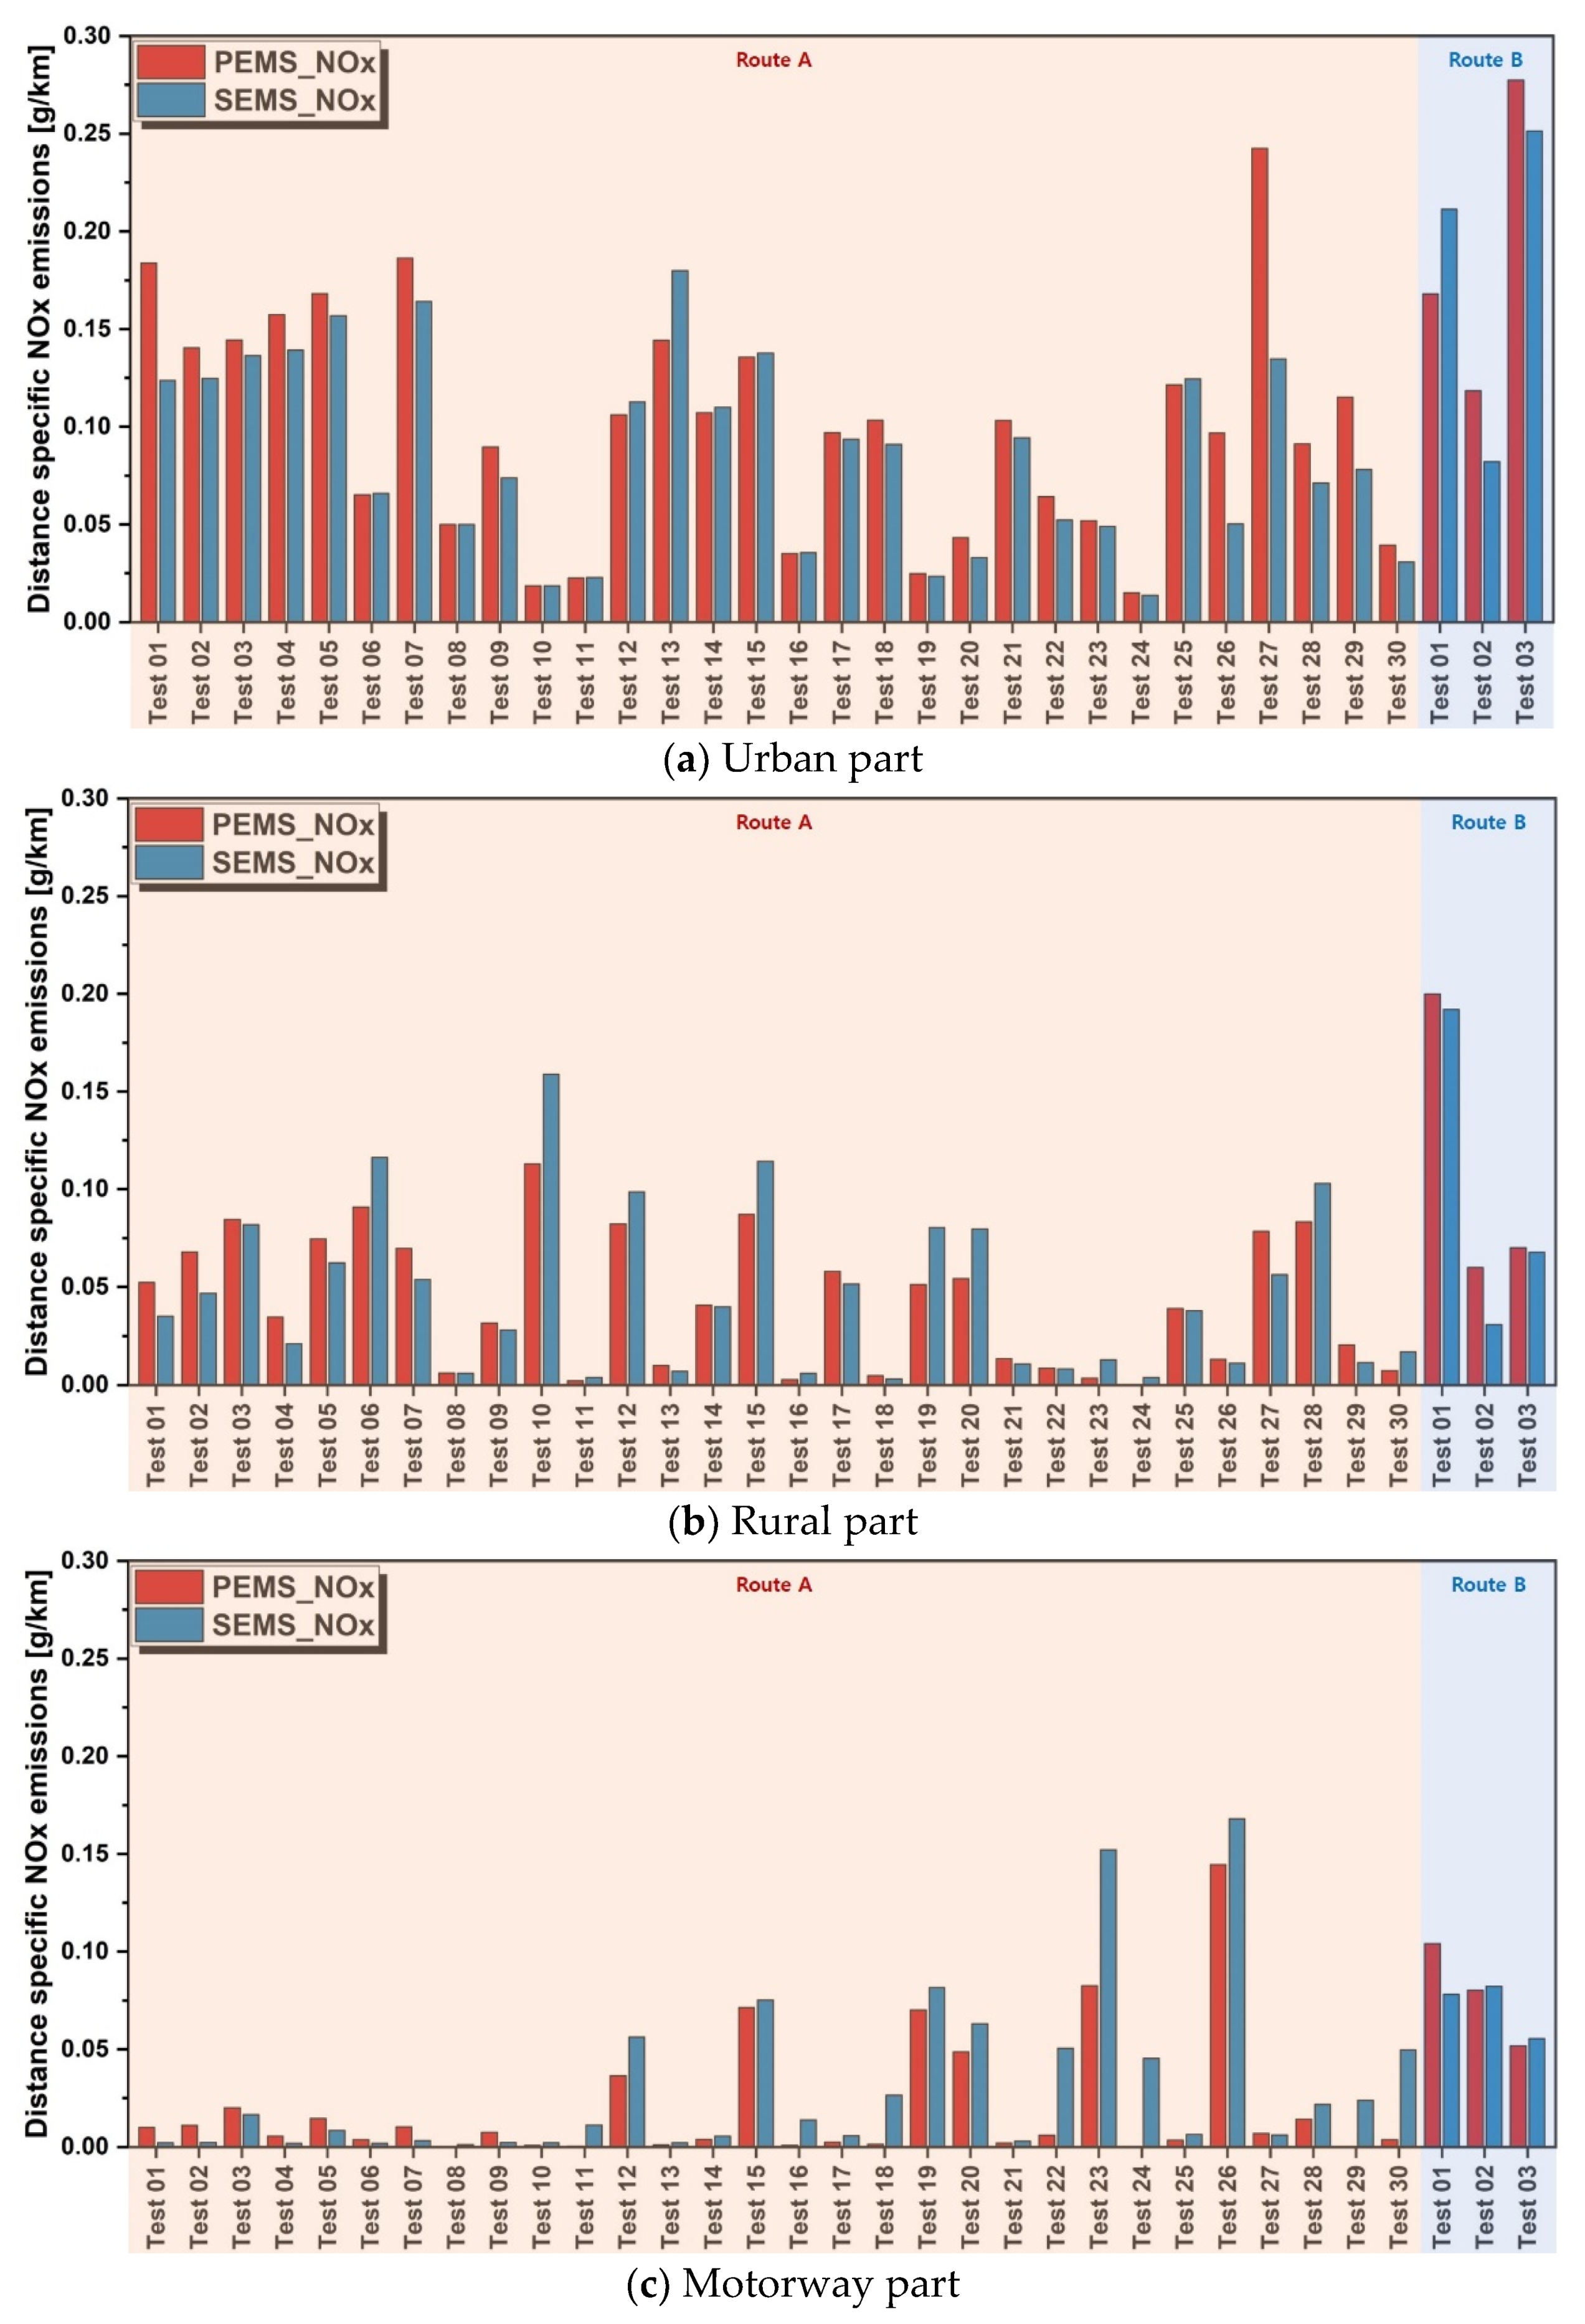
3.3. Correlation of NOx Emissions between the PEMS and SEMS Equipment On-Road

In this study, NOx emissions were measured by the PEMS and SEMS equipment over a total of 33 (Route A = 30 times, Route B = 3 times) on-road conditions with various driving variables compared to the various test modes, on a chassis dynamometer in the laboratory.
In Figure 16, the red circles indicate NOx emissions measured by PEMS and SEMS equipment on Route A, and the blue circles indicate NOx emissions measured by PEMS and SEMS equipment on Route B. Based on the comparison of NOx emissions measured by PEMS and SEMS equipment under RDE tests, the slope of the RDE test was 0.816, which is lower than the slope of the laboratory test. The slope of the RDE test was lower than that of the chassis dynamometer because the test was considered owing to the various on-road driving variables, such as a traffic jam in the urban part, driving style according to the driver, and road grade of route. These various on-road driving variables affect the engine load of vehicle. As the engine load of the vehicle increases, NOx emissions increase, and the tolerance of NOx emissions measured by the two types of equipment increases [28]. For this reason, the slope of the on-road is lower than that of the chassis dynamometer. In addition, the coefficient of determination was 0.922, thus indicating that the results were very similar. Most of the test results were within the RDE NOx emissions limit (0.1144 g/km).
As presented in Figure 17, NOx emissions measured by PEMS and SEMS equipment on Routes A and B were quantitatively indicated for urban, rural, and motorway parts. Regarding the urban part, it was determined that NOx emissions were higher than that of other driving parts because there were various driving characteristics such as vehicle congestion owing to the shutdown of the signal system, and a highly populated metropolitan area. Regarding the rural and motorway, it was determined that NOx emissions were lower than that of the urban part because of inertia driving with a fuel-cut, which can improve the fuel efficiency of the vehicle, and reduced exhaust emissions becomes possible as vehicle speed increases [29]. In addition, NOx emissions measured by the SEMS equipment were relatively higher than that of the PEMS equipment. As this is an amperometric method, it is based on the principle of the NOx sensor in the SEMS equipment. The amperometric method generates nitrogen and oxygen by splitting NOx (NO and NO2), as defined in the following equations. At this point, the generated O2 molecules are measured as the NOx inside the sensor.
However, the NOx sensor adopted in this study measures NH3 emissions, and the measured NH3 emissions are split into NO and H2O, owing to the chemical reaction [28]. As aforementioned, the split chemical equation of NH3 emissions emerges accordingly.
Accordingly, it was determined that NOx emissions measured by the SEMS equipment were higher than those measured by the PEMS equipment.
Figure 18 and Figure 19 illustrate real-time NOx emissions measured by PEMS and SEMS equipment for each driving part in Routes A and B, respectively. It can be observed that the NOx emissions measured by the PEMS and SEMS equipment under the RDE tests are similar. Unlike the results of the various test modes on a chassis dynamometer in the laboratory, NOx emissions measured by the SEMS equipment were higher than those measured by the PEMS equipment because the RDE tests consider various driving variables. As mentioned above, excess NH3 emissions from the SCR system, which adopts NH3 as a reductant to reduce nitrogen oxides, were injected, such that it was determined that the NOx emissions were measured by the NOx sensor.

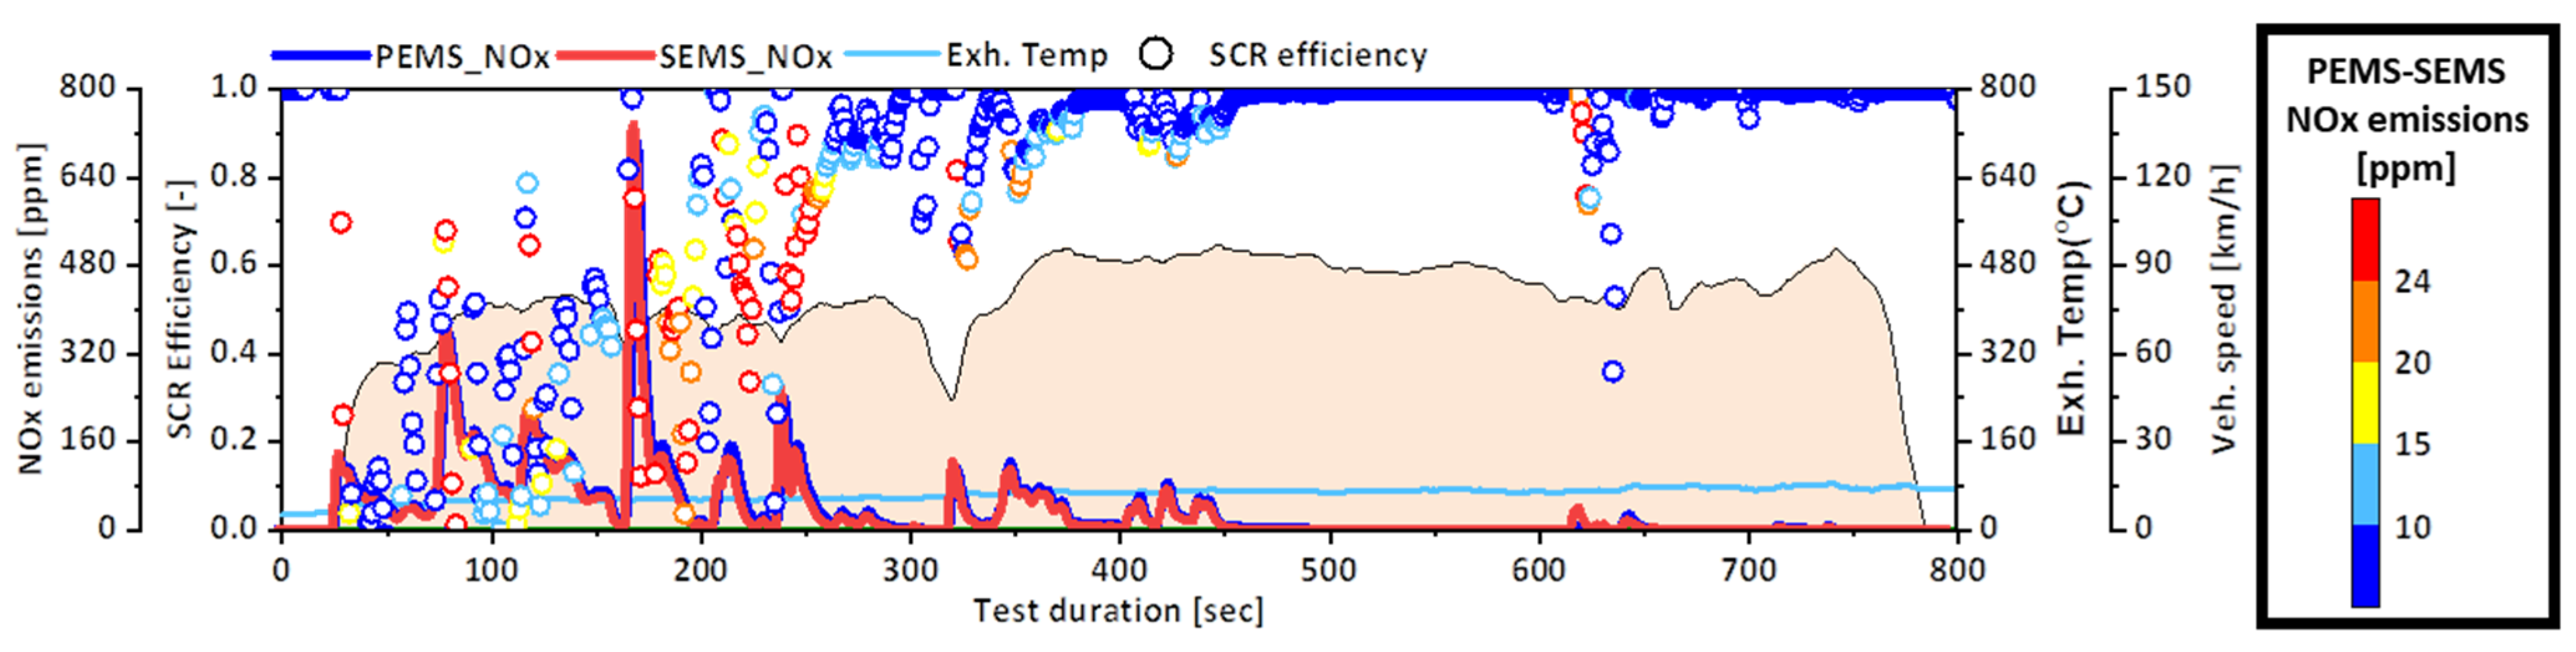
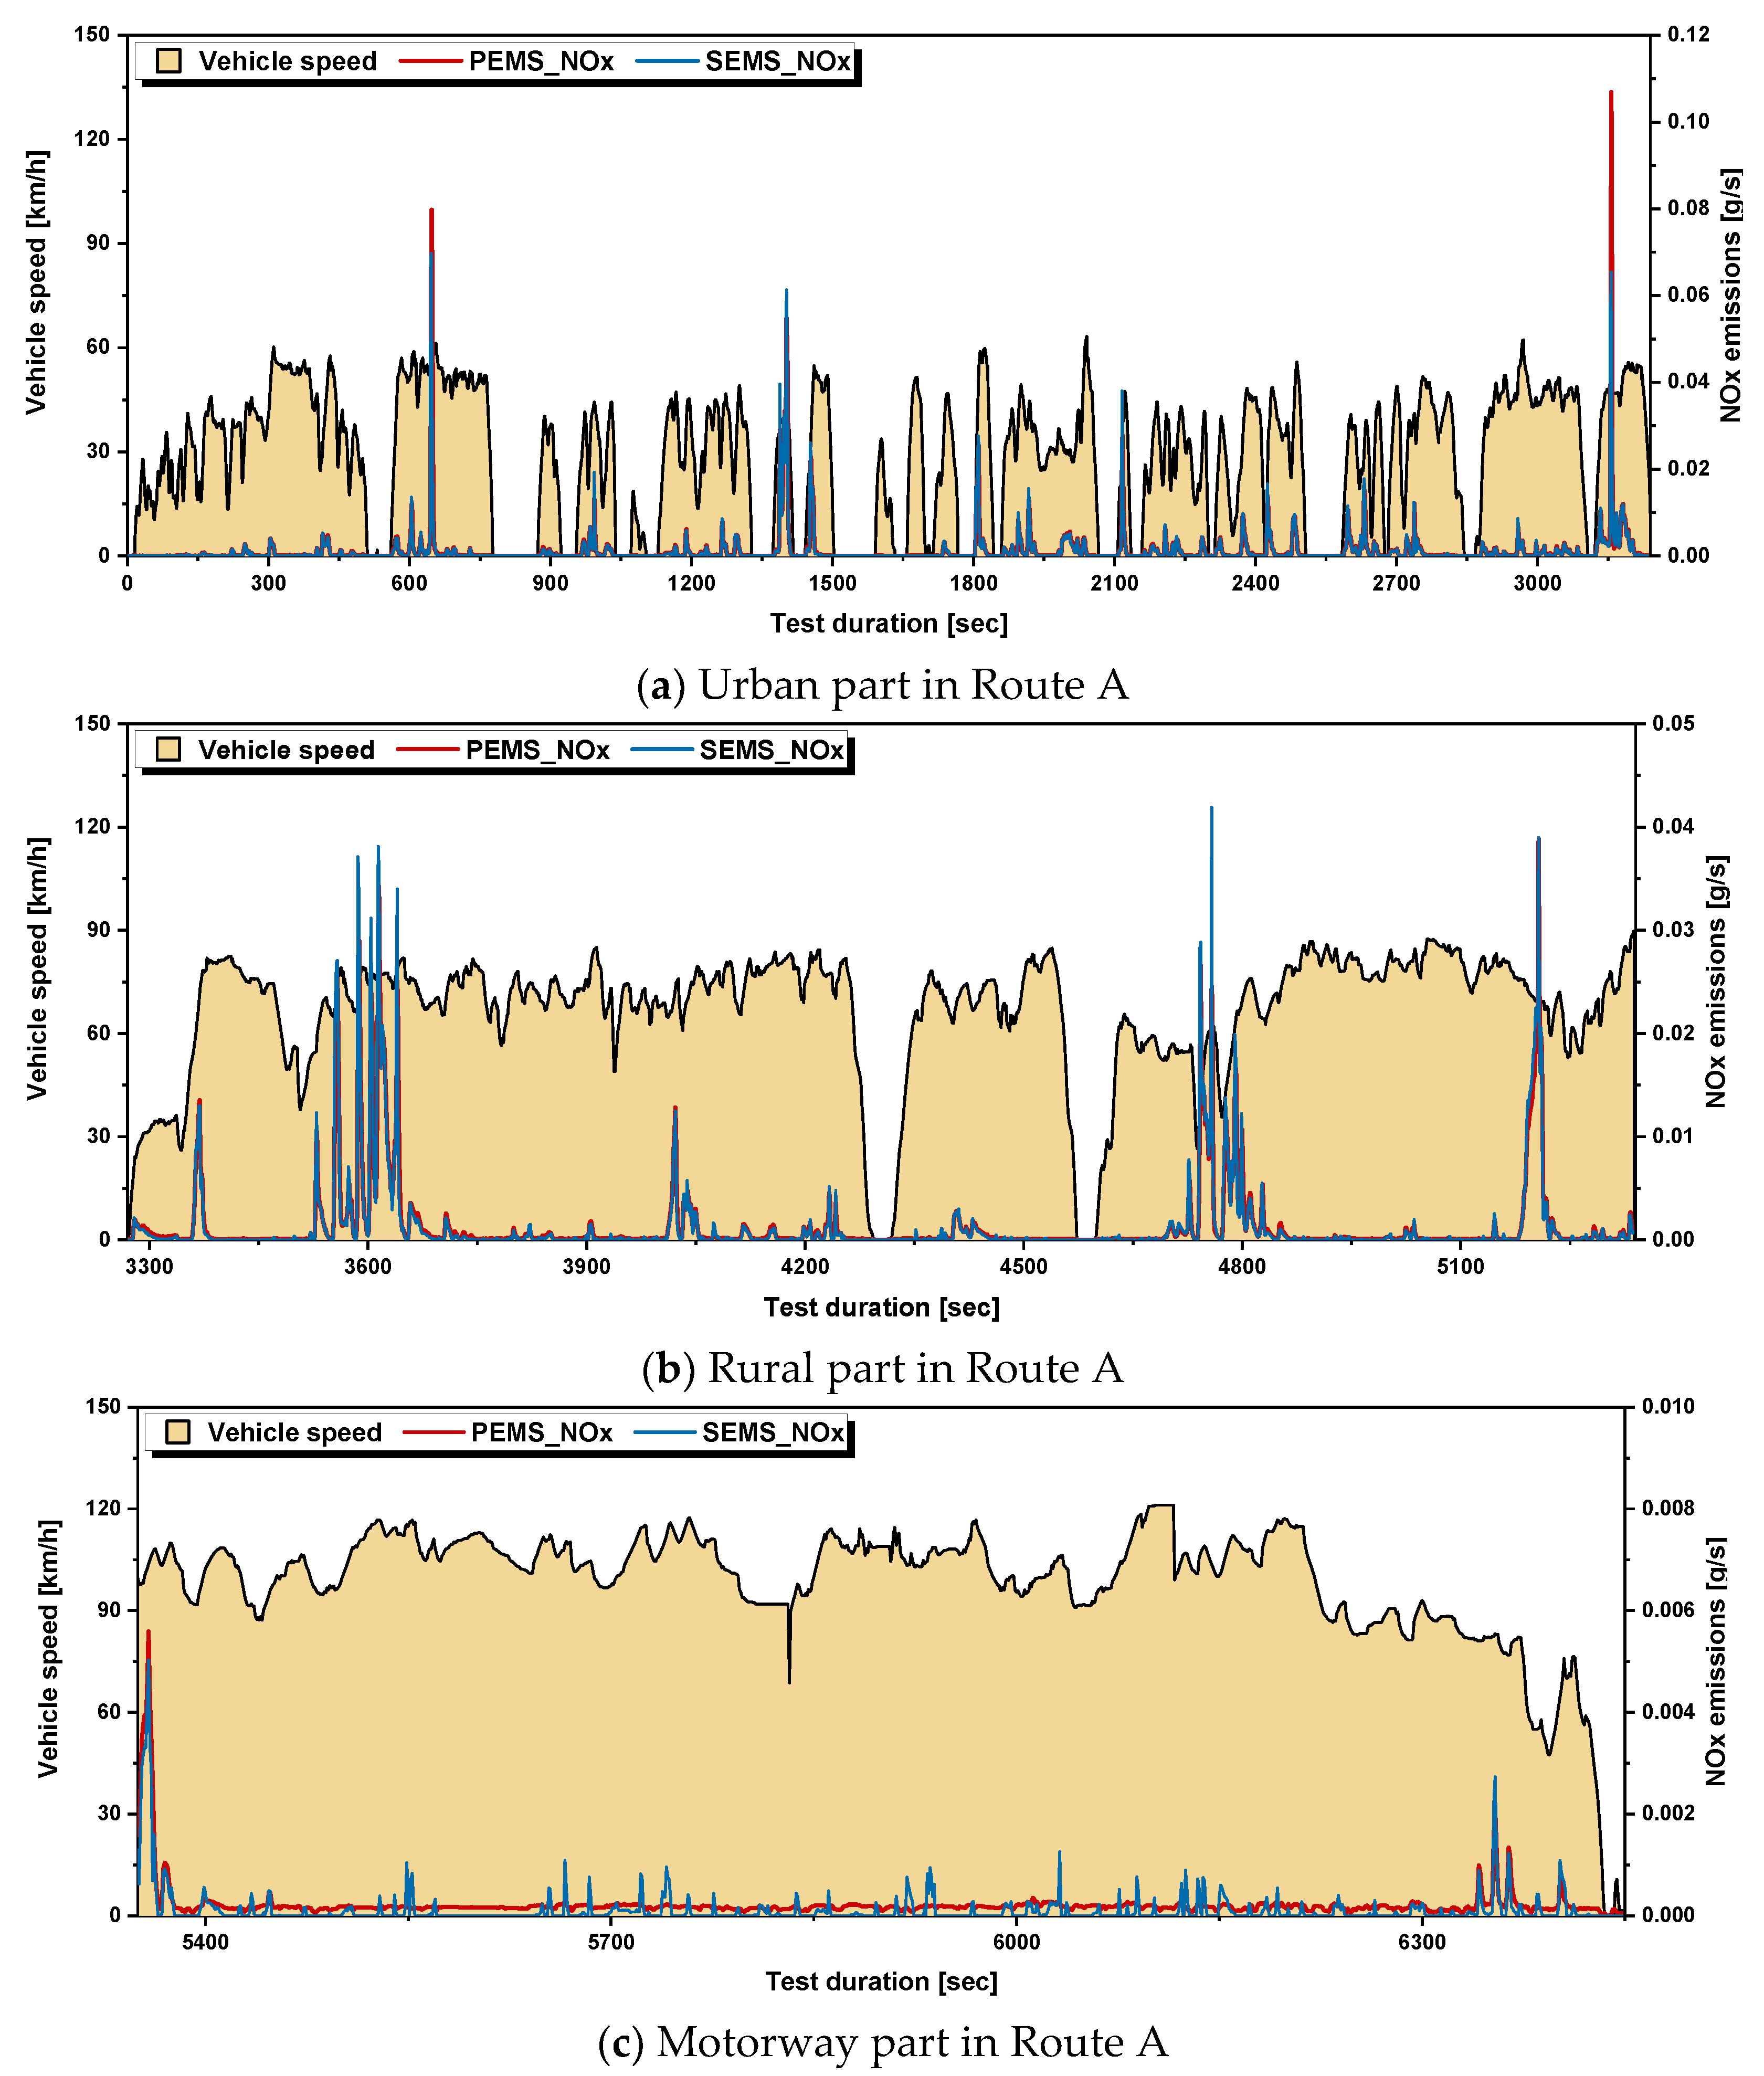
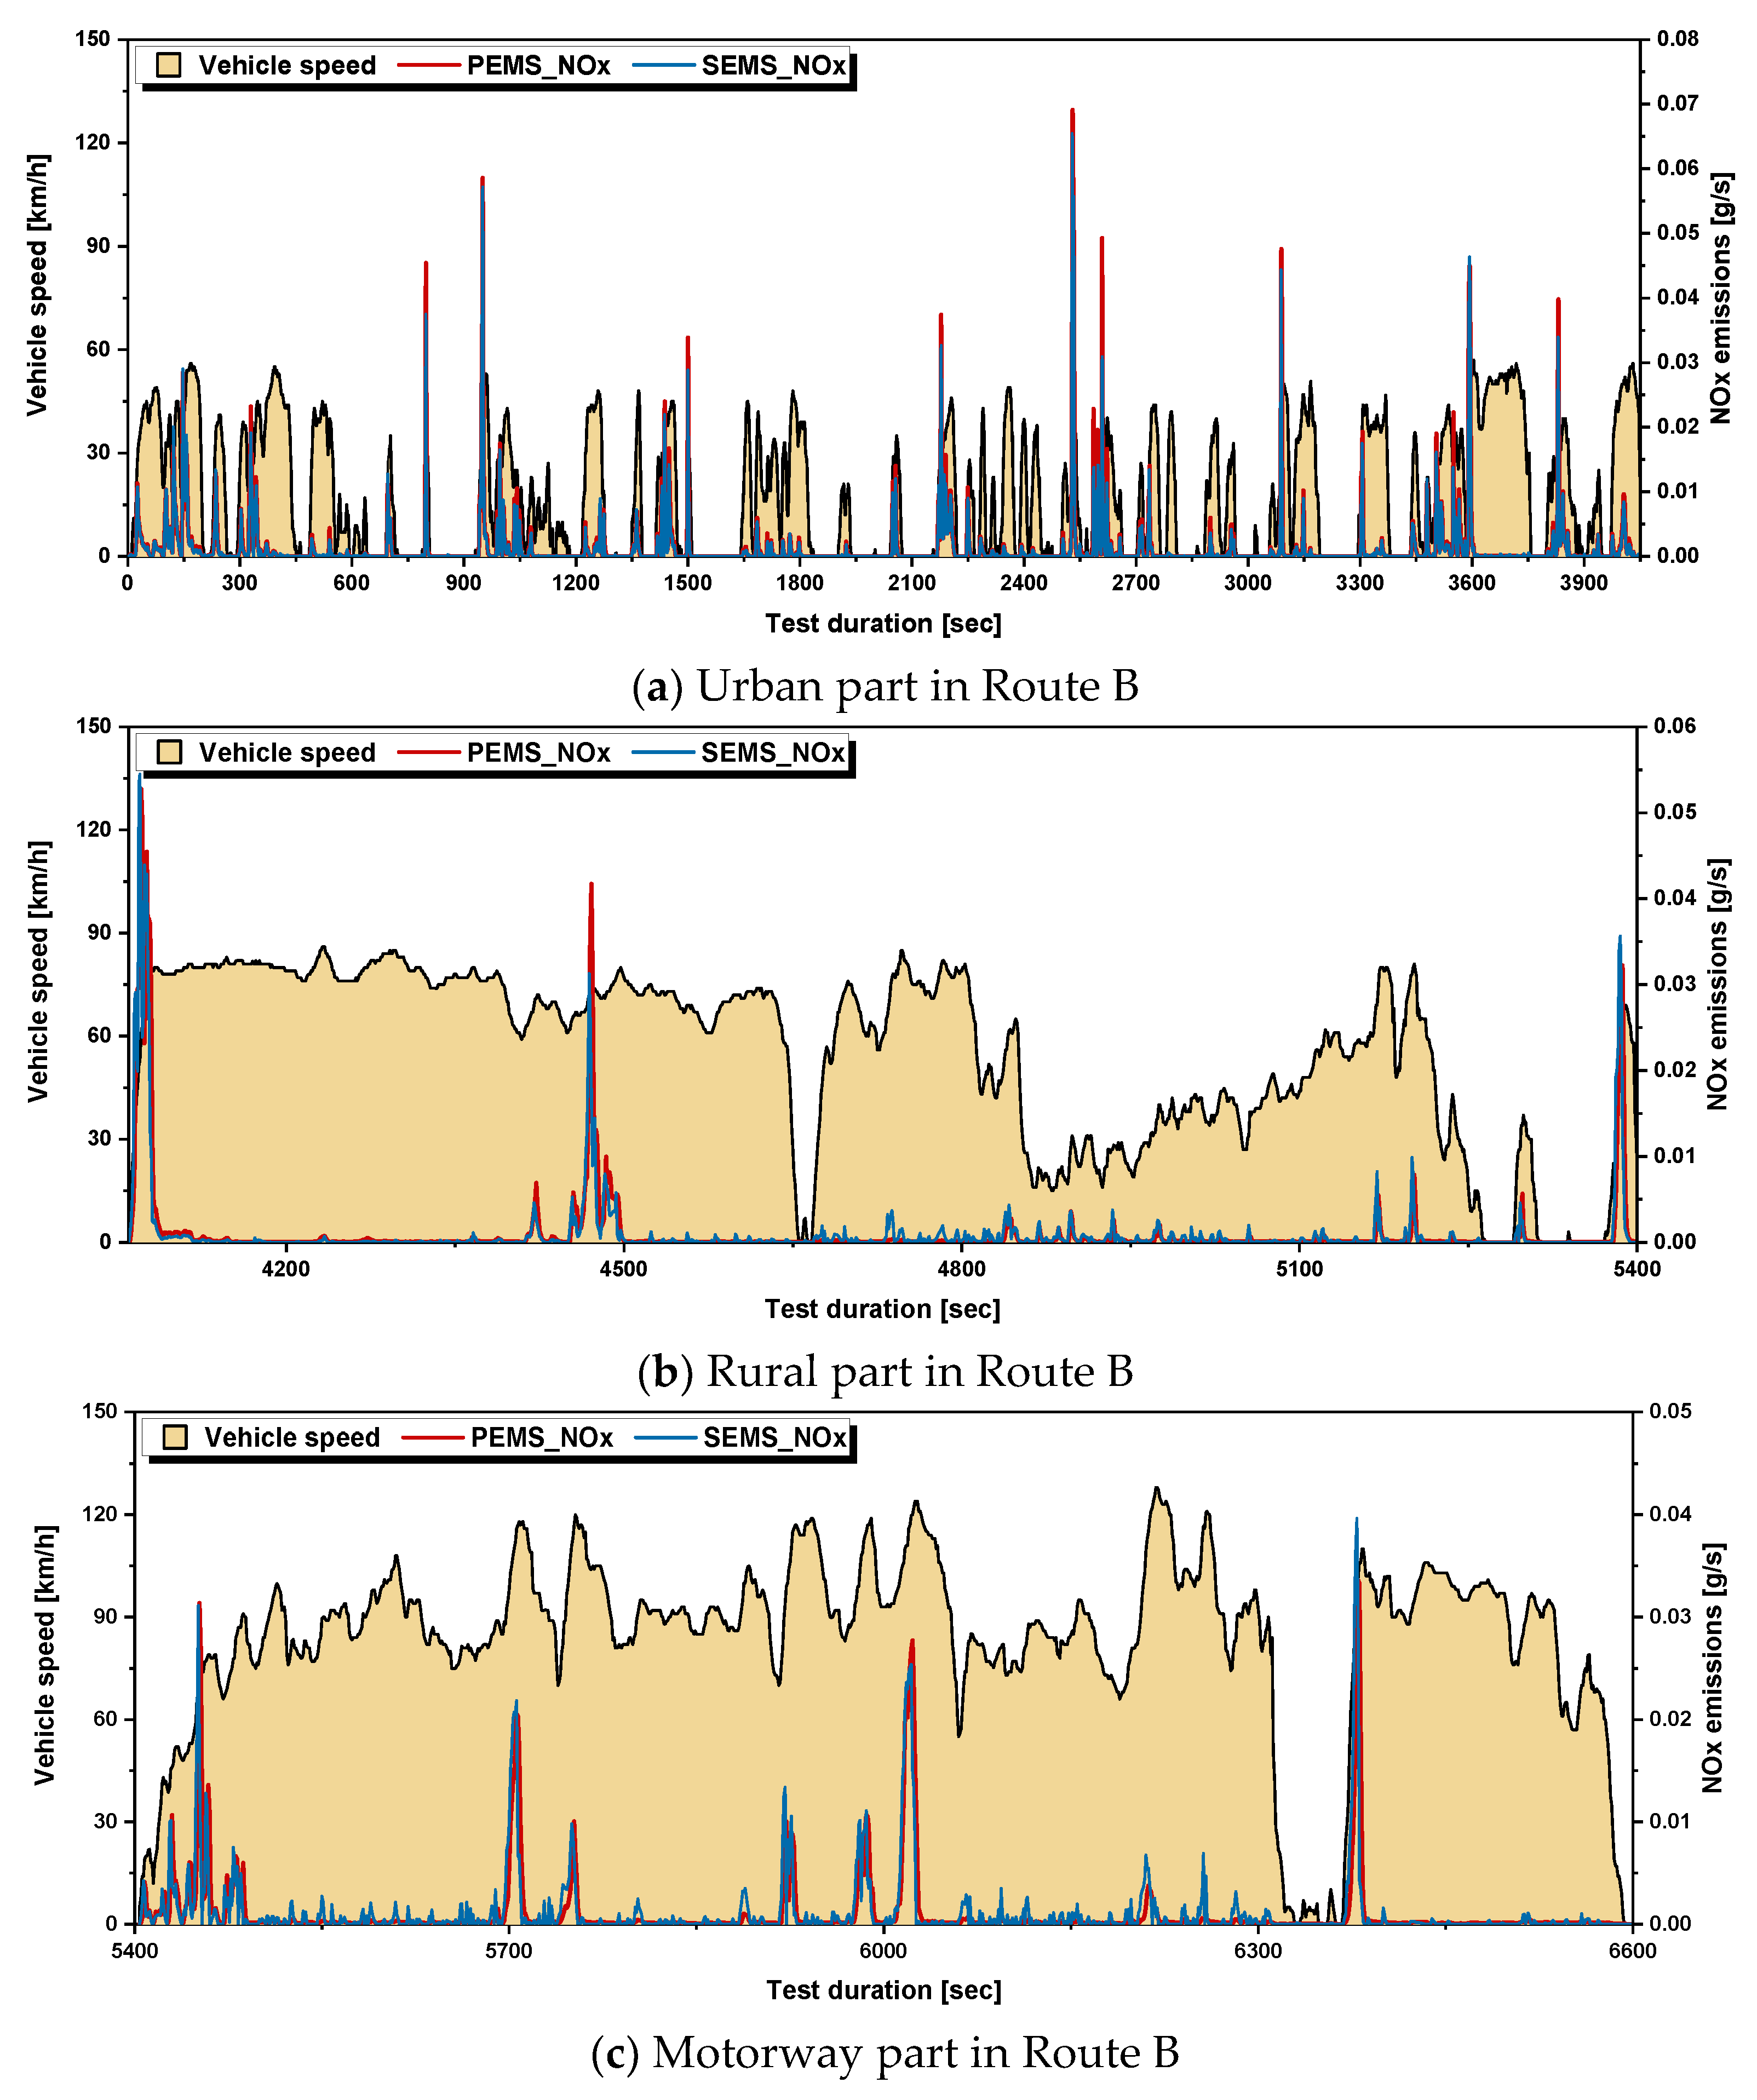
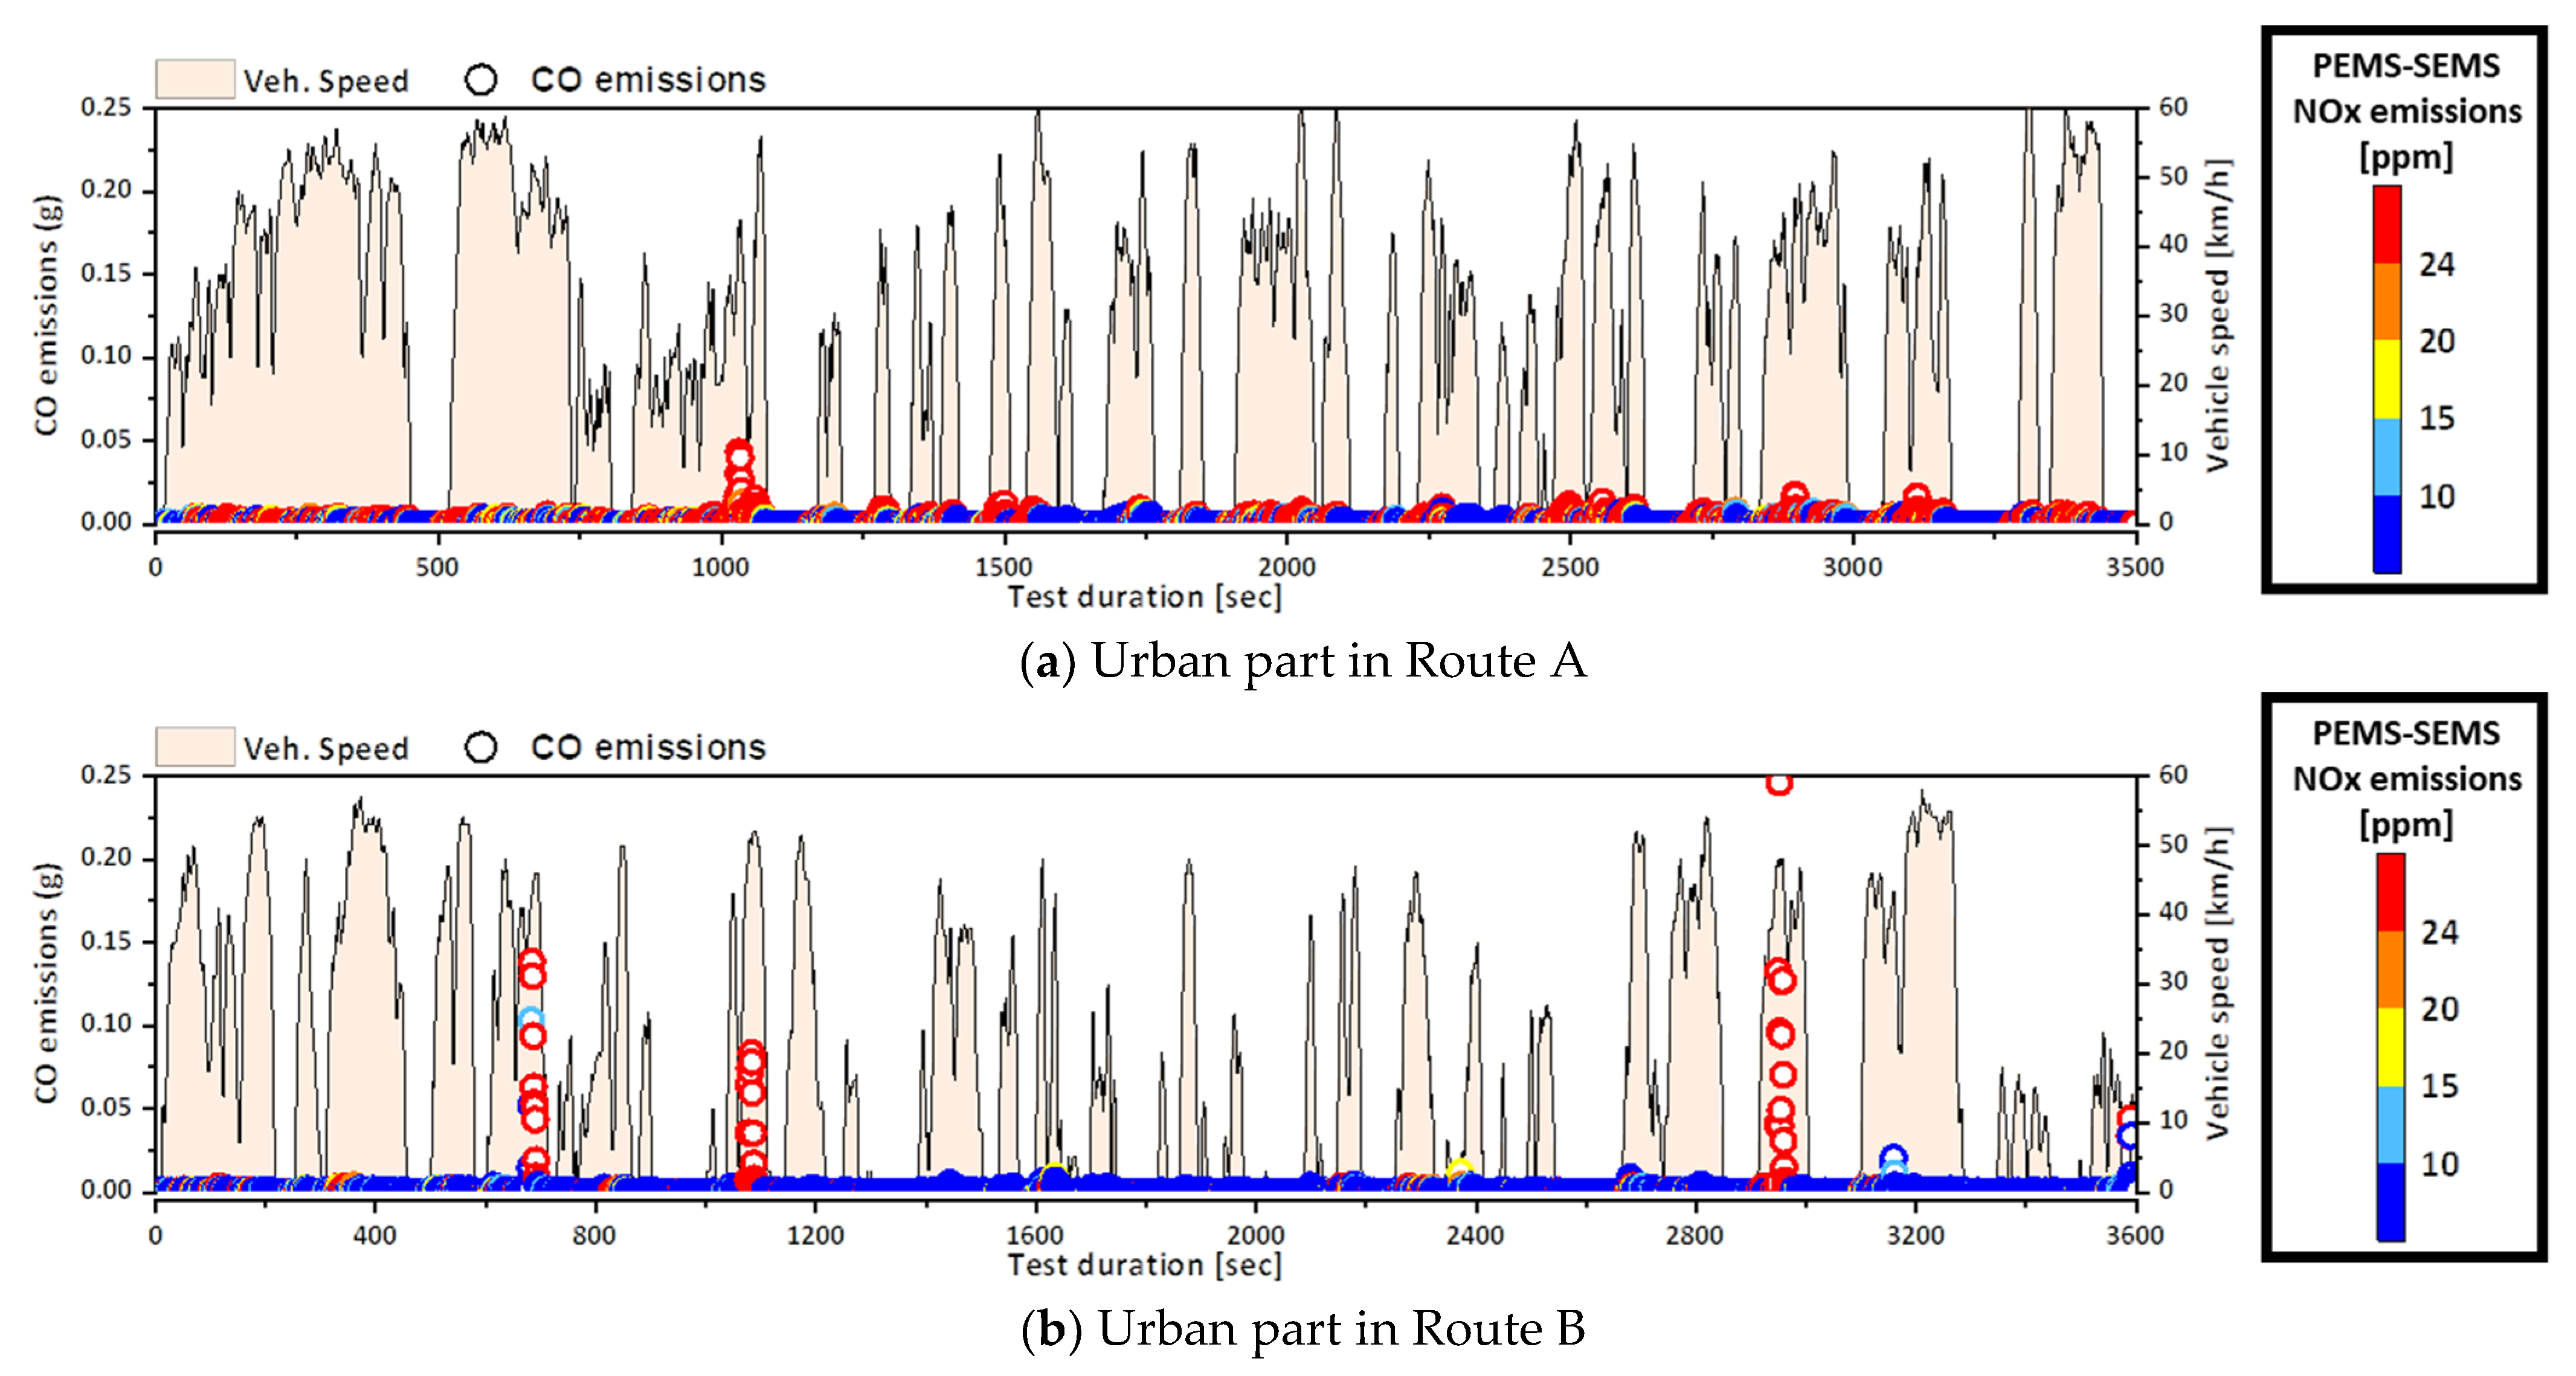
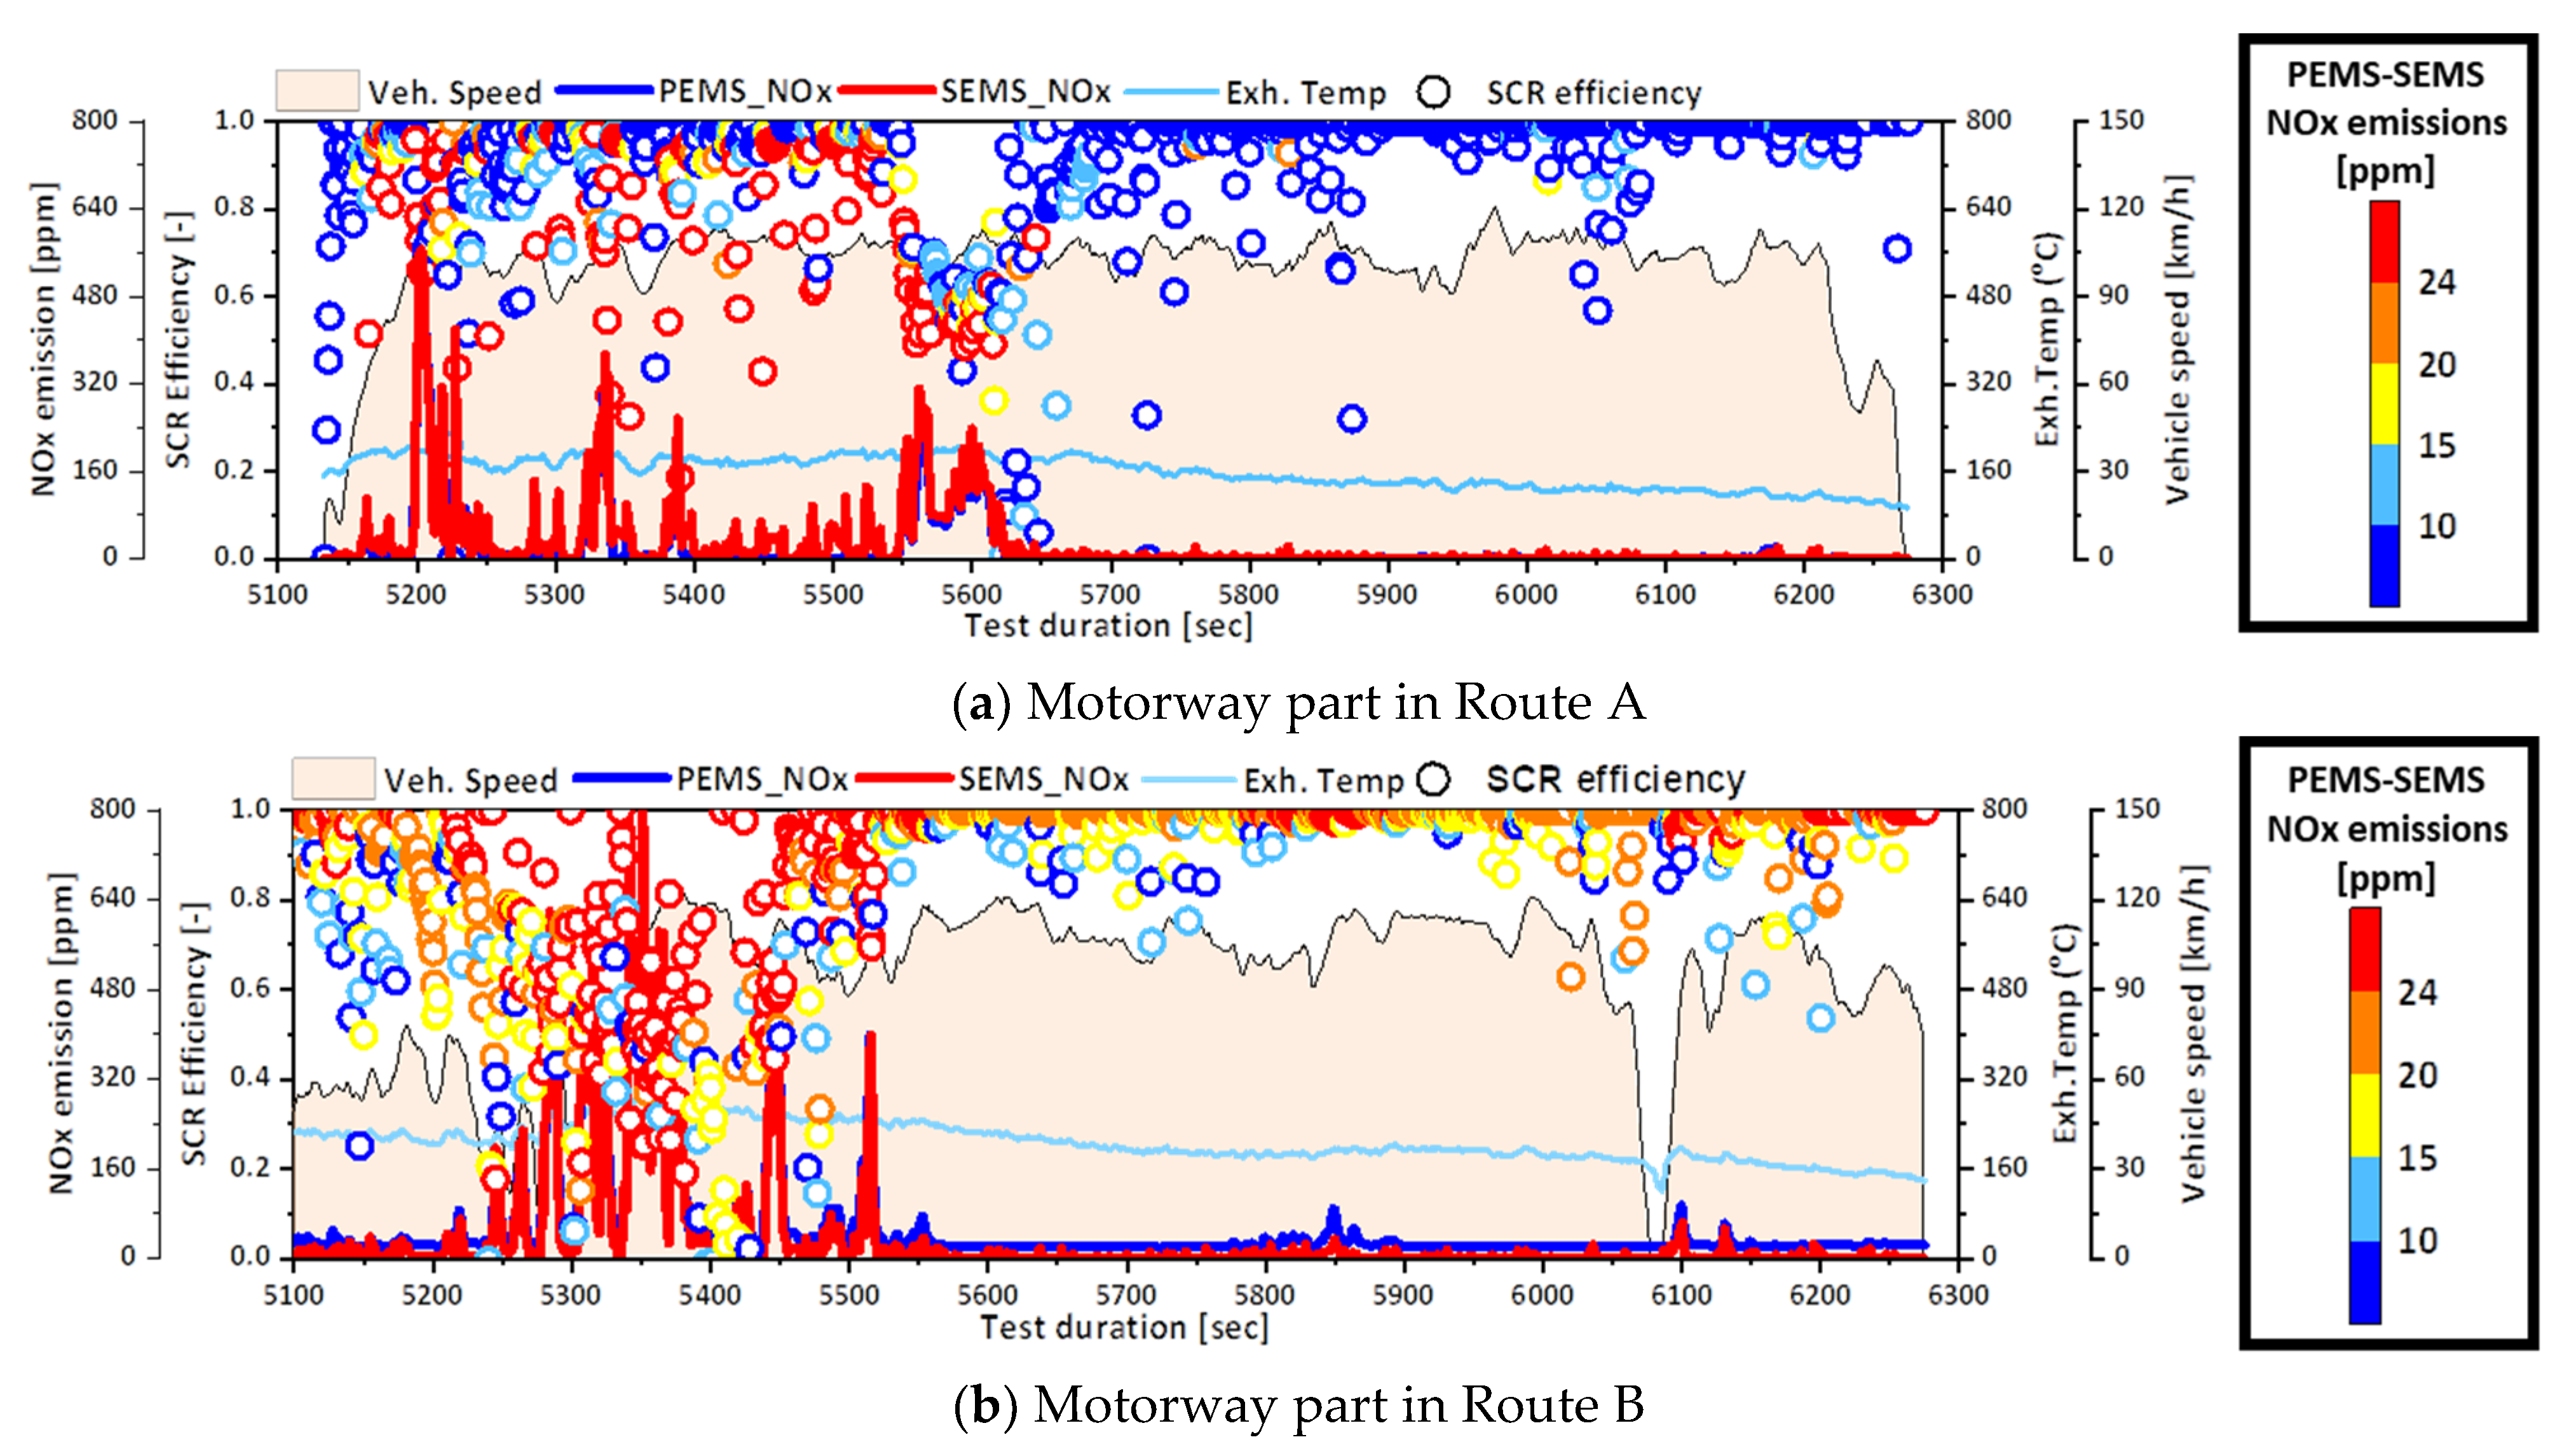
3.4. Detailed Analysis on Real-Time Profiles of NOx Emissions for the Characteristics of the NOx Conversion On-Road

Figure 20 and Figure 21 present the differences between NOx emissions measured by PEMS and SEMS equipment in urban and motorway part under RDE tests.
Figure 20 presents the difference between NOx emissions measured by PEMS and SEMS equipment according to CO emissions in the urban part, under Routes A and B. Accordingly, it can be observed that the difference between NOx emissions measured by PEMS and SEMS equipment was larger in Route B, where there are several stop durations.
Figure 21 presents the difference between NOx emissions measured by PEMS and SEMS equipment according to the SCR efficiency under the motorway part in Routes A and B. According to the RDE tests, NOx emissions abruptly increased in the section where vehicle speed was reduced, and then rapidly increased. Therefore, the SCR efficiency was reduced by this effect. This is believed to have triggered incomplete combustion, which is an inadequate air charge compared to the injected fuel quantity, owing to the delay in the increase in the rotational speed of the engine during rapid acceleration. Hence, NOx emissions were increased by this effect. If significant amounts of NOx emissions are released, it is believed that the SCR efficiency is reduced, owing to the relatively small amount of urea solution from the SCR system.

4. Conclusions

In this study, PEMS and SEMS equipment were installed on a test vehicle to simultaneously measure NOx emissions under various test modes in the laboratory and on road. Based on these test results, the reliability of NOx emissions measured by the SEMS equipment was verified as follows:
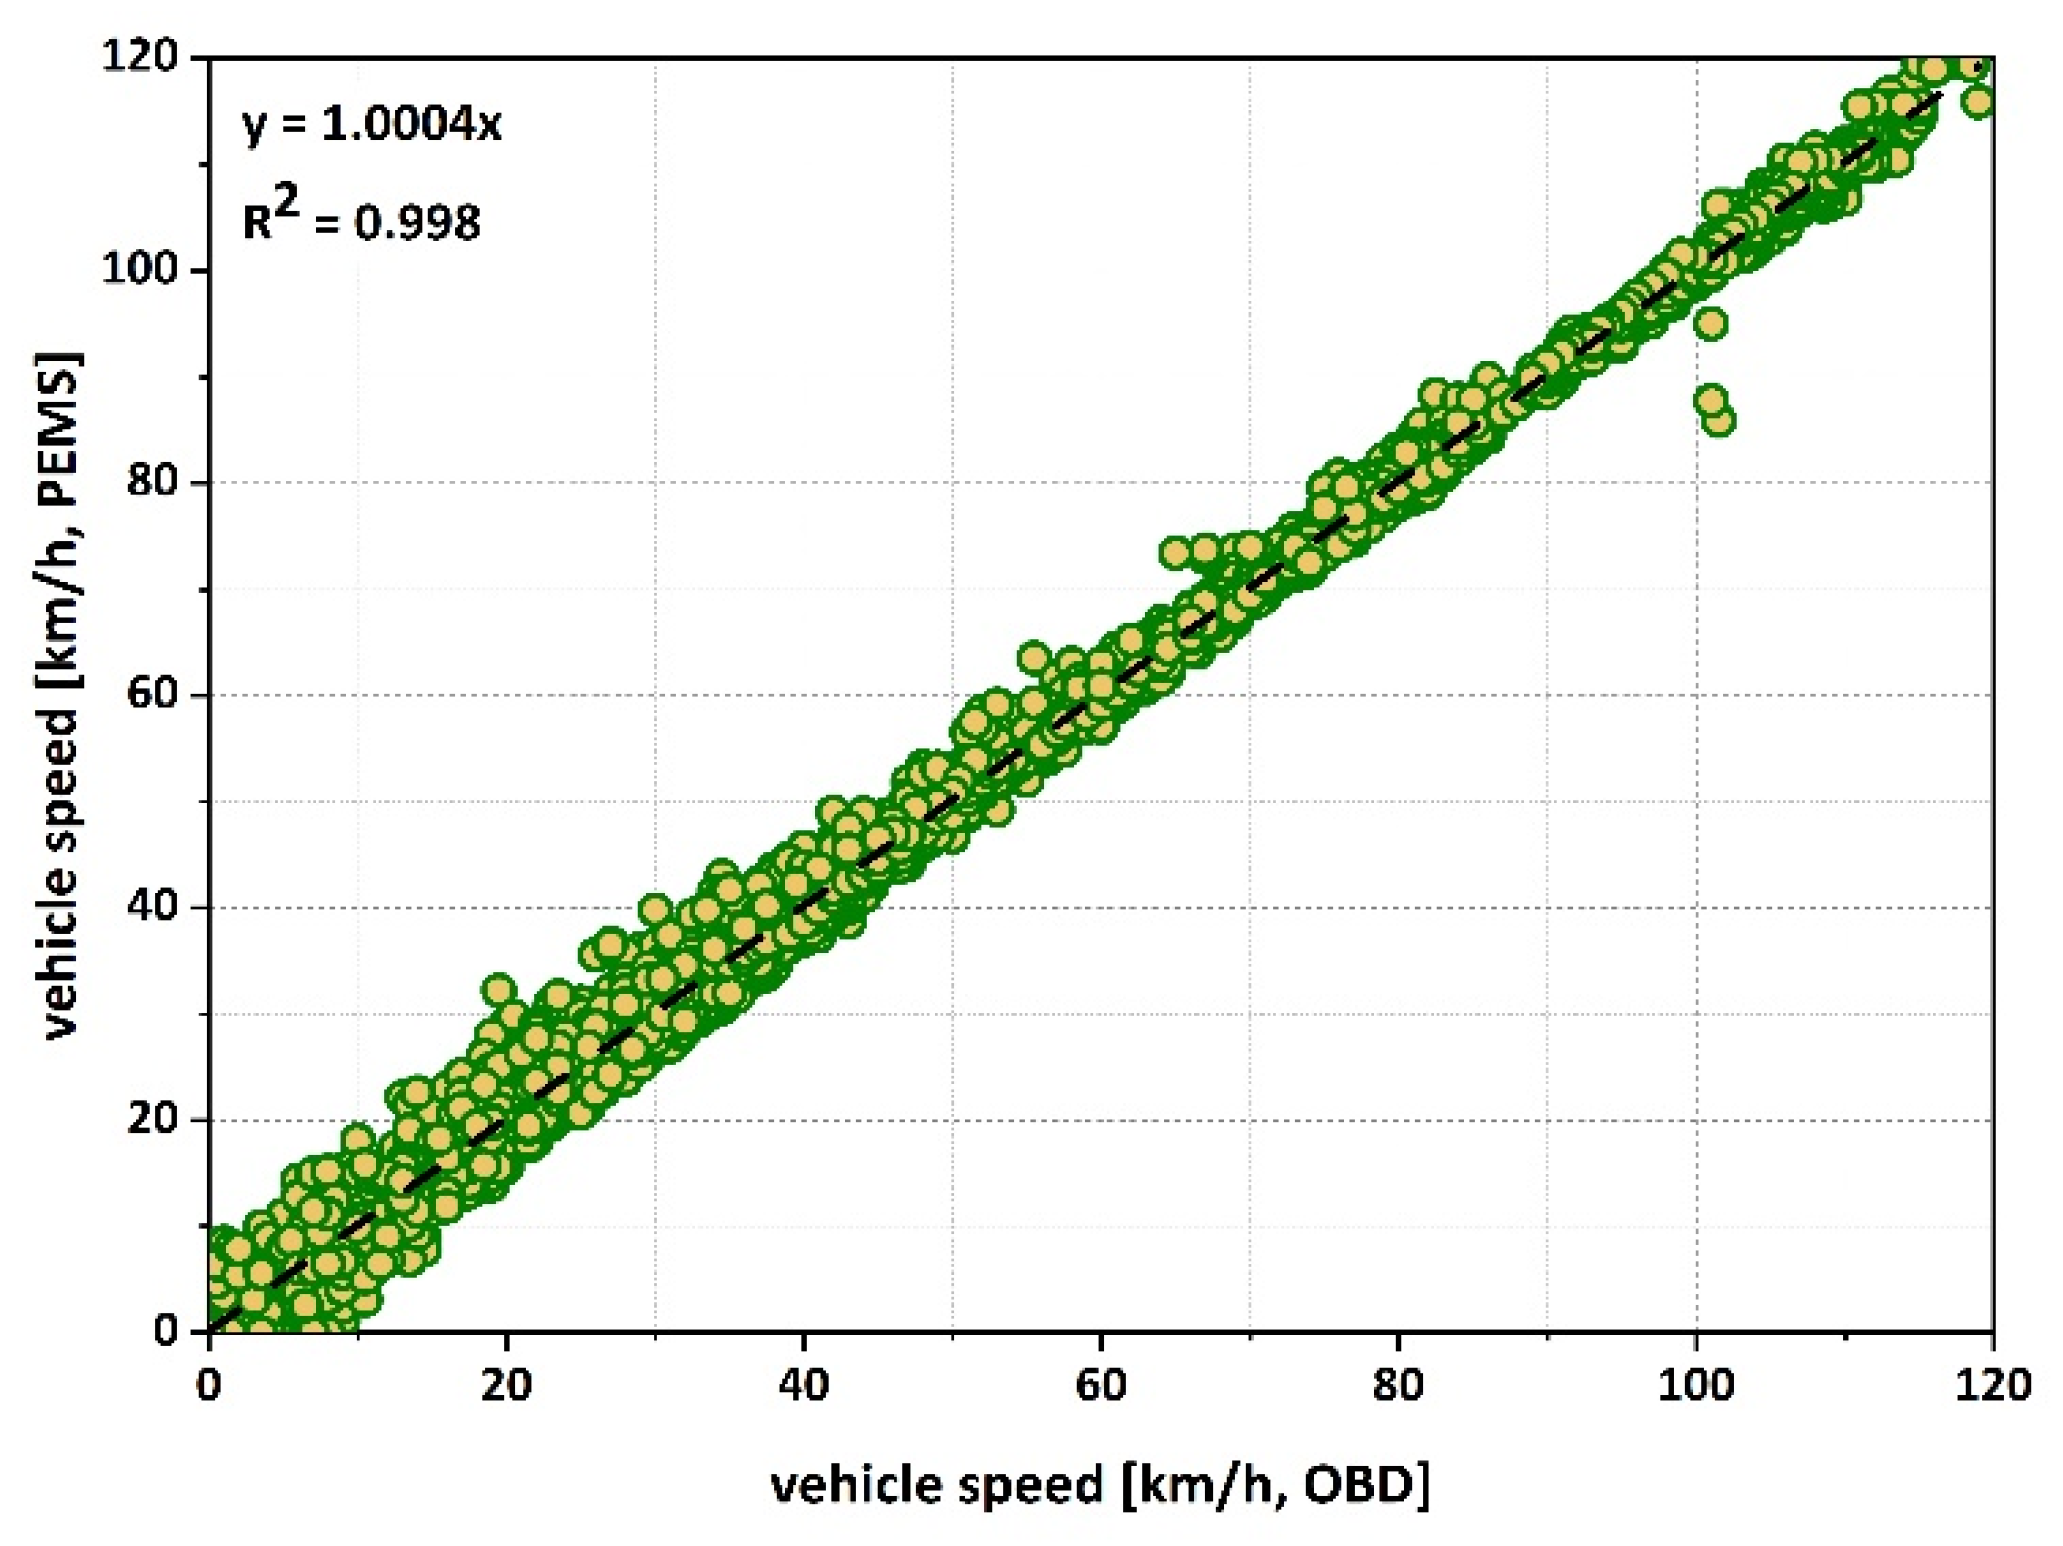
  • The slope was significantly equal to 1, and the coefficient of determination was 0.93 or more when comparing between the vehicle speed and exhaust flow rate measured by the PEMS and SEMS equipment. It was possible to verify the reliability of the OBD data measured by the SEMS equipment.
  • Via the correlation test results of PEMS and SEMS equipment in the laboratory, most of the NOx emissions measured by the PEMS and SEMS equipment were within the current NOx emission limit (0.08 g/km). It was verified that the slope of the NOx emissions measured by the PEMS and SEMS equipment was significantly close to 1, and the coefficient of determination was 0.961, thus indicating that the results were highly similar.
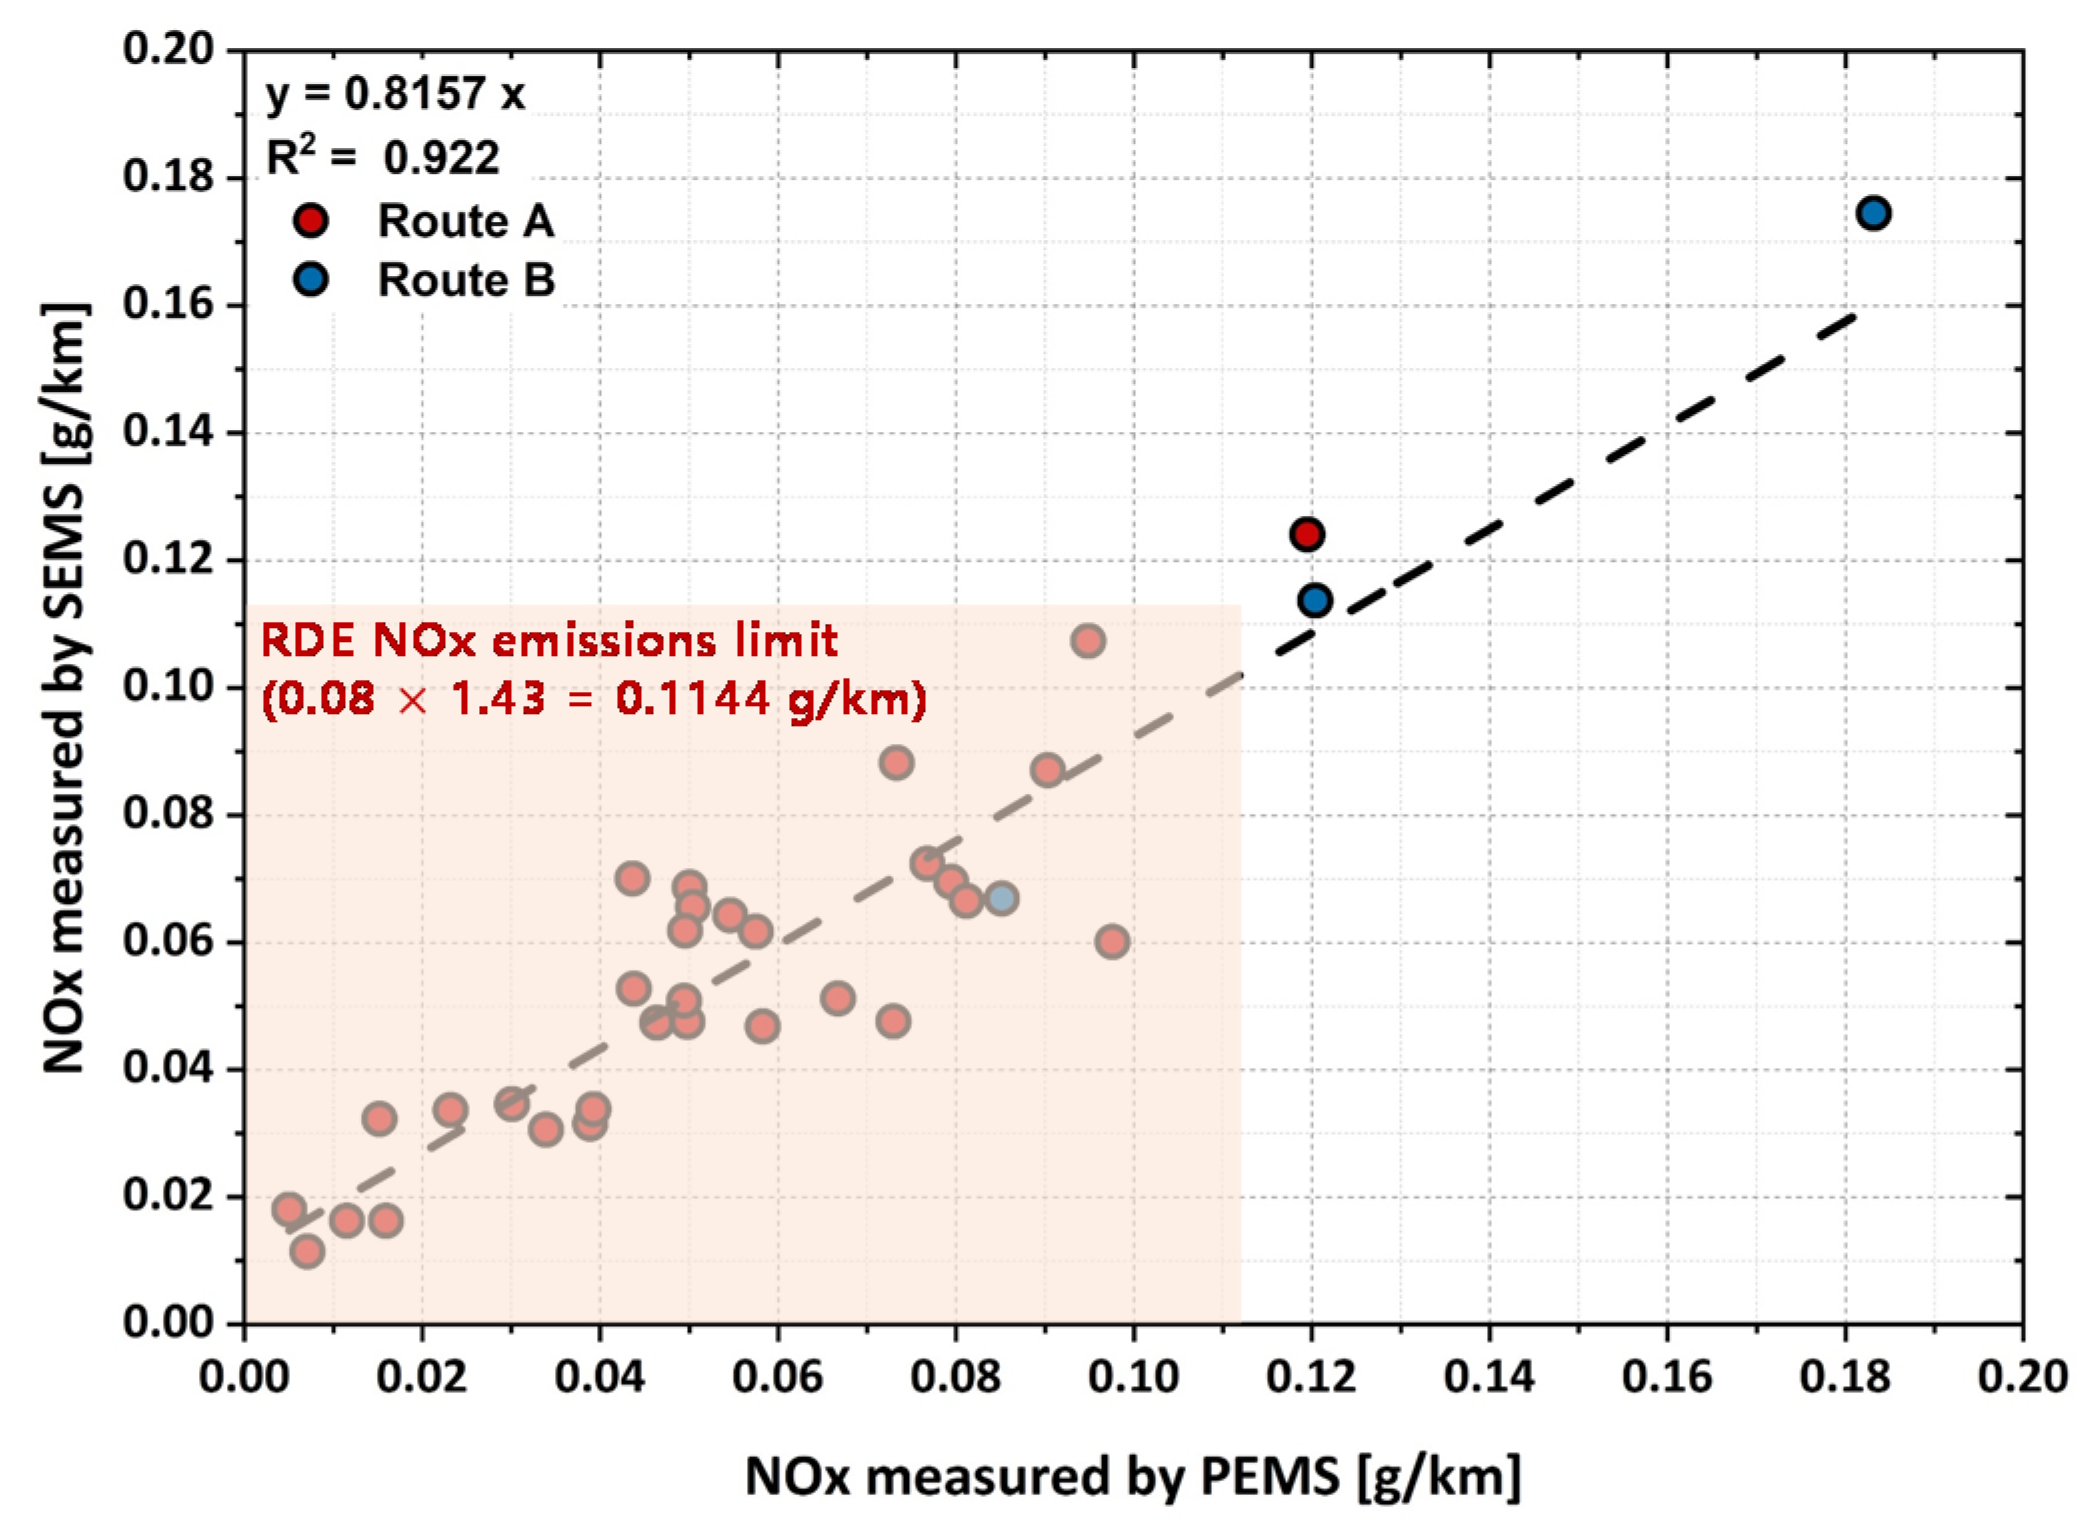
  • Regarding the on-road results of the PEMS and SEMS equipment obtained from the correlation tests, most of the test results were within the RDE NOx emissions limit (0.1144 g/km). It was confirmed that the slope of the NOx emissions measured by the PEMS and SEMS equipment was 0.816, which is lower than the slope obtained via the correlation test in the laboratory. In addition, the coefficient of determination was 0.922, thus indicating that the results were highly similar.
  • However, NOx emissions measured by the SEMS equipment were higher than those measured by the PEMS equipment under RDE tests. When NOx emissions increase due to LNT regeneration and the SCR efficiency reduction, the SEMS equipment increases NOx emissions by exceeding the limit of the O2 measurement range.
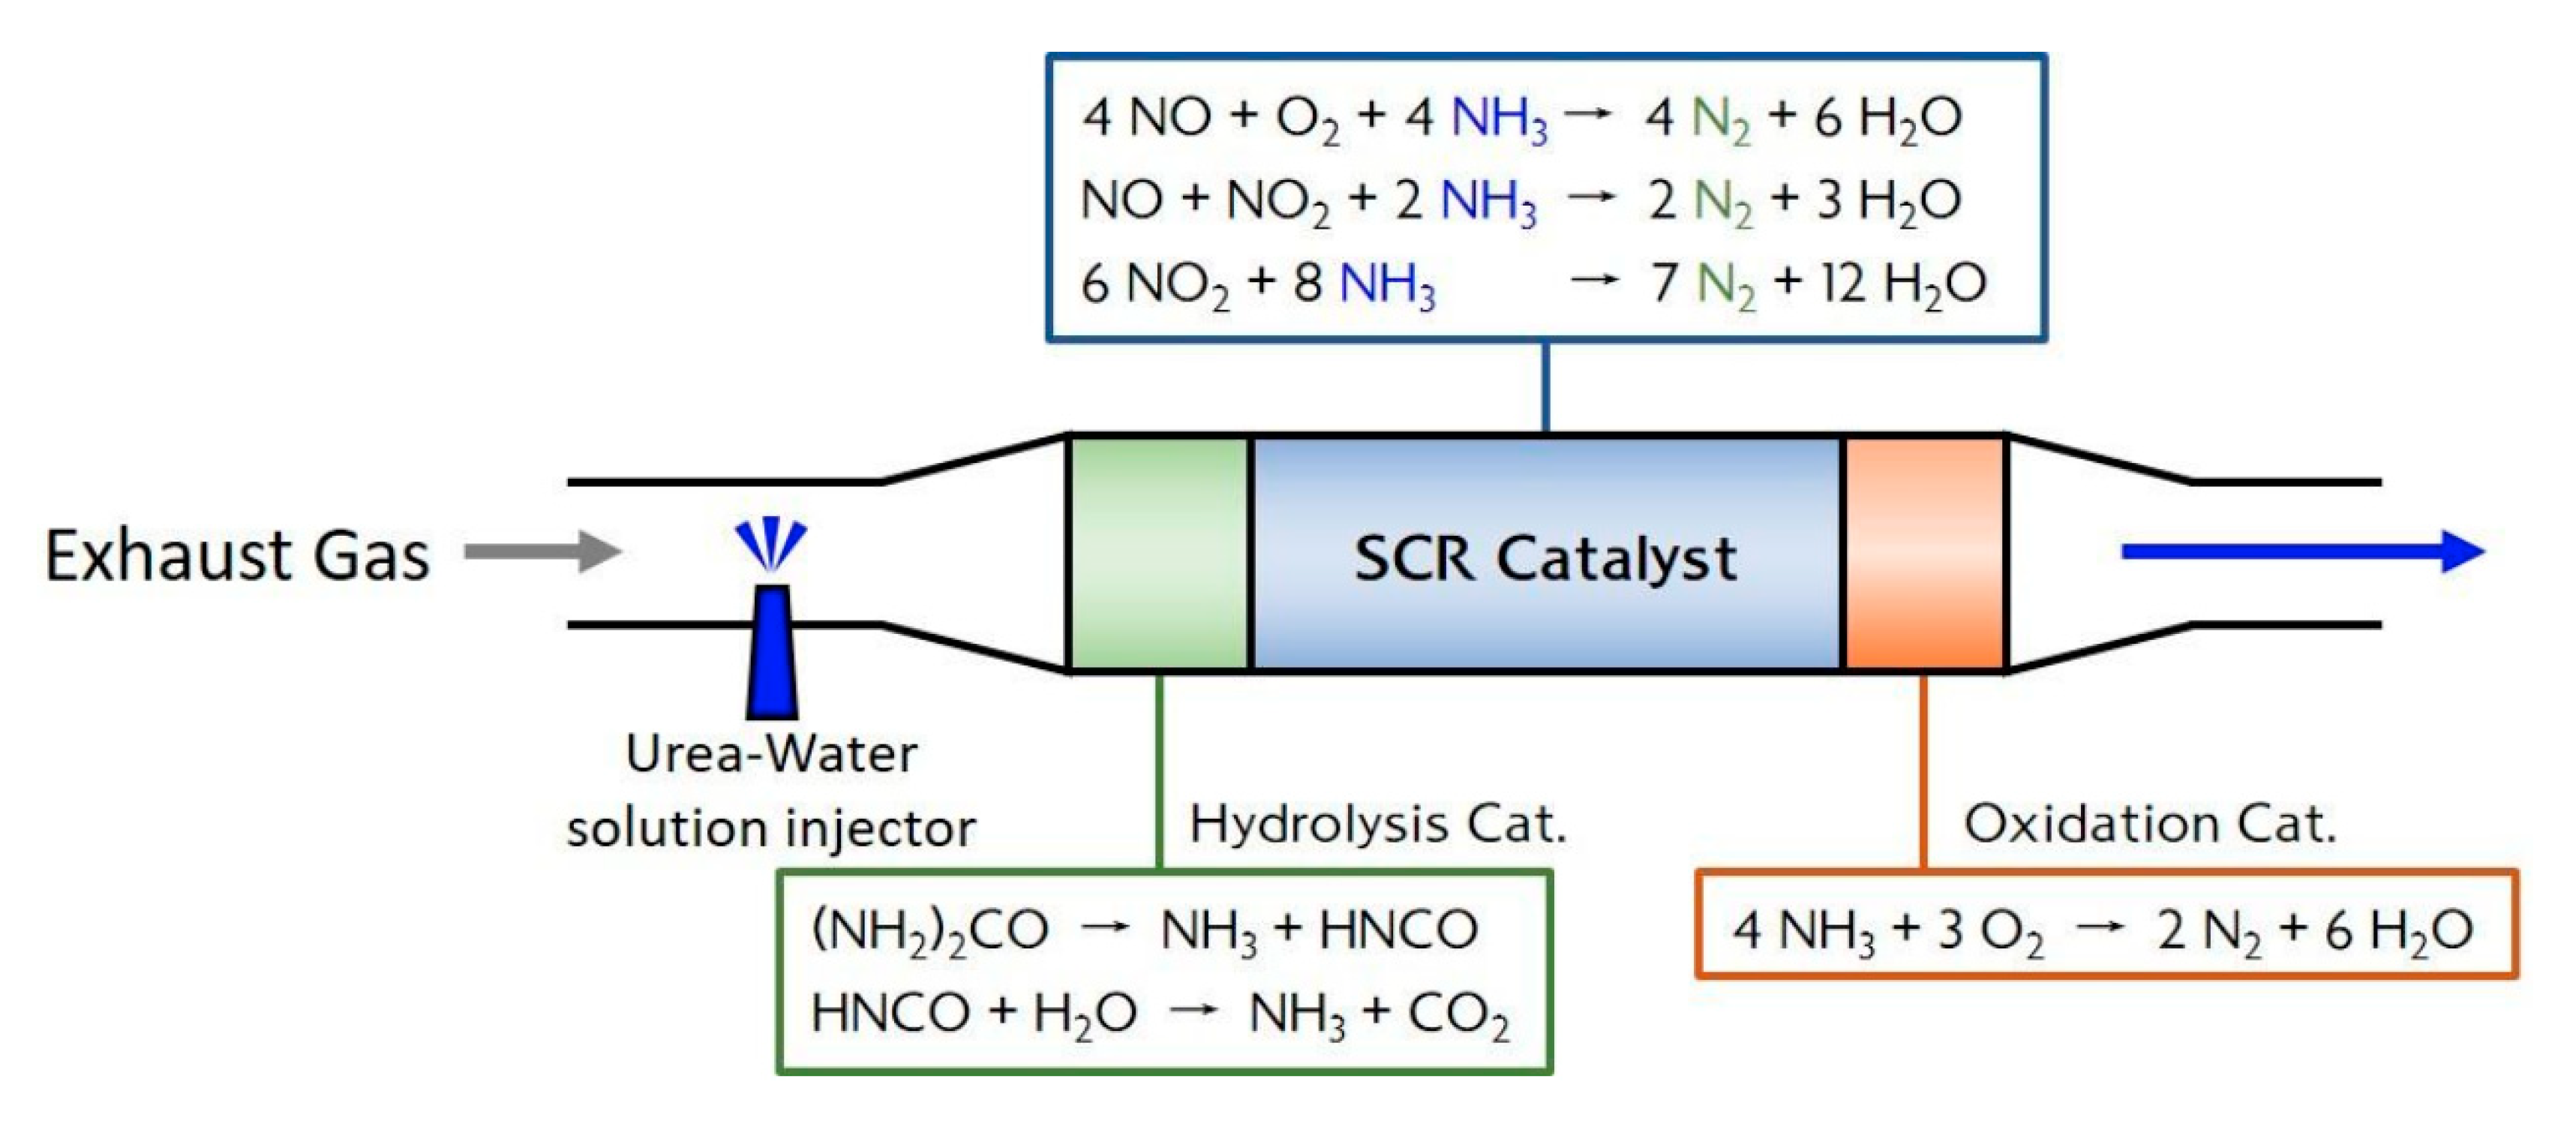
  • Finally, when comparing the two equipment types, the PEMS and SEMS equipment can be used interchangeably in the same way for measuring NOx emissions. However, unlike the PEMS equipment, the SEMS equipment can measure NO emissions generated by urea solution. Therefore, it is necessary to install an additional NH3 sensor for comparative analysis.

Author Contributions

Conceptualization, J.C. and M.S.C.; methodology, Y.S.Y.; validation, Y.S.Y.; J.W.J.; investigation, J.W.J.; data curation, Y.S.Y. and J.W.J.; writing—original draft preparation, Y.S.Y.; writing—review and editing, J.C.; supervision, J.C. and M.S.C.; funding acquisition, J.C. and M.S.C. All authors have read and agreed to the published version of the manuscript.

Funding

This research received no external funding.

Institutional Review Board Statement

No applicable.

Informed Consent Statement

Not applicable.

Data Availability Statement

The data of this study are available from the corresponding author upon reasonable request.

Acknowledgments

This research was supported by the Korea Evaluation Institute of Industrial Technology (20002762) and the National Research Foundation of Korea (NRF-2019R1I1A3A01062771).

Conflicts of Interest

The authors declare no conflict of interest.

References

  1. Lee, D.I.; Yu, Y.S.; Chon, M.S.; Cha, J. A Study of Cold-start and Evaluation Method for Real Driving Emissions of Diesel Light-duty Vehicle. Trans. Korean Soc. Automot. Eng. 2019, 27, 199–206. [Google Scholar] [CrossRef]
  2. Thompson, G.J.; Carder, D.K.; Besch, M.C.; Thiruvengadam, A.; Kappanna, H.K. In-Use Emissions Testing of Light-Duty Diesel Vehicles in the United States; West Virginia University: Morgantown, WV, USA, 2014. [Google Scholar]
  3. Yu, Y.S.; Chon, M.S.; Cha, J. NOx Characteristics of the Real Driving Emission with Data Calculation Methods. Alex. Eng. J. under review.
  4. European Commission. Amending Regulation (EC) No 692/2008 as Regards Emissions from Light Passenger and Commercial Vehicles (Euro 6); Regulation (EU) 2016/646; European Union: Luxembourg, 2016. [Google Scholar]
  5. Vermeulen, R.J.; van Goethem, S.; Baarbe, H.L.; Zuidgeest, L.W.M.; Spreeen, J.S.; Vonk, W.A. SEMS operating as a proven system for screening real-world NOx and NH3 emissions. In Proceedings of the 20th International Transport and Air Pollution Conference, Graz, Austria, 18–19 September 2014. TAP paper 58. [Google Scholar]
  6. Kadijk, G.; Vermeulen, R.J.; Buskermolen, E.G.; Elstgeest, M.; van Heesen, D.; Heijne, V.A.M.; Ligerink, N.E.; van der Mark, P.J. NOx Emissions of Eighteen Diesel Light Commercial Vehicles: Results of the Dutch Light-Duty Road Vehicle Emission Testing Programme 2017; TNO: The Hague, The Netherlands, 2017. [Google Scholar]
  7. Kadijk, G.; Elstgeest, M.; Ligterink, N.E.; van der Mark, P.J. Emissions of Twelve Petrol Vehicles with High Mileages; TNO: The Hague, The Netherlands, 2018. [Google Scholar]
  8. Sjödin, Å.; Borken-Kleefeld, J.; Carslaw, D.; Tate, J.; Alt, G.-M.; Fuente, J.D.; Bernard, Y.; Tietge, U.; McClintock, P.; Gentala, R.; et al. Real-Driving Emissions from Diesel Passenger Cars Measured by Remote Sensing and as Compared with PEMS and Chassis Dynamometer Measurements—CONOX Task 2 Report; IVL Swedish Environmental Research Institute: Stockholm, Sweden, 2018. [Google Scholar]
  9. Lee, B.; Yun, B.; Jung, J.; Kim, D. Study on NOx Emission Characteristics of Diesel Light Duty Vehicles by Analyzing Massive Driving Data. Trans. Korean Soc. Automot. Eng. 2018, 26, 684–692. [Google Scholar] [CrossRef]
  10. Yu, Y.S.; Jeong, J.W.; Kim, S.L.; Sim, I.; Chon, M.S.; Cha, J. A Study Correlations of NOx Emissions between PEMS and SEMS of Light-Duty Diesel Vehicle in Real Driving According to Ambient Temperature and Cold Start. Trans. Korean Soc. Automot. Eng. 2020, 28, 277–283. [Google Scholar] [CrossRef]
  11. Yang, J.; Durbin, T.D.; Jiang, Y.; Tange, T.; Karavalakis, G.; Cocker, D.R.; Johnson, K.C. A comparison of a mini-PEMS and a 1065 compliant PEMS for on-road gaseous and particulate emissions from a light duty diesel truch. Sci. Total Environ. 2018, 640–641, 364–376. [Google Scholar] [CrossRef] [PubMed] [Green Version]
  12. Vermeulen, R.J.; Ligterink, N.E.; Vonk, W.A.; Baarbe, H.L. A smart and robust NOx emission evaluation tool for the environmental screening of heavy-duty vehicles. In Proceedings of the 19th International Transport and Air Pollution Conference, Thessaloniki, Greece, 26–27 November 2012. [Google Scholar]
  13. Ligterink, N.E.; Heijne, V.; Kadijk, G.; van der Mark, P.J.; Spreen, J.; Stelwagen, U. NOx Emissions of Fifteen Euro 6 Diesel Cars: Results of the Dutch LD Road Vehicle Emission Testing Programme 2016; TNO: The Hague, The Netherlands, 2016. [Google Scholar]
  14. Heepen, F.; Weilin, Y. SEMS for Individual Trip Reports and Long-Time Measurement; SAE Technical Paper Series; SAE International: Warrendale, PA, USA, 2019. [Google Scholar]
  15. Vermeulen, R.J.; van Gijlswijk, R.N.; van Goethem, S. NOx emissions of Heavy-Duty Vehicles with Euro VI Certified engines. In Proceedings of the Transport and Air Pollution Conference, Thessaloniki, Greece, 15–17 May 2019. [Google Scholar]
  16. Ko, K.-H.; Choi, S.-C. A study on the improvement of vehicle fuel economy by fuel-cut driving. J. Korea Acad. Ind. Coop. Soc. 2012, 13, 498–503. [Google Scholar]
  17. Sahner, K. Automotive Exhaust Gas Sensing—Current Trends. In Proceedings of the 14th International Meeting on Chemical Sensors—IMCS 2012, Nürnberg/Nuremberg, Germany, 20–23 May 2012; AMA-Science: Berlin, Germany, 2012. [Google Scholar]
  18. Kato, N.; Nakagaki, K.; Ina, N. Thick Film ZrO2 NOx Sensor; SAE Technical Paper Series; SAE International: Warrendale, PA, USA, 1996. [Google Scholar]
  19. Lee, D.I.; Yu, Y.S.; Park, J.; Chon, M.S.; Cha, J. NOx Conversion Efficiency of SCR Diesel Vehicle Under Cold Start Condition. J. ILASS-Korea 2018, 23, 244–253. [Google Scholar]
  20. Bertoa, R.S.; Astorga, C. Impact of cold temperature on Euro 6 passenger car emissions. Environ. Pollut. 2018, 234, 318–329. [Google Scholar] [CrossRef] [PubMed]
  21. Maurer, M.; Fortner, T.; Holler, P.; Zarl, S.; Eichlseder, H. Impact of cyclic lean-rich aging under DeSOx condition on the lean-gas light-off and hydrogen formation ability of a lean NOx trap (LNT). Automot. Engine Technol. 2017, 2, 63–77. [Google Scholar] [CrossRef] [Green Version]
  22. Bari, S. Chapter 7: NOx Storage and Reduction for Diesel Engine Exhaust Aftertreatment. In Diesel Engine: Combustion, Emissions and Condition Monitoring; Bari, S., Ed.; IntechOpen: Adelaide, Australia, 2013; pp. 161–196. [Google Scholar]
  23. Pereda-Ayo, B.; González-Velasco, J.R.; Burch, R.; Hardacre, C.; Chansai, S. Regeneration mechanism of a Lean NOx Trap (LNT) catalyst in the presence of NO investigated using isotope labelling techniques. J. Catal. 2012, 285, 177–186. [Google Scholar] [CrossRef]
  24. Jang, W. Evaluation of Nitrogen Oxides (NOx) Emission and Its After-Treatment System Performance Characteristics from Diesel Passenger Vehicles on Real-World Driving with Ambient Temperature Effects. Ph.D. Thesis, Korea University, Seoul, Korea, February 2017. [Google Scholar]
  25. Nova, I.; Tronconi, E. Urea-SCR Technology for deNOx After Treatment of Diesel Exhausts, 1st ed.; Springer: New York, NY, USA, 2014; pp. 1–716. [Google Scholar]
  26. Fedoseev, G.; Loppolo, S.; Zhao, D.; Lamberts, T.; Linnartz, H. Low Temperature Surface Formation of NH3 and HNCO: Hydrogenation of nitrogen atoms in CO-rich interstellar ice analogues. Mon. Not. R. Astron. Soc. 2015, 446, 439–448. [Google Scholar] [CrossRef] [Green Version]
  27. Gibbs, J.; Singh, G. Innovative SCR Materials and Systems for Low Temperature Aftertreatment, U.S. Annual Merit Review and Peer Evaluation Meeting (AMR); Department of Energy, Vehicle Technologies Office: Washington, DC, USA, 2017.
  28. Jeong, J.W.; Sim, I.; Kim, S.L.; Yu, Y.S.; Chon, M.S.; Cha, J. A Correlation Analysis of NOx Emissions for Driving Condition between PEMS and SEMS Devices. Trans. Korean Soc. Automot. Eng. 2021, 29, 187–196. [Google Scholar] [CrossRef]
  29. Aliramezani, M.; Koch, C.R.; Secanell, M.; Hayes, R.E.; Patrick, R. An electrochemical model of an amperometric NOx sensor. Sens. Actuators B Chem. 2019, 290, 302–311. [Google Scholar] [CrossRef]
Figure 1. Example of the PEMS equipment installed on the test vehicle.
Energies 14 07250 g001
Figure 2. Schematic diagram of correlation test between the PEMS and laboratory exhaust emission analyzer.
Energies 14 07250 g002
Figure 3. Map of RDE routes—Urban (redline), Rural (yellow line), Motorway (blue line).
Energies 14 07250 g003
Figure 4. GPS location of urban in RDE routes; the color indicates the vehicle speed.
Energies 14 07250 g004
Figure 5. Schematic diagram of the PEMS and SEMS equipment installed on the test vehicle.
Energies 14 07250 g005
Figure 6. Comparison of exhaust emissions measured with the CVS and PEMS equipment.
Energies 14 07250 g006
Figure 7. Correlation of exhaust flow measured by the PEMS and SEMS equipment.
Energies 14 07250 g007
Figure 8. Correlation of vehicle speed measured by the PEMS and SEMS equipment.
Energies 14 07250 g008
Figure 9. Correlation of NOx emissions measured by the PEMS and SEMS equipment under various test modes in the laboratory.
Energies 14 07250 g009
Figure 10. NOx emissions measured by the PEMS and SEMS equipment under various test modes in the laboratory.
Energies 14 07250 g010
Figure 11. Real-time profiles of NOx emissions measured by the PEMS and SEMS equipment under various test modes in the laboratory.
Energies 14 07250 g011
Figure 12. Real-time profiles of CO emissions and the difference between NOx emissions measured by the PEMS and SEMS equipment under US06 test modes in the laboratory.
Energies 14 07250 g012
Figure 13. Real-time profiles of SCR efficiency and the difference between NOX emissions measured by the PEMS and SEMS equipment under HWFET test modes in the laboratory.
Energies 14 07250 g013
Figure 14. Schematic of the LNT system mechanism.
Energies 14 07250 g014
Figure 15. Schematic of the SCR system mechanism.
Energies 14 07250 g015
Figure 16. Correlation of NOx emissions measured by the PEMS and SEMS equipment under RDE tests in Routes A and B.
Energies 14 07250 g016
Figure 17. NOx emissions measured by the PEMS and SEMS equipment under RDE tests in Routes A and B.
Energies 14 07250 g017
Figure 18. Real-time profiles of NOx emissions measured by the PEMS and SEMS equipment under RDE Route A.
Energies 14 07250 g018
Figure 19. Real-time profiles of NOx emissions measured by the PEMS and SEMS equipment under RDE Route B.
Energies 14 07250 g019
Figure 20. Real-time profiles of CO emissions and the difference between NOx emissions measured by the PEMS and SEMS equipment under urban part in Routes A and B.
Energies 14 07250 g020
Figure 21. Real-time profiles of SCR efficiency and the difference between NOx emissions measured by the PEMS and SEMS equipment under motorway part in Routes A and B.
Energies 14 07250 g021
Table 1. Specifications of chassis dynamometer.
ItemAVL
RollerSingle Roll 48 inch (MIM type)
Inertia weight range (kg)454–5448
Maximum roll speed (km/h)200
Electric motor absorber typeAC motor
Speed deviation±0.1% F.S.
Torque deviation±0.02 km/h
Driving distance measurementEncoder
Cooling fanVariable speed
Table 2. Specifications of exhaust emission analyzer.
ItemHORIBA
Constant volume samplerCVS-7400T
Motor exhaust gas analyzerMEXA-7200H
Dilution tunnel samplerDLS-7100E
Dilution tunnelDLT-1230
Table 3. Summaries of test modes in laboratory.
ItemNEDCWLTCFTP-75HWFETUS06SC03
Trip duration (s)118018001874765594594
Trip distance (km)11.0323.2717.7716.4512.875.79
Avg. vehicle speed (km/h)33.646.534.177.777.934.1
Maximum acceleration (m/s2)1.041.671.481.433.792.28
Engine start conditionCold
Warm
Cold
Warm
ColdWarmWarmWarm
Table 4. Specifications of test vehicle [10].
Vehicle 01
TypeSUV
Maximum power kW137
Displacement cc1995
Engine typeCRDI I4
Model year2019
Emission regulationEuro 6d-temp
After-treatmentLNT + DPF + SCR
Table 5. Summaries of RDE test routes.
UrbanRuralMotorwayTotal
Route ATrip distance (km)30.932.029.992.8
Trip share (%)31.336.732.1100.0
Trip duration (min)78.425.014.6119.8
Average vehicle speed (km/h)26.477.6107.9
Route characteristics: stop duration of urban part is 23.79%
Route BTrip distance (km)22.023.021.466.4
Trip share (%)33.134.732.2100.0
Trip duration (min)59.117.513.990.5
Average vehicle speed (km/h)17.676.5117.3
Route characteristics: stop duration of urban part is 36.37%
Table 6. Specifications of PEMS equipment [10].
PrincipleSpecifications
Heated NDIRCO: 0–8% vol.
CO2: 0–18% vol.
Heated NDUVNO: 0–3000 ppm
NO2: 0–1000 ppm
Operating temperature (°C)−10–45
Tolerance of CO, CO2, NO, NO2 emissions±2%
Dimensions (mm)SCS module: 435(W) × 410(D) × 105(H)
GAS module: 437(W) × 312(D) × 135(H)
EFM module: 365(W) × 105(D) × 90(H)
Weight (kg)SCS module: 10.9
GAS module: 8.9
EFM module: 3.9
Table 7. Specifications of NOx sensor in SEMS equipment [10].
PrincipleSpecifications
MeasurementZrO2-based multi-layer sensor with integrated heater and three oxygen pumps
Output signalsNOx, linear λ or O2 concentration
Electrical system (V)12
Operating temperature (°C)100–800
PrincipleAmperometric
NOx tolerance0–100 ppm: ±20 ppm
100–1500 ppm: ±20%
Measuring rangeNOx: 0–1500 ppm
λ : −0.994–1.010
Publisher’s Note: MDPI stays neutral with regard to jurisdictional claims in published maps and institutional affiliations.

