Abstract
The power system responsiveness may be improved by determining the ideal size of each component and performing a reliability analysis. This study evaluated the design and optimization of an islanded hybrid microgrid system with multiple dispatch algorithms. As the penetration of renewable power increases in microgrids, the importance and influence of efficient design and operation of islanded hybrid microgrids grow. The Kangaroo Island in South Australia served as the study’s test microgrid. The sizing of the Kangaroo Island hybrid microgrid system, which includes solar PV, wind, a diesel engine, and battery storage, was adjusted for four dispatch schemes. In this study, the following dispatch strategies were used: (i) load following, (ii) cycle charging, (iii) generator order, and (iv) combination dispatch. The CO2 emissions, net present cost (NPC), and energy cost of the islanded microgrid were all optimized (COE). The HOMER microgrid software platform was used to build all four dispatch algorithms, and DIgSILENT PowerFactory was used to analyze the power system’s responsiveness and dependability. The findings give a framework for estimating the generation mix and required resources for an islanded microgrid’s optimal functioning under various dispatch scenarios. According to the simulation results, load following is the optimum dispatch technique for an islanded hybrid microgrid that achieves the lowest cost of energy (COE) and net present cost (NPC).
1. Introduction
Traditional fossil-fuel-based power plants emit a significant amount of glasshouse gases (GHGs), which are harmful to the environment. As a result, interest in non-conventional and renewable energy resources, such as solar, wind, biomass, wave, hydro, and geothermal energy, is growing. Solar and wind energy technologies are popular among renewable energy sources, and their participation in grids and microgrids around the world is increasing [1].
However, due to the unpredictable and intermittent nature of these resources, operating islanded microgrids with solar and wind energy is difficult. The variability of solar PV and wind generation in a microgrid may lead to short-term stability problems, such as sudden voltage and frequency deviation, which can be worse due to the rapid changes of the load demand [2]. Additionally, the reliability of a microgrid can be affected by multiple types of generation sources and their coordination [3]. To ensure system stability and reliability, optimal design and optimization of an islanded hybrid microgrid are critical, and they are achieved by assessing the optimal sizing of each component with appropriate dispatch strategies.
1.1. Review of Dispatch Strategies and Optimization Applied to Microgrids
The evaluation of islanded microgrid dispatch techniques and optimization algorithms has piqued researchers’ interest [4,5,6,7,8,9,10,11,12]. Feixiong et al. suggested and tested a strategy for creating an islanded microgrid based on distributed economic dispatch algorithms [5]. The author did not consider the alternative dispatch strategies for the analysis to justify the novelty of the conducted research. Chengquan et al. assessed an optimal dispatch strategy for islanded hybrid microgrid by incorporating vehicle-to-grid operation under time-of-use tariffs [6]. Dispatch-strategy-oriented schedule operational maintenance is missing in this analysis. Tian et al. demonstrated a two-level decentralized optimization approach facilitating power dispatch control strategies for an islanded microgrid [7]. To improve the generation stimulability of a wind–battery hybrid microgrid system, Abdullah et al. proposed an operative power dispatch technique [8]. Bo and his colleagues created a multi-agent system-based energy-management platform that takes into consideration real-time power-dispatch methodologies [9]. The synchronization between the power- and economic-dispatch strategy is missing here, which is significant in terms of system stability and reliability. Based on the stochastic behavior of wind-power projections, Meysam et al. proposed a modified operating dispatch approach for an integrated gas and electricity network [10]. To manage the high renewable penetration, Yu et al. designed a robust energy distribution scheme with a distributed economic dispatch method for a microgrid [11]. Lin et al. used a hierarchical model predictive controller to show a dynamic active power dispatch strategy for a wind-based hybrid energy system to boost network stability [12]. In order to keep the system frequency within acceptable bounds, Yunfeng et al. presented a dispatch model for the islanded microgrid [13]. Pedro et al. developed a distributed-technology-based improved optimal-dispatch technique for an imbalanced three-phase islanded microgrid [14], but there was no comparative analysis of the dispatch strategies to illustrate the innovation of each islanded microgrid design.
1.2. Review of System Operation (Stability) Issues in Microgrids
Some studies specifically focus on the system stability and mitigation of voltage and frequency fluctuations for islanded hybrid microgrid systems [15,16,17,18,19,20]. To increase the voltage stability of an islanded hybrid microgrid, Hale et al. proposed using a static synchronous compensator (STATCOM) and the genetic algorithm (GA) optimization technique [15]. Mohammad et al. [16] looked at a variety of control methods and optimization methodologies for lowering net present cost, voltage and frequency instability, and pollution. Hany et al. proposed a control technique for managing output voltage using a GA-based PI controller [17]. Amir et al. implemented a novel control technique to improve the power system performance of an islanded microgrid by considering the bidirectional interlinking converter [18]. Phillip et al. demonstrated a multi-agent distributed hybrid control technique for the islanded hybrid microgrid to maintain voltage and frequency stability [19]. Hossam et al. proposed a new multi-level voltage and frequency control strategy for an islanded hybrid microgrid considering the virtual inertia control co-efficient [20].
1.3. Review of System Planning (Reliability) Issues in Microgrids
Moreover, several studies highlighted the long-term planning and operational aspects considering the system reliability for islanded hybrid microgrid systems [21,22,23,24,25,26,27,28,29,30]. Xufeng et al. evaluated an operational reliability index for the islanded hybrid microgrid considering the short-term stability and outages model [21]. Khare et al. demonstrated the reliability assessment of the distribution network of the islanded hybrid microgrid to ensure the feasibility of the system [22]. Mokoka et al. described the reliability analysis of an islanded hybrid solar–diesel–battery system to support the typical rural and decentralized area of Nigeria [23]. Amin et al. demonstrated a transient component-based reliability analysis of the islanded hybrid microgrid to ensure the operability of the distribution network [24]. Abdelsalam et al. implemented an autonomous energy management scheme to ensure the reliability of the system by considering the load voltage and converter dynamics [25]. Abdulkarim et al. implemented a reliability assessment of islanded microgrid considering the operational faults of power electronic devices [26]. Subramanya et al. demonstrated reliability-based autonomous islanded hybrid microgrid with renewable-based resources [27]. Zhong et al. introduced a reduced-order model for the reliability and dynamic stability of an islanded hybrid microgrid by employing a bandpass filter-based droop control method [28,29].
1.4. Research Gaps Identified in Microgrid Optimization for Efficient Planning and Operation
The research gaps can be listed as mentioned below:
- Lack of coordination between optimal sizing and techno-economic analysis.
- Lack of coordination between techno-economic analysis and power system performances.
- The comparative analysis of dispatch strategies for the IHMS in terms of combined research of techno-economic analysis and power system performances are missing.
- The reliability analysis of the IHMS has never been considered under the dispatch strategies domain to ensure the technical feasibility of the system.
While the existing literature contributed solely either to the dispatch strategies or on the system stability and/or reliability, there is still a disconnect between appropriate sizing and techno-economic analysis, as well as power system performance and dependability. The following three requirements must be met for the islanded microgrid to function properly: (1) techno-economic feasibility, (2) system stability, and (3) reliability. Implementing the right combination of those three criteria for an islanded microgrid could be a feasible solution to this problem.
1.5. Contributions of This Research and Paper Outline
This research evaluates the assessment of the ideal sizing of each component. By studying the power system response to maintain system stability and performing reliability analysis, an islanded hybrid microgrid system with four dispatch strategies can be optimized. This scientific endeavor makes a two-fold contribution:
- To begin, choose the most appropriate dispatch method (in the HOMER software platform) to determine the optimal sizing of the resources of an islanded hybrid microgrid in order to achieve the lowest cost of energy (COE), net present cost (NPC), and CO2 emissions;
- Second, by analyzing the power system performance, ensure efficient, stable, and reliable operation of the best microgrid design (as determined in the previous stage) in MATLAB/Simulink and DIgSILENT PowerFactory.
The remainder of the paper is laid out as follows: Section 2 discusses the components and power conversion procedure of an islanded microgrid system; Section 3 discusses the research methodology and simulation algorithm with an explanation of the dispatch strategies; Section 4 discusses the results with relevant graphs to show a comparison between different dispatch strategies, taking into account NPC, COE, CO2 emission, power system performance, and the system reliability index to ensure the efficient and reliable operation of an islanded microgrid system; Section 4 discusses the results with relevant graphs to show a comparison between different dispatch strategies taking into consideration NPC, COE, CO2 emission, power system performance. The paper is then concluded with Section 4, which summarizes the key findings and highlights the paper’s contributions.
2. Research Methodology
2.1. System Simulation Procedure
The optimization and evaluation approach for the designed islanded hybrid microgrid is depicted in Figure 1. The optimization procedure begins with the selection of modules and input parameters, followed by economic and technical analysis, load profile evaluation, and dispatch strategy definition. After the optimal sizes of the resources are identified, they are integrated and implemented in the power system analysis to check the technical validity and reliability of the designed microgrid by using the DIgSILENT PowerFactory platform.
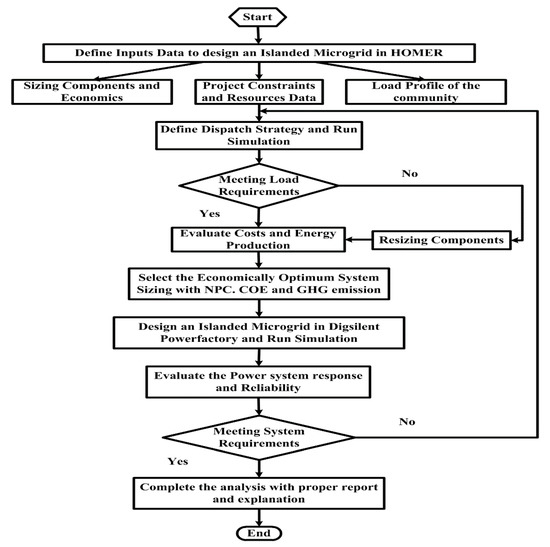
Figure 1.
Flowchart of the system-simulation procedure, which includes the optimization, power flow, and system-reliability analysis.
2.2. Dispatch Strategies
Depending on the power sources, load demand, and weather circumstances, the optimization algorithms use different dispatch mechanisms. “When there is insufficient renewable energy to serve the load, a dispatch strategy is a collection of rules used to govern the generator and storage bank operation” [30,31]. This study examined and implemented four dispatch strategies: (i) load following, (ii) cycle charging, (iii) generator order, and (iv) combination dispatching.
According to the load following (LF) procedure, when a generator is required, it just provides enough capacity to meet the load demand. To keep the system viable and stable, load demand should be met by renewable resources [32]. Power supply to the load contains the highest priority in this dispatch strategy. Hence, the system reliability is expected to be very high in this approach. When using the cycle charging (CC) methodology, a generator is used at full capacity whenever it is needed, and extra electricity is used to charge the battery bank. In general, cycle charging will be ideal in environments where renewable energy is scarce [32]. The battery storage is the critical element in this dispatch strategy, as the battery is expected to be charged always with the surplus power.
The defined sequence of generator combinations follows the generator order (GO) technique to fulfil the load demand, which meets the operating capacity first [33].
To avoid making assumptions about future net-load, the combined dispatch (CD) strategy uses the current net load to determine whether to charge the battery with the generator. At low loads, the CD method avoids using the generator. The combined dispatch (CD) finds the least expensive option for load following or cycle charging at each time step [33,34].
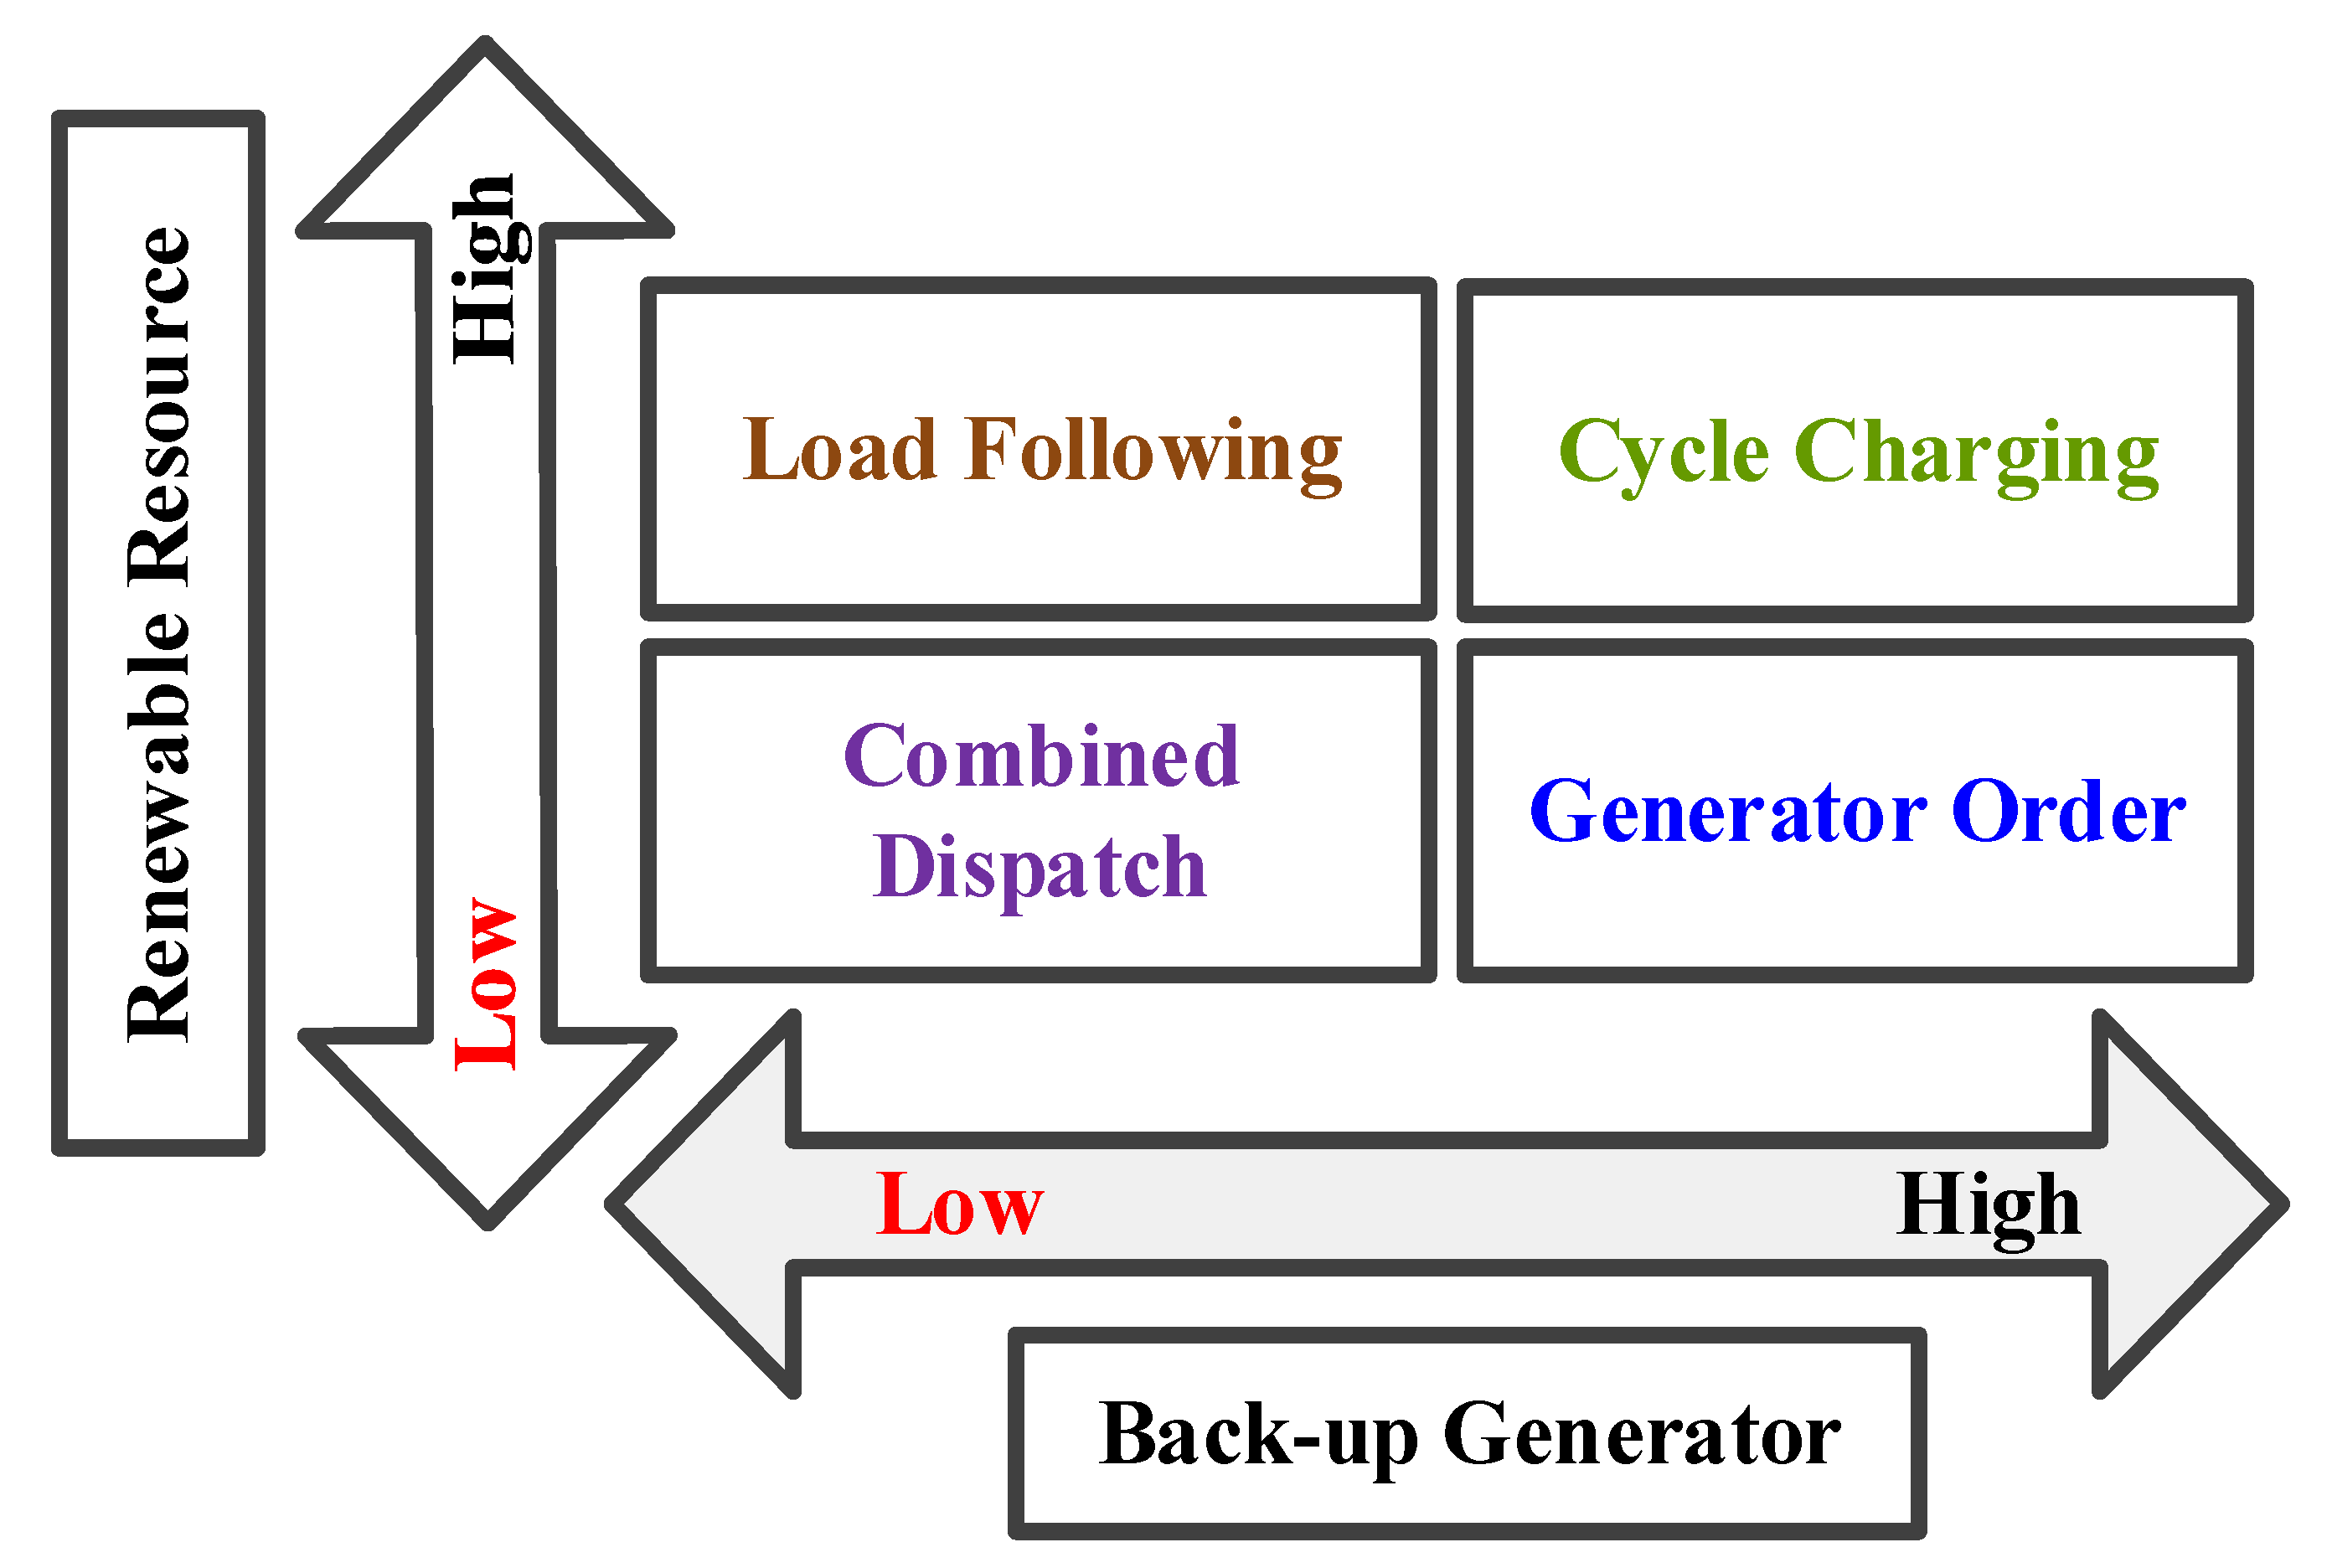
In a microgrid optimization, dispatch strategies refer to power management tactics and optimal sizing criteria. From all four dispatch strategies mentioned above, it is very important to consider the availability of renewable resources, a state-of-the charge of the battery and usage of the backup diesel generator when needed to meet the load demand. Figure 1 shows the priority of the operational strategies to meet the load demand and the consideration of the availability of the generation.
Figure 2 depicts the priority of generators and system demand for the planned microgrid based on the four dispatch options. After analyzing and observing the data, it can be concluded that the LF dispatch strategy has the most impact on system demand, while the GO dispatch strategy has the greatest impact on generator priority.
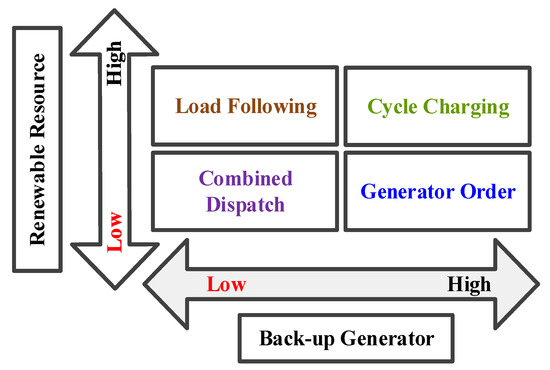
Figure 2.
Impact of renewable resources and diesel engines depends on the different dispatch mechanisms for IHMS.
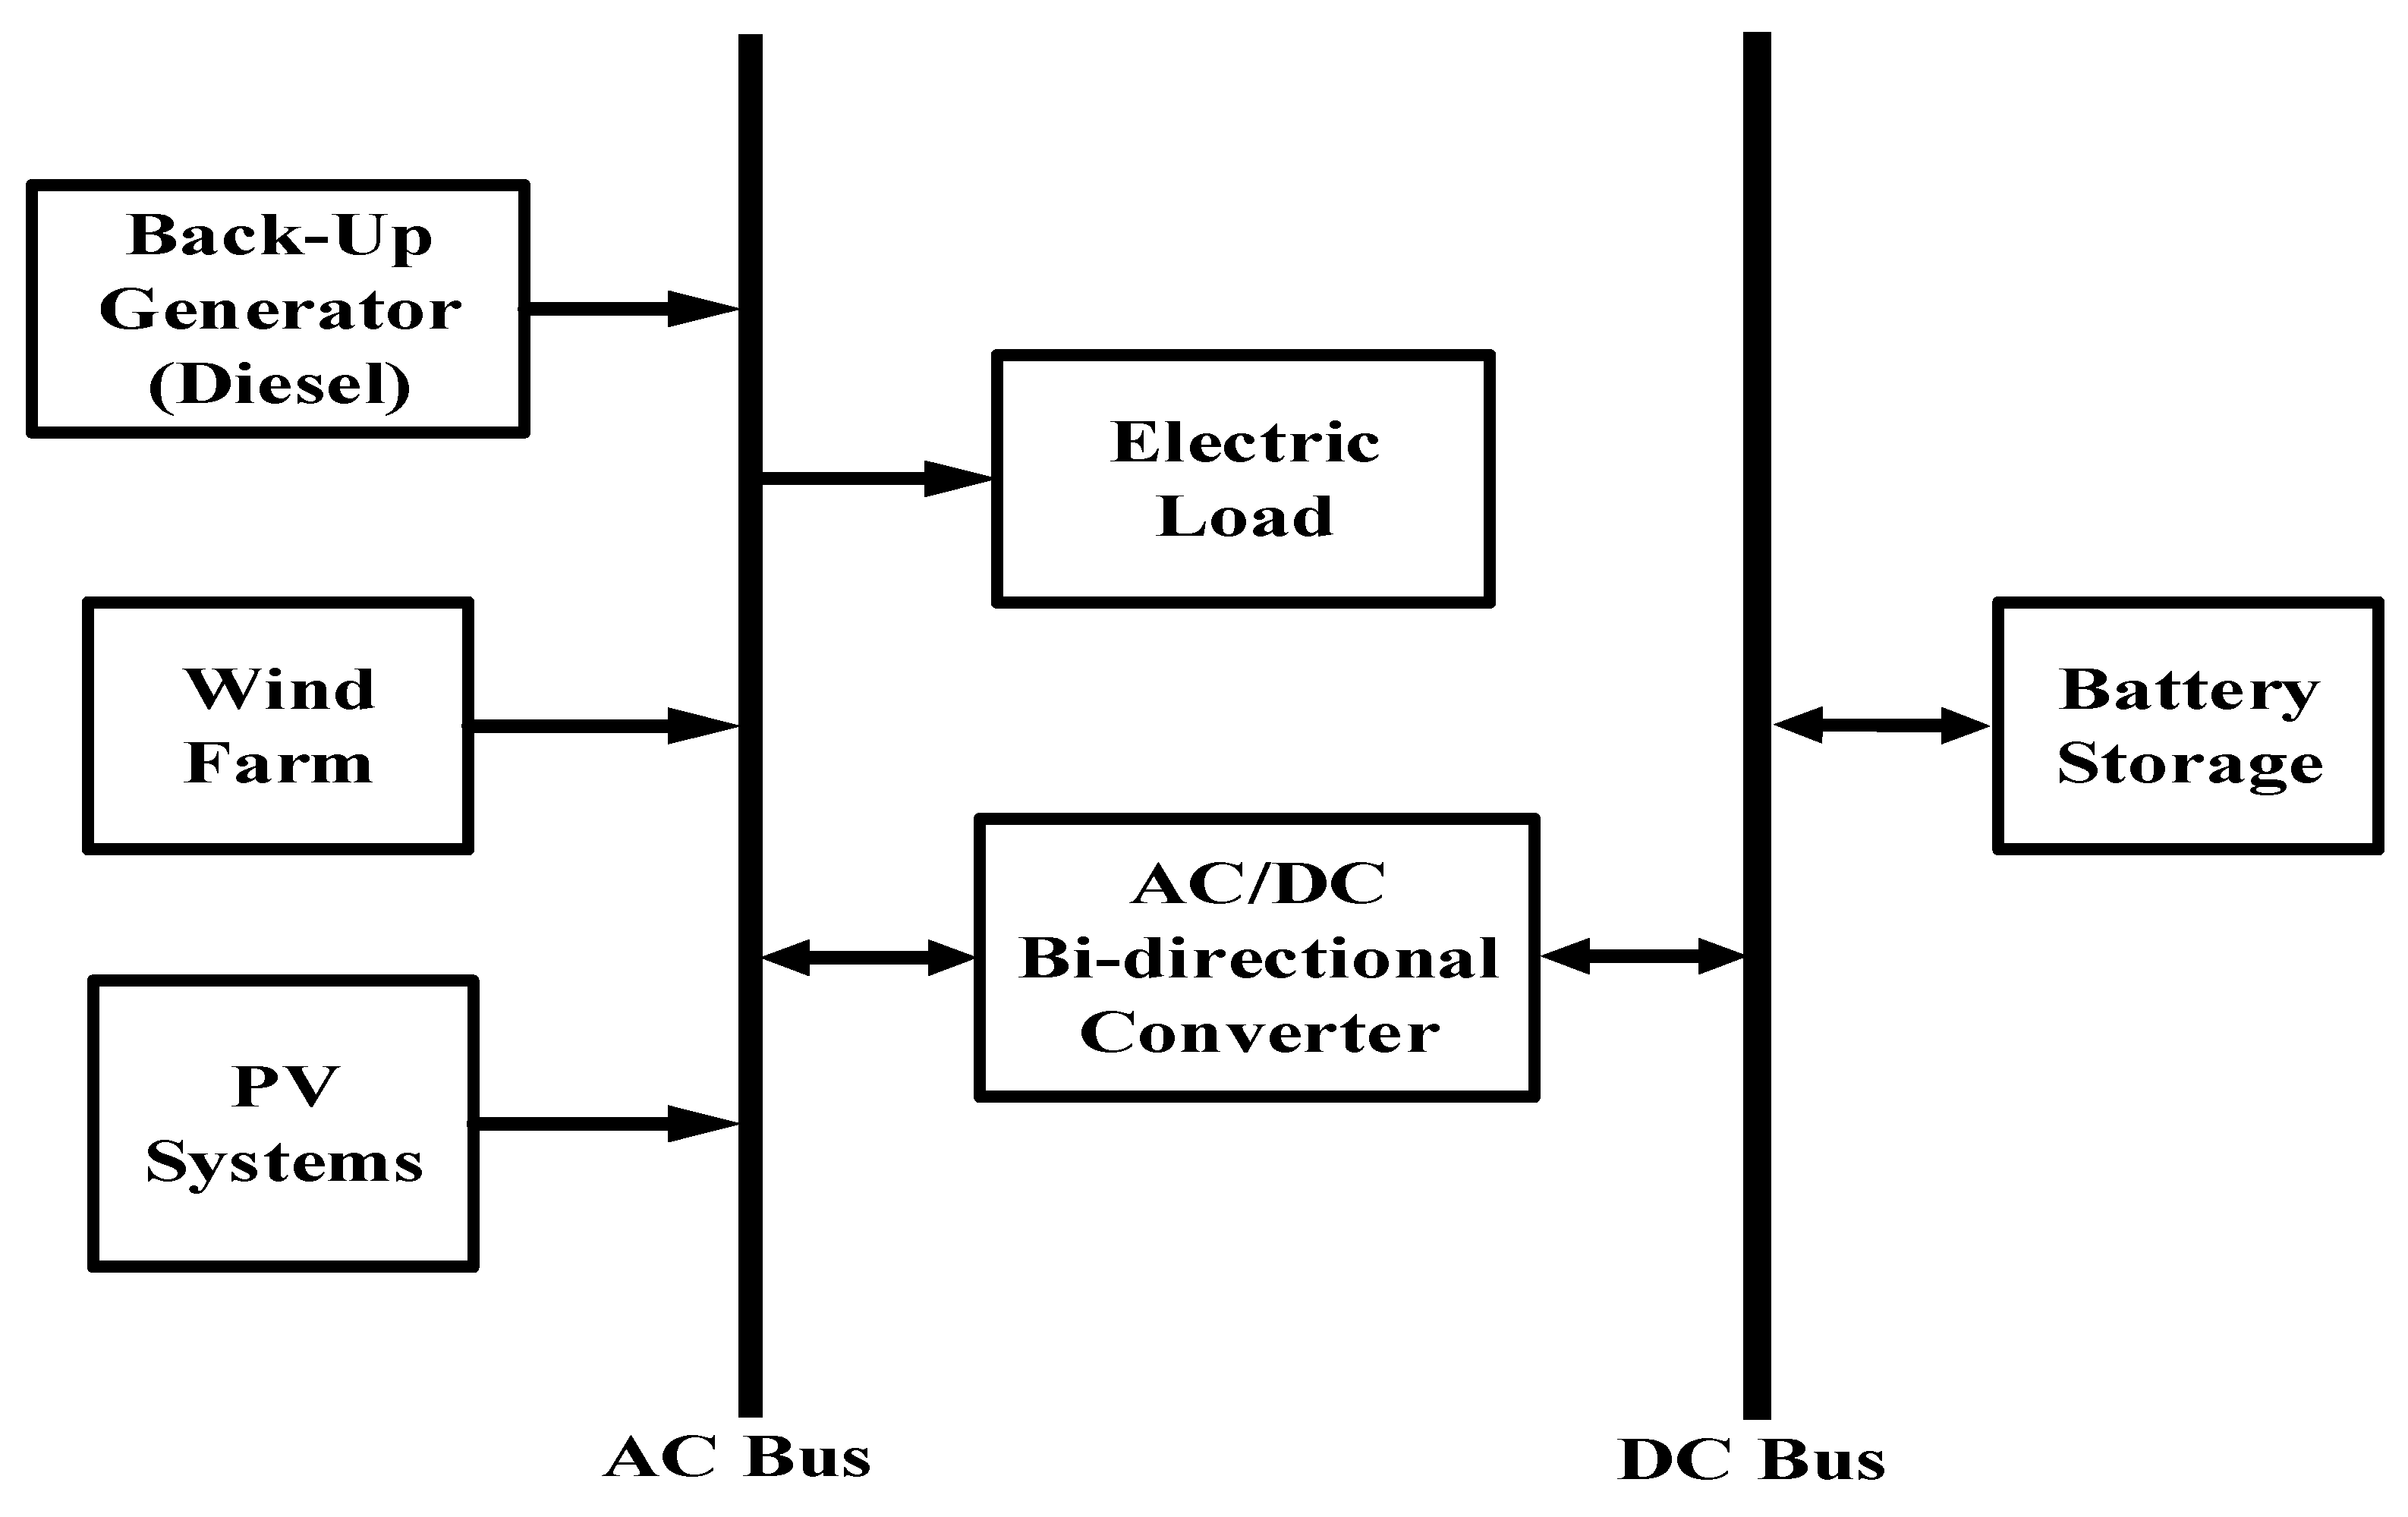
2.3. Microgrid Topology
Figure 3 shows the schematic diagram of the optimization procedure conducted through the simulation mechanism in the HOMER platform. Solar, wind, diesel generator, battery storage, and load profile and system converter modules make up the proposed and simulated islanded microgrid system. The optimization procedure was conducted through the proper application of meteorological data, such as solar irradiation, wind speed, temperature and some technical specifications of PV module, wind turbine module, battery storage, and diesel generator. All the modules were synchronized with the meteorological and technical data and interrelated with the system components. Wind turbine module, PV module, and diesel generator backup are connected with the AC bus, and the battery storage is connected with the DC bus. In between the AC and DC bus, there is a bi-directional converter that was connected to run the power flow according to the load demand.

Figure 3.
Schematic diagram of the Kangaroo Island hybrid microgrid optimization model.
2.4. Optimization Equations
To calculate the optimum cost of energy (COE) for a hybrid system in HOMER Pro, the following equation was used:
where Cann, tot is the total annualized cost, Eprim is the total amounts of primary load, Edef is the total amounts of deferrable load, and Egrid, sales is the amount of energy sold to the grid per year.
To calculate the total net present cost of energy, the following equation was used:
where Cann, tot is the total annualized cost, i is the annual real interest rate, Rproj is the project lifetime, and CRF (.) is the capital recovery factor.
To calculate the CO2 emissions from the hybrid energy system, the following supporting equation was introduced:
where is the amount of CO2 emissions, is the fuel quantity (litter), is the fuel heating value (MJ/L), is the carbon emission factor (ton carbon/TJ), and is the oxidized carbon fraction. Another factor that should have been considered was that 3.667 g of CO2 contains 1 g of carbon.
2.5. Test Microgrid
For the demonstration of the proposed methodology, Kangaroo Island was chosen as the location of the microgrid. Kangaroo Island has established solar- and wind-energy resources [35].
Figure 4 shows the single line diagram of the Kangaroo Island power system which was modified to introduce a hybrid islanded microgrid system [36]. The power system network consists of 13 buses, 7 loads, 6 transformers, 1 wind turbine generator, 1 solar PV generator, 1 BESS, and 1 diesel generator. The wind turbine generator, solar PV, BESS, and diesel generator are connected to Buses 1, 6, 13, and 12, respectively. The network has 7 loads connected to different busses at 0.4, 11, 33, and 66 kV voltage levels. The total electrical load demand is 7.7 MW.
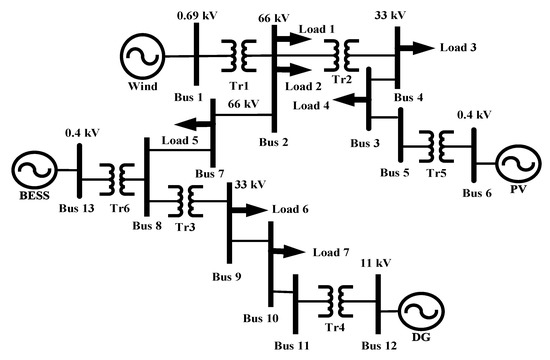
Figure 4.
Single line diagram of simplified Kangaroo islanded hybrid microgrid.
2.6. System Simulation Scenarios
To validate the robustness of the proposed approach, the system simulation procedure was carried out with three different sets of data. The results obtained from these three sets of data are presented to compare the design choices and to identify the most appropriate dispatch strategy for microgrid optimization. The considered datasets are (i) data collected from NASA surface metrology, (ii) Real Dataset 1, and (iii) Real Dataset 2; (ii) and (iii) are collected from BOM.
- (1)
- Data Scenario 1: (NASA Data)—The representative data include wind speed [37] and solar irradiation data [38] for 1 year with a 30-min data resolution. The load data for Kangaroo Island were obtained from Reference [39].
- (2)
- Data Scenario 2: (Real Dataset 1)—The second set of representative data for Kangaroo island includes solar irradiance, temperature, and wind-speed data [40,41] for 1 year, with a data resolution of 30 min. The representative load data were obtained from Reference [39].
- (3)
- Data Scenario 3: (Real Dataset 2)—Similar to Data Scenario 2, the representative dataset for Kangaroo island also includes solar irradiance, temperature, and wind-speed data [40,41] for a year, with a data resolution of 30 min. The load data were obtained from Reference [39].
2.7. Reliability Indices
The reliability indices considered in this study are System Average Interruption Frequency Index (SAIFI), System Average Interruption Duration Index (SAIDI), Customer Average Interruption Frequency Index (CAIFI), Customer Average Interruption Duration Index (CAIDI), Average Energy Not Supplied (AENS), and Average Service Unavailability Index (ASUI) [42].
3. Results and Discussion
3.1. Optimal Sizing
Table 1 shows the comparison of NPC, COE, and CO2 emission obtained from the HOMER optimization solutions according to the four dispatch strategies (LF, CC, GO, and CD) for three different data scenarios [43].

Table 1.
Comparison of NPC, COE, and CO2 emission according to the four dispatch strategies for three different cases.
From Table 1, it can be observed that NPC, CO2 emission, and operating cost are the lowest for GO strategy for the Real Data 2. However, COE is the lowest for the CD strategy using the NASA data. According to the working principle of GO strategy on every occasion, a generator follows the order of priority defined in the GO table. The GO strategy usually permits the high priority generator to dispatch first. Thus, the application of battery storage is limited here as the load demand will be fulfilled by the available renewable generation at first. That is why for GO the COE is higher than the other three dispatch strategies.
The NPC and operating cost are the highest for the CC strategy for Real Data 1 and 2 in comparison to all other strategies and scenarios. For CC strategy on every occasion, a generator needs to operate to serve the primary load demand while it operates at full output power. Thus, the priority of redundant energy application is going through the process of battery charging. That is why the investment cost is higher in the CC strategy. The CO2 emission is the highest for CD with Real Data 1 (6.72 Kt/year) and CC with Real Data 2 (6.69 Kt/year). According to the working principle of CD strategy, it can be observed that in every step, it decides which one is the most feasible option between LF and CC. As the CD selects CC, with the CC strategy, the diesel generator serves the load demand and charges the battery; thus, CC is producing much CO2.
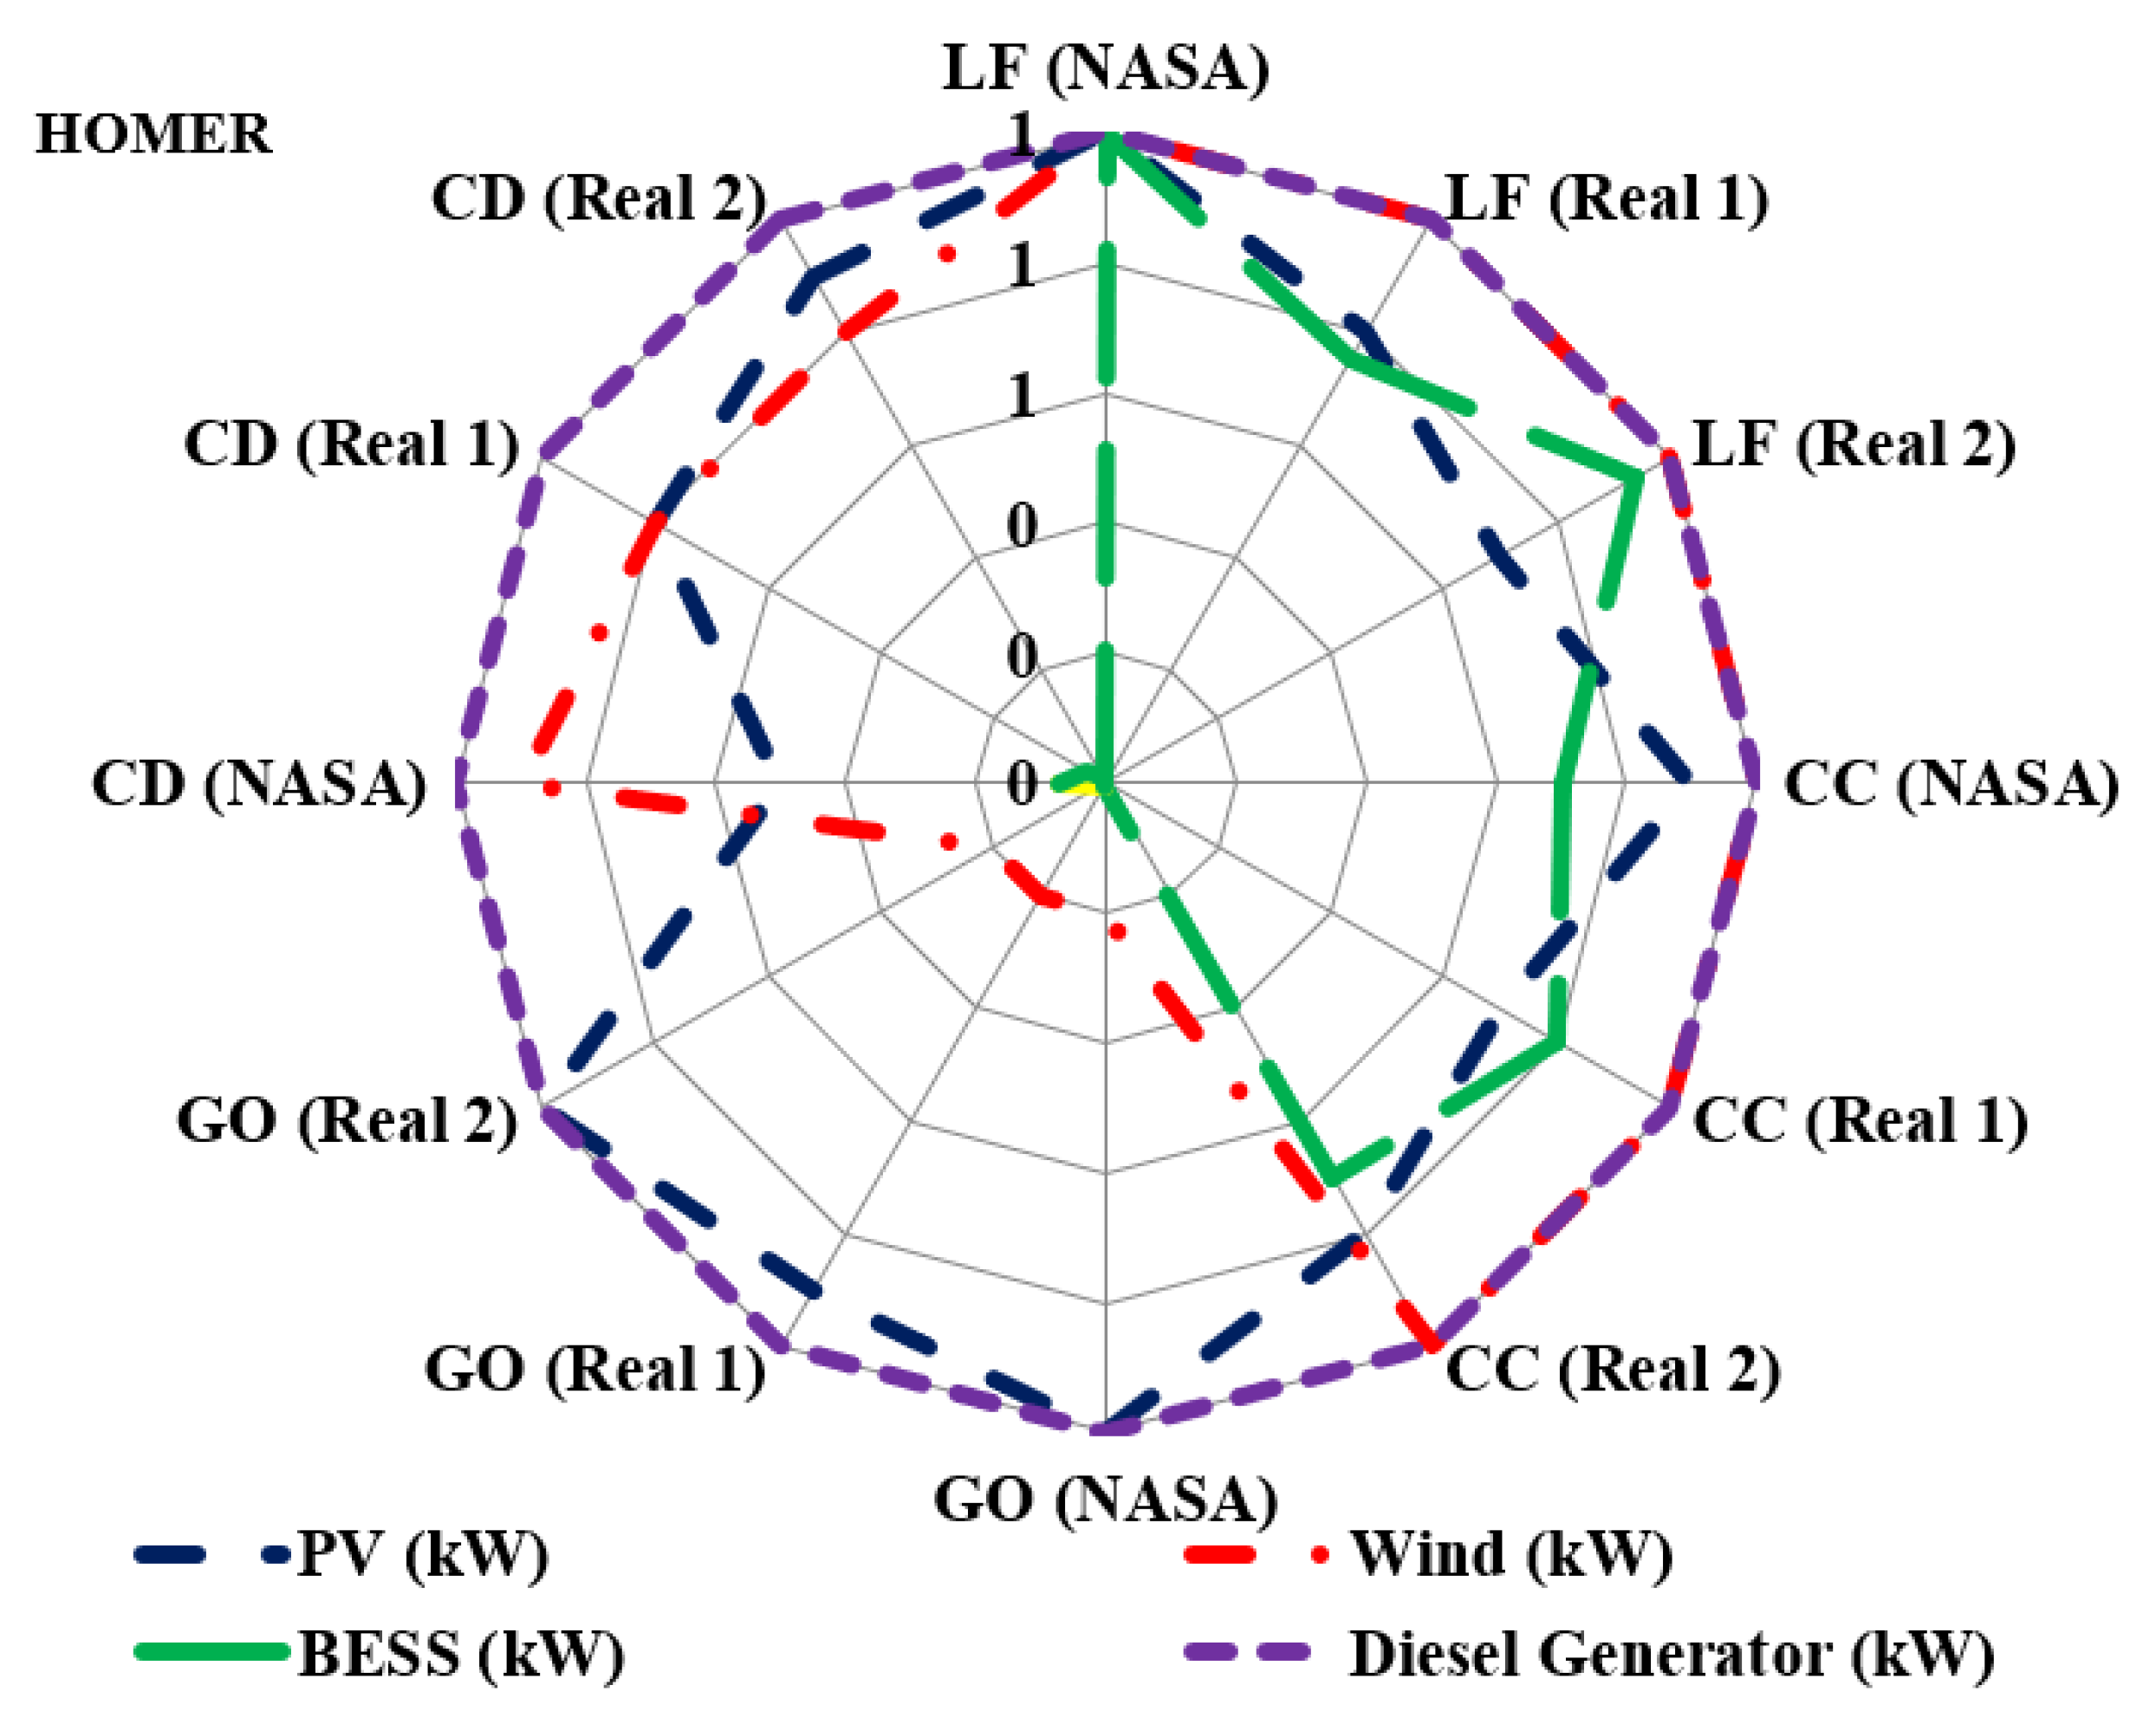
Figure 5 shows the comparison of the optimal sizes of power generation components (normalized) for Kangaroo Island for the four dispatch strategies obtained from the HOMER Pro. The optimal size of the PV, wind, diesel generation and battery system is different to support the same load profile as governed by the various dispatch strategies. Because the electricity generated by the PV and wind modules exceeds the load demand, the LF method requires the greatest battery size. As a result, a larger battery is required to store the excess power produced, ensuring future use in the event of no renewable power supply. The size of the PV, wind, and battery modules is the least among other dispatch systems, according to the ideal size of each module under the GO dispatch strategy, because, according to the GO, each module’s size will be determined by the overall load and generator sequence. The GO follows a defined order of generator combinations and uses the first combination in the list that meets the operating capacity. Moreover, the battery size using the GO is the smallest too. Battery capacity using the CD is the second smallest among other dispatch strategies. For the CD strategy, it can be concluded that, in every step, it decides which one is the most feasible option among LF and CC. To ensure energy security, diesel generator capacity is 3.5 MW for all the dispatch strategies under all the scenarios, as the average load is 3.5 MW for the Kangaroo Island.
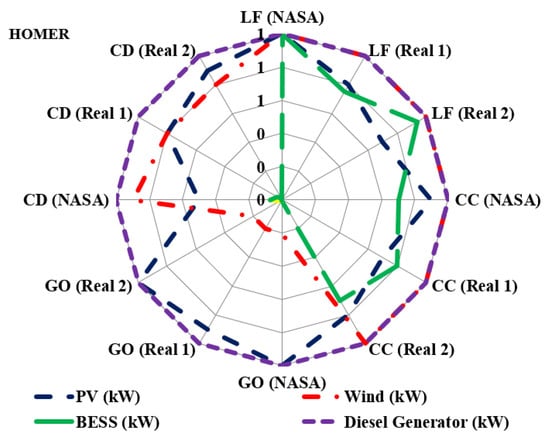
Figure 5.
Comparison of optimal capacity (normalized) of generation and storage for three datasets according to four dispatch strategies in HOMER Pro.
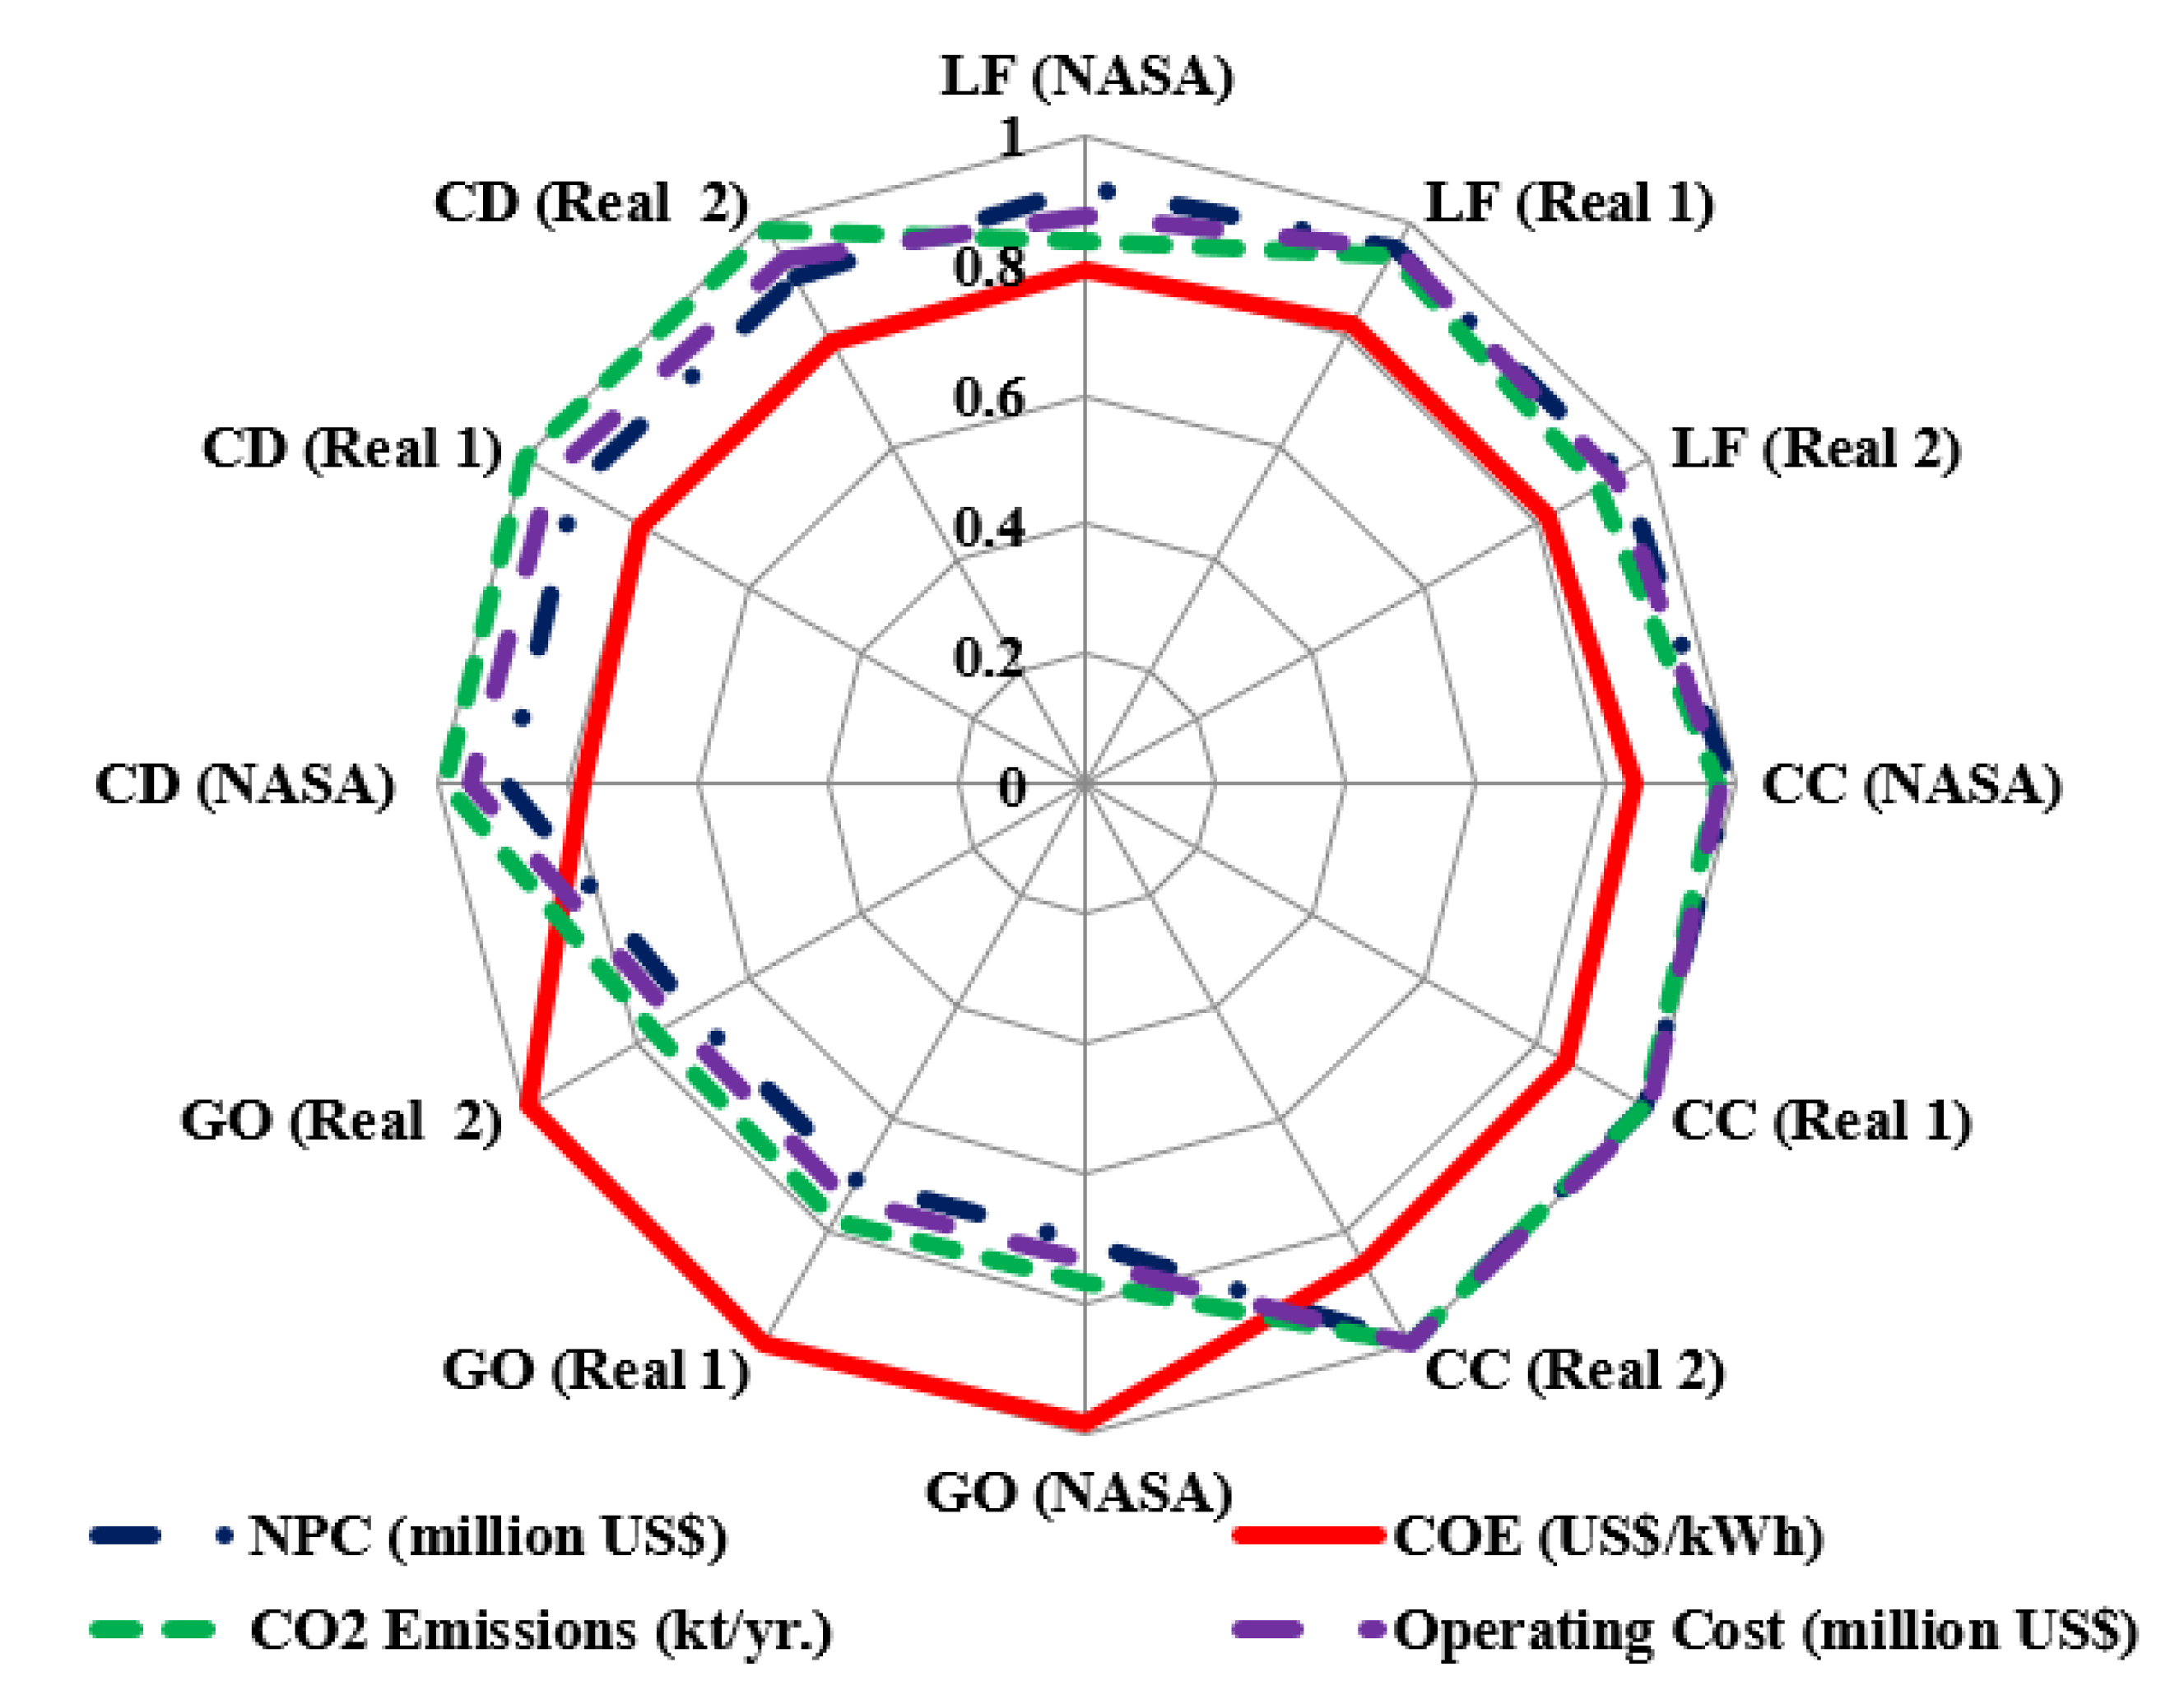
Figure 6 shows a comparison of NPC, COE, and CO2 emission (normalized) according to four dispatch strategies for three datasets. These are explained previously in Table 1.
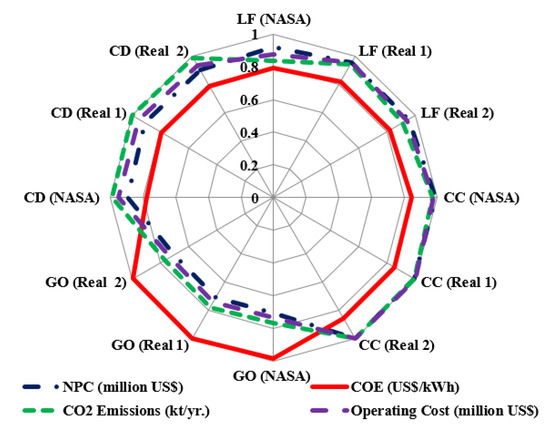
Figure 6.
Comparison of NPC, COE, and CO2 emission (normalized) according to four dispatch strategies for three datasets.
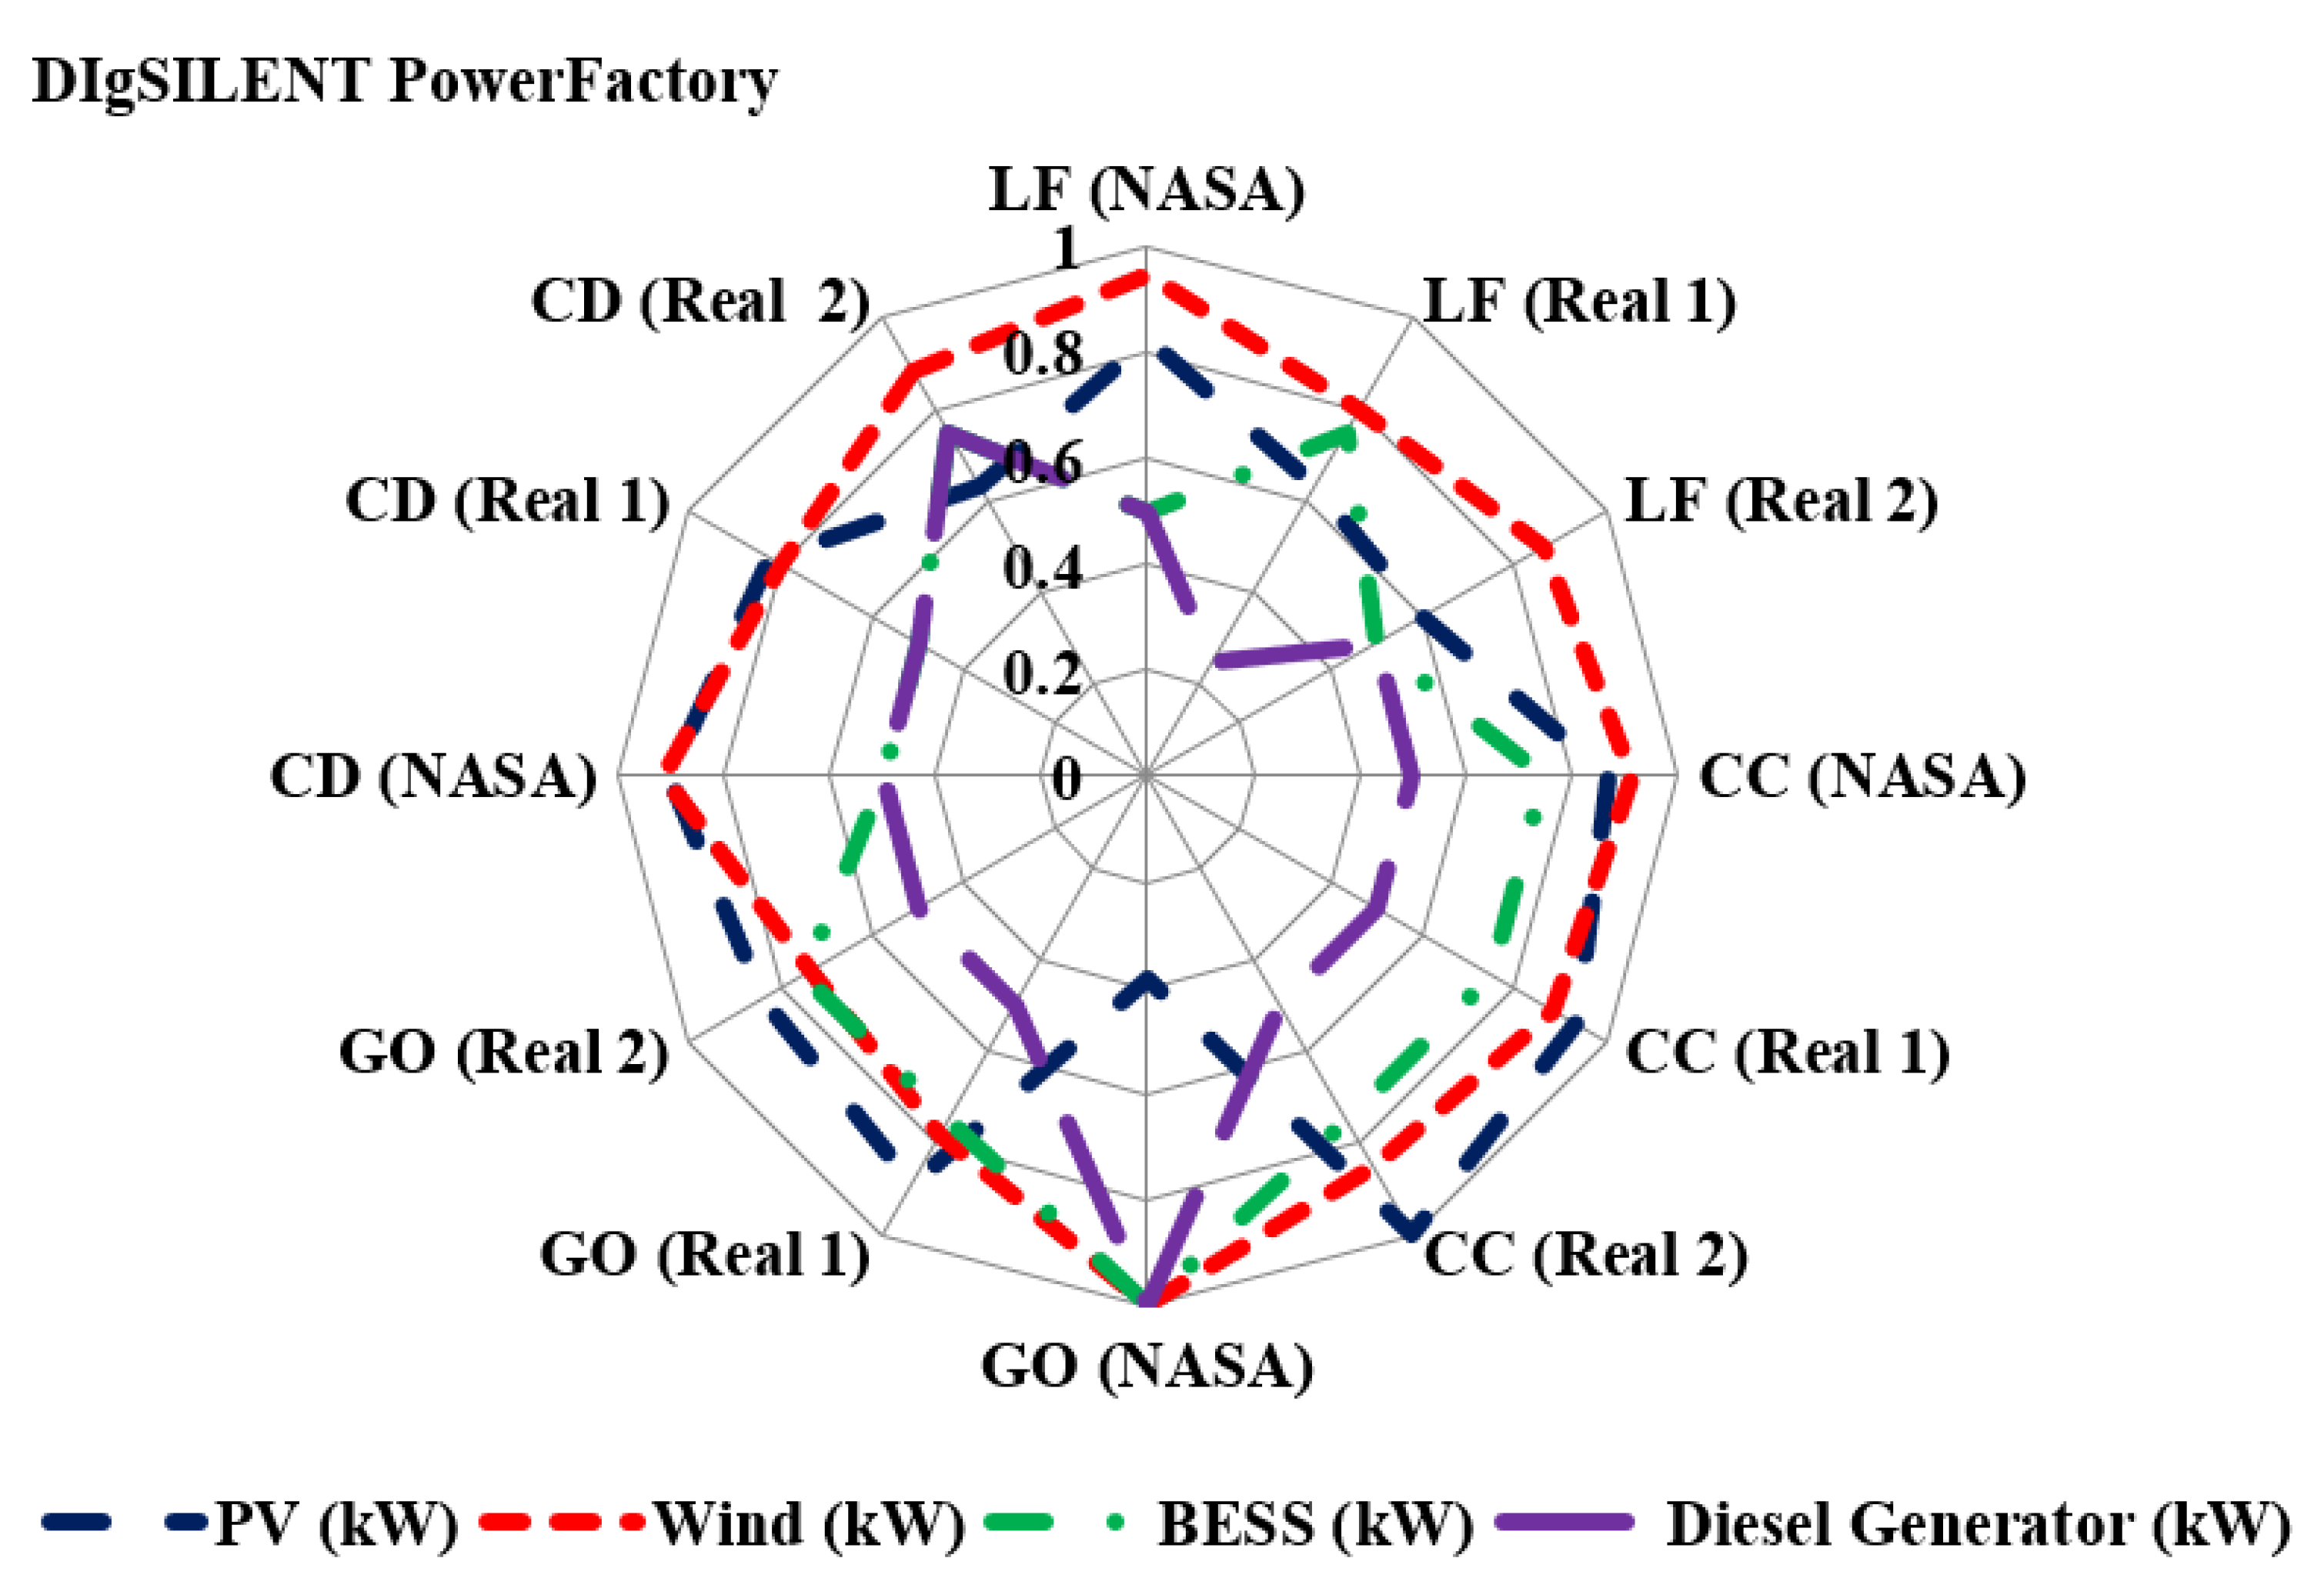
Figure 7 shows the optimal sizes of wind, PV, diesel generator, and battery module (normalized) as per the four dispatch strategies to ensure stable power system operation. These were obtained by using DIgSILENT PowerFactory. The starting values of these sizes were the optimal values obtained from the HOMER Pro. HOMER Profound the optimal sizes based on the objective functions described in Section 3 whereas DIgSILENT PowerFactory followed the optimal sizes according to the optimal power flow and total system stability.
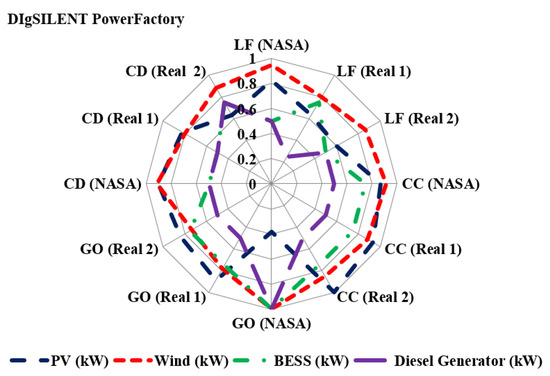
Figure 7.
Comparison of optimal sizes (normalized) of each module from three different cases according to four dispatch strategies in DIgSILENT PowerFactory platform.
3.2. Power System Reliability Assessment
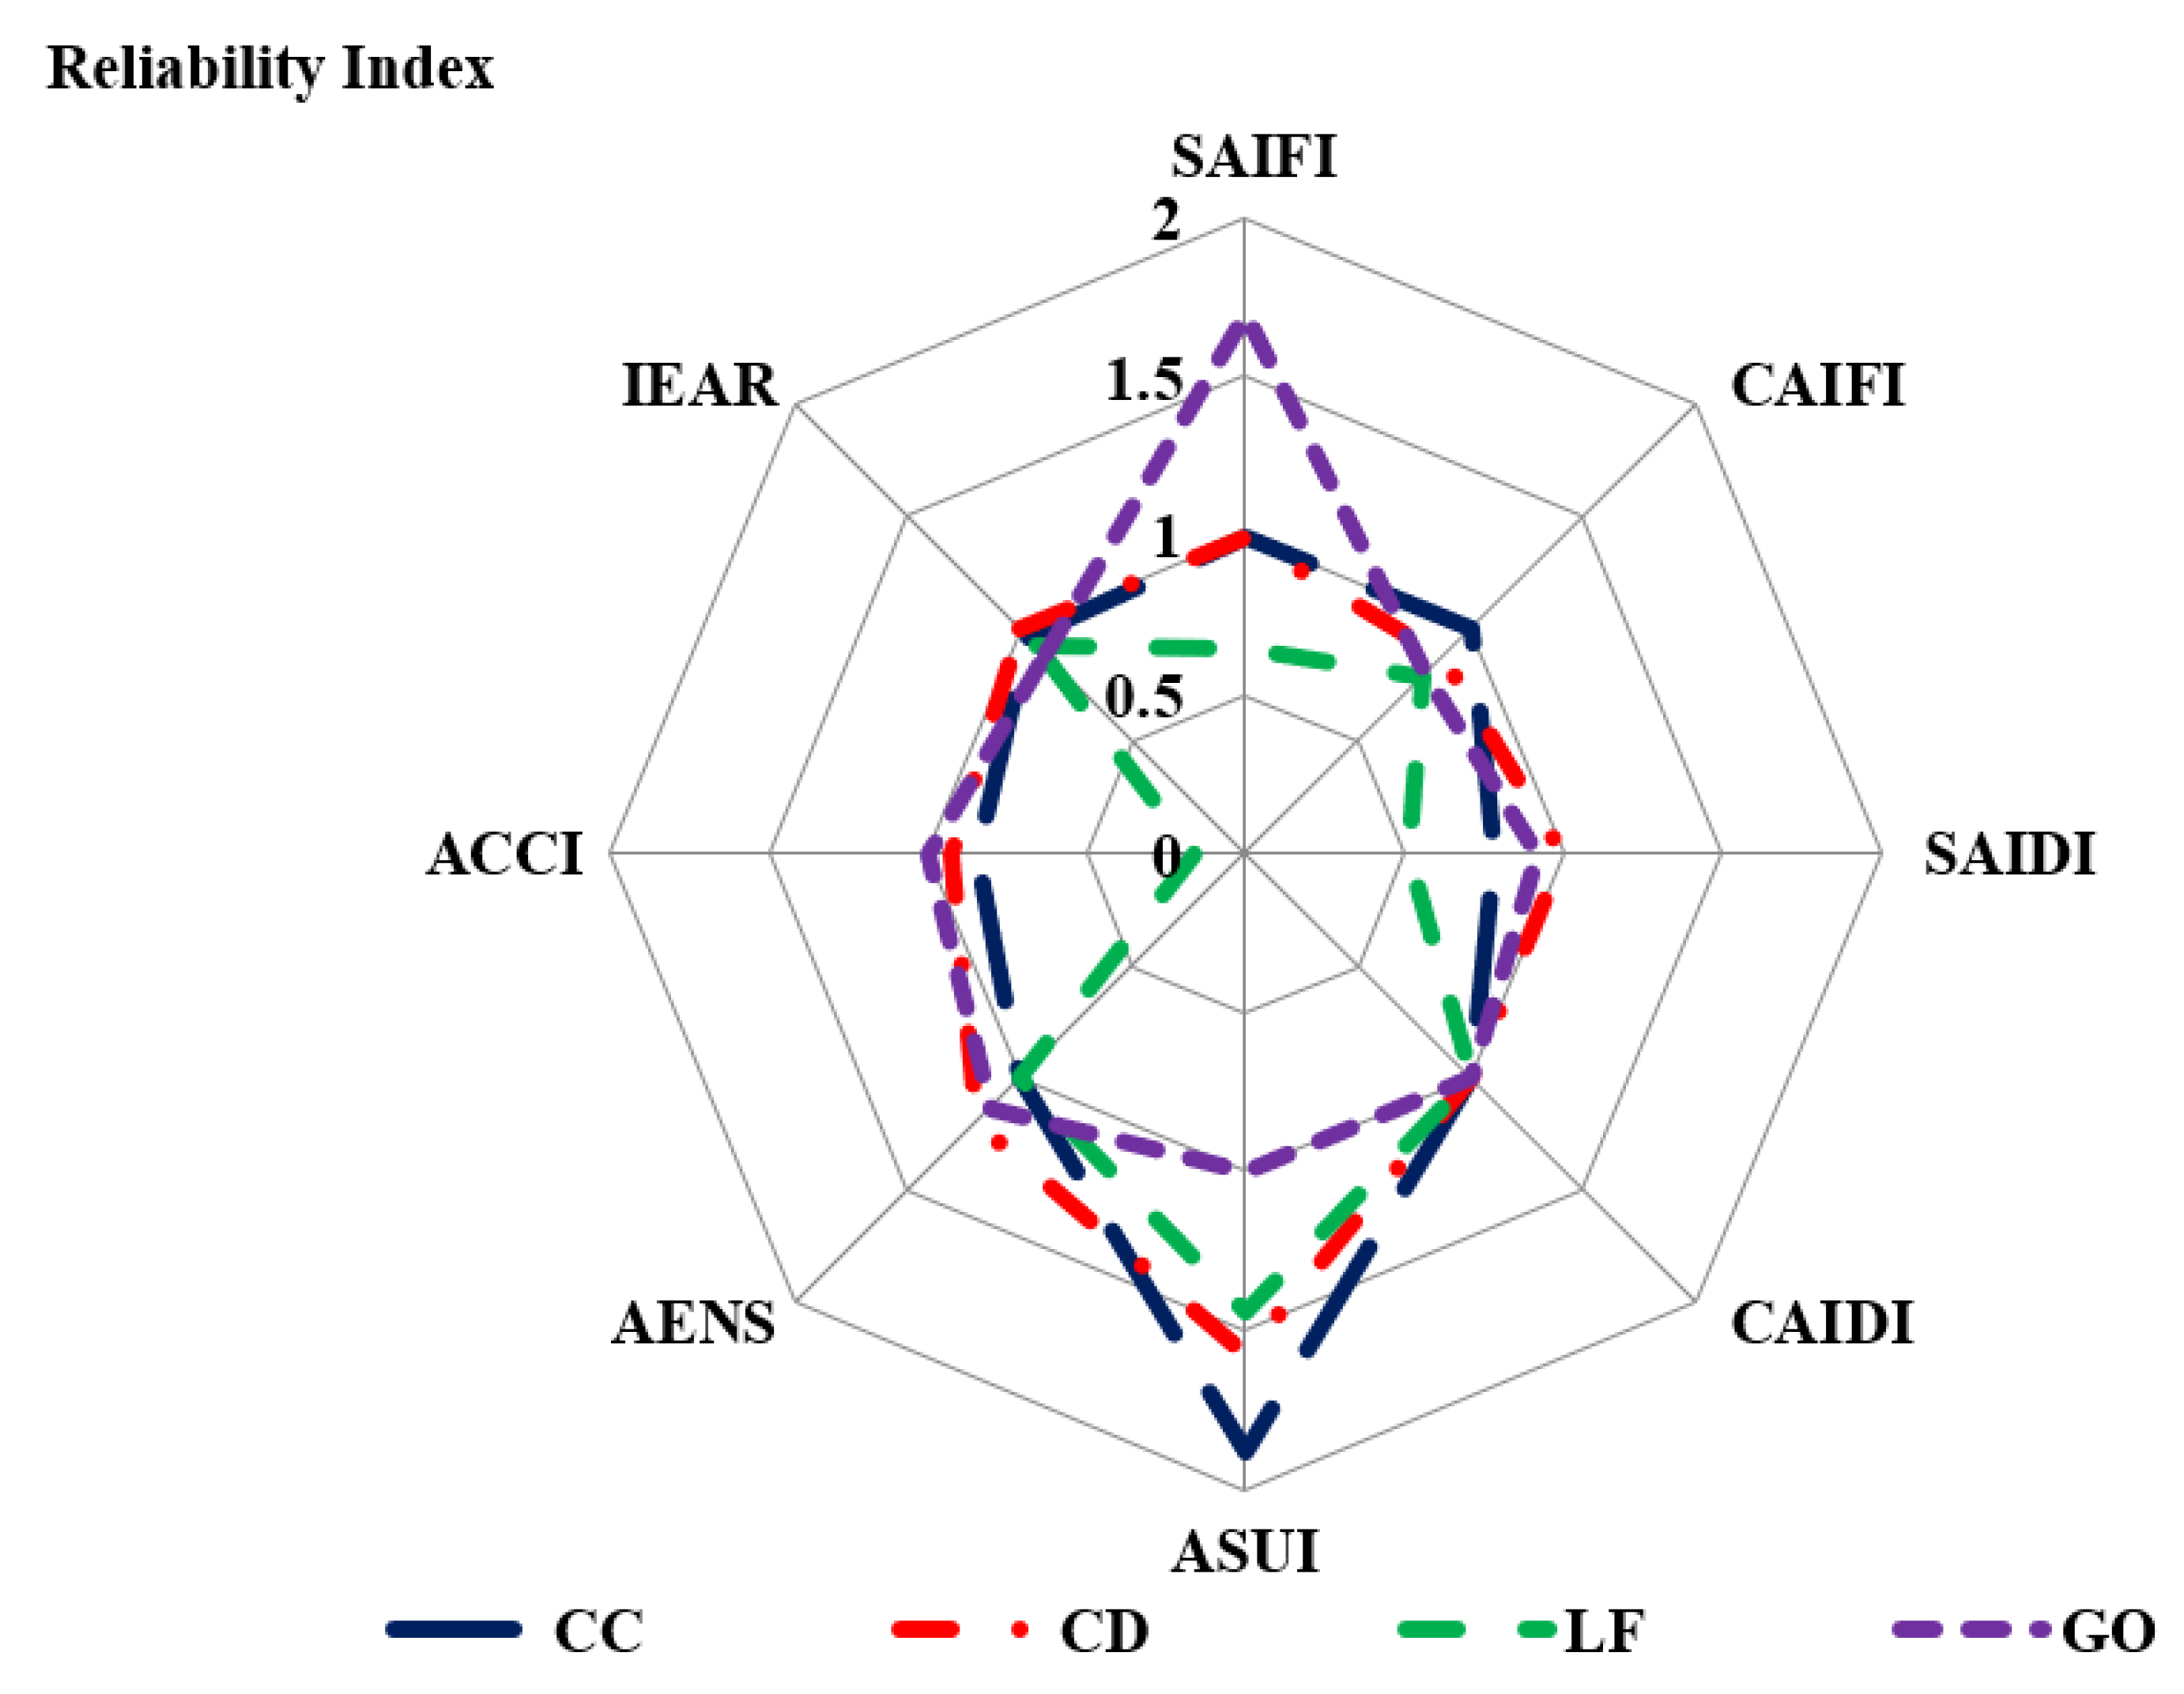
Figure 8 shows the normalized values of reliability indices according to the four dispatch strategies. Several selected reliability indices for the designed islanded hybrid microgrid are presented in Figure 8 to compare the four dispatch strategies. According to the comparison, it can be observed that the LF has better SAIDI, SAIFI, and ACCI than other dispatch strategies, because the LF provides the highest priority to serve the loads from any available generation resources; therefore, this strategy reduces the possibility of a system outage. Therefore, the outage indices, such as SAIDI and SAIFI, are less for this strategy.

Figure 8.
Reliability index parameters according to four dispatch strategies.
3.3. Power System Voltage and Frequency Assessment
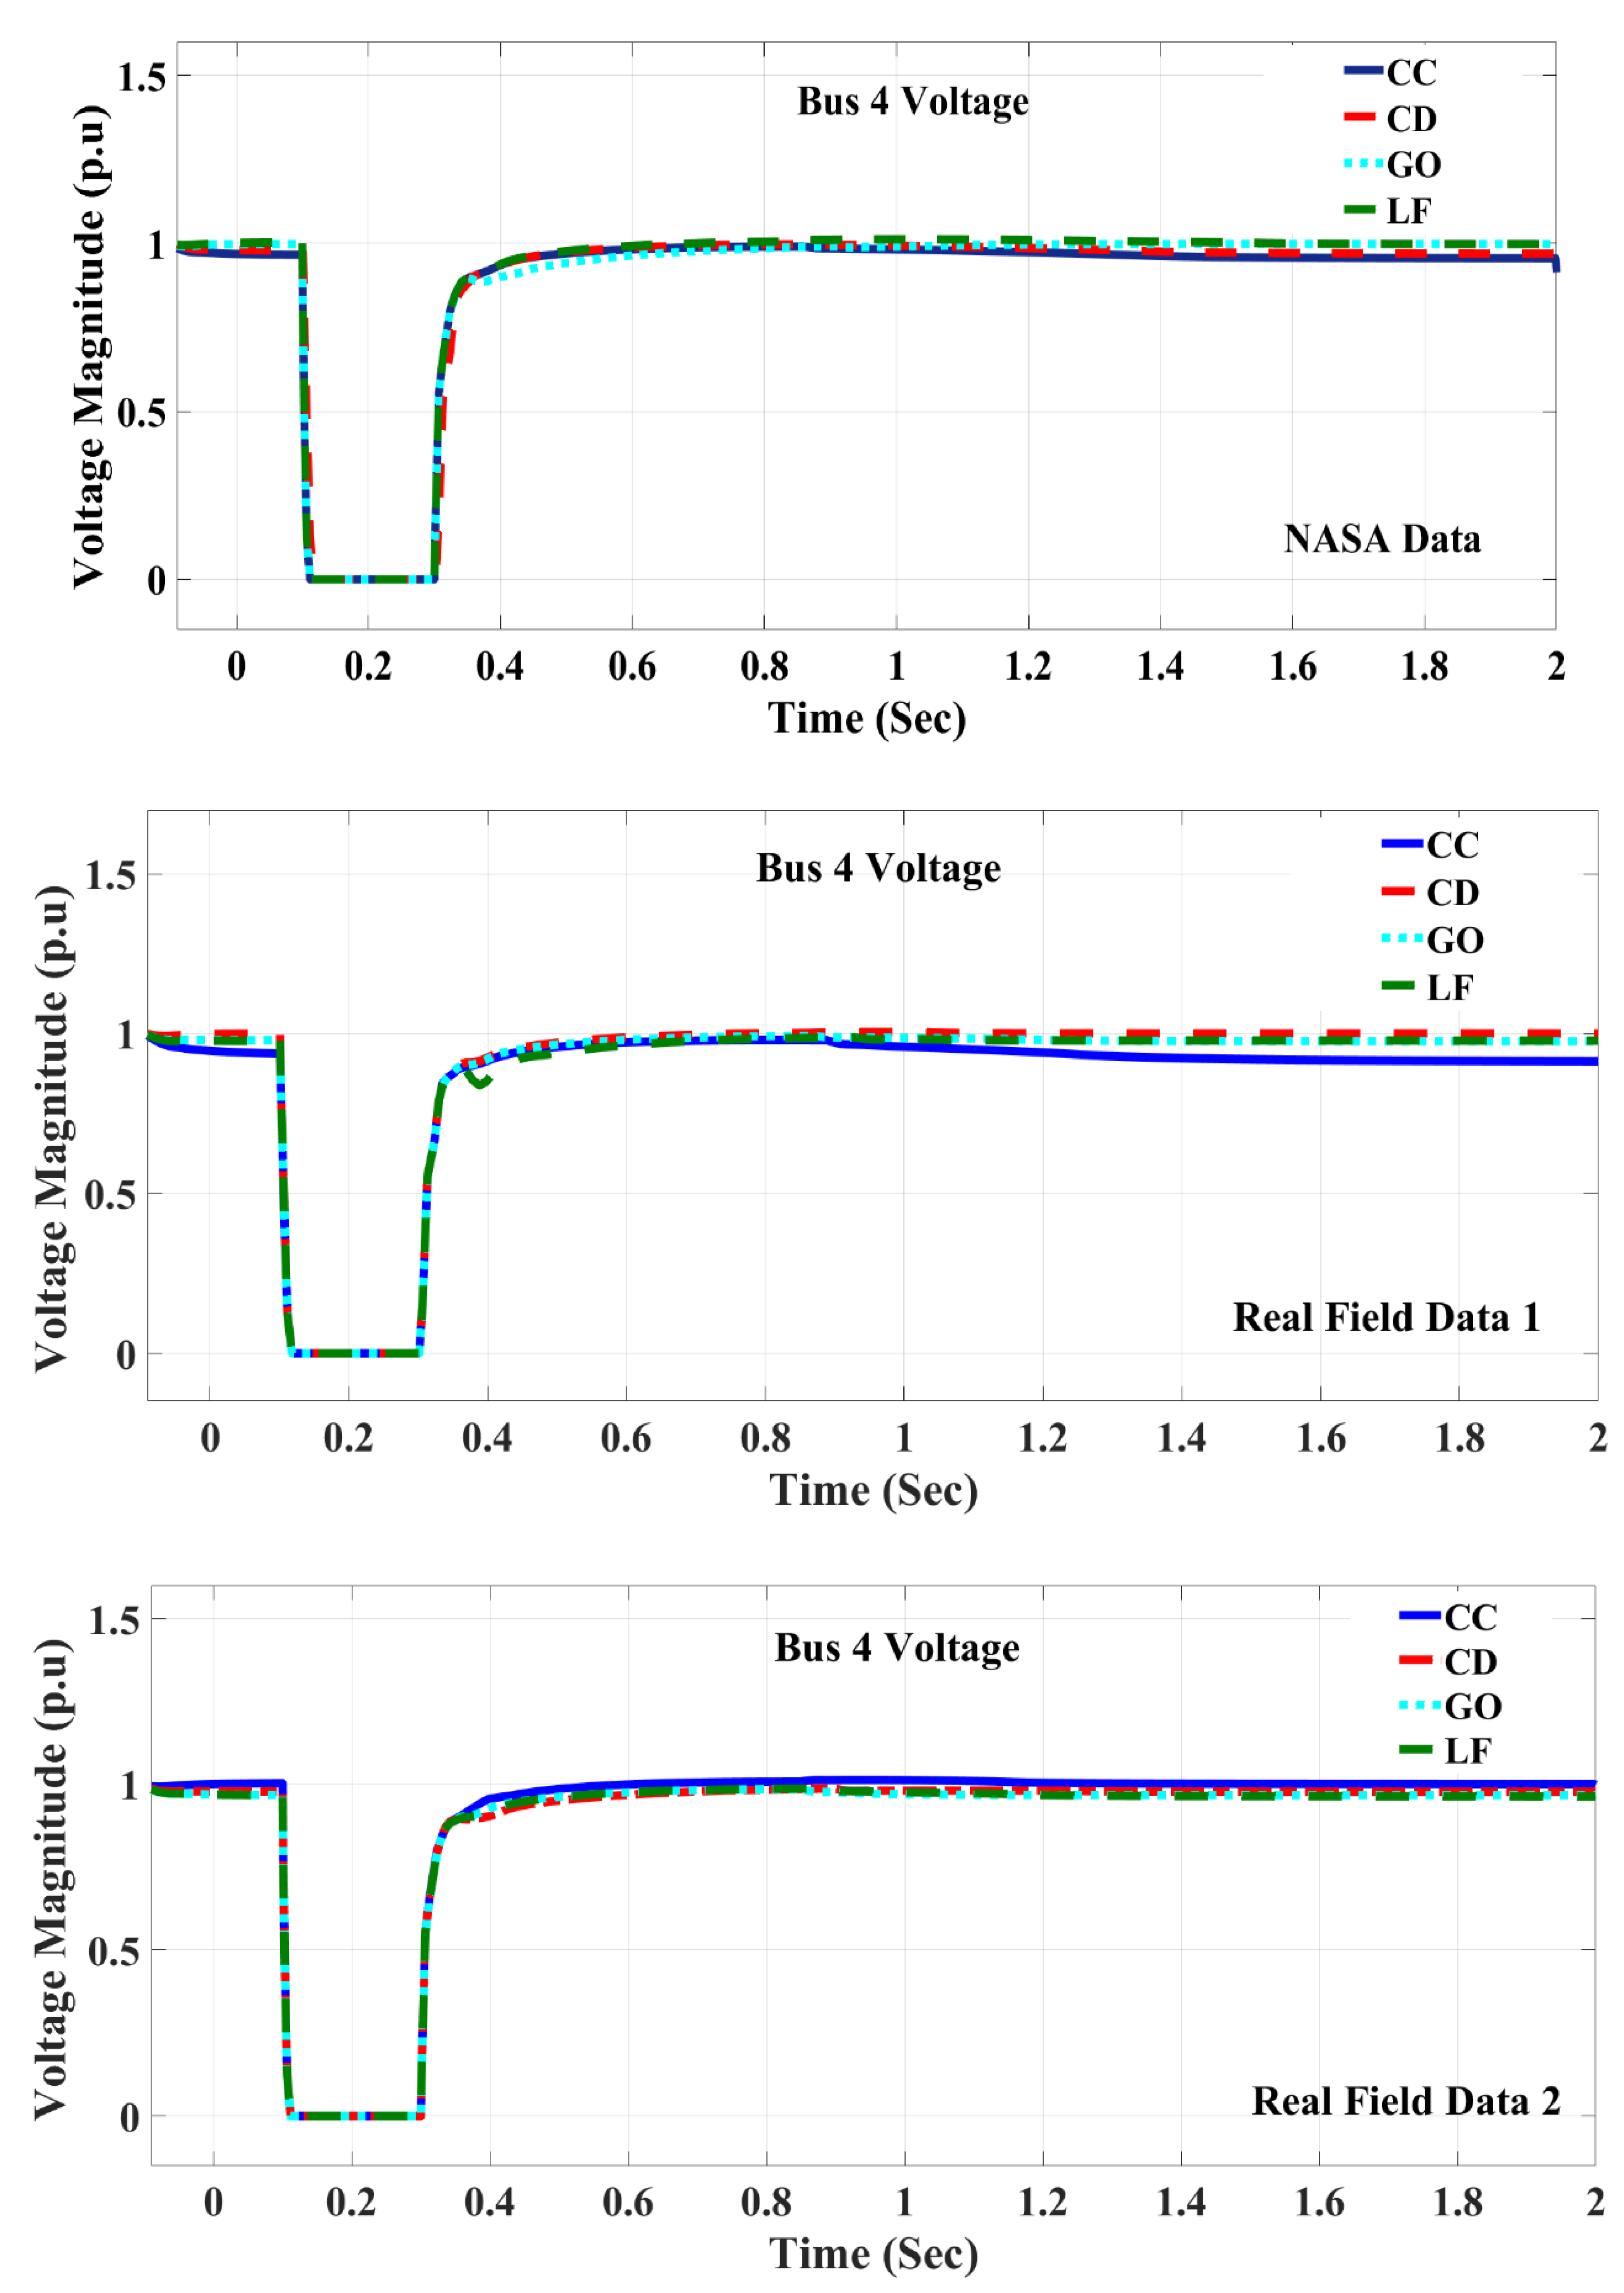
A three-phase short-circuit fault was implemented at Bus 4 from 0.1 to 0.3 s to check the bus voltage response for all four dispatch strategies. Figure 9 presents the transient voltage responses at Bus 4 (load bus) of the microgrid following a three-phase fault that sustained for 200 ms. For Data Scenario 1 (NASA data), the voltage at Bus 4 is very similar for all four dispatch strategies. Due to the variations in wind speed and solar irradiance, the voltage deviation is higher at 1s for GO and LF. For Data Scenario 2 (Real Field Data 1), Bus 4’s voltage deviation for the CC is increasing from 0.9 s, whereas the CD, GO, and LF show the same trajectories. It can be observed that Bus 4’s voltage under the GO strategy for all three data scenarios is stable throughout the operation, especially from 0.3 s. The Bus 4 voltage responses for the other three dispatch strategies considering the different data scenarios are changing due to the size differences of generation and load.
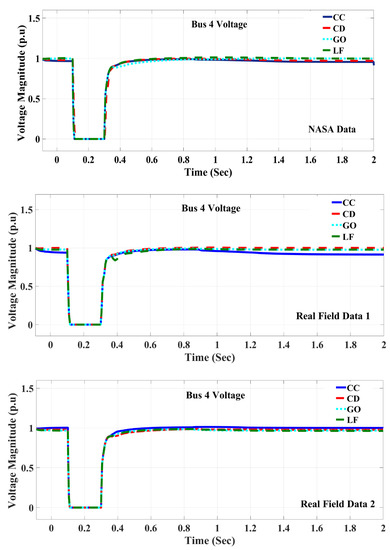
Figure 9.
Voltage responses at Bus 4, according to the four dispatch strategies.
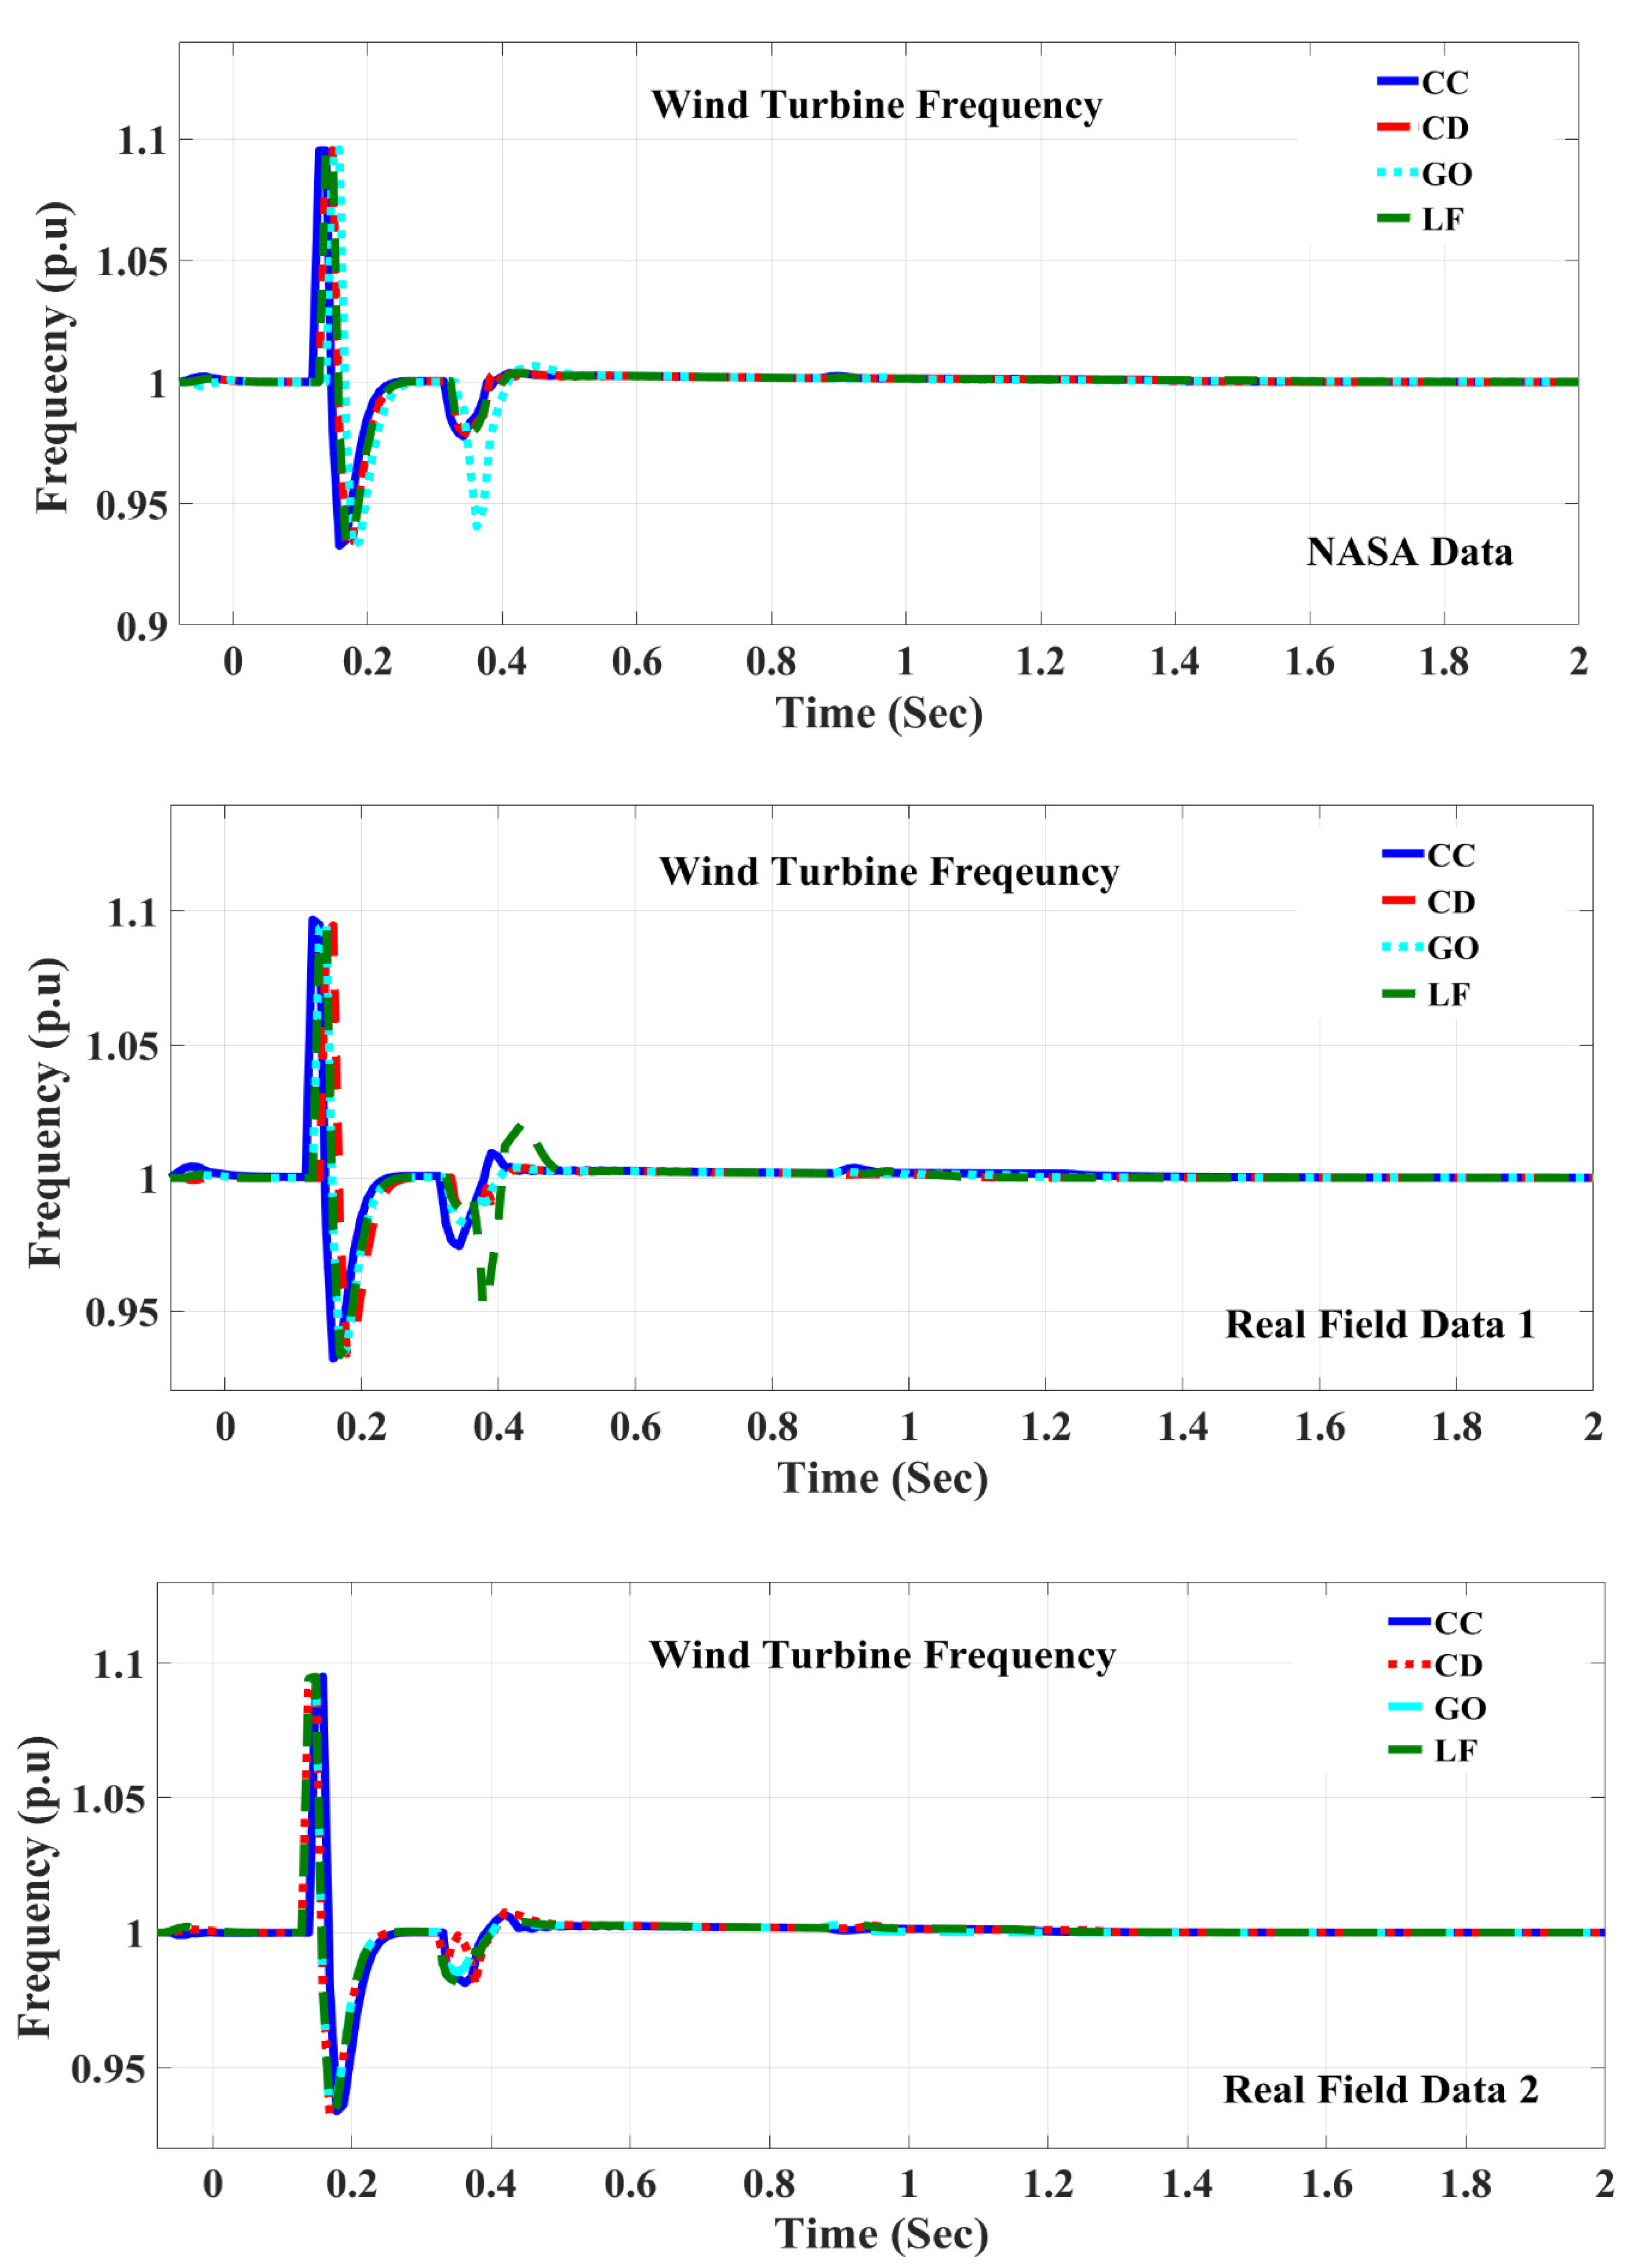
Figure 10 shows the frequency responses of the wind turbine generator at Bus 1 considering four dispatch strategies and three data scenarios. For CC and CD, the three-phase fault induced the frequency drop that occurred at the same time and for the same duration; however, for the GO and LF, they are a little delayed. For Data Scenario 1, under the GO, the frequency dropped one more time before stabilizing. However, for Data Scenario 2, under LF, the frequency dropped around 0.3 s and recovered around 0.4 s. The frequency response is stable after 0.38 s for all dispatch strategies under all the data scenarios. Interestingly, for Data Scenario 3, under all four dispatch strategies, frequency responses are very similar showing undershoots and overshoots and mostly recovering from 0.42 s.
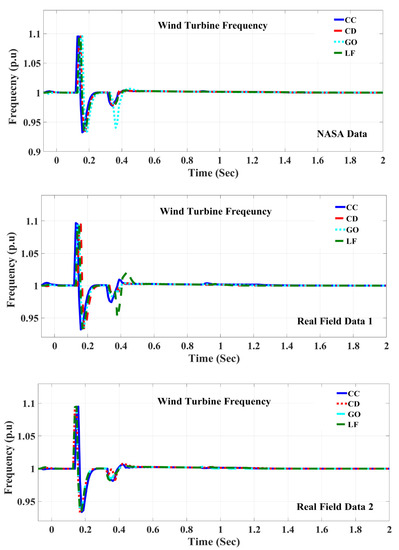
Figure 10.
Frequency responses of wind turbine generator at Bus 1 for four dispatch strategies.
The frequency responses of the CC and CD from PV module are very similar for all scenarios. However, for the GO and LF, they are very different for all scenarios. These frequency responses match with those of the wind turbine generator for Data Scenarios 1 and 2.
The frequency response of BESS under the LF and GO is very similar, as the load demand is the priority and needs to be fulfilled, and the renewable power generation is chosen based on the availability of renewable resources. On the other hand, the frequency responses under the CC and CD are different from the other two dispatch strategies as the CC prioritizes charging battery storage and CD supplies power to the nearest load bus.
3.4. Power System Real and Reactive Power Assessment
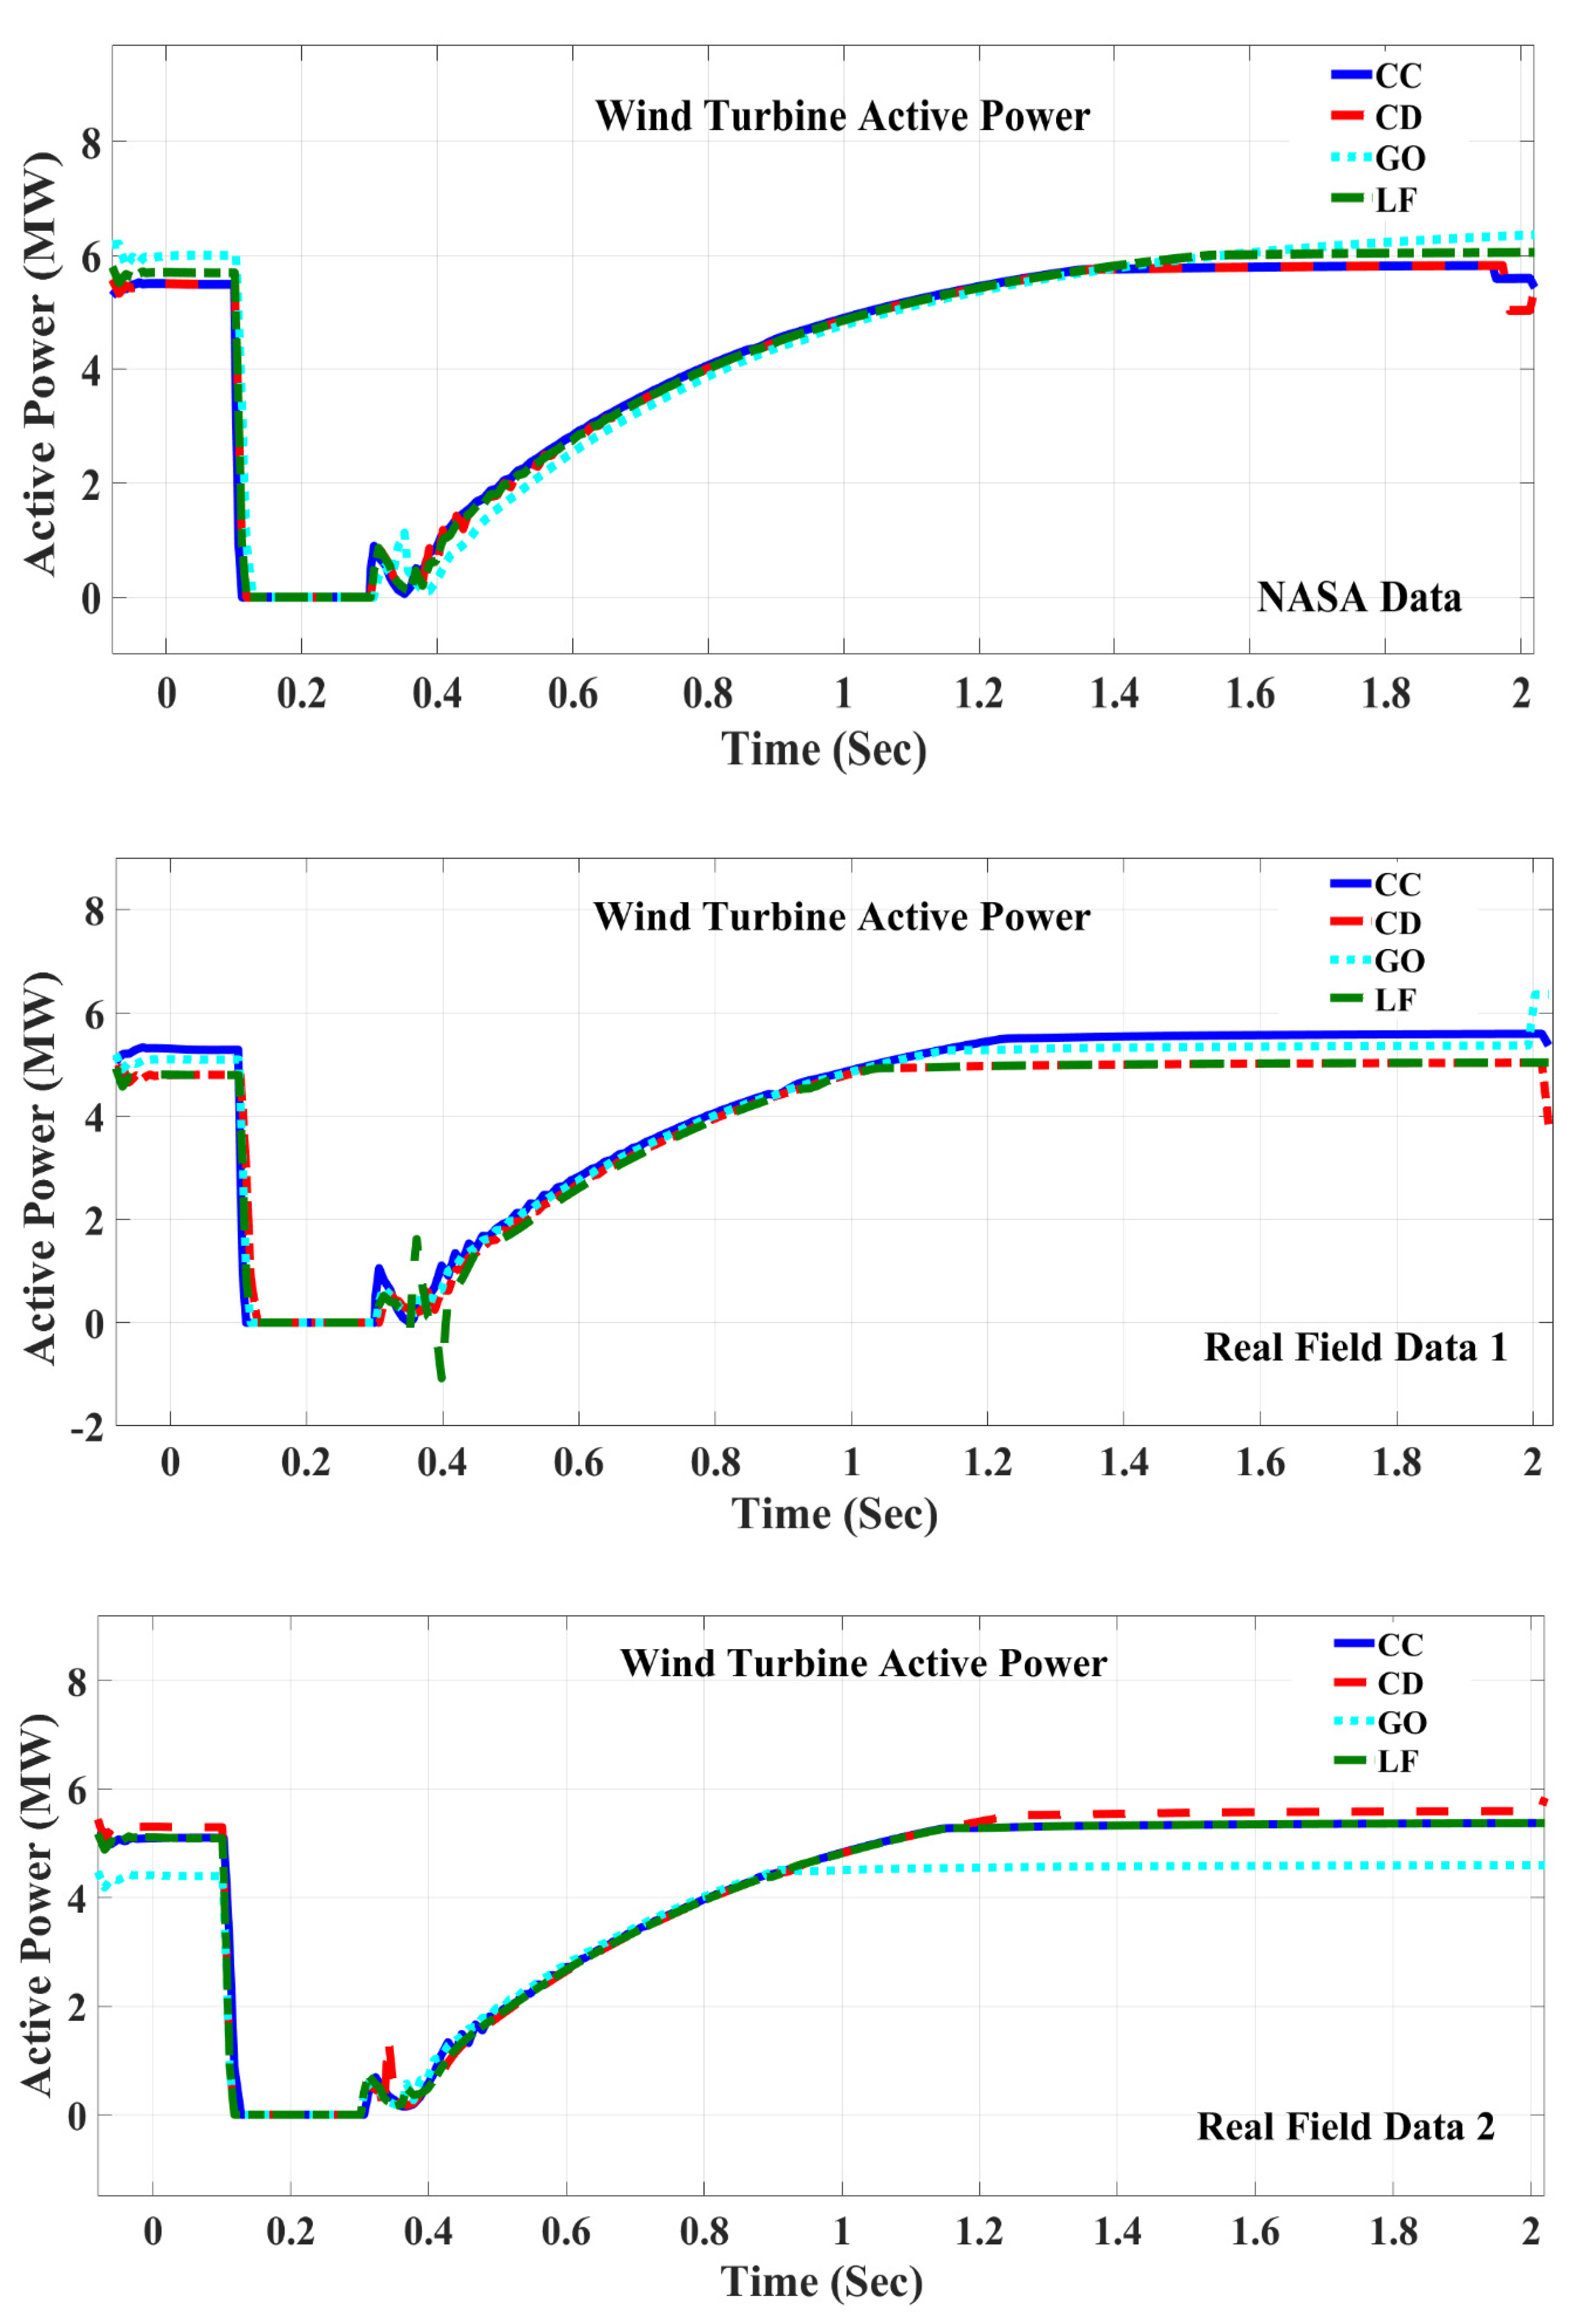
Figure 11 shows the active power responses of the wind turbine generator at Bus 1. These responses are very similar in pattern, however, different in values due to the differences in optimal sizes. These create different optimal power flows as per the variations of wind speeds. For Data Scenarios 1 and 3, the active power responses have a rapid undershoot at 0.1 s for all the dispatch strategies and then rising at 0.39 s. However, for Data Scenario 2, the active power response of LF going further down to −0.2 MW, although other dispatch strategies remained the same, such as Data Scenarios 1 and 3.
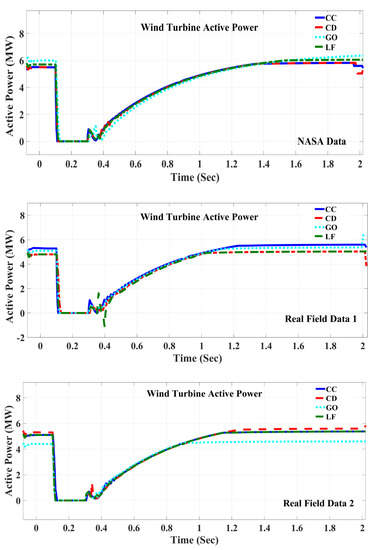
Figure 11.
Active power responses of wind turbine generator at Bus 1 for four dispatch strategies.
These power responses of the PV generator vary a lot due to the stochastic behavior of solar irradiance and the difference in optimal sizing under different dispatch strategies. At 0.1 s the active power responses go down and from 0.5 s are slowly getting stabilized.
These responses of active power for diesel generator vary as per the optimal sizes. From 0.4 s, the active power responses are going down and finally reaching stability around 1.2 s. The active power responses for GO, CD, and LF are different for all three data scenarios.
The active power responses under the CC strategy for all three data scenarios are quite the same. The CC is showing a much different pattern than the other three dispatch strategies, due to its working principle of producing full power and charging battery.
The active power responses of the BESS reach zero after a certain period as the load demands are met by the renewable generations rather than the BESS.
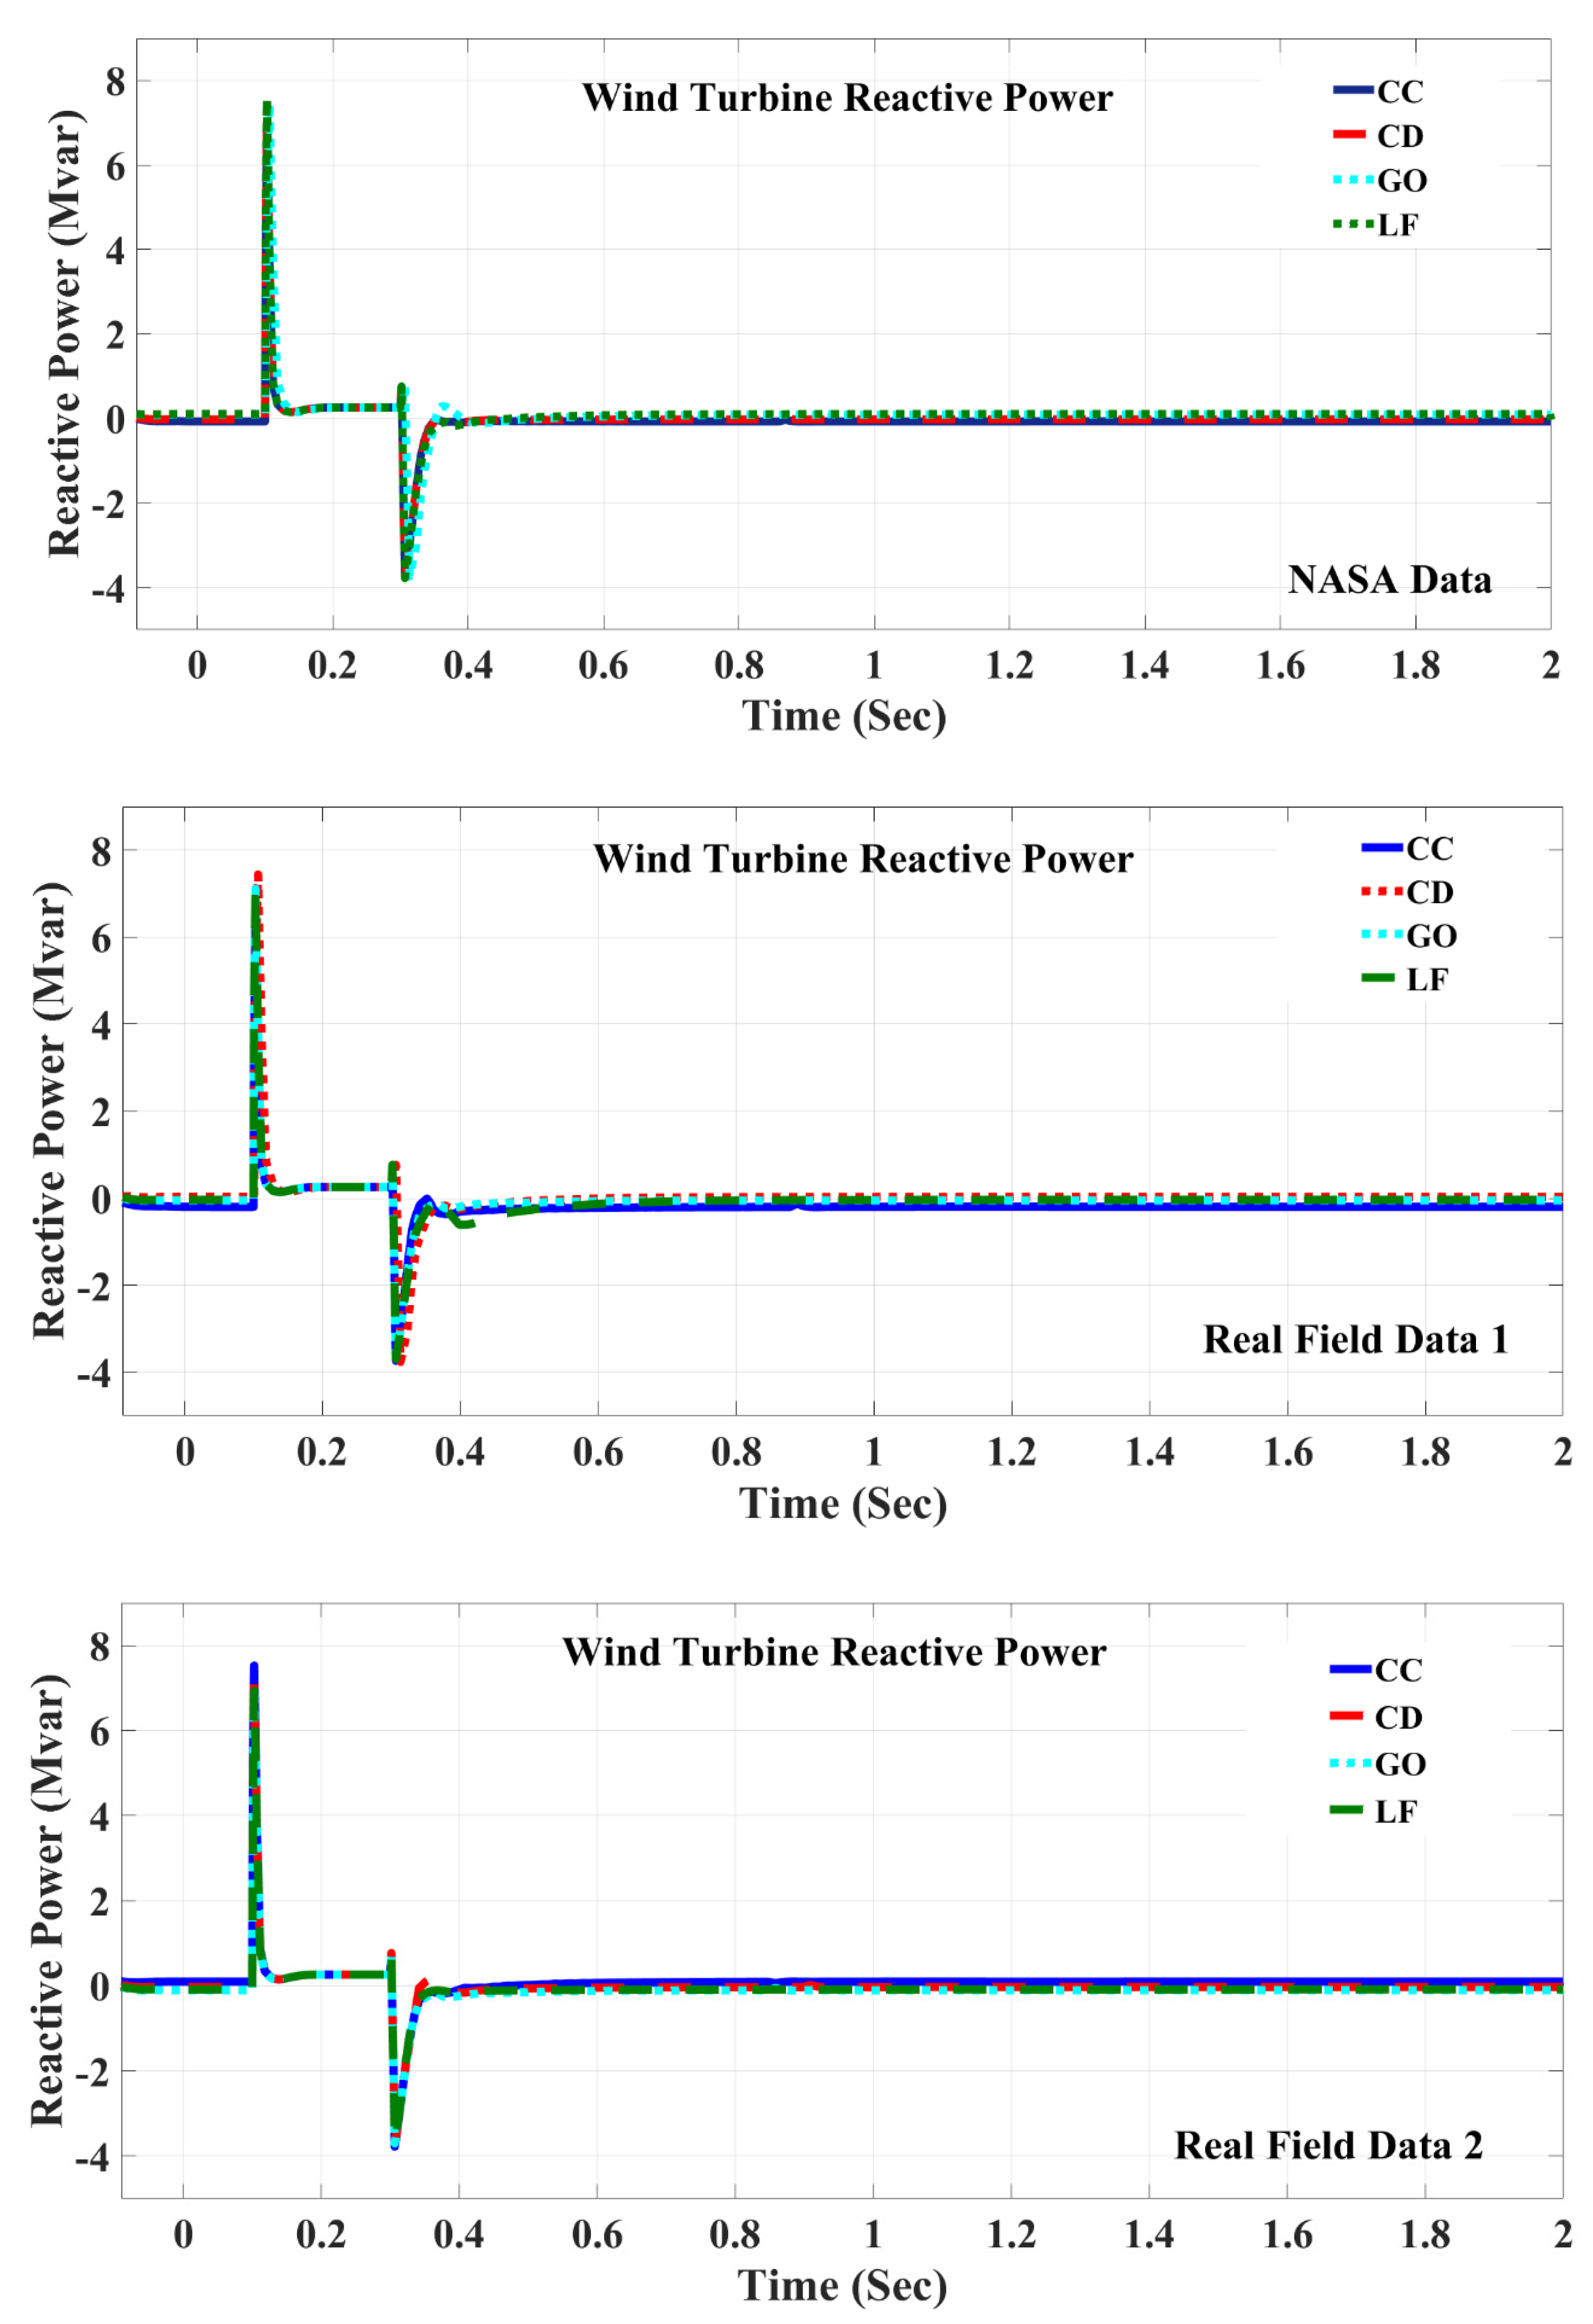
Under the CC, BESS is usually charged by the diesel generator and other generators supply power to meet the load demand. PV and wind-generator active powers are the highest under LF, which denotes the maximum power interjection from the renewable generators rather than the diesel generator. Figure 12 shows the reactive power response of the wind turbine generator at Bus 1. The reactive power responses are relatively similar for all the dispatch strategies.
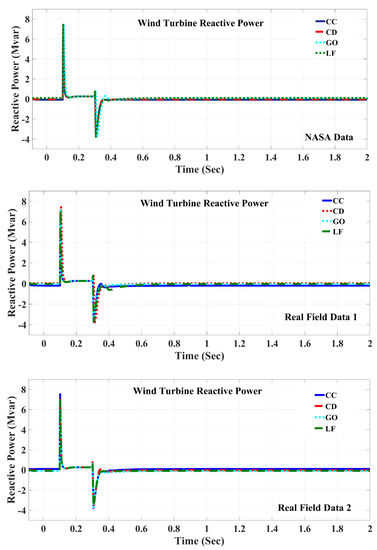
Figure 12.
Reactive power responses of wind turbine generator at Bus 1 for four dispatch strategies.
The reactive power responses are relatively similar. The reactive power responses of PV generator under CC and CD are relatively similar due to the working principle of CC and CD as in CC, the battery is charged before distributing power through the network and for CD, renewable generations follow the CC and then distribute power through the network. For Data Scenario 1, under the GO, reactive power response has a higher settling time following the overshoot. On the other hand, for Data Scenario 2, under the LF, reactive power response has a higher settling time.
Reactive power responses of diesel generator under the GO and LF strategies are relatively similar as the active power response and the frequency response remain the same for all three scenarios. However, under the CC and CD strategies, reactive power varies due to the variations of optimal sizes and renewable resources.
The reactive power responses reach zero after some initial oscillation until around 0.2 s as the voltage regulation responsibility was not given to the BESS inverters.
3.5. Comparative Analysis with Other Power and Energy Systems
3.5.1. Comparative Analysis of Designed System
The NPC can be changed based on the cost of the equipment, the cost of fuel, the cost of operation and maintenance, and the cost of the lifetime. The NPC for the proposed islanded hybrid Microgrid system was lowered in contrast to the NPC for other HRES in Table 2 and the conventional power plants in Table 3. Table 2 gives a brief comparison of the intended IHMS and comparable HRES in terms of CO2 emissions, NPC, COE, and running costs. It may be deduced from the comparative table that there is a considerable difference between the intended IHMS and other HRES.
Table 2.
Comparison of CO2 emission, NPC, COE, and operating cost between the designed IHMS and other HRES.
Table 3.
Comparison of CO2 emission, NPC, COE, and operating cost between the IHMS and Conventional Power Plant.
The COE of the developed IHMS is 89.13 percent, the NPC is 48.02 percent, the operating cost is 81.05 percent, and the CO2 emissions of the designed IHMS are 99.99 percent less than other proposed HRES, according to the comparative analysis. The COE of the developed IHMS is 46.32 percent, the NPC is 49.56 percent, and the CO2 emissions of the designed IHMS are 99.99 percent less than conventional power plants, according to the comparison analysis shown in Table 3. The comparison was made by considering the single unit results. The peak load of 3.9 kW [44] produces the amount of CO2 which is 99% more than the designed system of 7.7MW as per kW. The author calculated the per kW CO2 emissions for both the designed and comparing system and found that the designed system reduces 99% CO2 emissions.
3.5.2. Best and Worst Dispatch Strategy
According to the critical study in both techno-economic and power-system performance aspects, as well as environmental considerations, the LF dispatch plan is the optimal method for all criteria. Furthermore, in terms of techno-economic and environmental factors, the CD method is the poorest option for microgrid operation and long-term optimization. Aside from that, both CC and PS perform poorly in terms of power system performance due to long-term instability and delays in frequency- and voltage-stability mitigation.
3.5.3. Applications and Implementations of This Research Work
The findings of this study can be transferred to any other site on the planet with similar weather conditions and load profiles. This study is mostly used in decentralized operations, such as mobile towers (BTSs), off-grid clinics or schools, irrigation, and so on. The study was carried out by utilizing meteorological real-time field data, demonstrating their acceptability and feasibility. To assure the system stability of the designed model, the results were additionally validated by DIgSILENT PowerFactory microgrid design and power system analysis. Comparative analyses of analytical and experimental outcomes were set aside for future research. The next sections conclude the conducted research work with the future recommendations.
4. Conclusions
An islanded hybrid microgrid with solar PV, wind, diesel generator, and battery storage systems was created for optimal resource planning and reliable operation. The performance of four dispatch strategies was evaluated, and the robustness of the approach was verified with three sets of data. According to simulation data, the GO dispatch strategy is the best in terms of minimal operating cost, NPC, and CO2 emissions, whereas the combination dispatch (CD) dispatch strategy is the worst in terms of maximum COE, NPC, and CO2 emissions. The voltage and frequency responses along with the reliability indices are presented in this paper taking the Kangaroo Island microgrid as a test case scenario to identify the best energy dispatch strategy. To assure the isolated island’s uninterrupted power supply, the planned microgrid met three important criteria: techno-economic feasibility, system stability, and dependability.
The COE is the lowest for the LF dispatch strategy as 0.128, 0.133, and 0.133 $/kWh for Data Scenarios 1, 2, and 3, respectively. On the other hand, COE is the highest for CD dispatch strategy, as 0.160, 0.161, and 0.162 $/kWh for Data Scenarios 1, 2, and 3, respectively.
From the frequency response comparison of the wind turbine generator, it is observed that, under CC and CD, the frequency response stabilized much faster than the other two dispatch strategies. However, under the GO, the frequency response is more consistent and stable for Data Scenarios 2 and 3. From the comparison of the PV generator’s frequency response, it is observed that the frequency under the CC is the most consistent and is stabilized quicker than the other three dispatch strategies for Scenarios 1 and 2.
From the critical comparison of reactive power responses, it can be concluded that the reactive power responses under the GO dispatch strategy were the best in terms of quick voltage recovery and stabilization for all data scenarios, making the GO the most suitable dispatch strategy if the economics and transient stability are considered.
From the normalized value of reliability indices, it is observed and is concluded that the GO and LF are the most consistent in terms of accuracy and feasibility.
In future work, a predictive dispatch strategy incorporating 24 h ahead load and generation forecasting will be implemented and compared against the traditional dispatch strategies. It is expected that the predictive dispatch will perform equally or significantly better than the GO, providing an opportunity for a virtual power plant, as with the operation of the microgrid, and will become the universal dispatch strategy for the islanded and grid-connected microgrid.
Author Contributions
Conceptualization, S.A.S.; methodology, S.A.S.; software, S.A.S.; validation, K.N.H. and M.D.; formal analysis, S.A.S.; investigation, S.A.S. and U.D.; resources, S.A.S.; data curation, S.A.S.; writing—original draft preparation, S.A.S.; writing—review and editing, S.A.S., K.N.H. and M.D.; visualization, S.A.S. and U.D.; supervision, K.N.H. and M.D.; project administration, S.A.S. and A.R.; funding acquisition, S.A.S. and A.R. All authors have read and agreed to the published version of the manuscript.
Funding
Research publication grant of Engineering Institute of Technology, Melbourne, Australia.
Institutional Review Board Statement
Not applicable.
Informed Consent Statement
Not applicable.
Data Availability Statement
Not applicable.
Acknowledgments
This research work was completed by the research publication grant of Engineering Institute of Technology, Melbourne, Australia.
Conflicts of Interest
The authors declare no conflict of interest.
References
- Letcher, T.M. Introduction with a Focus on Atmospheric Carbon Dioxide and Climate Change. In Future Energy; Elsevier: Amsterdam, The Netherlands, 2020; pp. 3–17. [Google Scholar] [CrossRef]
- Shezan, S.A.; Saidur, R.; Ullah, K.; Hossain, A.B.M.S.; Chong, W.T.; Julai, S. Feasibility analysis of a hybrid off-grid wind–DG-battery energy system for the eco-tourism remote areas. Clean Technol. Environ. Policy 2015, 17, 2417–2430. [Google Scholar] [CrossRef]
- Liu, B.; Liu, S.; Guo, S.; Zhang, S. Economic study of a large-scale renewable hydrogen application utilizing surplus renewable energy and natural gas pipeline transportation in China. Int. J. Hydrog. Energy 2020, 45, 1385–1398. [Google Scholar] [CrossRef]
- Liu, W.; Zhuang, P.; Liang, H.; Peng, J. Distributed Economic Dispatch in Microgrids Based on Cooperative Reinforcement Learning. IEEE Trans. Neural Netw. Learn. Syst. 2018, 29, 2192–2203. [Google Scholar] [CrossRef]
- Chen, F.; Chen, M.; Xu, Z.; Guerrero, J.M.; Wang, L.Y. Distributed noise-resilient economic dispatch strategy for islanded microgrids. IET Gener. Transm. Distrib. 2019, 13, 3029–3039. [Google Scholar] [CrossRef]
- Ju, C.; Wang, P.; Goel, L.; Xu, Y. A Two-Layer Energy Management System for Microgrids with Hybrid Energy Storage Considering Degradation Costs. IEEE Trans. Smart Grid 2017, 9, 6047–6057. [Google Scholar] [CrossRef]
- Liu, T.; Tan, X.; Sun, B.; Wu, Y.; Tsang, D.H. Energy management of cooperative microgrids: A distributed optimization approach. Int. J. Electr. Power Energy Syst. 2018, 96, 335–346. [Google Scholar] [CrossRef]
- Abdullah, A.; Muttaqi, K.M.; Sutanto, D.; Agalgaonkar, A. An Effective Power Dispatch Control Strategy to Improve Generation Schedulability and Supply Reliability of a Wind Farm Using a Battery Energy Storage System. IEEE Trans. Sustain. Energy 2014, 6, 1093–1102. [Google Scholar] [CrossRef]
- Zhao, B.; Xue, M.; Zhang, X.; Wang, C.; Zhao, J. An MAS based energy management system for a stand-alone microgrid at high altitude. Appl. Energy 2015, 143, 251–261. [Google Scholar] [CrossRef] [Green Version]
- Qadrdan, M.; Wu, J.; Jenkins, N.; Ekanayake, J. Operating Strategies for a GB Integrated Gas and Electricity Network Considering the Uncertainty in Wind Power Forecasts. IEEE Trans. Sustain. Energy 2013, 5, 128–138. [Google Scholar] [CrossRef]
- Zhang, Y.; Gatsis, N.; Giannakis, G. Robust Energy Management for Microgrids with High-Penetration Renewables. IEEE Trans. Sustain. Energy 2013, 4, 944–953. [Google Scholar] [CrossRef] [Green Version]
- Ye, L.; Zhang, C.; Tang, Y.; Zhong, W.; Zhao, Y.; Lu, P.; Zhai, B.; Lan, H.; Li, Z. Hierarchical model predictive control strategy based on dynamic active power dispatch for wind power cluster integration. IEEE Trans. Power Syst. 2019, 34, 4617–4629. [Google Scholar] [CrossRef]
- Wen, Y.; Chung, C.Y.; Liu, X.; Che, L. Microgrid Dispatch with Frequency-Aware Islanding Constraints. IEEE Trans. Power Syst. 2019, 34, 2465–2468. [Google Scholar] [CrossRef]
- Vergara, P.P.; Rey, J.M.; Shaker, H.R.; Guerrero, J.M.; Jørgensen, B.N.; Da Silva, L.C. Distributed strategy for optimal dispatch of unbalanced three-phase islanded microgrids. IEEE Trans. Smart Grid 2018, 10, 3210–3225. [Google Scholar] [CrossRef] [Green Version]
- Bakir, H.; Kulaksiz, A.A. Modelling and voltage control of the solar-wind hybrid micro-grid with optimized STATCOM using GA and BFA. Eng. Sci. Technol. Int. J. 2019, 23, 576–584. [Google Scholar] [CrossRef]
- Moghaddam, M.J.H.; Kalam, A.; Nowdeh, S.A.; Ahmadi, A.; Babanezhad, M.; Saha, S. Optimal sizing and energy management of stand-alone hybrid photovoltaic/wind system based on hydrogen storage considering LOEE and LOLE reliability indices using flower pollination algorithm. Renew. Energy 2018, 135, 1412–1434. [Google Scholar] [CrossRef]
- Hasanien, H.M.; El-Fergany, A.A. Salp swarm algorithm-based optimal load frequency control of hybrid renewable power systems with communication delay and excitation cross-coupling effect. Electr. Power Syst. Res. 2019, 176, 105938. [Google Scholar] [CrossRef]
- Eisapour-Moarref, A.; Kalantar, M.; Esmaili, M. Control strategy resilient to unbalanced faults for interlinking converters in hybrid microgrids. Int. J. Electr. Power Energy Syst. 2020, 119, 105927. [Google Scholar] [CrossRef]
- Mathew, P.; Madichetty, S.; Mishra, S. A Multilevel Distributed Hybrid Control Scheme for Islanded DC Microgrids. IEEE Syst. J. 2019, 13, 4200–4207. [Google Scholar] [CrossRef]
- Ali, H.; Magdy, G.; Li, B.; Shabib, G.; Elbaset, A.A.; Xu, D.; Mitani, Y. A New Frequency Control Strategy in an Islanded Microgrid Using Virtual Inertia Control-Based Coefficient Diagram Method. IEEE Access 2019, 7, 16979–16990. [Google Scholar] [CrossRef]
- Xu, X.; Mitra, J.; Wang, T.; Mu, L. Evaluation of Operational Reliability of a Microgrid Using a Short-Term Outage Model. IEEE Trans. Power Syst. 2014, 29, 2238–2247. [Google Scholar] [CrossRef]
- Khare, V.; Nema, S.; Baredar, P. Reliability analysis of hybrid renewable energy system by fault tree analysis. Energy Environ. 2018, 30, 542–555. [Google Scholar] [CrossRef]
- Mokoka, O.K.P.; Awodele, K. Reliability Evaluation of distribution networks using NEPLAN & DIgSILENT power factory. 2013 Africon 2013, 1–5. [Google Scholar] [CrossRef]
- Rad, M.A.V.; Ghasempour, R.; Rahdan, P.; Mousavi, S.; Arastounia, M. Techno-economic analysis of a hybrid power system based on the cost-effective hydrogen production method for rural electrification, a case study in Iran. Energy 2019, 190, 116421. [Google Scholar] [CrossRef]
- Abdelsamad, A.; Lubkeman, D. Reliability Analysis for a Hybrid Microgrid based on Chronological Monte Carlo Simulation with Markov Switching Modeling. In Proceedings of the 2019 IEEE Power & Energy Society Innovative Smart Grid Technologies Conference (ISGT), Washington, DC, USA, 18–21 February 2019. [Google Scholar] [CrossRef]
- Abdulkarim, A.; Faruk, N.; Oloyede, A.O.; Olawoyin, L.A.; Akorede, M.F.; Madugu, I.S.; Abdelkader, S.; Morrow, J.D.; Adediran, Y.A. Reliability Study of Stand-alone Hybrid Renewable Energy Microgrids. Iran. J. Sci. Technol. Trans. Electr. Eng. 2018, 43, 411–425. [Google Scholar] [CrossRef]
- Sarma, S.S.; Madhusudhan, V.; Ganesh, V. Reliability Enhanced Autonomous Hybrid Micro Grid Based Distribution System with Renewable Resources. J. Eng. Technol. 2019, 8, 158–171. [Google Scholar]
- Zhong, W.; Wang, L.; Liu, Z.; Hou, S. Reliability Evaluation and Improvement of Islanded Microgrid Considering Operation Failures of Power Electronic Equipment. J. Mod. Power Syst. Clean Energy 2020, 8, 111–123. [Google Scholar] [CrossRef]
- Esan, A.B.; Agbetuyi, A.; Oghorada, O.; Ogbeide, K.; Awelewa, A.; Afolabi, A.E. Reliability assessments of an islanded hybrid PV-diesel-battery system for a typical rural community in Nigeria. Heliyon 2019, 5, e01632. [Google Scholar] [CrossRef] [Green Version]
- Shezan, S.A.; Das, N. Optimized Hybrid Wind-Diesel Energy System with Feasibility Analysis. Technol. Econ. Smart Grids Sustain. Energy 2017, 2, 9. [Google Scholar]
- Shezan, S.A. Optimization and assessment of an off-grid photovoltaic–diesel–battery hybrid sustainable energy system for remote residential applications. Environ. Prog. Sustain. Energy 2019, 38, e13340. [Google Scholar] [CrossRef]
- Melath, G.; Rangarajan, S.; Agarwal, V. A Novel Control Scheme for Enhancing the Transient Performance of an Islanded Hybrid AC–DC Microgrid. IEEE Trans. Power Electron. 2019, 34, 9644–9654. [Google Scholar] [CrossRef]
- Nale, R.; Biswal, M.; Kishor, N. A Transient Component Based Approach for Islanding Detection in Distributed Generation. IEEE Trans. Sustain. Energy 2018, 10, 1129–1138. [Google Scholar] [CrossRef]
- Eajal, A.A.; Yazdavar, A.H.; El-Saadany, E.F.; Ponnambalam, K. On the Loadability and Voltage Stability of Islanded AC–DC Hybrid Microgrids during Contingencies. IEEE Syst. J. 2019, 13, 4248–4259. [Google Scholar] [CrossRef]
- Wind Integration Data Sets|Grid Modernization|NREL, Nrel.gov. 2020. Available online: https://www.nrel.gov/grid/wind-integration-data.html (accessed on 3 June 2019).
- Solar Resource Data and Tools|Grid Modernization|NREL, Nrel.gov. 2020. Available online: https://www.nrel.gov/grid/solar-resource/renewable-resource-data.html (accessed on 3 June 2019).
- Kangaroo Island Load Profile Data, Sapowernetworks.com.au. 2020. Available online: https://www.sapowernetworks.com.au/data/3141/kangaroo-island-load-profile-data/ (accessed on 3 June 2019).
- Climate Maps—Solar Exposure Latest, Bom.gov.au. 2020. Available online: http://www.bom.gov.au/jsp/awap/solar/index.jsp?colour=colour&time=latest&step=0&map=solarave&period=12month&area=sa (accessed on 19 June 2019).
- Climate Maps—Temperature Latest, Bom.gov.au. 2020. Available online: http://www.bom.gov.au/jsp/awap/temp/index.jsp?colour=colour&time=latest&step=0&map=maxave&period=12month&area=sa (accessed on 19 June 2019).
- Li, X.; Li, Z.; Guo, L.; Zhu, J.; Wang, Y.; Wang, C. Enhanced Dynamic Stability Control for Low-Inertia Hybrid AC/DC Microgrid with Distributed Energy Storage Systems. IEEE Access 2019, 7, 91234–91242. [Google Scholar] [CrossRef]
- Alam, M.S.; Arefifar, S.A. Energy Management in Power Distribution Systems: Review, Classification, Limitations and Challenges. IEEE Access 2019, 7, 92979–93001. [Google Scholar] [CrossRef]
- Shezan, S.A.; Hasan, K.N.; Datta, M. Optimal Sizing of an Islanded Hybrid Microgrid Considering Alternative Dispatch Strategies. In Proceedings of the 2019 29th Australasian Universities Power Engineering Conference (AUPEC), Nadi, Fiji, 26–29 November 2019; pp. 1–6. [Google Scholar] [CrossRef]
- Shezan, S.; Al-Mamoon, A.; Ping, H. Performance investigation of an advanced hybrid renewable energy system in indonesia. Environ. Prog. Sustain. Energy 2017, 37, 1424–1432. [Google Scholar] [CrossRef]
- Shezan, S.; Julai, S.; Kibria, M.; Ullah, K.; Saidur, R.; Chong, W.T.; Akikur, R. Performance analysis of an off-grid wind-PV (photovoltaic)-diesel-battery hybrid energy system feasible for remote areas. J. Clean. Prod. 2016, 125, 121–132. [Google Scholar] [CrossRef]


Publisher’s Note: MDPI stays neutral with regard to jurisdictional claims in published maps and institutional affiliations. |
© 2021 by the authors. Licensee MDPI, Basel, Switzerland. This article is an open access article distributed under the terms and conditions of the Creative Commons Attribution (CC BY) license (https://creativecommons.org/licenses/by/4.0/).