Abstract
In this paper, the operating principles of the acid battery and its features are discussed. The results of voltage tests containing the measurements conducted at the terminals of a loaded battery under constant load conditions, and dependent on time, are presented. The article depicts the principles of the development of electric models of acid batteries and their various descriptions. The principles for processing the results for the purpose of the determination and description of the battery model are characterized. The characteristics under stationary and non-stationary conditions are specified using glued functions and linear combinations of exponential functions, and the electrical parameters of the battery are determined as the components of the circuit, i.e., its electromotive force, resistance, and capacity. The dynamic characteristic of the battery in the form of transmittance was determined, using the Laplace transform. Possible uses of the crankshaft driving signals as diagnostic signals of the battery, electric starter, and internal combustion engine are also indicated.
1. Introduction
The lead–acid battery is a chemical source of electric energy in which current is generated as a result of chemical processes taking place on its electrodes in the presence of sulfuric acid. The factor that forces the course of the current generating processes is an electromotive force of the cell resulting from a difference in the electrodes constituting the cell normal potentials. The basic parameters characterizing the electrical and energy properties of the battery are: voltage, twenty amp hour (Ah) rate capacity, and the ability to start an engine (CCA—Cold Cranking Amps). CCA is a rating used to define the ability of the battery to start an engine in a cold temperature. The existing chemical models of the battery explain a mechanism of the generation of an electromotive force and a sum of its electrical and energetic capacities, e.g., electric capacity. However, the chemical models are not useful for analyzing electrical circuits where the acid battery is a component. When using an acid battery, it is not possible to determine the current electrical parameters of the circuit, current, and voltage. In such a circuit it is necessary to use electric battery models composed of the typical electrical circuit components: electromotive force, resistance, capacitance, inductance, and others [1]. Modeling of the batteries, including acid batteries, has become necessary and is carried out in a particularly intensive manner due to the increased demand for electricity in vehicles resulting from the arrival of electric and hybrid drives. The modeling and determination of the battery model parameters is considered a difficult, unclear, laborious, expensive, and ambiguous process [2].
A lead–acid battery consists of a negative electrode made of porous lead and a positive electrode consisting of lead dioxide. Both electrodes are immersed in electrolyte which is a solution of sulfuric acid and water. The overall reversible chemical reaction, which enables lead–acid batteries to store energy, is as follows:
Discharging a battery causes the formation of lead sulphate at both the negative and positive electrodes. Sulphate from the sulfuric acid electrolyte surrounding the battery is used in the formation of this lead sulphate. When the battery is in the fully discharged state, its two electrodes are of the same material and there is no chemical potential or voltage between these two electrodes. Between the fully charged and discharged states, the lead–acid battery experiences a gradual reduction in voltage. A voltage level is used to indicate the state of charge of the battery. Thus, there is a dependence of the battery voltage on the battery state of charge. The battery is in equilibrium only in the state characterized by no load. The battery voltage and its capacity have specified values. The battery under load is not in equilibrium, and its voltage and battery capacity differ significantly from the equilibrium values. The difference between the voltage at equilibrium and that under a load, with a current flow, is termed the battery polarization.
The battery voltage value or its dependence on time versus battery operating condition parameters is the basic battery operating parameter or characteristic. The operating characteristics of the acid battery are the object of research and modeling for the implementation of many practical and theoretical objectives: the evaluation of the correlation of the starting parameters of the internal combustion engine [3]; the design of the internal combustion engine start-up systems [4]; the analysis of the dynamic properties of the battery in electric vehicles [5]; the possibility of using the characteristics in the process of diagnosing the internal combustion engine and its starting system [6]. In the case of the lead–acid battery model in electric or hybrid vehicles, the charging and discharging process is of great importance, i.e., a charging/discharging voltage and state of charge (SoC) [7]. Very often the model of the lead–acid battery for the Stop-Start Technology is a circuit model with two resistance–capacitance (RC) blocks [8]. The simulated battery operating parameters are the voltages, currents, and state of charge (SoC). The battery models for the different designs of the lead–acid-based batteries, i.e., batteries with gelled electrolyte and an Absorbent Glass Mat (AGM), differ from the common lead–acid batteries models in regards to the parameters of the battery model, although they are based on the same chemistry [9]. There are also different models of the lead–acid battery in terms of their ageing processes, i.e., deep discharge models which are combined with a sulfation model [10]. The ageing processes determine the battery state of health (SoH). The purpose of some works is to investigate factors which affect the failure of automotive batteries or battery durability. The main factors influencing the aging process of batteries are the battery temperature and the discharge current [11]. Statistical methods are used for analysis and prediction of battery degradation in electric vehicle use [12], including regression models for estimation of the battery state of health [13]. In regression models, charge/discharge cycle number, battery terminal voltage, and internal resistance are used as independent variables.
The existing methods of battery testing have been systematically developed, and new approaches are used to determine the characteristics of batteries, e.g., based on neural networks, genetic algorithms, or Kalman filters. These often concern the determination of model parameters, the battery state of charge, and energy management in energy storage systems using batteries. Genetic algorithms are used to optimize the energy system of electric vehicles because of the growing number of electricity consumers in the vehicle [14]. For the state of charge of batteries, and its dynamic determination, supervised chaos genetic algorithms have been used [15]. The use of the Kalman filter based on the RC model for estimation of model parameters and the state of charge of lead–acid batteries requires knowledge of the value of the process covariance and the measurement noise [16]. The prediction voltage and lifetime of a lead–acid battery may be determined using neural network methods [17]. Ref. [18] describes the design of a measurement system to conduct the electrical tests, and an estimation algorithm for automatic analyses and reporting proceedings for lead–acid started batteries. Determination of the state of charge (SoC) of a lead–acid battery was tested using the electrochemical impedance spectroscopy (EIS) method [19]. Lead–acid cells were explored during intermittent discharge and charge processes. More battery parameters were taken into account in the design and simulation of a model of a lead–acid battery [20]. These parameters were the SoC, battery voltage, and temperature of the battery in the charge and discharge state.
Previous research has also investigated the problems of the physical phenomena that determine the operation of the energy storage system, i.e., the lead–acid battery [21]. A relatively similar new modeling method for lead–acid batteries combined the physicochemical model with the equivalent circuit model [22]. Ref. [23] drew attention to the fact that the battery equivalent circuit model has two time constants. Because the load process duration is often short, the test data during the load period may not contain sufficient information for extracting these time constants. In contrast, the relaxation period may last hours, and thus may provide sufficient data for this purpose. The problems of the modern technology used in the battery production process were considered in [24]. Carbon materials are widely used as an additive to the negative active mass and allow the battery specific energy and active mass utilization to be increased. A constant problem concerning the use of battery energy relates to the starting of an automobile engine in low or negative temperature conditions. When using an autonomous means of engine pre-heating, it is necessary to optimally distribute the battery energy to the pre-start and start-up discharges [25].
The objective of this paper is to present the author’s mathematical models of the acid battery for stationary and non-stationary dynamic operating conditions. The basis for the development of the models was the research results of voltage measurements at the terminals of the loaded batteries under constant load conditions, i.e., the dependence of the voltage on time. The battery tests were carried out on a test stand that was placed in a low-temperature chamber, which allowed the ambient and tested battery temperatures to be changed.
In the literature, the accumulator battery models are presented in graphic or mathematical form, and a mathematical description is not frequently used. Therefore, in this work the mathematical form of the model is particularly emphasized and explained. On the basis of test results, a linear model of the dependence of the battery terminals’ voltage on its nominal electric capacity, loaded current, temperature, and battery state of charge (SoC) is elaborated. This multidimensional model was developed for the stationary operating conditions within the time period of several seconds following switching on the load. In this case, the principles of planning the experiment were applied [26]. The dynamic characteristics of the battery are also presented, i.e., its voltage at the dynamic state of operating just after switching on the load, and after switching it off.
The principles of processing the results for the purpose of the determination and description of the battery models are characterized. The characteristics under the stationary and non-stationary conditions are specified using glued functions and linear combinations of exponential functions, and the electrical parameters of the battery are determined as the components of the circuit, i.e., its electromotive force, resistance, and capacity. Possible uses of the crankshaft driving signals as diagnostic signals of the battery, electric starter, and internal combustion engine are also indicated.
2. Materials and Methods
The battery performance tests were carried out on a test stand that was placed in a low-temperature chamber, which allowed the ambient and the tested battery temperatures to be changed. The equipment of the test bench enabled the test implementation and the recording of the battery operation parameters to be controlled. The tested battery was loaded with a constant resistance value within approx. 10 s. The values of the current and voltage were recorded by means of a computer measuring system, including after switching off the load, to observe changes in the electromotive force of the battery polarization during this period. The examples of the recorded dependencies of the current and voltage at the terminals within the load test of the battery of 54 Ah capacity are shown in Figure 1 and Figure 2.
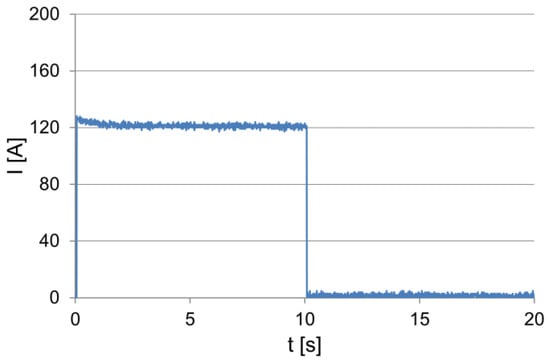
Figure 1.
The current drawn from the battery.
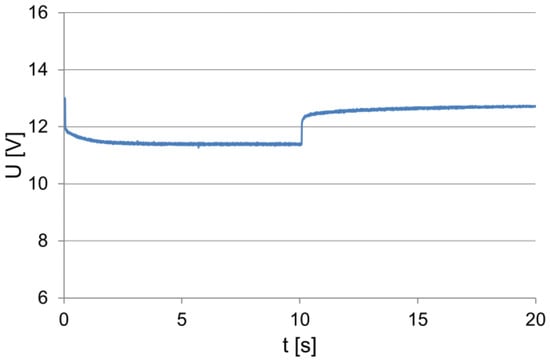
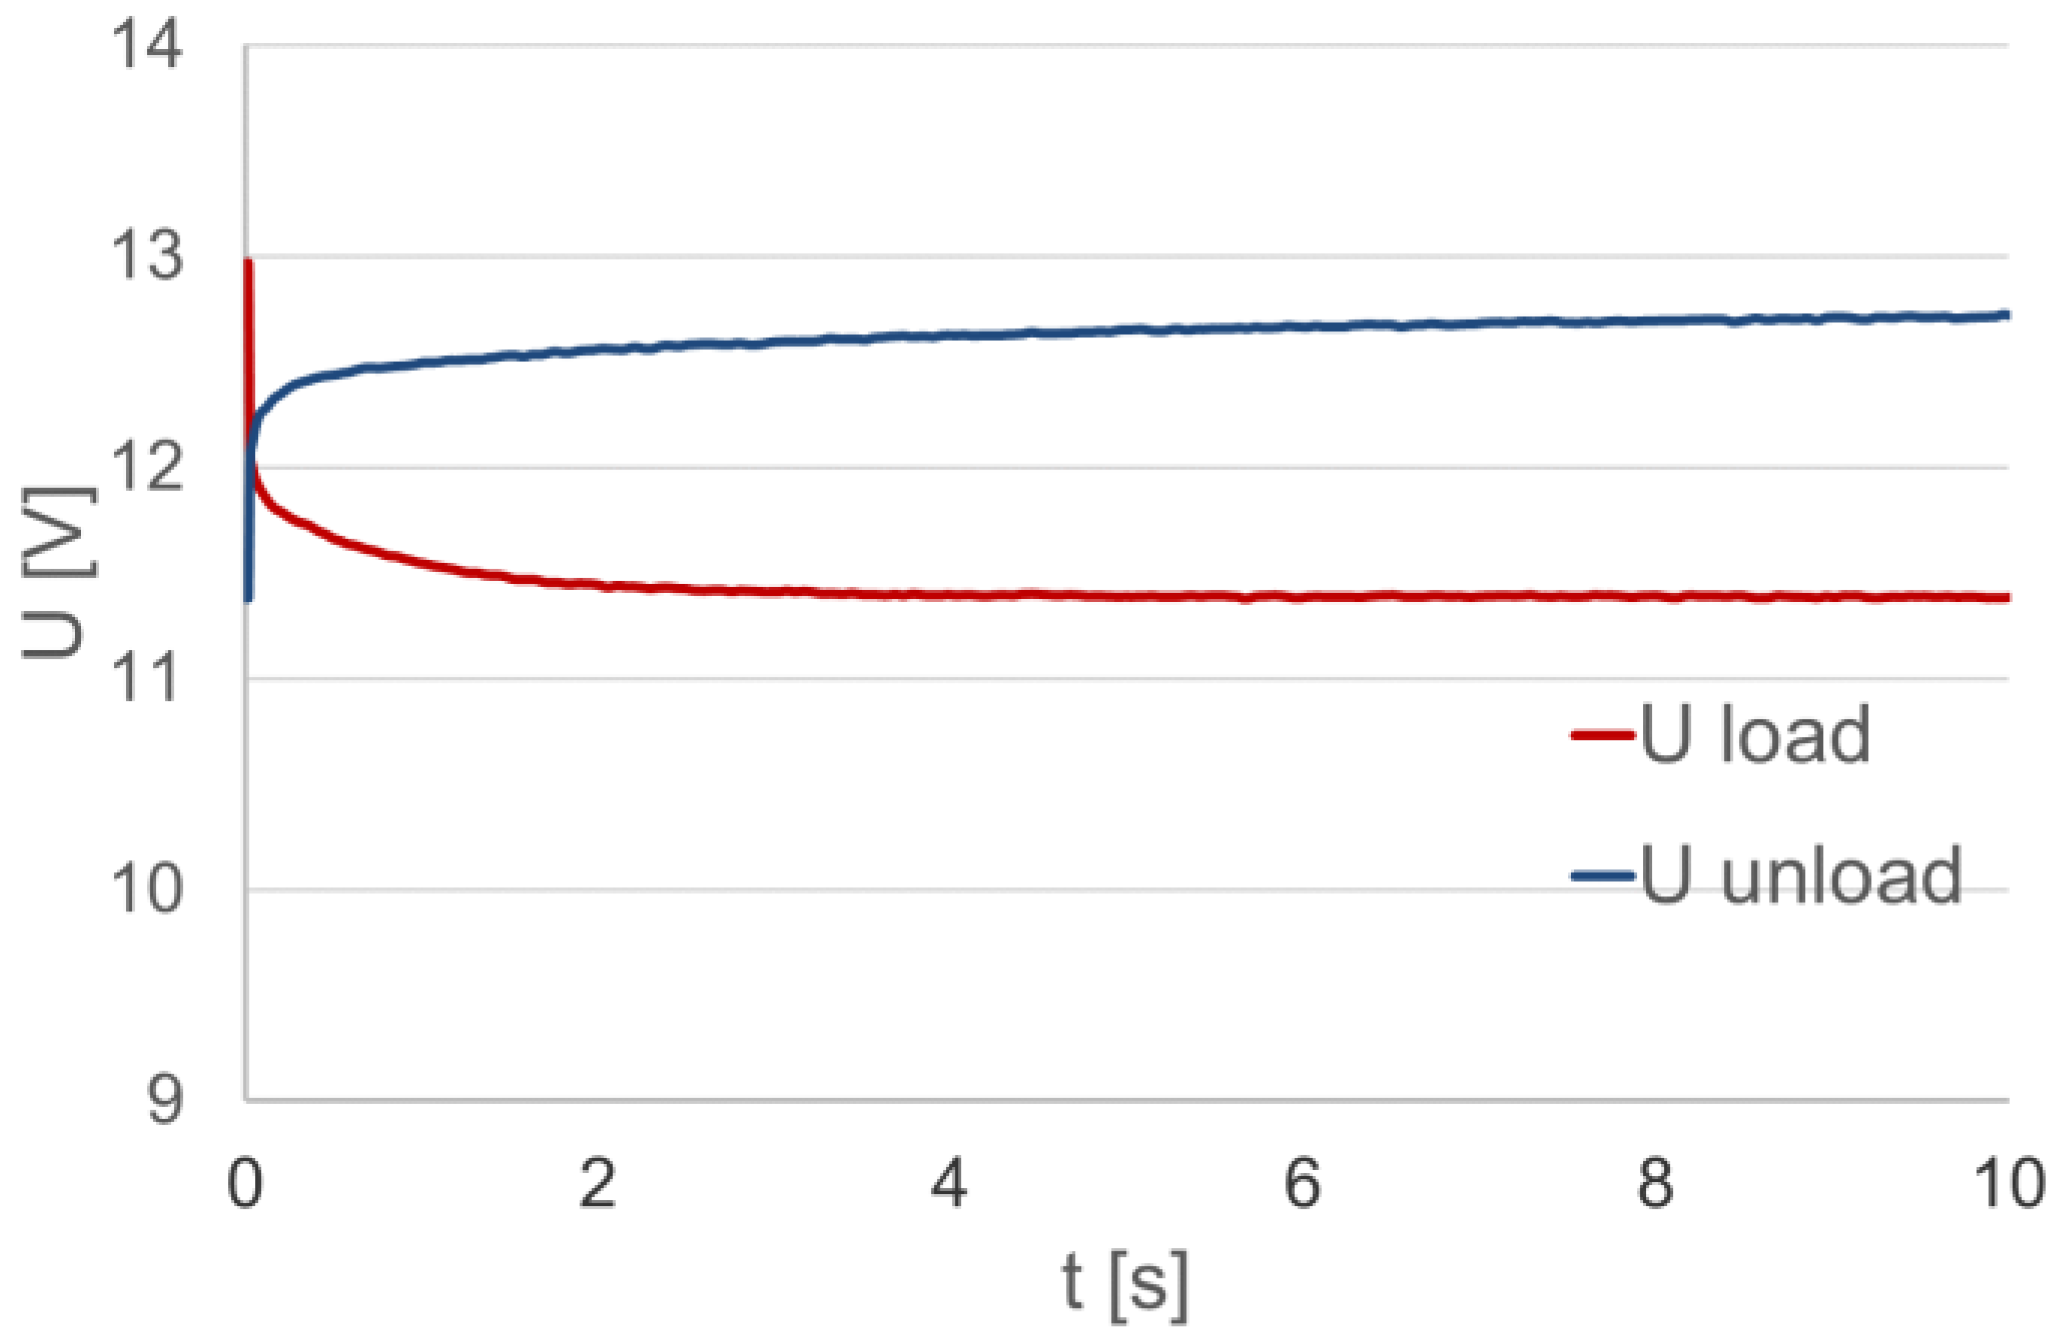
Figure 2.
The voltage (to 10 s) at the loaded and unloaded battery terminals.
At the moment of switching on the load, characteristic and correlated, proportional changes in the intensity of the absorbed current and voltage at the battery terminals can be observed. During the initial discharge period, the voltage at the battery terminals and the current decrease approximately exponentially, and then their values stabilize. When the load is switched off, the voltage increases rapidly and then increases exponentially (Figure 2). This is due to an increase in its electromotive force caused by changes in the electrolyte concentration in the vicinity and in the inner layers of the active mass of the battery plates.
The recorded characteristics have, in addition to the visible and clear trend of changes, significant irregularity. This can cause difficulties in their further processing to determine and interpret electrical characteristics and the battery model. Therefore, the courses were subjected to pre-processing aimed at smoothing them. The causes of signal distortion were analyzed, and methods of their elimination were developed. The following sources of interference were identified:
- The own noise of the measuring system;
- Interference from the external electricity network;
- Quantization errors of the measuring system.
The various forms and principles of averaging were adopted as the methods of smoothing of the received signals. These can only be used in the case of a good recognition of the signal and an understanding of the nature of its changes, to ensure that useful signal components are not lost. The own noise of the measuring system, particularly high values, is usually represented as a single isolated deviation of its value from the set level. In principle, all distortions can be reduced using a method analogous to the moving average; the difference is that the moving average is a forecasting method in which the forecast value is assumed as the moving average of the preceding values. In this case, a calculated value of the mean was taken as the central data value. It is preferred that this uses an odd number of datapoints. Depending on the degree of a signal interference, the smoothing of the curve can be used several times.
As a characteristic of the battery load, the dependence of the voltage at its terminals at a constant value resistance load is considered. The analysis concerns the characteristics during the battery load period, as shown in Figure 3 as Uload. After the load is turned off, the voltage at the battery terminals increases abruptly, and then gradually stabilizes to the value in the no-load state.
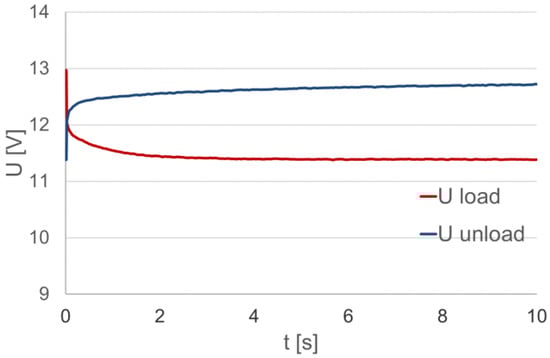
Figure 3.
The voltage at the loaded (Uload) and unloaded (Uunload) battery terminals.
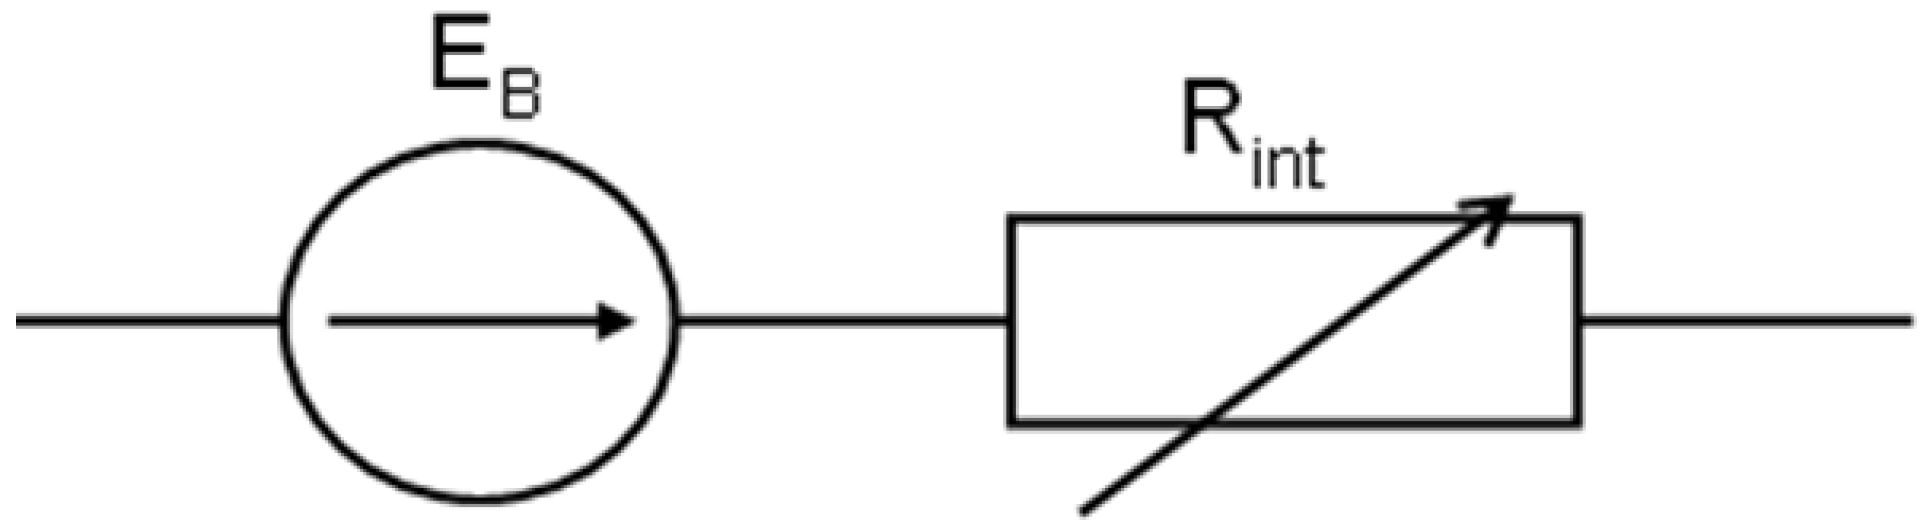
The different battery models are applied to the specific purposes and the different methods used to test the battery characteristics [27,28]. The simplest model of the battery presents it as an ideal voltage source, i.e., an electromotive force that does not exhibit even any internal resistance. The lead–acid battery is most often treated as a voltage source of electric current with a defined electromotive force and a variable internal resistance. In the electrical circuit, certain voltage changes at its terminals (at a constant value resistance load) can be justified by a change in its electromotive force or internal resistance. The changes in the electromotive force (or the internal resistance) are caused by the processes in the electrolyte around the electrodes or on their surface. When under the given discharge conditions, a constant value of electromotive force is accepted, and a classic equivalent electrical circuit of the battery can be presented, as shown in Figure 4.
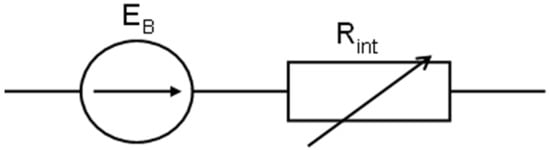
Figure 4.
The classic equivalent electrical circuit of the battery.
When such a battery is loaded with the external resistance R or the constant current I, the voltage at the battery and receiver terminals is as follows (1):
A complex battery model takes into account its electromotive force, internal resistance, inductance or capacitance, and other characteristics. The model presented in this article considers the dependencies of the characteristics of the battery on its rated capacity, temperature, and state of charge. However, the model should reflect the principle of the lead–acid battery. It also should be simple, fast, and effective to implement and use. The equations of the lead–acid model always contain constants that must be determined experimentally by laboratory tests. Any battery model can be validated by a simulation using, for example, the MATLAB/Simulink Software [29].
3. Results
3.1. Stationary Operating Characteristics of an Acid Battery
The operating voltage of the lead–acid battery depends on its rated capacity, current consumption, temperature, and state of charge (technical state). Previous research of one- and two-dimensional operating characteristics of acid batteries formulated a conclusion about the linear nature of the dependences of the battery operating voltage on the above-mentioned independent parameters [30]. In order to determine the multidimensional characteristics of the acid battery operation, an experiment was developed that enabled determination of the coefficients of a linear equation that describes the relationship between the voltage of the loaded battery and the factors influencing it. Testing the characteristics of the batteries was carried out on a test stand prepared and placed in a low-temperature chamber, which enabled the operating conditions of the battery to be changed. In the initial period of load, changes in the current and voltage values are visible, resulting from the dynamic nature of the tested battery operation (load switching on). Because the objective of the study was the determination of the characteristics under the steady-state load conditions, the values of the parameters describing the operating state of the battery were determined for the load duration time of approx. 10 s, i.e., after their stabilization.
Gaining an understanding of the properties of the research object and its behavior under the influence of extortion requires many, often costly and time-consuming experiments. The number of measurements performed depends on the complexity of the model, the number of independent variables affecting the research object, and the variables’ values. For the purpose of limiting the number of measurements and, at the same time, obtaining as much information as possible, it is necessary to plan the experiments and then perform them according to the principles resulting from the adopted plan. In the experimental research, the most commonly adopted approach is a linear structure of the model, in addition to exponential or logarithmic structures that can be reduced to a linear form. The method of least squares is most often used to determine the coefficients of these models. The method of least squares is used to identify the linear models and the second-order polynomials, in addition to the power or logarithmic functions.
The research object is characterized by the independent (input) variables xi, i.e., a set of parameters influencing its properties; and dependent variables yi, i.e., output quantities (the result of the interaction of input and disturbing quantities). The disturbing quantities zi are the result of an impact of random factors on the research object and the inaccuracy of measurement methods and means.
The research is carried out according to a prepared experiment plan, usually in accordance with the experiment table included in the plan. The determination of the inaccuracy of the measurement results is possible when the same experiment is repeated several times. The arithmetic mean can be used as a position measure and the standard deviation as a dispersion measure. The optimization of the model describing the real object mainly consists in finding the best of all possible limitations, and a model that describes the relationships between the studied variables.
As mentioned above, the experiment plan was developed with the assumption of a linear structure of the mathematical model that describes the relationship between the voltage of the loaded battery (dependent variable) and the physical quantities that influence the voltage (independent variables): battery nominal capacity—Q [Ah]; load current intensity—I [A]; temperature (of electrolyte)—T [°C] (in this case it is more advisable and convenient to use the Celsius temperature scale than the Kelvin temperature scale); and battery condition—k. A two-level, static, determined, and complete experiment was assumed. The plan assumes that the input factors, i.e., the independent variables, take two levels of values: the upper ones are marked as “+1” and the lower ones are marked as “−1”. Therefore, the number of tests in the planned experiment for the four independent variables is: n = 24 = 16.
For individual independent variables, the appropriate symbols xi were adopted, and the levels of their variability were assumed. The levels of variability define the range within which they take the values [xmin − xmax]. To develop the model, it is necessary to code the input quantities. Coding consists of transforming the value of any input quantity into a coded (normalized) value which is within the range limited by the conventional levels of the input variables, and falling into the following set [−1 ÷ +1]. For this purpose, mathematical operations were performed, consisting of determining central values; that is, calculating arithmetic means for the individual variables and determining a unit of variation for the individual quantities, which is the unit value of the input factor change. These values were then coded. The units of the variables’ variation were determined on the basis of the changes in the parameters of the operation of the engine starting system under the average engine starting conditions with the use of an electric starter.
A calculation of the units of variation consists of determining the unit value of the change in the independent variable. The unit of variation was determined on the basis of Equation (2). The value of ximax and ximin in Equation (2) corresponds to the maximum and minimum value, respectively, of the independent variable with the number, i.e., xi in the adopted variation range.
The central values are the arithmetic means of the maximum and minimum values of each individual independent variables Equation (3):
Coding of independent variables results in transforming the values of the input quantities into dimensionless numbers contained in the following set [−1; +1]. Coding makes the experiment plan independent of the real values and the physical meaning of independent variables describing the research object, and replaces the independent variables with dimensionless values. Hence, the methods of planning the experiment become universal and independent of the physical importance of factors describing a given phenomenon, and can be used in various fields of research.
Thus, the coded value of any independent variable, according to Equation (4), is:
where the individual component of Equation (4) has the following meaning:
- xik—the coded value of the independent variable;
- xi—the independent variable subjected to the coding;
- xio—the central value, determined by the Equation (3);
- Δxi—the unit of variation of the independent variable subjected to the coding.
The appropriate levels of the variability of the factors were adopted, for which the values were, respectively:
- The battery nominal capacity: Q = 110 and 170 Ah;
- The current: I = 84 and 224 A;
- The temperature: T = 0 and +22 °C
- The battery condition (state of charge): k = 0.7 and 1.
The notional levels of the factor values are described as −1 for the lower value and +1 for the higher value. The first step of the experiment is to code the variables, which then assume conventional, dimensionless values. The central values of the independent variables were determined in the form of the arithmetic mean of the values assumed by these variables at the upper and lower levels according to Equation (3). Then, the units of variability of the factors considered in the experiment were calculated. After calculating the central moments and units of variability, the variables were coded in accordance with Equation (4). The results of the activities leading to the presentation of the variables in the coded form are recorded in Table 1.

Table 1.
Variables’ coding results.
The dependent variable, i.e., the voltage at the terminals of the loaded battery, U [V], is also coded. Following the coding of the variables, the next step in the preparation of the experiment plan is the plan table arrangement, according to which the measurements are carried out. Table 2 presents the table for the planned experiment in question. The number of planned experiments results from the number of variables describing the research object and the number of levels of the values that these variables take.
Table 2.
The matrix of the experiment.
The x0 value is an intercept of the linear model describing the object, and the subsequent columns represent independent variables, respectively: battery rated capacity, load current, electrolyte temperature, and battery condition (SoC—state of charge). A single experiment from Table 2 defines the measurement system as a set of independent variable values. Only one value of each variable belongs to each set, and all independent variables describing the research object were simultaneously taken into account. In the created plan, the number of experiments was 16. It is also assumed that the individual experiments included in Table 2 should be performed in a random order. The measurements were made for the tests presented in the table.
The linear regression equation describing the relationships between the variables for the presented plan takes the form of Equation (5):
The coefficients of the regression equation were determined using the following relationships Equations (6) and (7):
After confirming the adequacy of the model, the equations were decoded and written in the form of a linear function taking into account all independent variables. The sought-after linear model of the object describes the relationships between the variables Equation (8).
After carrying out the measurements according to the plan review table, the coefficients of the linear equation describing the relationships between the variables were determined according to Equations (6) and (7). After determining the coefficients, the following equation was obtained in a coded form Equation (9):
This expression presents a linear mathematical model of the object, i.e., an acid battery, the coefficients of which, determined on the basis of the data from Table 2, indicate how much the value of the dependent variable (battery voltage) will change when the value of the coded independent variable changes by one.
The mathematical description of the research object, i.e., the lead–acid battery, obtained as a result of the tests, is presented below. For this purpose, Equation (9) was decoded in order to determine the coefficients describing the quantitative influence of the individual physical variables on the value of the loaded battery voltage. The decoded linear model of the research object is a quantitative model that describes the dependence of the loaded battery terminal voltage U, as the dependent variable, on the nominal (rated) capacity Q, the discharge current I, the ambient (electrolyte) temperature T, and the (technical) state of charge (SoC) k, as the independent variables. This is presented as Equation (10). This makes it possible to know the “degree of influence” of the individual independent variables on the dependent variable.
Thus, using the principles of experiment planning, a multidimensional model of the acid battery under the stationary operating conditions was obtained. This method significantly reduces the time needed to conduct experiments in order to achieve the intended research objective, especially when the objective is to develop a mathematical model with a known (assumed) form that describes the relationships between the factors.
3.2. Acid Battery Non-Stationary Operating Characteristics
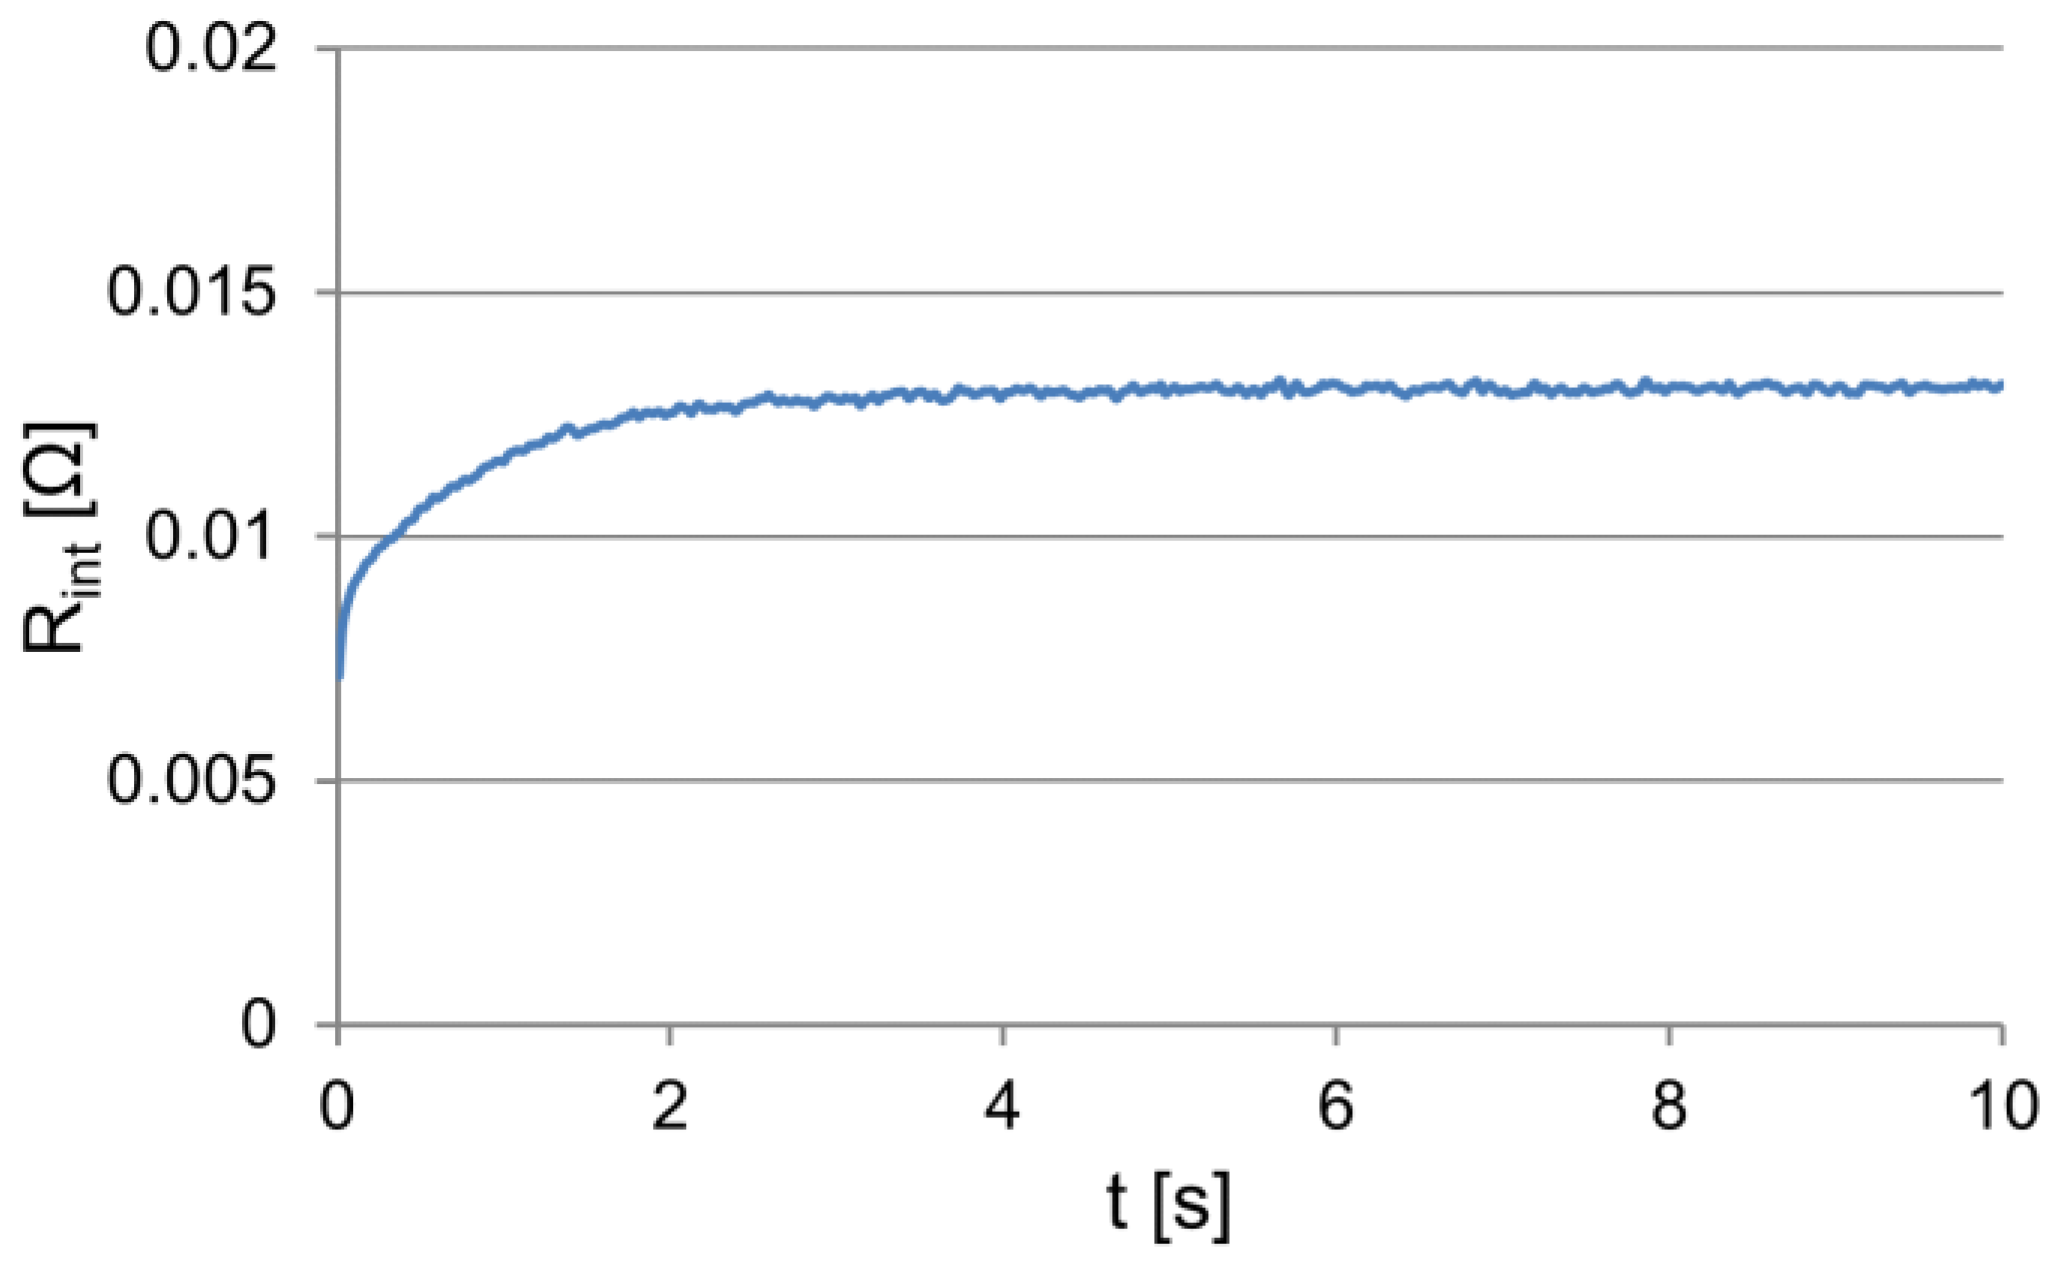
In the electrical circuit of the acid battery under the non-stationary operating conditions, the dynamic characteristics of the battery are revealed, which can be represented by the variability of its internal resistance. On the basis of Equation (1), the internal resistance of the analyzed battery was determined (Figure 5), considering that the voltage at the terminals of the unloaded battery, i.e., its electromotive force, was equal to 12.97 V.
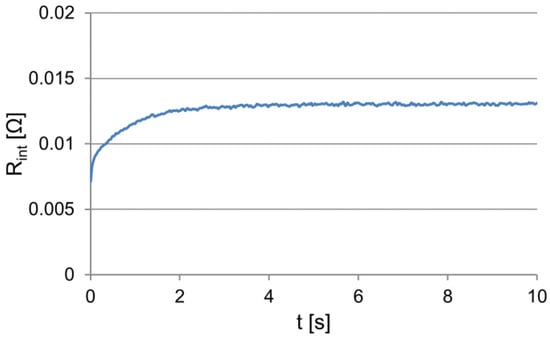
Figure 5.
The changes in the internal resistance of the loaded battery.
The analytical form of the obtained dependencies (internal resistance and analogously of the voltage and current consumption) is convenient for the engineering calculations for predicting the features of an object. One of the significant problems in this case is the choice of the form of a regression function that is appropriate as an object or a process model. In the analyzed case, e.g., for the internal resistance, it is advisable to adopt the exponential function featuring the form Equation (11) because of the nature of the variability of the observed dependency. In addition:
- It is a function commonly used in science and technology;
- It is easy to interpret;
- It enables the development, through the interpretations, of a structural model of the object that undergoes an exponential response to a step extortion and its analytical description.
- Rs—battery resistance in the steady operating state;
- Rv—amplitude of the variable resistance component of the battery;
- τ—time constant of the change process of the internal resistance.
The obtained signal courses (Figure 1, Figure 2, Figure 3, and Figure 5) indicate the need to isolate fixed and variable parts of the dependences. Clear determining the value of the specified course is difficult because, under exponential variability, this value is reached in infinity. In addition, especially at high current values, low temperature, and poor battery condition, the changes in the value of the analyzed signals can also be a result of the battery discharge, and thus a permanent change in its properties.
The variable part of the course, as presented in Figure 5, cannot be easily described using one exponential function. In this case, the description can be made using a glued function, i.e., a set of exponential functions defined in the different time intervals. The functions should meet the condition of continuity at the limits of the time intervals. The general form of the glued function, F, and the continuity condition can be written as in Equation (12):
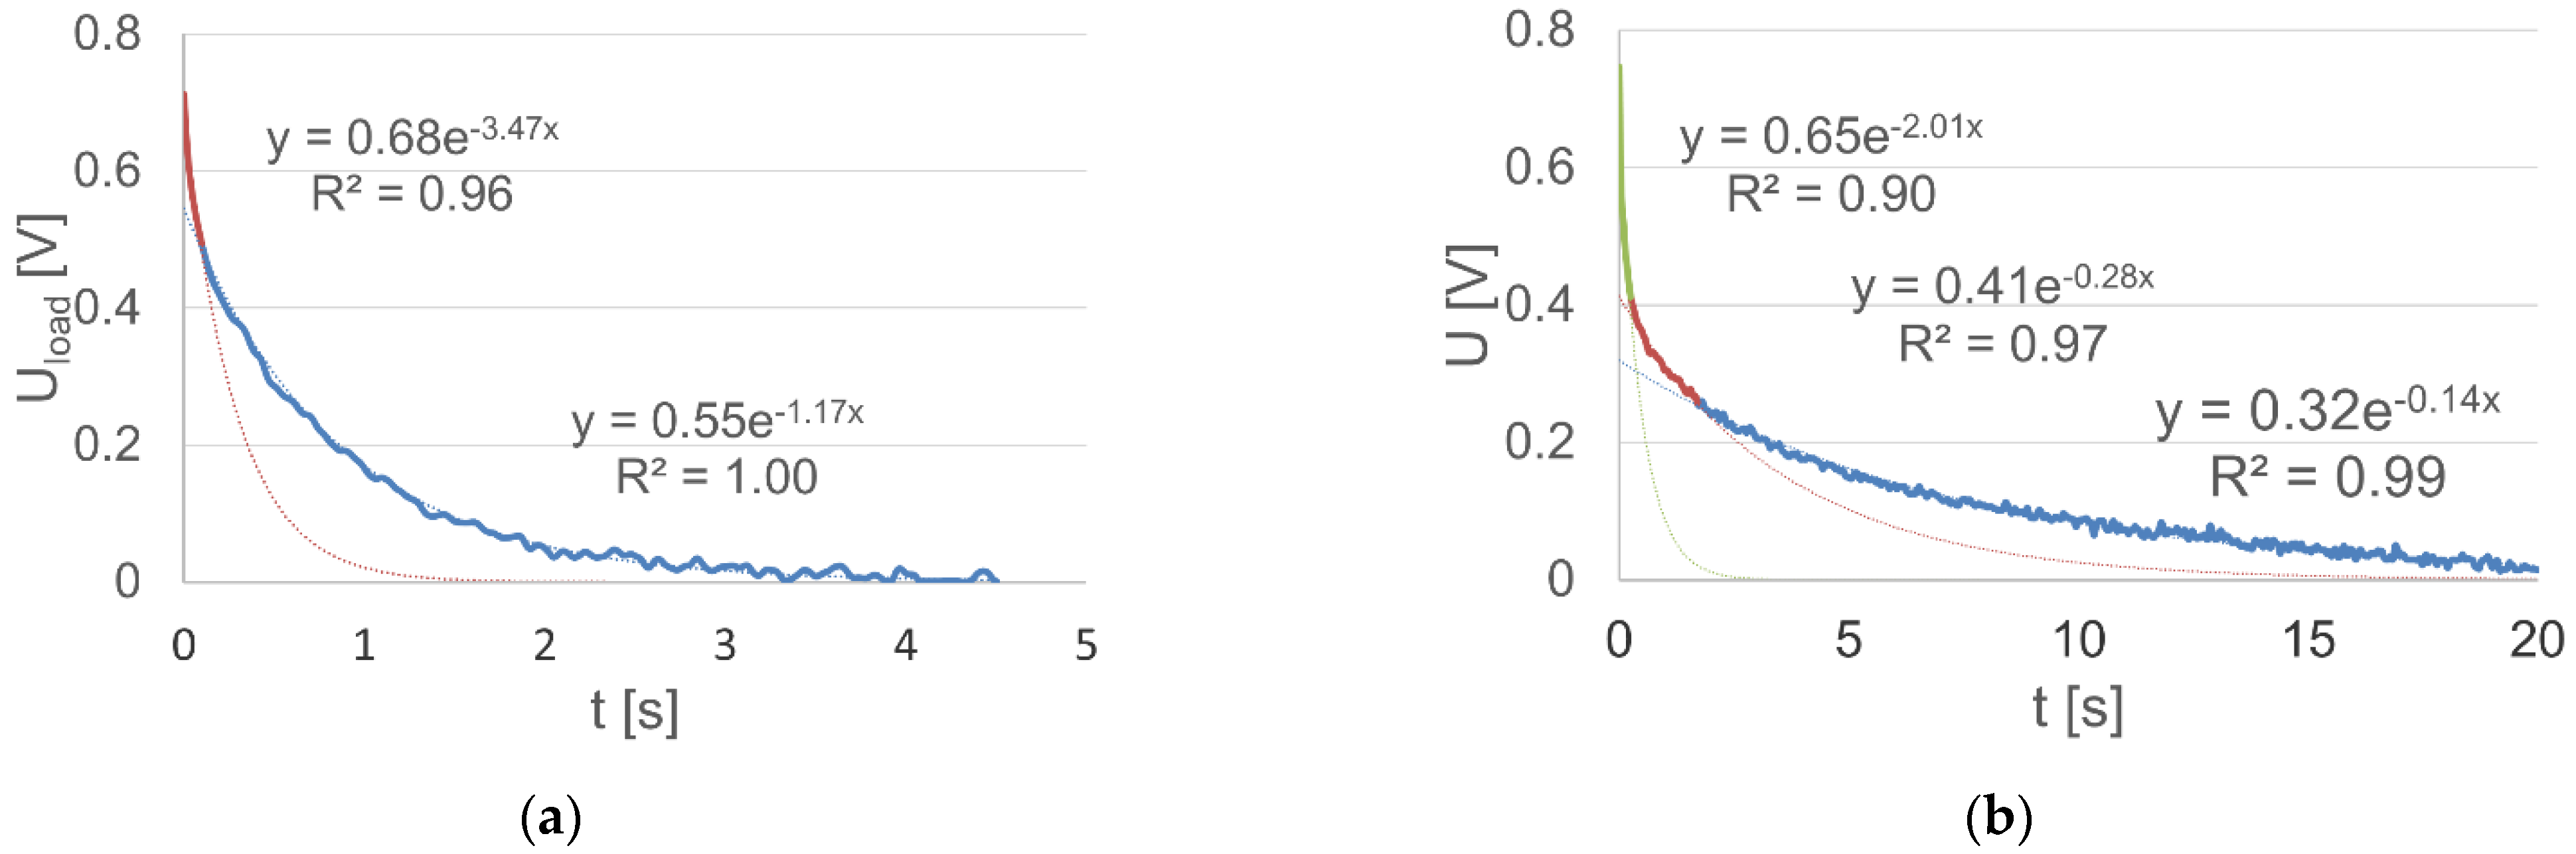
In this case, another problem is the choice of the number and domain of each function, which are related to the description complexity and accuracy. As a criterion for the choice and assessment of these properties, the coefficient of determination R2 for an individual function can be used. With regard to the analyzed dependencies in Figure 6, the fixed voltage values at the loaded and unloaded battery terminals were determined. Using the value of the coefficient of determination as a criterion, the time intervals of voltage stabilization at the terminals of the loaded and unloaded battery were determined, in addition to the variation intervals, for which the voltage change characteristic has an invariable value with respect to the time constant (Figure 6). In this manner, it was established that the voltage stabilization time of the loaded battery is approximately 4.5 s, and the stabilization of the voltage value after the load was turned off did not end within 20 s. It is important to note that the approximation of the value of the variable voltage of the loaded battery using the spline function requires two components, and for an unloaded battery, the required number of components is equal to three.
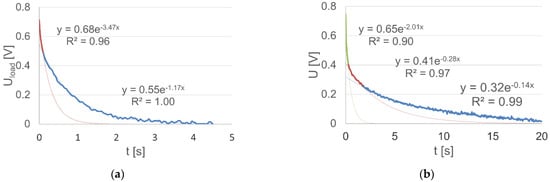
Figure 6.
The variable component of the: (a) loaded battery voltage together with the approximating glued function lines (regression equations are written in the text (13)); (b) unloaded battery voltage together with the approximating glued function lines (regression equations are written in the text (14)).
The final form of the analytical description of the two dependencies is presented by Equations (13) and (14), and its illustration, together with the exponential analytic functions, is shown in Figure 6.
The second possible means of describing the presented dependencies with the exponential functions is using their linear combination, i.e., a mixture of exponential functions. The mixture of functions, Fi, can be undertaken as follows Equation (15):
where ai represents the function weighting factors, which are also amplitudes of each individual function.
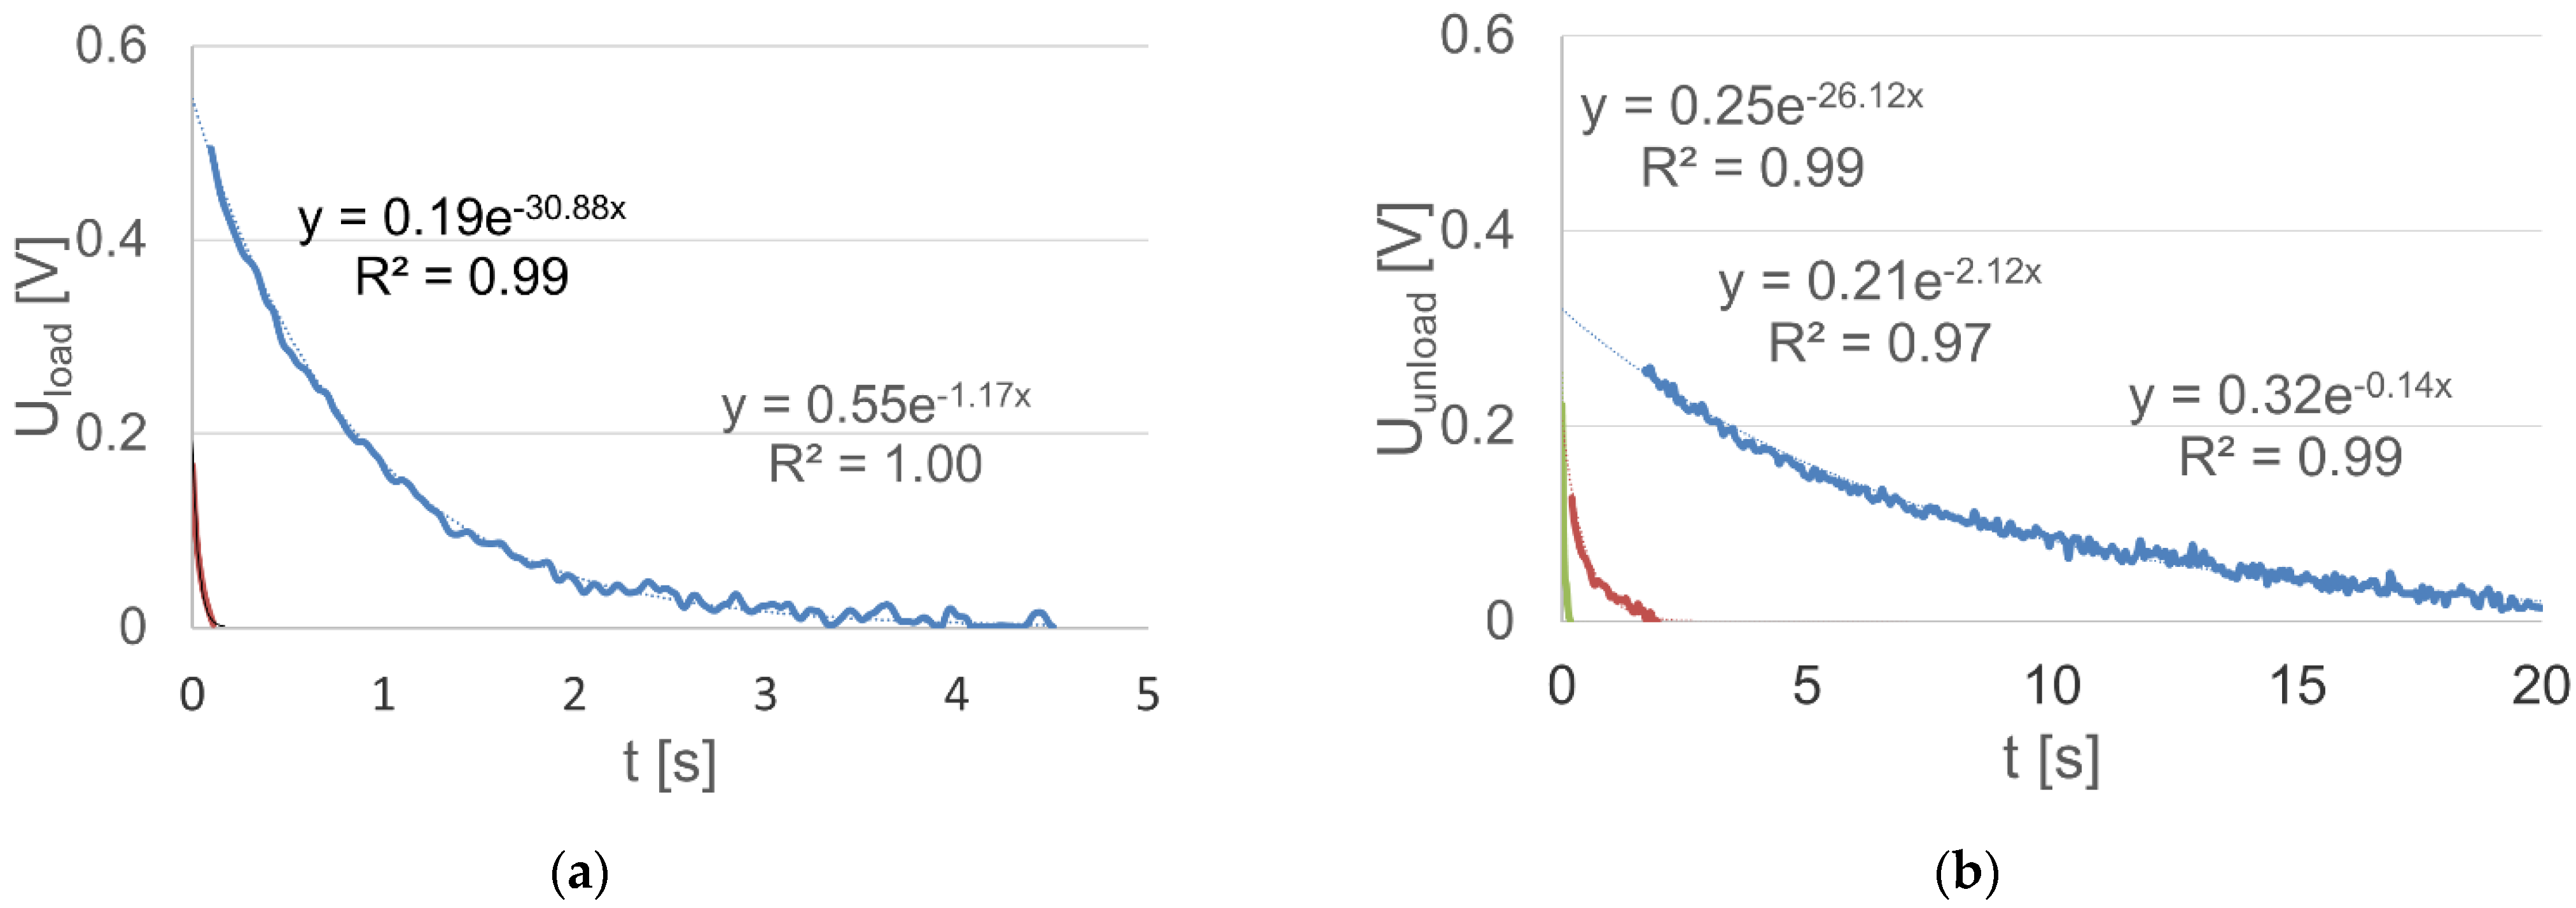
In the case of the analyzed battery, the description was made using a mixture of the voltage characteristic curve functions within the time interval from 0 to 4.5 s for a loaded battery. A stable component of the value of Us = 11.37 was extracted. Hence, a very good correspondence of the description with the real dependency was obtained, by distinguishing the range of fast polarization voltage variations in the period up to 0.1 s. In this case, a description according to Equation (16) was obtained, and the separated intervals and their approximation functions are shown in Figure 7a. Similarly, the voltage dependencies at the battery terminals after switching off the load were described using a mixture of exponential functions (Figure 7b, Equation (17)). In addition, in the case of a mixture of functions, it was necessary to use the three components of the exponential function.

Figure 7.
Determined voltage components at the terminals of the: (a) loaded battery within the time range up to 4.5 s (regression equations, mixture of exponential functions, are written in the text (16)); (b) unloaded battery within the time range up to 20 s (regression equations, mixture of exponential functions, are written in the text (17)).
Attention should be paid to the significant, more than 25-fold, differentiation in the time constants of both functions (for the loaded battery), which is equal to about 0.032 s for the fast-changing component, i.e., in the time interval up to 0.1 s and 0.86 s for the slow-changing component (they are equal to the inverse of coefficients specified in the function exponents).
3.3. Battery Structural Model
In the previous considerations, according to the electrical diagram given in Figure 4, the reason for the voltage change at the terminals of the loaded battery was recognized to be the change in its internal resistance. The primary reasons for the change are the changes in the electrolyte density around the electrodes and in the inner layers of the active mass of the battery plates. The change in the electrolyte density is also the reason for the changing potentials of the electrodes, i.e., the electromotive force of the battery. Therefore, the change in the voltage at the terminals can also be considered to be the change in the component of the electromotive force called the electromotive force of polarization. The polarity of each electrode (anode and cathode) can be distinguished, depending on the location of the polarization processes and the voltage drop in the electrolyte. In general, the electrical resistance of the battery is constituted by resistance, capacitance, and inductance components.
The electrical diagram of the acid battery shown in Figure 4 can be used to describe the operation of the battery under a constant current load or constant resistance. The variability of the internal resistance with time under dynamic load conditions makes it practically impossible to use this diagram to determine the response of the accumulator to the variable, dynamic force.
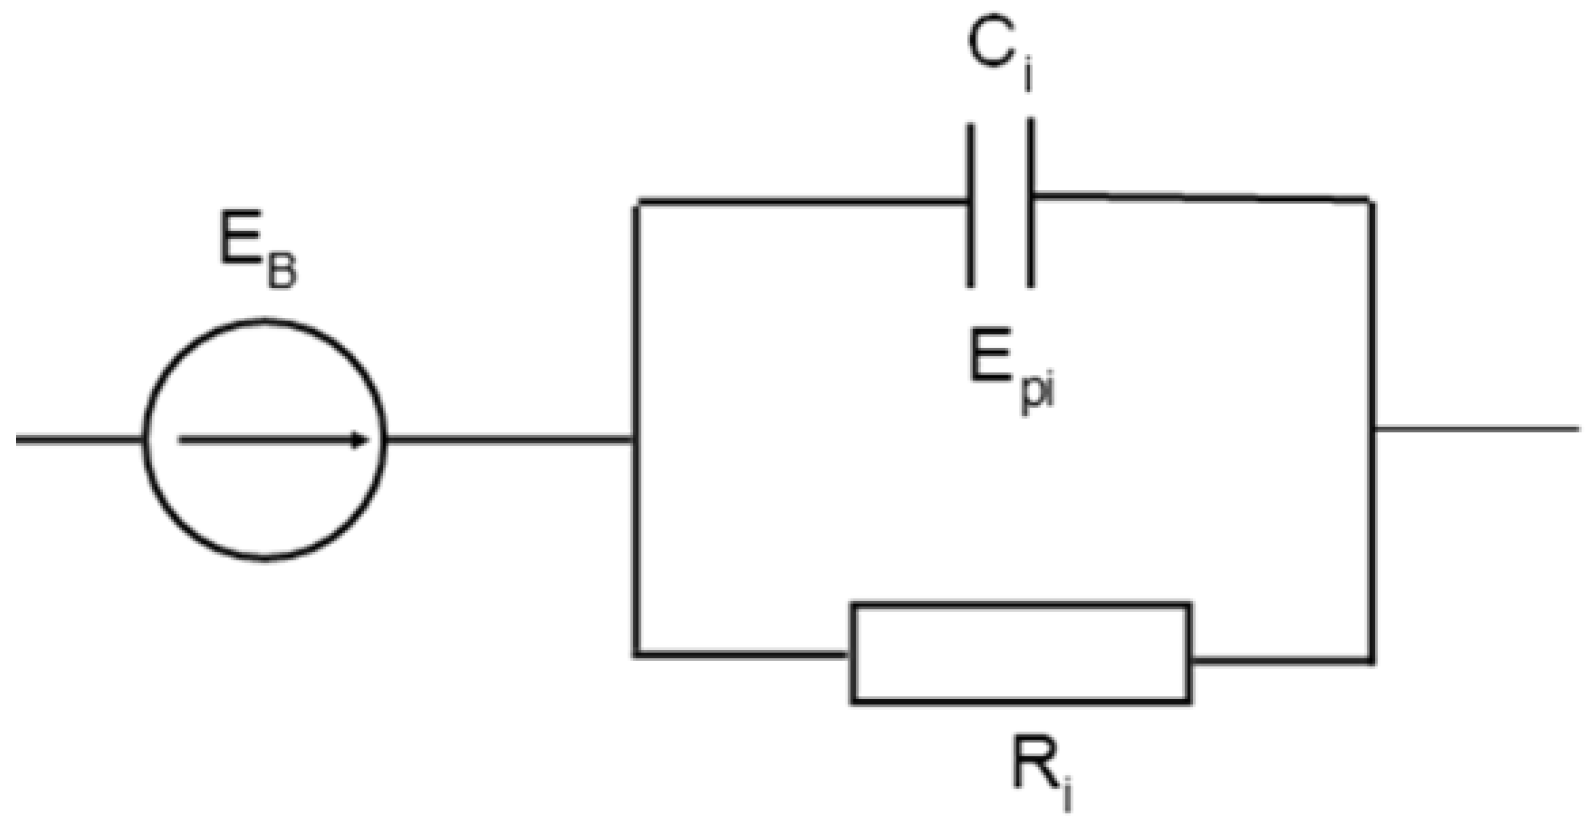
The description of the battery discharge characteristics (voltage at its terminals) using the exponential function enables the introduction of the electric components to the equivalent battery circuit, whose electrical properties generate responses in the form of exponential function. Such a component of vicarious battery diagrams may consist of a capacitor and a resistor through which the capacitor is charged or discharged. Therefore, it is possible to connect the RC circuits to a stationary source of the electromotive force of the battery EB, as in Figure 8. Under variable load conditions, these circuits generate the electromotive force of the polarization components Epi (Figure 8) according to Equations (16) and (17). A description of the battery discharge characteristics by means of a linear combination of two or more exponential functions indicates the possibility and need to also apply a larger number of RC circuits connected in series to the equivalent circuit of the battery.
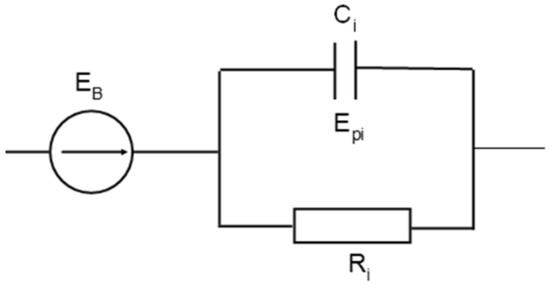
Figure 8.
Electrical equivalent circuit for an acid battery.
Determination of the parameters of the circuit components is made possible on the basis of the test results of the battery discharge characteristics, as specified in Equations (16) and (17). It is known that the capacitor discharge characteristic is the exponential curve in the following form Equation (18):
This enables physical values to be assigned to the indicated components of the battery equivalent circuit. This is due to the fact that the time constant of the discharge process is τ = RC.
4. Discussion
The characteristic of a device functioning (operating) is the dependence of its output signal feature value, i.e., device response, on the value of the input signal. Devices have static and dynamic characteristics. A device’s static characteristic is most often the function y = y(u), which represents the dependence of the value of the output signal feature y of the device on the input value, i.e., the input signal feature u under the steady-state conditions. An example of such a characteristic may be the dependence of the voltage at the battery terminals on the factors influencing its value, as presented above. The most frequently expected static characteristic is a linear one-dimensional or multi-dimensional characteristic, for example, as shown in Equation (10).
The dynamic characteristic of the device determines the transformation of the input signal u(t) (extortion signal), which varies as a function of time, into the output signal y(t); that is, the variable as a function of time constitutes a response of the system to this input. The dynamic characteristics of a device are most frequently described using transmittance. The operator transmittance, also referred to as a function of the device transition, is the ratio of the Laplace transform of the output signal Y(s) to the Laplace transform of the input signal U(s) under the zero initial conditions Equation (19):
where the Laplace transformation is a transformation of the time function f(t) into a complex function of the complex variable F(s) Equation (20):
On the basis of the transition function, using the inverse Laplace transform, it is possible to determine the signal that will be obtained at the output of the system for any input signal Equation (21)—or vice versa—to determine the driving signal, which should be given at the input of the device to obtain the desired response of the device.
The transmittance is most often presented in the form of the amplitude characteristic |A(f)| and phase characteristic Φ(f) of the device as a function of frequency f or angular frequency ω, i.e., amplitude and phase transfer in the event of a sinusoidal input. A lack of linearity of the amplitude and phase characteristics may cause dynamic deviations of the output signal. The amplitude and phase characteristics of the device are derived from the spectral transmittance.
The spectral transmittance is the ratio of the value of the complex Y response of the system caused by a sinusoidal extortion to the complex value of this extortion in the stationary state. Thus, spectral transmittance characterizes the response of the system to a sinusoidal extortion. The spectral transmittance can be obtained from the operator transmittance by substituting s = jω, thus obtaining the corresponding Fourier transform.
According to the aforementioned dependencies Equations (19) and (20), the battery operator transmittance was determined for the signal presented in Figure 7a and described using Equation (16). It was assumed that the input signal is the leap in the polarization electromotive force with a value equal to the sum of component amplitudes in Equation (16), given as Equation (22):
Therefore, in accordance with the above, the output signal Equation (16) can be written as Equation (23):
Performing the Laplace transforms of the above-written expressions, the transformations of the input and output signal were obtained in the forms of Equations (24) and (25):
As stated above, the battery operator transmittance can be obtained by dividing the Laplace transforms of the output signal and the input signal. Thus, after performing the appropriate transformations, the transmittance of the battery can be presented in the form Equation (26) as below:
Knowledge of the operating characteristics of the acid battery, both static and dynamic, in the form of its transmittance Equation (26), enables determination of the battery response, i.e., the voltage at its terminals, for any load value, i.e., the current drawn from the battery. In the expression describing the static characteristic Equation (10), the independent factors include the technical condition, i.e., the state of charge of the battery, k (it is advisable and necessary to determine similar relationships for the dynamic characteristics). The comparison of the battery voltage value determined on the basis of the characteristic for the reference battery, with the voltage value measured under the experimental conditions, may enable the (SoC) value k of the researched battery to be determined. In this case, value k becomes i.e., the battery status indicator, and can be used as a diagnostic parameter for the determination of the status of the battery. It is expected that the developed dependencies will be used in the diagnostic procedure of the battery, based on the measurement of the engine start signals, i.e., the driving of its crankshaft by the starting system. The proposed method will allow not only the diagnosis of the condition of the acid battery, but also the electric starter and the internal combustion engine in terms of the resistance to motion, taking into account the compression pressure of cylinder charges.
5. Conclusions
The acid battery is a functionally and structurally complex non-linear power source, whose features are dependent on many parameters. Its static characteristic, i.e., the loaded battery terminal voltage U in stationary operating conditions, depends on the nominal (rated) capacity Q, the discharge current I, the ambient (electrolyte) temperature T, and the (technical) state of charge (SoC) k as the independent variables. For the purpose of describing the dynamic characteristic of its operation, that is, the response to a rapid leap in current (i.e., a load with a constant current or resistance), it is convenient to use the exponential functions in the form of glued functions or a mixture of functions. Both methods of description correspond to two different electric models (equivalent circuits) of the acid battery in the form: (1) the electromotive force and the variable internal resistanc; (2) the stationary electromotive force and the (two or three) RC systems having different characteristics, resulting in changes in the electromotive force of the polarization of the battery in the circuit. The presence of two or three different components of the electromotive force of polarization indicates that the equivalent circuit of a lead–acid battery should include at least two RC circuits connected in series, with the significantly different parameters defined by means of time constants. In fact, the change in the time constant of the polarization electromotive force occurs continuously, from very small values to theoretically equal to infinity. The consideration of many independent parameters in the description of the battery and its structure requires long-term extensive experimental research.
A feature of modern machine exploitation is the constant, systematic increase in the role and meaning of technical diagnostics. The broad possibilities of its application result from the change in the properties of the exploitation objects, including motor vehicles and the development of methods and means of diagnosis using digital signal recording and processing techniques. In the diagnostics of internal combustion engines and their starting systems, the diagnostic parameters of the working and accompanying processes of the driving of the crankshaft can be used. These diagnostic parameters include: the current consumed by the starter, the voltage at the battery or starter terminals, and the speed of the crankshaft forced by the starter. The set of electric starter characteristics depends on the properties of the energy source, i.e., the acid battery.
The developed models, both for the stationary and non-stationary conditions, will be used in the proposed and currently developed diagnosis method for the internal combustion engine–electric starting system based on the engine start-up signals and its driving by the starting system. It will be possible to determine the state of charge of the battery on the basis of Equation (10). The dynamic components of the model in the form of transmittance Equation (26) will allow determination of the significance of the influence of the battery’s dynamic characteristics on the process of driving the crankshaft of the engine, and the necessity to include this in the diagnostic test of the system.
As a result of the presented research and characteristics of the acid battery, and the analyses performed, conclusions important for the knowledge and understanding of the principles of operation of the acid battery can be formulated:
- Regression methods that enable general, symbolic, and formal descriptions of the test results play an important role in the study of the characteristics and parameters of the acid battery structure.
- The static characteristics of the battery as a function of the essential independent parameters, such as rated capacity, state of charge, current intensity, and electrolyte temperature, are linear under a wide range of usable operating conditions.
- Under dynamic operating conditions, the battery is a complex control object with time-varying characteristics and properties of an equivalent structural electrical circuit. This is expressed by the necessity to include two or even three RC circuits in its structure.
- The determined stationary and dynamic model enables determination of the influence on the operation of the starter and the parameters of driving the crankshaft of the internal combustion engine by the battery under specific operating conditions.
- Estimation of the time constants of dynamic voltage characteristics of the battery enables the determination of its operator and spectral transmittance, and evaluation of the impact of the dynamic characteristics, not only on the functioning of the battery, but also on the internal combustion engine starting system and its crankshaft drive characteristics.
- The dynamic characteristics of the load phase and voltage stabilization after switching off the load are significantly different, and the equivalent circuit has two or three RC circuits, respectively.
- Significant differences in the load phase and voltage stabilization characteristics indicate a significant differentiation in the causes of the appearance and disappearance of the imbalance of the loaded battery and after the load is turned off.
- The determination procedures, especially of the dynamic characteristics, are laborious and require precise separation of the variable, dynamic part from the recorded course. It is possible to achieve high accuracy in determining the characteristics, as assessed by the value of the determination coefficient, which can be as high as 0.99.
- The criterion for assessing the accuracy of determining the dynamic characteristics may be the value of the determination coefficient, both in the range of the value of the stable voltage and in the time intervals of the exponential function with a specific value of the time constant.
Funding
This research received no external funding.
Institutional Review Board Statement
Not applicable.
Informed Consent Statement
Not applicable.
Data Availability Statement
Exclude this statement.
Conflicts of Interest
The author declares no conflict of interest.
References
- Ceraolo, M. New dynamical models of lead-acid batteries. IEEE Trans. Power Syst. 2000, 15, 1184–1190. [Google Scholar] [CrossRef] [Green Version]
- Jackey, R.A. A Simple, Effective Lead-Acid Battery Modeling Process for Electrical System Component Selection; SAE International: Warrendale, PA, USA, 2007. [Google Scholar]
- Droździel, P. Impact of selected operation conditions of a car combustion engine on its start-up parameters. Eksploat. Niezawodn. Maint. Reliab. 2003, 4, 22–30. [Google Scholar]
- Enache, B.-A.; Constantinescu, L.-M.; Lefter, E. Modeling aspects of an electric starter system for an internal combustion engine. In Proceedings of the 2014 6th International Conference on Electronics, Computers and Artificial Intelligence (ECAI), Bucharest, Romania, 23–25 October 2014; pp. 39–42. [Google Scholar]
- Kasprzyk, L. Modelling and analysis of dynamic states of the lead-acid batteries in electric vehicles. Eksploat. Niezawodn. Maint. Reliab. 2017, 19, 229–236. [Google Scholar] [CrossRef]
- Pszczółkowski, J. Rozruch silnika tłokowego jako proces diagnostyczny. Diagnostyka 2002, 27, 48–53. [Google Scholar]
- Chacón, H.E.A.; Banguero, E.; Correcher, A.; Pérez-Navarro, Á.; Morant, F. Modelling, Parameter Identification, and Experimental Validation of a Lead Acid Battery Bank Using Evolutionary Algorithms. Energies 2018, 11, 2361. [Google Scholar] [CrossRef] [Green Version]
- Lee, S.; Cherry, J.; Safoutin, M.; McDonald, J. Modeling and Validation of 12V Lead-Acid Battery for Stop-Start Technology. SAE Tech. Pap. Ser. 2017, 1. [Google Scholar] [CrossRef]
- Dost, P.; Sourkounis, C. Generalized Lead-Acid based Battery Model used for a Battery Management System. Athens J. Technol. Eng. 2016, 3, 255–270. [Google Scholar] [CrossRef]
- Mohsin, M.; Picot, A.; Maussion, P. Lead-acid battery modelling in perspective of ageing: A review. In Proceedings of the 2019 IEEE 12th International Symposium on Diagnostics for Electrical Machines, Power Electronics and Drives (SDEMPED), Toulouse, France, 27–30 August 2019; pp. 425–431. [Google Scholar]
- Park, C.H.; Yoon, J.H.; Choi, J.D. A Quantitative Study for Critical Factors of Automotive Battery Durability. In Automotive Electronics Reliability; SAE International: Warrendale, PA, USA, 2010; pp. 187–192. [Google Scholar]
- Barré, A.; Suard, F.; Gérard, M.; Montaru, M.; Riu, D. Statistical analysis for understanding and predicting battery degradations in real-life electric vehicle use. J. Power Sources 2014, 245, 846–856. [Google Scholar] [CrossRef]
- Tseng, K.-H.; Liang, J.-W.; Chang, W.; Huang, S.-C. Regression Models Using Fully Discharged Voltage and Internal Resistance for State of Health Estimation of Lithium-Ion Batteries. Energies 2015, 8, 2889–2907. [Google Scholar] [CrossRef] [Green Version]
- Korotunov, S.; Tabunshchyk, G.; Okhmak, V. Genetic Algorithms as an Optimization Approach for Managing Electric Vehi-cles. Charging in the Smart Grid. Available online: http://ceur-ws.org/Vol-2608/paper15.pdf (accessed on 26 October 2021).
- Shen, Y. Supervised chaos genetic algorithm based state of charge determination for LiFePO4 batteries in electric vehicles. In Proceedings of the 2nd International Conference on Advances in Materials, Machinery, Electronics (AMME 2018), Xi’an, China, 20–21 January 2018; AIP Publishing: College Park, MD, USA, 2018; Volume 1955, p. 040050. [Google Scholar]
- Loukil, J.; Masmoudi, F.; Derbel, N. A real-time estimator for model parameters and state of charge of lead acid batteries in photovoltaic applications. J. Energy Storage 2021, 34, 102184. [Google Scholar] [CrossRef]
- Wang, Z.-H.; Hendrick; Horng, G.-J.; Wu, H.-T.; Jong, G.-J. A prediction method for voltage and lifetime of lead-acid battery by using machine learning. Energy Explor. Exploit. 2019, 38, 310–329. [Google Scholar] [CrossRef]
- Demirci, O.; Taskin, S. Development of measurement and analyses system to estimate test results for lead-acid starter batteries. J. Energy Storage 2021, 34, 102172. [Google Scholar] [CrossRef]
- Křivík, P.; Vaculík, S.; Bača, P.; Kazelle, J. Determination of state of charge of lead-acid battery by EIS. J. Energy Storage 2019, 21, 581–585. [Google Scholar] [CrossRef]
- Raji, S.; Kubba, Z.M. Design and Simulation of Lead-Acid Battery. J. Al-Nahrain Univ. Sci. 2020, 23, 39–44. [Google Scholar] [CrossRef]
- Laadissi, M.; Filali, A.; Zazi, M.; Ballouti, A. Comparative Study of Lead Acid Battery Modelling. ARPN J. Eng. Appl. Sci. 2006, 13, 4448–4452. [Google Scholar]
- Shi, M.; Yuan, J.; Dong, L.; Zhang, D.; Li, A.; Zhang, J. Combining physicochemical model with the equivalent circuit model for performance prediction and optimization of lead-acid batteries. Electrochim. Acta 2020, 353, 136567. [Google Scholar] [CrossRef]
- Jiang, S. A Parameter Identification Method for a Battery Equivalent Circuit Model. In SAE Technical Paper 1; SAE International: Warrendale, PA, USA, 2011. [Google Scholar] [CrossRef]
- Lach, J.; Wróbel, K.; Wróbel, J.; Podsadni, P.; Czerwiński, A. Applications of carbon in lead-acid batteries: A review. J. Solid State Electrochem. 2019, 23, 693–705. [Google Scholar] [CrossRef] [Green Version]
- Zhuravsky, B.V.; Zanin, A.; Kvasov, I.N. Simulation of the electric starter system of the internal combustion engine start-up to study the impact on its operation of the pre-start battery discharge. J. Phys. Conf. Ser. 2020, 1441, 012030. [Google Scholar] [CrossRef] [Green Version]
- Dyga, G.; Pszczółkowski, J. Plan eksperymentu identyfikacji modelu napięcia obciążonego akumulatora kwasowego. Technika Transportu Szynowego. 2015, 12, 1843–1849. [Google Scholar]
- Chang, W.-Y. The State of Charge Estimating Methods for Battery: A Review. ISRN Appl. Math. 2013, 2013, 953792. [Google Scholar] [CrossRef]
- Nikdel, M. Various battery models for various simulation studies and applications. Renew. Sustain. Energy Rev. 2014, 32, 477–485. [Google Scholar] [CrossRef]
- Moubayed, N.; Kouta, J.; El-Ali, A.; Dernayka, H.; Outbib, R. Parameter identification of the lead-acid battery model. In Proceedings of the 2008 33rd IEEE Photovolatic Specialists Conference, San Diego, CA, USA, 11–16 May 2008; pp. 1–6. [Google Scholar] [CrossRef]
- Pszczółkowski, J.; Dyga, G. Dwuwymiarowe liniowe zależności funkcyjne napięcia akumulatora kwasowego. Logistyka 2014, 6, 8984–8995. [Google Scholar]


Publisher’s Note: MDPI stays neutral with regard to jurisdictional claims in published maps and institutional affiliations. |
© 2021 by the author. Licensee MDPI, Basel, Switzerland. This article is an open access article distributed under the terms and conditions of the Creative Commons Attribution (CC BY) license (https://creativecommons.org/licenses/by/4.0/).