
Life Cycle Climate Change Impact of a Cost-Optimal HVDC Connection to Import Solar Energy from Australia to Singapore

 ,
,  , ,
, ,  , and
, and
Abstract
:1. Introduction
1.1. Background
1.2. Literature Review
1.3. Contribution of This Paper
2. Materials and Methods
2.1. Methods
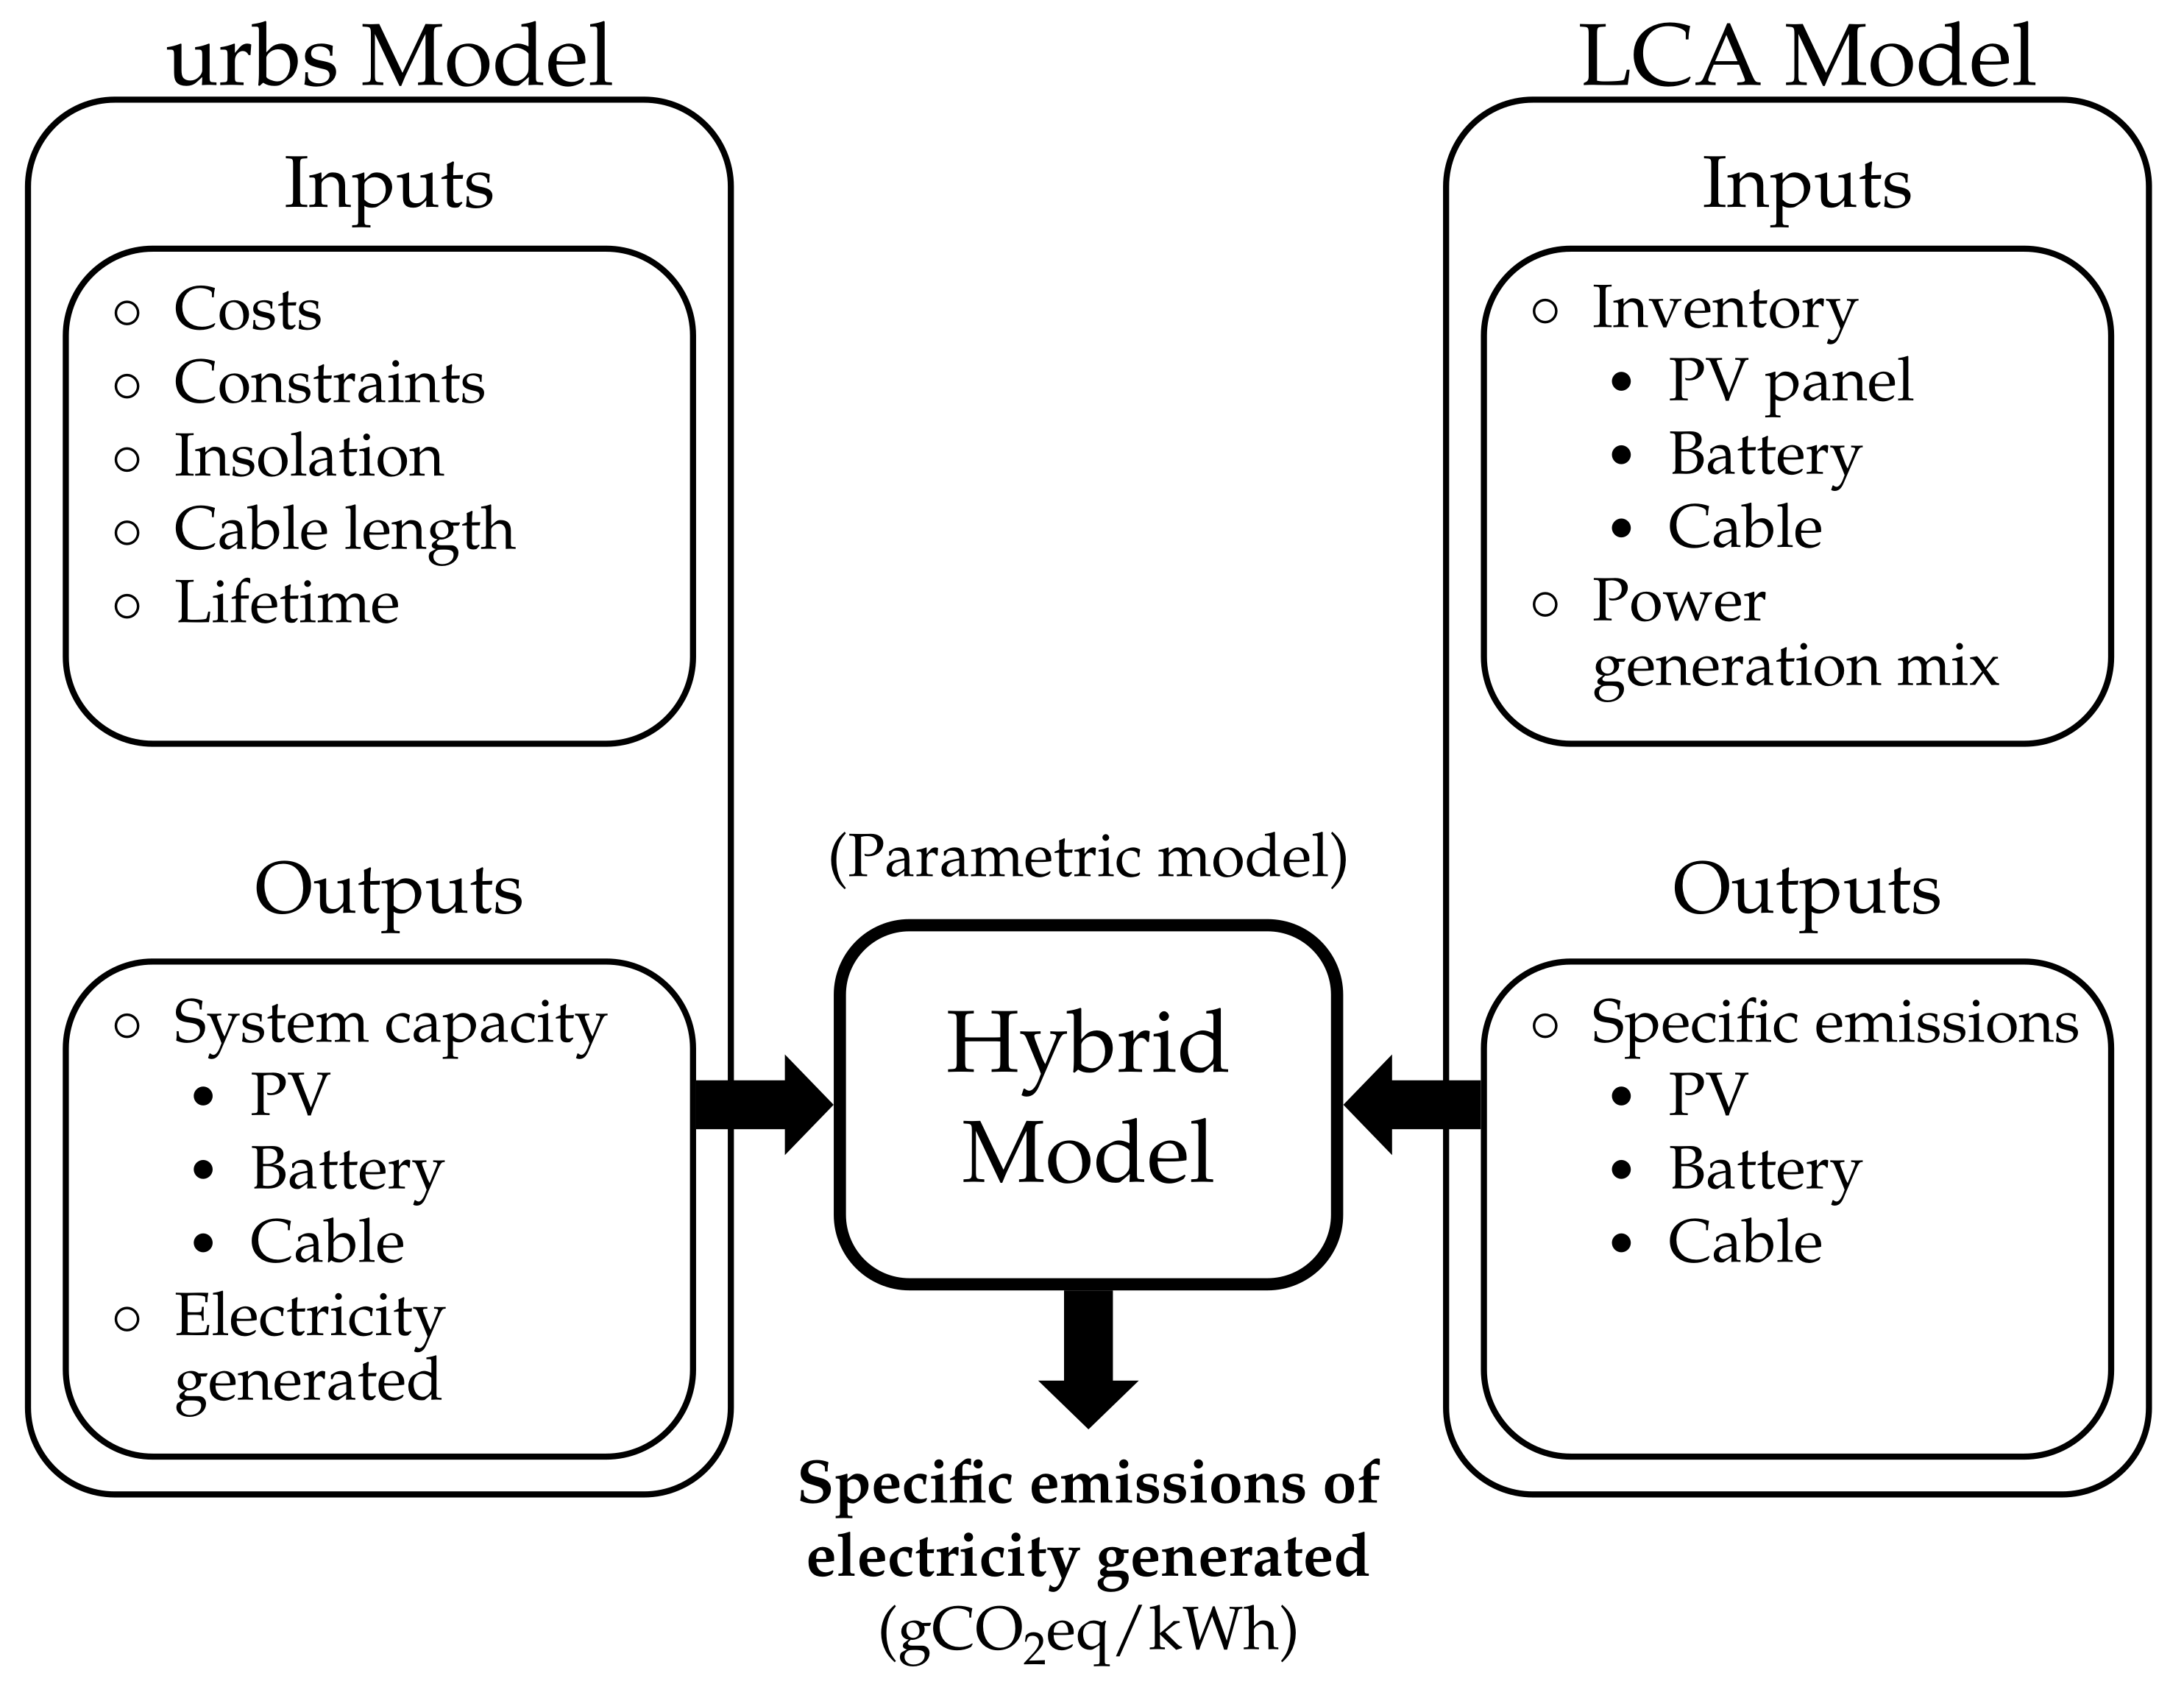
2.1.1. Workflow
2.1.2. Cost Optimization with urbs
2.1.3. Life Cycle Assessment
2.2. Data
2.2.1. Data for the urbs Model
2.2.2. Life Cycle Inventory
3. Scenarios and Results
3.1. Scenarios
3.1.1. Reference Scenario
3.1.2. Scenarios in the LCA Model
Electricity Mix
Heat Source
Metals
Cable Models
3.1.3. Scenarios in the urbs Model
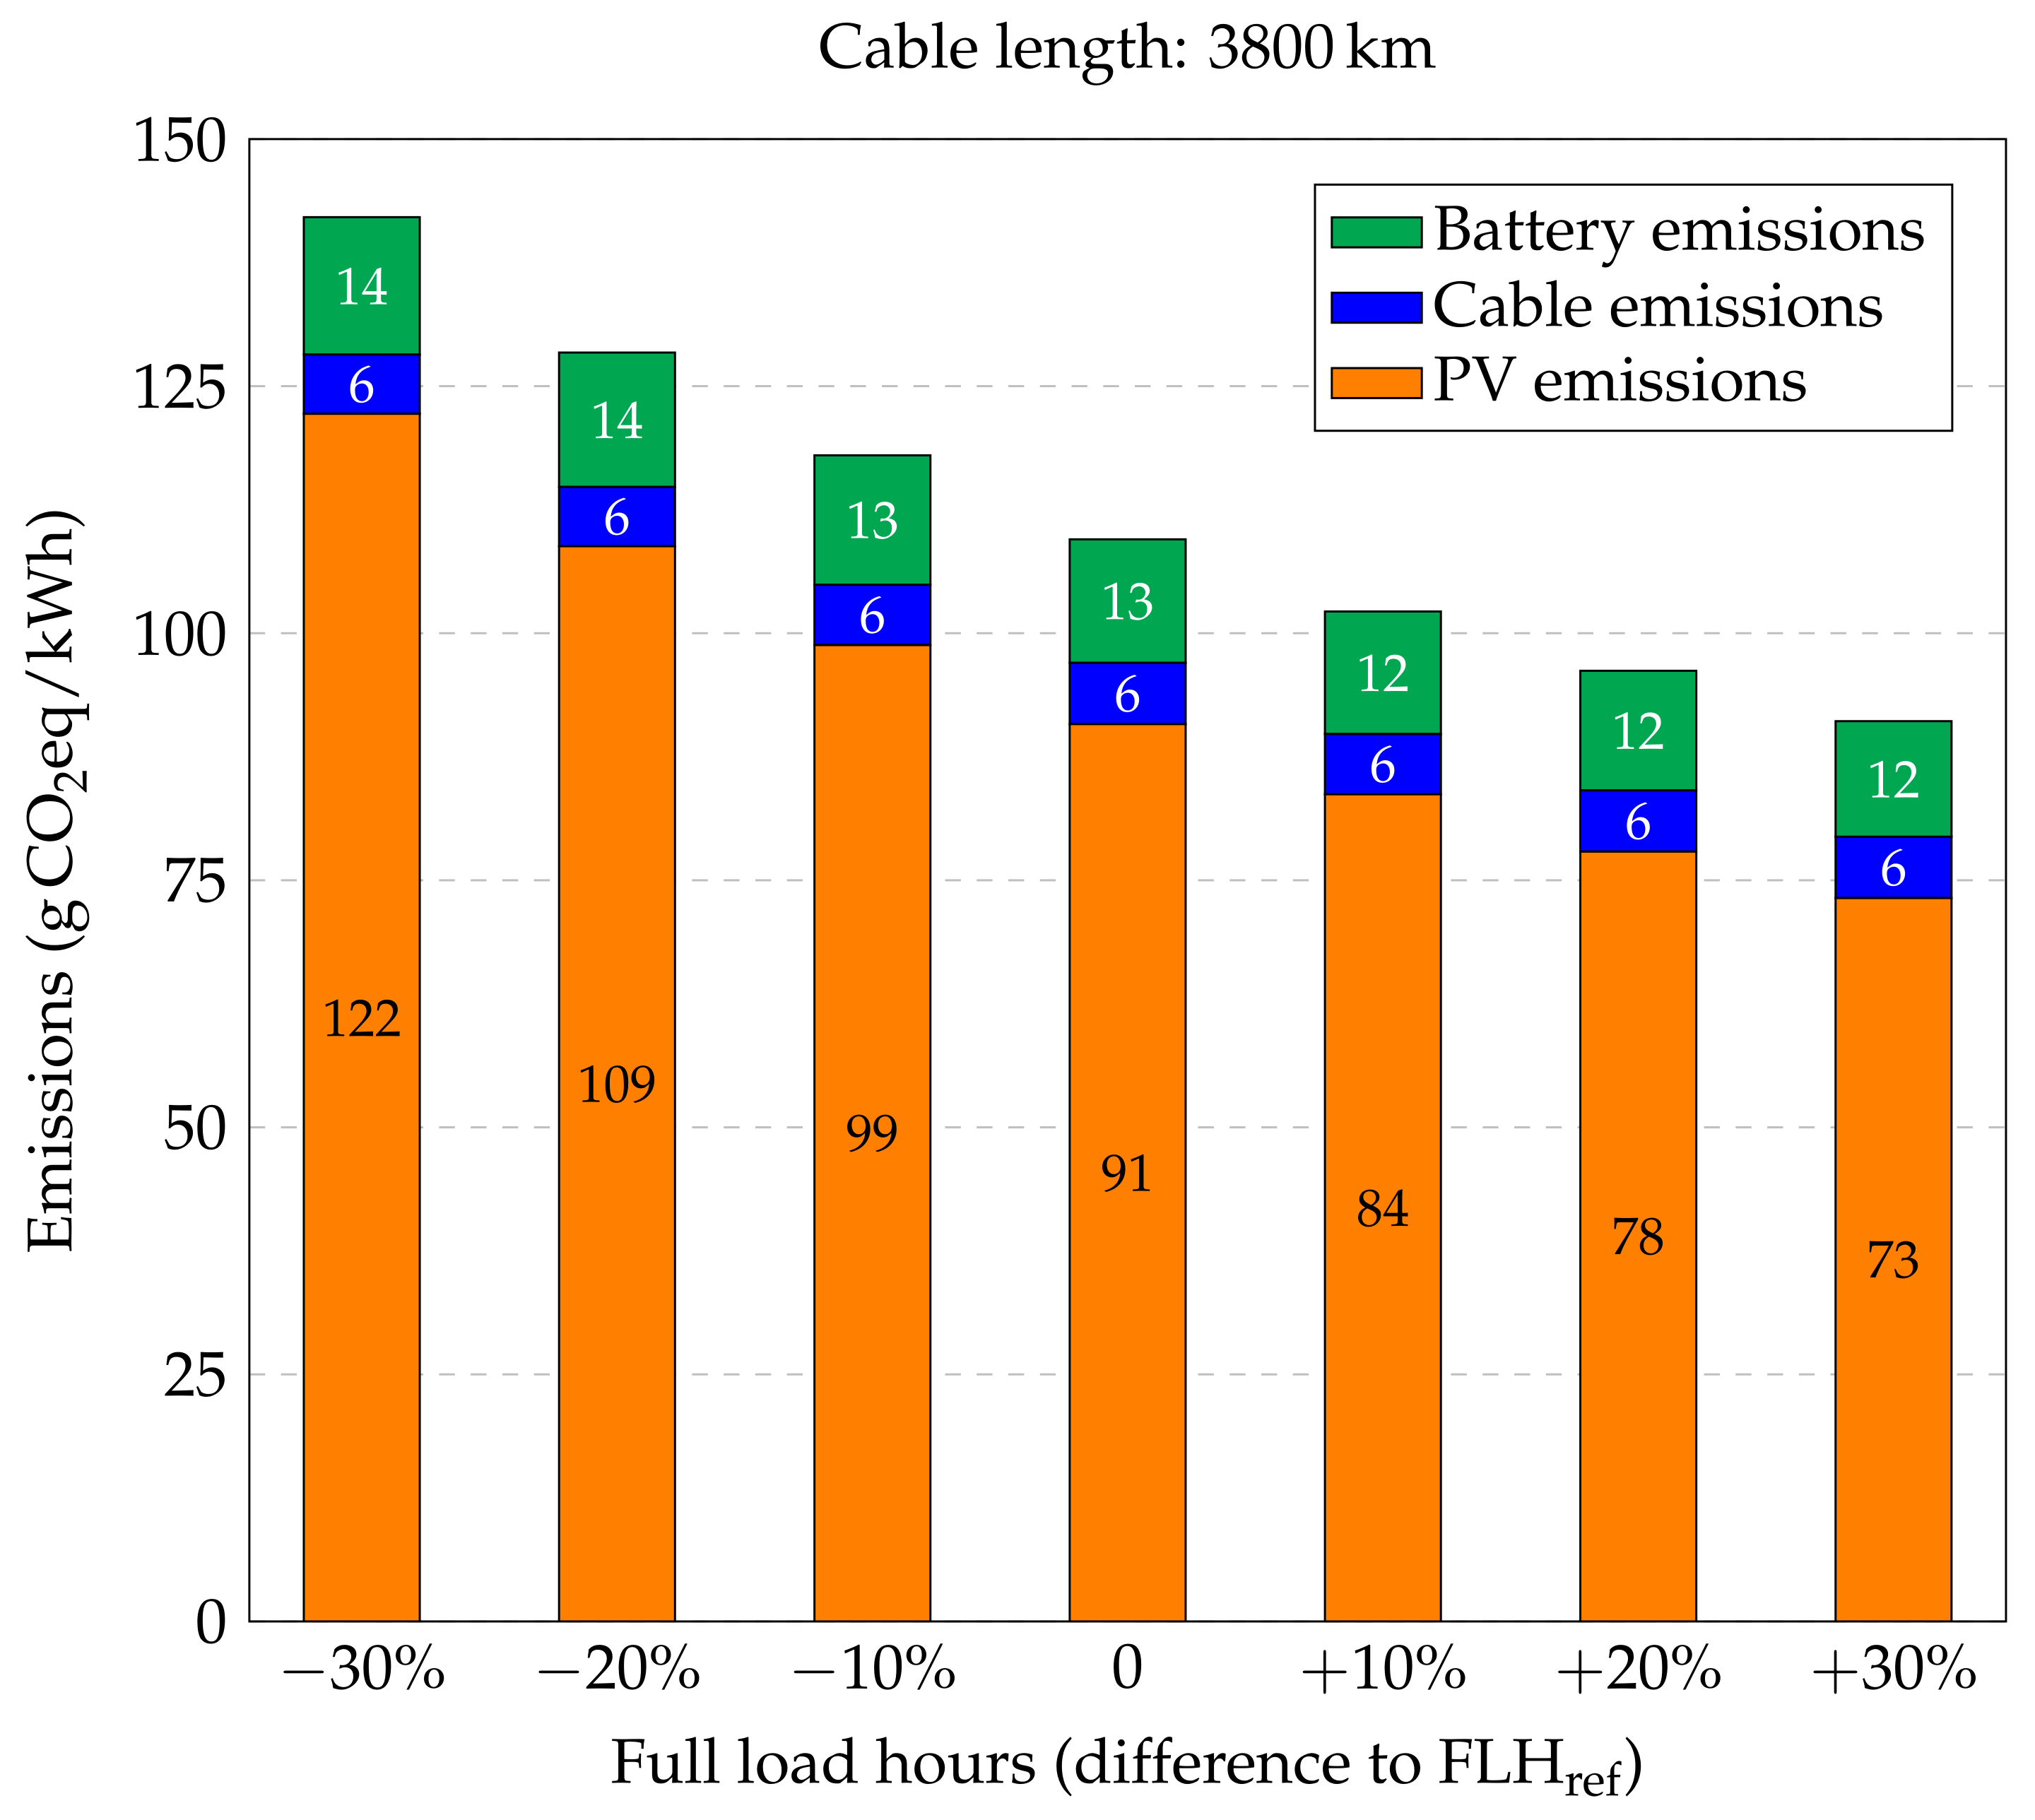
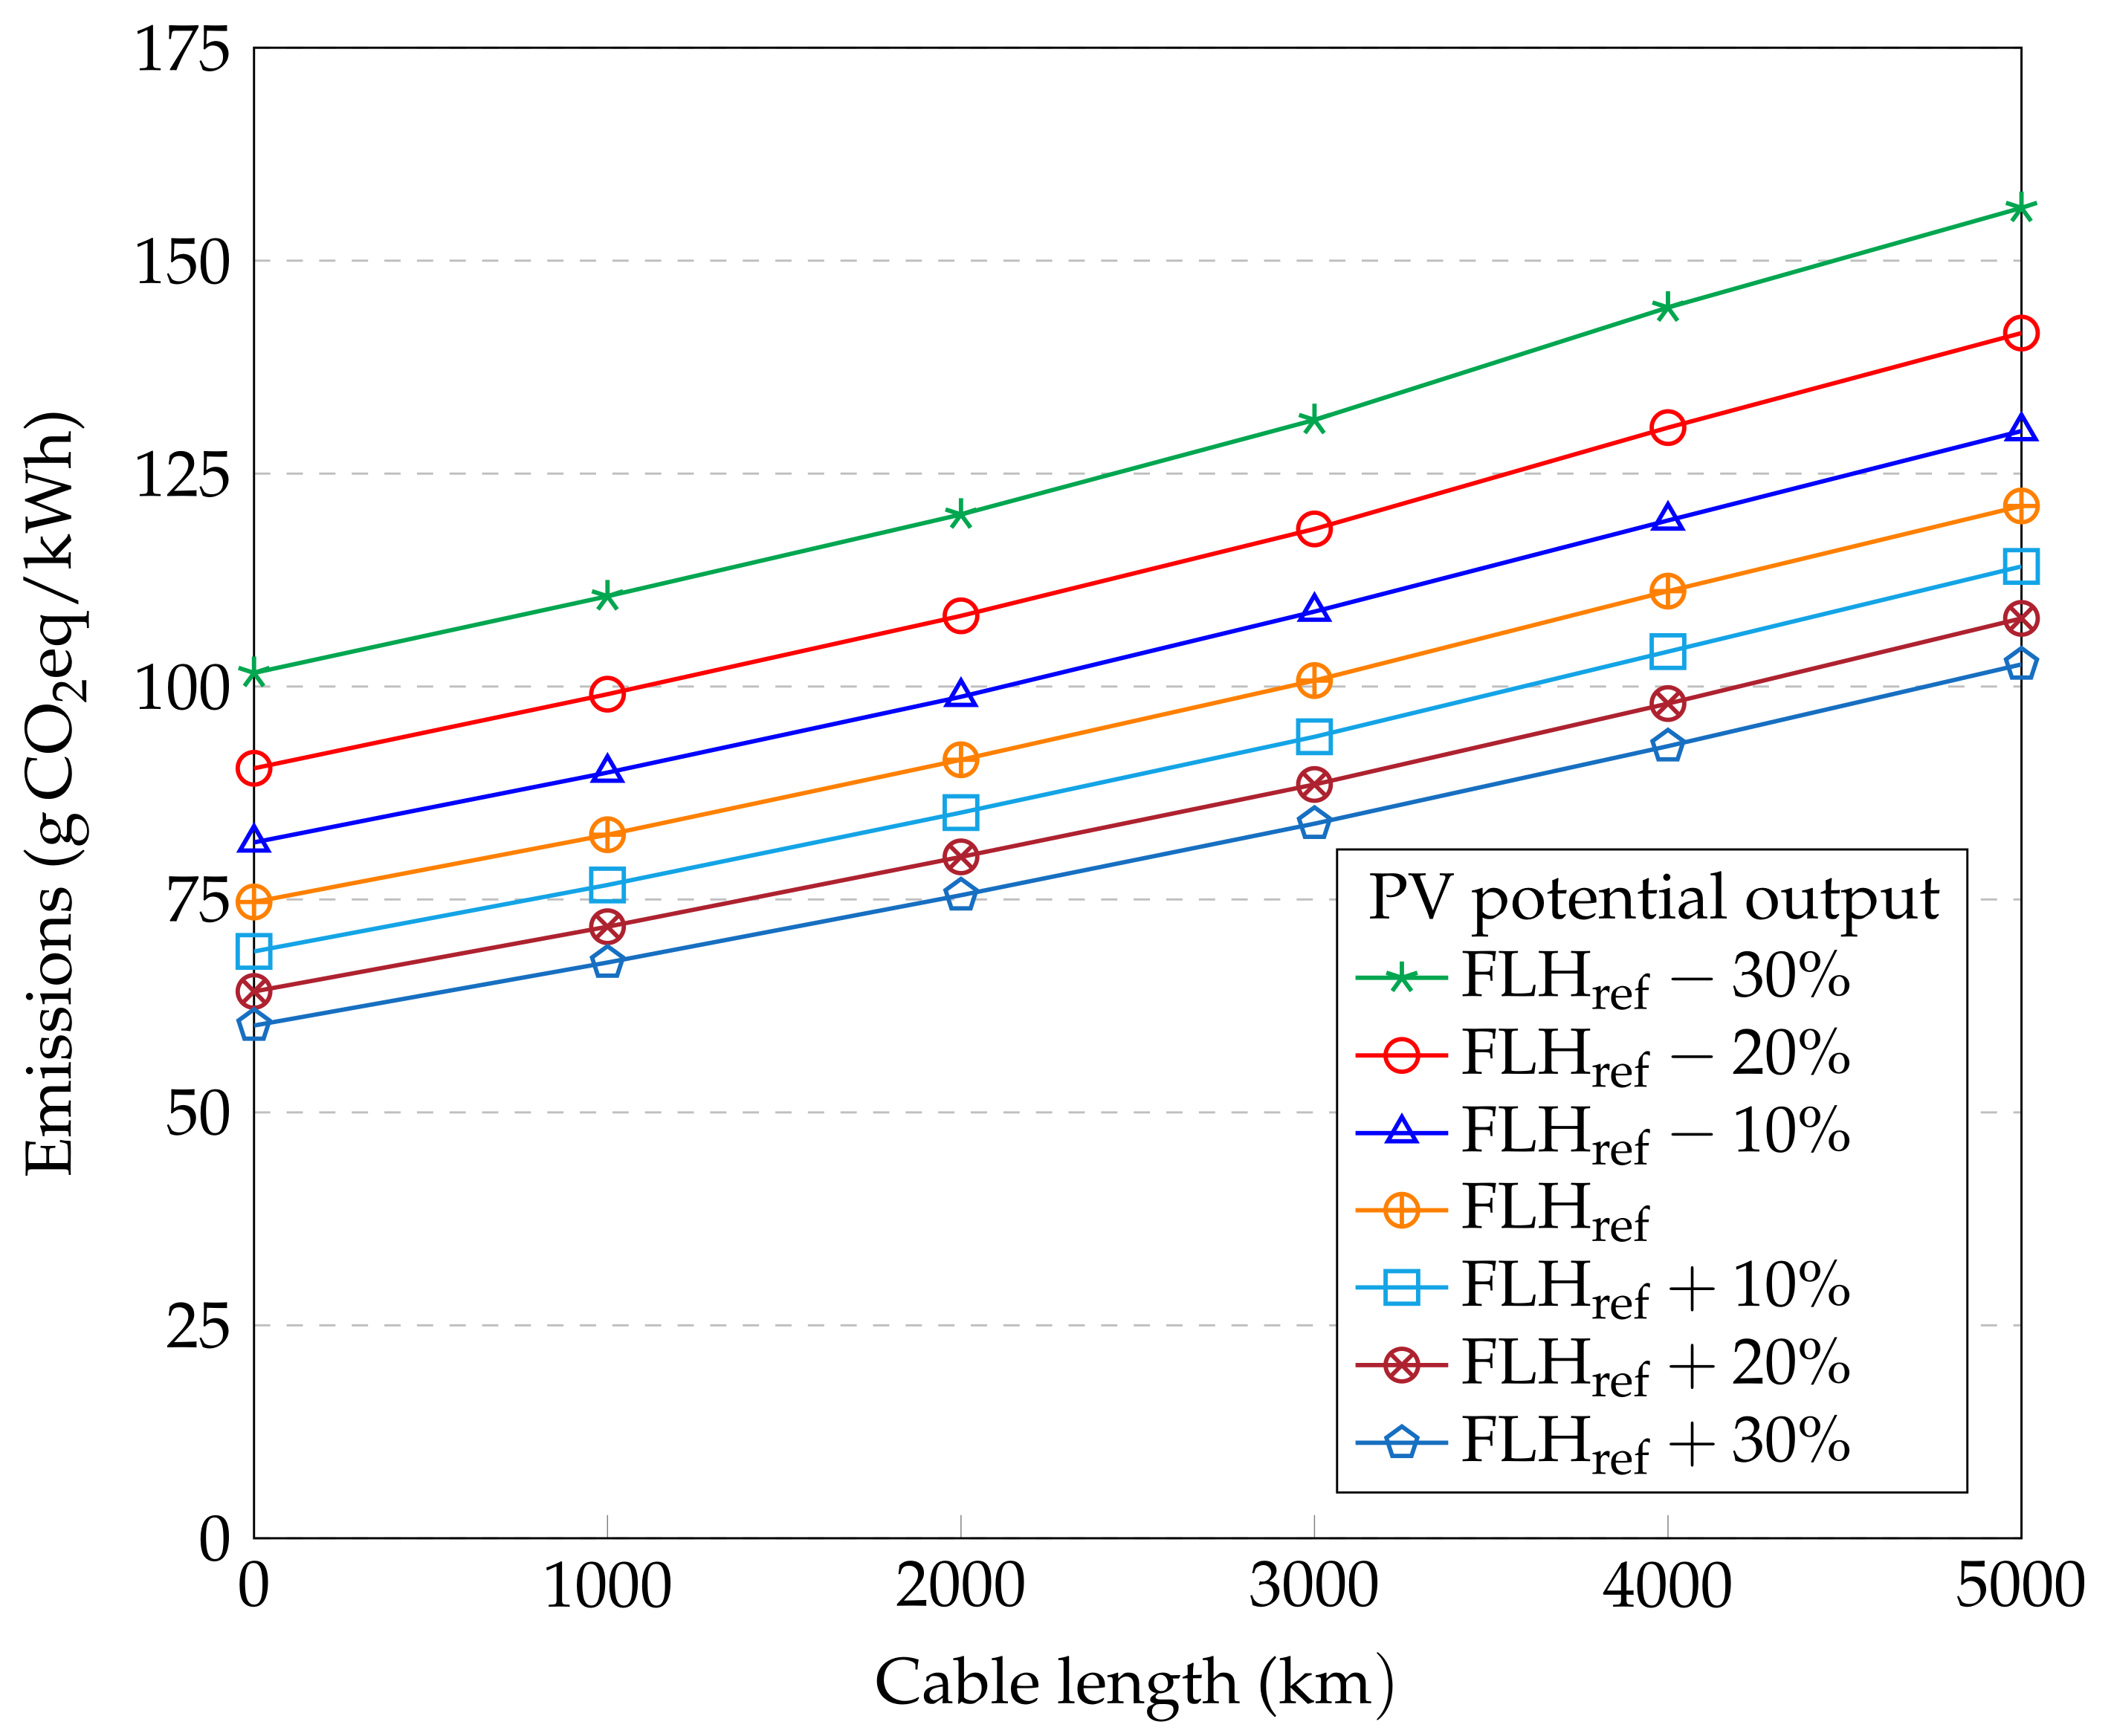
- Effective solar potential: variation in steps of 10% between and ;
- Cable length: variation between 0 and 5000 km in steps of 1000 km, in addition to the reference length of 3800 km.
3.2. Results
3.2.1. Reference Scenario
- Battery storage system: 97 CO2/
- Solar PV panels: 2330 CO2/
- Cable: 270 CO2/
- Total: 110 CO2/
3.2.2. Scenarios in the LCA Model
Battery Storage System
Photovoltaics
Cable
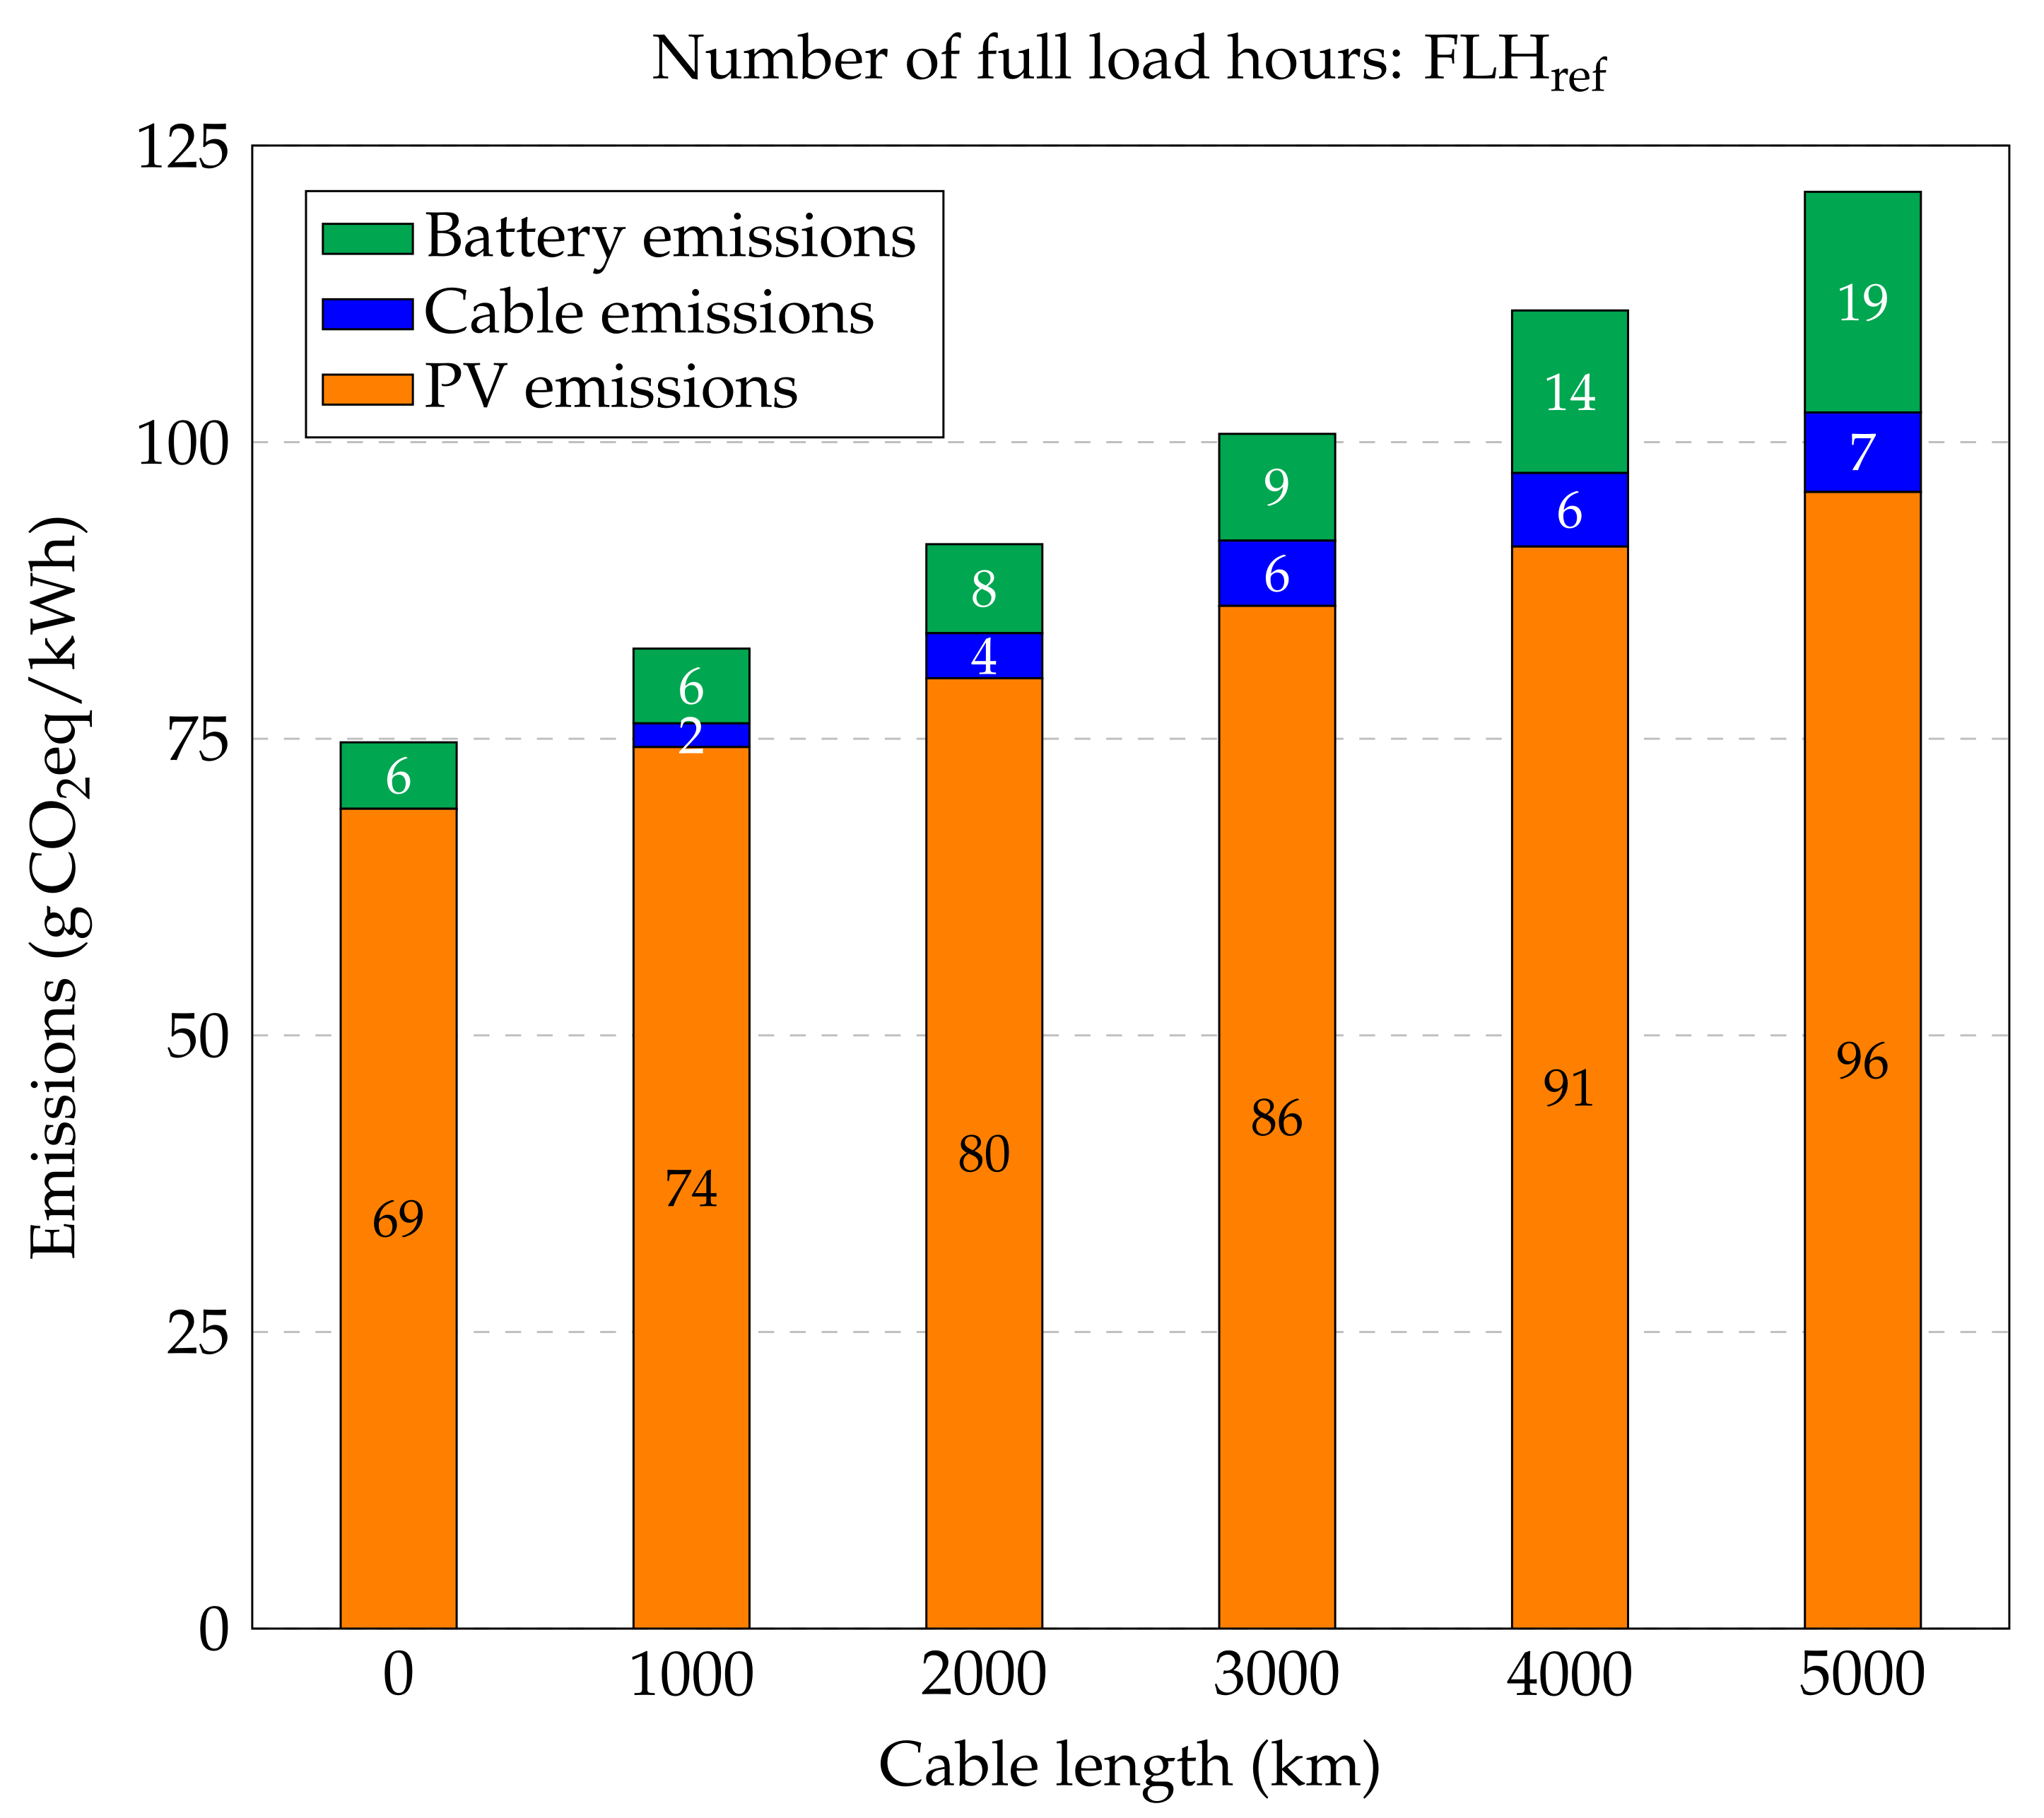
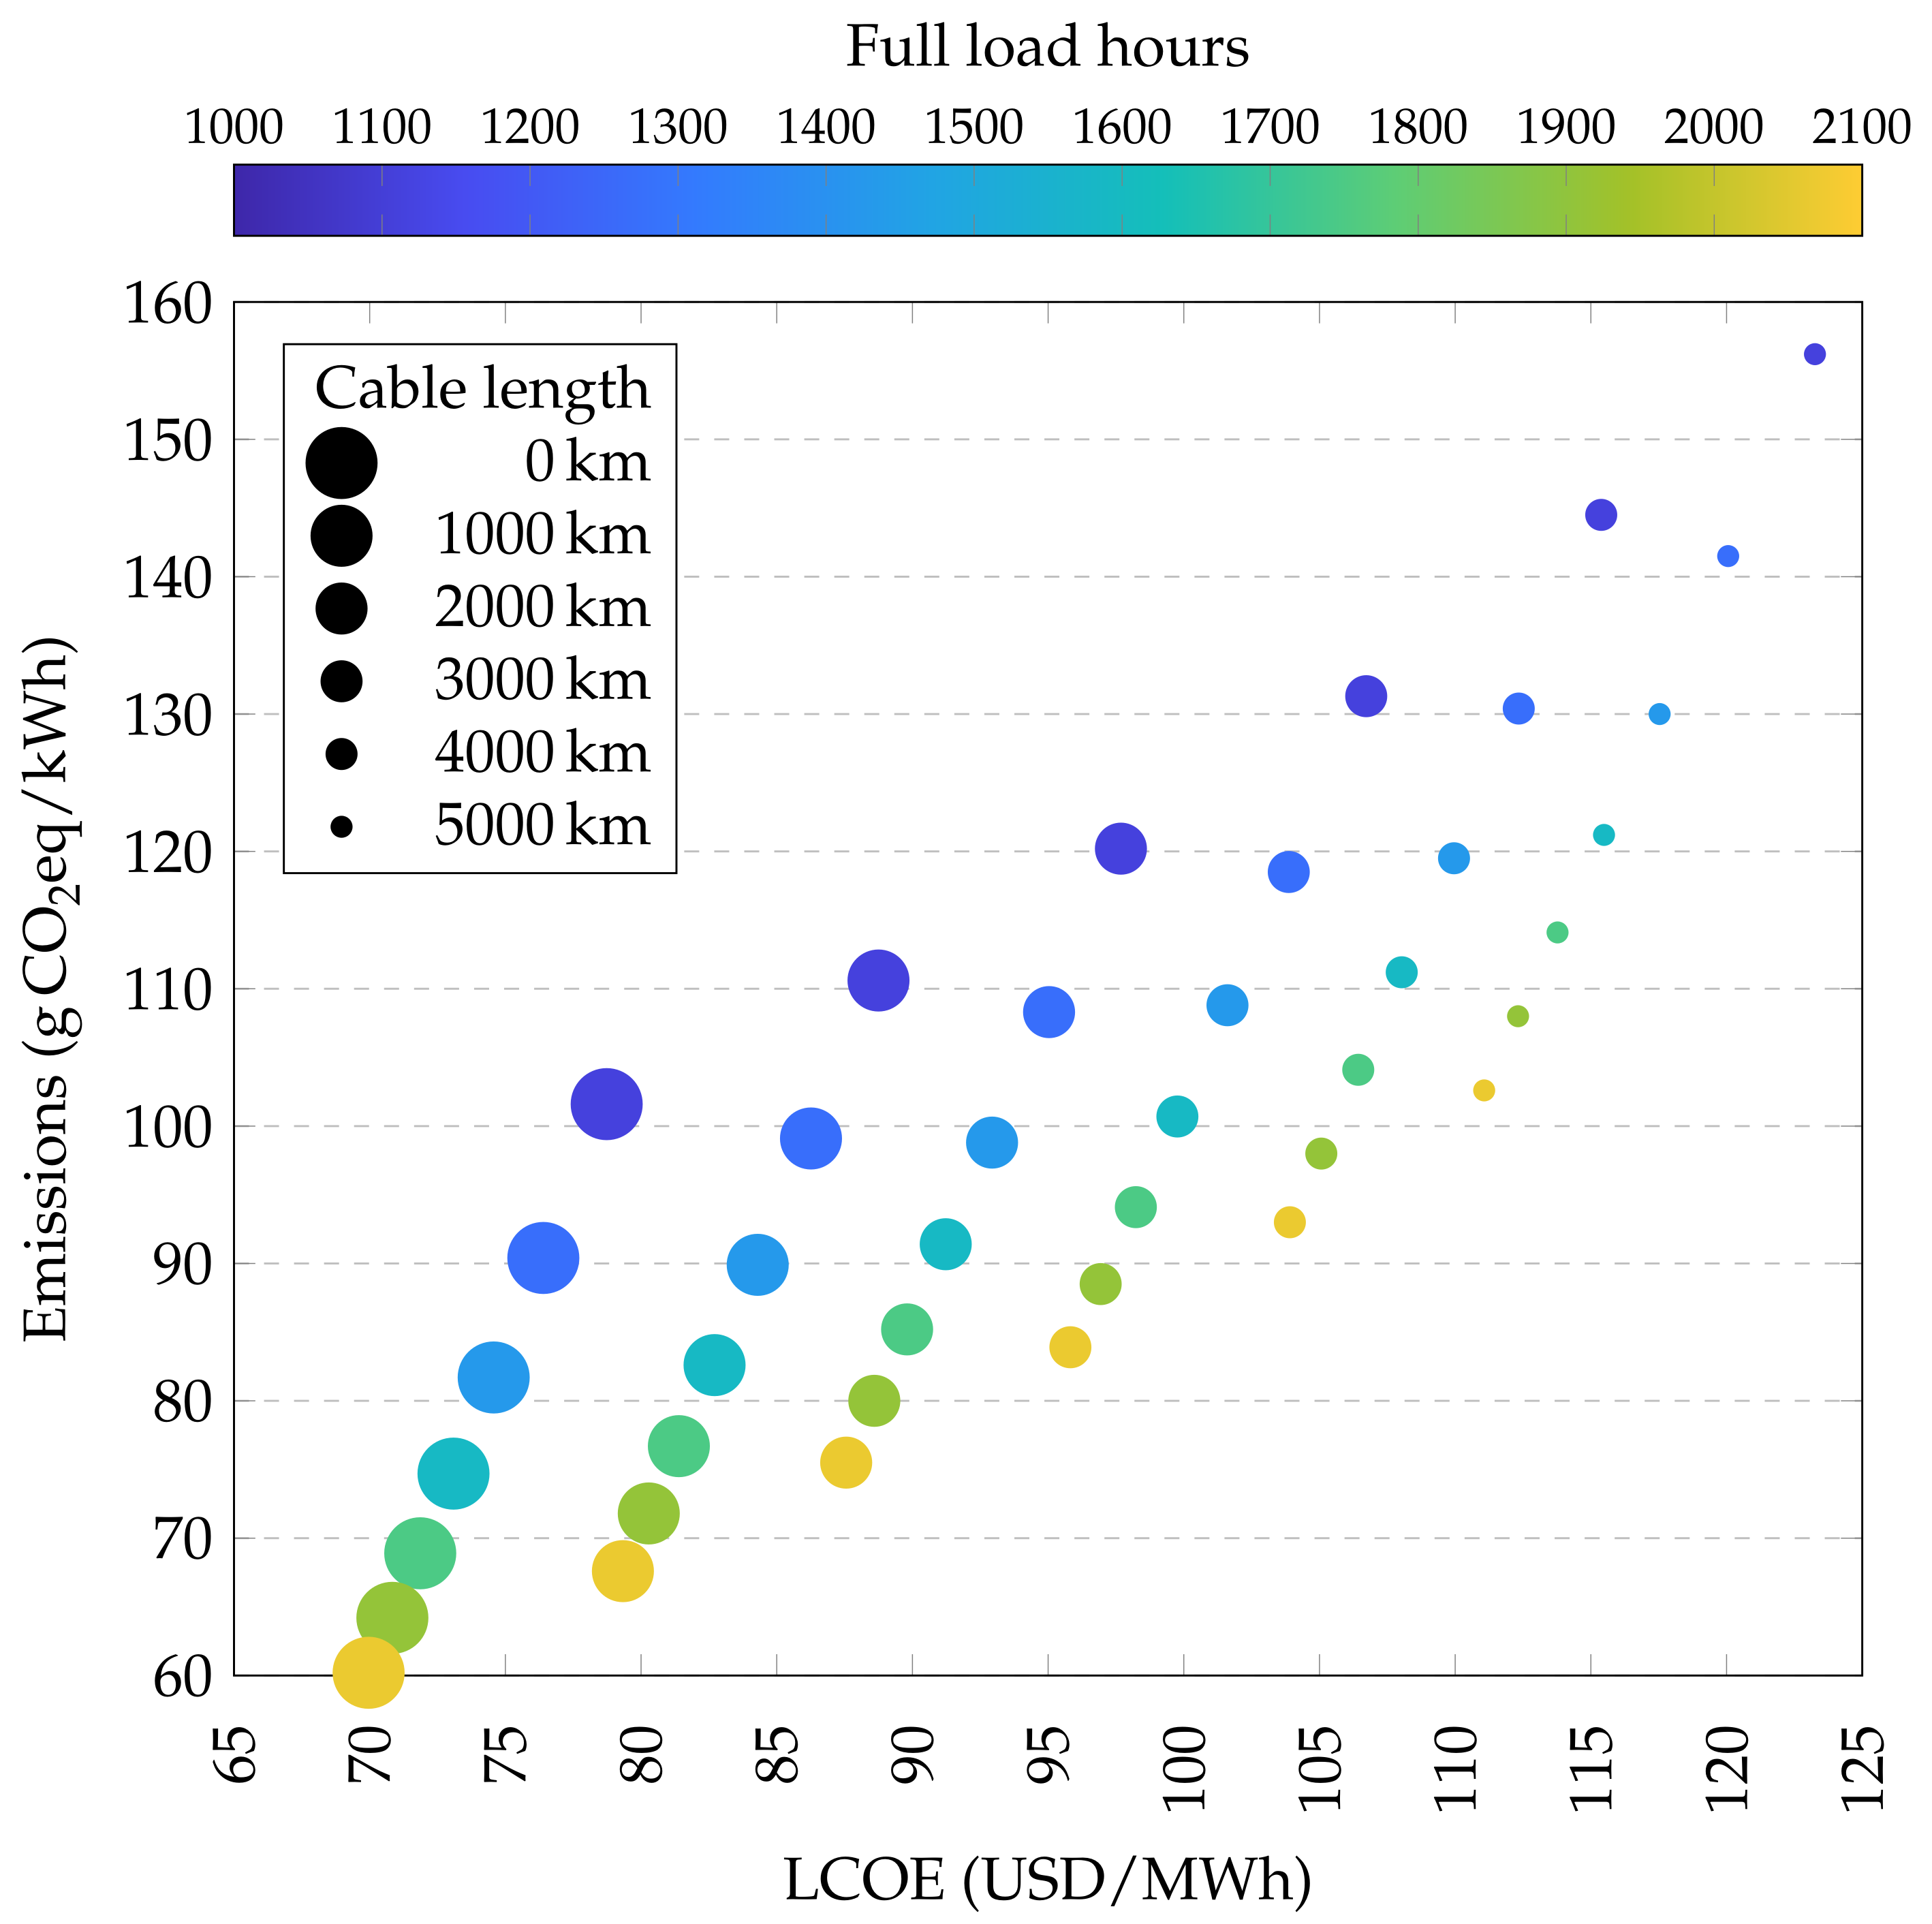
3.2.3. Scenarios in the urbs Model
3.2.4. Impact of Land Use Change
4. Conclusions
Author Contributions
Funding
Institutional Review Board Statement
Informed Consent Statement
Data Availability Statement
Conflicts of Interest
Abbreviations
| ASEAN | Association of Southeast Asian Nations |
| CCGT | combined cycle gas turbine |
| FLH | full-load hour |
| GHG | greenhouse gas |
| HVDC | high-voltage direct current |
| LCA | life cycle assessment |
| LCI | life cycle inventory |
| LCOE | levelized cost of electricity |
| LUC | land use change |
| PV | photovoltaic |
Appendix A

| Parameter | Unit | Value | Source |
|---|---|---|---|
| Weighted Average Cost of Capital | % | 7 | assumption |
| Solar PV investment costs | USD/MW | 880,000 | [38] |
| Solar PV fixed O&M costs | USD/MW | 15,000 | [38] |
| Solar PV lifetime | years | 25 | [38] |
| Subsea HVDC cable investment costs | USD/MWkm | 1270 | [39] |
| Converter station investment costs | USD/MW | 176,000 | [39] |
| Subsea HVDC cable fixed O&M costs | USD/MWkm | 23,100 | [39] |
| Subsea HVDC cable losses | %/1000 km | 5 | assumption |
| Subsea HVDC cable lifetime | years | 40 | [38] |
| Battery storage capacity investment costs | USD/MWh | 281,000 | [38] |
| Battery charging capacity investment costs | USD/MW | 143,000 | [38] |
| Battery charging fixed O&M costs | USD/MW | 2000 | [38] |
| Battery lifetime | years | 10 | [38] |
| Scenario | Specific Emissions (kg COeq/kW) | Total Emissions (g COeq/kWh) | ||
|---|---|---|---|---|
| Absolute | (Diff.) | Absolute | (Diff.) | |
| Reference | 97 | 109 | ||
| Electricity (nuclear) | 80 | (−17.5%) | 107 | (−1.8%) |
| Electricity (lignite) | 107 | (10.3%) | 111 | (1.8%) |
| Heat (natural gas) | 97 | (0.0%) | 109 | (0.0%) |
| Heat (oil) | 101 | (4.1%) | 110 | (0.9%) |
| Heat (heat pump) | 96 | (−1.0%) | 109 | (0.0 %) |
| Aluminum (R) | 78 | (−19.6%) | 107 | (−1.8%) |
| Aluminum (P) | 107 | (10.3%) | 111 | (1.8%) |
| Scenario | Specific Emissions (kg COeq/kW) | Total Emissions (g COeq/kWh) | ||
|---|---|---|---|---|
| Absolute | (Diff.) | Absolute | (Diff.) | |
| Reference | 273 | 109 | ||
| Arvesen [23]—Lit. | 308 | (12.8%) | 110 | (0.9%) |
| Birkeland [34]—Lit. | 215 | (−21.2%) | 108 | (−0.9%) |
| May [48]—Calc. | 248 | (−9.1%) | 109 | (0.0%) |
| ABB [49]—Calc. | 252 | (−7.7%) | 109 | (0.0%) |
| Birkeland [34]—Calc. | 344 | (26.0%) | 111 | (1.8%) |
| [34]—Calc. (reference) | 344 | 111 | ||
| [34]—Calc.—Steel (R) | 304 | (−11.6%) | 110 | (−0.8%) |
| [34]—Calc.—Steel (P) | 375 | (9.1%) | 112 | (0.6%) |
| [34]—Calc.—Copper (R) | 315 | (−8.4%) | 110 | (−0.6%) |
| [34]—Calc.—Copper (P) | 363 | (5.5%) | 111 | (0.4%) |


References
- National Climate Change Secretariat. Singapore’s Climate Action Plan: Take Action Today, for a Carbon-Efficient Singapore Technical Report. NCCS. 2016. Available online: https://www.nccs.gov.sg/docs/default-source/publications/take-action-today-for-a-carbon-efficient-singapore.pdf (accessed on 23 February 2021).
- Karthikeya, B.R.; Negi, P.S.; Srikanth, N. Wind resource assessment for urban renewable energy application in Singapore. Renew. Energy 2016, 87, 403–414. [Google Scholar] [CrossRef]
- National Climate Change Secretariat. Singapore’s Approach to Alternative Energy. 2020. Available online: https://www.nccs.gov.sg/singapores-climate-action/singapore-approach-to-alternative-energy/ (accessed on 3 February 2021).
- Solar Energy Research Institute of Singapore (SERIS). Update of the Solar Photovoltaic (PV) Roadmap for Singapore; Technical Report; SERIS, National University of Singapore: Singapore, 2020; Available online: http://www.seris.sg/doc/publications/Update-of-the-Solar-Roadmap-for-Singapore-(March-2020).pdf (accessed on 16 June 2020).
- Stich, J.; Mannhart, M.; Zipperle, T.; Massier, T.; Huber, M. Modelling a Low-carbon Power System for Indonesia, Malaysia and Singapore. In Proceedings of the 33rd International Energy Workshop; ERI-NDRC: Beijing, China, 2014; pp. 1–11. [Google Scholar] [CrossRef]
- Quek, T.Y.A.; Alvin Ee, W.L.; Chen, W.; Ng, T.A. Environmental Impacts of Transitioning to Renewable Electricity for Singapore and the Surrounding Region: A Life Cycle Assessment. J. Clean. Prod. 2019, 214, 1–11. [Google Scholar] [CrossRef]
- Siala, K.; Stich, J. Estimation of the PV Potential in ASEAN with a High Spatial and Temporal Resolution. Renew. Energy 2016, 88, 445–456. [Google Scholar] [CrossRef]
- Stich, J.; Ramachandran, S.; Hamacher, T.; Stimming, U. Techno-economic Estimation of the Power Generation Potential from Biomass Residues in Southeast Asia. Energy 2017, 135, 930–942. [Google Scholar] [CrossRef]
- Stich, J.; Massier, T. Enhancing the Integration of Renewables by Trans-border Electricity Trade in ASEAN. In Proceedings of the 2015 IEEE PES Asia-Pacific Power and Energy Engineering Conference (APPEEC), Brisbane, Australia, 15–18 November 2015; pp. 1–5. [Google Scholar] [CrossRef]
- Ahmed, T.; Mekhilef, S.; Shah, R.; Mithulananthan, N.; Seyedmahmoudian, M.; Horan, B. ASEAN Power Grid: A Secure Transmission Infrastructure for Clean and Sustainable Energy for South-East Asia. Renew. Sustain. Energy Rev. 2017, 67, 1420–1435. [Google Scholar] [CrossRef]
- Ahmed, T.; Mekhilef, S.; Shah, R.; Mithulananthan, N. Investigation into Transmission Options for Cross-border Power Trading in ASEAN Power Grid. Energy Policy 2017, 108, 91–101. [Google Scholar] [CrossRef]
- Huang, Y.W.; Kittner, N.; Kammen, D.M. ASEAN Grid Flexibility: Preparedness for Grid Integration of Renewable Energy. Energy Policy 2019, 128, 711–726. [Google Scholar] [CrossRef]
- Jiang, H.; Gao, Y.; Xu, P.; Li, J. Study of Future Power Interconnection Scheme in ASEAN. Glob. Energy Interconnect. 2019, 2, 549–559. [Google Scholar] [CrossRef]
- Sun Cable. Sun Cable—The World’s Largest Solar Energy Infrastructure Project. 2019. Available online: https://www.suncable.sg/ (accessed on 7 August 2020).
- Halawa, E.; James, G.; Shi, X.R.; Sari, N.H.; Nepal, R. The Prospect for an Australian–Asian Power Grid: A Critical Appraisal. Energies 2018, 11, 200. [Google Scholar] [CrossRef] [Green Version]
- Blakers, A.; Luther, J.; Nadolny, A. Asia Pacific Super Grid—Solar Electricity Generation, Storage and Distribution. Green—Int. J. Sustain. Energy Convers. Storage 2012, 2, 189–202. [Google Scholar] [CrossRef]
- Lu, B.; Blakers, A.; Stocks, M.; Do, T.N. Low-cost, Low-emission 100% Renewable Electricity in Southeast Asia Supported by Pumped Hydro Storage. Energy 2021, 236, 121387. [Google Scholar] [CrossRef]
- Wang, C.; Dargaville, R.; Jeppesen, M. Power system decarbonisation with Global Energy Interconnection—A case study on the economic viability of international transmission network in Australasia. Glob. Energy Interconnect. 2018, 1, 507–519. [Google Scholar] [CrossRef]
- Itiki, R.; Manjrekar, M.; Di Santo, S.G.; Machado, L.F.M. Technical feasibility of Japan-Taiwan-Philippines HVdc interconnector to the Asia Pacific Super Grid. Renew. Sustain. Energy Rev. 2020, 133, 110161. [Google Scholar] [CrossRef]
- Gulagi, A.; Bogdanov, D.; Breyer, C. A Cost Optimized Fully Sustainable Power System for Southeast Asia and the Pacific Rim. Energies 2017, 10, 583. [Google Scholar] [CrossRef] [Green Version]
- Boie, I.; Kost, C.; Bohn, S.; Agsten, M.; Bretschneider, P.; Snigovyi, O.; Pudlik, M.; Ragwitz, M.; Schlegl, T.; Westermann, D. Opportunities and challenges of high renewable energy deployment and electricity exchange for North Africa and Europe—Scenarios for power sector and transmission infrastructure in 2030 and 2050. Renew. Energy 2016, 87, 130–144. [Google Scholar] [CrossRef]
- Jorge, R.S.; Hawkins, T.R.; Hertwich, E.G. Life cycle assessment of electricity transmission and distribution – Part 1: Power lines and cables. Int. J. Life Cycle Assess. 2012, 17, 9–15. [Google Scholar] [CrossRef]
- Arvesen, A.; Nes, R.N.; Huertas-Hernando, D.; Hertwich, E.G. Life Cycle Assessment of an Offshore Grid Interconnecting Wind Farms and Customers Across the North Sea. Int. J. Life Cycle Assess. 2014, 19, 826–837. [Google Scholar] [CrossRef] [Green Version]
- Harrison, G.P.; Maclean, E.N.J.; Karamanlis, S.; Ochoa, L.F. Life Cycle Assessment of the Transmission Network in Great Britain. Energy Policy 2010, 38, 3622–3631. [Google Scholar] [CrossRef] [Green Version]
- Jorge, R.S.; Hertwich, E.G. Environmental Evaluation of Power transmission in Norway. Appl. Energy 2013, 101, 513–520. [Google Scholar] [CrossRef] [Green Version]
- Kiss, B.; Kácsor, E.; Szalaya, Z. Environmental assessment of future electricity mix—Linking an hourly economic model with LCA. J. Clean. Prod. 2020, 264, 121536. [Google Scholar] [CrossRef]
- Orfanos, N.; Mitzelos, D.; Sagani, A.; Dedoussis, V. Life-cycle environmental performance assessment of electricity generation and transmission systems in Greece. Renew. Energy 2019, 139, 1447–1462. [Google Scholar] [CrossRef]
- Dorfner, J.; Schönleber, K.; Dorfner, M.; Candas, S.; Leonhard, B.; Odersky, L.; Ozsahin, Y.; Zipperle, T.; Herzog, S.; Siala, K.; et al. urbs v1.0.1: A Linear Optimisation Model for Distributed Energy Systems. Software Repository. 2019. Available online: https://urbs.readthedocs.io/en/latest/ (accessed on 19 October 2021). [CrossRef]
- Siala, K.; urbs Model for the SunCable Project. Software Repository. 2021. Available online: https://zenodo.org/record/4486189#.YXuQM55BxPY (accessed on 1 February 2021). [CrossRef]
- Energy Market Authority of Singapore. 2020. Available online: https://www.ema.gov.sg/statistic.aspx?sta_sid=20140802apItNJRIa9Pa (accessed on 10 December 2020).
- International Organization for Standardization Central Secretary. Environmental Management—Life Cycle Assessment—Principles and Framework; Standard ISO 14040:2006; International Organization for Standardization: Geneva, Switzerland, 2006; Available online: https://www.iso.org/standard/37456.html (accessed on 10 December 2020).
- International Organization for Standardization Central Secretary. Environmental Management—Life Cycle Assessment—Requirements and Guidelines; Standard ISO 14044:2006; International Organization for Standardization: Geneva, Switzerland, 2006; Available online: https://www.iso.org/standard/38498.html (accessed on 10 December 2020).
- Ecoinvent. The Ecoinvent Database. 2020. Available online: https://www.ecoinvent.org/database/database.html (accessed on 2 December 2020).
- Birkeland, C. Assessing the Life Cycle Environmental Impacts of Offshore Wind Power Generation and Power Transmission in the North Sea. Master’s Thesis, Norwegian University of Science and Technology (Norges Teknisk-Naturvitenskaplige Universitet), Trondheim, Norway, 2011. [Google Scholar]
- Stocker, T.F.; Qin, D.; Plattner, G.K.; Tignor, M.; Allen, S.K.; Boschung, J.; Nauels, A.; Xia, Y.; Bex, V.; Midgley, P.M. Climate Change 2013: The Physical Science Basis. Contribution of Working Group I to the Fifth Assessment Report of the Intergovernmental Panel on Climate Change; Technical Report; IPCC: Cambridge UK; New York, NY, USA, 2013; Available online: https://www.ipcc.ch/report/ar5/wg1/ (accessed on 24 February 2021).
- Energy Market Authority of Singapore. Electricity Generation Capacity by Generator (Sheet 29RSU). 2020. Available online: https://www.ema.gov.sg/statistic.aspx?sta_sid=20141211PlH5tAbg9BY8 (accessed on 10 December 2020).
- Energy Market Authority. Half-Hourly System Demand Data. 2020. Available online: https://www.ema.gov.sg/statistic.aspx?sta_sid=20140826Y84sgBebjwKV (accessed on 10 December 2020).
- Lacal Arantegui, R.; Jaeger-Waldau, A.; Vellei, M.; Sigfusson, B.; Magagna, D.; Jakubcionis, M.; Perez Fortes, M.d.M.; Lazarou, S.; Giuntoli, J.; Weidner Ronnefeld, E.; et al. ETRI 2014—Energy Technology Reference Indicator Projections for 2010–2050; EUR—Scientific and Technical Research Reports; Joint Research Center of the European Union: Petten, The Netherlands, 2014. [Google Scholar] [CrossRef]
- Lauria, D.; Mazzanti, G.; Quaia, S. Per-unit power costs of traditional and innovative OHLs: A multi-criteria comparison. IET Gener. Transm. Distrib. 2016, 10, 3033–3040. [Google Scholar] [CrossRef]
- International Energy Agency. World Energy Outlook 2019; OECD Publishing: Paris, France, 2019. [Google Scholar] [CrossRef]
- Siala, K.; Houmy, H. tum-ens/pyGRETA: Python Generator of REnewable Time Series and mAps. Software Repository. 2020. Available online: https://zenodo.org/record/3872068#.YXuTBZ5BxPY (accessed on 1 February 2021). [CrossRef]
- REC Group. Factsheet REC Alpha Series; Technical Factsheet; REC Solar Holdings AS: Singapore, 2020; Available online: https://www.recgroup.com/sites/default/files/documents/ds_rec_alpha_series_en_us.pdf (accessed on 5 April 2021).
- Dai, Q.; Kelly, J.C.; Gaines, L.; Wang, M. Life Cycle Analysis of Lithium-Ion Batteries for Automotive Applications. Batteries 2019, 5, 48. [Google Scholar] [CrossRef] [Green Version]
- International Energy Agency. Data and Statistics. 2021. Available online: https://www.iea.org/data-and-statistics?country=WORLD&fuel=Energy%20supply&indicator=TPESbySource (accessed on 5 April 2021).
- NREL. Life Cycle Greenhouse Gas Emissions From Solar Photovoltaics; Technical Report; National Renewable Energy Laboratory: Golden, CO, USA, 2012. Available online: https://www.nrel.gov/docs/fy13osti/56487.pdf (accessed on 15 March 2012).
- Ardelean, M.; Minnebo, P. HVDC Submarine Power Cables in the World; Technical Report EUR 27527 EN; Joint Research Centre, The European Commission: Den Haag, The Netherlands, 2015. [Google Scholar] [CrossRef]
- Mazzanti, G.; Marzinotto, M. Extruded Cables for High-Voltage Direct-Current Transmission: Advances in Research and Development; Wiley-IEEE Press: Hoboken, NJ, USA, 2013; Volume 93. [Google Scholar] [CrossRef]
- May, N. Ecobalance of a Solar Electricity Transmission from North Africa to Europe. Diploma Thesis, Technical University of Braunschweig, Braunschweig, Germany, 2005. [Google Scholar]
- ABB. Submarine Cable Design Sheet—1000 MW. 2014. Available online: http://www.necplink.com/docs/Champlain_VT_electronic/04%20L.%20Eng/Exh.%20TDI-LE-4%20(HVDC%20Cable%20Design%20Sheet%20(ABB)).pdf (accessed on 20 February 2021).
- Gelaro, R.; McCarty, W.; Suárez, M.J.; Todling, R.; Molod, A.; Takacs, L.; Randles, C.A.; Darmenov, A.; Bosilovich, M.G.; Reichle, R.; et al. The Modern-Era Retrospective Analysis for Research and Applications, Version 2 (MERRA-2). J. Clim. 2017, 30, 5419–5454. [Google Scholar] [CrossRef]
- de Atholia, T.; Flannigan, G.; Lai, S. Renewable Energy Investment in Australia; Technical Report; Reserve Bank of Australia: Sydney, Australia, 2020. Available online: https://www.rba.gov.au/publications/bulletin/2020/mar/pdf/renewable-energy-investment-in-australia.pdf (accessed on 2 October 2021).
- European Union. Directive 2009/28/EC of the European Parliament and of the Council of 23 April 2009 on the promotion of the use of energy from renewable sources and amending and subsequently repealing Directives 2001/77/EC and 2003/30/EC. Off. J. Eur. Union 2009, 52, 16–62. [Google Scholar] [CrossRef]
- Silalahi, D.F.; Blakers, A.; Stocks, M.; Lu, B.; Cheng, C.; Hayes, L. Indonesia’s Vast Solar Energy Potential. Energies 2021, 14, 5424. [Google Scholar] [CrossRef]
- Bolton, C. World’s Largest Floating Solar Farm—More Than 2GW—To Supply Singapore. 2021. Available online: https://www.narecsolar.com/worlds-largest-floating-solar-farm-more-than-2gw-to-supply-singapore/ (accessed on 5 October 2021).
- Lammerant, J.; Laureysens, I.; Driesen, K. Potential Impacts of Solar, Geothermal and Ocean Energy on Habitats and Species Protected under the Birds and Habitats Directives. Final Report under EC Contract ENV.D.3/SER/2017/0002; Technical Report; Arcadis Belgium, Institute for European Environmental Policy, BirdLife International, NIRAS, Stella Consulting, Ecosystems Ltd.: Brussels, Belgium, 2020; Available online: https://ec.europa.eu/environment/nature/natura2000/management/docs/POTENTIAL%20IMPACTS%20OF%20SOLAR_%20GEOTHERMAL%20AND%20OCEAN%20ENERGY%20ON%20HABITATS%20AND%20SPECIES%20PROTECTED%20UNDER%20THE%20BIRDS%20AND%20HABITATS%20DIRECTIVES%20-%20Final%20report.pdf (accessed on 5 October 2021).


| Component | Material | Amount (g/kWh) |
| Cell | NMC11 powder | 1767 |
| Graphite | 986 | |
| Carbon black | 119 | |
| Binder | 151 | |
| Copper | 802 | |
| Aluminum | 417 | |
| Electrolyte: LiPF6 | 113 | |
| Electrolyte: ED | 316 | |
| Electrolyte: DMC | 316 | |
| Polypropylene | 77 | |
| Polyethylene | 18 | |
| Polyethylene terephthalate | 14 | |
| Module | Copper | 18 |
| Aluminum | 307 | |
| Polypropylene | 8 | |
| Insulation | 5 | |
| Electronic parts | 48 | |
| Pack | Copper | 4 |
| Aluminum | 950 | |
| Steel | 43 | |
| Insulation | 29 | |
| Coolant | 302 | |
| Electronic parts | 209 | |
| Component | Process | Amount (MJ/kWh) |
| Cell | Heat | 140 |
| Electricity | 30 |
| Source | Material | Quantity (kg/MW km) | Emissions (kg COeq/MW km) |
|---|---|---|---|
| Arvesen [23]—Lit. | 310 | ||
| Birkeland [34]— Lit. | 210 | ||
| Copper | 15.0 | ||
| IP | 5.6 | ||
| May [48]—Calc. | Lead | 14.0 | 250 |
| Polypropylene | 0.84 | ||
| Steel | 19.0 | ||
| XPLE | – | ||
| Copper | 22.0 | ||
| IP | – | ||
| ABB [49]—Calc. | Lead | 11.0 | 250 |
| Polypropylene | 2.2 | ||
| Steel | 11.0 | ||
| XPLE | 5.7 | ||
| Copper | 19.0 | ||
| IP | 7.9 | ||
| Birkeland [34]— | Lead | 33.0 | 340 |
| Calc. | Polypropylene | 4.3 | |
| Steel | 4.3 | ||
| XPLE | – | ||
| Our study | 270 |
| Component | Size | Unit |
|---|---|---|
| PV capacity in Tennant Creek | 13.0 | GW |
| Overhead HVDC line Tennant Creek—Darwin | 6.1 | GW |
| Subsea HVDC cable Darwin—Singapore | 3.2 | GW |
| Battery storage capacity in Darwin | 17.0 | GWh |
| Battery storage charging capacity | 2.6 | GW |
| Scenario | Specific Emissions (kg COeq/kW) | Total Emissions (g COeq/kWh) | ||
|---|---|---|---|---|
| Absolute | (Diff.) | Absolute | (Diff.) | |
| Reference | 2325 | 109 | ||
| Electricity (nuclear) | 2042 | (−12.0%) | 98 | (−10.0%) |
| Electricity (lignite) | 2480 | (6.7%) | 116 | (6.4%) |
Publisher’s Note: MDPI stays neutral with regard to jurisdictional claims in published maps and institutional affiliations. |
© 2021 by the authors. Licensee MDPI, Basel, Switzerland. This article is an open access article distributed under the terms and conditions of the Creative Commons Attribution (CC BY) license (https://creativecommons.org/licenses/by/4.0/).
Share and Cite
Ramachandran, S.; Siala, K.; de La Rúa, C.; Massier, T.; Ahmed, A.; Hamacher, T. Life Cycle Climate Change Impact of a Cost-Optimal HVDC Connection to Import Solar Energy from Australia to Singapore. Energies 2021, 14, 7178. https://doi.org/10.3390/en14217178
Ramachandran S, Siala K, de La Rúa C, Massier T, Ahmed A, Hamacher T. Life Cycle Climate Change Impact of a Cost-Optimal HVDC Connection to Import Solar Energy from Australia to Singapore. Energies. 2021; 14(21):7178. https://doi.org/10.3390/en14217178
Chicago/Turabian StyleRamachandran, Srikkanth, Kais Siala, Cristina de La Rúa, Tobias Massier, Arif Ahmed, and Thomas Hamacher. 2021. "Life Cycle Climate Change Impact of a Cost-Optimal HVDC Connection to Import Solar Energy from Australia to Singapore" Energies 14, no. 21: 7178. https://doi.org/10.3390/en14217178
APA StyleRamachandran, S., Siala, K., de La Rúa, C., Massier, T., Ahmed, A., & Hamacher, T. (2021). Life Cycle Climate Change Impact of a Cost-Optimal HVDC Connection to Import Solar Energy from Australia to Singapore. Energies, 14(21), 7178. https://doi.org/10.3390/en14217178