Low Carbon Scenario Analysis of a Hydrogen-Based Energy Transition for On-Road Transportation in California
Abstract
:1. Introduction
2. Modeling Methods
2.1. Hydrogen Demand Projection
2.2. Estimation of Hydrogen Production Facilities
2.3. Estimation of Hydrogen Refueling Stations
2.4. Hydrogen Pathways and Supply Chain Costs
2.5. Sensitivity Analysis of Hydrogen Supply Chain Costs
3. Results and Discussion
3.1. Hydrogen Demand and Infrastructure Buildout
3.2. Hydrogen Supply Chain Costs
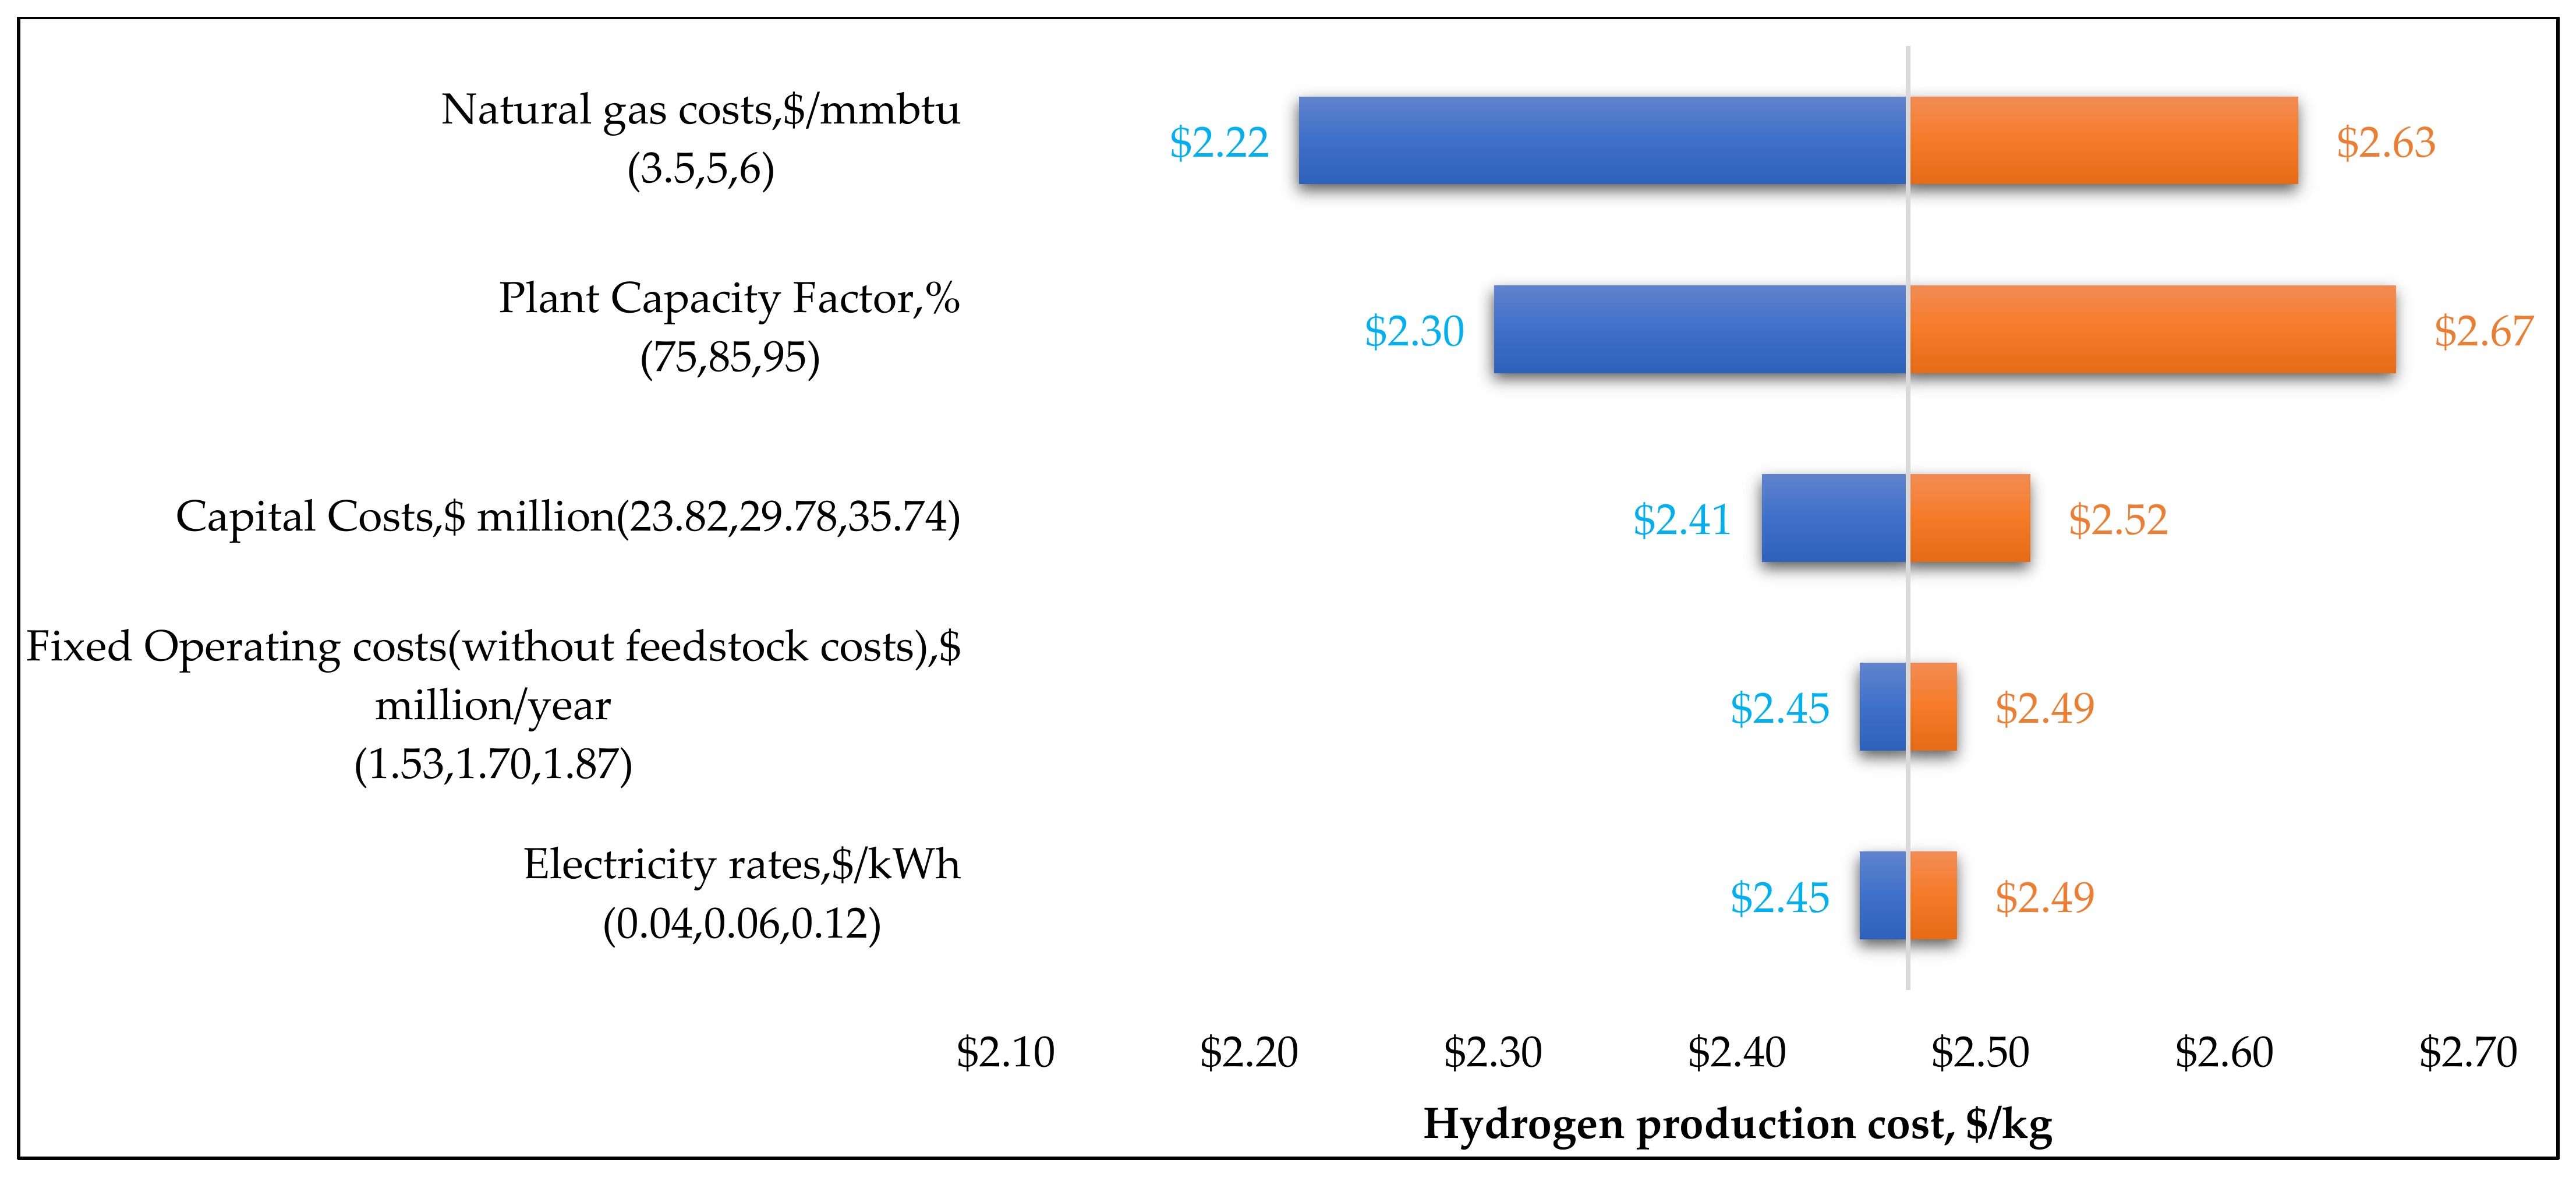
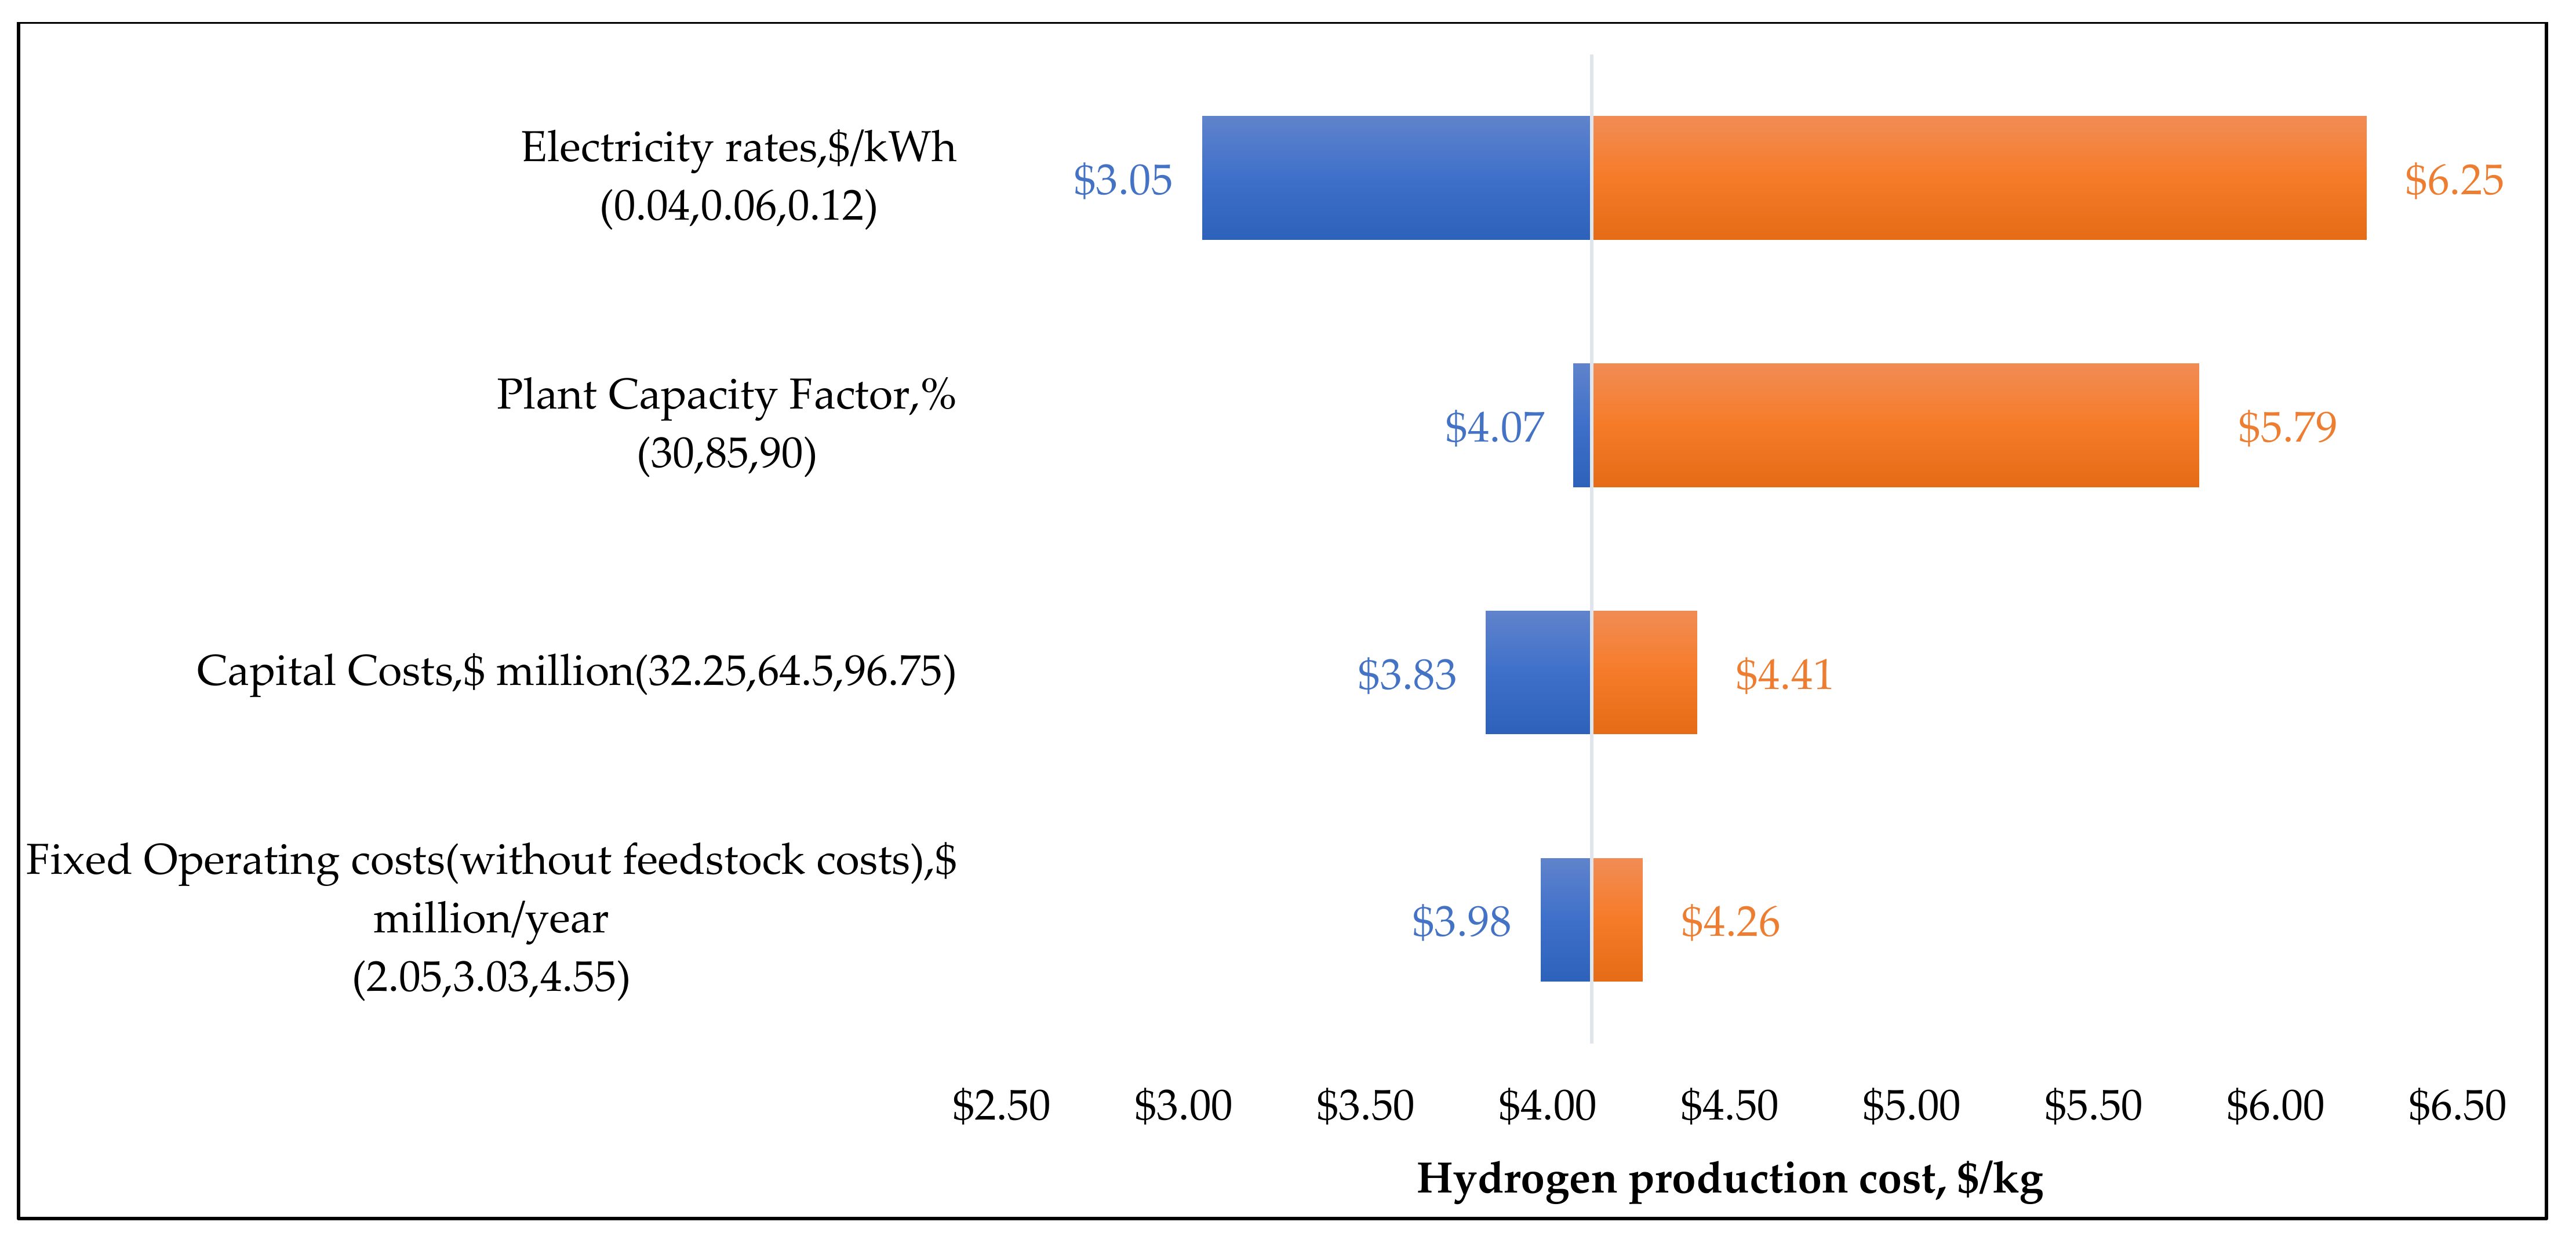
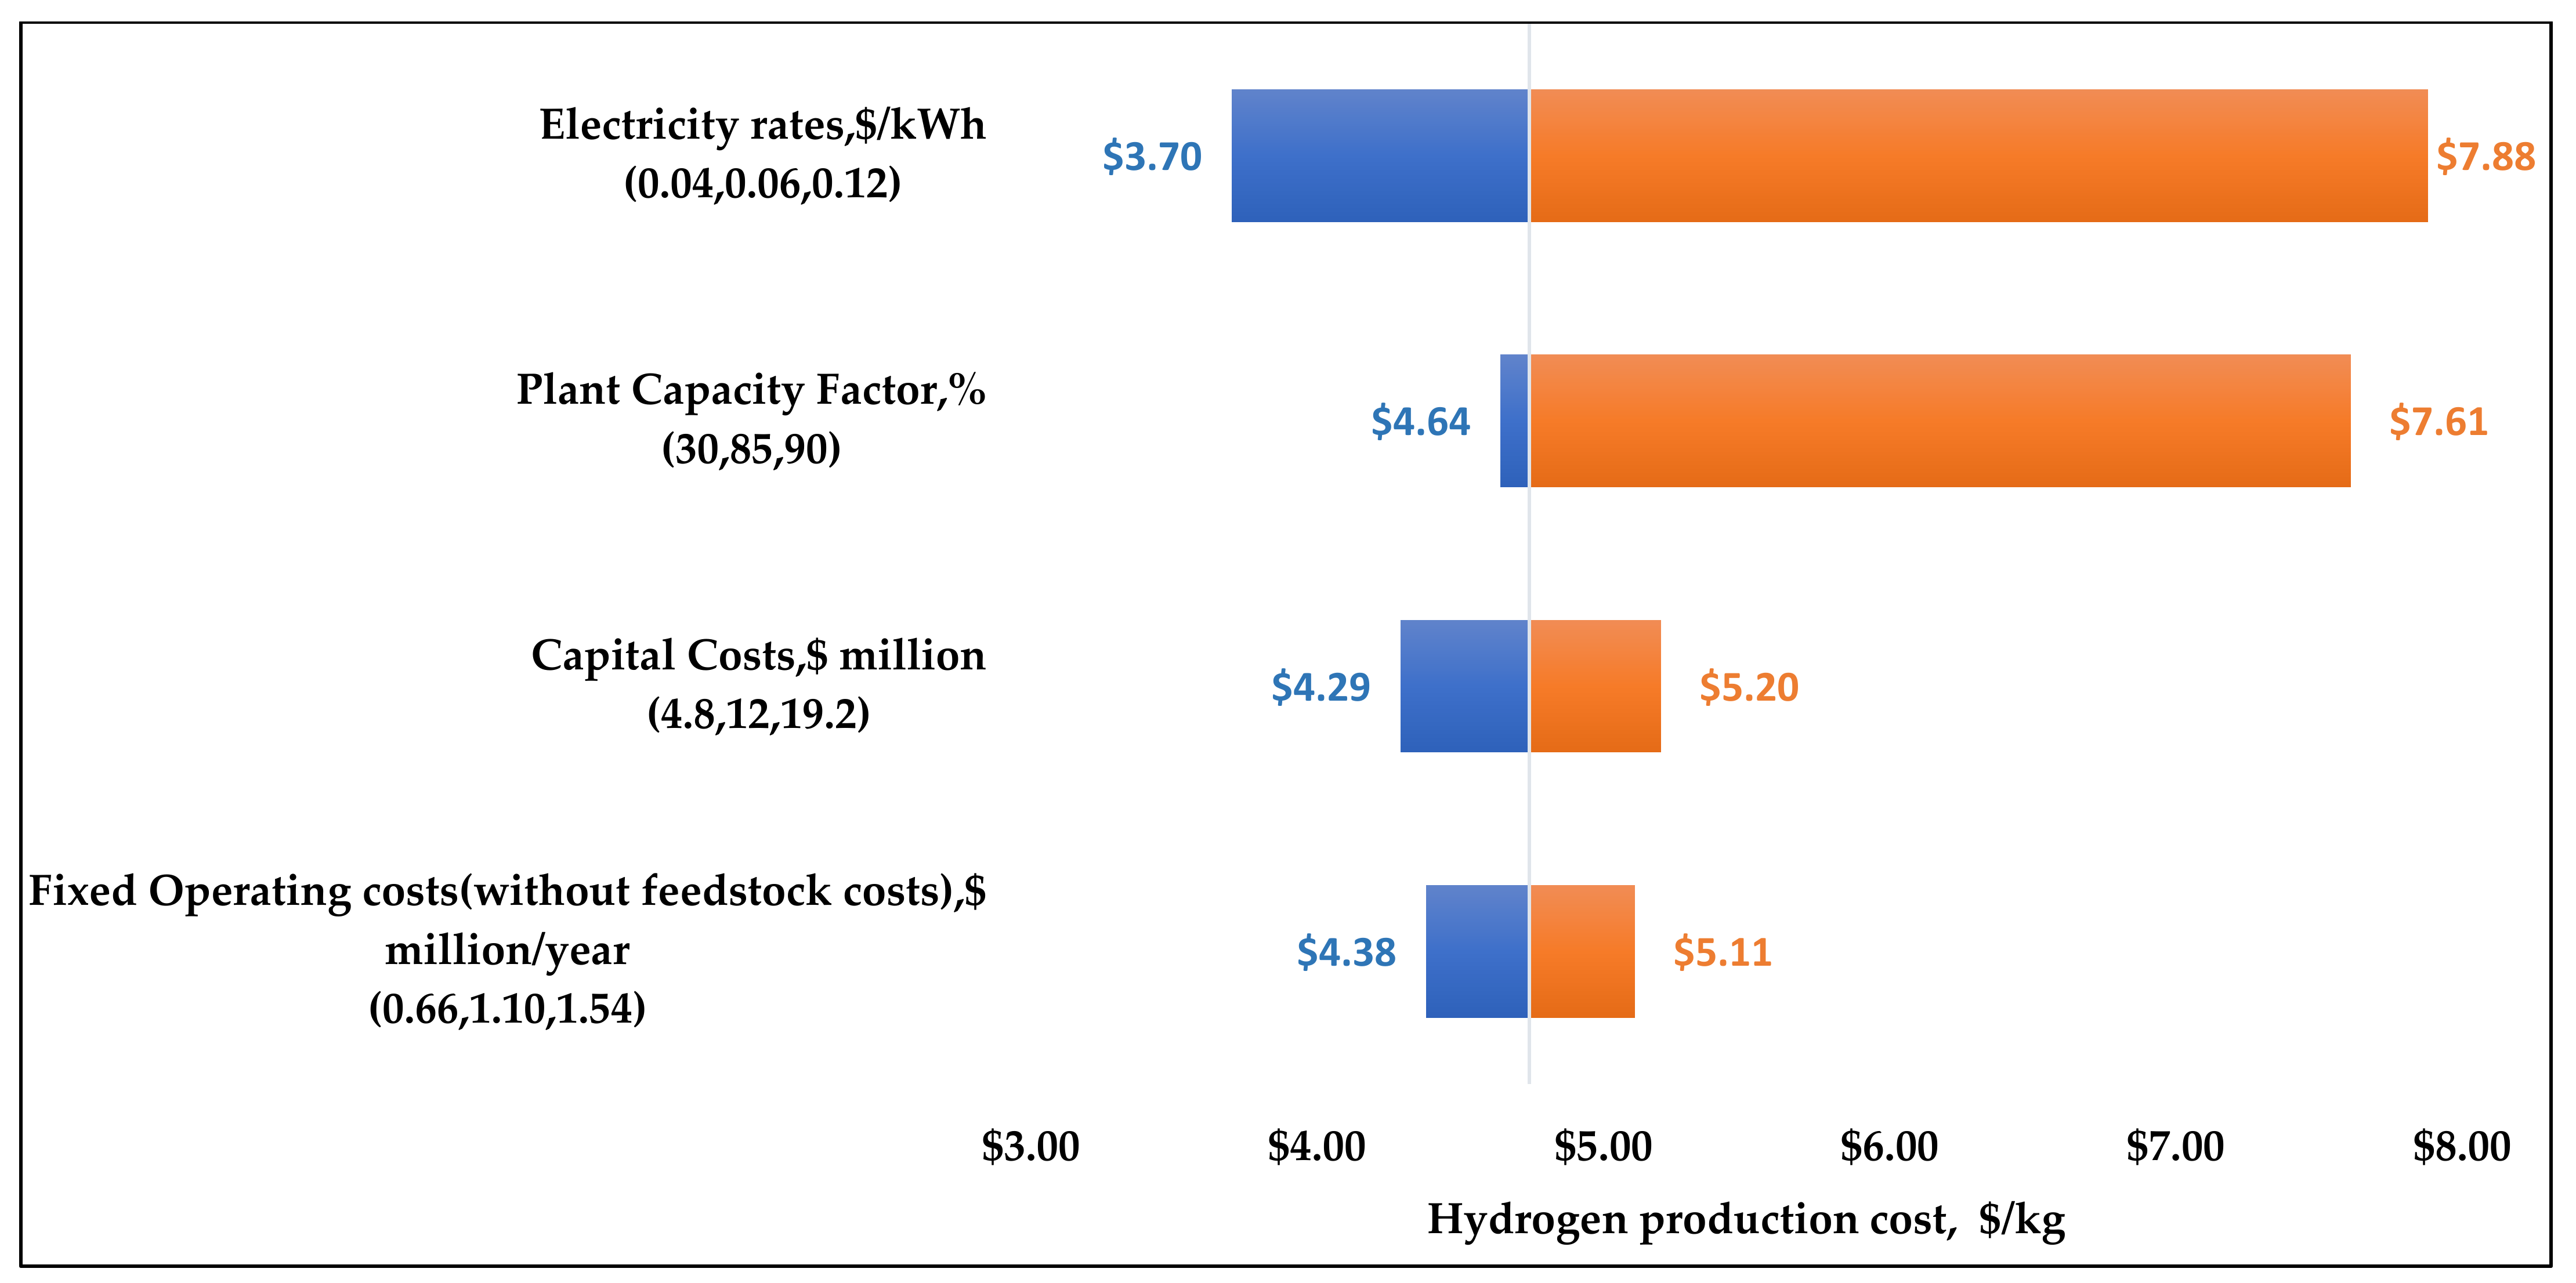
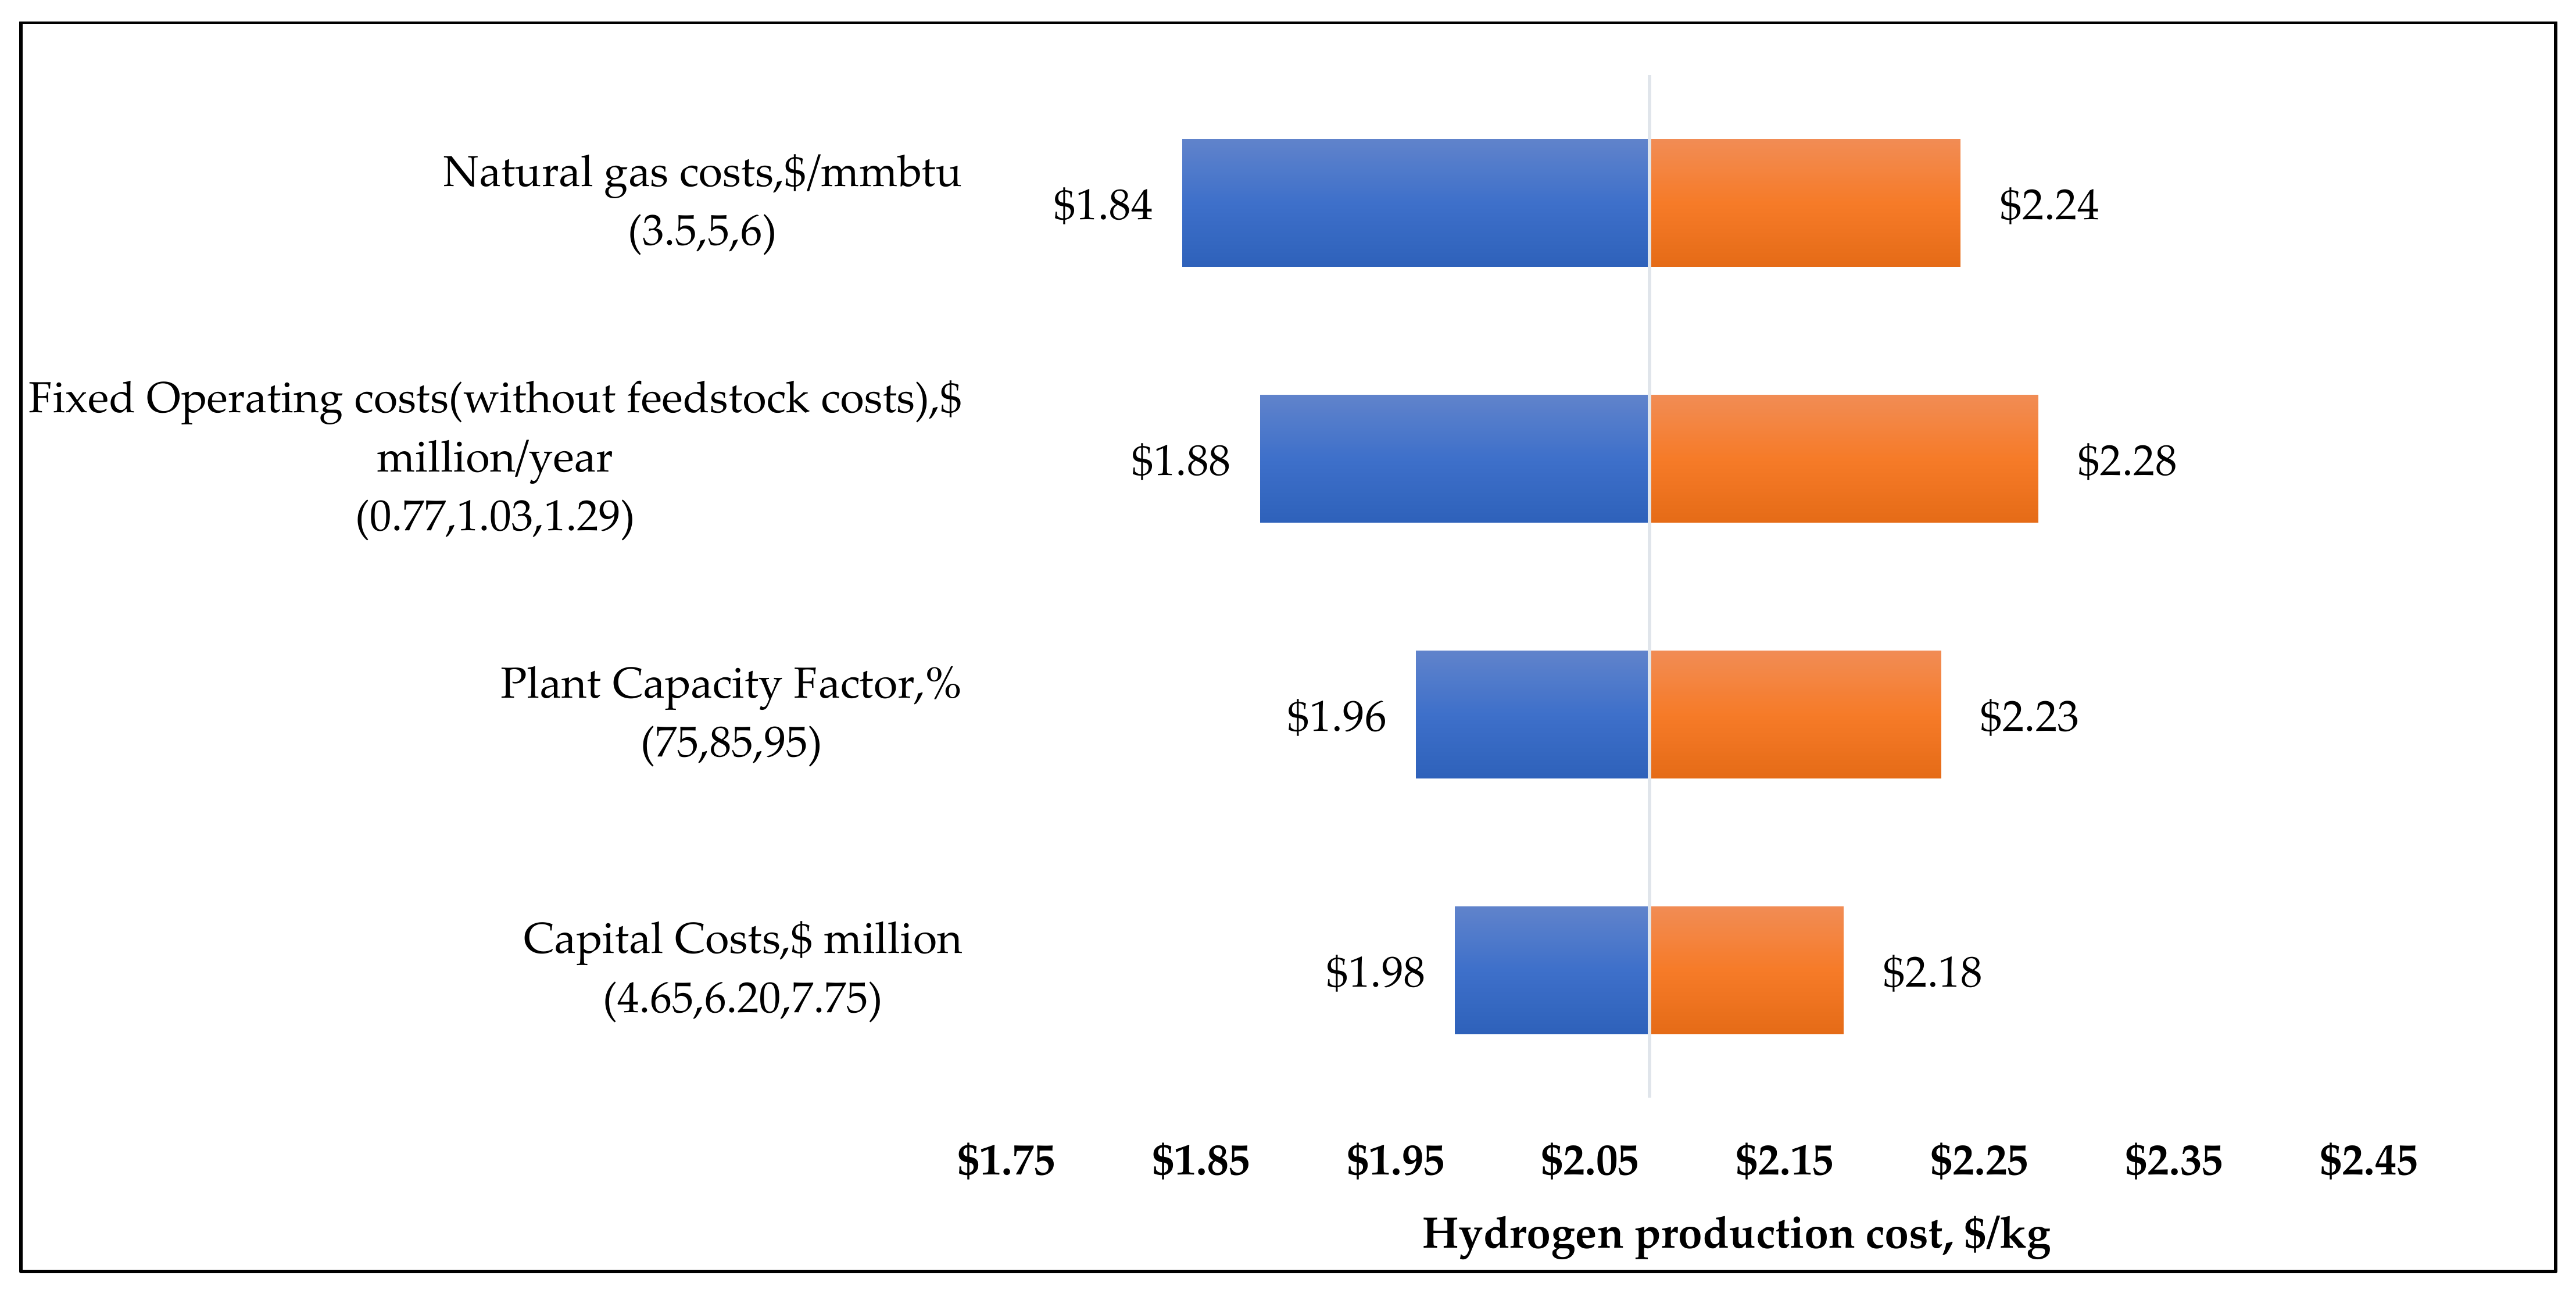
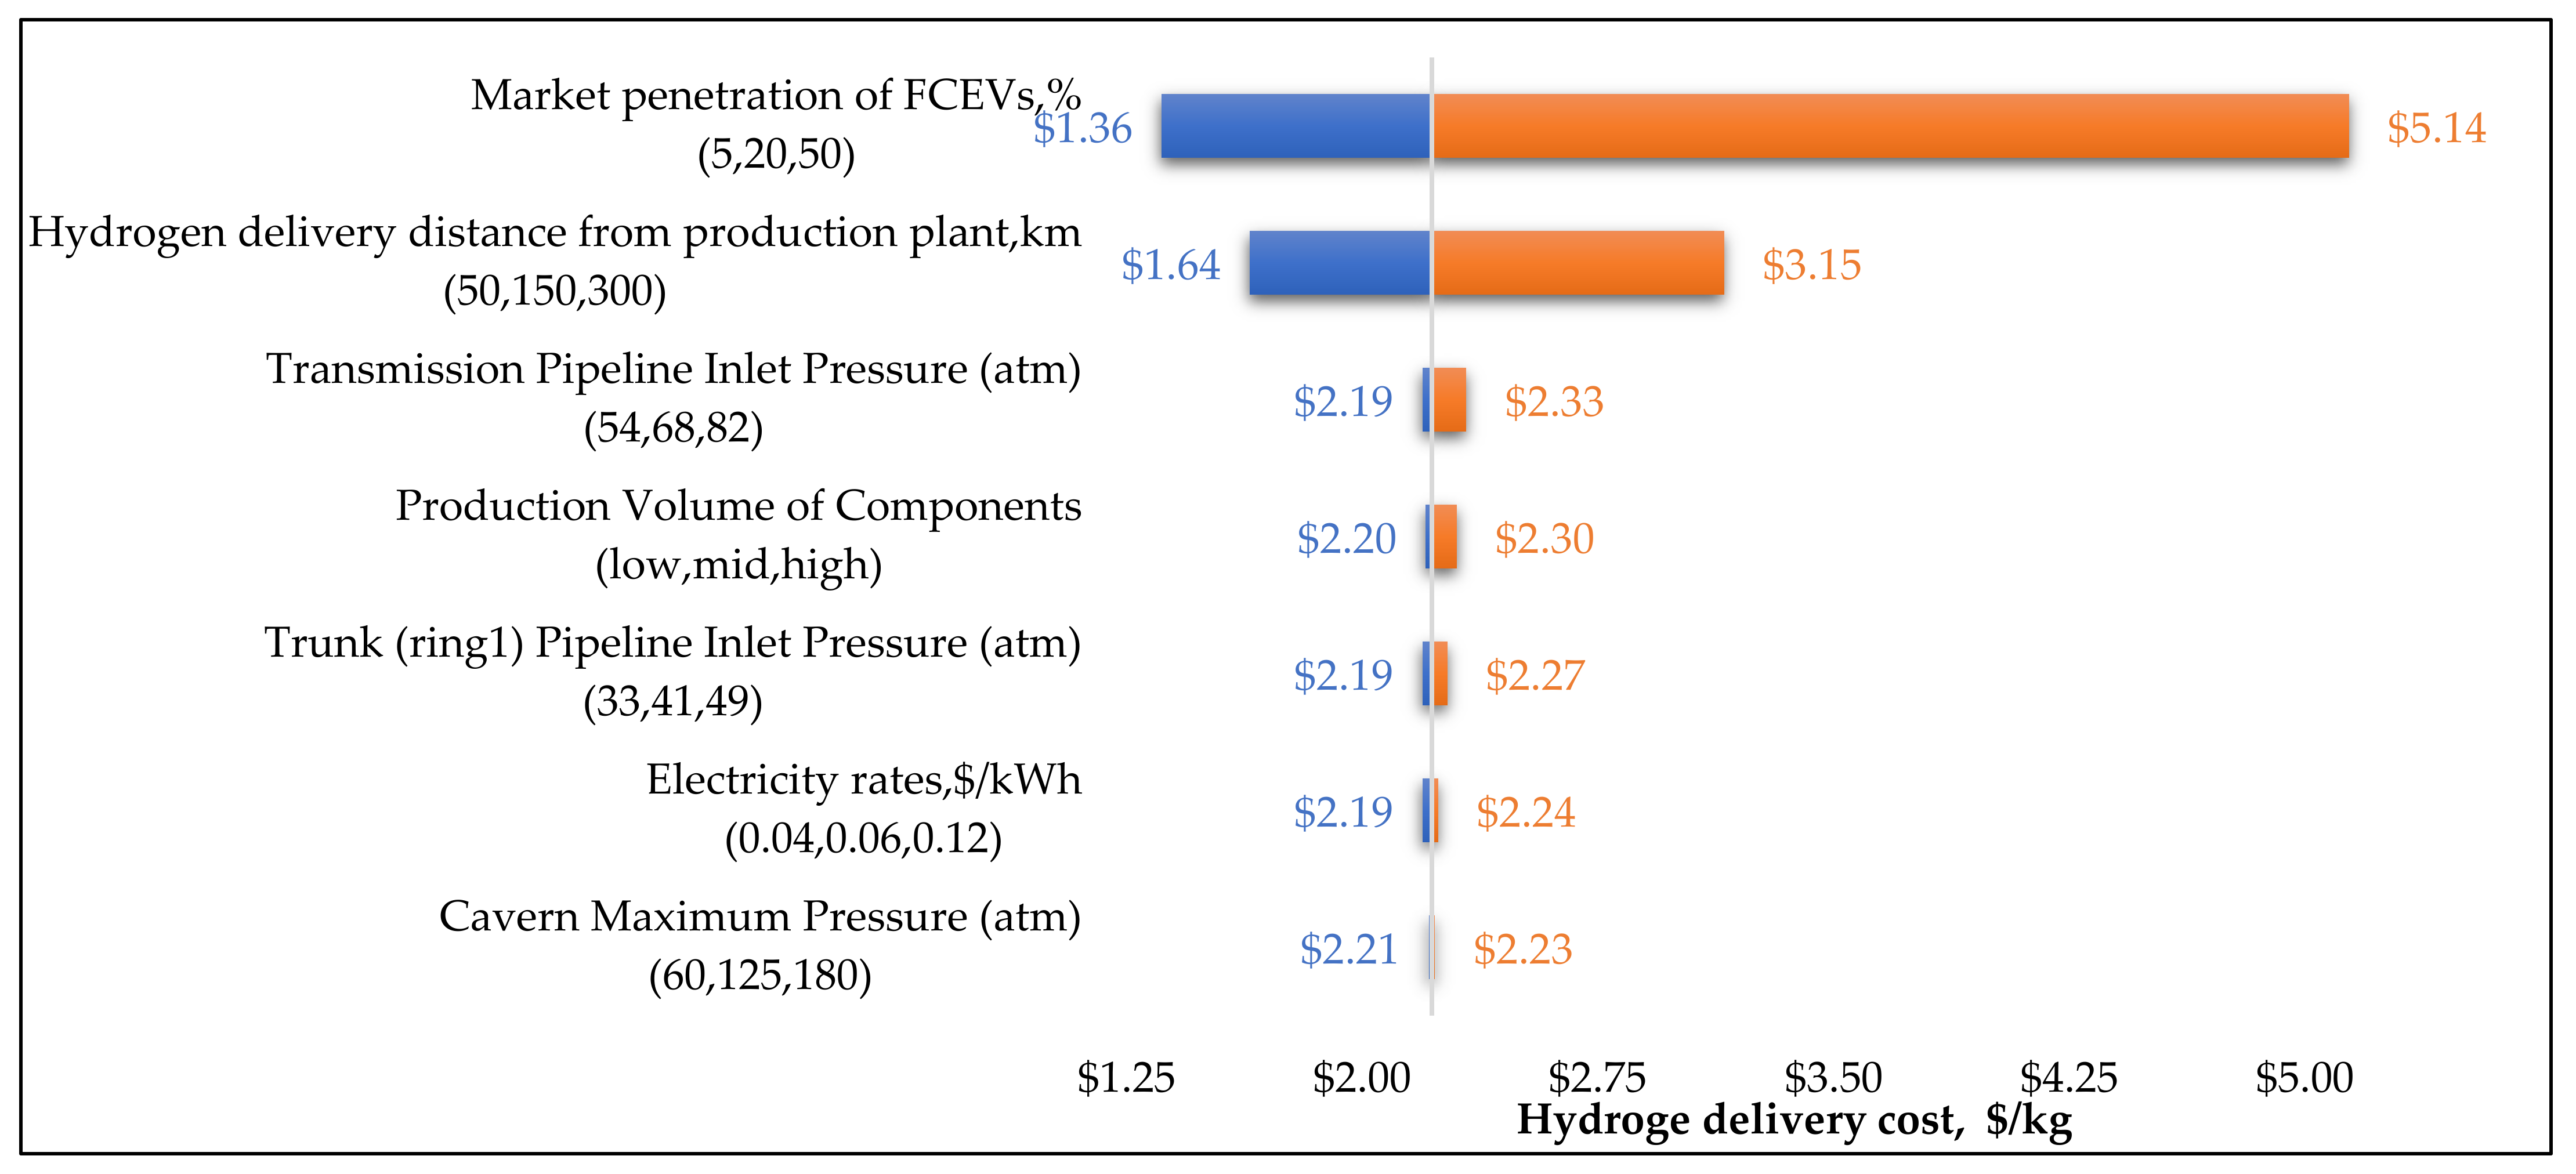
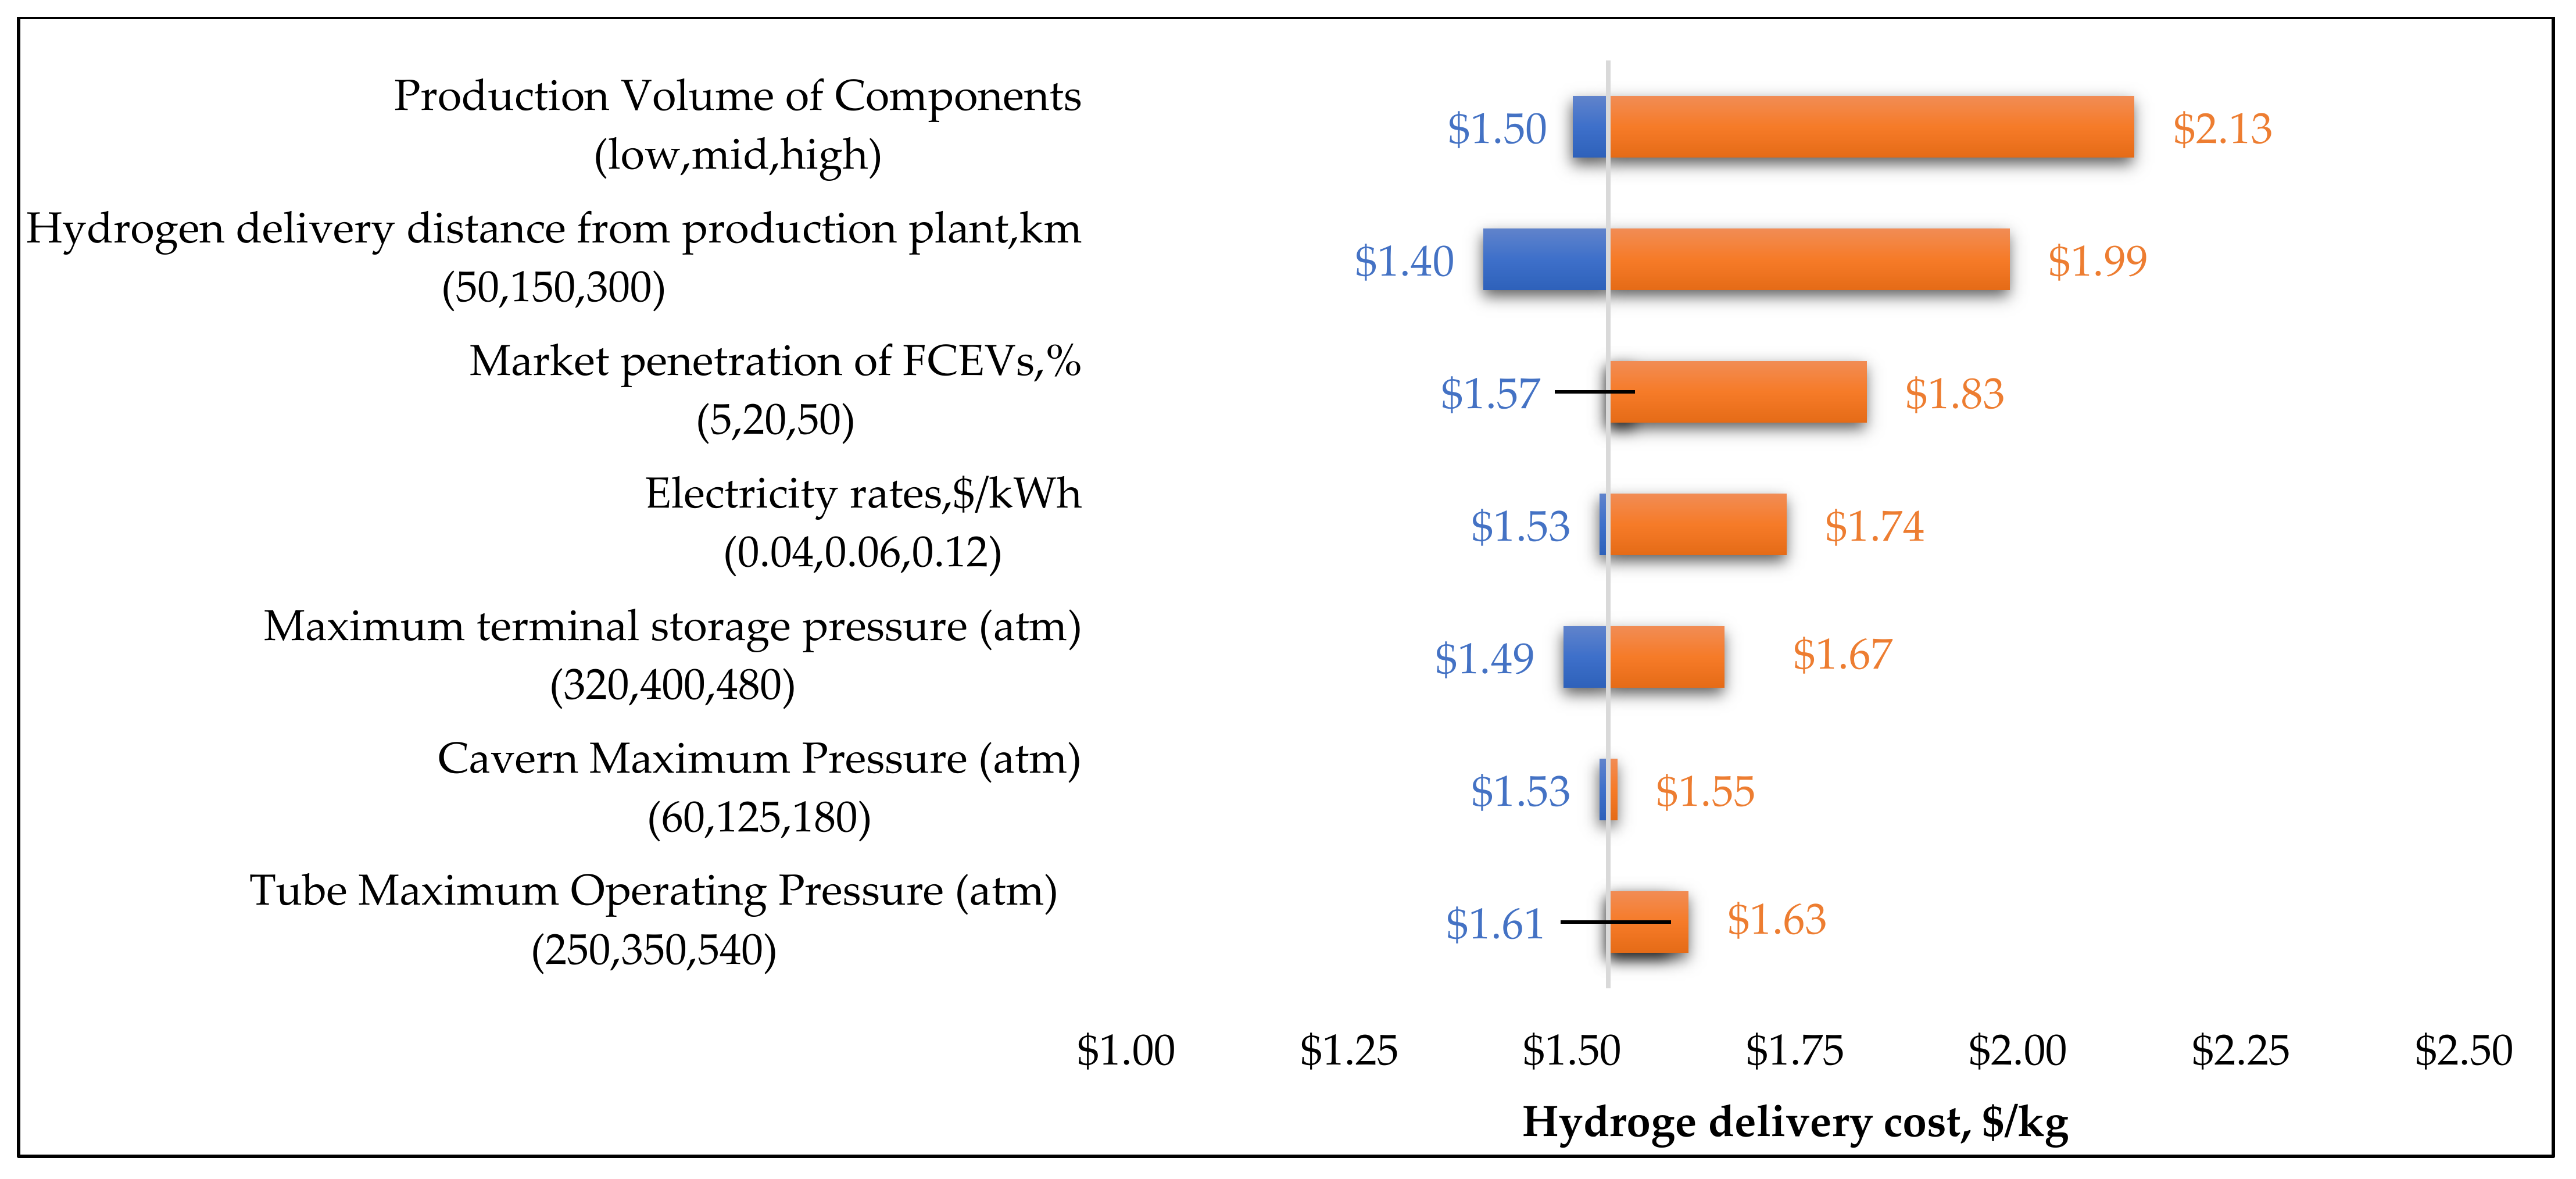
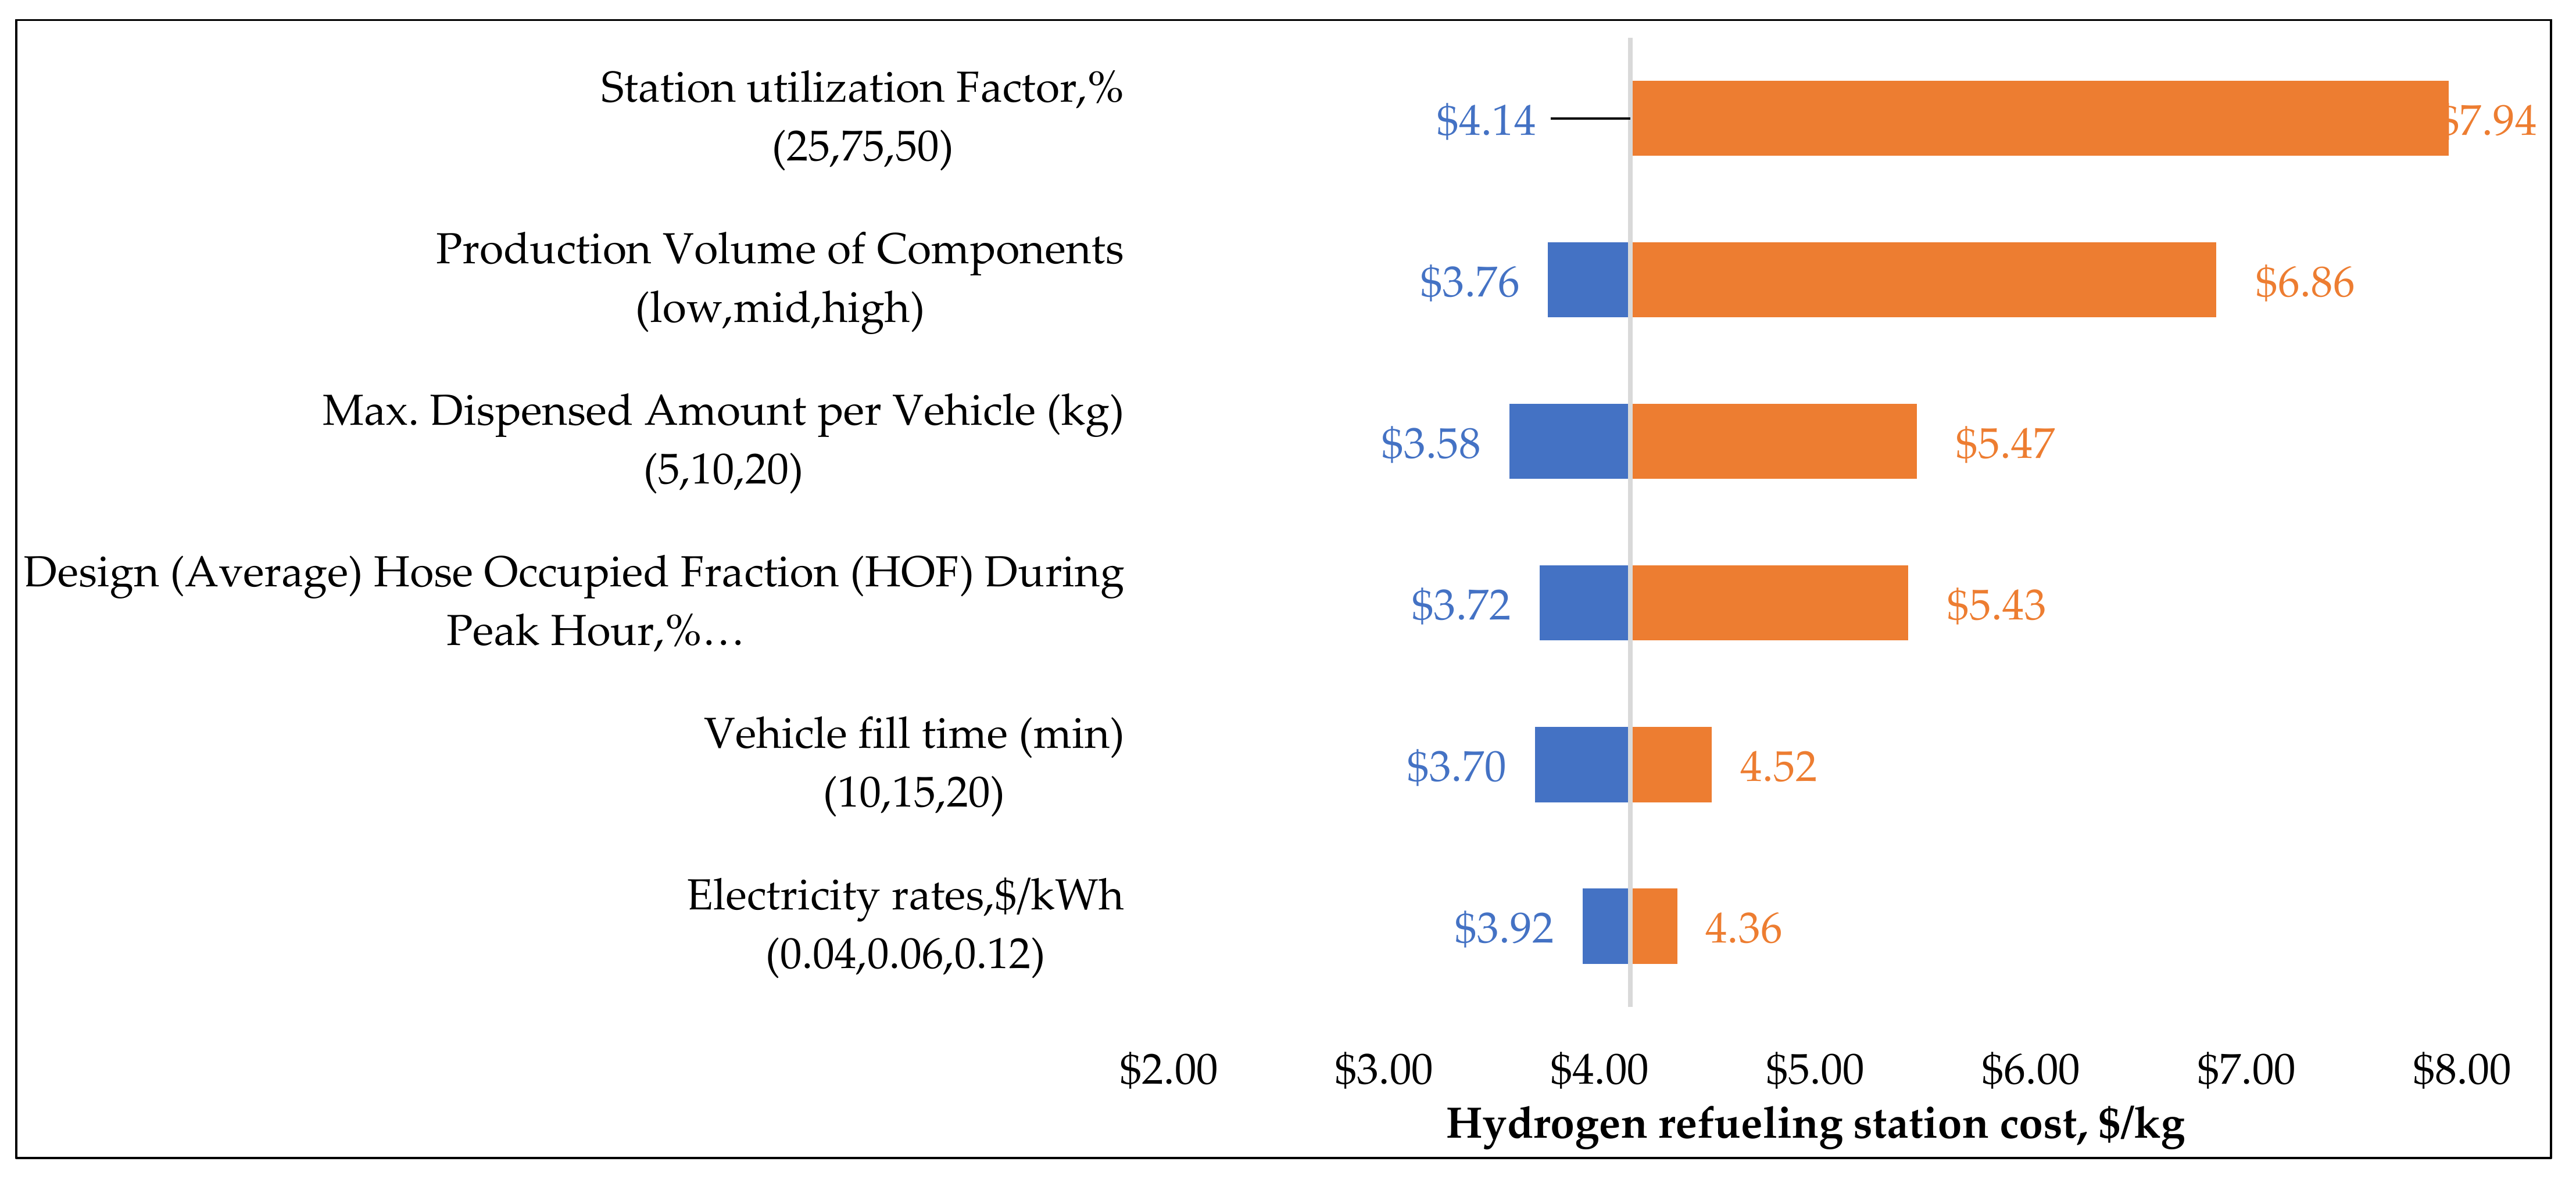
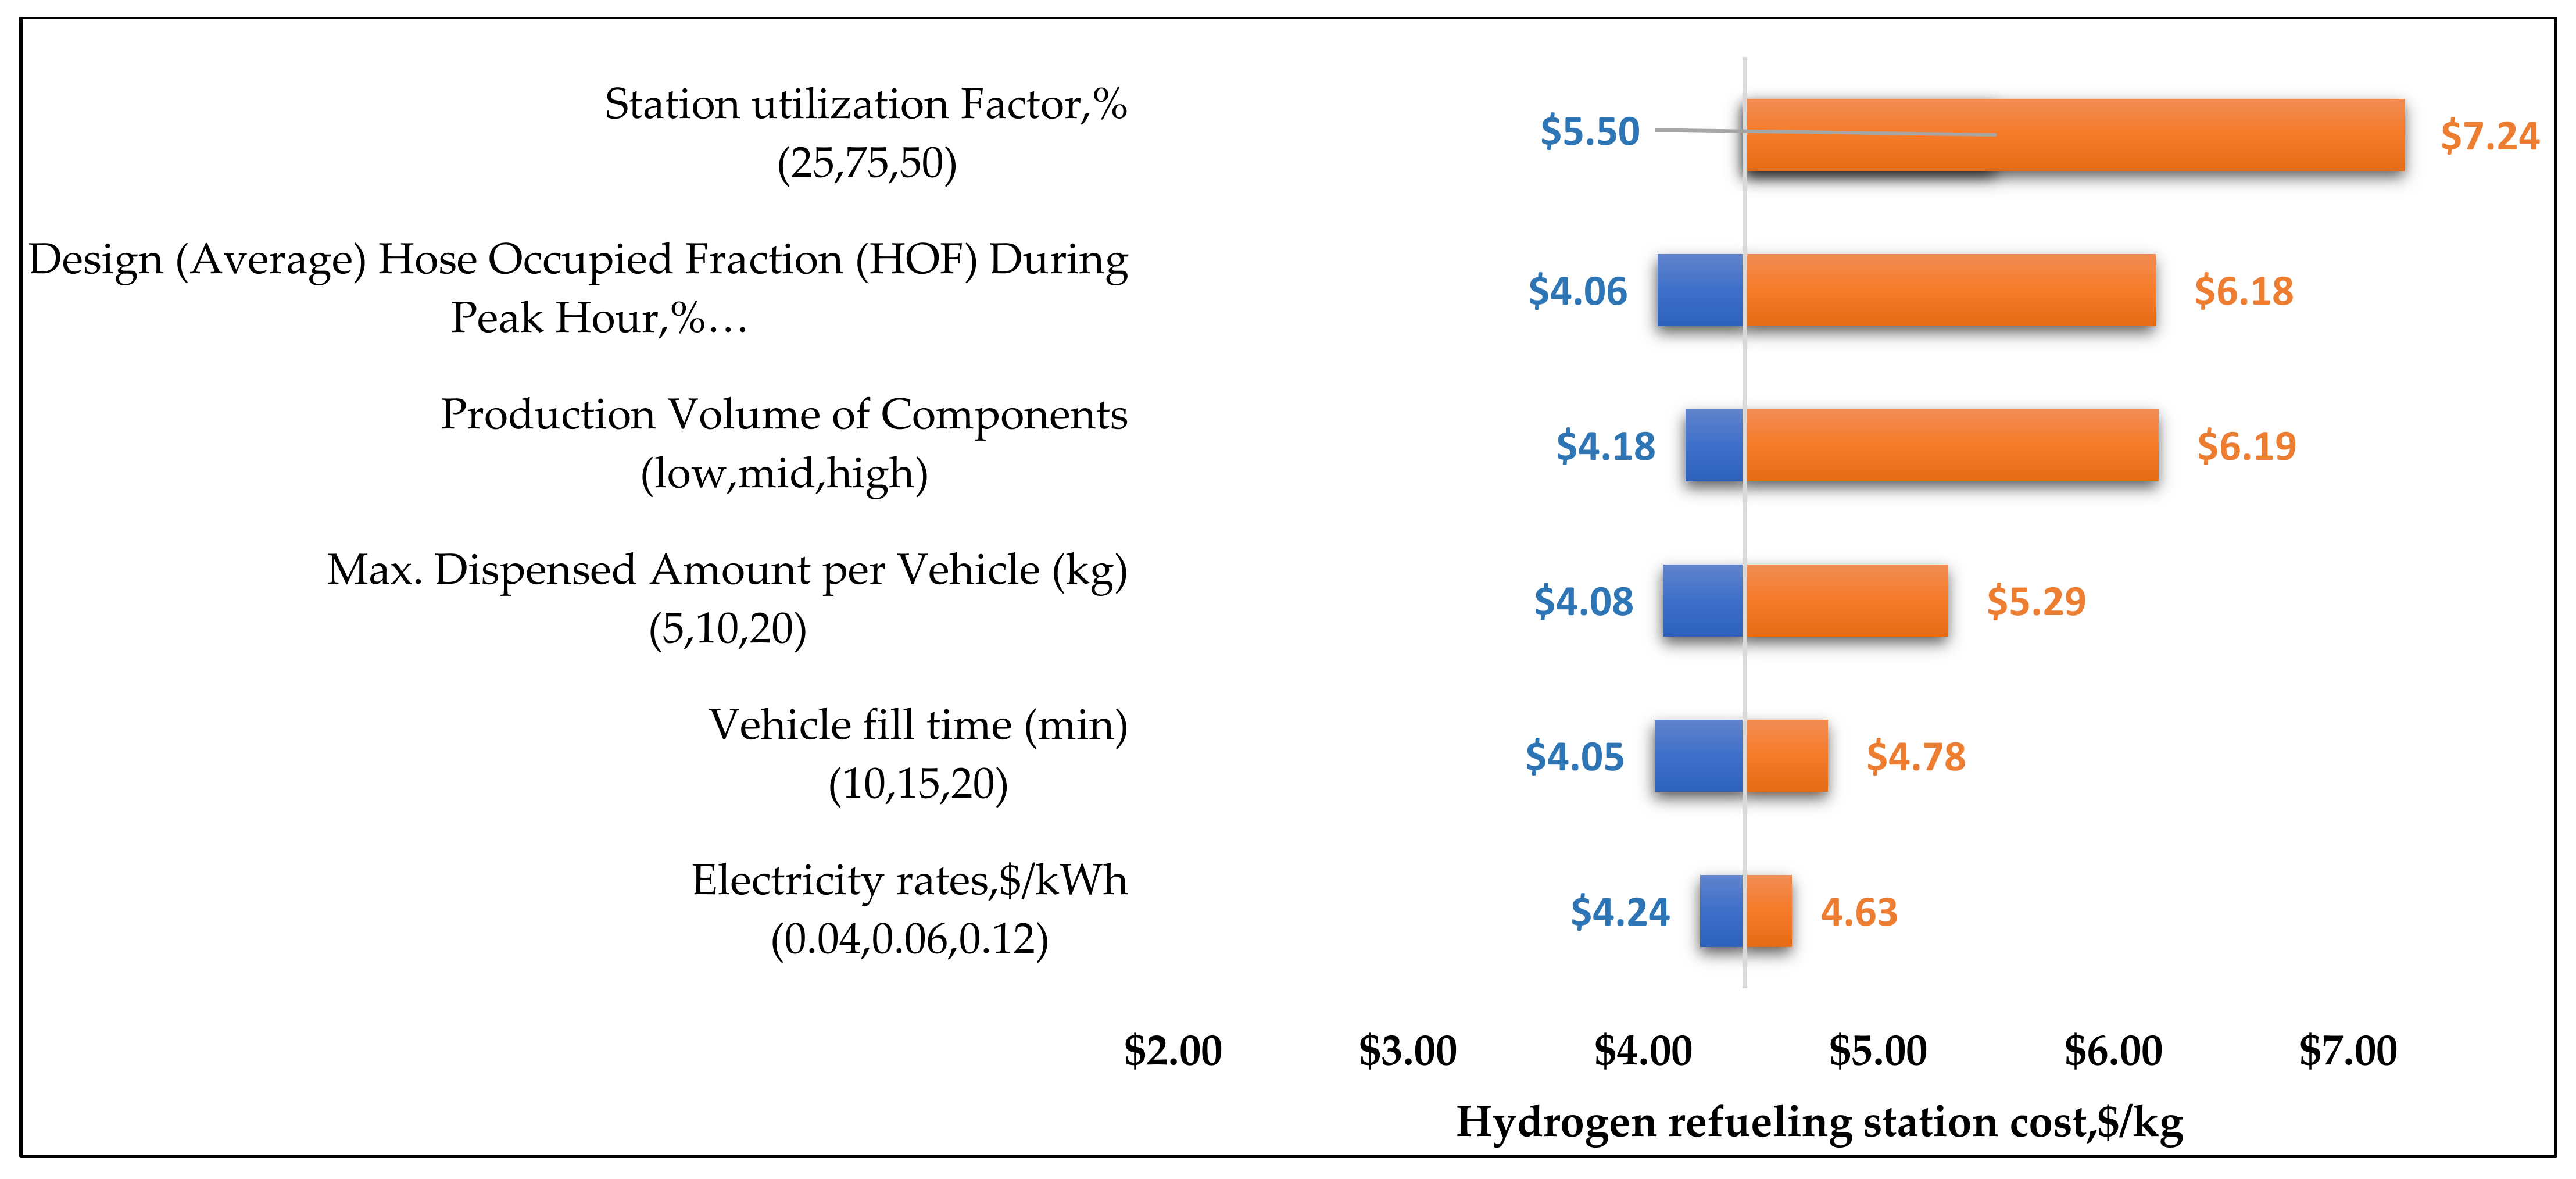
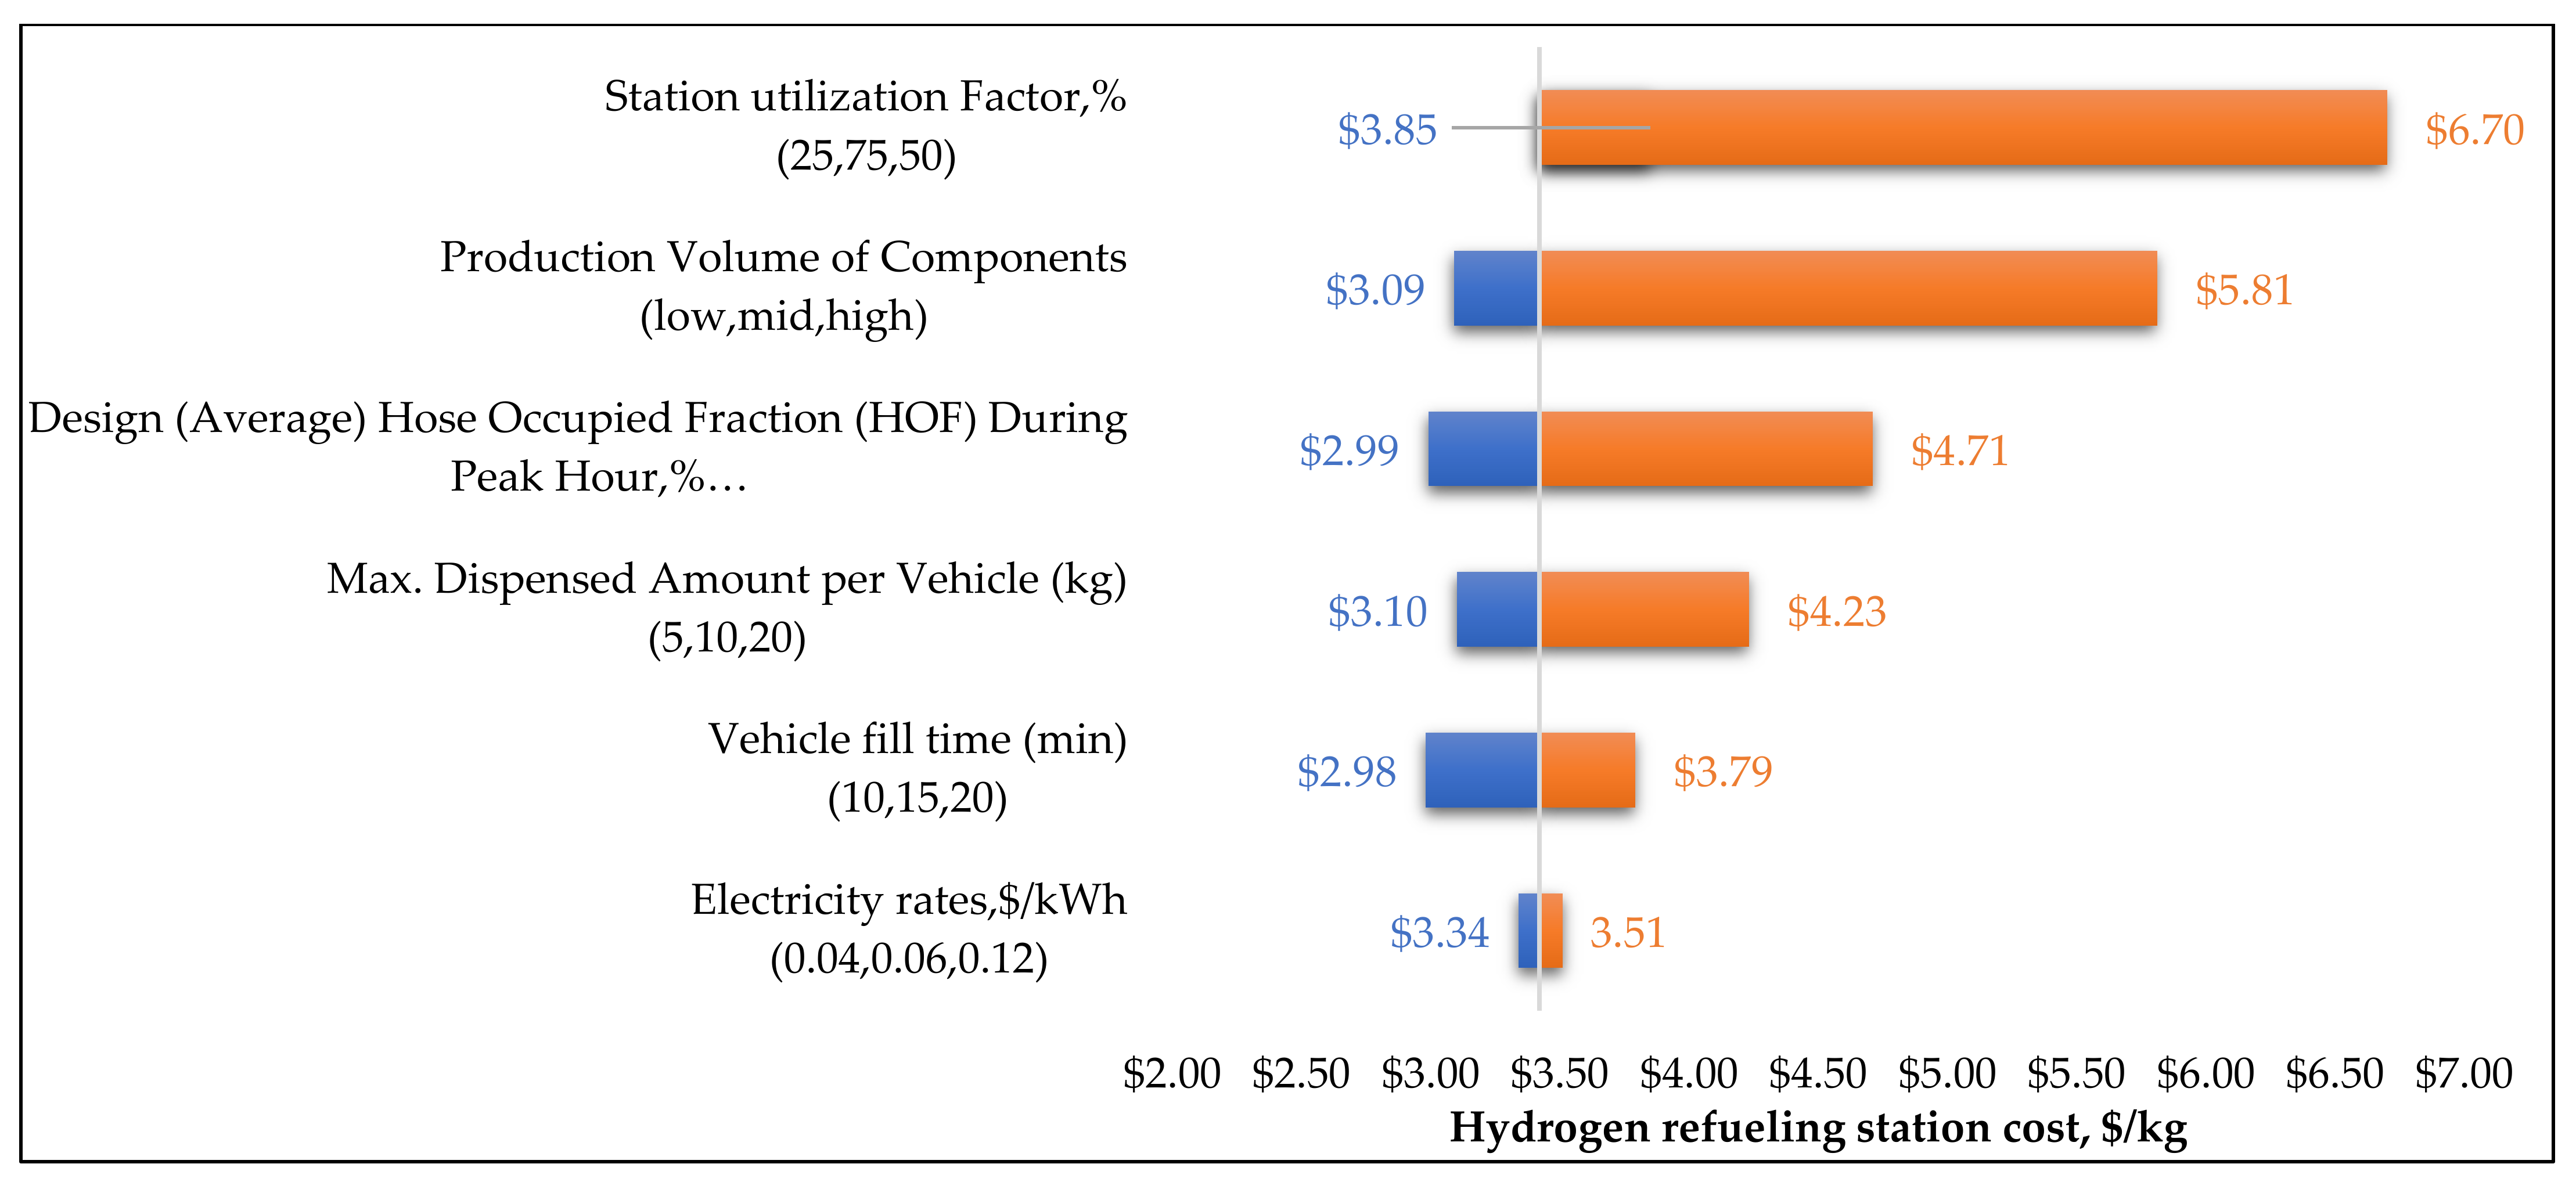
3.3. Sensitivity Analysis Results for Hydrogen Supply Chain Costs
4. Conclusions
Author Contributions
Funding
Institutional Review Board Statement
Informed Consent Statement
Data Availability Statement
Acknowledgments
Conflicts of Interest
Appendix A
| Parameter | Value | |
|---|---|---|
| 1 | Plant Capacity Factor (%) | 85 |
| 2 | Lifetime(years) | 30 |
| 3 | Carbon capture efficiency (%) | 90 |
| 4 | Inflation (%) | 2 |
| 5 | State tax (%) | 6 |
| 6 | Federal tax (%) | 21 |
| 7 | After-tax Real IRR (%) | 8 |
| 8 | Number of staff (central, distributed) | 6, 4 |
| 9 | Cost of land for plant ($/acre) | 50,000 |
| 10 | Acres of land needed (central, distributed) | 5, 1.5 |
| 11 | NG usage (mmBtu/kg H2) in SMR plants | 0.1558 |
| 12 | Electricity usage (kWh/kg H2) for electrolysis | 51 |
| Time Frame | Electricity Rates ($/kwh) | Natural Gas Price ($/mmBtu) |
|---|---|---|
| Near-term (2020–2025) | 0.12 | 3.5 |
| Mid Term (2025–2030) | 0.06 | 5 |
| Long Term (2030–2035) | 0.04 | 6 |
| Time Frame | Capital Cost $ Millions | Fixed Operating Cost ($/Year) | ||||||
|---|---|---|---|---|---|---|---|---|
| Central SMR Plant (30 tpd) | Distributed SMR (5 tpd) | Central PEM Plant (30 tpd) | Distributed PEM (5 tpd) | Central SMR Plant (30 tpd) | Distributed SMR (5 tpd) | Central PEM Plant (30 tpd) | Distributed PEM (5 tpd) | |
| Near-term (2025–2030) | 37.23 | 6.89 | 83.1 | 14.9 | 1.99 | 1.06 | 4.1 | 1.36 |
| Mid Term (2030–2040) | 29.78 | 6.20 | 64.5 | 12 | 1.7 | 1.03 | 3.3 | 1.1 |
| Long Term (2040–2050) | 23.83 | 5.58 | 17.8 | 4.6 | 1.46 | 1 | 1.9 | 0.77 |
Appendix B
- Gaseous Hydrogen Delivery
- ✓
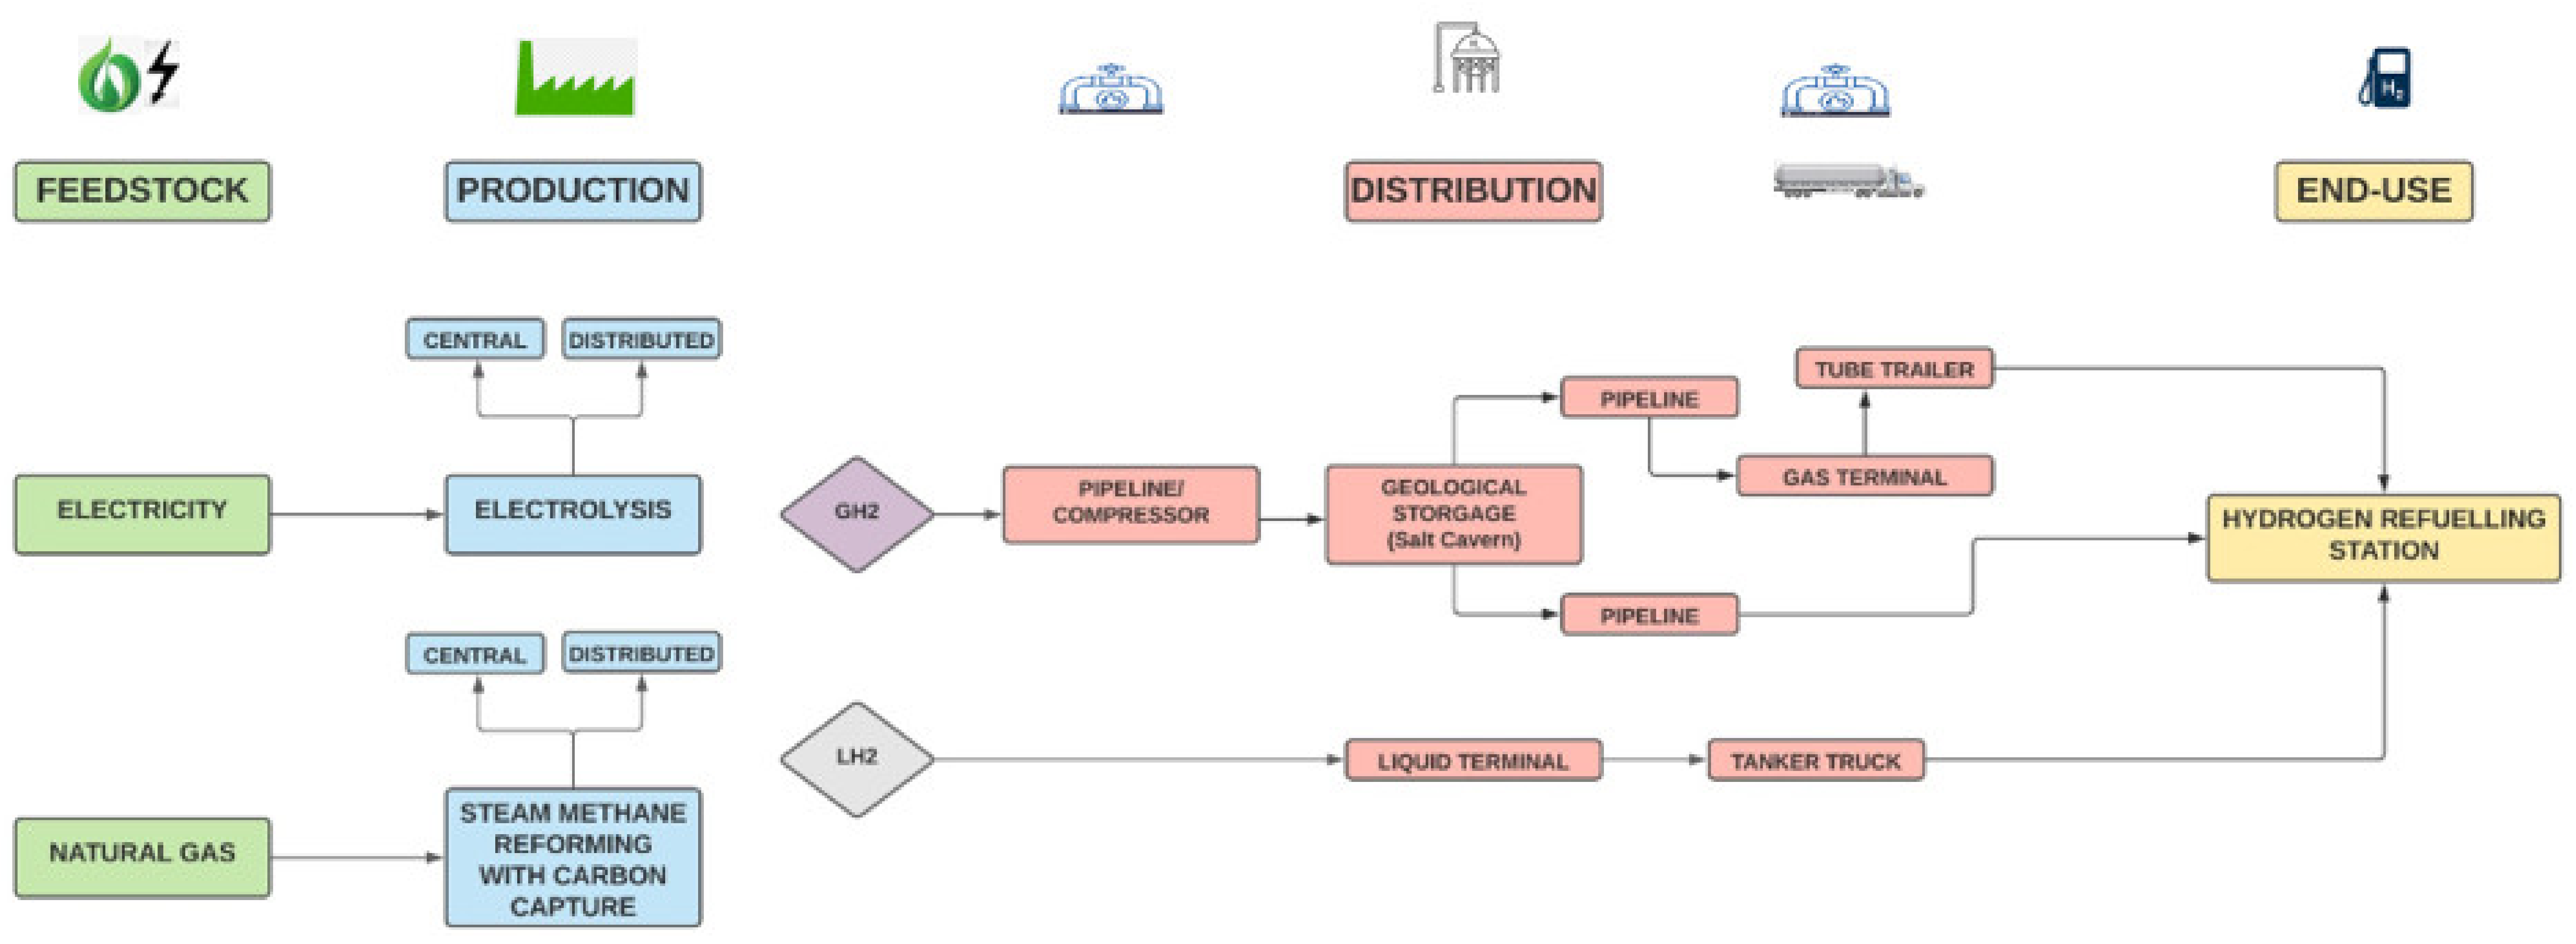
- Central production → compressor → geologic storage for plant outages → transmission pipeline → GH2 terminal → GH2 truck distribution → GH2 fueling station.
- ✓
- Central production → compressor → geologic storage for plant outages → transmission & distribution pipeline → GH2 fueling station.
- Liquid Hydrogen Delivery
- ✓
- Central production → liquefier → LH2 terminal (including liquid storage for plant outages) → LH2 truck transmission & distribution → LH2 fueling station.
| S. No | Parameter | Value |
|---|---|---|
| 1 | Distance from central production plant to station (km) | 100 |
| 2 | Electricity rate for the three-time frames ($/kwh) | 0.1, 0.06 and 0.04 |
| 3 | Market penetration of FCEV for the three-time frames (%) | 5, 20, 50 |
| 4 | Production Volume of Components for the three-time frames | Low, med, high |
| 5 | Tube trailer Maximum Operating Pressure (atm) | 350 |
| 6 | Maximum gas terminal storage pressure (atm) | 400 |
| 7 | Salt Cavern Maximum Pressure (atm) | 125 |
| 8 | Transmission Pipeline Inlet Pressure (atm) | 68 |
| 9 | Trunk (ring1) Pipeline Inlet Pressure (atm) | 41 |
| 10 | Service Pipeline Inlet Pressure (atm) | 26 |
| 11 | Liquid hydrogen Tanker Water Volume (m3) | 56 |
| 12 | Tank Unloading Losses (% of unloaded amount) | 2.5 |
| 13 | Discount rate (%) | 8 |
Appendix C
| S. No | Parameter | Value |
|---|---|---|
| 1 | Station utilization rate (%) | 75 |
| 2 | Station Lifetime(years) | 30 |
| 3 | Location of station | Urban and Rural |
| 4 | Electricity rate for the three-time frames ($/kwh) | 0.1, 0.06 and 0.04 |
| 5 | Hydrogen dispensing pressure(bar) | 700 |
| 6 | Number of dispensers for 1.5 and 5 tpd refueling stations | 6 and 3 |
| 7 | Hose Occupied Fraction (HOF) During Peak Hour (%) | 50 |
| 8 | Filling rate for 1.5 and 5 tpd refueling stations (kg/ min) | 1 and 7.2 |
| 9 | Vehicle fill time for 1.5 and 5 tpd refueling stations (min) | 5 and 11 |
| 10 | Vehicle Lingering time (min) | 2 |
| 11 | Discount Rate (%) | 8 |
| 12 | Total federal and state tax (%) | 39 |
| 13 | Max. Dispensed Amount per Vehicle for 1.5 and 5 tpd refueling stations (kg) | 5 and 80 |
| 14 | Production Volume of Components for the three-time frames | Low, mid, high |
References
- Latest GHG Inventory Shows California Remains below 2020 Emissions Target|California Air Resources Board. 2021. Available online: https://ww2.arb.ca.gov/news/latest-ghg-inventory-shows-california-remains-below-2020-emissions-target (accessed on 5 April 2021).
- GHG 1990 Emissions Level & 2020 Limit|California Air Resources Board. 2021. Available online: https://ww2.arb.ca.gov/ghg-2020-limit (accessed on 5 April 2021).
- Taylor, M. Assessing California’ s Climate Policies—Transportation; Legislative Analyst Office: Sacramento, CA, USA, 2018. [Google Scholar]
- Carbon Neutrality Study 1: Driving California’s Transportation Emissions to Zero—University of California Institute of Transportation Studies. 2021. Available online: https://www.ucits.org/research-project/2179/ (accessed on 3 September 2021).
- By The Numbers|California Fuel Cell Partnership. 2020. Available online: https://cafcp.org/by_the_numbers (accessed on 2 July 2021).
- Greene, D.L.; Ogden, J.M.; Lin, Z. Challenges in the designing, planning and deployment of hydrogen refueling infrastructure for fuel cell electric vehicles. ETransportation 2020, 6, 100086. [Google Scholar] [CrossRef]
- Annual Evaluation of Fuel Cell Electric Vehicle Deployment and Hydrogen Fuel Station Network Development; California Air Resources Board: Sacramento, CA, USA, 2021. Available online: https://ww2.arb.ca.gov/resources/documents/annual-hydrogen-evaluation (accessed on 3 October 2021).
- Annual Evaluation of Fuel Cell Electric Vehicle Deployment & Hydrogen Fuel Station Network Development; California Air Resources Board: Sacramento, CA, USA, 2019. Available online: https://ww2.arb.ca.gov/resources/documents/annual-hydrogen-evaluation (accessed on 3 October 2021).
- A Hydrogen Strategy for a Climate Neutral Europe; European Commission: Brussels, Belgium, 2020. Available online: https://www.europarl.europa.eu/legislative-train/api/stages/report/current/theme/a-european-green-deal/file/eu-hydrogen-strategy (accessed on 2 July 2021).
- The National Hydrogen Strategy; Federal Ministry for Economic Affairs and Energy: Berlin, Germany, 2020. Available online: https://www.bmwi.de/Redaktion/EN/Publikationen/Energie/the-national-hydrogen-strategy.html (accessed on 3 September 2021).
- California Energy comission (2020): Roadmap for the Deployment and Buildout of Renewable Hydrogen Production Plants in California (Docket Number 17-HYD-01). Available online: https://efiling.energy.ca.gov/Lists/DocketLog.aspx?docketnumber=17-HYD-01 (accessed on 5 February 2021).
- Schoenung, S.M.; Keller, J.O. Commercial potential for renewable hydrogen in California. Int. J. Hydrogen Energy 2017, 42, 13321–13328. [Google Scholar] [CrossRef]
- Yang, C.; Ogden, J.M. Renewable and low carbon hydrogen for California-Modeling the long term evolution of fuel infrastructure using a quasi-spatial TIMES model. Int. J. Hydrogen Energy 2013, 38, 4250–4265. [Google Scholar] [CrossRef]
- Brown, T.; Schell, L.S.; Stephens-Romero, S.; Samuelsen, S. Economic analysis of near-term California hydrogen infrastructure. Int. J. Hydrogen Energy 2013, 38, 3846–3857. [Google Scholar] [CrossRef]
- Stephens-Romero, S.D.; Brown, T.M.; Kang, J.E.; Recker, W.W.; Samuelsen, G.S. Systematic planning to optimize investments in hydrogen infrastructure deployment. Int. J. Hydrogen Energy 2010, 35, 4652–4667. [Google Scholar] [CrossRef] [Green Version]
- Brown, T.; Stephens-Romero, S.; Soukup, J.; Manliclic, S.S.K. The 2013 strategic plan for the inaugural rollout of hydrogen fueling stations in California. Publication number CEC-600-2015-005. 2015. Available online: https://www.energy.ca.gov/publications/2015/2013-strategic-plan-inaugural-rollout-hydrogen-fueling-stations-california (accessed on 3 January 2021).
- Li, L.; Manier, H.; Manier, M.A. Hydrogen supply chain network design: An optimization-oriented review. Renew. Sustain. Energy Rev. 2019, 103, 342–360. [Google Scholar] [CrossRef]
- Fulton, L.; Miller, M.; Burke, A.; Yang, C. Technology and Fuel Transition Scenarios to Low Greenhouse Gas Futures for Cars and Trucks in California. 2019. Available online: https://escholarship.org/uc/item/8wn8920p (accessed on 2 September 2021).
- Advanced Clean Trucks Fact Sheet|California Air Resources Board. 2021. Available online: https://ww2.arb.ca.gov/resources/fact-sheets/advanced-clean-trucks-fact-sheet (accessed on 2 February 2021).
- ZEV Strategy|California Governor’s Office of Business and Economic Development. 2021. Available online: https://business.ca.gov/industries/zero-emission-vehicles/zev-strategy/ (accessed on 2 January 2021).
- Innovative Clean Transit (ICT) Regulation Fact Sheet|California Air Resources Board. 2021. Available online: https://ww2.arb.ca.gov/resources/fact-sheets/innovative-clean-transit-ict-regulation-fact-sheet (accessed on 2 March 2021).
- Sorlei, I.-S.; Bizon, N.; Thounthong, P.; Varlam, M.; Carcadea, E.; Culcer, M.; Iliescu, M.; Raceanu, M. Fuel Cell Electric Vehicles—A Brief Review of Current Topologies and Energy Management Strategies. Energies 2021, 14, 252. [Google Scholar] [CrossRef]
- Du, Z.; Liu, C.; Zhai, J.; Guo, X.; Xiong, Y.; Su, W.; He, G. A Review of Hydrogen Purification Technologies for Fuel Cell Vehicles. Catalysts 2011, 11, 393. [Google Scholar] [CrossRef]
- Wróblewski, P.; Drożdż, W.; Lewicki, W.; Dowejko, J. Total Cost of Ownership and Its Potential Consequences for the Development of the Hydrogen Fuel Cell Powered Vehicle Market in Poland. Energies 2021, 14, 2131. [Google Scholar] [CrossRef]
- Hunter, C.; Penev, M.; Reznicek, E.; Lustbader, J.; Birky, A.; Zhang, C. Spatial and Temporal Analysis of the Total Cost of Ownership for Class 8 Tractors and Class 4 Parcel Delivery Trucks; Office of Scientific and Technical Information: Oak Ridge, TN, USA, 2021. [Google Scholar]
- Burke, A.; Sinha, A.K. Technology, Sustainability, and Marketing of Battery Electric and Hydrogen Fuel Cell Medium-Duty and Heavy-Duty Trucks and Buses in 2020–2040; UC Davis, National Center for Sustainable Transportation: Davis, CA, USA, 2020. [Google Scholar]
- Baker, S.E.; Stolaroff, J.K.; Peridas, G.; Pang, S.H.; Goldstein, H.M.; Lucci, F.R.; Li, W.; Slessarev, E.W.; Pett-Ridge, J.; Ryeson, F.J.; et al. Getting to Neutral: Options for Negative Carbon Emissions in California, January, 2020; Lawrence Livermore National Laboratory: Livermore, CA, USA, 2020; LLNL-TR-796100. [Google Scholar]
- Scheitrum, D. Renewable Natural Gas as a Solution to Climate Goals: Response to California’s Low Carbon Fuel Standard; University Library of Munich: Munich, Germany, 2017. [Google Scholar]
- Carbon Capture and Sequestration Protocol Under the Low Carbon Fuel Standard|California Air Resources Board. 2021. Available online: https://ww2.arb.ca.gov/resources/documents/carbon-capture-and-sequestration-protocol-under-low-carbon-fuel-standard (accessed on 2 September 2021).
- Bill Text—SB-1505 Fuel: Hydrogen Alternative Fuel. 2021. Available online: https://leginfo.legislature.ca.gov/faces/billTextClient.xhtml?bill_id=200520060SB1505 (accessed on 2 April 2021).
- National Hydrogen and Fuel Cell Day 2020—Exclusive Groundbreaking Images of the Construction of Air Liquide Hydrogen Plant in Nevada|Air Liquide Energies. 2021. Available online: https://energies.airliquide.com/national-hydrogen-and-fuel-cell-day-2020-exclusive-groundbreaking-images-construction-air-liquide (accessed on 21 June 2021).
- Plug Power Inc.—Plug Power to Build Largest Green Hydrogen Production Facility on the West Coast. 2021. Available online: https://www.ir.plugpower.com/Press-Releases/Press-Release-Details/2021/Plug-Power-to-Build-Largest-Green-Hydrogen-Production-Facility-on-the-West-Coast/default.aspx (accessed on 2 September 2021).
- Nikola Orders Enough Electrolysis Equipment From Nel to Produce 40,000 kgs of Hydrogen Per Day. 2021. Available online: https://nikolamotor.com/press_releases/nikola-orders-enough-electrolysis-equipment-from-nel-to-produce-40000-kgs-of-hydrogen-per-day-79 (accessed on 2 September 2021).
- Baronas, J.; Achtelik, G. Joint Agency Staff Report on Assembly Bill 8: 2020 Annual Assessment of Time and Cost Needed to Attain 100 Hydrogen Refueling Stations in California; California Energy Commission and California Air Resources Board: Sacramento, CA, USA, 2020. [Google Scholar]
- LCFS ZEV Infrastructure Crediting|California Air Resources Board. 2021. Available online: https://ww2.arb.ca.gov/resources/documents/lcfs-zev-infrastructure-crediting (accessed on 2 May 2021).
- Kurtz, J.; Sprik, S.; Bradley, T.H. Review of transportation hydrogen infrastructure performance and reliability. Int. J. Hydrogen Energy 2019, 44, 12010–12023. [Google Scholar] [CrossRef]
- Baronas, J.; Achtelik, G. Joint Agency Staff Report on Assembly Bill 8: 2019 Annual Assessment of Time and Cost Needed to Attain 100 Hydrogen Refueling Stations in California; California Energy Commission and California Air Resources Board: Sacramento, CA, USA, 2019. [Google Scholar]
- H2A: Hydrogen Analysis Production Models|Hydrogen and Fuel Cells|NREL. 2021. Available online: https://www.nrel.gov/hydrogen/h2a-production-models.html (accessed on 2 September 2021).
- Hydrogen Delivery Scenario Analysis Model. 2021. Available online: https://hdsam.es.anl.gov/index.php?content=hdsam (accessed on 2 September 2021).
- Hydrogen Refueling Station Analysis Model. 2021. Available online: https://hdsam.es.anl.gov/index.php?content=hrsam (accessed on 2 September 2021).
- Yang, C.; Ogden, J. Determining the lowest-cost hydrogen delivery mode. Int. J. Hydrogen Energy 2007, 32, 268–286. [Google Scholar] [CrossRef] [Green Version]
- Omoniyi, O.; Bacquart, T.; Moore, N.; Bartlett, S.; Williams, K.; Goddard, S.; Lipscombe, B.; Murugan, A.; Jones, D. Hydrogen Gas Quality for Gas Network Injection: State of the Art of Three Hydrogen Production Methods. Processes 2021, 9, 1056. [Google Scholar] [CrossRef]
- European Hydrogen Backbone: How A Dedicated Hydrogen Infrastructure Can Be Created. 2020. Available online: https://gasforclimate2050.eu/wp-content/uploads/2020/07/2020_European-Hydrogen-Backbone_Report.pdf (accessed on 2 September 2021).
- Heavy-Duty Refueling Station Analysis Model. 2021. Available online: https://hdsam.es.anl.gov/index.php?content=hdrsam (accessed on 2 January 2021).
- Reddi, K.; Elgowainy, A.; Rustagi, N.; Gupta, E. Impact of hydrogen refueling configurations and market parameters on the refueling cost of hydrogen. Int. J. Hydrogen Energy 2017, 42, 21855–21865. [Google Scholar] [CrossRef]
- Elgowainy, A.; Reddi, K.; Sutherland, E.; Joseck, F. Tube-trailer consolidation strategy for reducing hydrogen refueling station costs. Int. J. Hydrogen Energy 2014, 39, 20197–20206. [Google Scholar] [CrossRef] [Green Version]
- U.S. Hydrogen Electrolyzer Locations and Capacity|Department of Energy. 2021. Available online: https://www.energy.gov/eere/fuelcells/articles/us-hydrogen-electrolyzer-locations-and-capacity (accessed on 2 August 2021).
- Sadik-Zada, E.R.; Gatto, A. Energy Security Pathways in South East Europe: Diversification of the Natural Gas Supplies, Energy Transition, and Energy Futures. In From Economic to Energy Transition: Three Decades of Transitions in Central and Eastern Europe; Mišík, M., Oravcová, V., Eds.; Springer: Cham, Switzerland, 2021; pp. 491–514. ISBN 978-3-030-55085-1. [Google Scholar] [CrossRef]
- Energy Commission Approves Plan to Invest Up to $115 Million for Hydrogen Fueling Infrastructure. 2021. Available online: https://www.energy.ca.gov/news/2020-12/energy-commission-approves-plan-invest-115-million-hydrogen-fueling (accessed on 2 September 2021).
- California Retail Fuel Outlet Annual Reporting (CEC-A15) Results. 2021. Available online: https://www.energy.ca.gov/data-reports/energy-almanac/transportation-energy/california-retail-fuel-outlet-annual-reporting (accessed on 2 October 2021).
- Self-Sufficiency Study|California Air Resources Board. 2021. Available online: https://ww2.arb.ca.gov/resources/documents/self-sufficiency-study?utm_medium=email&utm_source=govdelivery (accessed on 2 October 2021).
- California Governor’s Office Of Business And Economic Development. Hydrogen Station Permitting Guidebook; California Governor’s Office Of Business And Economic Development: Sacramento, CA, USA, 2020.
- Eichman, J.; Flores-Espino, F. California Power-to-Gas and Power-to-Hydrogen Near-Term Business Case Evaluation; NREL: Golden, CO, USA, 2016.
- Congressional Research Service, The Tax Credit for Carbon Sequestration (Section 45Q). 2020. Available online: https://crsreports.congress.gov (accessed on 21 January 2021).
- Parkinson, B.; Balcombe, P.; Speirs, J.F.; Hawkes, A.D.; Hellgardt, K. Levelized cost of CO2 mitigation from hydrogen production routes. Energy Environ. Sci. 2019, 12, 19–40. [Google Scholar] [CrossRef]
- Collodi, G.; Azzaro, G.; Ferrari, N.; Santos, S. Techno-economic Evaluation of Deploying CCS in SMR Based Merchant H2 Production with NG as Feedstock and Fuel. Energy Procedia 2017, 114, 2690–2712. [Google Scholar] [CrossRef]
- James, B.; Colella, W.; Moton, J.; Saur, G.; Ramsden, T. PEM Electrolysis H2A Production Case Study Documentation; Technical Report Number NREL/TP-5400-61387; NREL: Golden, CO, USA, 2013. [CrossRef] [Green Version]
- Natural Gas—US Energy Information Administration (EIA). 2021. Available online: https://www.eia.gov/naturalgas/ (accessed on 2 February 2021).




| Year in Which ZEVs Reach 100% of Total Vehicle Sales | Scenarios | |
|---|---|---|
| Low | High | |
| Transit buses | 2030 | 2030 |
| LDVs | 2040 | 2035 |
| Class 2b/3 heady duty pickup trucks | 2040 | 2035 |
| Class 4–7 Delivery trucks | 2040 | 2035 |
| Class 7–8-day trucks (including drayage) | 2040 | 2035 |
| Class 8 tractor (long haul) trucks | 2045 | 2040 |
| FCEV Share of ZEV Sales, Low Scenario | FCEV Share of ZEV Sales, High Scenario | |||
|---|---|---|---|---|
| 2030 | 2040 and beyond | 2030 | 2040 and beyond | |
| LDVs | 5% | 10% | 18% | 50% |
| Transit buses | 20% | 20% | 25% | 50% |
| Class 2b/3 heady duty pickup trucks | 15% | 25% | 20% | 50% |
| Class 4–7 Delivery trucks | 15% | 20% | 20% | 50% |
| Class 7–8-day trucks (including drayage) | 33% | 33% | 40% | 66% |
| Class 8 tractor (long haul) trucks | 60% | 60% | 66% | 97% |
Year  | 2025 | 2030 | 2035 | 2040 | 2045 | 2050 | ||||||
|---|---|---|---|---|---|---|---|---|---|---|---|---|
Scenario  | Slow EL | Fast EL | Slow EL | Fast EL | Slow EL | Fast EL | Slow EL | Fast EL | Slow EL | Fast EL | Slow EL | Fast EL |
| Percentage of new plants employing SMR technology | 95% | 95% | 76% | 63% | 57% | 32% | 38% | 0% | 19% | 0% | 0% | 0% |
| Percentage of new plants employing electrolysis technology | 5% | 5% | 24% | 37% | 43% | 68% | 62% | 100% | 81% | 100% | 100% | 100% |
| S. No | Pathway Name | Production Technology | Delivery Mode | Refueling Type |
|---|---|---|---|---|
| 1.5 tpd refueling station | ||||
| 1 | STG | SMR (CC), central production | Tube trailer | Gaseous |
| 2 | SLG | SMR (CC), central production | Liq.H2 truck | Gaseous |
| 3 | SPG | SMR (CC), central production | Pipeline | Gaseous |
| 4 | ETG | Electrolysis (PEM), central production | Tube trailer | Gaseous |
| 5 | ELG | Electrolysis (PEM), central production | Liq.H2 truck | Gaseous |
| 6 | EPG | Electrolysis (PEM), central production | Pipeline | Gaseous |
| 5 tpd refueling station | ||||
| 7 | SLL | SMR (CC), central production | Liq.H2 truck | Liquid |
| 8 | SPG | SMR (CC), central production | Pipeline | Gaseous |
| 9 | ELL | Electrolysis (PEM), central production | Liq.H2 truck | Liquid |
| 10 | EPG | Electrolysis (PEM), central production | Pipeline | Gaseous |
| 11 | SG | SMR, onsite production | - | Gaseous |
| 12 | SL | SMR, onsite production | - | Liquid |
| 13 | EG | Electrolysis (PEM), onsite production | - | Gaseous |
| 14 | EL | Electrolysis (PEM, onsite production | - | Liquid |
| S. No | Type of Hydrogen Cost | Sensitivity Case | Factors Considered |
|---|---|---|---|
| 1 | Production | Central Electrolysis |
|
| 2 | Central SMR | ||
| 3 | Distributed electrolysis | ||
| 4 | Distributed SMR | ||
| 5 | Delivery | Gaseous pipeline |
|
| 6 | Gaseous tube trailer | ||
| 7 | Liquid tanker | ||
| 8 | Refueling | Station with pipeline delivery of hydrogen |
|
| 9 | Station with liquid tanker delivery of hydrogen | ||
| 10 | Station with tube trailer delivery of hydrogen |
Publisher’s Note: MDPI stays neutral with regard to jurisdictional claims in published maps and institutional affiliations. |
© 2021 by the authors. Licensee MDPI, Basel, Switzerland. This article is an open access article distributed under the terms and conditions of the Creative Commons Attribution (CC BY) license (https://creativecommons.org/licenses/by/4.0/).
Share and Cite
Vijayakumar, V.; Jenn, A.; Fulton, L. Low Carbon Scenario Analysis of a Hydrogen-Based Energy Transition for On-Road Transportation in California. Energies 2021, 14, 7163. https://doi.org/10.3390/en14217163
Vijayakumar V, Jenn A, Fulton L. Low Carbon Scenario Analysis of a Hydrogen-Based Energy Transition for On-Road Transportation in California. Energies. 2021; 14(21):7163. https://doi.org/10.3390/en14217163
Chicago/Turabian StyleVijayakumar, Vishnu, Alan Jenn, and Lewis Fulton. 2021. "Low Carbon Scenario Analysis of a Hydrogen-Based Energy Transition for On-Road Transportation in California" Energies 14, no. 21: 7163. https://doi.org/10.3390/en14217163
APA StyleVijayakumar, V., Jenn, A., & Fulton, L. (2021). Low Carbon Scenario Analysis of a Hydrogen-Based Energy Transition for On-Road Transportation in California. Energies, 14(21), 7163. https://doi.org/10.3390/en14217163


