Abstract
In this paper, an in situ investigation and comparison of energy consumption and efficiency of two devices for implementation of the thermo-injection masonry wall drying method are presented. The following drying devices were considered: the currently used device (CUD) and the novel prototype device (NPD) with optimized control of the operating parameters. The historic building subjected to the drying and renovation was located in the city of Łowicz (Poland). The temperature and relative humidity of the air in several points in the basement and the temperature and moisture content at various locations in the considered masonry wall segments, as well as the electrical parameters for both devices, were measured in the real time and registered by applying a dedicated data acquisition system. The specific energy consumption during drying, defined as the energy consumption divided by the length of the drying wall section and by the mean volumetric moisture content change in the wall, was equal to 16.58 and 10.44 kWh/m/moisture content vol.% for the CUD and NPD, respectively. Moreover, the moisture content in the wall decreased by an average of 2.13 and 3.22 vol.% for the CUD and NPD, respectively, while the temperature of the wall surface in the drying zone was increased to approximately 35–40 °C and 40–65 °C for the CUD and NPD, respectively. The obtained results showed that the NPD was much more efficient than the CUD and that the building renovation process may be more environmentally friendly by applying more efficient drying devices and strategies.
1. Introduction
Healthy masonry walls in buildings are required to preserve the good conditions of building elements, efficient heating and cooling of the building and the wellbeing of the occupants [1]. However, many buildings have problems with excessive moisture in some building elements. There are many sources of dampness in building structures, such as leakage of roofs or hydraulic installations, water uptake from the ground or flooding. In the case of historical buildings, a lack of or wearing out of waterproofing of foundations and masonry walls is the main reason for excessive moisture content in buildings [2]. If the excessive moisture is found in the building’s elements, the building must be renovated. The renovation of wet masonry walls is divided into three steps [3]. In the first one, the excessive moisture is removed from the wall by applying the drying process. In the second step, the waterproofing is created (i.e., the new impermeable membrane is generated inside the masonry wall). In the last step, the wall structure is restored.
The most problematic as well as time- and energy-consuming step is the first step of the renovation of wet walls, in which masonry walls are dried by applying different techniques (e.g., convective [4,5,6], vacuum [7] or microwave drying [2,8]). Therefore, in order to improve the overall efficiency of the masonry wall renovation process, the drying step should be optimized. This may be achieved by using both experimental [4] and theoretical methods [9]. However, real-scale experimental investigations on the drying process efficiency and optimization are missing. Moreover, the improvement of the efficiency of the drying process of masonry walls may include activities such as optimization of the drying method parameters, proposing a new drying strategy or improvement of the drying device. However, no such activities were reported in the literature, aside from the work of Cieślikiewicz et al. [3], who studied the hygrothermal behavior of a wet masonry wall in a historic building during its drying and assessed the energy consumption of the process.
In terms of dampness in building structures, most related works were focused on the problem of the monitoring and analysis of moisture content during different periods of a building’s normal or standard utilization. In these studies, moisture and temperature monitoring were crucial for identification of a building’s problems and prediction of a building’s performance. Several investigations related to different in situ monitoring techniques and systems for moisture and temperature behavior in buildings were published [10]. For example, Válek et al. [11] used infrared thermography, complex resistivity, ground penetrating radar and ultrasonics to analyze the drying behavior of flooded masonry walls made of fired clay brick, sandstone and spongolite. As a benchmark method for moisture content measurement, the gravimetric method was applied. They concluded that different non-destructive testing methods gave qualitatively good matching of the measurements. Full-scale masonry models were applied in a case study to understand the behavior of brick and stone masonries during and after a flood and the drying rate of both high- and low-porosity materials by Binda et al. [12]. They compared and assessed the effectiveness of different measurement techniques (e.g., radar tests, thermography tests, sonic tests and minor destructive powder drilling tests) able to detect the presence of moisture in the walls and its change after a flood and during natural drying. They concluded that, although the thermography and radar tests had shown very good effectiveness and sensitivity in moisture detecting, the powder drilling test seemed to be the best way of measuring the moisture content and its variation and distribution inside the masonry wall. The system for estimation of the moisture content not only on the surface but also inside the wall, including thehistorical buildings, which was based on a hybrid tomography original measurement sensor system and a solution of the inverse problems, was proposed by Rymarczyk et al. [13]. In the next paper, Rymarczyk et al. [14] applied four machine learning methods (total variation, least-angle regression, elastic net and artificial neural networks) to reconstruct electrical tomographic images in applications related to the detection of moisture in the walls of historical buildings. Based on the obtained results, including tests in real conditions, the elastic net method was indicated as the most efficient in the spatial tomographic reconstructions of the moisture distribution in walls. A large-scale laboratory set-up with four test rooms designed for the investigation of drying of walls was proposed by Zegowitz et al. [15]. The stand was closed in a large climate simulator, in which the water damage and surrounding air parameters were artificially simulated. To monitor the drying behavior of wet walls, they applied more than 300 sensors for the moisture content, relative humidity and temperature measurements, accompanied by the thermography. Zegowitz et al. [15] compared different drying systems (e.g., the under floor drying equipment, infrared heating panels and lance wall drying system). The in situ long period investigation of the moisture content behavior in a solid brick wall with different internal insulations of varying thermal and moisture characteristics was presented by Walker and Pavía [16]. The measurement of the temperature and relative humidity near the internal interface between the insulation and solid brick wall was carried out over two-and-a-half-year period. Walker and Pavía [16] found that the moisture accumulation and transfer in walls were highly dependent on the vapor permeability of the insulation layer. The experimental stand for investigation of the drying process in a lab-scale model of a red brick wall was proposed by Cieślikiewicz et al. [4]. They developed a dedicated acquisition system for the long-term measurements which consisted of the temperature and relative humidity sensors for registration of surrounding air parameters, the precise platform balance for the measurement of the moisture content change in the sample and several time domain reflectometry (TDR) probes and resistance temperature detectors (RTDs) for monitoring the sample local distribution of the volumetric moisture content and temperature, respectively. They presented the preliminary results of monitoring of the drying process of a small-scale wall model. Recently, Knarud et al. [17] studied the wetting and drying behavior of masonry wall segments mounted in a large-scale building envelope climate simulator and exposed to a climatic sequence including driving rain. The interior of the wall was insulated and had embedded wooden beam ends. A large variety of masonry behavior—and hence segment performance—was observed. Moreover, the investigation gave the indication of improved segment drying, having a smart vapor barrier instead of a traditional polyethylene vapor barrier.
The mentioned studies mostly dealt with monitoring the moisture accumulation and transfer in building elements under their normal or standard usage. Only a few papers [3,4,15] were related to the analysis of a forced drying process. The state of the art is still missing wide studies of the hygrothermal behavior of the masonry wall during its forced drying at a real scale with analysis of the energy efficiency of this process and its optimization. This gap in the knowledge is partially filled in this work, as the performance of two different drying devices for removing moisture from masonry walls in historical buildings is compared in terms of the hygrothermal parameters of the walls and the energy consumption during the process. The most important contribution of this paper is the real-time hygrothermal analysis of the drying process in a real-scale historic building subjected to the excessive moisture problem. Such studies are very rarely reported in the literature. Moreover, the new device for drying process implementation with improved drying efficiency and a two-phase drying strategy are shown. Practical information about its construction and operating parameters are provided and may be interesting for other researchers and designers in the field of building renovation.
The drying process itself is very time- and energy-consuming. Most of the available literature is devoted to the analysis of the energy consumption and efficiency of the drying process in the food and wood industries. However, the drying process is even more time- and energy-consuming in the case of drying of building elements and structures due to their large sizes and unfavorable hygrothermal properties (i.e., moisture and heat transfer processes in building elements are very slow). To fulfill current environmental requirements related to power consumption reduction and decreasing carbon traces, the masonry wall drying methods must be optimized on the device and process levels. Such studies are undertaken in this paper.
This paper is organized as follows. First, the renovated historic building and considered segments of masonry walls are characterized. Then, descriptions of the applied drying and waterproofing techniques, drying devices, developed data acquisition system and research methodology are given. Next, the results of monitoring the drying processes implemented using two different drying devices are shown and discussed. Finally, the comparison of the devices is summarized in terms of the power consumption and drying efficiency.
2. Materials and Methods
2.1. Building under Consideration
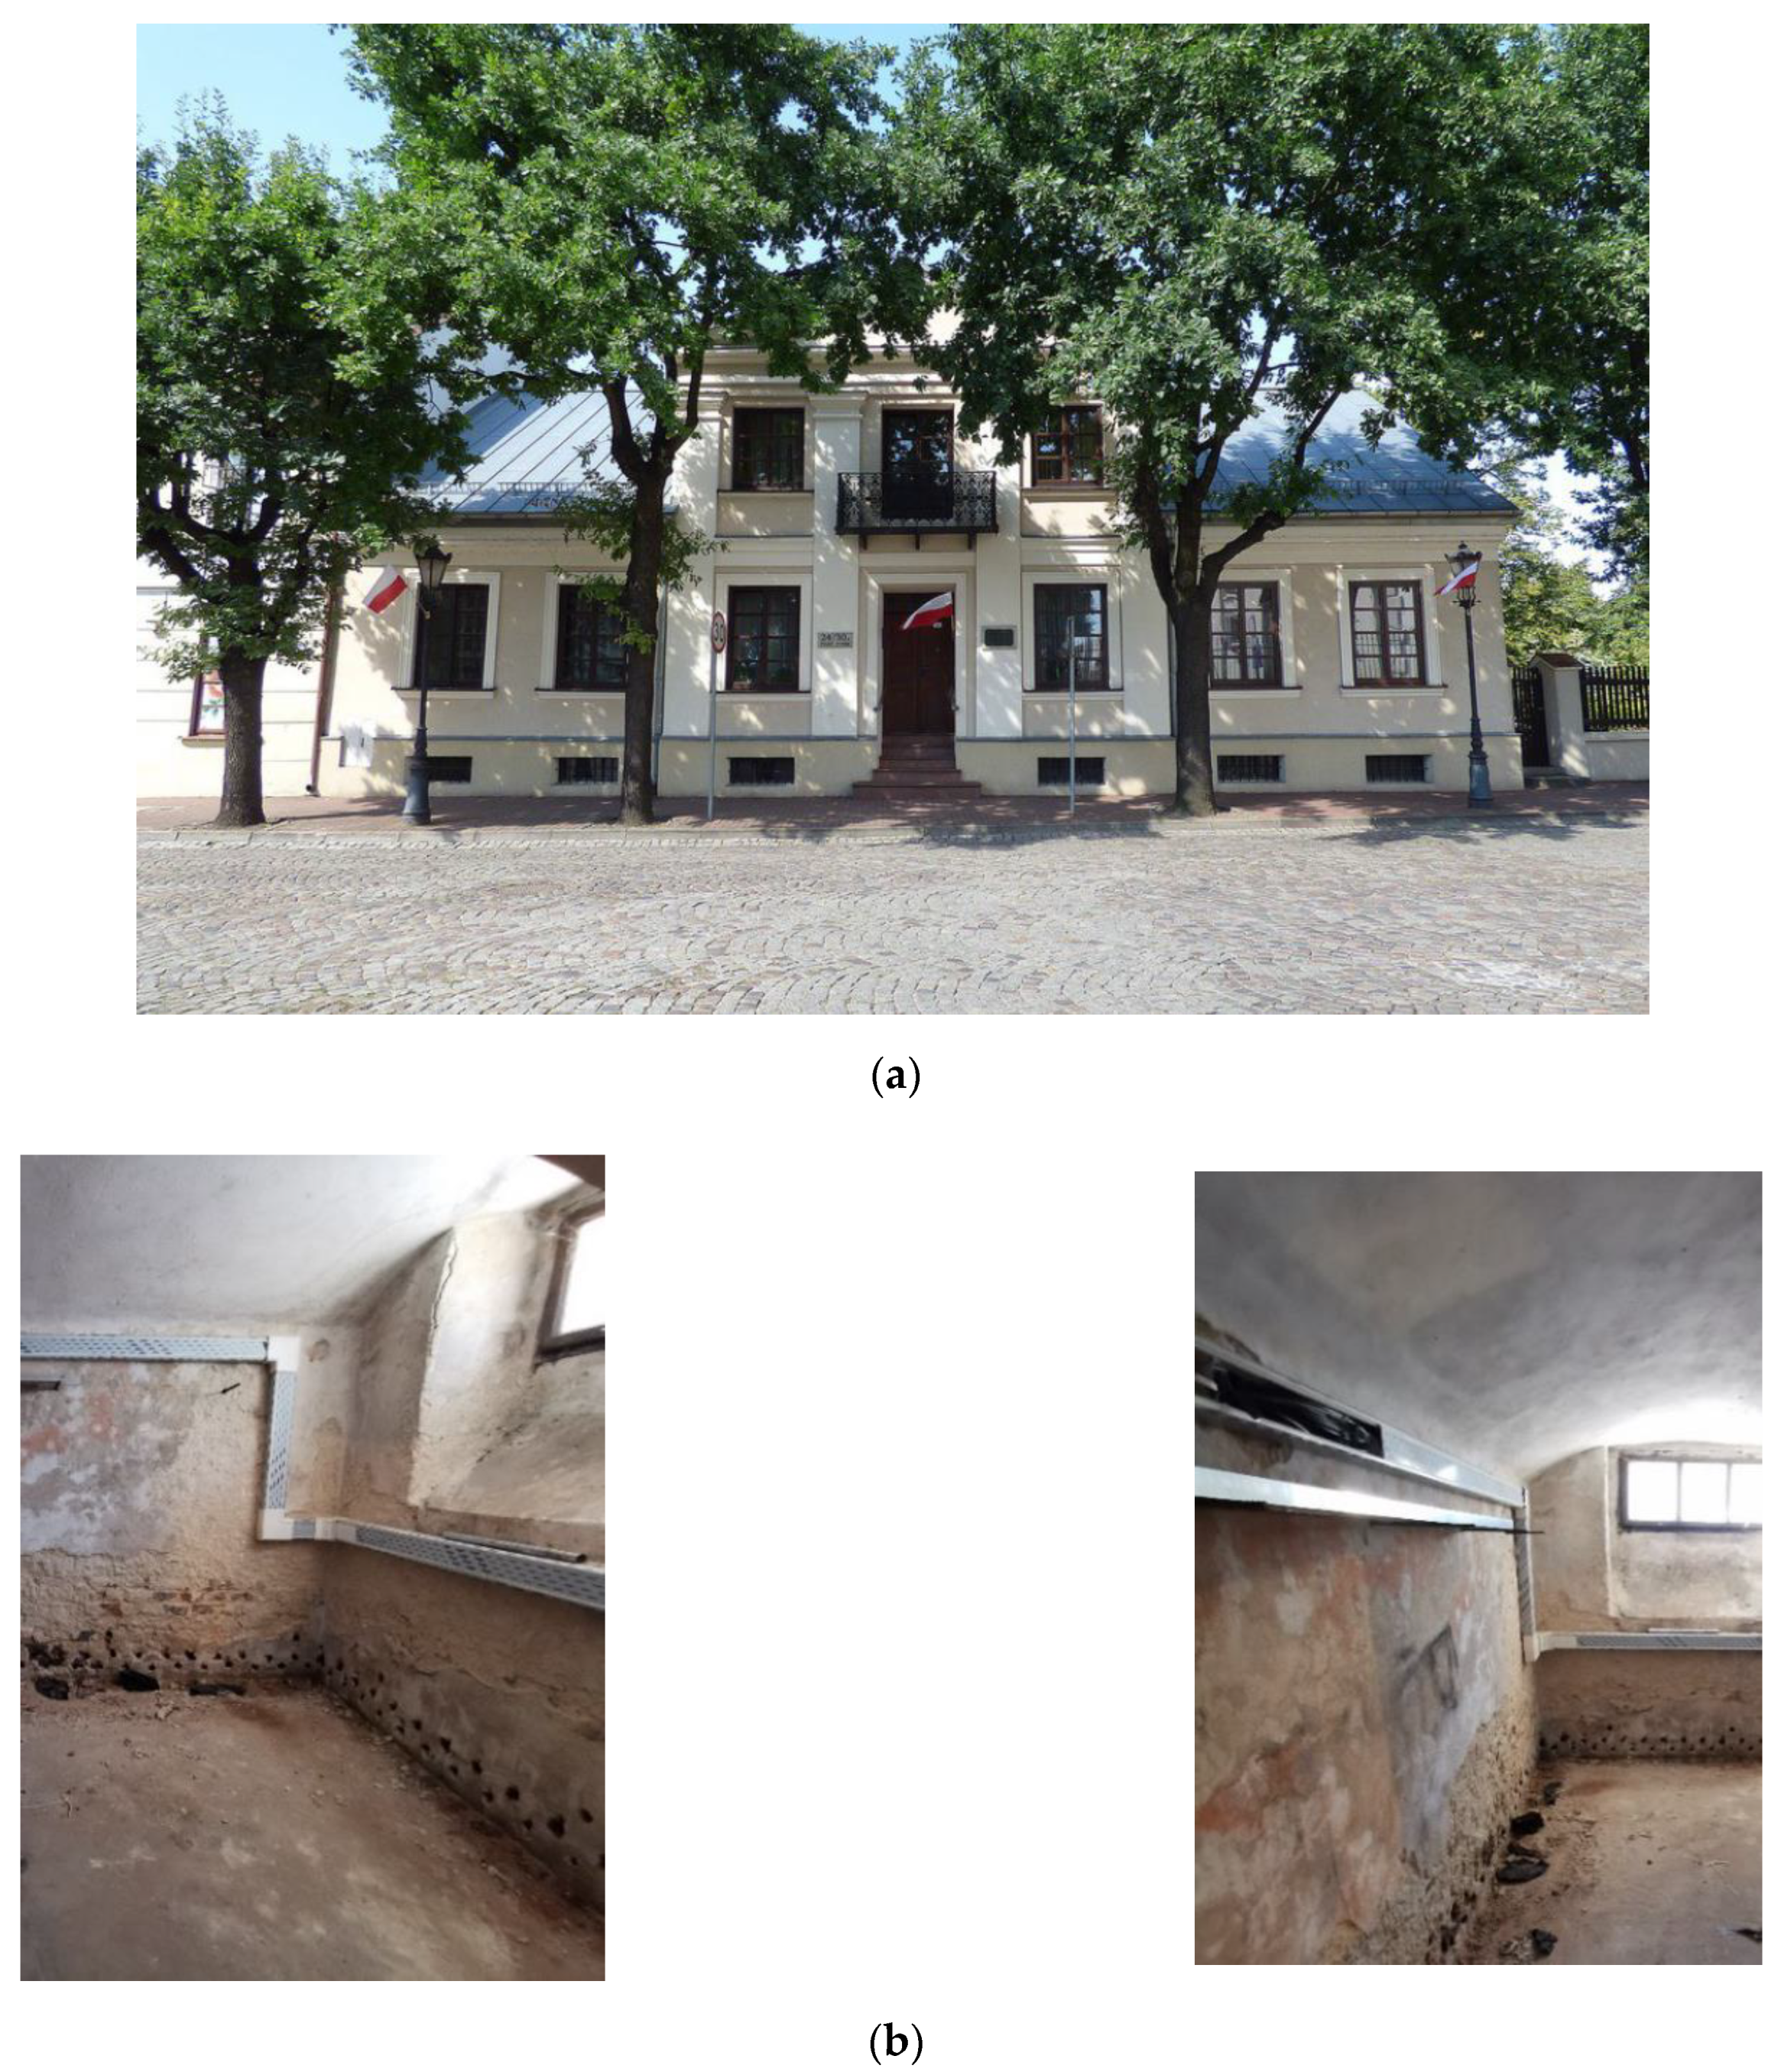
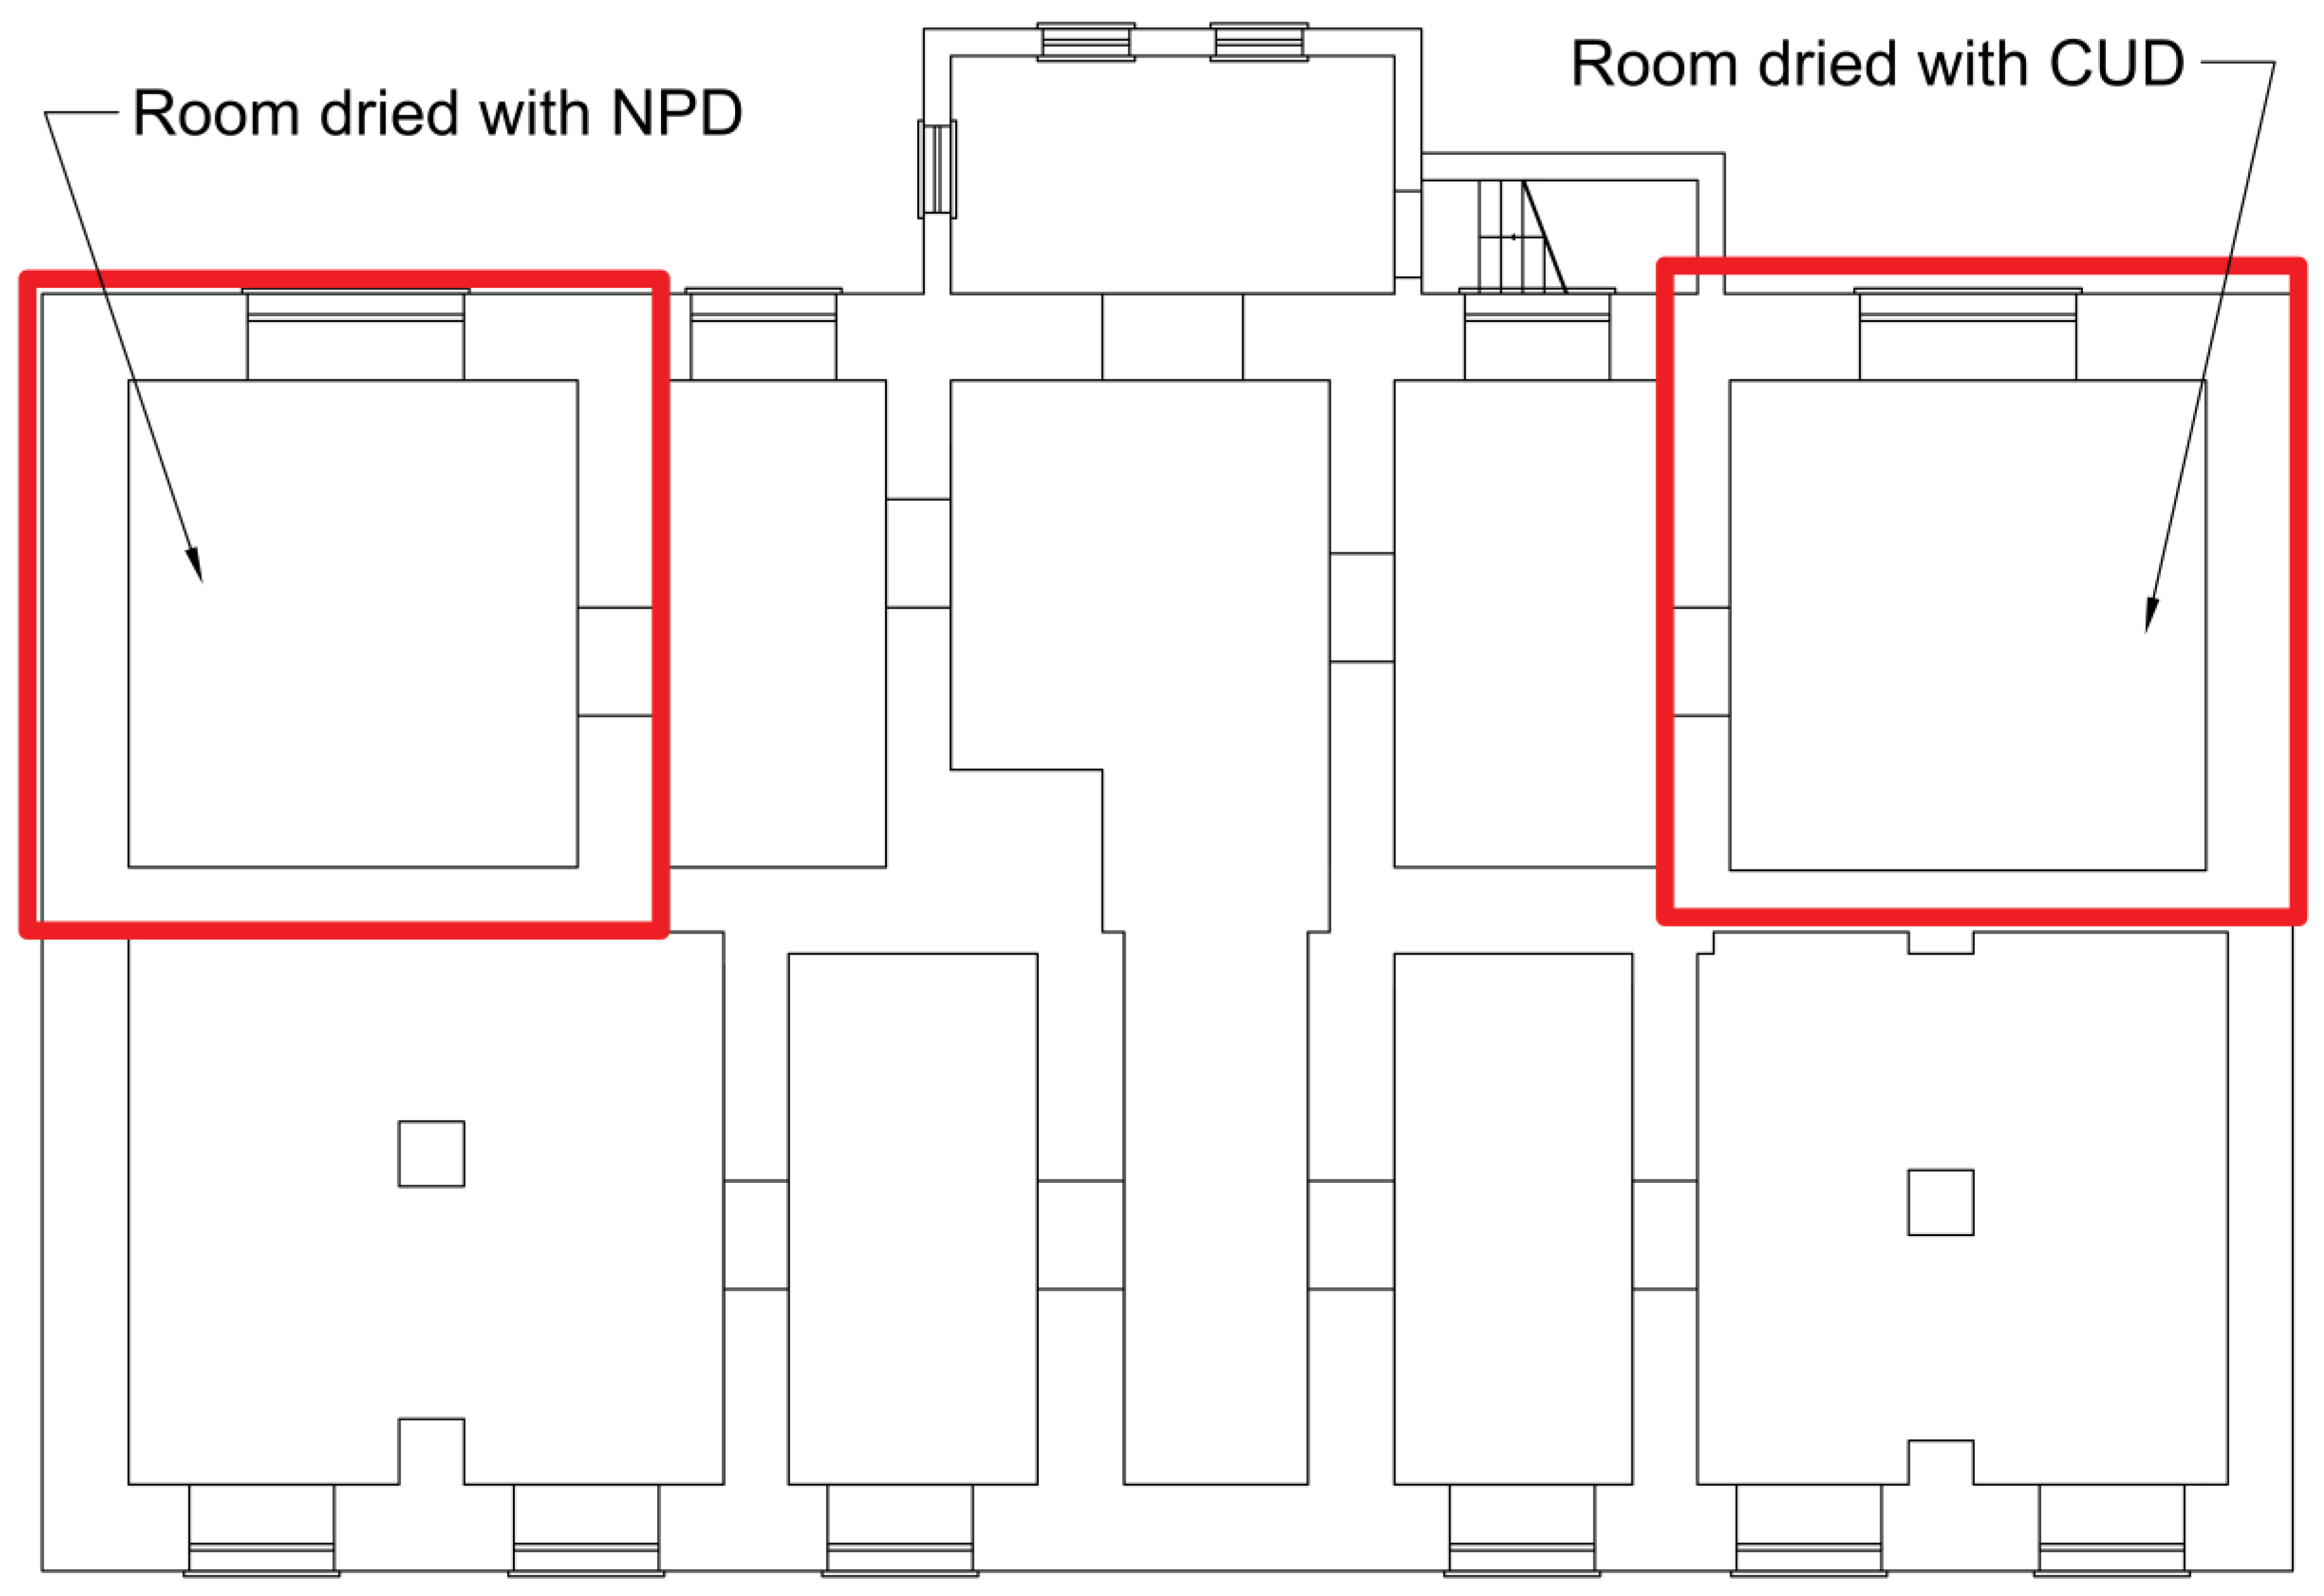
The building under study, located in the city of Łowicz (Poland), is a former monastery. Nowadays, it is a rectory. The building was erected at the end of the eighteenth century, and it is a member of the historic buildings group, which is a part of the northern frontage of the Old Market Square in Łowicz. The building is recorded in the provincial register of monuments. Pictures of the building and its basement are shown in Figure 1. The building is made of a red fired brick and lime-based joints. In the basement, the masonry’s thickness ranges from approximately 60 up to 80 cm. Moreover, on the internal side, the walls in the basement are covered with a lime-based plaster with a thickness of approximately 2–3 cm, while on the external side, they are partially in contact with the soil. The plan of the basement is presented in Figure 2, while the structure of the considered masonry walls with the drying hole and heating probe is shown on Figure 3.
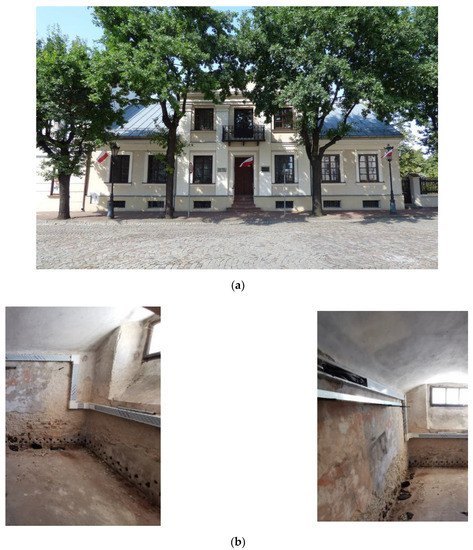
Figure 1.
Picture of (a) the renovated building and (b) the moist basement of the building.
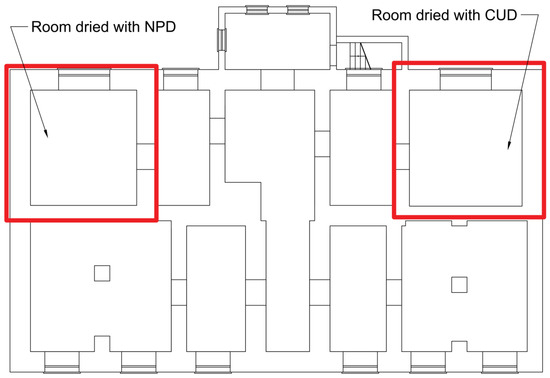
Figure 2.
Schematic of the dried basement with locations of the analyzed parts of the masonry walls.
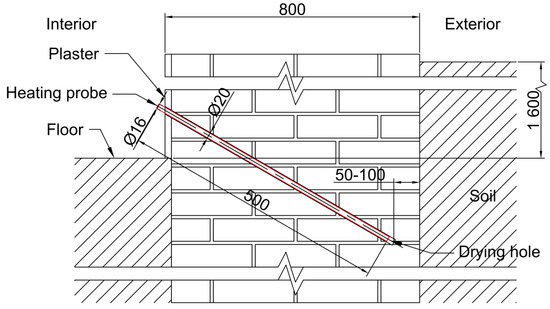
Figure 3.
Cross-section of the dried masonry wall along the upper drilling hole, with the wall structure presented and the heating probe inside the hole (dimensions in mm).
During the inspection of the building basement, signs of dampness on the plastered walls were found, as may be noticed in Figure 1b. Detailed measurements in several locations in the basement indicated that the moisture content in the masonry walls was in the range of 5–11% wt., which is a much higher level than the recommended value of 3% wt. These tests, by applying the calcium carbide method (C-M Hydrometer by Gann), were carried out using residue samples which were taken in 6 locations in the basement by drilling holes 30–35 cm deep and approximately 10 cm above the floor. The reason for the presence of the excessive moisture in the masonry walls was the capillary uptake of water from the ground due to the lack of effective vertical and horizontal waterproofing. Therefore, it was decided to renovate the basement of the building (i.e., the following work was planned: drying of masonry walls, creation of waterproofing and replacement of the old plaster with new plaster).
2.2. Drying Method
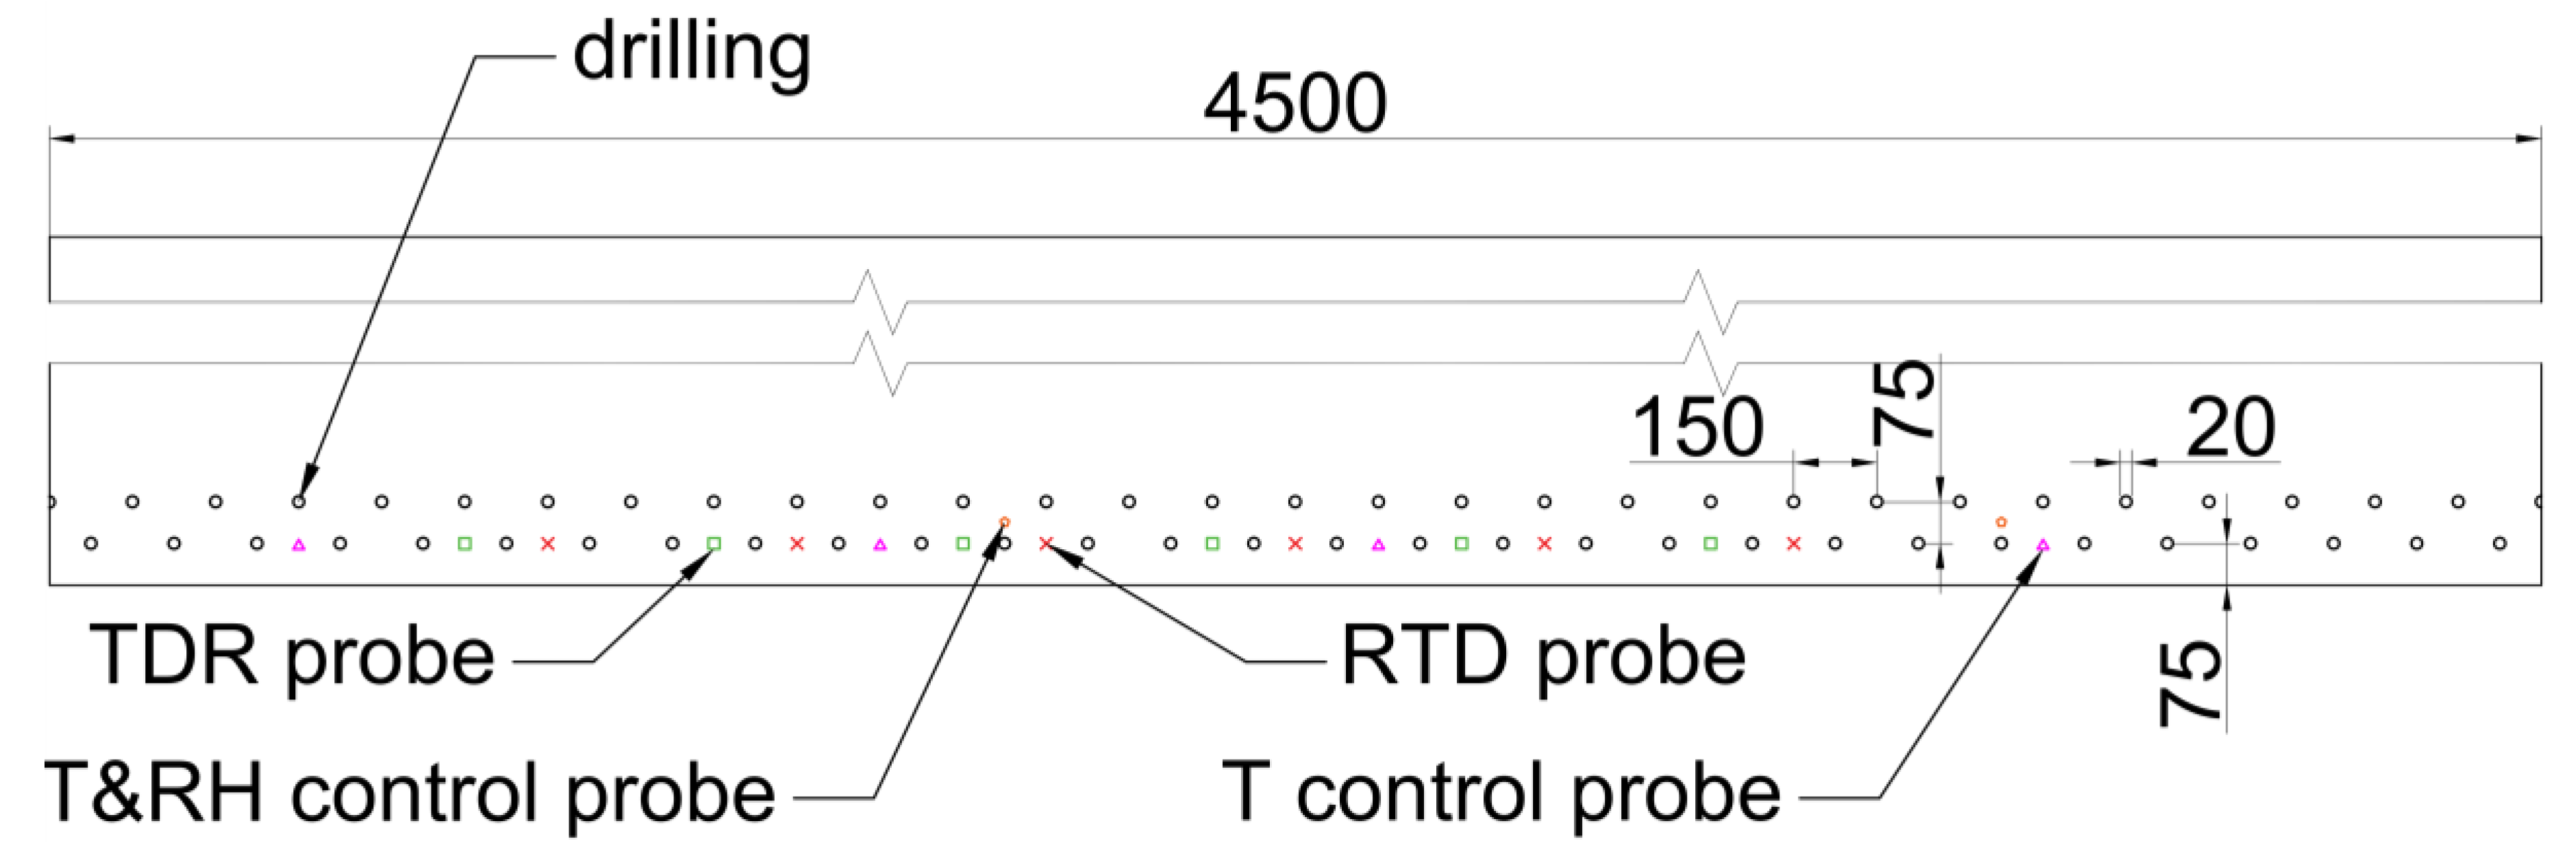
The drying process was carried out by applying the thermo-injection method, which is a convective drying method [3,4]. In the first step of this method, at the internal side of the wall segment, a set of 20-mm drying holes every 15 cm and at an angle of 30° from the horizon was prepared in 2 staggered rows. The depths of the holes were selected in a such way that they ended approximately 5–10 cm from the external side of the wall. A cross-section along a single drying hole is presented in Figure 3, while the hole’s spatial distribution is shown in Figure 4. Then, dedicated heating probes were mounted in the upper row, which heated the wall and provided air to the holes for drying. When the drying process decreased the moisture content of the wall to approximately 3–4% wt., the heating stopped, and the second step of the thermo-injection method began. In this step, the special hydrophobic silicone micro-emulsion was injected under elevated pressure by applying dedicated injectors mounted in all the holes. This silicone micro-emulsion penetrated the wall material and created a waterproof membrane in the masonry wall. The lower the moisture content and the higher wall temperature (not exceeding 60 °C due to cross-linking of the silicon emulsion in a temperature above 62 °C), the deeper the penetration of the silicon micro-emulsion into the wall material, as explained in [3]. In the third step of the thermo-injection method, the wall structure was recreated by filling the holes with the dedicated mortar and by covering the wall with the new plaster.
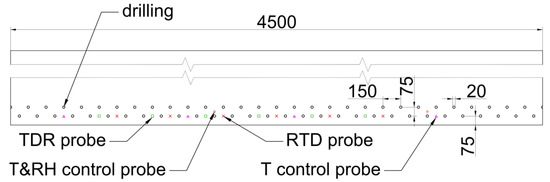
Figure 4.
Spatial distribution of drying holes and the positions of sensors in the wet masonry wall (dimensions in mm; RTD = resistance temperature detector, T = temperature, T&RH = temperature and relative humidity and TDR = time domain reflectometry).
It should be noted that for cases with very high penetration of water in the wall or for a very moist ground, the second row of holes drilled from the external side above the first one is also applied to stop the lateral moisture penetration. However, this increases the cost of the renovation process and is rarely used. From practice, in most cases, one row of holes at the bottom of the wall is enough to stop the water uptake from the ground and to significantly decrease the moisture amount in the wall.
For more than 30 years, the thermo-injection method has been successfully used in the renovation of many precious buildings in Poland [3]. It is approved by monument conservators and allowed to be applied in protected historic buildings. However, the method needs upgrading on the equipment and process levels to follow current trends related to improvement of the efficiency of industrial processes.
2.3. Drying Devices
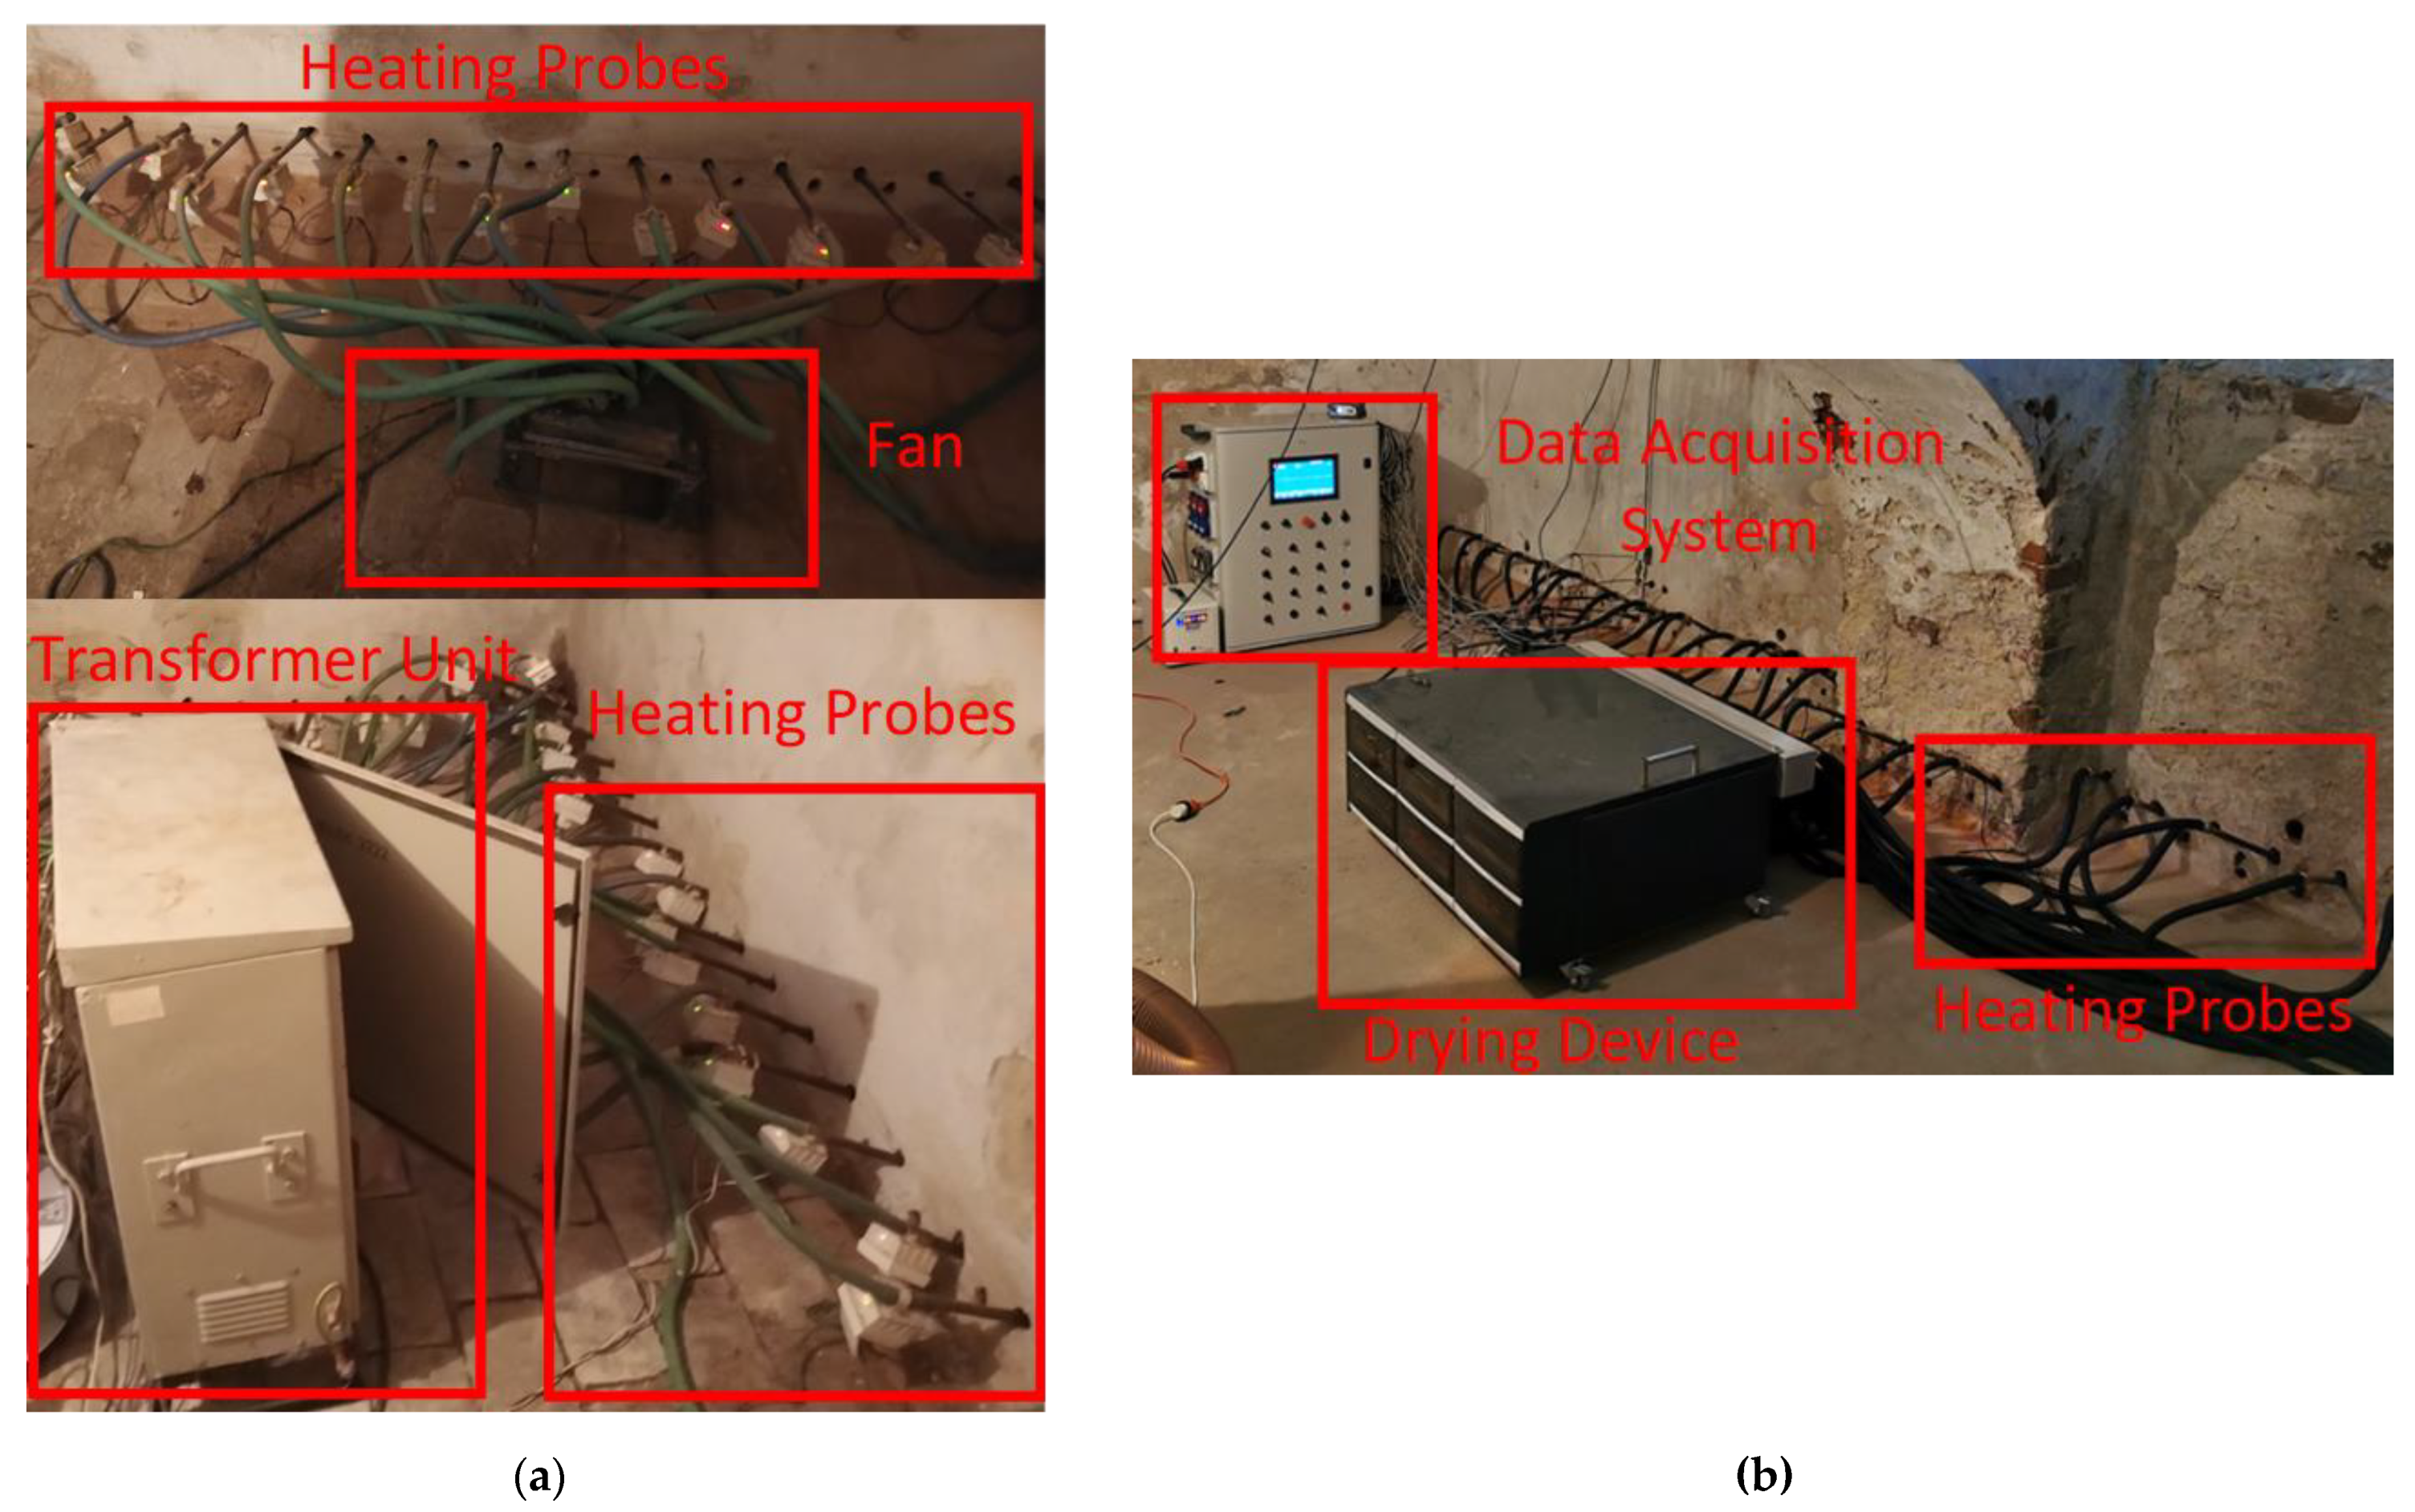
The investigation of the drying process in real masonry walls was carried out by applying two drying devices: the currently used device (CUD) presented in Figure 5a and the novel prototype device (NPD) presented in Figure 5b. Both devices are compared in Table 1. The CUD consists of several separate fans, which supply drying air to the heating probes, a separate transformer, which supplies power to the heating probes, and several dozens of heating probes. In this research, the CUD was configured to dry 8.5 m of the masonry wall using 60 24 V AC drying probes of 40 W, each grouped in 10 sections of 6 probes with independent overcurrent protection and 3 AC centrifugal fans. Pipes were connected to the manifolds mounted at the fan outlets. The pipes from the fans to the probes had different lengths, which resulted in uneven air distribution between the probes. The fans worked with constant power, and no automatic control system was integrated with this device. The NPD had a smaller working length equal to 5 m of the masonry wall and used 35 24 V AC drying probes of 40 W each. The probes were grouped into 7 sections of 5 probes with independent power control systems for each section. This device had 2 integrated DC fans with variable speeds. The heating probes and fans were powered from the transformer and DC supplier, respectively. The pipes connecting the drying probes and the device all had the same length. The prototype was remotely controlled with the use of a mobile application. Moreover, temperature and relative humidity sensors were added to control the drying process and device operation. All elements of the NPD (e.g., the transformer, fans, manifolds, control system and DC supplier) were integrated into a single chassis. The detailed description of this device was presented in [3].

Figure 5.
Picture of devices applied for drying: (a) the CUD and (b) the NPD.

Table 1.
Comparison of both devices (i.e., CUD and NPD) for the implementation of the thermo-injection method.
2.4. Data Aqusition System and Sensors
Both devices (i.e., the CUD and NPD) were connected to the same data acquisition system, which consisted of the following:
- A PLC controller with a 10” screen, applied for collecting data from all sensors, storing them on the internal memory and remote connection via a LTE GSM modem (XV 303 manufactured by Eaton Industries GmbH).
- Three air relative humidity and temperature transducers with accuracies of ±2% and ±0.3 °C for the relative humidity and temperature, respectively. Sensors were placed in 3 locations in the room: at the device inlet, in the middle of the considered room at a height of 0.5 m from the ceiling and near the wet wall at a height of 10 cm from the floor (AR 252 manufactured by APAR).
- A TDR device with 6 field probes with a maximum error of ±2 vol.% for the moisture content. The locations of the probes in the masonry wall are presented in Figure 3 (TDR/MUX/MPTS manufactured by E-TEST).
- Six resistance temperature detectors with three-wire connections. They had the A tolerance class and maximum acceptable error defined in standards lower than ±0.3 °C for the measured temperatures. The locations of the detectors in the masonry wall are presented in Figure 3 (PT1000 manufactured by Termoaparatura Wroclaw).
- A 1-phase power network meter with a 32/63 A measurement range. It measured the voltage with a basic error of ±0.2%, the current with a basic error of ±0.2%, the active power with a basic error of ±0.5%, the reactive power with a basic error of ±0.5%, the apparent power with a basic error of ±0.5%, the frequency with a basic error of ±0.2%, the active energy with a basic error of ±0.5% and the reactive energy with a basic error of ±0.5% (N27P manufactured by LUMEL).
Moreover, an infrared camera (i7 by Flir) was applied to generate thermograms. This camera had a resolution of 140 × 140 pixels, a thermal sensitivity lower than 100 mK, a field of view of 29 × 29° and 9 Hz for the imaging frequency, with an accuracy of ±2 °C or ±2% for reading the ambient temperature from 10 to 35 °C and object temperatures above 0°.
The data acquisition system and sensors were successfully verified for possible interaction, and test measurements were carried out, showing that the system worked correctly.
2.5. Research Methodology
The research methodology was based on the real-time measurement of the parameters (i.e., the volumetric moisture content and temperature) at several points of two segments of the wet masonry walls during their drying process. One of the segments was dried by applying a CUD and the other by applying an NPD. Both masonry wall segments were localized in the same building but in different parts of its basement and were dried one after another. The volumetric moisture content was monitored to find the water amount reduction in the masonry wall, while the wall temperature was recorded to observe how both devices effectively transferred heat to the wet masonry wall. Moreover, the temperature levels in the masonry wall should be monitored because the thermo-injection method has a limitation for the wall temperature; it should not exceed 60 °C due to possible cross-linking of the micro-emulsion injected into the wall immediately after the drying is stopped in the second phase of the renovation process. This micro-emulsion cross-links in temperatures above 62 °C [3]. The real-time electrical parameters of both devices during implementation of the thermo-injection drying process were also registered to find their power consumption. Moreover, the air temperature and relative humidity in the basement close to the considered walls were recorded to have insight into the ambient air parameters and their influence on the masonry wall temperatures and moisture contents.
Based on the results of the measurements, the power consumption and drying efficiency of both devices were analyzed in terms of the moisture content reduction in the considered masonry wall segments. Additionally, the influence of the ambient air parameters on the courses of the drying processes were studied.
This contribution was based on a previous paper [3] (i.e., similar research and measurement methodologies and the same historic building have been considered). However, this paper compares, in terms of the power consumption and energy efficiency, two drying devices (i.e., the CUD and NPD) applied for the implementation of the thermo-injection drying method. In the work of Cieślikiewicz et al. [3], attention was paid to the real-time monitoring of the hygrothermal behavior of the wet masonry wall during its drying process.
3. Results and Discussion
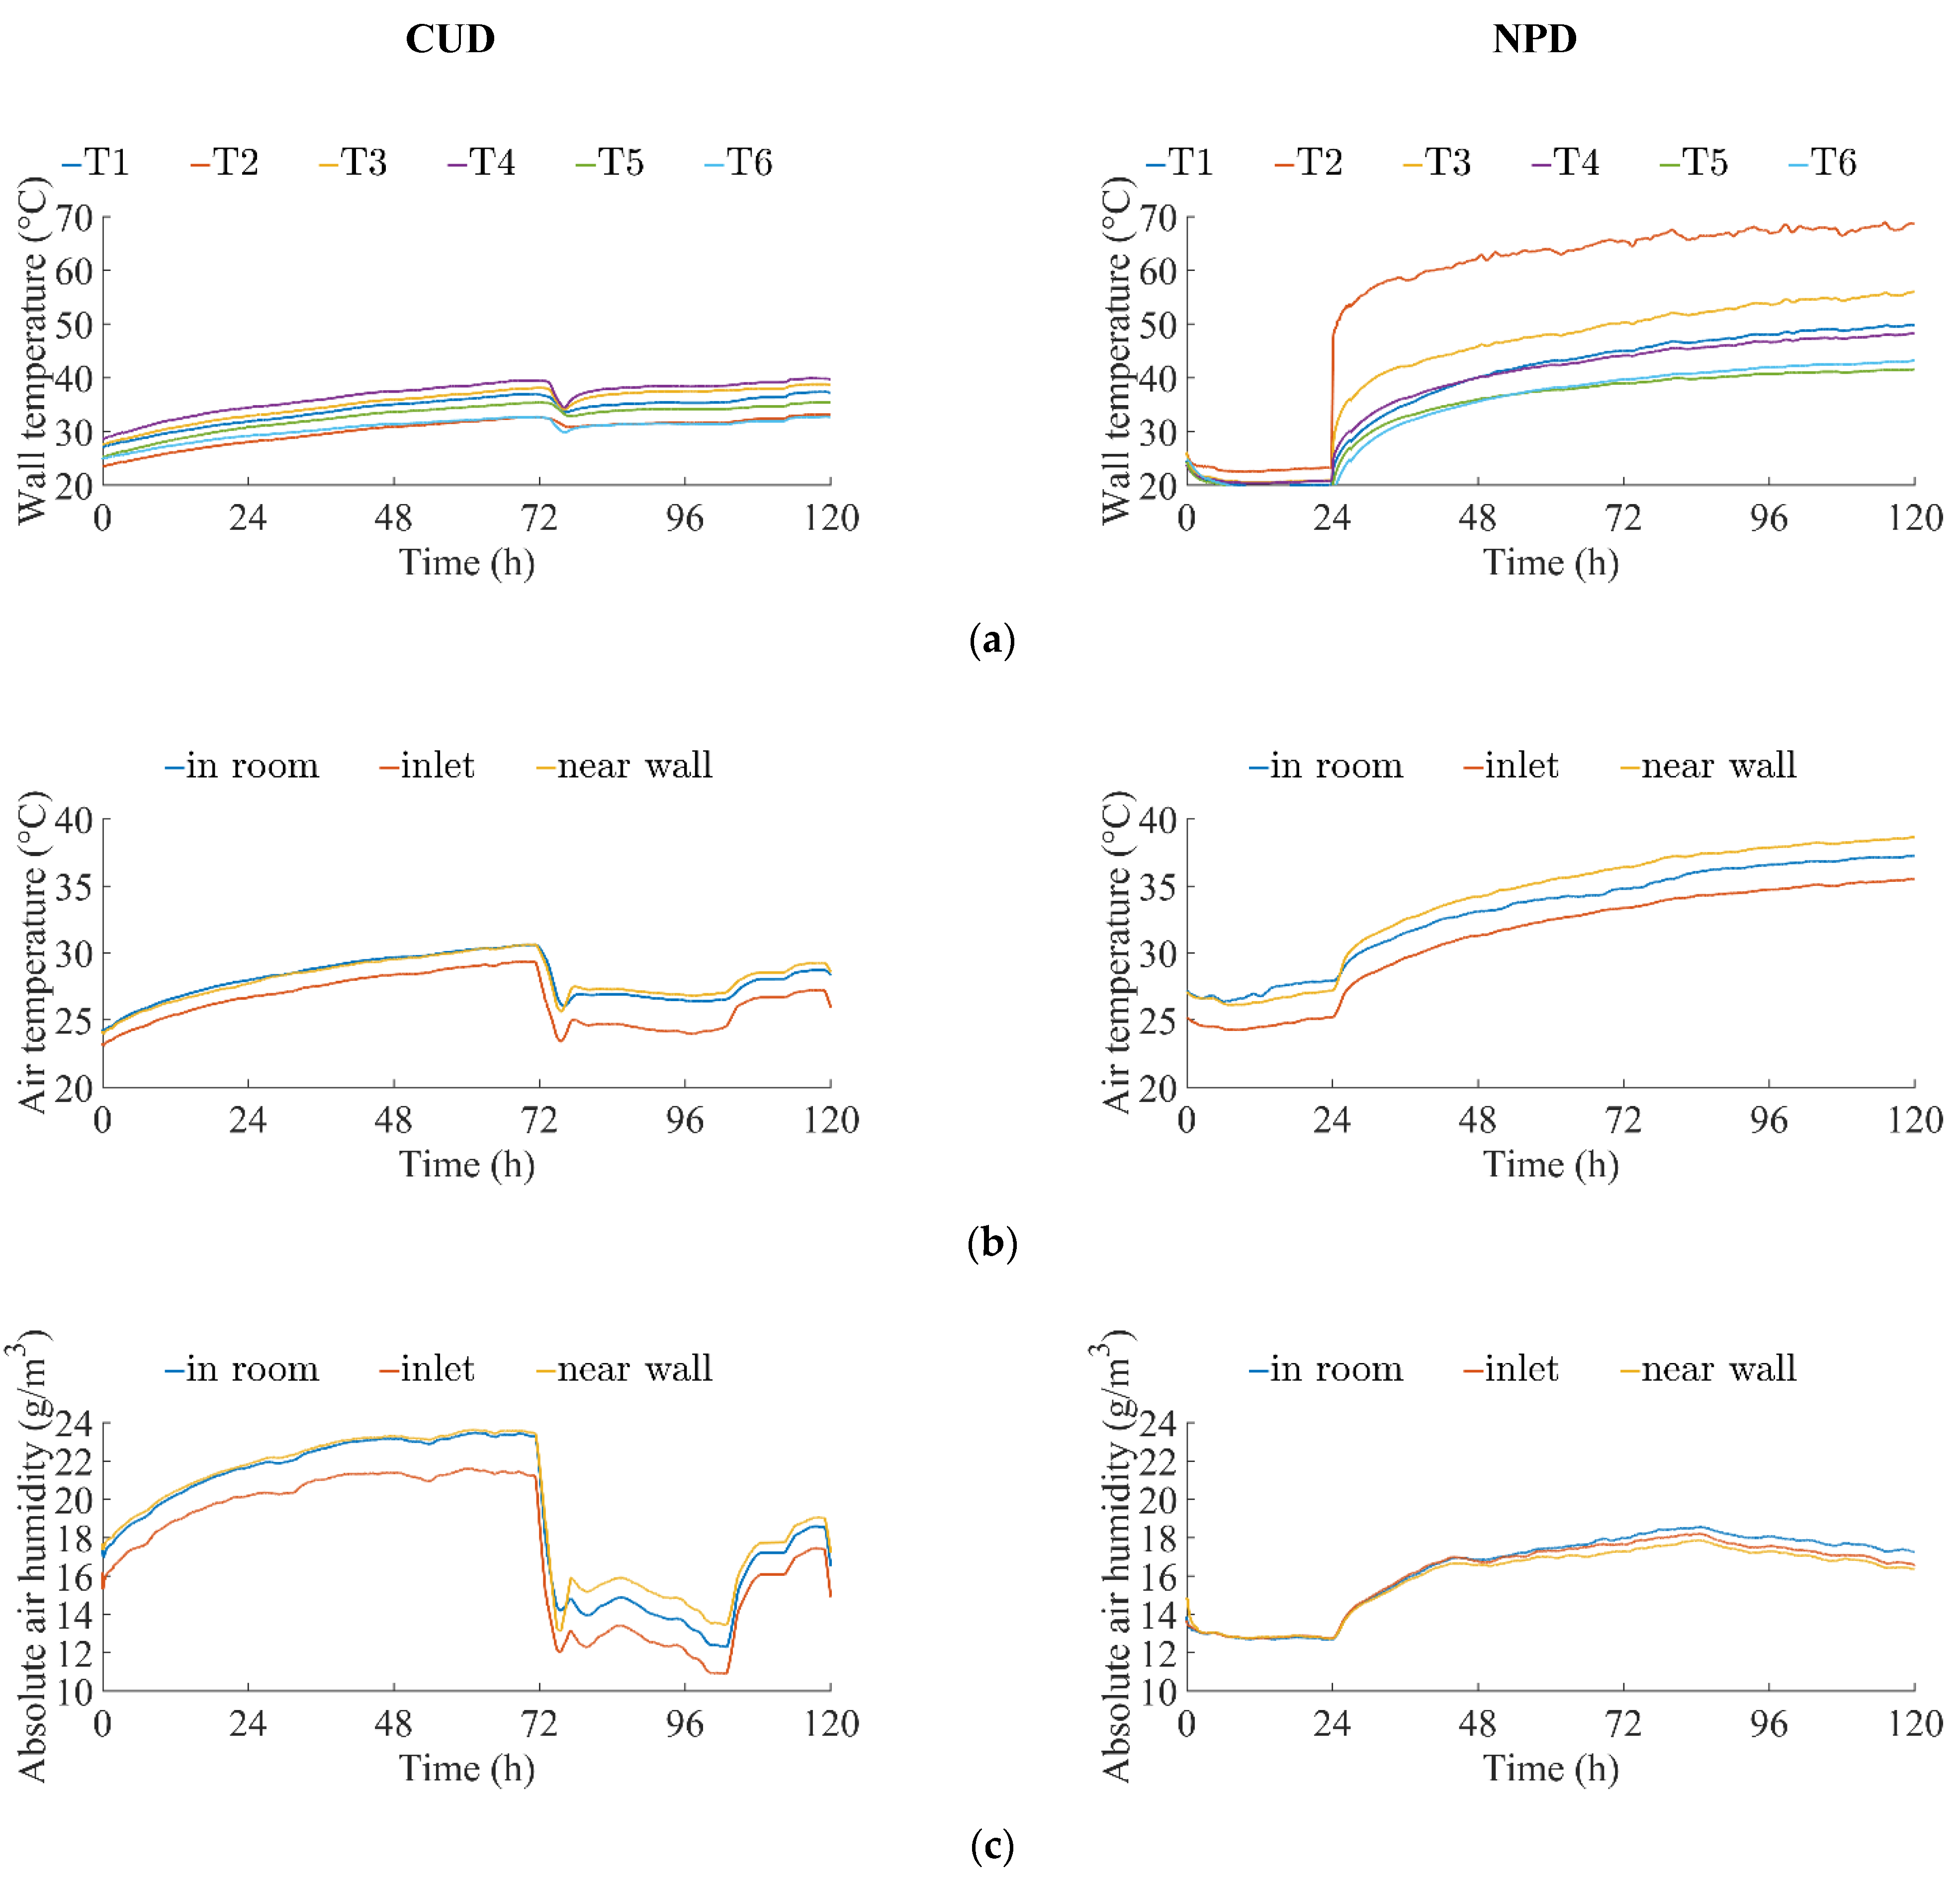
The masonry wall drying process using the CUD was implemented with the heating on and the fan running from the onset of drying. The drying air velocity at the heating probe outlet was equal to 4.3 m/s, which corresponded to a volumetric flow rate of 3.14 m3/h per probe. Such process implementation had an influence on both the drying air and masonry wall temperature, which immediately began to rise, reaching approximately 35–40 °C (see Figure 6a). In addition, the ambient air temperature and relative humidity in the room were influenced by the masonry wall’s heating and drying process and started to increase (see Figure 6b,c). The results were also significantly affected by the surrounding conditions. After approximately 72 h of the process, the weather conditions changed significantly (i.e., the surrounding temperature rapidly dropped, which caused a sudden decrease in the air temperature in the room, cooling down the masonry wall). This also affected the relative humidity of the air in the room. It should be noted that before the weather conditions changed, the masonry wall temperature started approaching an asymptotic value. Therefore, it seemed that the wall temperature would not rise above 40 °C if the weather conditions did not change.
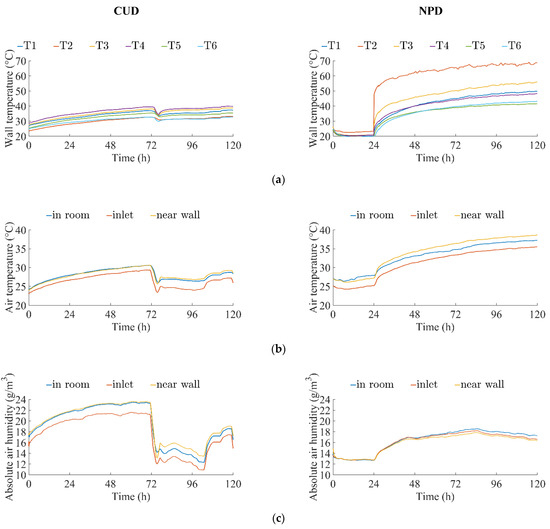
Figure 6.
Variation of (a) the temperature of the masonry wall section; (b) the ambient air temperature in the room; and (c) the ambient air relative humidity in the room for the CUD (left) and the NPD (right).
In the case of the masonry wall drying process the NPD applied, the drying process started without the heating and with only the fans running. The air velocity at the heating probe outlet was equal to 3.1 m/s, which corresponded to a volumetric flow rate of 2.25 m3/h per probe. The first drying phase lasted for 24 h and was characterized by fairly stable and low masonry wall and room air temperatures (see Figure 6a,b). Additionally, the room air relative humidity did not vary significantly (see Figure 6c). The second drying phase began 24 h after the onset of the process with turning on the heating, while the fans were running at the same speed. This phase was characterized by intensive heating of the masonry wall and a related rise in the ambient air temperature and relative humidity in the room. For this implementation, the surrounding conditions were quite stable and did not cause changes in the conditions inside the building. For the NPD, the masonry wall attained a much higher temperature in the range of 40–65 °C, depending on the location of the temperature sensor. Sensor T2 was located closest to the drying hole and therefore indicated the highest temperature. The higher masonry wall temperature for the NPD than for the CUD was the effect of the lower volumetric flow rate of the drying air in the former device than in the latter one. For the lower volumetric flow rate, more heat was transferred from the heating probe to the masonry wall, and at the same time, less heat was carried away by the drying air flowing through the heating probe and leaving the hole through the gap between the hole’s surface and the heating probe. To sum up, the masonry wall temperature was dependent on the heat lost from the heating probes and the wall to the drying air. It increased with the rise in the volumetric flow rate of the drying air, and at the same time, the wall temperature decreased.
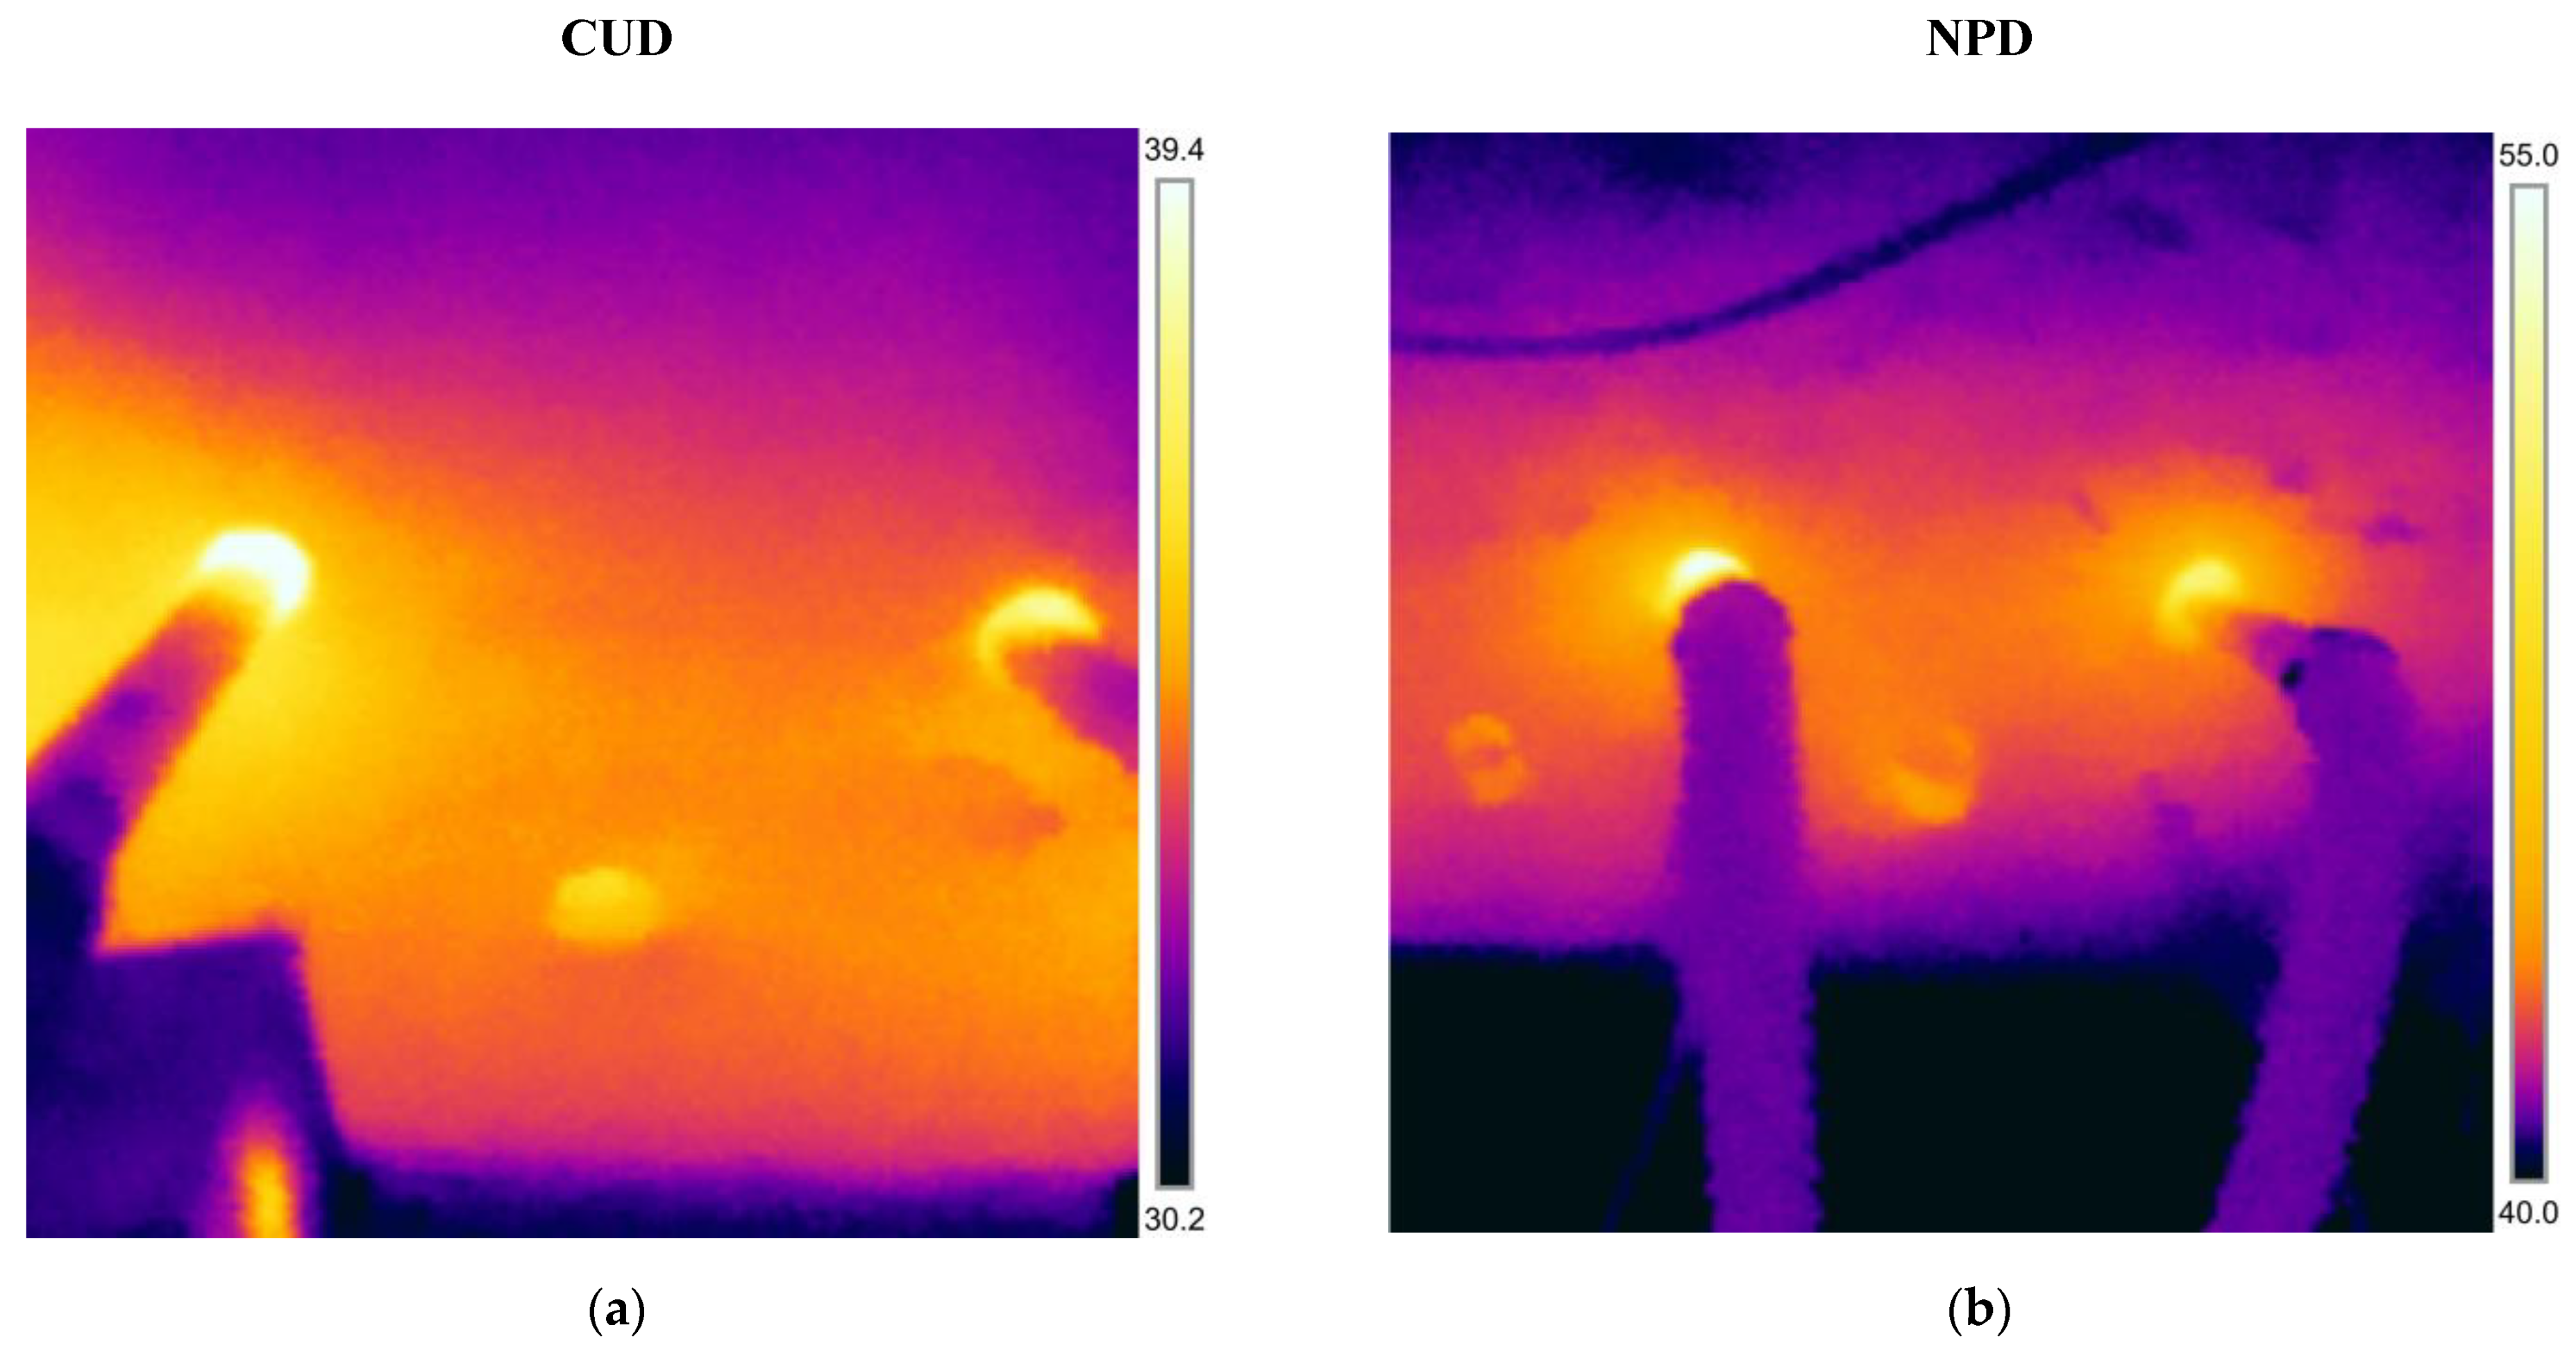
The mentioned effect is also clearly visible in Figure 7, which shows the infrared thermograms at the masonry wall’s surface at the end of the drying process (after 120 h of the drying process) for the masonry wall section with two heating probes. For the CUD, the masonry wall surface temperature between the heating probes oscillated around the value of 35 °C, while it reached about 38 °C near the heating probes. The thermogram also clearly showed the drying and heating area for the CUD, which was a strip approximately 12–15 cm wide. For the NPD, the wall surface temperature between the heating probes oscillated at a higher level around 43 °C, while it reached about 54 °C near the heating probes. The thermogram also clearly showed the drying and heating area for the NPD, which was a strip approximately 12 cm wide. The higher volumetric flow rate of the drying air for the CUD than for the NPD resulted not only in a lower masonry wall temperature for the CUD than the NPD but also in a lower heating probe temperature (39.4 °C vs. 55 °C, respectively).

Figure 7.
Thermograms at the masonry wall’s surface (section with two probes) at the end of the drying process implemented with (a) the CUD and (b) the NPD.
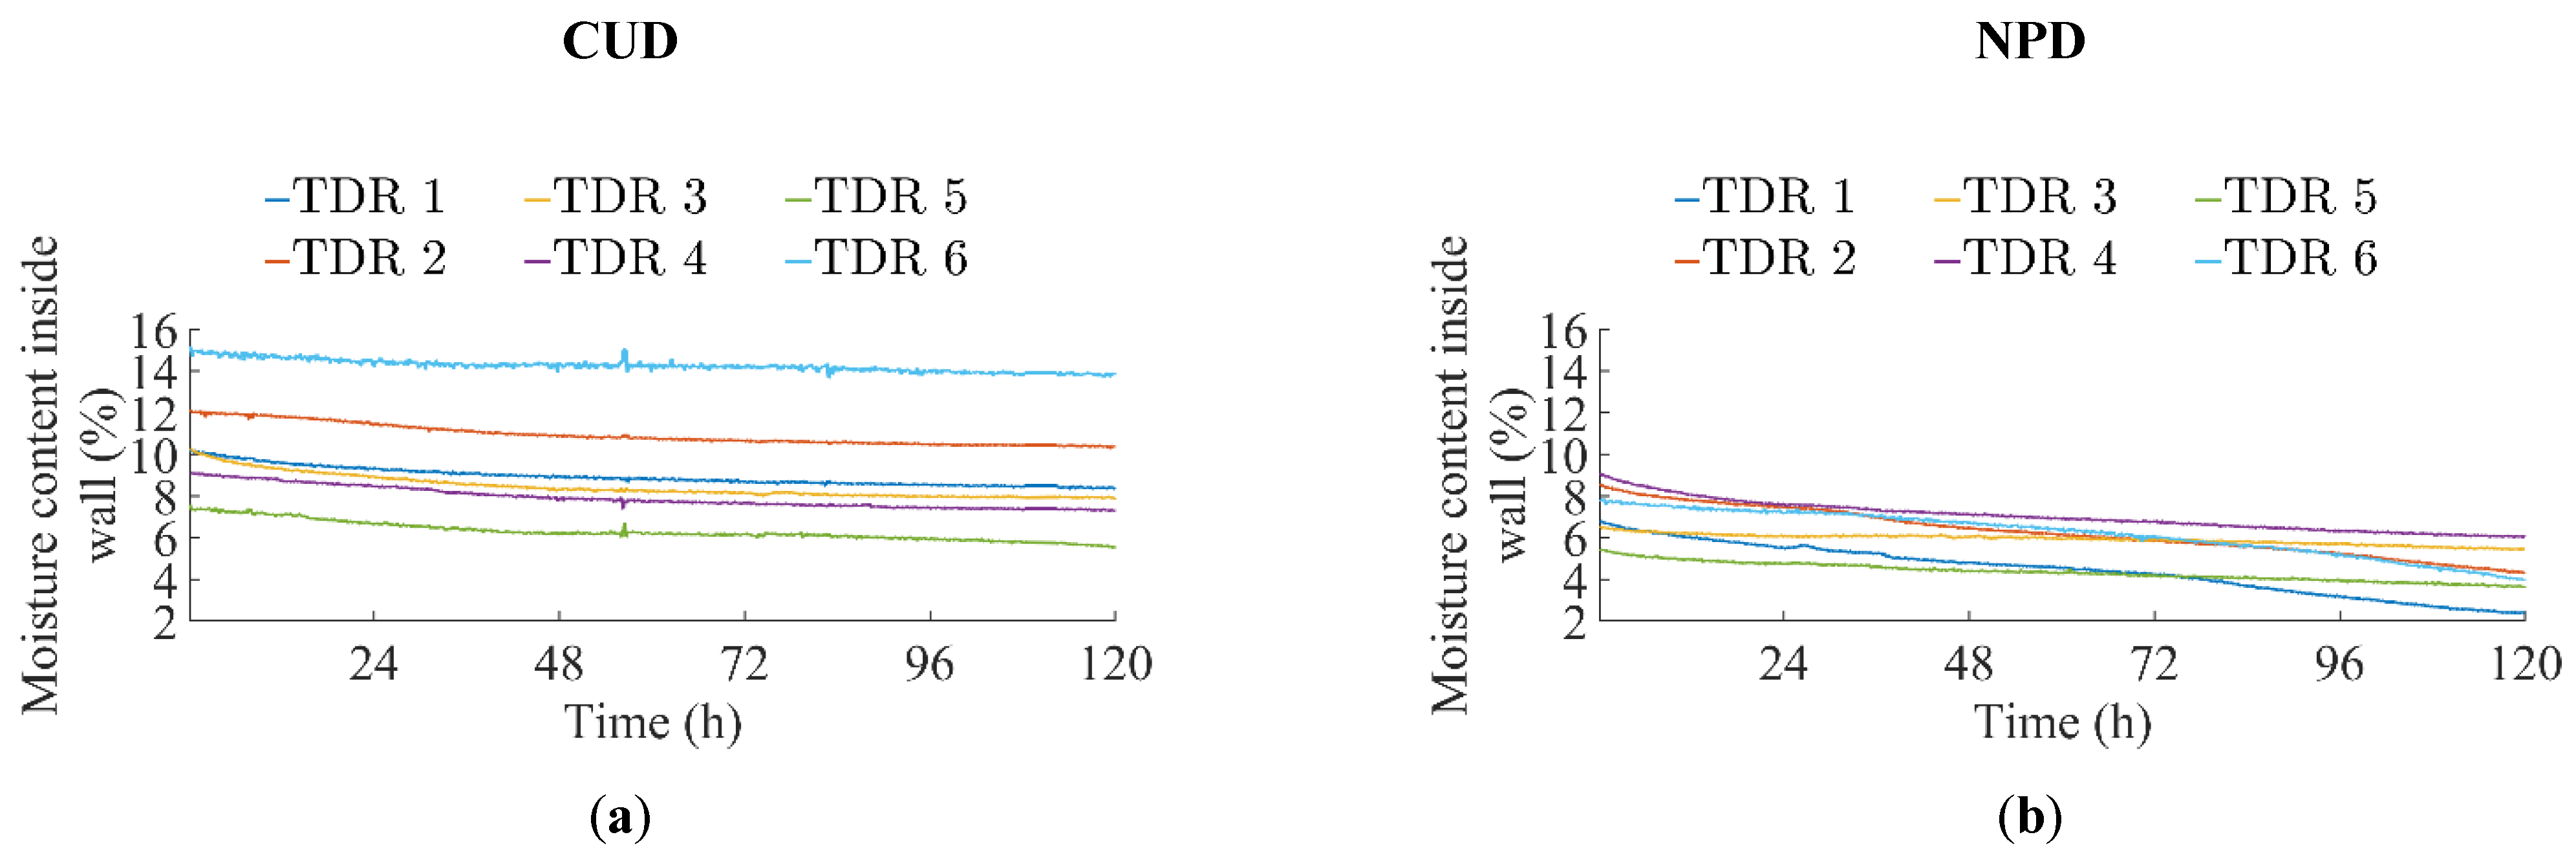
The variation of the moisture content inside the masonry wall during drying is presented in Figure 8. For the CUD, after 120 h of measurement, the moisture contents in the masonry wall registered by 6 TDR probes were equal to 8.4, 10.3, 8.0, 7.3, 5.4 and 14 vol.% (see Figure 8a). The amount of water slightly decreased compared with the initial state of the wall from approximately 11.03 to 8.9 vol.% on average. It should also be noted that the moisture content variation in the masonry wall was not affected by the sudden change in the weather conditions after 72 h of the process (see Figure 6). Figure 8b shows the variation of the moisture content inside the masonry wall for the NPD. During the first phase of drying, there was a rapid reduction in the moisture content even without heating. After 24 h of the process, additional heating by the drying probes was turned on, and the high drying rate was maintained. Finally, after 120 h of drying, the TDR probes indicated moisture contents inside the masonry wall equal to 2.3, 4.3, 5.4, 6.1, 3.8 and 4.1 vol.%. These values were significantly lower compared with the initial state of the wall; the amount of water decreased from approximately 7.55 to 4.33 vol.% on average.
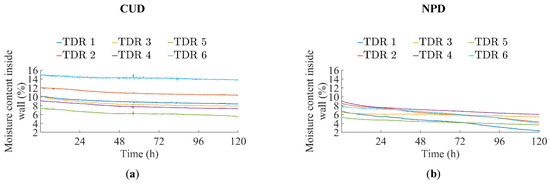
Figure 8.
Moisture content variations in the masonry wall dried by applying (a) the CUD and (b) the NPD.
The initial differences in the moisture levels in different locations in the masonry walls (see the initial values indicated by TDR 1–6 in Figure 8) were related to variations in the local water content in different parts of the building. Moreover, the different moisture content change behaviors observed (e.g., in Figure 8b) were due to positioning of the TDR probes in zones made of different building materials (i.e., TDR 3–5 were located in areas surrounded by significantly more mortar than TDRs 1, 2 and 6, which were located in areas surrounded by red brick). These materials are characterized by the significantly different hygrothermal properties [18] which affected the moisture content change. Additionally, the moisture levels were significantly different in both considered rooms. In the room dried by the CUD, the average moisture level was approximately 1.7–1.9 times higher than in the room dried by the NPD. This difference probably resulted from the fact that the room dried with the NPD directly adjacent to another building, which hindered the lateral water transfer, and only capillary uptake from the ground below it occurred. This resulted in an overall lower dampness level than in the second room, which was adjacent to the ground and might have absorbed water through the lateral and bottom surfaces. However, to decrease the impact of these differences in the analysis of the energy consumption and efficiency, only the mean moisture content reductions were taken into consideration.
Table 2 shows a comparison of the specific energy consumption, defined as the amount of energy required to reduce the moisture content of 1 m of the masonry wall by 1 vol.%. Table 2 also presents the mean moisture content reduction in the masonry walls, the total energy consumption by devices, the energy consumption per meter of the dried masonry wall and the percentage of change between the CUD and NPD. The values in Table 2 were determined as the averaged values of all 6 TDR measurement points. As can be seen in Table 2, the drying process implemented with the NPD was more dynamic and energy efficient than that with the CUD. The NPD attained approximately 1.5 times greater moisture content reduction in the wall, and it consumed approximately 1.8 times fewer energy in total and had a specific energy consumption approximately 1.6 times lower than that of the CUD. This better performance of the NPD was the effect of construction modification of the device and implementation of the two-phase drying process (i.e., 24 h with the heating mode off and ventilation mode on and then 96 h with the heating and ventilation modes on). In the first phase, the NPD consumed only energy for powering the fan, which resulted in energy consumption savings. However, the drying rates were very high due to removing water present at the drying holes’ surfaces and close to them. Then, after 24 h of the process to remove moisture more effectively from the deeper wall regions, heating was activated.
Table 2.
Energy efficiency comparison of both devices after 120 h of the drying process.
4. Conclusions
In this paper, a comparison of two drying devices—the CUD and NPD, applied in the first step of the building renovation process (i.e., for drying of masonry walls)—was presented. Both devices were used to implement the thermo-injection drying method during basement renovation of a historic building located in the city of Łowicz in Poland. Both devices dried different sections of the masonry wall. The drying process was monitored using the dedicated data acquisition system with the set of measuring sensors. Both devices were compared in terms of the specific energy consumption, the mean moisture content reduction in the masonry wall, the total energy consumption by the devices and the energy consumption per meter of the dried masonry wall. Such real-time hygrothermal studies of the drying process in a real-scale historic building subjected to the excessive moisture problem are very rarely presented in the literature. Therefore, the analysis presented in this paper is a very important contribution to the current state of the art.
It was found that the specific energy consumption for the CUD was estimated to be 58.8% higher than that for the NPD. This shows the positive energetic effect of the new prototype. In addition, we observed a 51% greater reduction in the moisture content for the same drying period in the case of the NPD, indicating the possibility of shortening the wall drying process when applying this device. Moreover, the temperature of the masonry wall reached in the process was higher in the case of the NPD than that for the CUD, which also had a positive effect on the next step of the wall renovation process (i.e., on the injection phase), in which the waterproof membrane is created. In this step, the higher masonry wall temperature results in better heating of the hydrophobic silicone micro-emulsion, which is injected into the wall and impregnates it. The rise in the micro-emulsion temperature lowers its viscosity and encourages deeper penetration of the building material and the creation of a more effective waterproof membrane [3].
To sum up, the new device for drying process implementation with improved drying efficiency and the new two-phase drying strategy were shown, and some practical information related to its construction and operation were provided. These data may be interesting for other researchers and designers in the field of building renovation.
The general conclusion is that the paper showed significant improvement of the drying process efficiency just by developing and applying a more efficient drying device (i.e., the NPD) and also by proposing a new drying strategy (i.e., the two-phase drying process). Both the lower energy consumption and shorter drying time were achieved without any further device or process optimization. The results suggest that the renovation process may be even more efficient and environmentally friendly if the drying of the masonry wall is optimized at the equipment and process levels.
Author Contributions
Conceptualization, Ł.C. and P.Ł.; methodology, Ł.C. and P.Ł.; software, Ł.C.; validation, Ł.C. and P.Ł.; formal analysis, Ł.C. and P.Ł.; data curation, Ł.C.; investigation, Ł.C. and P.Ł.; writing—original draft preparation, Ł.C. and P.Ł.; writing—review and editing, P.Ł.; visualization, Ł.C.; supervision, P.Ł.; project administration, P.Ł.; funding acquisition, P.Ł. All authors have read and agreed to the published version of the manuscript.
Funding
This work was supported by the European Union within the European Regional Development Fund under project no. POIR.04.01.02-00-0099/16 “Development of innovative technology of drying and moisture sealing of masonry walls, DryWall”, granted by the National Centre for Research and Development (Poland). The authors also acknowledge the financial support from the Faculty of Power and Aeronautical Engineering of the Warsaw University of Technology in the framework of statutory activity.
Institutional Review Board Statement
Not applicable.
Informed Consent Statement
Not applicable.
Conflicts of Interest
The authors declare no conflict of interest.
References
- Promis, G.; Douzane, O.; Rousse, D.R.; Langlet, T. An Innovative System for the Treatment of Rising Dampness in Buildings Located in Cold Climates. Energies 2021, 14, 3421. [Google Scholar] [CrossRef]
- Kvapilová, V.; Šuhajda, K. Possibility of Using Microwave Radiation for Rehabilitation of Historical Masonry Constructions. Key Eng. Mater. 2020, 868, 119–126. [Google Scholar] [CrossRef]
- Cieślikiewicz, Ł.; Łapka, P.; Mirowski, R. In Situ Monitoring of Drying Process of Masonry Walls. Energies 2020, 13, 6190. [Google Scholar] [CrossRef]
- Cieślikiewicz, Ł.; Łapka, P.; Mirowski, R.; Wasik, M.; Kubiś, M.; Pietrak, K.; Furmański, P.; Seredyński, M.; Wiśniewski, T. Development of the experimental stand for investigation of the drying process in moist walls. IOP Conf. Ser. Mater. Sci. Eng. 2019, 660, 012021. [Google Scholar] [CrossRef]
- Cieślikiewicz, Ł.; Łapka, P.; Wasik, M.; Kubiś, M.; Pietrak, K.; Wiśniewski, T.S.; Furmański, P.; Seredyński, M. Development of the experimental stand for investigation of heating and drying phenomena in the porous building materials with one surface of the sample exposed to the flowing air. E3S Web Conf. 2018, 70, 03003. [Google Scholar] [CrossRef]
- Cieślikiewicz, Ł.; Wasik, M.; Kubiś, M.; Łapka, P.; Bugaj, M.; Pietrak, K.; Wiśniewski, T.S.; Furmański, P.; Seredyński, M. Development of The Experimental Stand With Centrally Located Specimen for The Investigation of Heat and Moisture Phenomena in Porous Building Materials. Civ. Environ. Eng. Rep. 2019, 29, 53–65. [Google Scholar] [CrossRef] [Green Version]
- He, Z.; Yang, F.; Yi, S.; Gao, J. Effect of Ultrasound Pretreatment on Vacuum Drying of Chinese Catalpa Wood. Dry Technol. 2012, 30, 1750–1755. [Google Scholar] [CrossRef]
- Sobotka, J.; Kolář, R. Drying of the Basement Spaces of the Faculty of Arts in Brno. Appl. Mech. Mater. 2016, 861, 295–302. [Google Scholar] [CrossRef]
- Seredyński, M.; Wasik, M.; Łapka, P.; Furmanski, P.; Cieslikiewicz, Ł.; Pietrak, K.; Kubis, M.; Wisniewski, T.S.; Jaworski, M. Analysis of non-equilibrium and equilibrium models of heat and moisture transfer in a wet porous building material. Energies 2020, 13, 214. [Google Scholar] [CrossRef] [Green Version]
- Phillipson, M.C.; Baker, P.H.; Davies, M.; Ye, Z.; McNaughtan, A.; Galbraith, G.H.; McLean, R.C. Moisture measurement in building materials: An overview of current methods and new approaches. Build. Serv. Eng. Res. Technol. 2007, 28, 303–316. [Google Scholar] [CrossRef]
- Válek, J.; Kruschwitz, S.; Wöstmann, J.; Kind, T.; Valach, J.; Köpp, C.; Lesák, J. Nondestructive Investigation of Wet Building Material: Multimethodical Approach. J. Perform. Constr. Facil. 2010, 24, 462–472. [Google Scholar] [CrossRef]
- Binda, L.; Cardani, G.; Zanzi, L. Nondestructive Testing Evaluation of Drying Process in Flooded Full-Scale Masonry Walls. J. Perform. Constr. Facil. 2010, 24, 473–483. [Google Scholar] [CrossRef]
- Rymarczyk, T.; Sikora, J.; Tchórzewski, P. Implementation of electrical impedance tomography for analysis of building moisture conditions. COMPEL Int. J. Comput. Math. Electr. Electron. Eng. 2018, 37, 1837–1861. [Google Scholar] [CrossRef]
- Rymarczyk, T.; Kłosowski, G.; Hoła, A.; Hoła, J.; Sikora, J.; Tchórzewski, P.; Skowron, Ł. Historical buildings dampness analysis using electrical tomography and machine learning algorithms. Energies 2021, 14, 1307. [Google Scholar] [CrossRef]
- Zegowitz, A.; Renzl, A.; Hofbauer, W.; Meyer, J.; Kuenzel, H. Drying behaviour and microbial load after water damage. Struct. Surv. 2016, 34, 24–42. [Google Scholar] [CrossRef]
- Walker, R.; Pavía, S. Thermal and moisture monitoring of an internally insulated historic brick wall. Build. Environ. 2018, 133, 178–186. [Google Scholar] [CrossRef]
- Knarud, J.I.; Geving, S.; Kvande, T. Moisture performance of interior insulated brick wall segments subjected to wetting and drying—A laboratory investigation. Build. Environ. 2021, 188, 107488. [Google Scholar] [CrossRef]
- Pietrak, K.; Kubiś, M.; Cieślikiewicz, L.; Furmański, P.; Seredyński, M.; Wasik, M.; Wiśniewski, T.; Łapka, P. Measurement of thermal, hygric and physical properties of bricks and mortar common for the Polish market. IOP Conf. Ser. Mater. Sci. Eng. 2019, 660, 012022. [Google Scholar] [CrossRef]

Publisher’s Note: MDPI stays neutral with regard to jurisdictional claims in published maps and institutional affiliations. |
© 2021 by the authors. Licensee MDPI, Basel, Switzerland. This article is an open access article distributed under the terms and conditions of the Creative Commons Attribution (CC BY) license (https://creativecommons.org/licenses/by/4.0/).