Article

Lignin Syngas Bioconversion by Butyribacterium methylotrophicum: Advancing towards an Integrated Biorefinery

1
LNEG, Laboratório Nacional de Energia e Geologia, Unidade de Bioenergia e Biorrefinarias, Estrada do Paço do Lumiar, 1649-038 Lisboa, Portugal
2
Instituto Dom Luiz, Faculdade de Ciências, Universidade de Lisboa, 1749-016 Lisboa, Portugal
*
Authors to whom correspondence should be addressed.
Energies 2021, 14(21), 7124; https://doi.org/10.3390/en14217124
Submission received: 7 September 2021 / Revised: 15 October 2021 / Accepted: 20 October 2021 / Published: 1 November 2021
(This article belongs to the Collection Feature Papers in Bio-Energy)

Abstract

:
Hybrid bio-thermochemical based technologies have the potential to ensure greater feedstock flexibility for the production of bioenergy and bioproducts. This study focused on the bioconversion of syngas produced from low grade technical lignin to C2-/C4-carboxylic acids by Butyribacterium methylotrophicum. The effects of pH, medium supplementation and the use of crude syngas were analyzed. At pH 6.0, B. methylotrophicum consumed CO, CO2 and H2 simultaneously up to 87 mol% of carbon fixation, and the supplementation of the medium with acetate increased the production of butyrate by 6.3 times. In long-term bioreactor experiments, B. methylotrophicum produced 38.3 and 51.1 mM acetic acid and 0.7 and 2.0 mM butyric acid from synthetic and lignin syngas, respectively. Carbon fixation reached 83 and 88 mol%, respectively. The lignin syngas conversion rate decreased from 13.3 to 0.9 NmL/h throughout the assay. The appearance of a grayish pellet and cell aggregates after approximately 220 h was indicative of tar deposition. Nevertheless, the stressed cells remained metabolically active and maintained acetate and butyrate production from lignin syngas. The challenge that impurities represent in the bioconversion of crude syngas has a direct impact on syngas cleaning requirements and operation costs, supporting the pursuit for more robust and versatile acetogens.

Graphical Abstract

1. Introduction

Concerns regarding the depletion of finite feedstock resources have shifted industrial sectors to the use of renewable biomass and the adoption of circular business models. In 2020, the bio-based industry in Europe was represented by 2362 facilities, from which 788 integrated the production of bioproducts and energy, including biofuels and other types of energy from biomass [1]. Although biomass plants tend to be efficient at its conversion, there are still waste streams generated from this process. Low-grade technical lignin from lignocellulosic biomass is one of such examples. Its polymeric composition and high stability make it impervious to enzymatic hydrolysis and other biological decomposition processes [2]. Due to its recalcitrant properties and high heating value, lignin has become a preferred feedstock for thermochemical plants, particularly for gasification [3].
The main product of gasification is synthesis gas or syngas, which is mainly composed of carbon monoxide (CO), hydrogen (H2), carbon dioxide (CO2), and also, in lower amounts, of methane (CH4), short chain hydrocarbons (CnHn), ammonia (NH3) and hydrogen sulfide (H2S) [3,4]. Syngas is a versatile feedstock for the production of fuels and chemicals, and some microorganisms can use the main syngas components as a source of carbon and energy. Some species of bacteria and archaea, known as carboxydotrophs, can produce a variety of short chain organic acids and alcohols from syngas [5,6]. Although syngas fermentation is not a recent technology, over the years, knowledge in this field has been focused on the use of synthetic syngas formulations. Synthetic syngas is a custom-made gaseous mixture of CO, H2, CO2 and N2 in various ratios. Such mixtures are perfect for fermentation parameter optimization and fundamental research because they allow for a flexibility that crude syngas cannot offer, as they are independent of feedstock and gasification conditions [7]. However, the composition of crude syngas is highly complex, and not exclusive to the main gaseous components. Contaminants such as tar, cyanide and other molecules are recognized as one of the biggest obstacles for direct syngas fermentation. These molecules can be present in concentrations shown to hinder microbial growth, significantly affecting overall yields and productivities [6,7,8,9,10,11,12,13,14]. For example, the presence of tar in crude syngas produced by lignin gasification was shown to induce cell dormancy and influence the redistribution of ethanol and acetic acid production by Clostridium carboxidivorans P7T and Clostridium ragsdalei P11 [15,16]. Fortunately, some of these inhibitory effects may be mitigated by gradually adapting microbial cultures to crude syngas, prior to fermentation [9,10,17].
Butyribacterium methylotrophicum is a mesophilic carboxydotrophic acetogen, which is able to produce a variety of organic acids and alcohols from syngas. B. methylotrophicum was isolated from a sewage sludge digestor in 1980 by Zeikus et al. [18] and is described as being able to grow from a multitude of carbon sources, including carbon gaseous mixtures. This microorganism uses the Wood–Ljungdahl (WL) acetyl-CoA formation pathway to convert CO and CO2 + H2 to biomass and metabolites (acetate, butyrate, ethanol and butanol) [19,20]. Acetate and butyrate can be further used as platform chemicals for varied applications including food, pharmaceutical and chemical products, replacing processes based on chemical conversion at high temperatures and pressures. Ethanol and butanol are also important as precursors for next generation biofuels [21,22,23]. The fermentative production of such compounds could contribute to a more environmentally friendly economy, less dependent on fossil fuels [24].
Although B. methylotrophicum is a promising microorganism for syngas-to-bioproducts processes, research on the fermentation process has been only carried out with synthetic syngas mixtures. The current challenges of syngas bioconversion are mostly associated with the search for new and robust biocatalysts, low biomass yields, mass transfer limitations, and aspects of process integration and intensification [6,25]. Microbial catalysts must be stable enough to withstand a prolonged conversion fed by real gases, in processes that may represent a huge potential for future applications; for example, the carbon fixation of CO2-rich flue gas streams. More robust acetogenic microorganisms are required, such as those that are being developed by Arantes et al., 2021 and Diender et al., 2021, to tackle the conversion of syngas to platform molecules and tolerate a greater variety of syngas compositions [26,27]. Studies that integrate gasification and crude syngas fermentation, based on the development of scalable bioreactor configurations, with efficient material flow integration and that address the problem of microbial resistance to crude syngas impurities are also still scarce [8,9,28]. A complete scale-up and techno-economic assessment are also necessary to substantiate the integration of the biochemical and thermochemical platforms, as they are essential for the full application of this hybrid technology in carbon fixation processes [29].
This work focused on testing the conditions to maximize C2- and C4-carboxylic acids production by B. methylotrophicum, first from a synthetic syngas mixture mimicking lignin syngas, and then from crude syngas obtained by the gasification of low-grade technical lignin generated as a by-product in a second-generation (2G) ethanol biorefinery. Two different types of syngas feeding modes were tested—batch and on-demand feeding—allowing for a comprehensive analysis of the behavior of this microorganism under more adverse fermentative conditions.

2. Materials and Methods

2.1. Microorganism, Culture Media and Syngas Composition

The microbial strain used in this study was Butyribacterium methylotrophicum strain Marburg DSM 3468 (Deutsche Sammlung von Mikroorganismen und Zellkulturen, Braunschweig, Germany). The culture medium was adapted from Oswald et al., 2016 and was composed of 2 g/L NaCl, 2.5 g/L NH4Cl, 0.25 g/L KCl, 0.25 g/L KH2PO4, 0.5 g/L MgSO4·7H2O, 0.1 g/L CaCl2·2H2O, 0.001 g/L resazurin, 0.56 g/L cysteine-HCl·H2O, 2 g/L yeast extract and 10 mL/L trace elements solution (see below) [28]. A concentration of 140 mM phosphate buffer or 20 g/L 2-(n-morpholino)ethanesulfonic acid (MES) was used in the culture medium formulation at pH 7.0 and pH 6.0, respectively. The medium was first made anoxic by replacing the gas phase by nitrogen (N2) through a gas manifold system. Afterwards, the serum bottles were sparged with synthetic syngas (Syngas A—Table 1) for 10 min. After autoclaving, 10 mL/L of vitamin solution and, optionally, 60 mM of sodium acetate were aseptically added. The trace elements solution contained: 2.0 g/L sodium ethilenediaminetetracetic acid (EDTA), 1.0 g/L MnSO4·H2O, 0.567 g/L FeSO4·7H2O, 0.022 g/L Na2WO4·2H2O, 0.2 g/L CoCl2·6H2O, 0.2 g/L ZnSO4·7H2O, 0.02 g/L CuCl2·2H2O, 0.02 g/L NiCl2·6H2O, 0.02 g/L Na2MoO4·2H2O and 0.02 g/L Na2SeO3·5H2O. The filter sterilized vitamin solution contained: 0.01 g/L pyridoxine, 0.005 g/L calcium pantothenate, 0.005 g/L nicotinic acid, 0.005 g/L riboflavin, 0.005 g/L thiamine·HCl, 0.005 g/L thioctic acid, 0.005 g/L vitamin B12, 0.002 g/L biotin and 0.002 g/L folic acid. The culture medium for the maintenance of syngas adapted cells was inoculated at 2% (v/v) every 4 days and incubated at 37 °C, 150 rpm in an orbital shaker [7,18].
The culture media formulation in the bioreactor assays was the same as described above except for the buffer solution: 20 g/L MES sodium salt at both pH values tested. A 2 M NaOH solution was used to maintain the pH, and 10 M H2SO4 solution was used to lower the pH in the bioreactor to 6.0, when needed. The culture medium in the bioreactor was inoculated with 8% (v/v) B. methylotrophicum pre-cultured at 37 °C, 150 rpm for 48 h.
In this study, two syngas compositions were used: a synthetic composition of syngas (Syngas A) and lignin-derived syngas (Syngas B). Table 1 shows the concentrations of the main syngas compounds. Syngas B was obtained through the gasification of technical lignin (lignin A sample) obtained from a 2G biorefinery plant, in a bench-scale bubbling fluidized bed gasifier (BFB) with a height of 1.5 m and an interior diameter of 0.08 m. Details about lignin composition and gasification conditions are described elsewhere [3]. The gasifier was operated at 850 °C and atmospheric pressure. The lignin flow rate was around 5 g daf/min (dry and ash free). The lignin/steam ratio was about 1 and the equivalent ratio (ER) was around 0.2. The gasifying/fluidizing agent was a mixture of steam and oxygen, introduced through a gas distributor located at the base of the gasifier. The produced syngas was passed through a cyclone and was cooled down, in order to remove particulates and condensates. Finally, the gas was filtered before being collected to be used in the fermentation assays. The formulation of synthetic Syngas A with a ratio of CO/H2 = 1.0 was adapted from Oswald et al., 2016 [28].

2.2. Experimental Set-Up

In the small-scale bioconversion assays, B. methylotrophicum was cultured anaerobically in 120 mL serum flasks with 20 mL of culture medium, at 37 °C and 150 rpm. To increase mass transfer and facilitate gas consumption, flasks were placed horizontally in the incubator. At each sampling time three flasks were withdrawn for processing.
In the batch bioreactor experiments, B. methylotrophicum was cultured in a 1.65 L air-tight double jacketed glass vessel with 500 mL working volume. The reactor was equipped with a pH sensor (405-DPAS–SC–K8S/250, Mettler Toledo, OH, USA) and controller (Black Stone BL 931700 pH controller, Hanna Instruments, Johannesbourg, South Africa), and all the necessary inlets/outlets for pH control, gas sampling, pressure measurement (LabQuest2 with gas pressure sensor, Vernier, OR, USA), syngas feed, liquid sampling/inoculum addition and syngas outlet. Temperature and stirring were 37 °C and 400 rpm, respectively. Two different pH values were set in this experiment. In the first phase the pH was maintained at 7.0, for biomass and acetate accumulation. In the second phase the pH was lowered to 6.0, to promote butyrate production [30].
Two different syngas feeding modes were tested in the bioreactor experiments. The first consisted of aerating the bioreactor headspace with synthetic syngas until saturation. Carbon conversion occurred solely at the expense of the syngas present in the bioreactor headspace. Syngas consumption was monitored by the decrease of pressure inside the reactor, after which the headspace was batch-refilled with new syngas. The second syngas feeding mode consisted in connecting a H2 tight gas sampling bag (SKC 263-03 Standard FlexFoil® series with stainless steel fittings, PA, USA) filled with the respective syngas mixture. The syngas entrance in the bioreactor occurred when the pressure inside the glass vessel was sufficiently low to pull the gas from the bag. The syngas influx was measured through an inline flow meter (μflow, Bioprocess Control, Stockholm, Sweden) connected to the gas sampling bag. The nutrients were replaced by fresh autoclaved concentrated culture medium at the end of each batch.

2.3. Analytical Methods

The microbial growth was monitored by optical density at 600 nm (Thermo Fisher Scientific spectrophotometer, Genesys 20, MA, USA) and the cell dry weight (CDW) was quantified according to official methods of analysis [31]. Acetic and butyric acids were quantified by High-Performance Liquid Chromatography (HPLC) with a Biorad Aminex HPX-87H column (Bio-Rad Laboratories, CA, USA) at 35 °C, in a LaChrom L-7490 (Merck, Darmstadt, Germany) chromatographer equipped with a differential refractive index detector. The liquid phase used was 0.5 mM H2SO4, at a flow rate of 0.4 mL/min. Solutions of the carboxylic acids were used as external standards. Gas samples were analyzed through gas chromatography (GC) in an Agilent/HP 6890 gas chromatograph equipped with a gas sampling valve, two filling columns (Molecular Sieve 5A and Porapak Q) and two detectors (Thermal Conductivity Detector and Flame Ionization Detector) mounted in series. Each injected sample was heated to 40 °C for 17 min and then up to 185 °C for 43 min, with a heating rate of 15 °C/min. The carrier gas used was argon at a constant flow of 18.5 mL/min. The molar concentration of CO, H2 and CO2 were estimated from the GC analysis using the Peng–Robinson equation [32].

2.4. Calculations

In the assays where the culture medium was supplemented with sodium acetate, the acetate production was determined as the difference between the concentration in the samples collected from the supplemented culture medium at each time-point and the concentration determined immediately after the supplementation occurred.
The amount of CO and CO2, in mol, that was used by the cells to form products and to be incorporated as biomass per mol of CO and CO2 fed was referred to as carbon fixation (CF), and was estimated as follows:
Carbon   fixation   ( % ) = n   ( CO + CO 2 ) i n   ( CO + CO 2 ) f n   ( CO + CO 2 ) i × 100
where n(CO + CO2) corresponds to the sum of the number of moles of CO and CO2 in the headspace of the bioreactor or the serum flask, and i and f correspond to the initial and final batch period. This equation was adapted from the carbon fixation equations used by Infantes et al., 2020 [33].

3. Results and Discussion

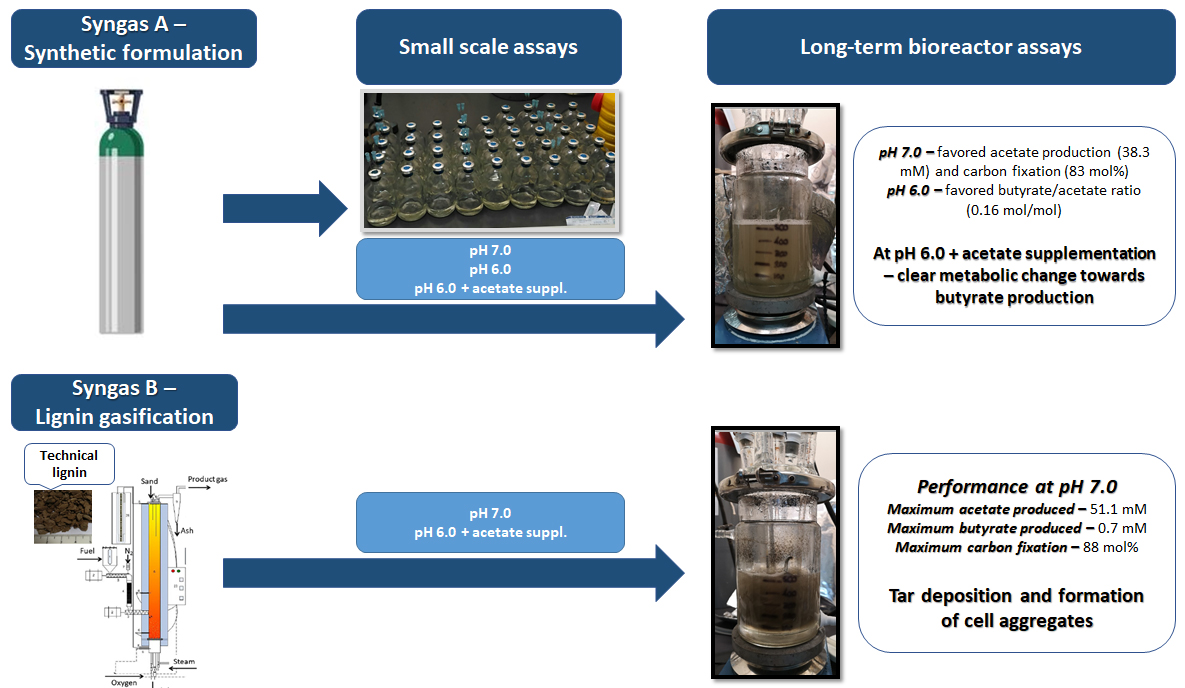
3.1. Effect of Varying pH and Medium Supplementation on Syngas Bioconversion by B. methylotrophicum

As a preliminary evaluation of B. methylotrophicum fermentative behavior, an initial assay was performed in serum flasks using Syngas A as carbon and energy source. Based on data from the literature [30], two initial pH values were tested, 7.0 and 6.0. To evaluate the effect on butyrate production, the supplementation of the culture broth at pH 6.0 with 60 mM sodium acetate was also tested.
Figure 1 and Table 2 show the results obtained.
Cellular growth, organic acids production, and CO, CO2 and H2 fixation were observed under all the tested conditions. According to the CO, CO2 and H2 fixation profiles, it was observed that CO was the preferred carbon and energy source under all the tested conditions, since it was consumed at a faster rate than H2 + CO2. The concentration of CO2 results from a balance between uptake and production by the WL pathway. Because CO2 can be used as a carbon source, but needs the presence of H2 as energy source, H2 consumption was considered to be an indicator of CO2 uptake by the cells [34].
At pH 7.0 the production of acetate started at the beginning of the exponential growth phase (Figure 1a). The onset of butyrate production occurred only during the stationary growth phase (72–84 h), when the pH of the medium decreased to 6.6 and the concentration of acetate in the medium amounted to 23.1–24.8 mM. Carbon monoxide was depleted from the headspace at a consumption rate of 0.25 mM/h up to 48 h (Figure 1b). The H2 fixation profile showed no decrease until CO depletion, after which it was totally consumed during the 48–84 h period, at a rate of 0.36 mM/h. This preference for CO consumption by B. methylotrophicum was also observed by Heiskanen et al., 2007 at pH 7.3 [35]. The CO acted as a hydrogenase inhibitor, which caused a delay in H2 consumption. The CO2 concentration oscillated between production and consumption over the 120 h of fermentation, at pH 7.0.
At pH 6.0, acetate was immediately detected after inoculation, and butyrate production started approximately in the mid exponential growth phase after 24 h (Figure 1c). The supplementation of the culture medium with 60 mM of sodium acetate did not inhibit syngas conversion by B. methylotrophicum. However, a drastic change in both acetate and butyrate production was observed. Not only did the maximum acetate production decrease from 32.0 to 20.2 mM, but also the butyrate production increased 6.3 times, up to 5.7 mM. Figure 1e shows that both acetate and butyrate production started with the exponential growth phase. At pH 6.0, carbon uptake was faster than at pH 7.0, and the CO and H2 fixation profiles were similar either with or without acetate supplementation. The concentrations of CO and H2 decreased simultaneously after the inoculation of the culture medium until depletion at 48 and 72 h, respectively (Figure 1d,f). The consumption rates of CO and H2 were similar with or without acetate supplementation, respectively 0.25–0.26 mM/h for CO and 0.17–0.18 mM/h for H2. The CO2 balance at pH 6.0, with or without acetate supplementation, resulted in a net decrease of 4.8 and 5.6 mM, respectively. Carbon fixation was higher at pH 6.0 (Table 2), indicating that carbon was being used for anabolic and catabolic purposes rather than being released as CO2. Nevertheless, the concentration of H2 present in the Syngas A formulation was not sufficient to assure CO2 depletion (Figure 1d,f). Theoretically, an additional 1.6-fold increase in H2 would be required to fully consume the supplied carbon.
The culture of B. methylotrophicum at pH 6.0 with sodium acetate supplementation yielded the best results of C2 and C4 acid production, and carbon fixation (Table 2). However, the profiles of acetate and butyrate varied in the three conditions tested. Butyrate is described in the literature as a secondary metabolite that starts to be produced by acetogens such as B. methylotrophicum and Eubacterium limosum during the stationary growth phase [29,35,36]. In this study, this was observed for pH 7.0; however, at pH 6.0 butyrate was produced during the exponential growth phase. When the culture medium was supplemented with sodium acetate, butyrate production started simultaneously with acetate production, immediately after inoculation. Without supplementation, the main product of Syngas A bioconversion was acetate, and the production of butyrate was residual. The low pH together with excess acetate shifted B. methylotrophicum metabolism to more reduced products (Table 2). This effect was described by Worden et al., 1989, where a sudden pH reduction from pH 6.8 to 6.0 after 72 h of B. methylotrophicum growth incremented butyrate production from CO by approximately 23 times [30]. Diender et al., 2016 also observed that the external addition of acetate to a co-culture of Clostridium autoethanogenum and Clostridium kluyveri increased butyrate production approximately 7 times [30,37]. This metabolic shift may be related to an acidity protection mechanism. A high concentration of protons in solution disrupts membrane potential, affecting cellular metabolism and increasing acetate toxicity towards microbial cells [38,39,40,41]. Furthermore, as described by Grethlein et al., 1990, B. methylotrophicum growth was greatly affected by pH lower than 6.0. At pH 5.5, biomass was half that obtained at pH 6.0, whereas pH 5.0 resulted in cell washout [42]. The preference for reduced products at low pH also has an effect in the ATP balance of the cell. The acetate pathway is the preferred ATP source, however, under high acetate concentrations, either acetate kinase or phosphotransacetylase become inhibited, and the carbon influx is diverted into the butyrate pathway to compensate the energy loss [43,44].

3.2. Long-Term Synthetic Syngas Bioconversion by B. methylotrophicum

The bioreactor set-up to test the long-term syngas bioconversion by B. methylotrophicum at different pH values was processed in two sequential stages: in the first stage the pH of the culture medium was adjusted to 7.0 in order to maximize the acetate concentration; the second stage started with the pH adjustment to 6.0, to induce butyrate production. The complete Syngas A fermentation assay comprised a total of 483 h: the first 288 h at pH 7.0 and from 288 to 483 h at pH 6.0 (Figure 2). Table 3 shows the main bioconversion outcomes.
Syngas A infeed to the bioreactor was performed in two supply modes: (I) the syngas was supplied in sequential batches, until the pressure value inside the bioreactor decreased to approximately 60.8 kPa and where the rate of syngas consumption was measured as the rate of pressure decrease inside the bioreactor; or (II) the syngas was supplied on-demand, where the pressure inside the bioreactor was stable at 101 kPa (atmospheric pressure) and B. methylotrophicum achieved a maximum consumption rate of 20 mL syngas/h by exerting enough suction to pull Syngas A from the sampling bag.
During the first 175 h of process time, five series of sequential syngas batches were performed. After the second sequential syngas feed, from 120 h onwards, the pressure decreased rapidly with each replenishment of the bioreactor gas phase. The rate of syngas consumption increased more than 3.2 times from the period of 120–150 h to 150–168 h and 168–175 h, corresponding to a pressure decrease of 0.67, 2.1 and 2.3 kPa/h, respectively. The acceleration of syngas bioconversion rate after the initial adaptation to Syngas A was accompanied by an increase in cell density, indicating an effective growth of B. methylotrophicum that was maintained until 288 h under batch or on-demand syngas infeed (Figure 2).
At pH 7.0 the cells needed a small adaptation period after which they were able to keep a constant consumption of syngas and produce both biomass and organic acids. The bioconversion of syngas to acetate and butyrate followed a similar trend to that of cell growth. The acetate and butyrate concentrations reached 38.3 and 2.0 mM, respectively, corresponding to the conversion of 83 mol% of the total carbon provided by the syngas, in contrast with 61 mol% obtained in the shake flask assay at pH 7.0. During the operation period at pH 6.0, 79 mol% of the carbon provided on syngas was converted to biomass, and organic acids and the acetate and butyrate production reached 55.6 mM and 1.3 mM, respectively.
Comparing the growth at pH 7.0 in the serum flasks and in the bioreactor, it was possible to observe that the lag phase was significantly higher in the bioreactor, most likely associated with mass transfer limitations in a larger liquid volume. Lower gas solubility and transport through the liquid medium to the surface of cells impacted not only on B. methylotrophicum growth, but also on acids production in the first 120 h. After this adaptation period, the cells were able to grow and produce acetate at a maximum of 0.2 mM/h from 145 to 288 h, while also producing butyrate from 145 h onward. Just before the pH setpoint was changed to 6.0, the complete consumption of CO and H2 and a decrease of CO2 to 8.7% (v/v) were registered in the bioreactor.
The acidification of the culture medium to pH 6.0 resulted in a rapid decay of the cell density inside the bioreactor (Figure 2). On the contrary, the metabolic activity of B. methylotrophicum was maintained, as observed by the sharp decrease of the internal pressure when the syngas feed was changed to batch mode (336–389 h). In the first hours at pH 6.0, the syngas conversion rates were not correlated with B. methylotrophicum growth, but with acid production. After 26 h at pH 6.0 the cells maintained a syngas consumption rate of 20 mL/h and acetate production. After this period, acetate production ceased, and the concentration of butyrate decreased (Figure 2). Duncan et al., 2002 described the ability that some gut microorganisms from the Roseburia, Coprococcus and Faecalibacterium genera have to reassimilate both acetic and butyric acids to acetyl-CoA as a way to replenish membrane and phosphorylation potentials [45]. This may be a response to the acidic conditions in the culture medium, because after 167 h at pH 6.0 the cells restarted to produce acids, namely, 13.6 mM acetate and 1.6 mM butyrate, until the end of the experiment.
In this work, promising values of carbon fixation were obtained. To maximize the dissolution of the syngas in the culture medium, the common process employed in the literature is to force a high inflow of syngas into the bioreactor [8,16,25,46]. However, as the syngas inflow is higher than the microbial syngas conversion rate, most of the gas leaving the bioreactor still contains a significant percentage of carbon [8,28,33]. The on-demand syngas feed enabled B. methylotrophicum to fully access the available carbon before pulling fresh syngas from the gas bag, resulting in the full consumption of both CO and H2, whereas the consumption of the remaining CO2 was only limited by the available H2.

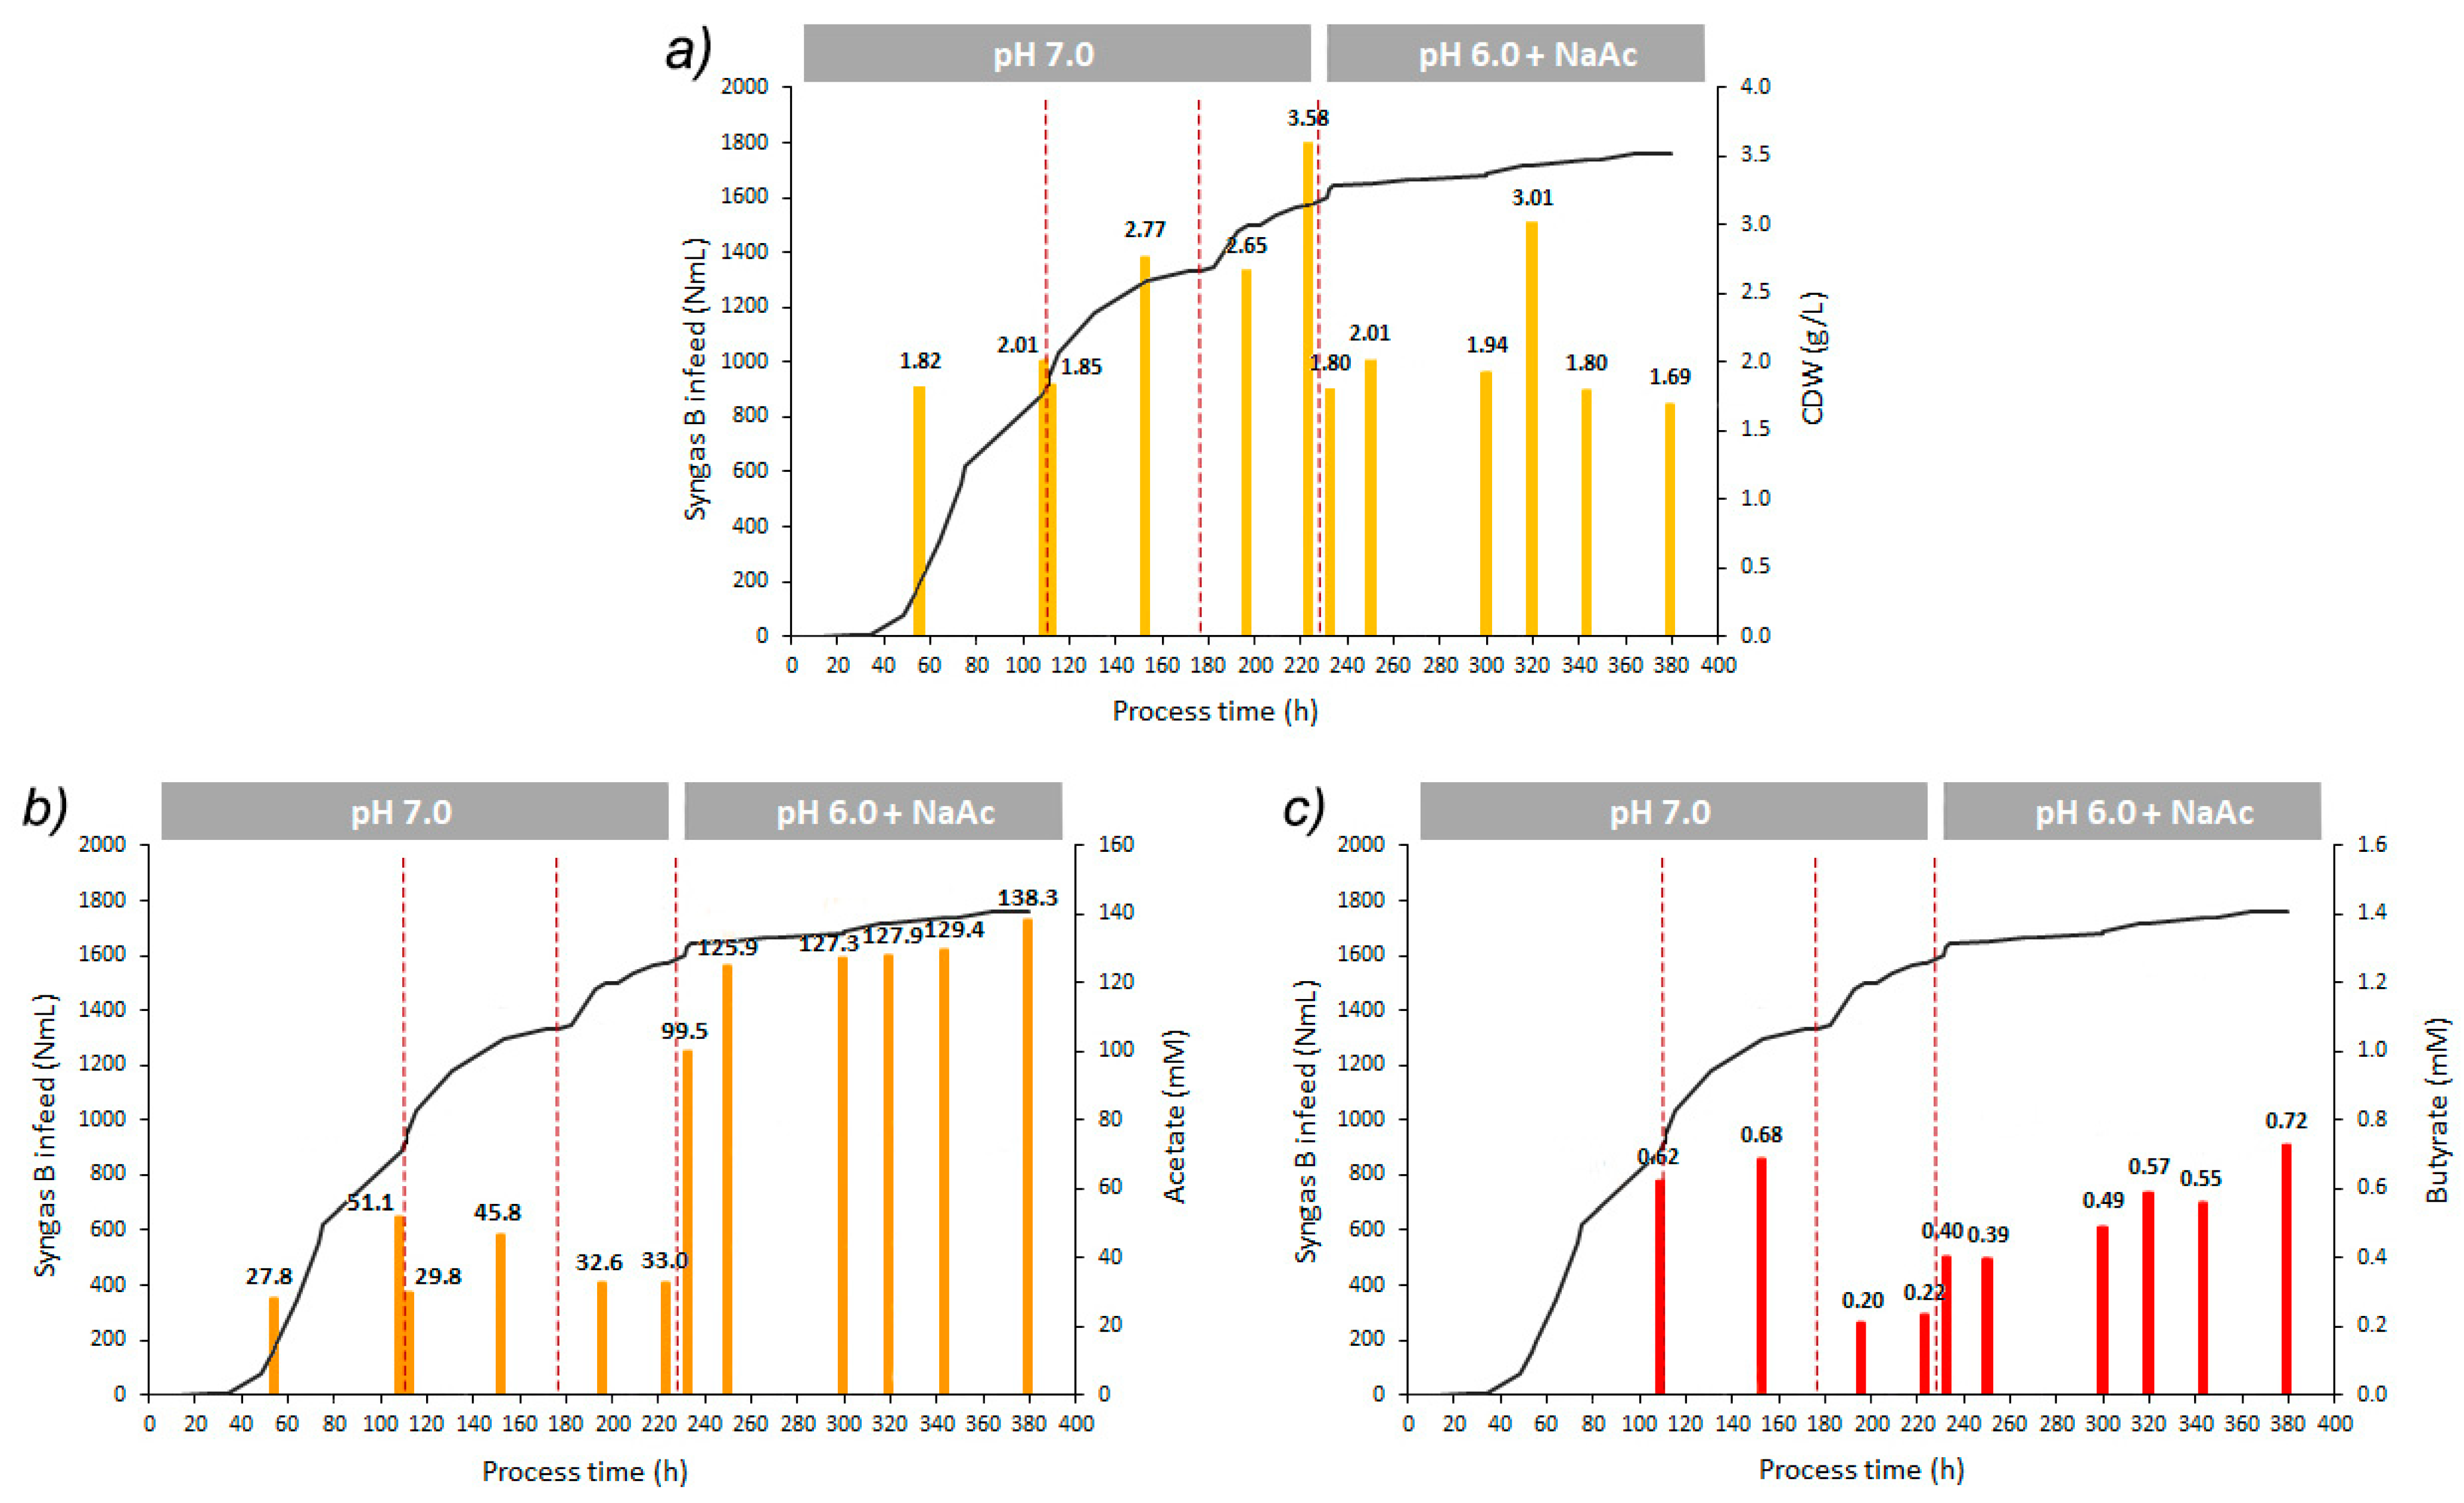
3.3. Long-Term Lignin Syngas Bioconversion by B. methylotrophicum

The bioreactor operation started with the culture of B. methylotrophicum in Syngas A for biomass formation. After the initial period of approximately 60 h, the syngas feed was changed to Syngas B and the fermentation continued for more 380 h. During the 380 h of bioreactor operation with Syngas B, half the volume of the liquid fermentate medium was replaced by new nutrient stock solution when the syngas consumption rate started to decrease. The first replacement occurred immediately after switching from Syngas A to Syngas B feed, and the second and third replacements occurred at 112 and 176 h, respectively (as indicated by the red dashed lines in Figure 3). Between 0 and 232 h the pH set-point was adjusted to 7.0, whereas from 232 to 380 h the pH was changed to 6.0 simultaneously with the supplementation of the culture medium with 60 mM sodium acetate (NaAc), as indicated by the red dashed line at 232 h.
The chosen feeding mode for Syngas B was the on-demand supply. The gas was introduced into the bioreactor from a 20 L gas sampling bag that was filled with syngas directly from the BFB gasifier and was connected with the bioreactor through a flowmeter.
Figure 3, and Table 4 and Table 5, show the results obtained in this assay.
A total of 1757 mL of Syngas B were fed on-demand to the bioreactor, from which 1600 mL were consumed by B. methylotrophicum when the pH set-point was 7.0. A small lag phase of 35 h was visible at the beginning of the assay, after which syngas consumption by B. methylotrophicum increased continuously during the process time. However, throughout the period at pH 7.0, the Syngas B inflow rate decreased during the three consecutive substitutions of nutrient solution, from 13.3 to 6.7 and 3.2 NmL/h (Figure 3). A maximum of 51.1 mM acetate and 0.7 mM butyrate were produced at pH 7.0. The concentration of organic acids in the culture medium decreased after each medium renovation down to 33.0 mM acetate and 0.2 mM butyrate after the 2nd replacement.
At pH 6.0 the slope of Syngas B consumption was clearly less pronounced and only 157 mL were consumed by B. methylotrophicum during the remaining 148 h (Figure 3). Immediately after changing the pH set-point, the trend for syngas demand decreased, indicating some stress to the cells. At this pH, 38.9 mM of acetate was further produced, corresponding to a product yield of 1.24 × 10⁻¹ mmol/Lsyngas used. The concentration of butyrate increased steadily at pH 6.0 and the maximum concentration amounted to 0.7 mM, with a product yield of 1.26 × 10⁻³ mmol/Lsyngas used.
During the sequential batches at pH 7.0, the culture medium in the bioreactor started to acquire a grey color (Figure 4), possibly associated with the presence of some tar compounds and other impurities in Syngas B. Cells also started to form aggregates that hindered optical density measurements. This behavior is common in stressed cells, as a mechanism of defense against chemical contaminants in the culture medium [47]. Even so, B. methylotrophicum cells were able to produce both acetate (51.1 mM) and butyrate (0.7 mM) although at lower concentrations than from synthetic syngas. After the acidification of the culture medium to pH 6.0 and acetate supplementation, the cellular growth rate decreased even further. High amounts of impurities started to deposit in the bioreactor, and the culture medium became completely dark (Figure 4c). Organic acid production proceeded, yielding further 38.8 mM acetate and 0.3 mM butyrate. The abrupt decrease in syngas consumption from pH 7.0 to pH 6.0 further supports the theory that the cells were already highly stressed and metabolically affected by the conditions in the culture medium. It has been reported that crude syngas may contain several impurities that are potentially inhibitory to microorganisms, e.g., cyanide compounds, which can impact microbial growth and syngas bioconversion performance [9,11,12,17].
Since headspace sampling would highly influence the batch culture due to forced entry of fresh syngas, only four gaseous samples were collected from the bioreactor during the whole experiment, to monitor the gas composition in a time period of 64 h at pH 7.0 and 65 h at pH 6.0. Table 5 shows the results of carbon and H2 conversion by the cells in these time periods.
During the first 64 h of growth, B. methylotrophicum was able to convert a total of 21.5 mmol of CO + CO2 to products and biomass, corresponding to a total carbon fixation of 88 mol%. CO was the preferential carbon source, with a conversion of 100 mol% at pH 7.0, whereas CO2 registered a negative balance of only 71 mol%. At pH 6.0 only 2.3 mmol of carbon was converted (approximately 10 times less), with a total carbon fixation of 48 mol%. Even though CO was still the preferential carbon source (93 mol% fixation), its conversion rate was significantly lower (0.01 mmol/h). Regarding CO2, only 43 mol% was converted at a rate of 0.03 mmol/h.
The carbon fixation obtained with Syngas B at pH 7.0 was similar to that obtained with Syngas A. Comparatively, a carbon fixation value of 55.9 mol% was obtained in the conversion of lignin syngas with a composition similar to that of Syngas B by Clostridium ljungdahlii, with a constant inflow into the bioreactor [8]. Comparing the two forms of gas feed, the constant inflow results in higher carbon conversion rates, whereas the on-demand feed used in the present work resulted in higher carbon fixation.
As the bioconversion process proceeded, the stress to which the cells were exposed caused a drastic decrease in syngas consumption, halving the value obtained at the beginning of the assay (from 20 to 13 mL/h). Infantes et al., 2020 [8] observed the same effect during lignin syngas bioconversion by C. ljungdahlii, where syngas impurities highly influenced both productivity and carbon fixation. In the present study, the cumulative inhibitory effects caused by the prolonged exposure to Syngas B, the pH adjustment to 6.0, and the acetate surplus in the culture medium led to an accumulation of cell stress that influenced negatively, and decisively, the bioconversion performance of B. methylotrophicum. Additional research, namely the selection of more robust and adapted strains and the implementation of additional syngas cleaning steps, is needed to overcome the problems described.
A tentative carbon balance was undertaken based on the lignin A composition and additional data from the literature [3,48]. The results are preliminary and limited by the small number of gas samples collected from the bioreactor headspace, at 0, 64, 234 and 299 h of process time (Table 5). Figure 5 represents the process schematic with the corresponding inputs and outputs.
Using the BFB gasification yield of 900 L of Syngas B produced from 1 kg of dry lignin determined by Liakakou et al., 2019, 0.25 kg of CO, 0.27 kg of CO2, 0.08 kg of CH4, and residual concentrations of hydrocarbons and tars were obtained [3]. The bioconversion of Syngas B by B. methylotrophicum at pH 7.0 resulted in the accumulation of 0.33 kg of CO2 and 0.24 kg of CH4 in the headspace gas, and in the production of 2.18 kg of acetic acid and 1.72 kg of cell biomass per kg of lignin. All the available CO was converted to products and biomass simultaneously with a slight accumulation of CO2 and a significant accumulation of CH4 in the bioreactor headspace. At pH 6.0, 0.25 kg of CO2 and 0.26 kg of CH4 were accumulated, whereas 1.96 kg of acetic acid, 0.01 kg of butyrate and 0.15 kg of biomass were produced. The switch to more acidic conditions placed the cells under extreme stress, but they were still able to metabolize the CO to acids.
Under the tested conditions, the gasification to Syngas B without subsequent bioconversion would release 0.49 kg of carbon in the form of CO, CO2 and CH4 per kg of dry lignin. Conversely, the bioconversion of Syngas B would result in the direct fixation of approximately 73% of the carbon of the gasification output. This value can be further increased through optimization of the overall process, for example, with the supply of additional H2 to increase CO2 conversion, the removal of easily accessible carbon sources, such as yeast extract, in the culture medium, and the adoption of a continuous culture setting. This latter modification would alleviate the inhibitory effect of crude syngas on the cells by reducing the accumulation of impurities inside the bioreactor. The broad carbon fixation potential of this bio-thermochemical based technology ranges from the conversion of syngas produced by the gasification of organic waste materials, such as low-grade technical lignin, biomass residues and municipal solid waste, to the use of gaseous carbon substrates, such as industrial waste gases. Raw material flexibility is extremely aligned with ambitious, yet urgent, climate change adaptation strategies. This will shape the decarbonization of the economy, orienting the circular action plans towards more sustainable products and technologies for the incorporation and capture of CO2 [49,50]. In future prospects, a techno economic analysis (TEA) and life cycle analysis (LCA) of this process with generated fermentation metrics will be important in order to prove the viability of the proposed biomass-to-chemicals integrated biorefinery. Moreover, it will allow the identification of possible process improvement alternatives at an early development stage. Although LCA studies exist in the literature for volatile fatty acids, for TEA, to the best of the authors’ knowledge, is still scarce, which enforces the need of such combined studies for this integrated biorefinery.

4. Conclusions

This work highlighted the potential of B. methylotrophicum to be used in crude syngas fermentation, converting CO- and CO2-rich gas streams into platform carboxylic acids. The values of carbon fixation from synthetic syngas (Syngas A) by this acetogen reached 88 mol% of the supplied carbon in small scale experiments and 83 mol% in a long-term operated bioreactor. B. methylotrophicum also demonstrated the ability to consume lignin syngas (Syngas B) and was able to use 88 mol% of the supplied carbon, with fixation of 71 mol% of the available CO2 and complete fixation of the CO at pH 7.0. In small-scale experiments with synthetic syngas, the maximum acetate production was 32.0 mM at pH 6.0, whereas in the bioreactor the production reached 38.3 mM at pH 7.0. The supplementation of the culture medium with sodium acetate supported a 6.3-fold increase in butyrate production under more acidic conditions. This effect was less clear in the bioreactor assay, with a maximum butyrate production of 1.2 mM at pH 6.0. Nevertheless, an increase of more than two-fold in the butyrate per acetate produced ratio was observed in this condition.
There was a clear influence of pH on the production profile of B. methylotrophicum from Syngas A, with lower pH and excess acetate shifting metabolism towards butyrate production. When using lignin-derived Syngas B this effect was not as evident, most likely due to the accumulation of toxic syngas impurities inside the bioreactor that acted as additional stress factors to the cells. At pH 6.0, acetate and butyrate production were residual for 148 h, Syngas B consumption rate by B. methylotrophicum decreased drastically to 0.9 NmL/h, and cell density dropped significantly to an O.D.600nm of 0.65. These results seem to indicate that a future syngas-based biorefinery would benefit from a modified bioreactor system, possibly with continuous cell renewal, to reduce the influence of inhibitors present in the crude syngas. More work on strain adaption to syngas impurities is required, since B. methylotrophicum demonstrated some initial resilience to the exposure to crude syngas. Ultimately this work demonstrated the importance of testing the bioconversion of syngas not only with synthetic gas formulations, but also with real gaseous waste streams, to correctly predict cell behavior and limit the effect of syngas impurities.

Author Contributions

Conceptualization, P.M. and M.P.; Methodology, M.P., P.M. and J.O.; validation, P.M.; formal analysis, M.P. and P.M.; investigation, M.P. and J.O.; resources, F.P.; writing—original draft preparation, M.P. and P.M.; writing—review and editing, P.M., C.S., J.O., F.P. and F.G.; supervision, P.M. and C.S.; project administration, F.G.; funding acquisition, F.G. and P.M. All authors have read and agreed to the published version of the manuscript.

Funding

This research was performed under the framework of the AMBITION Project, an ECRIA project funded by the European Union’s Horizon 2020 research and innovation program, under grant agreement No. 731263, and the Operational Program for Competitiveness and Internationalization (PORTUGAL 2020), Lisbon Portugal Regional Operational Program (Lisboa 2020) and North Portugal Regional Operational Program (Norte 2020) under the Portugal 2020 Partnership Agreement, through the European Regional Development Fund (ERDF). MP and JO were supported by FCT through PhD grants DFA/BD/6423/2020 and SFRH/BD/107780/2015, respectively. The authors would like to acknowledge FCT through project UIDB/50019/2021—Instituto Dom Luiz.

Institutional Review Board Statement

Not applicable.

Informed Consent Statement

Not applicable.

Data Availability Statement

Not applicable.

Acknowledgments

The authors would like to thank Tania Chen Barbachano for proofreading and editing the present manuscript. The authors would also like to thank the technical assistance of Luís Ramalho (GC analysis).

Conflicts of Interest

The authors declare no conflict of interest.

References

  1. Parisi, C. Distribution of the Bio-Based Industry in the EU; Publications Office of the European Union: Luxembourg, 2020. [Google Scholar] [CrossRef]
  2. Wen, J.-L.; Wang, H.-M.; Ma, C.-Y.; Yuan, T.-Q.; Sun, R.-C. Value-added products from lignin: Isolation, characterization and applications. In Biomass, Biofuels, Biochemicals: Lignin Biorefinery; Bhaskar, T., Pandey, A., Eds.; Elsevier: Amsterdam, The Netherlands, 2021; pp. 33–55. ISBN 9780128202944. [Google Scholar]
  3. Liakakou, E.T.; Vreugdenhil, B.J.; Cerone, N.; Zimbardi, F.; Pinto, F.; André, R.; Marques, P.; Mata, R.; Girio, F. Gasification of Lignin-Rich Residues for the Production of Biofuels via Syngas Fermentation: Comparison of Gasification Technologies. Fuel 2019, 251, 580–592. [Google Scholar] [CrossRef]
  4. Whitty, K.J.; Zhang, H.R.; Eddings, E.G. Emissions from Syngas Combustion. Combust. Sci. Technol. 2008, 180, 1117–1136. [Google Scholar] [CrossRef]
  5. Henstra, A.M.; Sipma, J.; Rinzema, A.; Stams, A.J. Microbiology of Synthesis Gas Fermentation for Biofuel Production. Curr. Opin. Biotechnol. 2007, 18, 200–206. [Google Scholar] [CrossRef] [PubMed]
  6. Kumar, S.; Muthu Dineshkumar, R.; Angkayarkan Vinayakaselvi, M.; Ramanathan, A. Bio-Ethanol Production from Syngas-Derived Biomass: A Review. Mater. Today Proc. 2021, 46, 9989–9993. [Google Scholar] [CrossRef]
  7. Pinto, F.; André, R.; Marques, P.; Mata, R.; Pacheco, M.; Moura, P.; Gírio, F. Production of Syngas Suitable to Be Used in Fermentation to Obtain Biochemical Added-Value Compounds. Chem. Eng. Trans. 2019, 76, 1399–1404. [Google Scholar] [CrossRef]
  8. Liakakou, E.T.; Infantes, A.; Neumann, A.; Vreugdenhil, B.J. Connecting Gasification with Syngas Fermentation: Comparison of the Performance of Lignin and Beech Wood. Fuel 2021, 290, 120054. [Google Scholar] [CrossRef]
  9. Infantes, A.; Kugel, M.; Raffelt, K.; Neumann, A. Side-by-side Comparison of Clean and Biomass-Derived, Impurity-containing Syngas as Substrate for Acetogenic Fermentation with Clostridium ljungdahlii. Fermentation 2020, 6, 84. [Google Scholar] [CrossRef]
  10. Ramachandriya, K.D.; Wilkins, M.R.; Patil, K.N. Influence of Switchgrass Generated Producer Gas Pre-Adaptation on Growth and Product Distribution of Clostridium ragsdalei. Biotechnol. Bioprocess Eng. 2013, 18, 1201–1209. [Google Scholar] [CrossRef]
  11. Xu, D.; Lewis, R.S. Syngas Fermentation to Biofuels: Effects of Ammonia Impurity in Raw Syngas on Hydrogenase Activity. Biomass Bioenergy 2012, 45, 303–310. [Google Scholar] [CrossRef]
  12. Xu, D.; Tree, D.R.; Lewis, R.S. The Effects of Syngas Impurities on Syngas Fermentation to Liquid Fuels. Biomass Bioenergy 2011, 35, 2690–2696. [Google Scholar] [CrossRef]
  13. Ahmed, A.; Lewis, R.S. Fermentation of Biomass-Generated Synthesis Gas: Effects of Nitric Oxide. Biotechnol. Bioeng. 2007, 97, 1080–1086. [Google Scholar] [CrossRef] [PubMed]
  14. Datar, R.P.; Shenkman, R.M.; Cateni, B.G.; Huhnke, R.L.; Lewis, R.S. Fermentation of Biomass-Generated Producer Gas to Ethanol. Biotechnol. Bioeng. 2004, 86, 587–594. [Google Scholar] [CrossRef] [PubMed]
  15. Ahmed, A.; Cateni, B.G.; Huhnke, R.L.; Lewis, R.S. Effects of Biomass-Generated Producer Gas Constituents on Cell Growth, Product Distribution and Hydrogenase Activity of Clostridium carboxidivorans P7T. Biomass Bioenergy 2006, 30, 665–672. [Google Scholar] [CrossRef]
  16. Kundiyana, D.K.; Huhnke, R.L.; Wilkins, M.R. Syngas Fermentation in a 100-L Pilot Scale Fermentor: Design and Process Considerations. J. Biosci. Bioeng. 2010, 109, 492–498. [Google Scholar] [CrossRef] [PubMed]
  17. Oswald, F.; Zwick, M.; Omar, O.; Hotz, E.N.; Neumann, A. Growth and Product Formation of Clostridium ljungdahlii in Presence of Cyanide. Front. Microbiol. 2018, 9. [Google Scholar] [CrossRef] [PubMed]
  18. Zeikus, J.G.; Lynd, L.H.; Thompson, T.E.; Krzycki, J.A.; Weimer, P.J.; Hegge, P.W. Isolation and Characterization of a New, Methylotrophic, Acidogenic Anaerobe, the Marburg Strain. Curr. Microbiol. 1980, 3, 381–386. [Google Scholar] [CrossRef]
  19. Bertsch, J.; Müller, V. Bioenergetic Constraints for Conversion of Syngas to Biofuels in Acetogenic Bacteria. Biotechnol. Biofuels 2015, 8, 210. [Google Scholar] [CrossRef] [PubMed] [Green Version]
  20. Kennes, D.; Abubackar, H.N.; Diaz, M.; Veiga, M.C.; Kennes, C. Bioethanol Production from Biomass: Carbohydrate vs Syngas Fermentation. J. Chem. Technol. Biotechnol. 2016, 91, 304–317. [Google Scholar] [CrossRef]
  21. Deshmukh, G.; Manyar, H. Production Pathways of Acetic Acid and Its Versatile Applications in the Food Industry. In Acetic Acid-Production and Applications in the Food Industry [Working Title]; IntechOpen: London, UK, 2020; ISBN 978-1-83881-182-2. [Google Scholar]
  22. Xu, Z.; Jiang, L. Butyric Acid. In Comprehensive Biotechnology; Moo-Young, M., Ed.; Pergamon: Elmsford, NY, USA, 2011; Volume 3, pp. 235–243. ISBN 9780444640475. [Google Scholar]
  23. Kolesinska, B.; Fraczyk, J.; Binczarski, M.; Modelska, M.; Berlowska, J.; Dziugan, P.; Antolak, H.; Kaminski, Z.J.; Witonska, I.A.; Kregiel, D. Butanol Synthesis Routes for Biofuel Production: Trends and Perspectives. Materials 2019, 12, 350. [Google Scholar] [CrossRef] [PubMed] [Green Version]
  24. Kiefer, D.; Merkel, M.; Lilge, L.; Henkel, M.; Hausmann, R. From Acetate to Bio-Based Products: Underexploited Potential for Industrial Biotechnology. Trends. Biotechnol. 2021, 39, 397–411. [Google Scholar] [CrossRef] [PubMed]
  25. Yasin, M.; Jang, N.; Lee, M.; Kang, H.; Aslam, M.; Bazmi, A.A.; Chang, I.S. Bioreactors, Gas Delivery Systems and Supporting Technologies for Microbial Synthesis Gas Conversion Process. Bioresour. Technol. Rep. 2019, 7, 100207. [Google Scholar] [CrossRef]
  26. Arantes, A.L.; Moreira, J.P.C.; Diender, M.; Parshina, S.N.; Stams, A.J.M.; Alves, M.M.; Alves, J.I.; Sousa, D.Z. Enrichment of Anaerobic Syngas-Converting Communities and Isolation of a Novel Carboxydotrophic Acetobacterium wieringae Strain JM. Front. Microbiol. 2020, 11, 58. [Google Scholar] [CrossRef] [PubMed] [Green Version]
  27. Diender, M.; Parera Olm, I.; Sousa, D.Z. Synthetic Co-Cultures: Novel Avenues for Bio-Based Processes. Curr. Opin. Biotechnol. 2021, 67, 72–79. [Google Scholar] [CrossRef] [PubMed]
  28. Oswald, F.; Dörsam, S.; Veith, N.; Zwick, M.; Neumann, A.; Ochsenreither, K.; Syldatk, C. Sequential Mixed Cultures: From Syngas to Malic Acid. Front. Microbiol. 2016, 7, 891. [Google Scholar] [CrossRef] [PubMed]
  29. Gírio, F.; Marques, S.; Pinto, F.; Oliveira, A.C.; Costa, P.; Reis, A.; Moura, P. Biorefineries in the world. In Biorefineries. Lecture Notes in Energy; Rabaçal, M., Ferreira, A., Silva, C., Costa, M., Eds.; Springer: Cham, Switzerland, 2017; Volume 57, pp. 227–281. [Google Scholar] [CrossRef]
  30. Worden, R.M.; Grethlein, A.J.; Zeikus, J.G.; Datta, R. Butyrate Production from Carbon Monoxide by Butyribacterium methylotrophicum. App. Biochem. Biotechnol. 1989, 20–21, 687–698. [Google Scholar] [CrossRef]
  31. AOAC. Official Methods of Analysis of AOAC International, 21st ed.; Latimer, G.W., Ed.; AOAC International: Rockville, MD, USA, 2019; Volumes 1–3, ISBN 0935584897. [Google Scholar]
  32. Ortigueira, J.; Alves, L.; Gouveia, L.; Moura, P. Third Generation Biohydrogen Production by Clostridium butyricum and Adapted Mixed Cultures from Scenedesmus obliquus Microalga Biomass. Fuel 2015, 153, 128–134. [Google Scholar] [CrossRef] [Green Version]
  33. Infantes, A.; Kugel, M.; Neumann, A. Evaluation of Media Components and Process Parameters in a Sensitive and Robust Fed-Batch Syngas Fermentation System with Clostridium ljungdahlii. Fermentation 2020, 6, 61. [Google Scholar] [CrossRef]
  34. Fernández-Naveira, Á.; Veiga, M.C.; Kennes, C. H-B-E (Hexanol-Butanol-Ethanol) Fermentation for the Production of Higher Alcohols from Syngas/Waste Gas. J. Chem. Technol. Biotechnol. 2017, 92, 712–731. [Google Scholar] [CrossRef]
  35. Heiskanen, H.; Virkajärvi, I.; Viikari, L. The Effect of Syngas Composition on the Growth and Product Formation of Butyribacterium methylotrophicum. Enzym. Microb. Technol. 2007, 41, 362–367. [Google Scholar] [CrossRef]
  36. Park, S.; Yasin, M.; Jeong, J.; Cha, M.; Kang, H.; Jang, N.; Choi, I.G.; Chang, I.S. Acetate-Assisted Increase of Butyrate Production by Eubacterium limosum KIST612 during Carbon Monoxide Fermentation. Bioresour. Technol. 2017, 245, 560–566. [Google Scholar] [CrossRef] [PubMed]
  37. Diender, M.; Stams, A.J.M.; Sousa, D.Z. Production of Medium-Chain Fatty Acids and Higher Alcohols by a Synthetic Co-Culture Grown on Carbon Monoxide or Syngas. Biotechnol. Biofuels 2016, 9, 82. [Google Scholar] [CrossRef] [PubMed] [Green Version]
  38. Drake, H.L.; Gößner, A.S.; Daniel, S.L. Old Acetogens, New Light. Ann. NY Acad. Sci. 2008, 1125, 100–128. [Google Scholar] [CrossRef] [PubMed]
  39. Dürre, P. Butanol Formation from Gaseous Substrates. FEMS Microbiol. Lett. 2016, 363, 40. [Google Scholar] [CrossRef] [PubMed]
  40. Richter, H.; Molitor, B.; Diender, M.; Sousa, D.Z.; Angenent, L.T. A Narrow pH Range Supports Butanol, Hexanol, and Octanol Production from Syngas in a Continuous Co-Culture of Clostridium ljungdahlii and Clostridium kluyveri with in-Line Product Extraction. Front. Microbiol. 2016, 7, 1773. [Google Scholar] [CrossRef] [PubMed] [Green Version]
  41. Annous, B.A.; Shieh, J.-S.; Shen, G.-J.; Jain, M.K.; Zeikus, J.G. Regulation of Hydrogen Metabolism in Butyribacterium methylotrophicum by Substrate and pH. Appl. Microbiol. Biotechnol. 1996, 45, 804–810. [Google Scholar] [CrossRef]
  42. Grethlein, A.J.; Worden, R.M.; Jain, M.K.; Datta, R. Continuous Production of Mixed Alcohols and Acids from Carbon Monoxide. Appl. Biochem. Biotechnol. 1990, 24, 875–884. [Google Scholar] [CrossRef]
  43. Jaros, A.M.; Rova, U.; Berglund, K.A. Acetate Adaptation of Clostridia tyrobutyricum for Improved Fermentation Production of Butyrate. Springerplus 2013, 2, 47. [Google Scholar] [CrossRef] [PubMed] [Green Version]
  44. Ueki, T.; Nevin, K.P.; Woodard, T.L.; Lovley, D.R. Converting Carbon Dioxide to Butyrate with an Engineered Strain of Clostridium ljungdahlii. mBio 2014, 5, e01636-14. [Google Scholar] [CrossRef] [PubMed] [Green Version]
  45. Duncan, S.H.; Barcenilla, A.; Stewart, C.S.; Pryde, S.E.; Flint, H.J. Acetate Utilization and Butyryl Coenzyme A (CoA): Acetate-CoA Transferase in Butyrate-Producing Bacteria from the Human Large Intestine. Appl. Environ. Microb. 2002, 68, 5186–5190. [Google Scholar] [CrossRef] [Green Version]
  46. Fernández-Naveira, Á.; Abubackar, H.N.; Veiga, M.C.; Kennes, C. Production of Chemicals from C1 Gases (CO, CO2) by Clostridium carboxidivorans. World J. Microbiol. Biotechnol. 2017, 33, 43. [Google Scholar] [CrossRef] [PubMed]
  47. Trunk, T.; Khalil, H.S.; Leo, J.C. Bacterial Autoaggregation. AIMS Microbiol. 2018, 4, 140–164. [Google Scholar] [CrossRef] [PubMed]
  48. Thompson, K.; Summers, R.; Cook, S. Development and Experimental Validation of the Composition and Treatability of a New Synthetic Bathroom Greywater (SynGrey). Environ. Sci. Water Res. Technol. 2017, 3, 1120–1131. [Google Scholar] [CrossRef]
  49. Abu Hassan, M.H.; Sher, F.; Fareed, B.; Ali, U.; Zafar, A.; Bilal, M.; Iqbal, H.M.N. Sustainable Hydrates for Enhanced Carbon Dioxide Capture from an Integrated Gasification Combined Cycle in a Fixed Bed Reactor. Ind. Eng. Chem. Res. 2021, 60, 11346–11356. [Google Scholar] [CrossRef] [PubMed]
  50. Ameen, M.; Zamri, N.M.; May, S.T.; Azizan, M.T.; Aqsha, A.; Sabzoi, N.; Sher, F. Effect of Acid Catalysts on Hydrothermal Carbonization of Malaysian Oil Palm Residues (Leaves, Fronds, and Shells) for Hydrochar Production. Biomass Convers. Biorefin. 2021. Available online: https://link.springer.com/article/10.1007%2Fs13399-020-01201-2 (accessed on 22 October 2021). [CrossRef]
Figure 1. Cell growth, acetate and butyrate production, and CO, CO2 and H2 fixation by B. methylotrophicum cultured with Syngas A in serum flasks at: pH 7.0 (a,b); pH 6.0 (c,d); and pH 6.0 with supplementation of sodium acetate (e,f). The results are average values of two experiments. Standard deviation was performed with 3 experimental repetitions. ( Energies 14 07124 i001—Optical density at 600 nm; Energies 14 07124 i002—acetate; Energies 14 07124 i003—butyrate; Energies 14 07124 i004—CO; Energies 14 07124 i005—H2; Energies 14 07124 i006—CO2).
Energies 14 07124 g001
Figure 2. Time course representation of pressure variation, cell density, acetate and butyrate production by B. methylotrophicum cultured with Syngas A in bioreactor at pH 7.0 and pH 6.0 ( Energies 14 07124 i007
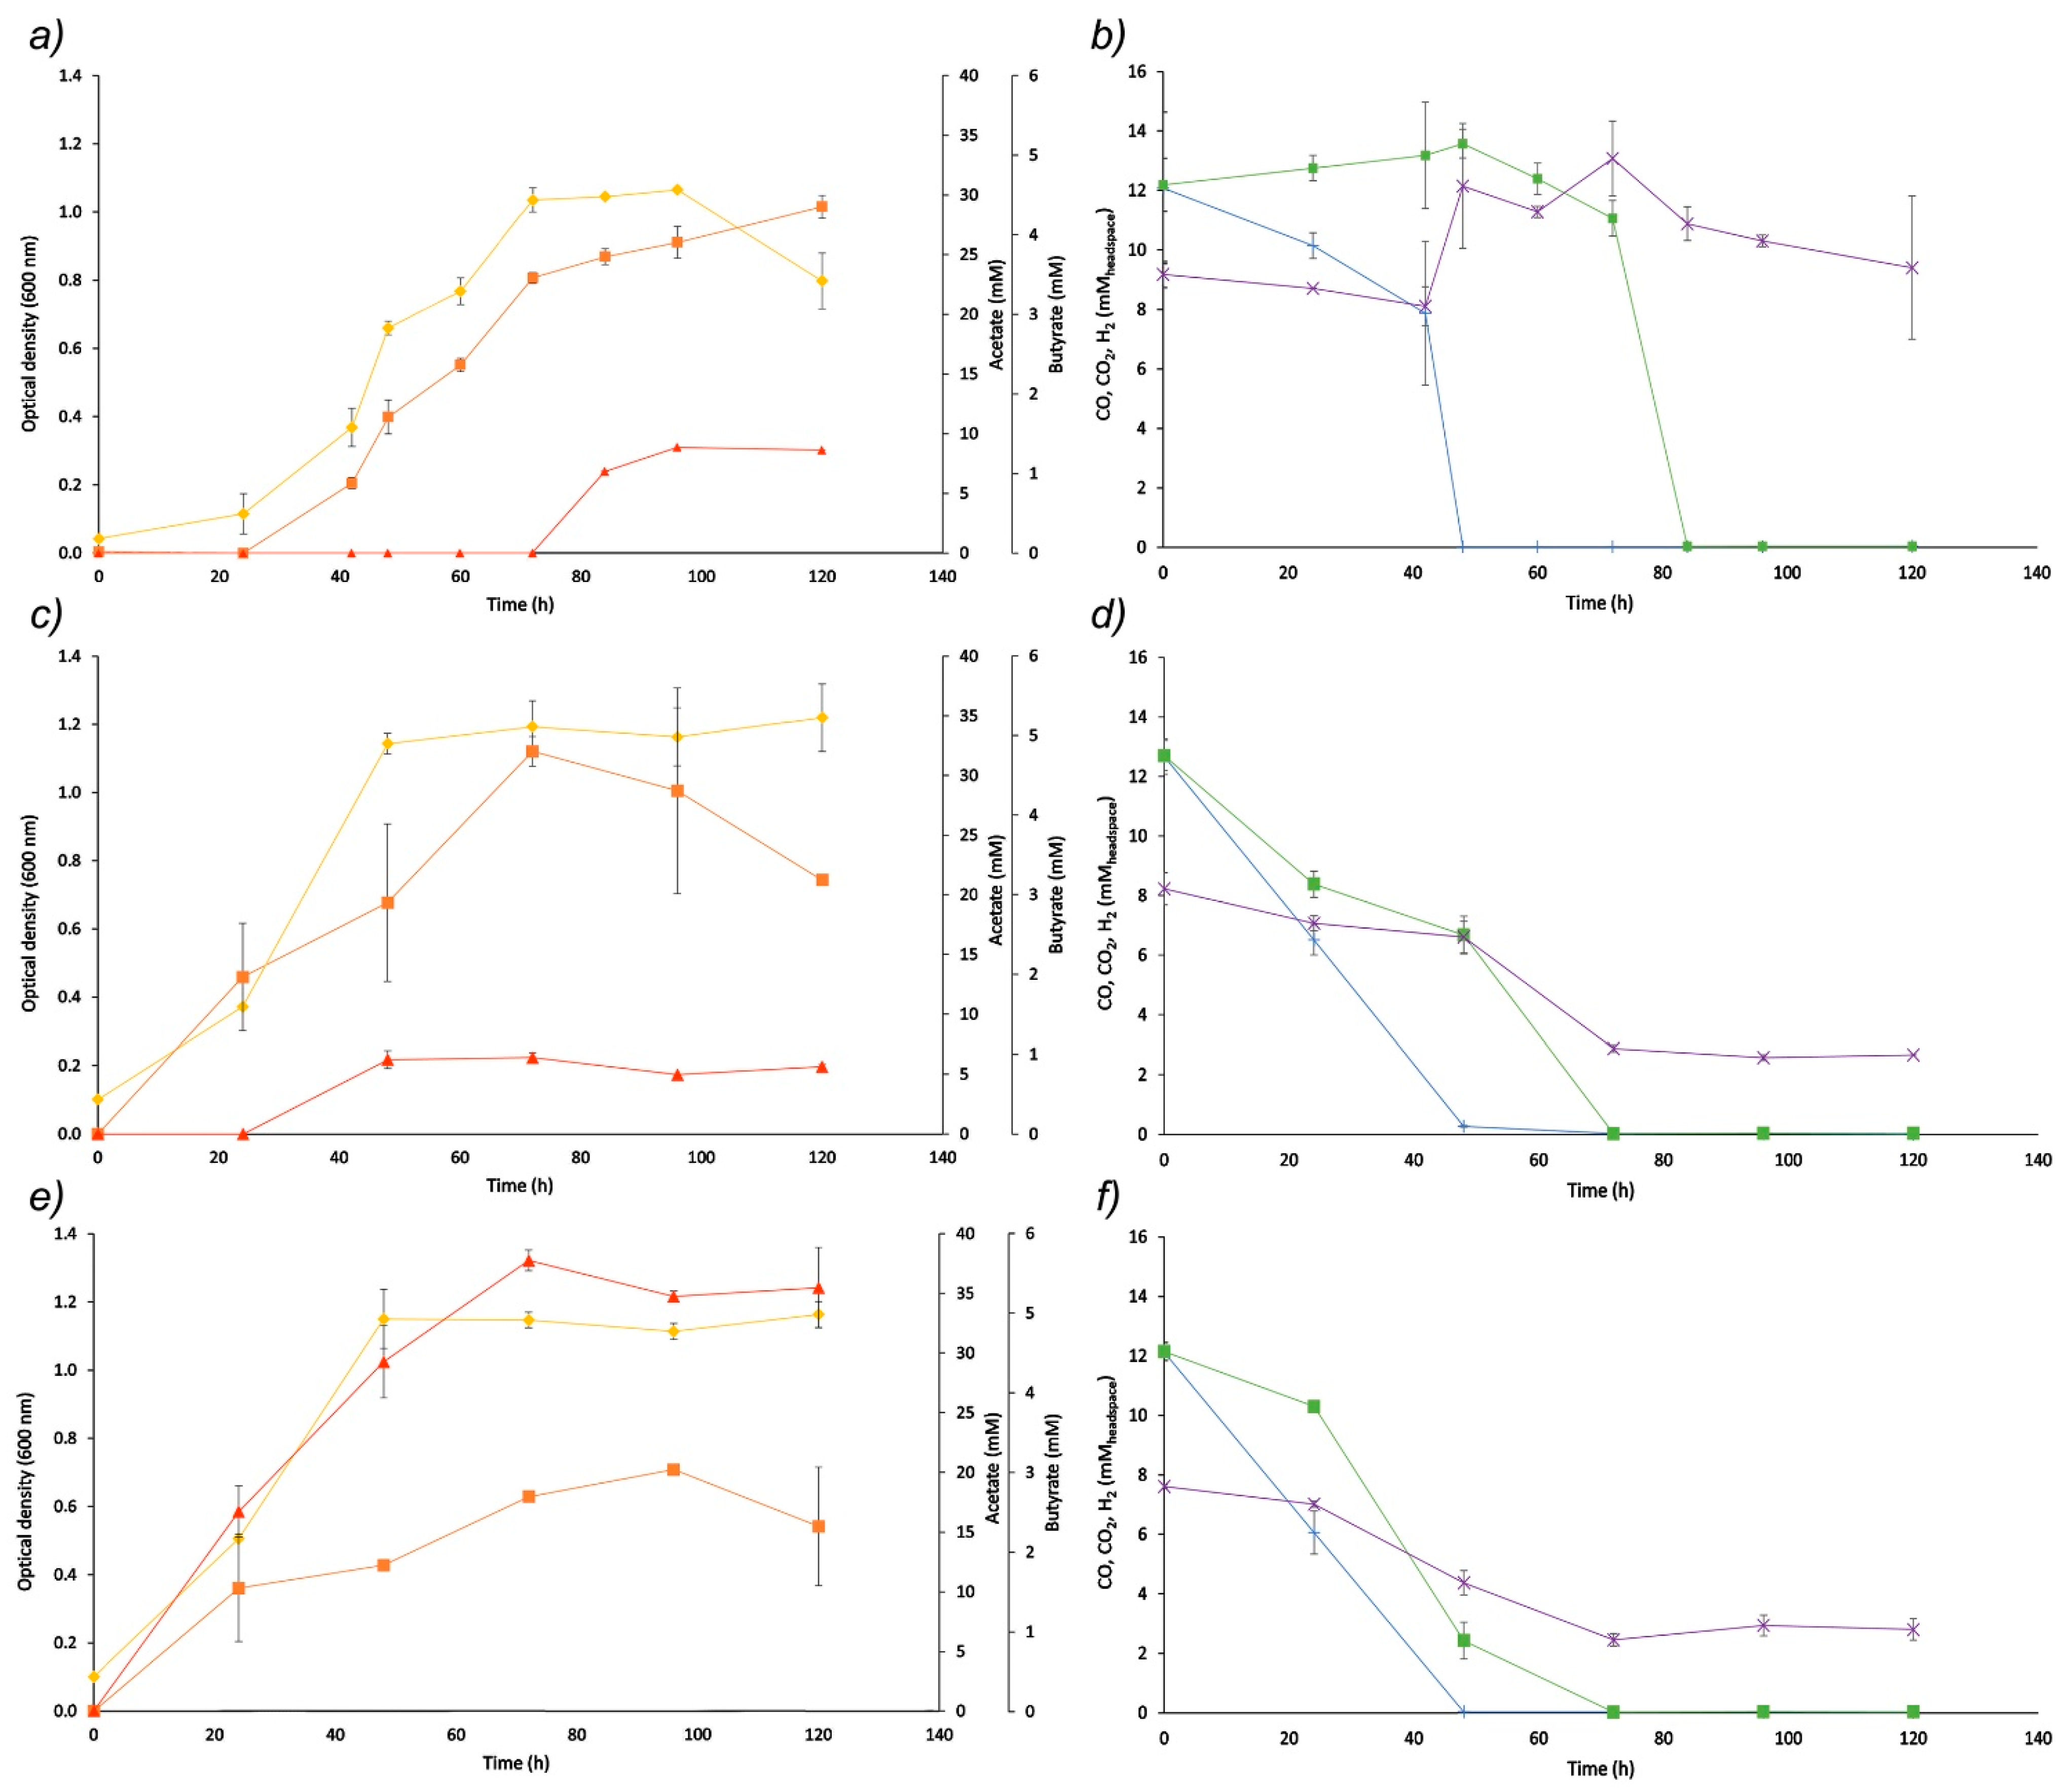
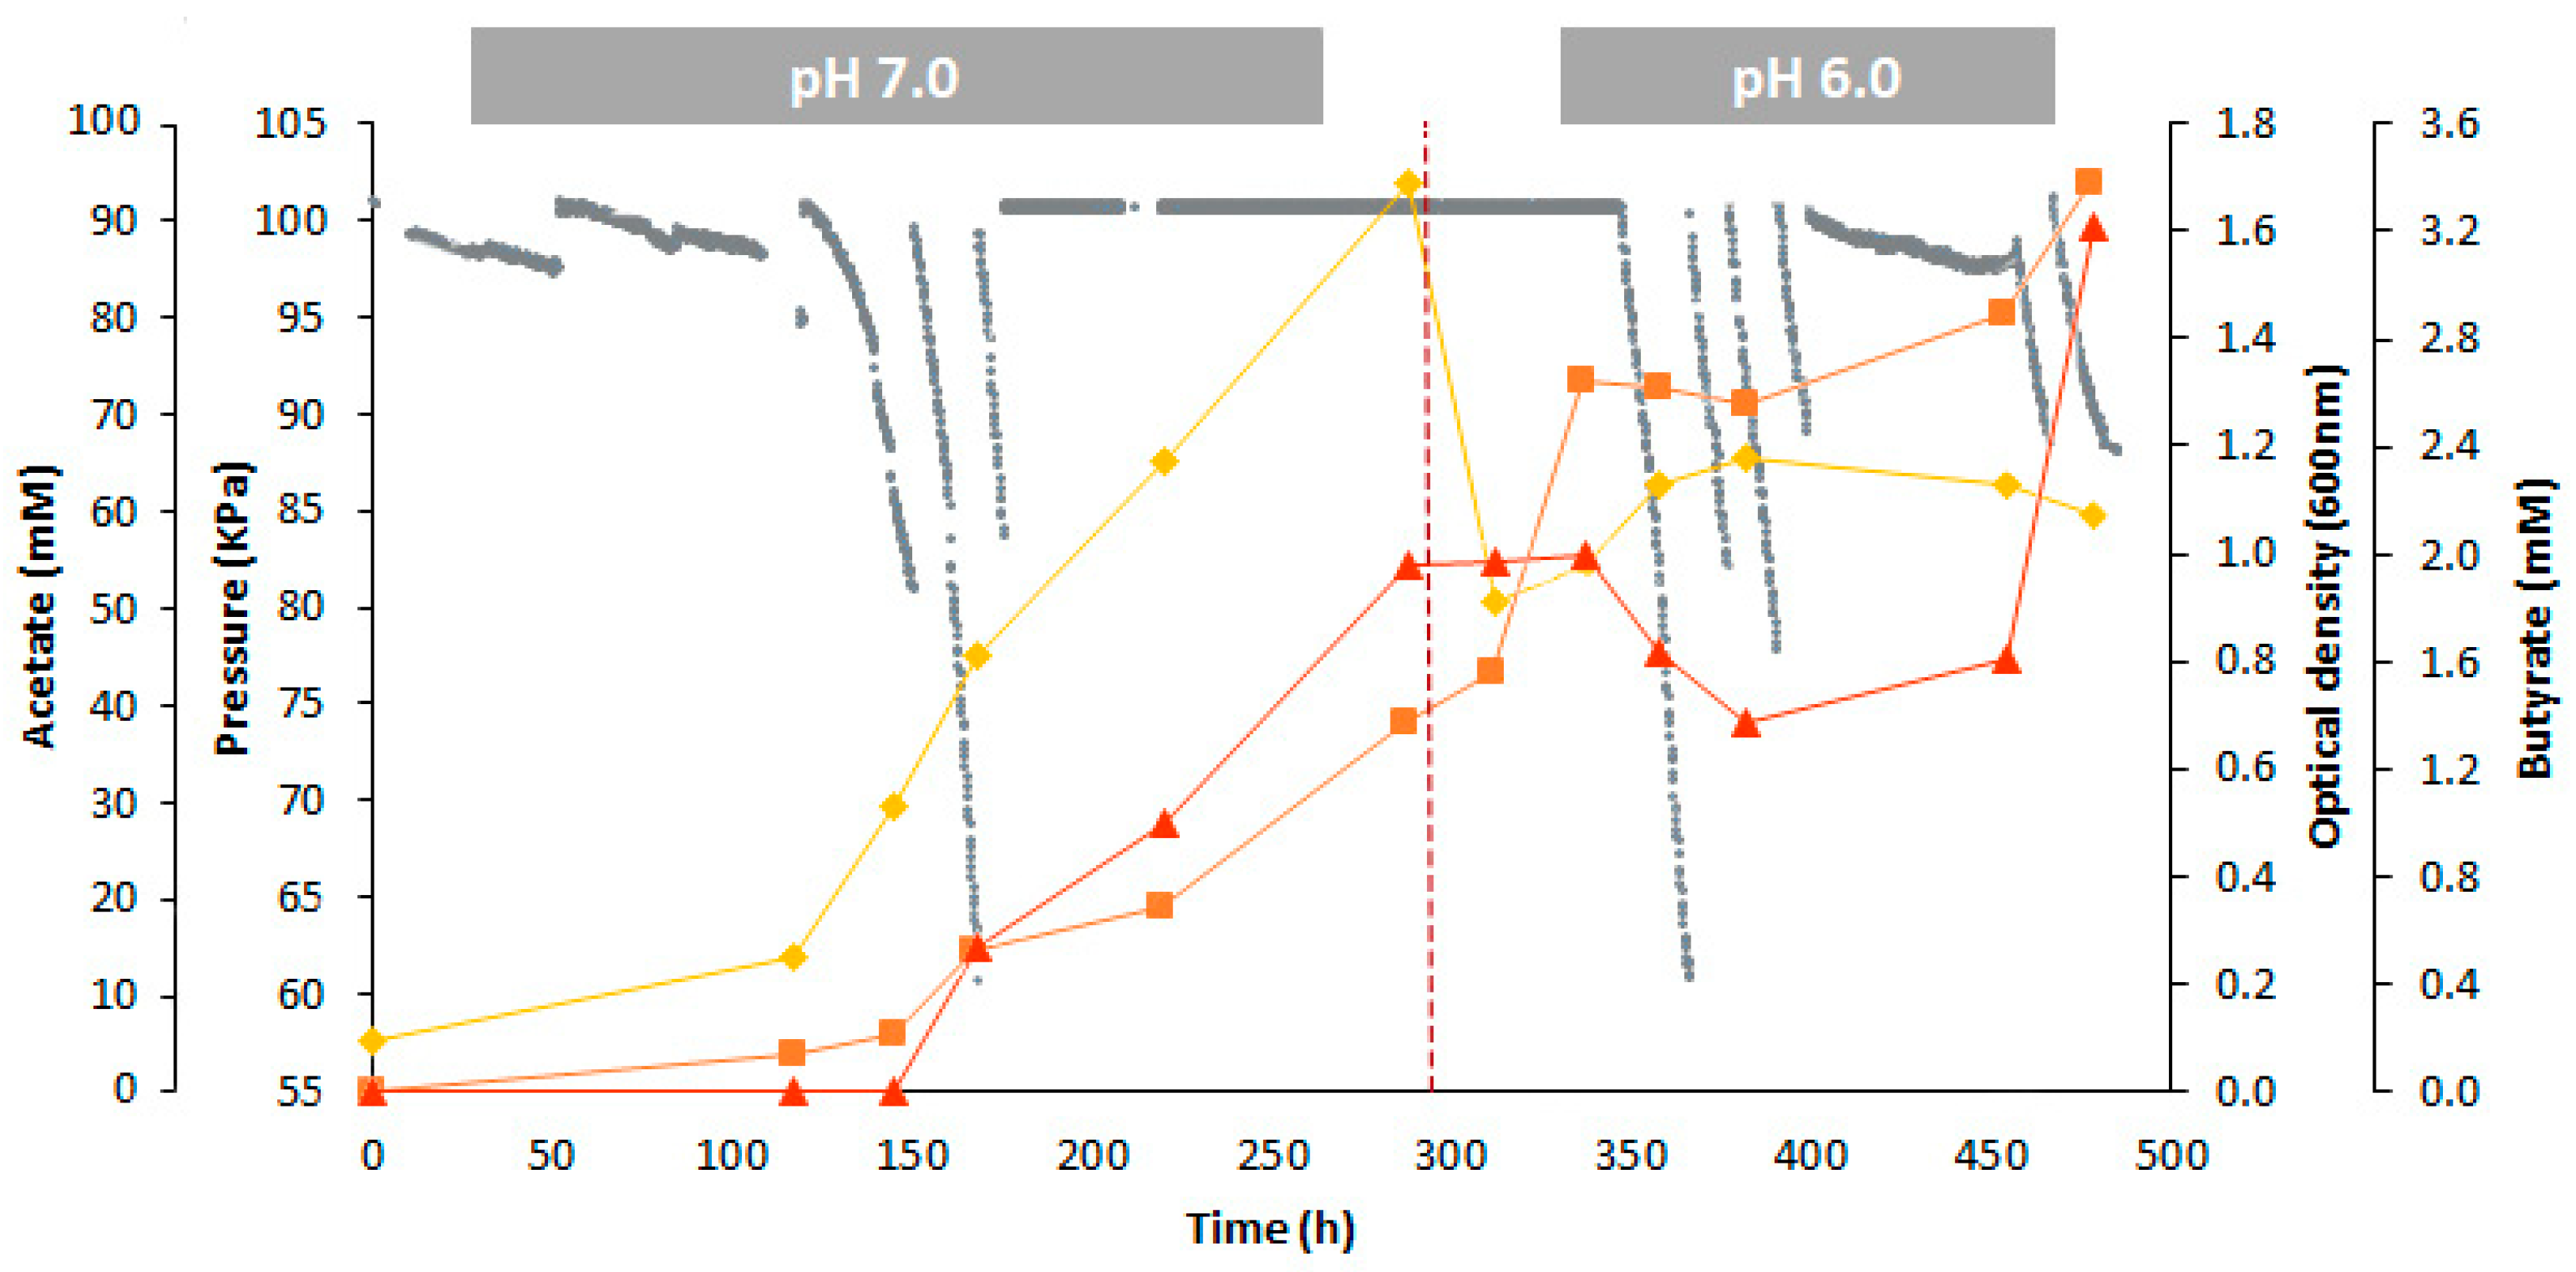
—pressure inside the bioreactor; Energies 14 07124 i008—Optical density at 600 nm; Energies 14 07124 i009—acetate; Energies 14 07124 i010—butyrate; —pH set-point change).
Energies 14 07124 g002
Figure 3. Time course representation of B. methylotrophicum growth with on-demand Syngas B supply at pH 7.0 and 6.0. The continuous line represents the volume of Syngas B infeed, and the colored vertical bars represent (a) cell dry weight (CDW), (b) acetate concentration and (c) butyrate concentration. The vertical dashed lines represent the time points where the culture medium was partially replaced by new nutrient stock solution during pH 7.0 or when the pH set-point was changed to 6.0 and the culture medium was supplemented with sodium acetate.
Energies 14 07124 g003
Figure 4. (a) Cells collected from the bioreactor at the beginning of Syngas B bioconversion by B. methylotrophicum (left) and at the end of the three pH 7.0 batch series (right); (b) culture media in the bioreactor at the end of the Syngas A bioconversion; (c) culture media in the bioreactor at the end of Syngas B bioconversion.
Energies 14 07124 g004
Figure 5. Process schematic of Syngas B production and bioconversion, representing the carbon inputs and outputs per kg of dry lignin.
Energies 14 07124 g005
Table 1. Composition of the syngas used for bioconversion by B. methylotrophicum. Syngas A was the synthetic syngas formulation and Syngas B was obtained from the gasification of technical lignin.
Syngas CompoundSyngas ASyngas B Units
CO30.024.2vol%
CO220.016.5vol%
H230.023.9vol%
CH4-13.6vol%
N220.018.1vol%
O2-0.4vol%
C2H2-nd -
C2H4-3.0vol%
C2H6-0.1vol%
C3H6-300ppmV
C3H8-500ppmV
C4H10-300ppmV
NH3-760ppmV
H2S-180ppmV
, Values are at standard conditions of temperature and pressure—temperature of 25 °C (293.15 K) and absolute pressure of 1.0 × 10⁵ Pa. , not detected
Table 2. Growth rate, acetate and butyrate production, pH and pressure decrease achieved in the culture of B. methylotrophicum with Syngas A, at pH 7.0 and pH 6.0, with or without medium supplementation of the culture medium with sodium acetate.
ParameterpH 7.0pH 6.0pH 6.0 and
NaAc 1
Max. specific growth rate 2 (h−1)0.07 (R2 = 0.99)0.05 (R2 = 1.00)0.05 (R2 = 0.97)
Acetate (mM)29.0 ± 1.032.0 ± 1.220.2 ± 0.3
Butyrate (mM)1.7 ± 0.40.9 ± 0.15.7 ± 0.1
Butyrate/acetate produced (mol/mol)0.060.050.59
Final pH6.6 ± 0.15.8 ± 0.06.0 ± 0.0
Pressure after 120 h (kPa) 342.644.645.6
CF (mol %)618786
1, NaAc, sodium acetate; 2, Based on ln O.D.600nm; 3, Pressure value measured inside the serum flasks; CF, Carbon fixation determined using Equation (1), from 0–120 h.
Table 3. Growth, acetate and butyrate production, and minimum pressure achieved in the bioconversion of Syngas A by B. methylotrophicum at pH 7.0 (0–288 h) and pH 6.0 (288–483 h).
Parameters.pH 7.0pH 6.0
Max. specific growth rate 1 (h−1)0.0120.006
Acetate (mM) 238.320.2
Butyrate (mM) 22.01.2
Butyrate/Acetate produced (mol/mol)0.050.16
Min. pressure 3 (kPa)60.860.9
CF (mol%)8379
1, Based on ln(O.D.600nm); 2, Production was estimated as the concentration increase during the operation at each pH value; 3, Minimum pressure value measured inside the bioreactor headspace; CF, Carbon fixation determined, using Equation (1), from 175 to 287 h (during on-demand syngas feeding) for pH 7.0 and 465 to 483 h (during batch syngas feeding) for pH 6.0.
Table 4. Syngas feed, cell growth, yields and productivities achieved in the bioconversion of Syngas B by B. methylotrophicum in four sequential batches under on-demand gas feed, at pH 7.0 and pH 6.0.
ParameterspH 7.0pH 6.0; NaAc Supplementation
Time period (h)0–232232–380
Vsyngas (NmL)1600157
rSmax (NmL/h)13.3
6.7
3.2 *
0.9
OD (600nm) max1.710.65
CDW (g/L)2.77 1
3.58 2
3.01 2
Max. acetate produced (mM)51.138.9
Max. acetate concentration (mM)51.1138.3
YP/S acetate (mmol/Lsyngas used)1.20 × 10⁻² †
2.42 × 10⁻² ‡
2.16 × 10−3 *
1.24 × 10−1
Max. butyrate produced (mM)0.70.3
Max. butyrate concentration (mM)0.70.7
YP/S butyrate (mmol/Lsyngas used)3.29 × 10⁻⁴ †
1.03 × 10⁻³ ‡
1.02 × 10−4 *
1.26 × 10−3
rSmax, maximum volumetric rate of syngas consumption; YP/S, product yield (maximum acid produced in terms of total syngas used); 1, no cell aggregation was observed; 2, cell aggregation occurred; , determined in the 1st batch; , determined in the 2nd batch; *, determined in the 3rd batch.
Table 5. CO, CO2 and H2 consumption and carbon fixation during the bioconversion of Syngas B by B. methylotrophicum.
ParameterspH 7.0pH 6.0; NaAc Supplementation
Time period (h)0–64234–299
CO consumed (mmol)14.40.4
CO2 negative balance (mmol)7.11.9
H2 consumed (mmol)11.2-
rCO (mmol/h)0.230.01
rCO2 (mmol/h)0.110.03
rH2 (mmol/h)0.18-
CF, total (mol%)8848
CF, partial (mol%)CO: 100
CO2: 71
CO: 93
CO2: 43
rCO;CO2;H2, consumption rate of each syngas component; in the case of CO2, it is based on the net negative balance between CO2 consumption and CO2 production; CF, total, total carbon fixation calculated using Equation (1); CF partial CO, CO fixation calculated using Equation (1); CF partial CO2, CO2 fixation calculated using Equation (1).
Publisher’s Note: MDPI stays neutral with regard to jurisdictional claims in published maps and institutional affiliations.

