Abstract
The article presents the results of research related to the SDG7 sustainable development implementation analysis. The goal is to provide affordable and clean energy. Its implementation will allow for development that will simultaneously provide the possibility of economic growth and the achievement of an optimal level of citizens’ health and life. The research was conducted for the countries of the European Union EU-27. During the analysis, the indicators proposed by Eurostat were used. The research aimed to examine the progress in EU member states’ energy markets integration. In order to carry out the indispensable research, it was necessary to use a spatial information system. Cluster analysis, as well as TSA analysis, were applied. The conducted research made it possible to verify the posed hypotheses and showed that the energy transformation process of the EU-27 countries is so complicated and heterogeneous that it has given rise to new independent and unique clusters. The authors also verified the adopted set of SDG7 achievement indicators using multiple regression. Additional indicators were also proposed that could complement the set and clarify its analyses.
1. Introduction
The idea of sustainable development arose due to concerns about the condition of the Earth’s ecosystem, which was threatened by human activity. Economic growth had a negative impact on the natural environment, so it became necessary to strike a balance between economic development and care for the natural environment.
The article focuses on the seventh goal (SDG7), i.e., affordable and clean energy. The degree of SDG7 implementation was presented in the Sustainable Development Report 2021 [1]. The progress has been recognized as on track or maintaining SDG achievement, for example in Iceland, New Zealand, Switzerland, and Norway. In the case of the European Union, only a few member states have succeeded in this area, such as Finland, Denmark, Bulgaria, Portugal, and Sweden.
For each of the goals, Eurostat has assigned indicators that make it possible to assess the degree of their implementation. Eurostat has adopted a set of indicators to monitor and verify the progress of individual EU countries towards the SDG7. These indicators are:
- Primary energy consumption
- Final energy consumption
- Final energy consumption in households per capita
- Energy productivity
- Share of renewable energy in gross final energy consumption by sector
- Energy import dependency by products
- Population unable to keep home adequately warm by poverty status
- Greenhouse gas emissions intensity of energy consumption [2,3].
In addition to the eight fundamental indicators, the set also includes additional subgroups, such as energy import dependency by products (coal, crude oil, and natural gas), primary energy consumption per capita, or final energy consumption in households per capita.
The European Union places the emphasis on actions aimed at achieving all the goals of sustainable development. Therefore, they were included in the policy and vision of the European Union until 2030 [4]. The research aimed to examine the progress in EU member states’ integration of energy markets. It was assumed that the degree of the SDG7 achievement depended on the country for which the analyses were conducted. Therefore, in the article, a cluster analysis was used. This enabled an assignment of the analyzed countries to groups similar to each other in terms of the level of the analyzed indicators. The analysis was carried out for the EU-27 in two years: 2000 as the base year and 2019. This allowed for dynamic analysis. Cluster analysis was conducted using the hierarchical method in two variants, without and with weights of the considered factors. To determine the importance of indicators, an expert survey was carried out. In the next step the set of indicators adopted by Eurostat was verified.
2. Literature Review
The concept of sustainable development was first used in the 1980s. Its authors are considered to be Pearce D.W., Barbier E.W., Markandya A. [5]. It meant at the time the activity undertaken in order to meet the needs of the society [6]. The United Nations then disseminated the idea after the Rio De Janeiro Conference in 1992. The result of this summit was the creation of the principles presented in the Action Program—Agenda 21 [7]. Since then, the term has changed constantly [8,9,10]. In the face of the enormous challenges that the world is facing in the 21st century, solutions should be sought that would make it possible to ensure a dignified and safe life for everyone now and in the future [11]. The global problems that must be dealt with are the humanitarian crisis and environmental degradation. Today, the concept of sustainable development is understood as 17 goals that enable actions to be taken to benefit humanity, its well-being, and the protection of the natural environment. These goals are described in the 2030 Agenda for Sustainable Development from 2015 [12].
- No poverty
- No hunger
- Good health and well-being
- Quality education
- Gender equality
- Clean water and sanitation
- Affordable and clean energy
- Decent work and economic growth
- Industry, innovation, and infrastructure
- Reduced inequality
- Sustainable cities and communities
- Responsible consumption and production
- Climate action
- Life below water
- Life on land
- Peace, justice, and strong institutions
- Partnership for the goals [13].
Their implementation will allow for the development of such an economy that will give the possibility of economic development, and at the same time, achieve the optimal level of health and life of citizens. Such an economy also guarantees no negative impact of human activities on the natural environment [14]. The implementation of the set goal is primarily intended to reduce the amount of fuel and consumed energy, increase the share of renewable energy sources in the energy mixes of countries, and reduce greenhouse gas emissions [15,16,17]. On the other hand, sustainable energy management consists of two complementary elements: energy efficiency and the use of renewable energy sources [18].
Access to energy carriers has a huge impact on the possibility of eradicating poverty. Access to energy enables economic development and is synonymous with citizens’ access to health care and education. This is evidenced, inter alia, by the correlation between the Human Development Index HDI [19] and energy consumption per capita in a given country [20,21]. The development of the world and the achievement of SDG goals will require access to energy. Therefore, one of the most important goals included in the SDG is the seventh goal: clean and available energy [22], the implementation of which has been analyzed and presented in the article.
Very serious and more and more real threats such as degradation of the natural environment, dying species of plants and animals, climate change, and increasingly dangerous weather phenomena and natural disasters have drawn attention to the concept of sustainable development, which has become very important and is being implemented all over the world [23,24,25].
The Sustainable Development Goals (SDG) have been set for the whole world, both for developed and developing countries. They are based on three pillars: economic growth, social inclusion, and environmental protection [22]. Due to the limited amount of fossil energy resources, sustainable development is becoming increasingly important. Optimal consumption of energy resources is significant due to the growing demand for energy [26,27]. The level of achievement of individual goals varies depending on the country in question. The presented research focuses on analyzing the implementation of the Sustainable Development Goals in the EU-27 European Union countries. According to the treaties of the European Union, sustainable development means synergistic activities in the field of economic development, as well as environmental protection and policy. These activities are aimed at meeting the needs of EU citizens today, but also in the future [28].
3. Materials and Methods
The research was preceded by a literature review in sustainable development, cluster analysis, and multiple regression. Subsequently spatial and statistical data were collected. Then, a database was built that was used to conduct spatial analyses in the spatial information system. Clusters were built, and the results were analyzed. Subsequently, multiple regression was used to verify the set of data accepted for analysis. The methodology used in the research is presented in the diagram below (Figure 1).
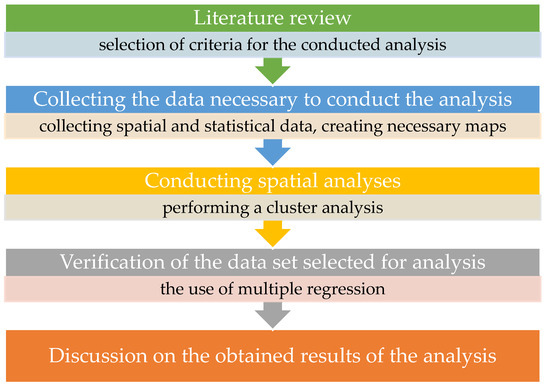
Figure 1.
Diagram showing the methodology used during the research.
In conclusion, the authors of the article put forward and verified during the research the following hypotheses:
Hypothesis 1 (H1).
Activities related to implementing SDG7 will unify the analyzed indicators within the EU.
Hypothesis 2 (H2).
The countries of the “Old” and the “New” Union will implement sustainable development differently.
The presented research required using methods in cluster analysis, Trend Surface Analysis TSA, and multiple regression. The tools and used methods are described below.
3.1. Trend Surface Analysis
Trend Surface Analysis TSA is one of the best-known and frequently used global surface fitting procedures. It was used for the first time in 1927 by O. Loverson. In the TSA model, the independent variables are the geographical coordinates of the object, and the zij is any attribute characterizing the studied phenomenon [29,30,31,32]. The general form of the model takes the form [33]:
where:
zij—dependent variable,
xi, yi—geographic coordinates,
εij—random component.
TSA was used to characterize the examined attributes for the EU-27 countries. It made it possible to present the local diversity of the analyzed feature in the individual member states.
3.2. Cluster Analysis
Cluster analysis is one of the methods of multivariate comparative analysis. It allows for comparison between the objects in terms of selected attributes. Moreover, it enables the determination of objects groups with similar characteristics [34]. Cluster analysis can be carried out concerning both point and area features. In the presented research the algorithm used grouped area units corresponding to individual countries of the European Union. Cluster analysis allows dividing a set of objects into clusters and groups of features. This set is defined as [35]:
where:
wi—is the j-dimensional feature vector of an object that belongs to the set O.
Groups are determined using following principle: objects included in one group are homogeneous, while objects in two different groups are characterized by heterogeneity. The methods for grouping objects fall into two categories of hierarchical and non-hierarchical methods. In the presented studies, hierarchical methods were used [36,37,38,39]. In the first phase, the algorithms assume that each analyzed object is a separate cluster. In the next step, similar clusters are combined. Successive iterations are repeated until similar clusters are combined into one. The main issue of multivariate comparative analysis is the normalization of the input variables. The normalization task is to transform the values of variables expressed in different units to bring them to mutual comparability [40]. Subsequently, the Chebyshev distance was used to calculate the distance between the objects, which made it possible to compare the data subjected to normalization [41]:
where:
i, k—number of objects,
j—number of variables,
zik, zjk—normalized values of j-th features of objects i and k.
The determined distances between individual objects form the distance matrix Do [42]:
This matrix is used to compute clusters. In order to define clusters, the grouping method should be used. In this case, e.g., the nearest neighbor method, the median method, the center of gravity method, and the Ward method can be selected. The single linkage method was used in the presented research. The method enables the determination of the distance between two clusters by determining the distance between two closest neighbors—objects that have been assigned to different clusters. Using the single linkage method also identifies outliers. The algorithm of the hierarchical unweighted method allows for the automatic selection of the optimal number of clusters. However, to determine the number of clusters in the case of the weighted hierarchical method, the elbow method was used [43,44,45]. This method is expressed in terms of Sum of Squared Error:
where:
k—number of clusters,
xi—object assigned to a given cluster Sk,
Ck—cluster centroid.
The first step in the elbow method is to determine the centroids for the available objects randomly. After calculating the Euclidean distance, the objects are assigned to the nearest centroid, thus creating groups k. Next, further centroids are determined for the resulting groups. Points are reassigned to the nearest centroid. The procedure is repeated until the position of the centroids stabilizes [43].
3.3. Expert Survey
The weighted cluster analysis requires the determination of individual SDG7 indicators weights. For this purpose, an expert survey was carried out—in accordance with the principles of the Delphi method. The respondents participating in the study were experts in the discipline of environmental engineering, mining, and energy, as well as the discipline of chemical science. The examination of experts’ opinions made it possible to obtain results for an undiagnosed problem for which no empirical data was available. The survey was anonymous. Experts also had the opportunity to supplement the presented set of indicators with those which, according to them, should be included in the survey. Experts were asked to weight each indicator on a 0–100% scale. The sum of the weights for all indicators assessed by one expert should be 100%. The weight of the indicators was determined according to the formula [46]:
where:
—weight of the i-th parameter,
—the importance of the i-th parameter.
3.4. Verification of the SDG7 Indicators Set
After the survey is completed, the compliance of the results obtained from individual experts should be verified. For this purpose, the variation coefficient was determined, which made it possible to indicate the level of the obtained opinions unanimity [47]:
where:
s—standard deviation,
—mean value.
In the next step, it was necessary to determine which indicators are statistically significant variables explaining the analyzed phenomenon. Therefore, the multiple regression presented in the next section was used.
3.5. Trend Multiple Regression
TSA models can also constitute multiple regression when several explanatory variables are introduced into the model. Multiple regression was performed for the analyzed spatial and statistical data. The explained and explanatory variables constituted a set of indicators for the achievement of SDG7. The following equation can describe the multiple regression model [48,49,50]:
where:
z—dependent variable,
αi—model parameters,
xi—explanatory variables,
—random component.
Multiple regression allows to detect the relationship between explanatory variables(xi) and explained variables (z). Therefore, it enables investigating which explanatory variables best describe the dependent variable. It also allows determining the trend and the rest of the model. A trend is a long-term development tendency, and it is a consequence of a constant set of factors influencing the variable z. The rest of the model, on the other hand, is white noise, random fluctuations that cannot be explained and controlled. The result of the analysis is a three-dimensional, smoothed surface approximation.
When deciding whether a variable is statistically significant, the value of Student’s t-test and the p-level (probability) should be considered:
- If p ≤ α, the null hypothesis that the variable is insignificant should be rejected and an alternative hypothesis of significance of the variable adopted.
- If p > α, there is no reason to reject the null hypothesis of irrelevance.
The backward selection method was used. It consisted in introducing all explanatory variables into the model and then removing statistically insignificant variables from the model [43].
3.6. Analysis of SDG7 Achievement Indicators
The research was divided into two stages. In the first stage, the indicators of SDG7 were analyzed in terms of their changes in the years 2000–2019. The level of homogeneity of these indicators in the individual member states was also examined. The most important conclusions are described below.
The indicators of the achievement of SDG7 are presented in the Table 1 and Figure 2. Figure a presents the values of indicators in 2000, while b is the year 2019.

Table 1.
Goal 7 achievement indicators.
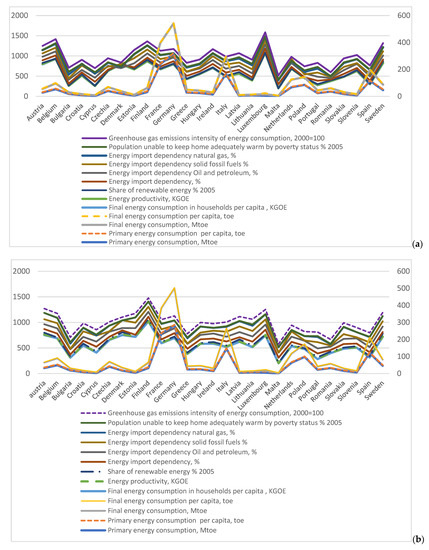
Figure 2.
Value of target 7 achievement indicators in 2000 (a) and 2019 (b).
The energy market of the European Union member states is significantly diversified. This can be seen when analyzing the indicators of achieving SDG7.
To enable a visual analysis of this differentiation, TSA models were used. TSA models allowed the analysis of the homogeneity and variability of the explanatory variables. Additionally, the coefficient of variation of the indicators used during the analysis was determined. It has been noticed that the level of primary energy consumption is the most diverse in the individual member states (Figure 3). On the other hand, greenhouse gas emissions are the most similar in the EU-27 (Figure 4).
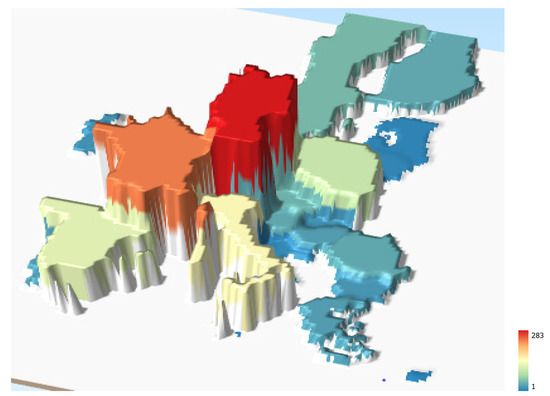
Figure 3.
Primary energy consumption in the EU-27 in 2019.
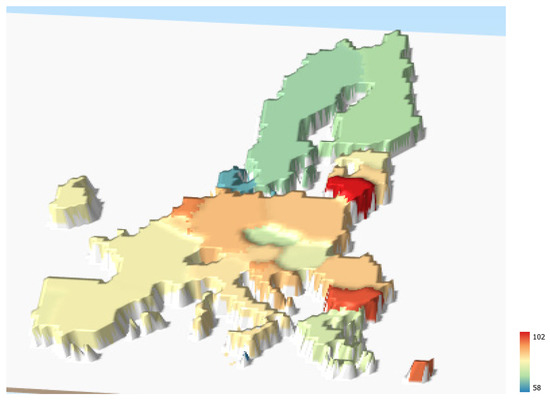
Figure 4.
Greenhouse gas emissions in the EU-27 in 2019.
The average consumption of primary and final energy in the EU countries slightly decreased in 2000–2019. The activities of the European Union are focused on the use of energy-saving technologies and thermal modernization of buildings. However, this feature’s differentiation level in the EU-27 is the highest and amounts to 138%.
Greenhouse gas emissions in the EU in the years 2000–2019 decreased by less than 20%. It was possible mainly due to the reduction of the share of coal in the energy mixes of the member states and the increase in the share of renewable energy sources and natural gas. The coefficient of variation in greenhouse gas emissions for the EU-27 was 12% in 2019 and was the lowest among the analyzed indicators (Figure 3).
The energy mixes of individual countries have different compositions. Therefore, the level of energy import dependency is also very heterogeneous. Energy import dependency means that the EU cannot self-satisfy its energy needs. The lowest level of dependency on imports occurs in the case of coal. In 2019, it amounted to an average of 75% for the EU-27. On the other hand, the most significant import dependency occurs in crude oil, where the mean value is 95%. This level is very stable and has been maintained since 2000 [51,52]. The European Union obtains fossil fuels mainly from Russia, and the low level of diversification of import sources poses a threat to the EU’s energy security.
The analysis of the energy productivity index showed that in the analyzed period, the average productivity level increased by 45%. The level of productivity diversification in individual countries, determined using the variation coefficient, was 50% in 2019. It is one of the most important indicators included in the analyzed set. The increase in productivity will reduce the consumption of primary and final energy and reduce greenhouse gas emissions.
In the case of the renewable energy share in the energy mixes of the EU-27 countries, an average 75% increase can be noticed in 2000–2019. In most EU countries, the emphasis has been on the development of renewable energy sources (RES) for many years [53]. On the other hand, in some countries, such as the countries of the Visegrad Group, this development was intensified after they acceded to the EU. RES will continue to be developed in connection with the growing energy demand and the need to implement Sustainable Development Goals in environmental protection. The coefficient of variation for the share of renewable energy is 52%.
The economic situation of households significantly influences the adequate heating of households. The analysis of the population unable to keep home adequately warm by poverty status indicator shows that the percentage of households affected by this problem in Europe is declining. However, there are countries where it is still high. In the analyzed period, the value of the indicator decreased on average by about 40%. The coefficient of variation, in this case, is 94% for 2019.
The situation in countries where coal occupies an essential position in energy mixes may deteriorate in terms of problems with sufficient heating of households due to phasing out this fuel. The energy obtained by burning coal is one of the cheapest. This applies to both heat and electricity. Therefore, the authors believe that new technological solutions should be sought that will allow the further use of coal in the mix and enable efficient and clean coal combustion. These methods include membrane techniques. They are an excellent solution due to their economy, efficiency, versatility, and ease of use [54,55,56,57,58,59].
The discovered regularities allowed for the correct interpretation of the results of spatial analyses carried out in the second stage.
4. Results and Discussion
4.1. Cluster Analysis
The conducted research aimed to examine the progress of the EU-27 countries on the way to transforming their economies and energy systems following the concept and goals of sustainable development. They concerned the availability of energy as well as the achievement of goals related to climate protection. It was assumed that actions taken in connection with the implementation of SDG7 should unify and integrate the EU-27 countries and that differences between the “Old” and the “New” Union countries may arise. A spatial information system was used to verify the hypotheses and perform the necessary analyses. Quantum GIS 3.20.1 Odense was used [60]. In the first step, it was necessary to obtain both spatial and statistical data that would enable the planned research to be carried out. Statistical data were obtained from the Eurostat database [2], while vector maps of individual EU-27 member states were obtained from the Free vector world & country maps website [61]. Individual maps of countries were combined, creating a vector map of the entire European Union. Then, statistical data on eight indicators of the achievement of SDG7 were added to the database related to map (Figure 5).
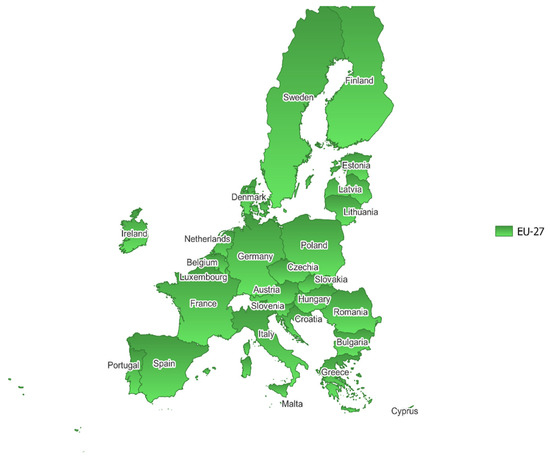
Figure 5.
Vector map of the European Union.
Cluster analysis was performed using the hierarchical method in two variants:
- Not weighted—where each of the considered attributes has a weight of 1. In this case, the algorithm enables the automatic determination of the number of clusters.
- Weighted—in this case, the attributes considered during the analysis are given weights from 0–1. For this purpose, an expert survey was carried out. Ten experts participated in the study, and their competencies made it possible to answer the question: which of the indicators are considered the most important and which are least important. The respondents were asked to rate a set of all 13 indicators. The results of the study are presented in the Table 2.
Table 2. Expert survey results.
Experts considered the energy import dependency as the most important of the indicators taken into account. It was given a weight of 14%. Energy productivity, import dependency, and greenhouse gas emissions were also considered the most critical factors that will affect SDG7. For the least important indicators, experts considered dependence on oil and natural gas imports and population unable to keep home adequately warm by poverty status.
Expert assessments have shown that the most important factor in the survey is the import of energy resources. This is because only some European countries have sufficient energy resources or sufficiently developed RES to become independent from energy sources outside the EU. This, in turn, poses a severe threat to the energy security of EU countries. Additionally, it was indicated that the import of coal was the most important in import dependency indicators. This is related to the nationality of the experts participating in the study. Since the power industry in Poland is mainly based on coal, the inability to obtain its own fuel and the need to rely only on raw material from Russia would pose a severe threat to energy security. It is not only characteristic for Poland but also other countries such as the Czech Republic, Greece, or Germany, where coal is an essential component of the energy mix [62]. For the same reasons, dependence on natural gas and oil was considered the least important. Additionally, this result was influenced by the growing share of renewable energy sources in the mixes of the EU-27 countries. It is assumed that they are to form the basis of the energy mixes of EU countries in the future. The share of the population unable to adequately heat their homes was also considered insignificant. In this case, in most EU countries, such a phenomenon occurs in the amount lower than 10%. The highest level of the indicator in EU is specific for Bulgaria and amounts (in 2019) to 30%. Due to the above, the indicator was considered insignificant.
In order to conduct the cluster analysis, the attribute-based clustering tool was used. This made it possible to consider the distance between individual objects and additional features of each country during the construction of clusters. A set of 13 indicators constituted these attributes. The not weighted cluster analysis was carried out for both 2000 and 2019. The analysis results are presented in the Figure 6 and Figure 7. For both years, the same assumptions were made as to the grouping method and the method of determining the distance between objects. As a result of the analysis, considering selected attributes (presented in the Table 2), 13 clusters were created for 2000 and 15 clusters for 2019. In 2000, the most numerous cluster was cluster no. 3: France, Spain, Italy, Poland, the Czech Republic, Hungary, and Greece. In 2019, Poland, the Czech Republic, and Hungary were classified into separate group. There was also a differentiation in the case of Lithuania, Latvia, and Estonia.
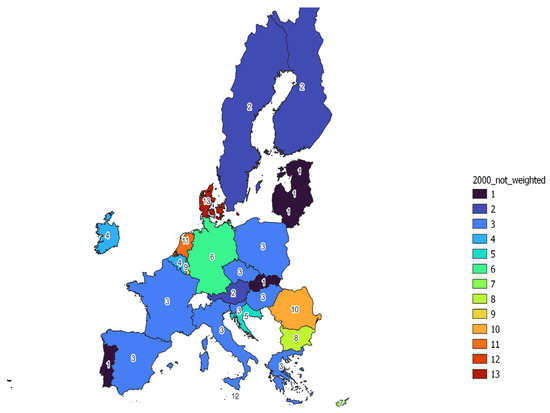
Figure 6.
Unweighted EU-27 cluster analysis for the year 2000.
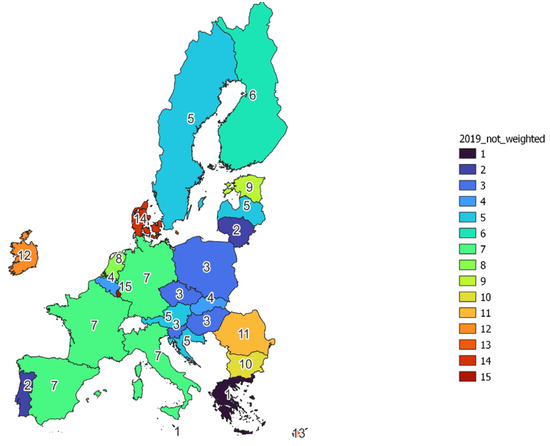
Figure 7.
Unweighted EU-27 cluster analysis for the year 2019.
The analysis showed that despite the EU countries’ efforts to implement SDG7, a serious discrepancy in their actions appeared. This is evidenced by the growing number of designated clusters from 13 to 15 in 2019.
Clusters formed by countries that were part of the EU before 2000, and those that systematically joined the EU since 2004, are visible. Due to the vast diversity of specific indicators, some countries have been classified as separate objects. An example, in this case, is Denmark (cluster no. 14) due to its low level of dependence on oil imports, the highest level of dependence on coal imports, and a level of dependence on natural gas imports lower than 0. Luxembourg is also classified as a separate cluster (no. 15) due to its almost 100% level of dependence on imported energy resources. The cluster no. 3, which includes Poland, the Czech Republic, Hungary, and Slovenia, is distinguished from other countries mainly by a significant increase in dependence on the import of raw materials, a dynamic increase in energy productivity, and a substantial decrease in population unable to keep home adequately warm by poverty status indicator. In the countries of the Visegrad Group, energy productivity grew faster and energy intensity slower than changes in these parameters for the entire EU, mainly as a result of the economic transformation. The countries of the “Old” Union were separated from cluster no. 7 in 2019 because they systematically implemented the policy consistent with SDG7 long before the countries of the “New” Union. Therefore, the dynamics of changes in their case are slower. Moreover, cluster no. 2 from 2000 (Sweden and Finland) was split in 2019. This was mainly due to a 36% increase in population unable to keep home adequately warm by poverty status in Sweden. In the case of cluster no. 1 (2000), Lithuania, Latvia, and Estonia, in 2019, were not classified as one cluster mainly due to the seven-fold decrease in Estonia’s dependence on imports, its dynamic development in the field of renewable energy sources, and a reduction in the level of the population unable to keep home adequately warm by poverty status.
In the next step, a hierarchical cluster analysis was performed, considering the weights of individual attributes. In this case the elbow method was used. For the data from 2000, 7 clusters were created, and for the year 2019, 11 clusters.
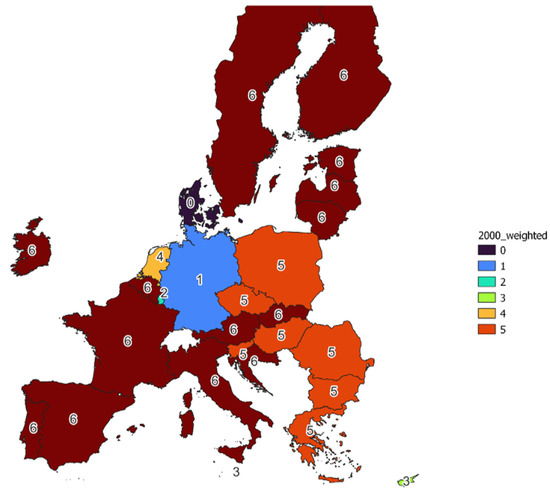
Figure 8.
Weighted cluster analysis for the year 2000.
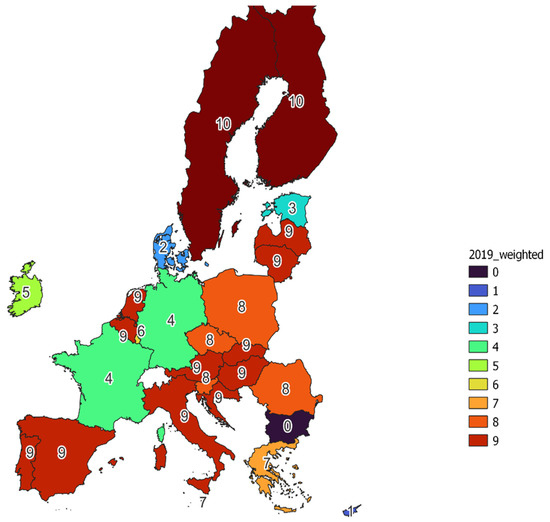
Figure 9.
Weighted cluster analysis for the year 2019.
Considering the importance of the attributes used in the analysis, an increase in the number of clusters was again observed. The number of clusters increased from 7 to 11. There are also clusters composed of only one object, such as Denmark or Luxembourg. In 2000, clusters of countries that were part of the Union before 2000 and after 2004 were again visible. However, after 15 years, i.e., in 2019, this division disappeared, and the following clusters have been designated:
Cluster no. 0—Bulgaria
Cluster no. 1—Cyprus
Cluster no. 2—Denmark
Cluster no. 3—Estonia
Cluster no. 4—Germany, France
Cluster no. 5—Ireland
Cluster no. 6—Luxembourg
Cluster no. 7—Malta, Greece
Cluster no. 8—Poland, Czech Republic, Slovenia, Romania
Cluster no. 9—Lithuania, Latvia, Portugal, Spain, Italy, Belgium, the Netherlands, Croatia, Hungary, Austria, Slovakia
Cluster no. 10—Sweden, Finland
Bulgaria has been classified as a separate cluster due to the lowest level of energy productivity and the highest level of the population unable to keep home adequately warm by poverty status. Moreover, Cyprus and Estonia are separate clusters due to one of the highest levels of dependence on imported energy resources, a factor that has received the highest weight. Ireland, on the other hand, has the highest level of energy productivity. Cluster no. 8 constitutes the majority of the Visegrad group countries in which the factors of the highest importance are at a similar level, i.e., energy productivity, import dependence and greenhouse gas emissions. Cluster no. 9 is characterized by a similar level of dependence on the import of energy resources (approx. 70%). On the other hand, for cluster no. 10, the emission of greenhouse gases at the level of 70% is characteristic and the highest share of renewable energy sources.
4.2. Verification of the SDG7 Indicators Set
During the expert’s survey, it was noticed that experts disagreed on the assessment of individual indicators. Additionally, experts found the set of indicators to be incomplete. They also stated that the indicators should be differentiated for energy availability and its impact on the natural environment. Taking into account the opinion of experts, the strengths and weaknesses of the SDG7 indicator set have been identified. They are presented in the Table 3.
Table 3.
Strengths and weaknesses of the SDG7 indicators set.
First of all, the experts pointed out that the set of indicators should be supplemented with indicators that will inform about the availability of energy in economic terms. It is also difficult to deduce from the current set of indicators whether sufficient energy is available in a given country. The set covers the level of consumption extensively but does not take supply into account. It was also noticed that a very important factor in the aspect of clean energy is the analysis of the number of technologies developed and implemented in the EU member states. Such technologies include, inter alia, technologies related to the production and acquisition of clean energy, as well as clean coal technologies (CCT). CCT should be used along the entire coal and energy distribution chain. They can be used at the stage of coal extraction and mechanical processing, hard coal combustion and waste management.
One of the methods of producing clean coal is its enrichment, that is, separating the coal from waste rock and excesses. These are the most cost-effective ways to eliminate pollution to date. Greenhouse gases generated during the combustion of coal pose a serious threat to the natural environment. At this stage, CCTs focus on the removal of carbon dioxide. This can take place before or after the combustion of coal, as well as during combustion. CCT technologies used at the coal processing stage are developing the most dynamically, and they can be used primarily in the process of:
- Combustion—oxy-combustion, power plants with fluidized bed boilers, supercritical power plants with steam boilers [63],
- Coal gasification—this category includes ground and underground gasification [64,65],
- Flue gas cleaning—for example carbon dioxide sequestration, desulphurization, dedusting [66,67].
The coefficient of variation was determined for the results of the expert’s survey (Table 2). For all indicators, the coefficient of variation exceeds 10%, which determines the threshold beyond which the respondents’ opinions should be considered inconsistent. For 85% of the indicators, it exceeds 30%. This means that the experts disagreed, and their assessments were not alike. Therefore, the authors of the article decided to verify the adopted set of indicators. For this purpose, multiple regression was used.
SDG7 combines the two most essential postulates concerning the energy sector of the European Union. This is, firstly, access to energy in an amount appropriate to the recipients. Secondly, this energy must be clean, i.e., energy production must not have a negative impact on the natural environment. Because the set of indicators proposed by Eurostat has not been differentiated in this respect, the authors decided to define which indicators affect availability and which affect the ecological dimension related to energy production. For this purpose, multiple regression was carried out. The SAGA multiple regression analysis—raster and predictor raster’s algorithm was used to make the application of multiple regression possible with simultaneous consideration of the spatial dimension [68]. Both the dependent variable and the explanatory variables were introduced to the model in the form of raster maps. As a result of the algorithm, a new raster layer was created, which presents the values based on the regression. As the constructed maps were created in the form of vector maps, they were converted first. It made it possible to transform vector layers into raster layers. For this purpose, the rasterize-vector to raster algorithm was used. When executing individual maps for explanatory variables, the option burn-in value was selected. This made it possible to create raster maps, where individual pixels were assigned the values of selected attributes. In this way, 13 raster layers were created as input data to the multiple regression analysis algorithm. The authors considered the set of indicators in terms of energy availability first. In this case, primary energy consumption per capita was used as the explained variable (Model 2). In terms of clean energy, the emission of greenhouse gases was assumed as the dependent variable (Model 1). All the remaining 12 indicators were entered into the model each time. Thanks to this, it was possible to determine which of the explanatory variables are statistically significant in terms of purity and energy availability.
Table 4 presents the results of multiple regression. The variables that turned out to be significant for explaining the explained variable are marked with asterisks. In the case of energy availability, it was six indicators, and in the case of clean energy 4 out of 12 proposed indicators.
Table 4.
Multiple regression analysis results.
The constructed regression models are characterized by high accuracy and reliability. The MAPE (mean absolute percentage error) is less than 10% [69]. From among the created models, those with the smallest information criterion were selected. The Akaike, Hannan-Quinn and Schwarz information criteria were used [70]. Model errors are presented in the Table 5.
Table 5.
Multiple regression models 1 and 2 error.
Multiple regression models were used to create raster maps of the explained variables presented in the Figure 10 and Figure 11. They present the value of the dependent variable predicted based on the values of the explanatory variables that were used to carry out the analysis. Multiple regression also makes it possible to build forecasts of dependent variables in a selected time horizon (period for which the forecast is determined). After introducing only statistically significant variables into the model, the obtained values of explanatory variables were calculated on the basis of multiple regression parameters. It was noticed that the results of the forecast correspond to the empirical values. In the case of greenhouse gas emission, the highest emission level was recorded in Lithuania, and the lowest in Finland. In the case of primary energy consumption per capita, the highest energy consumption was recorded in Finland, and the lowest in Lithuania. The results of the empirical and forecast values are presented in Table 6. The low values of the model errors and the clear compliance of the forecasted values with the empirical values indicate the need to verify the validity of the constructed set of indicators.
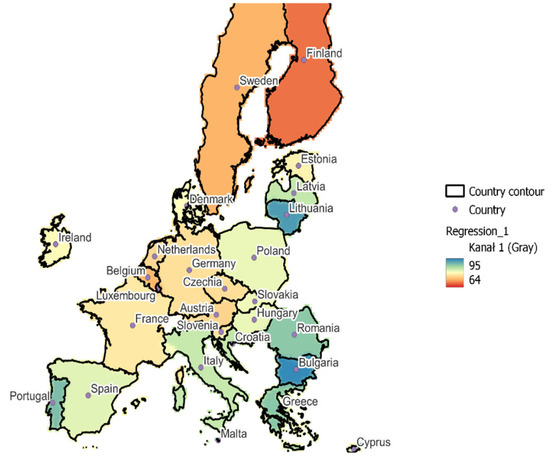
Figure 10.
Results of multiple regression of greenhouse gas emissions for the EU-27 (2019).
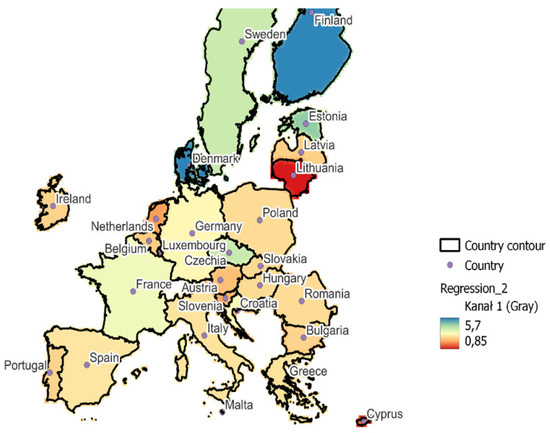
Figure 11.
Results of multiple regression of primary energy consumption per capita for the EU-27 (2019).
Table 6.
Empirical and forecast values of selected indicators.
5. Conclusions
In the presented research, cluster analysis was used to examine the progress of the EU-27 countries towards achieving SDG7. The conducted research showed that the member states differ significantly in terms of the applied attributes. Moreover, in the period 2000–2019, this differentiation increased. The process of energy transformation of the EU-27 countries is so complicated and heterogeneous that it has created new independent and unique clusters. This situation was mainly influenced by the composition of the member states’ energy mix, energy productivity, dependence on imports, and a population unable to keep home adequately warm by poverty status indicator. The main differences were observed in the case of the “Old” and “New” EU countries. Therefore, actions should be taken that would make it possible to standardize the changes taking place in individual EU countries.
The discovered growing diversity may pose a threat to the timely achievement of the SDG7 goal. The main factor that delays the implementation of this goal is the growing tendency of dependence on imported energy carriers. Therefore, it is imperative to look for alternative energy sources that could take on the role of fossil fuels. It is also necessary to take further actions to increase the level of diversification of obtaining energy carriers and increase the share of renewable energy sources in the energy mix. The share of renewable energy sources is already systematically increasing, which positively impacts the pace of implementation of the set goal of sustainable development. Moreover, the increase in energy productivity affects the implementation of SDG7, reducing the energy sector’s negative impact on the natural environment while reducing the demand for energy resources.
The level of SDG7 achievement set out in the Sustainable Development Report 2021 is consistent with the market integration demonstrated with the use of cluster analysis conducted by the authors. Sweden and Finland stand out positively compared to the EU-27, where this goal has already been recognized as achieved. Most of the “Old” EU countries were classified as a group “challenges remain”. This is the case, for example of Germany, France, Italy, and Spain. The countries of the Visegrad Group have been classified as “significant challenges remain”. On the other hand, the country that formed a separate cluster is Luxembourg as the only EU country classified as “major challenges remain”.
The cluster analysis showed that in 2000–2019, the European union member states and their activities did not lead to the unification of clusters in the EU. On the contrary, the pace and direction of changes in individual countries have led to the creation of additional clusters. Therefore, the authors decided to verify the set of indicators and the validity of their selection. The conducted multiple regression analysis showed that the set of indicators proposed as a measure of the achievement of SDG7 should be verified. It has been proven that this set should be separated and supplemented with separate indicators for the aspect of available and clean energy. The conducted experts survey showed that some indicators might be irrelevant when assessing the achievement of SDG7. The authors believe that the set of indicators should be enriched with new components. In the case of energy availability, these should undoubtedly be energy prices, which will determine whether consumers can purchase raw materials and electricity available in a given country. In terms of clean energy, an indicator that should complement the set of indicators should be the number of implemented technologies that enable clean energy production. This is in line with the goals to be achieved in the European Union in 2030. First of all, it concerns establishing and expanding the existing international cooperation to conduct research on clean technologies, including clean coal technologies, ensuring access to modern energy services and infrastructure and universal access to affordable, reliable, and modern energy services. In conclusion the research confirmed hypothesis 2, while hypothesis 1 on the unification of energy markets in the EU-27 countries was rejected.
Author Contributions
Conceptualization, A.R. (Aleksandra Rybak), A.R. (Aurelia Rybak) and S.D.K.; methodology, A.R. (Aleksandra Rybak) and A.R. (Aurelia Rybak); software, A.R. (Aleksandra Rybak) and A.R. (Aurelia Rybak); writing—original draft preparation, A.R. (Aleksandra Rybak), A.R. (Aurelia Rybak) and S.D.K. All authors have read and agreed to the published version of the manuscript.
Funding
The work was elaborated in the frames of the statutory research 06/010/BK_21/0046.
Institutional Review Board Statement
Not applicable.
Informed Consent Statement
Not applicable.
Data Availability Statement
The data presented in this study are available on request from the corresponding author. The data are not publicly available due to the extremely large size.
Conflicts of Interest
The authors declare no conflict of interest.
References
- Ki-moon, B. Sustainable Energy for All: A Vision Statement by Ban Ki-Moon Secretary-General of the United Nations; United Nations: New York, NY, USA, 2011. [Google Scholar]
- Eurostat Database. Available online: https://ec.europa.eu/eurostat/web/main/data/database (accessed on 1 September 2021).
- Johnston, R.B. Arsenic and the 2030 Agenda for sustainable development. In Arsenic Research and Global Sustainability—Proceedings of the 6th International Congres on Arsenic in Environment AS, Stockholm, Sweden, 19–23 June 2016; pp. 12–14. [Google Scholar]
- Communication from the Commission to the European Parliament, the Council, the European Economic and Social Committee and the Committee of the Regions Next Steps for a Sustainable European Future: European Union Action for Sustainability; SWD/2016/0390 final; European Commission: Strasbourg, France, 2016.
- Pearce, D.W.; Barbier, E.W.; Markandya, A. Sustainable Development; Earthscan: London, UK, 1990. [Google Scholar]
- World Commission on Environment and Development. Report of the World Commission on Environment and Development; World Commission on Environment and Development: New York, NY, USA, 1987. [Google Scholar]
- Sustainable Development Goals. Available online: https://sustainabledevelopment.un.org/content/documents/Agenda21.pdf (accessed on 10 May 2021).
- Rosen, M.A. Energy sustainability: A pragmatic approach and illustrations. Sustainability 2009, 1, 55–80. [Google Scholar] [CrossRef]
- UNDP. World Energy Assessment: Energy and the Challenge of Sustainability, United Nations Development Programme; United Nations: New York, NY, USA, 2000. [Google Scholar]
- Turkson, C.; Acquaye, A.; Liu, W.; Papadopoulos, T. Sustainability assessment of energy production: A critical review of methods, measures, and issues. J. Environ. Manag. 2020, 264, 110464. [Google Scholar] [CrossRef] [PubMed]
- Hillerbrand, R. Why Affordable Clean Energy Is Not Enough. A Capability Perspective on the Sustainable Development Goals. Sustainability 2018, 10, 2485. [Google Scholar] [CrossRef]
- United Nations. Available online: https://sdgs.un.org/goals (accessed on 10 June 2021).
- Sustainable Development in the European Union—Monitoring Report on Progress towards the SDGs in an EU Context—2020 Edition. Available online: https://ec.europa.eu/eurostat/web/products-statistical-books/-/ks-02-20-202 (accessed on 17 October 2021).
- United Nations. A/RES/70/1, United Nations General Assembly; United Nations: New York, NY, USA, 2015. [Google Scholar]
- Wang, Z.; Zhu, Y.; Zhu, Y.; Shi, Y. Energy structure change and carbon emission trends in China. Energy 2016, 115, 369–377. [Google Scholar] [CrossRef]
- McCollum, D.L.; Krey, V.; Riahi, K. An integrated approach to energy sustainability. Nat. Clim. Chang. 2011, 1, 428–429. [Google Scholar] [CrossRef]
- von Hippel, D.; Suzuki, T.; Williams, J.H.; Savage, T.; Hayes, P. Energy security and sustainability in Northeast Asia. Energy Policy 2011, 39, 6719–6730. [Google Scholar] [CrossRef]
- Şalvarlı, M.; Salvarli, H. For Sustainable Development: Future Trends in Renewable Energy and Enabling Technologies. In Renewable Energy—Resources, Challenges and Applications; IntechOpen: London, UK, 2020. [Google Scholar]
- Human Development Report. Available online: hdr.undp.org/en/content/human-development-index-hdi (accessed on 17 October 2021).
- Osborne, D. The Coal Handbook: Towards Cleaner Production; 2 Coal Utilization; Woodhead Publishing: Cambridge, MA, USA, 2013. [Google Scholar]
- Marcondes dos Santos, H.T.; Perrella Balestieri, J.A. Spatial analysis of sustainable development goals: A correlation between socioeconomic variables and electricity use. Renew. Sustain. Energy Rev. 2018, 97, 367–376. [Google Scholar] [CrossRef]
- Nerini, F.F.; Tomei, J.; To, L.S.; Bisaga, I.; Parikh, P.; Black, M.; Borrion, A.; Spataru, C.; Broto, V.C.; Anandarajah, G.; et al. Mapping synergies and trade-offs between energy and the sustainable development goals. Nat. Energy 2018, 3, 10–15. [Google Scholar] [CrossRef]
- Bebbington, J.; Unerman, J. Achieving the United Nations Sustainable Development Goals: An enabling role for accounting research. Account. Audit. Account. J. 2018, 31, 2–24. [Google Scholar] [CrossRef]
- Osborn, D.; Cutter, A.; Ullah, F. Universal Sustainable Development Goals. In Understanding the Transformational Challenge for Developed Countries; Report of a Study by Stakeholder Forum; Stakeholder Forum: Herne Bay, UK, 2015. [Google Scholar]
- Indicators for Sustainable Development: Guidelines and Methodologies. Available online: https://www.un.org/esa/sustdev/natlinfo/indicators/guidelines.pdf (accessed on 17 October 2021).
- Skytt, T.; Nielsen, S.N.; Froling, M. Energy flows and efficiencies as indicators of regional sustainability—A case study of Jamtland, Sweden. Ecol. Indic. 2019, 100, 74–98. [Google Scholar] [CrossRef]
- Kavouridis, K.; Koukouzas, N. Coal and sustainable energy supply challenges and barriers. Energy Policy 2008, 36, 693–703. [Google Scholar] [CrossRef]
- International Atomic Energy Agency; United Nations Department of Economic and Social Affairs; International Energy Agency; Eurostat, European Environment Agency. Energy Indicators for Sustainable Development: Guidelines and Methodologies; International Atomic Energy Agency: Vienna, Austria, 2005. [Google Scholar]
- Li, J.; Heap, A.D. Spatial interpolation methods applied in the environmental sciences: A review. Environ. Model. Softw. 2014, 53, 173–189. [Google Scholar] [CrossRef]
- Sen, Z. Spatial Modeling Principles in Earth Sciences; Springer: Berlin/Heidelberg, Germany, 2009. [Google Scholar]
- Hota, R.N. Trend surface analysis of spatial data. Gondwana Geol. Mag. 2014, 29, 39–44. [Google Scholar]
- Dessaint, F.; Caussenal, J.P. Trend surface analysis: A simple tool for modelling spatial patterns of weeds. Crop. Prot. 1994, 13, 433–438. [Google Scholar] [CrossRef]
- Watson, G.S. Trend-surface analysis. J. Int. Assoc. Math. Geol. 1971, 3, 215–226. [Google Scholar] [CrossRef]
- Bolin, J.H.; Edwards, J.M.; Finch, W.H.; Cassady, J.C. Applications of cluster analysis to the creation of perfectionism profiles: A comparison of two clustering approaches. Front. Psychol. 2014, 5, 343. [Google Scholar] [CrossRef]
- Suchecka, J. Statystyka przestrzenna. In Metody Analizy Struktur Przestrzennych; C.H. Beck: Warszawa, Poland, 2014. [Google Scholar]
- Nielsen, F. Hierarchical Clustering. In Introduction to HPC with MPI for Data Science; Springer: Cham, Switzerland, 2016. [Google Scholar] [CrossRef]
- Köhn, H.F.; Hubert, L.J. Hierarchical Cluster Analysis; Statistics Reference Online; Wiley StatsRef: Hoboken, NJ, USA, 2015. [Google Scholar]
- Arbolino, R.; Carlucci, F.; Cirà, A.; Ioppolo, G.; Yigitcanlar, T. Efficiency of the EU regulation on greenhouse gas emissions in Italy: The hierarchical cluster analysis approach. Ecol. Indic. 2017, 1, 115–123. [Google Scholar] [CrossRef]
- Bluszcz, A.; Manowska, A. The Use of Hierarchical Agglomeration Methods in Assessing the Polish Energy Market. Energies 2021, 14, 3958. [Google Scholar] [CrossRef]
- Kotu, V.; Deshpande, B. Classification. Data Science, 2nd ed.; Morgan Kaufmann: Cambridge, MA, USA, 2019; pp. 65–163. [Google Scholar]
- Xueyan, L.; Nan, L.; Sheng, L.; Jun, W.; Ning, Z.; Xubin, Z.; Kwong-Sak, L.; Lixin, C. Normalization Methods for the Analysis of Unbalanced Transcriptome Data: A Review. Front. Bioeng. Biotechnol. 2019, 7, 358. [Google Scholar]
- Suchecki, B. Ekonometria przestrzenna. In Metody i Modele Analizy Danych Przestrzennych; C.H. Beck: Warszawa, Poland, 2010. [Google Scholar]
- Syakur, M.A.; Khotimah, B.K.; Rochman, E.M.S.; Satoto, B.D. Integration K-means clustering method and elbow method for identification of the best customer profile cluster. IOP Conf. Ser. Mater. Sci. Eng. 2018, 336, 012017. [Google Scholar] [CrossRef]
- Thorndike, R.L. Who belongs in the family? Psychometrika 1953, 18, 267–276. [Google Scholar] [CrossRef]
- Nainggolan, R.; Perangin-angin, R.; Simarmata, E.; Tarigan, A. Improved the performance of the K-means cluster using the sum of squared error (SSE) optimized by using the Elbow method. J. Phys Conf. Ser. 1361, 2019, 012015. [Google Scholar] [CrossRef]
- Zimon, D.; Kruk, U. The use of the CSI method to examine the logistic customer service on the example of a selected organization. Logistics 2015, 3, 5094–5101. [Google Scholar]
- Everitt, B.S.; Skrondal, A. The Cambridge Dictionary of Statistics; Cambridge University Press: Cambridge, UK; New York, NY, USA, 1998; ISBN 978-0521593465. [Google Scholar]
- Moore, A.W.; Anderson, B.; Das, K.; Wong, W.K. Chapter 15—Combining Multiple Signals for Biosurveillance, Handbook of Biosurveillance; Academic Press: Cambridge, MA, USA, 2006; pp. 235–242. [Google Scholar]
- Nugus, S. Chapter 5—Regression Analysis, CIMA Professional Handbook, Financial Planning Using Excel, 2nd ed.; CIMA Publishing: Burlington, MA, USA, 2009; pp. 59–74. [Google Scholar]
- Águila, M.M.; Benítez-Parejo, N. Simple linear and multivariate regression models. Allergol. Immunopathol. 2011, 39, 159–173. [Google Scholar] [CrossRef]
- Rybak, A.; Manowska, A. Przyszłość gazu ziemnego jako substytutu węgla w aspekcie bezpieczeństwa energetycznego Polski. Wiadomości Górnicze 2017, 68, 144–152. [Google Scholar]
- Rybak, A.; Manowska, A. The future of crude oil and hard coal in the aspect of Polands energy security. Polityka Energetyczna 2018, 21, 141–154. [Google Scholar] [CrossRef]
- The Promotion of Electricity Produced from Renewable Energy Sources in the Internal Market, Directive 2001/77/EC of the European Parliament and the Council; European Parliament and the Council: Brussels, Belgium, 2001.
- Rybak, A.; Rybak, A.; Sysel, P. Modeling of Gas Permeation through Mixed-Matrix Membranes Using Novel Computer Application MOT. Appl. Sci. 2018, 8, 1166. [Google Scholar] [CrossRef]
- Kusworo, T.D.; Budiyono, A.F.; Ismail, A.; Mustafa, A. Fabrication and Characterization of Polyimide-CNTs hybrid membrane to enhance high performance CO2 separation. Int. J. Sci. Eng. 2015, 8, 115–119. [Google Scholar]
- Hasebe, S.; Aoyama, S.; Tanaka, M.; Kawakami, H. CO2 separation of polymer membranes containing silica nanoparticles with gas permeable nano-space. J. Membr. Sci. 2017, 536, 148–155. [Google Scholar] [CrossRef]
- Sarfraz, M.; Ba-Shammakh, M. A novel zeolitic imidazolate framework based mixed-matrix membrane for efficient CO2 Separation under wet conditions. J. Taiwan Inst. Chem. Eng. 2016, 65, 427–436. [Google Scholar] [CrossRef]
- Sridhar, S.; Smith, B.; Ramakrishna, M.; Aminabhavi, T.M. Modified poly (phenylene oxide) membranes for the separation of carbon dioxide from methane. J. Membr. Sci. 2006, 280, 202–209. [Google Scholar] [CrossRef]
- Xiang, L.; Pan, Y.; Jiang, J.; Chen, Y.; Chen, J.; Zhang, L.; Wang, C. Thin poly(ether-block-amide)/attapulgite composite membranes with improved CO2 permeance and selectivity for CO2/N2 and CO2/CH4. Chem. Eng. Sci. 2017, 160, 236–244. [Google Scholar] [CrossRef]
- QGIS. Available online: https://qgis.org/pl/site/index.html (accessed on 10 May 2021).
- Free Vector Maps. Available online: https://freevectormaps.com/world-maps/europe/WRLD-EU-010004?ref=more_region_map (accessed on 10 May 2021).
- Eurostat. Available online: https://ec.europa.eu/eurostat/statistics-explained/index.php?title=Energy_production_and_imports#Production_of_primary_energy_decreased_between_2009_and_2019 (accessed on 15 May 2021).
- Uchida, T.; Goto, T.; Yamada, T.; Kiga, T.; Spero, C. Oxyfuel combustion as CO2 capture technology advancing for practical use—Callide Oxyfuel Project. Energy Procedia 2013, 37, 1471–1479. [Google Scholar] [CrossRef]
- Porada, S.; Grzywacz, P.; Czerski, G.; Kogut, K.; Makowska, D. Ocena przydatności polskich węgli do procesu zgazowania. Energy Policy J. 2014, 17, 89–102. [Google Scholar]
- Sobczyk, E.J.; Wot, A.; Kopacz, M.; Frączek, J. Clean Coal Technologies—A chance for Poland’s energy security. Decision-making using AHP with Benefits, Opportunities, Costs and Risk Analysis. Miner. Resour. Manag. 2017, 33, 27–48. [Google Scholar] [CrossRef][Green Version]
- Roddy, D.J.; Younger, P.L. Underground coal gasification with CCS: A pathway to decarbonising industry. Energy Environ. Sci. 2010, 3, 400–407. [Google Scholar] [CrossRef]
- Viebahn, P.; Vallentin, D.; Höllerm, S. Prospects of carbon capture and storage (CCS) in India’s power sector—An integrated assessment. Appl. Energy 2014, 117, 62–75. [Google Scholar] [CrossRef]
- Saga. Available online: http://www.saga-gis.org/saga_tool_doc/2.2.0/statistics_regression_8.html (accessed on 15 May 2021).
- Myttenaere, A.; Golden, B.; Grand, B.; Rossi, F. Mean Absolute Percentage Error for regression models. Neurocomputing 2016, 192, 38–48. [Google Scholar] [CrossRef]
- Profillidis, V.A.; Botzoris, G.N. Chapter 6—Trend Projection and Time Series Methods Modeling of Transport Demand; Elsevier: Amsterdam, The Netherlands, 2019; pp. 225–270. [Google Scholar]
Publisher’s Note: MDPI stays neutral with regard to jurisdictional claims in published maps and institutional affiliations. |
© 2021 by the authors. Licensee MDPI, Basel, Switzerland. This article is an open access article distributed under the terms and conditions of the Creative Commons Attribution (CC BY) license (https://creativecommons.org/licenses/by/4.0/).