Article

Research on Test and Logging Data Quality Classification for Gas–Water Identification

1
College of Energy, Chengdu University of Technology, Chengdu 610059, China
2
State Key Laboratory of Oil and Gas Reservoir Geology and Exploitation, Chengdu University of Technology, Chengdu 610059, China
3
College of Earth Sciences, Chengdu University of Technology, Chengdu 610059, China
*
Author to whom correspondence should be addressed.
Energies 2021, 14(21), 6991; https://doi.org/10.3390/en14216991
Submission received: 15 September 2021 / Revised: 16 October 2021 / Accepted: 18 October 2021 / Published: 25 October 2021
(This article belongs to the Special Issue Advances in Petroleum Exploration and Production)

Abstract

:
Tight sandstone oil and gas reservoirs are widely distributed, rich in resources, with a bright prospect for exploration and development in China. Due to multiple evolutions of the structure and sedimentary system, the gas–water distribution laws are complicated in tight sandstone gas reservoirs in the northern Ordos area. It is difficult to identify gas and water layers in the study area. In addition, in the development and production, various factors, such as the failure of the instrument, the difference in construction parameters (injected sand volume, flowback rate), poor test results, and multi-layer joint testing lead to unreliable gas test results. Then, the inaccurate logging responses will be screened by unreliable gas test results for different types of fluids. It is hard to make high-precision fluid logging identification charts or models. Therefore, this article combines gas logging, well logging, testing and other data to research the test and logging data quality classification. Firstly, we select reliable standard samples through the initial gas test results. Secondly, we analyze the four main factors which affect the inaccuracy of gas test results. Thirdly, according to these factors, the flowback rate and the sand volume are determined as the main parameters. Then, we establish a recognition chart of injected sand volume/gas–water ratio. Finally, we proposed an evaluation method for testing quality classification. It provides a test basis for the subsequent identification of gas and water through the second logging interpretation. It also provides a theoretical basis for the exploration and evaluation of tight oil and gas reservoirs.

1. Background

Tight sandstone oil and gas reservoirs are widely distributed and have huge reserves in China. They are distributed in Ordos Basin, Sichuan Basin, Songliao Basin, Turpan-Hami Basin and other areas [1,2,3]. However, due to the low abundance of tight sandstone oil and gas reservoirs, production has declined rapidly [4]. The current economic development is particularly difficult [5,6]. There are obvious differences between tight gas reservoirs and conventional gas reservoirs in the accumulation process, this reason directly leads to the generally high water saturation in tight oil and gas reservoirs [7,8,9]. As a result, the law of gas–water relationship becomes complicated, and it is difficult to identify gas–water layers.
The study area is located in the northern part of the Ordos Basin (Figure 1). Its structure is relatively complex, including three structural units: Yimeng Uplift, Yishan Slope, and Tianhuan Depression [10,11,12,13]. The overall tectonic pattern has evolved from a high in the south and a low in the north to a uniclinal structure with a high in the north and a low in the south; the early compressional environment has also evolved into a late extensional environment many times [14,15,16,17,18,19]. For different depositional periods, there are different degrees of tectonic movement, leading to changes in the depositional system. During the sedimentary period of the Shanxi Formation, affected by the overall uplift of the North China Plate, regression occurred on the east and west sides of the Ordos Basin. The sedimentary environment changed from marine to continental and developed the delta deposit system [20,21,22]. For the sedimentary period of the Lower Shihezi Formation, the northern part of the basin evolved from a compression environment to a tension environment under the influence of the regressive background of the Shanxi Formation, and developed the fluvial deposit system [23,24,25,26]. Due to the multiple evolutions of this structure and sedimentary system, tight oil and gas reservoirs formed in Ordos Basin. Through gas logging and initial logging interpretation, gas and water layers cannot be accurately identified. It caused a serious impact on the exploration and development of oil and gas [27,28,29].
The current conventional logging gas–water identification methods include the three-porosity overlay method, acoustic log method, logging characteristics method, gas reservoir index method, and intersection chart method, etc. [30,31,32,33,34,35,36,37]. Due to the characteristics of low porosity and low permeability of tight sandstone reservoirs, in recent years, the quantitative calculation of gas-bearing properties has been mainly combined with new logging methods. There are several gas quantification methods based on the principle of nuclear magnetic resonance, including the T2 spectrum method, difference spectrum method and shift spectrum method [38,39,40,41,42]. Based on array acoustic logging, lateral-induction combined measurement method and invasion zone analysis method are applied in gas quantification [43,44]. There are methods based on computers and mathematics, including gray correlation, Support Vector Machine and artificial neural networks [45,46,47,48].
Based on these methods, it is possible to qualitatively and quantitatively evaluate the gas-bearing properties of the reservoir through logging interpretation. Then use the gas test data as the test basis to verify the conclusion of the second interpretation. However, in the process of gas testing, the quality of the test results will be different due to different construction equipment and gas test methods. The quality of the test results will directly affect the qualitative judgment of the fluid properties [49,50]. It will cause great difficulties in the evaluation of the logging gas-bearing property in combination with the actual interval. Due to the strong inconsistency between the logging and test results, the test results are difficult to provide effective training samples or test basis for the judgment of gas layers, gas and water layers, and water layers [51]. Ultimately it will affect the establishment of effective fluid identification standards. In actual production, a single perforation gas production rate is used as the most favorable criterion for judging the quality of a certain reservoir interval, but the accuracy of the test results has always been ignored [52,53]. Therefore, to clarify the fluid properties of the reservoir, we must use production and development data as the inspection basis to ensure the accuracy of the test results. Then make a qualitative judgment of the gas or water layer. Finally, the gas–water identification study of the reservoir can be perfected according to the characteristics of the logging response curve. The specific research ideas are shown in the figure below (Figure 2).

2. Consistency Analysis of Gas Test and Logging Data

In the tight sandstone reservoir section of the study area, the logging curve is affected by the formation and borehole environment and cannot accurately reflect the reservoir fluid information [54]. The correlation between test data and logging data is poor, and the corrected log curve needs to rely on the test results as the inspection standard. Therefore, we need to judge the consistency between the test data and the logging curve characteristics based on the gas logging, initial logging interpretation and production data. Combining the test results with the resistivity, core porosity, gas measurement and other data of the interval, the intervals with higher conformity are selected as the standard sample with better test quality. Then, we carry out the evaluation of the quality of the test results and analysis of the reasons for the inconsistent layers, and determine whether the original logging curve needs to be processed. Finally, we completely finish the inspection work for the identification of gas and water layers.
For the actual well data in the study area, the thickness of the perforated layer in Well X1 is 3 m (Figure 3). The gas-logging total hydrocarbon of this layer is very high. This layer is less affected by diameter expansion and mud intrusion. The formation information reflected by the logging curve is more real, and the resistivity value is 62.3 Ω·m. The core analysis porosity is 8.29%. The resistivity, core porosity and gas logging measurement values of this layer are all high, which belongs to a typical gas layer; the conclusion of perforation is also a gas layer. The test gas production volume is 16,952.4 m3, and the water production volume is 13.6 m3. It is a typical layer in which the test data are consistent with the logging data. This type of layer is common in the study area, and the test results have good consistency with the logging data. It can be used as a standard sample layer with good test quality.
The thickness of the perforated layer in Well X2 is 5 m (Figure 4), which is less affected by diameter expansion and mud intrusion, and the logging curve can more truly reflect the formation information. The gas-logging total hydrocarbon is only 0.3%, the resistivity is 20.2 Ω·m and the core porosity is 7.86%. The resistivity, core porosity and gas logging measurement values of this layer are all low. According to the initial logging data, it is qualitatively judged that the layer may be gas and water layer; and the conclusion of perforation is a gas layer as well. The test gas production is 925 m3, and the water production is very small. The analysis indicates that the test productivity is poor and there is a certain amount of water production. In the follow-up further research, the consistency of test data and logging data should be comprehensively interpreted and judged.

3. Causes Analysis of Uncertain Test Gas Layers

Analyzing the test results in the study area, it is found that the quality of the test results is uncertain. There are many construction factors that affect the test results, such as the difference in the amount of sand volume, whether the working fluid completely flowback, the reservoir section is not compressed during sand fracturing, and the equipment used for gas testing is abnormal [55,56,57,58,59,60]. According to the geological conditions and the actual test data in the study area, the undisturbed formation and damage to the gas test equipment are not the main controlling factors that affect the test results. Excluding the factors that cause differences in uncompressed layers and equipment. The main influencing factors of the uncertainty in the quality of analysis and test results are the following four aspects: differences in construction parameters, poor or unsuccessful test results, incomplete flowback of working fluid, and multi-layer joint testing make it difficult to determine the single-layer test result.

3.1. Differences in Construction Parameters

The perforated layer in Well X3 (Figure 5) and the perforated layer in Well X4 (Figure 6) are both less affected by diameter expansion and mud intrusion, and the thickness of the two layers is 4 m. The deep lateral resistivity value of Well X3 is 41.23 Ω·m, the deep lateral resistivity value of X4 well is 40.30 Ω·m; the porosity of X3 well is interpreted as 9.2%, and the porosity of X4 well is interpreted as 9.6%. For these two perforated layers, the resistivity and porosity logging response characteristics are similar. According to the logging results, the lithology of the two layers is coarse sandstone. Only when the perforation thickness, resistivity value, and porosity are all similar, can we compare the impact caused by the difference in construction parameters.
According to the gas test data, the perforation layers of the two wells are both modified by sand fracturing, and the equipment and gas test methods used in the two wells are the same. The injected sand volume of the perforation section of Well X3 is 41.9 m3, the injected liquid volume is 246.5 m3, and the flow-back liquid volume is 227.9 m3. The amount of injected sand volume in the perforation layer of Well X4 is 28.1 m3, the injected liquid volume is 156.1 m3, and the flow-back liquid volume is 234.8 m3. From the construction parameters, such as injected sand volume, the injected liquid volume, and the flow-back liquid volume, the construction conditions of Well X3 are more perfect. Further, the amount of injected sand volume is about 1.49 times more than that of the perforation layer of Well X4.
Both wells are produced by the one-point method. Well X3 has an average stable daily gas production is 2789 m3 and water production is 4.8 m3. The comprehensive interpretation conclusion should be a gas–water layer. Well X4 has a gas production is 0 m3 and water production is 18 m3. The conclusion of the comprehensive interpretation is a water layer. For these two layers with similar geological conditions, there are huge differences in construction parameters, which are mainly manifested in the amount of injected sand volume, the injected liquid volume, and the flow-back liquid volume. Ultimately gas test results are different due to the above reasons. Therefore, the difference in construction parameters will cause the test results to be incomparable. In the subsequent evaluation of the test results, the relationship between construction parameters and gas production should be mainly studied under similar geological conditions.

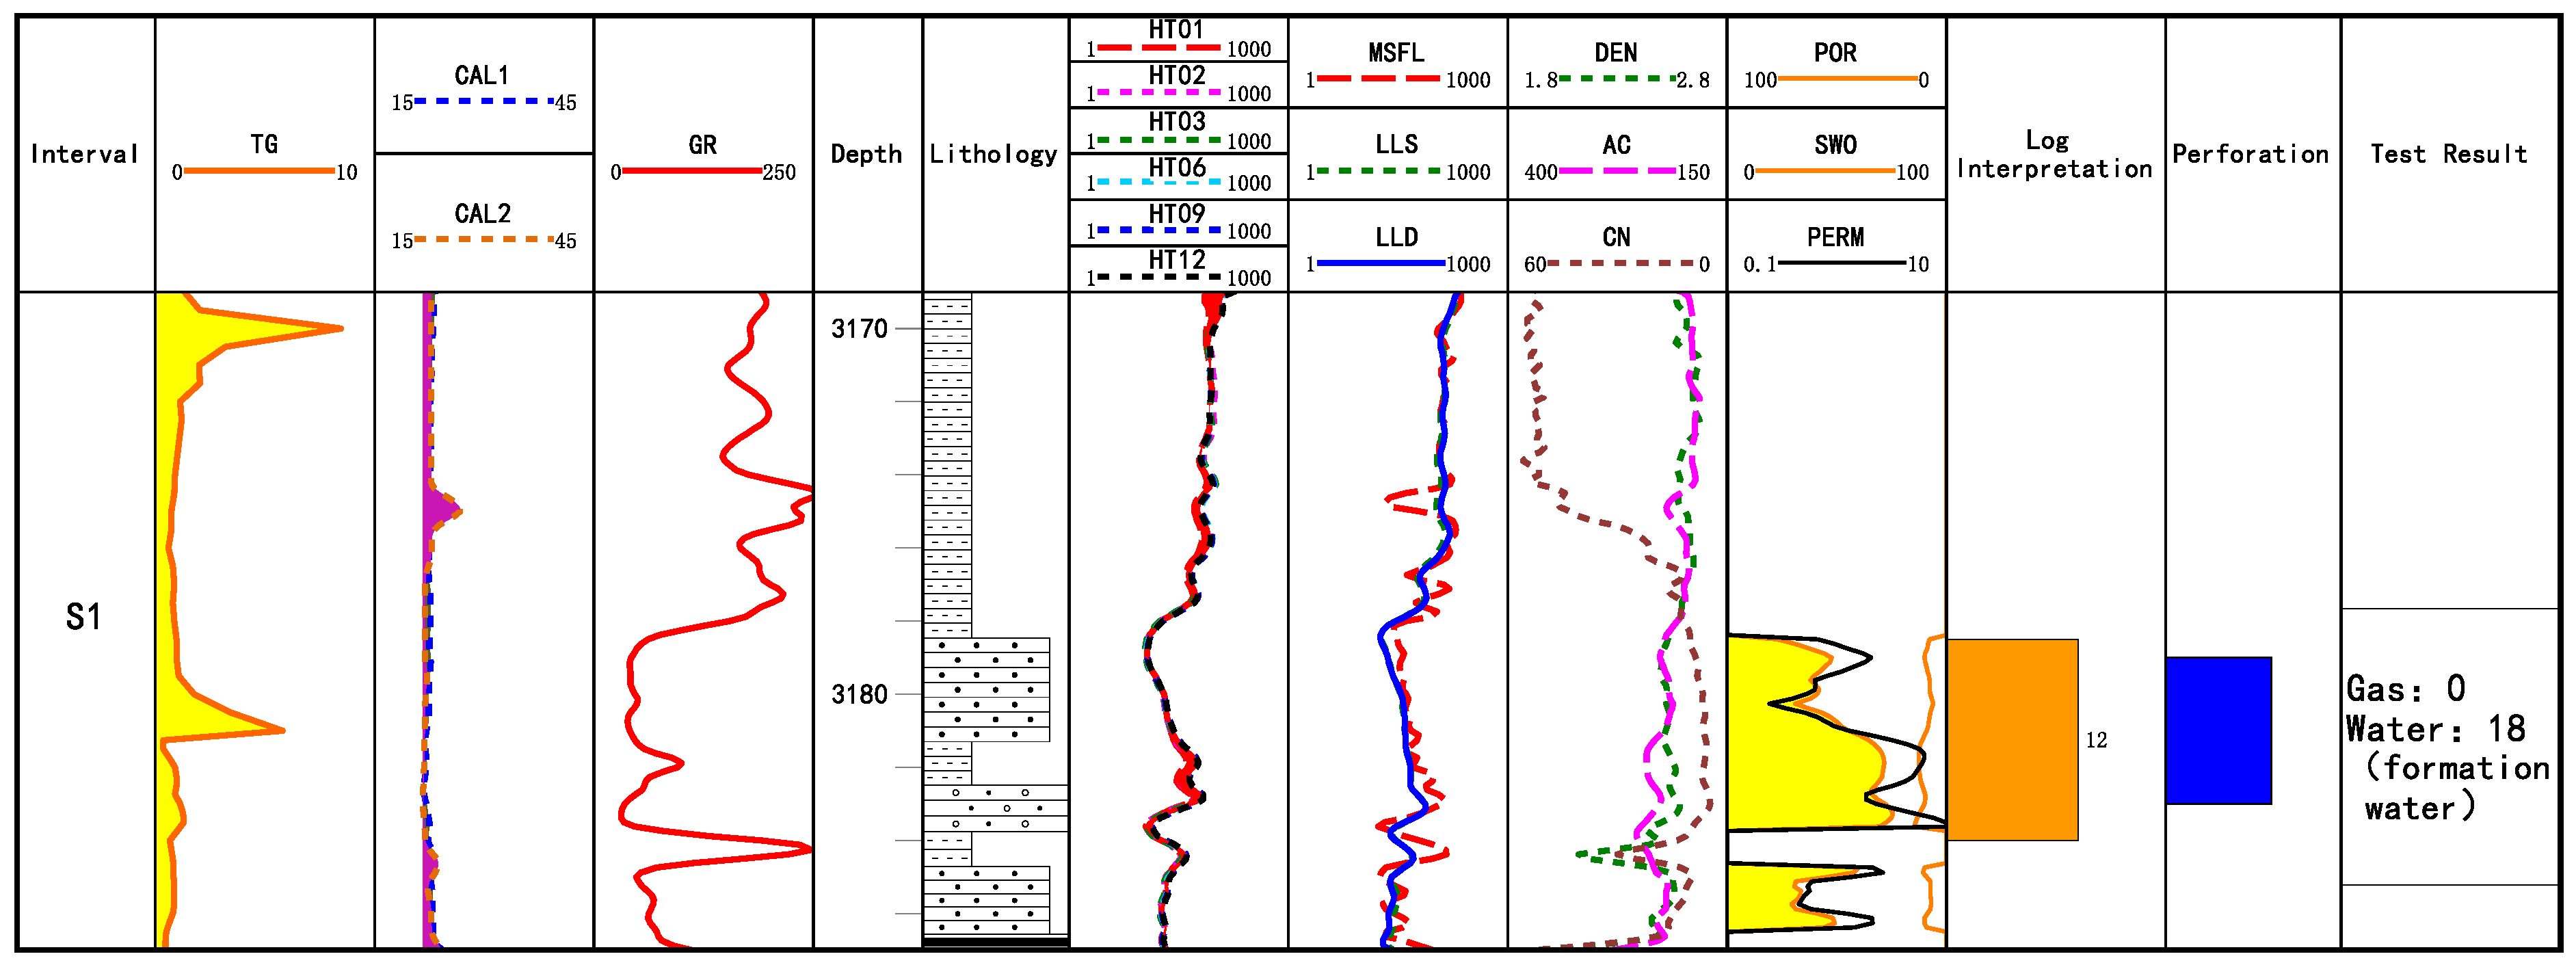
3.2. Poor or Unsuccessful Test Results

The thickness of the perforated layer in Well X2 (Figure 7) is 3.5 m, the deep lateral resistivity value is 39.322 Ω·m, and the porosity is interpreted as 10.833%. Its electrical and physical properties are good. According to gas logging and well logging data interpretation, the conclusion is considered to be a gas–water layer. During the construction, sand fracturing was used to reform the layer. The amount of injected sand volume in the perforation layer is 18 m3, the injected liquid volume is 188 m3, and the flow-back liquid volume is 190.9 m3, and the flowback rate is 85.3%. The swabbing method was used in the gas test, the gas production and the water production are both 0 m3. After testing, the conclusion of the perforation gas test is dry layer. This conclusion is completely inconsistent when the conclusion is a gas-bearing water layer through gas logging and well logging.
The perforated layer has good porosity, the resistivity value is medium resistance, and the amount of injected sand volume is also sufficient. However, the gas production in the test is obviously insufficient. There may be one situation where the perforation fails to open the reservoir layer fully. The conclusion drawn from the well logging data should be a gas-bearing water layer. Poor or unsuccessful testing will seriously affect the subsequent identification of gas and water layers in this layer. The identification of the fluid type should be based on the core, gas logging, well logging, production or other data.

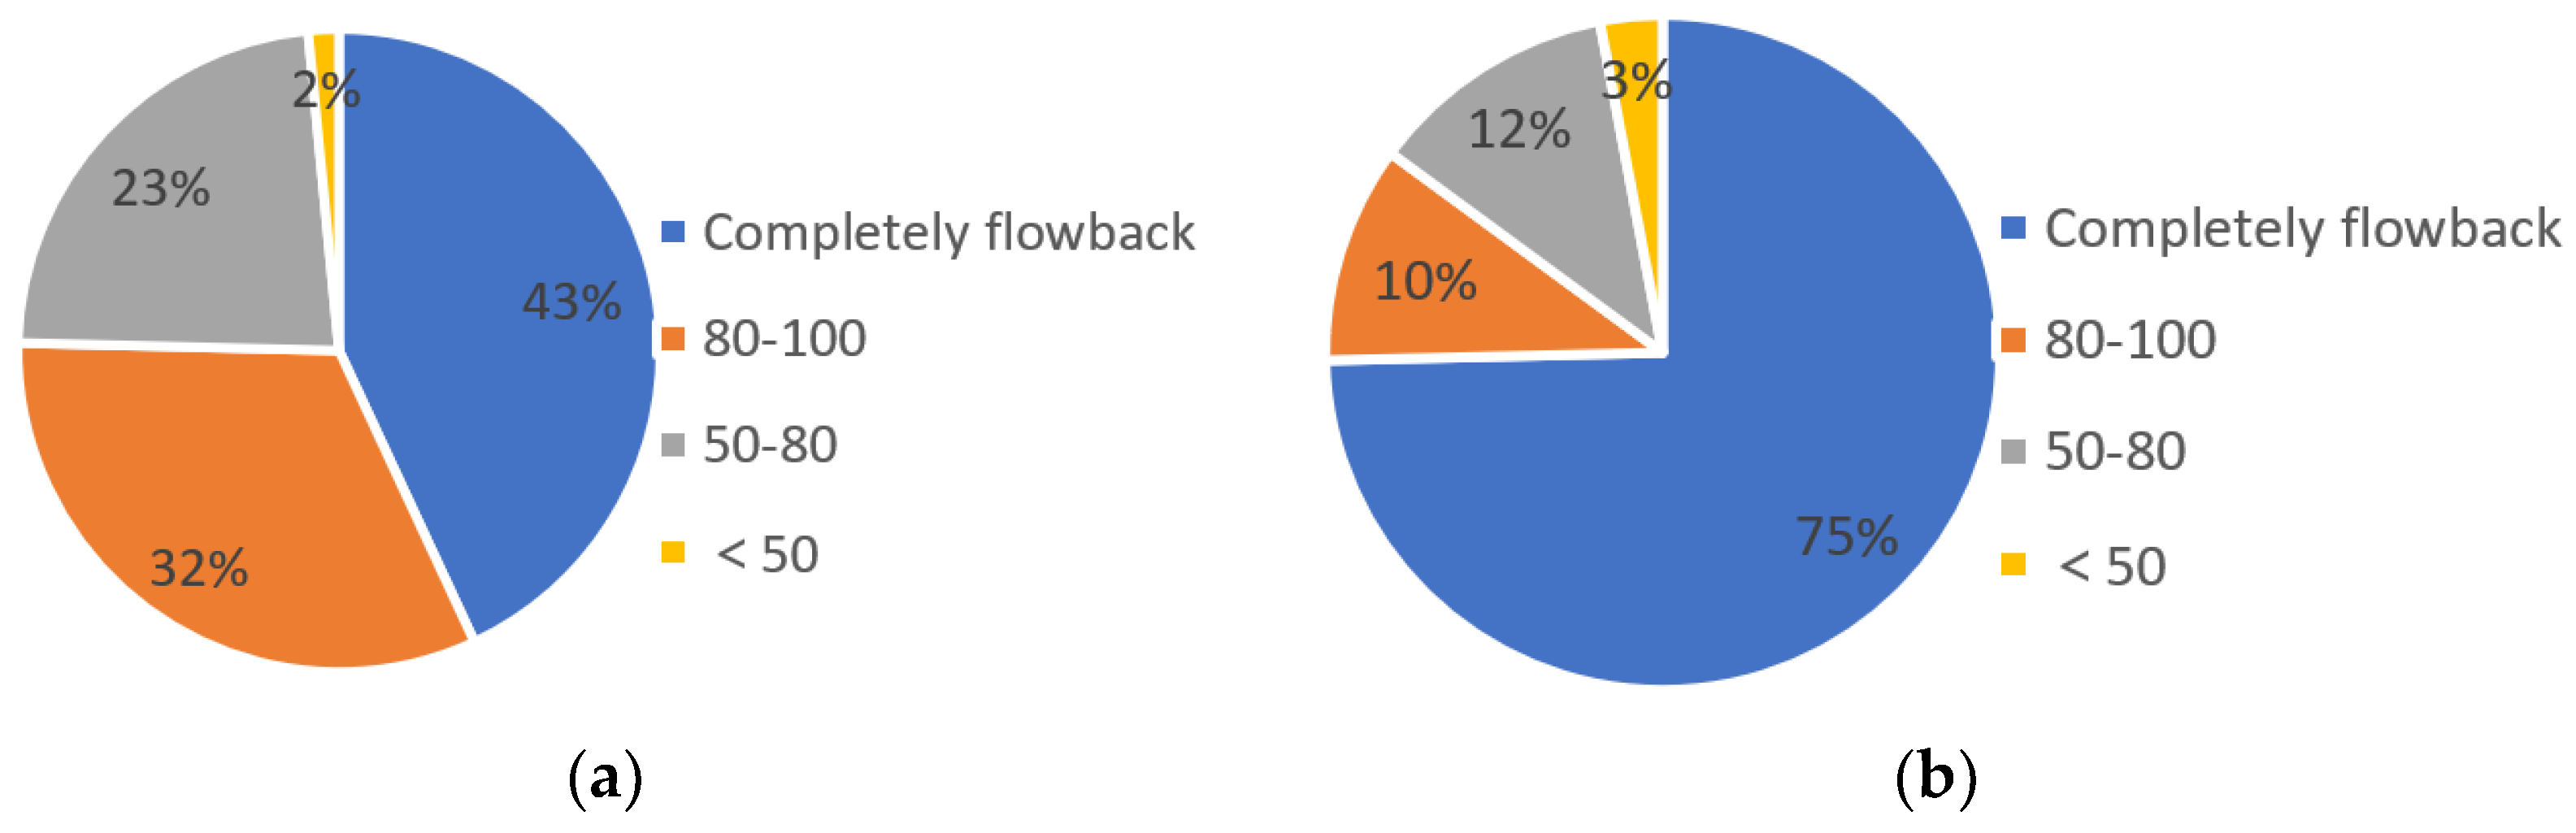
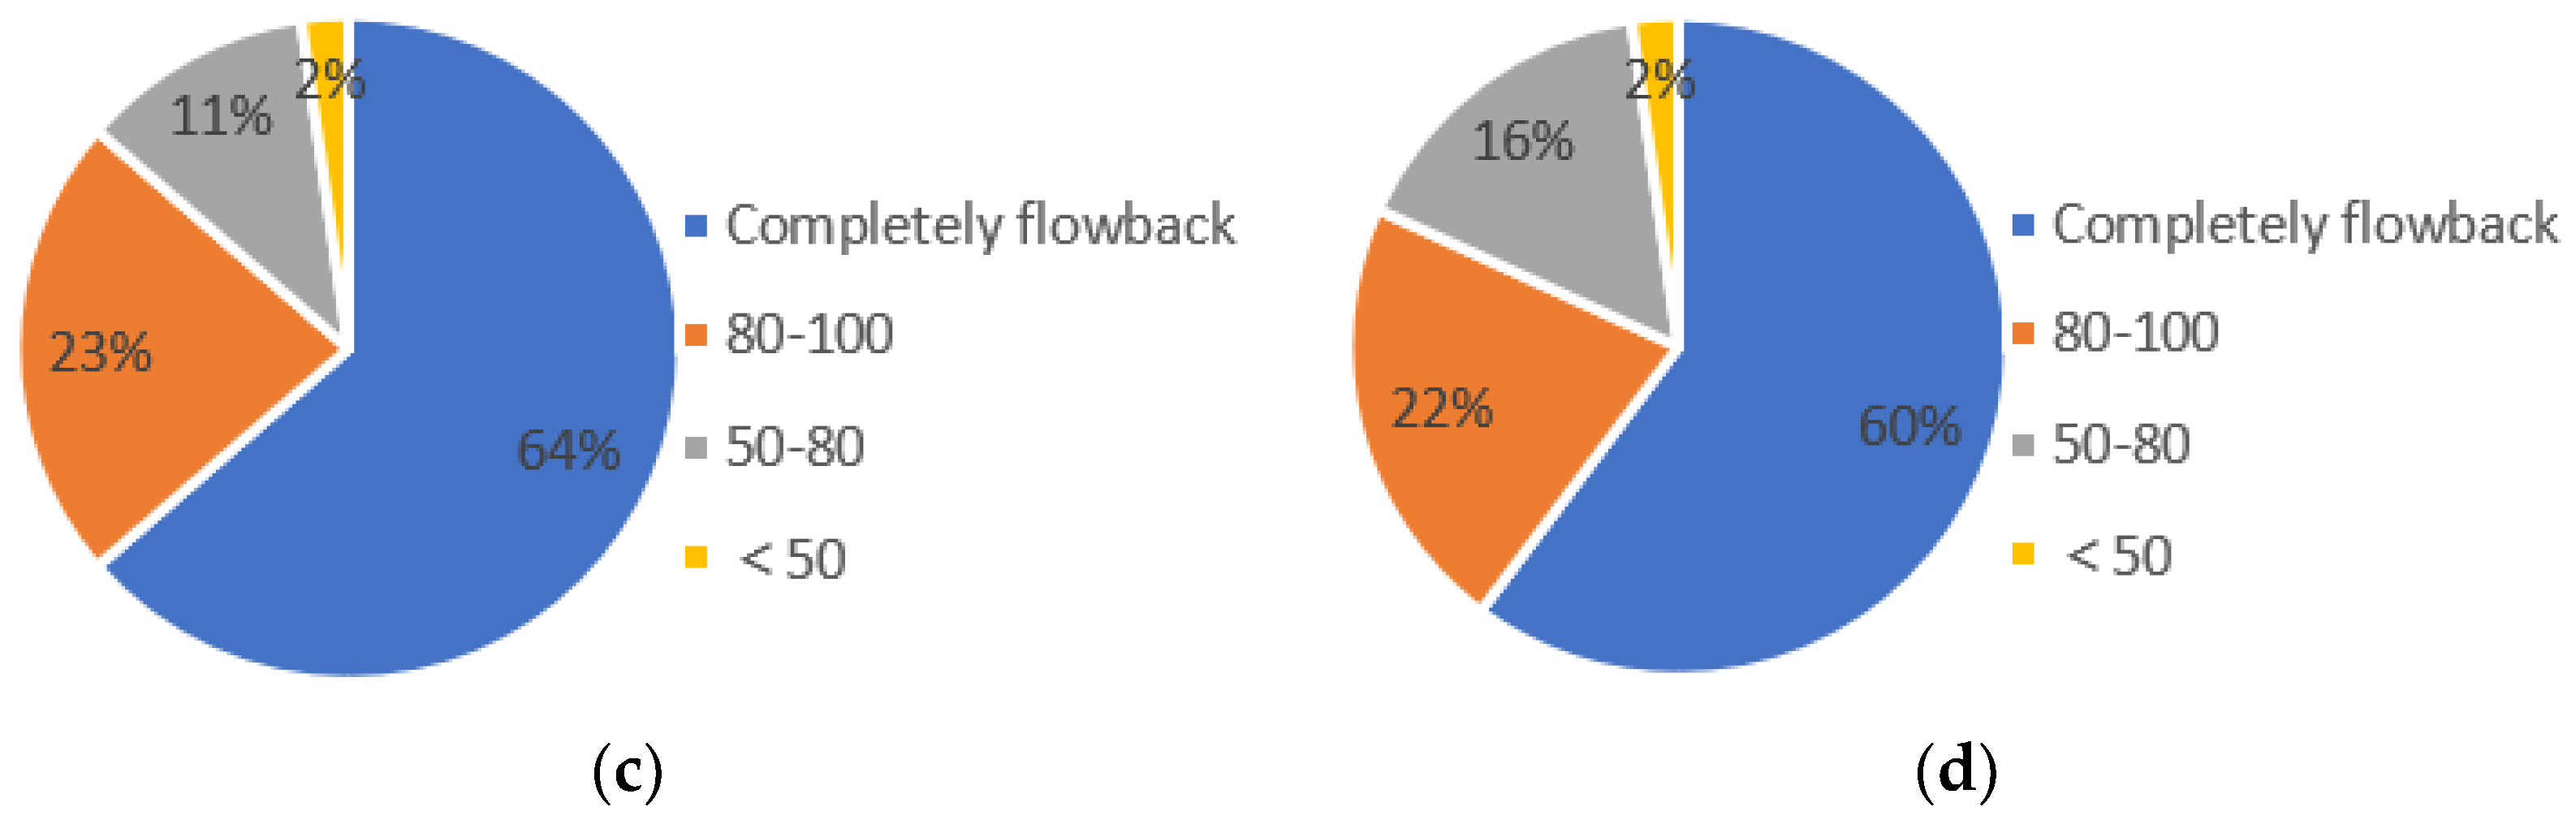
3.3. Completely Flowback of Working Fluid

The thickness of the perforated layer in Well X5 (Figure 8) is 2 m, which is less affected by diameter expansion and mud intrusion. The deep lateral resistivity values of the first and second layers are 37.5 Ω·m and 88.4 Ω·m, the porosity interpretation is 8% and 12%. The electrical and physical properties of layers are better. Reservoir reconstruction is carried out by sand fracturing. The amount of injected sand volume in the perforation layer is 30 m3, the injected liquid volume is 268.7 m3, and the flow-back liquid volume is 234.5 m3, and the flowback rate is 76.5%. One-point method is used to obtain the production, the gas production is 10,831 m3, and the water production is 15.8 m3. The interpretation conclusion is a water-bearing gas layer.
The resistivity value of the perforated layers of Well X5 is relatively high and has good gas-bearing properties. The formation water salinity of Well X5 is 37,121.71 mg/L, which is smaller than the regional salinity of the S2 interval in the study area (51,101.62 mg/L). Further, the flowback is not complete. The test water content is obviously higher, so incomplete flowback will cause the construction effect to deteriorate and cause the test results to be biased.

3.4. Multi-Layer Joint Test

The thicknesses of the perforation sections of the two small layers in Well X4 (Figure 9) are 6 m and 3 m, which are both affected by diameter expansion and mud intrusion to varying degrees. The deep lateral resistivity values are 36.9 Ω·m and 15.7 Ω·m, which is lower than the actual resistivity value. Further, the porosity is better at 11.9% and 17.6%. The interpretation conclusions are all gas reservoirs.
The amount of injected sand volume in the joint test layers is 44.7 m3. The gas production volume is 4019 m3, and a water production volume is 7.1 m3. The perforation conclusions of the two layers are both gas and water layers. However, due to geological conditions such as thickness, resistivity and porosity, and obvious differences in logging response characteristics, the actual gas and water identification of these two layers will be difficult. This is not conducive to the formation of a standard inspection sample for single well fluid identification through the test results. Therefore, when selecting the standard sample of test quality, we should exclude the existence of multiple layers of joint testing firstly. The fluid identification of this type of layer must be combined with gas logging, well logging, gas testing, production and other data to determine.

4. Consistency Analysis of Gas Test and Logging Data

4.1. Analysis of the Influencing Factors (the Flowback Rate and the Injected Sand Volume)

The research area uses sand fracturing to reform the reservoir nearly. There is a phenomenon that some of the fracturing fluid in the reservoir section cannot be discharged. It will produce a water lock phenomenon to reduce the gas permeability and cause damage to the reservoir [61,62,63]. Therefore, the flowback rate of fracturing fluid, as an important parameter to measure whether the flowback is thorough or not, flowback rate can directly reflect the size of the gas test productivity. Further, another important parameter is the amount of injected sand volume. A small amount of injected sand volume during fracturing is not conducive to the support of fractures, thus affecting the effect of fracturing reformation. As a result, the test capacity is reduced, and the amount of sand volume will directly affect the subsequent production and gas extraction process [64,65,66].

4.1.1. Flowback Rate

The higher the flowback rate, the less fracturing fluid stays in the formation, and the less damage to the formation, and the more gas produced by the initial gas well test [67]. According to the statistics of the flowback rate of 176 perforation sections in the study area (Figure 10), the flowback rate of all fluid types is 60% at most, the layers with a flowback rate of 50% to 80% account for about 22%. The flowback fluid in the layers with a rate of 80% to 100% has little impact on the formation, the identification of gas and water layers is also more accurate, and the test results are in good agreement with the logging response characteristic values. However, for the layers where the flowback rate is 50% to 80%, the gas test results should be carefully selected, and well logging data should be combined with subsequent production and development data for inspection. For the layers with flowback rate lower than 50%, the test result is unreliable. Gas logging, well logging, gas testing, production and other data should be used for qualitative judgment and evaluation.

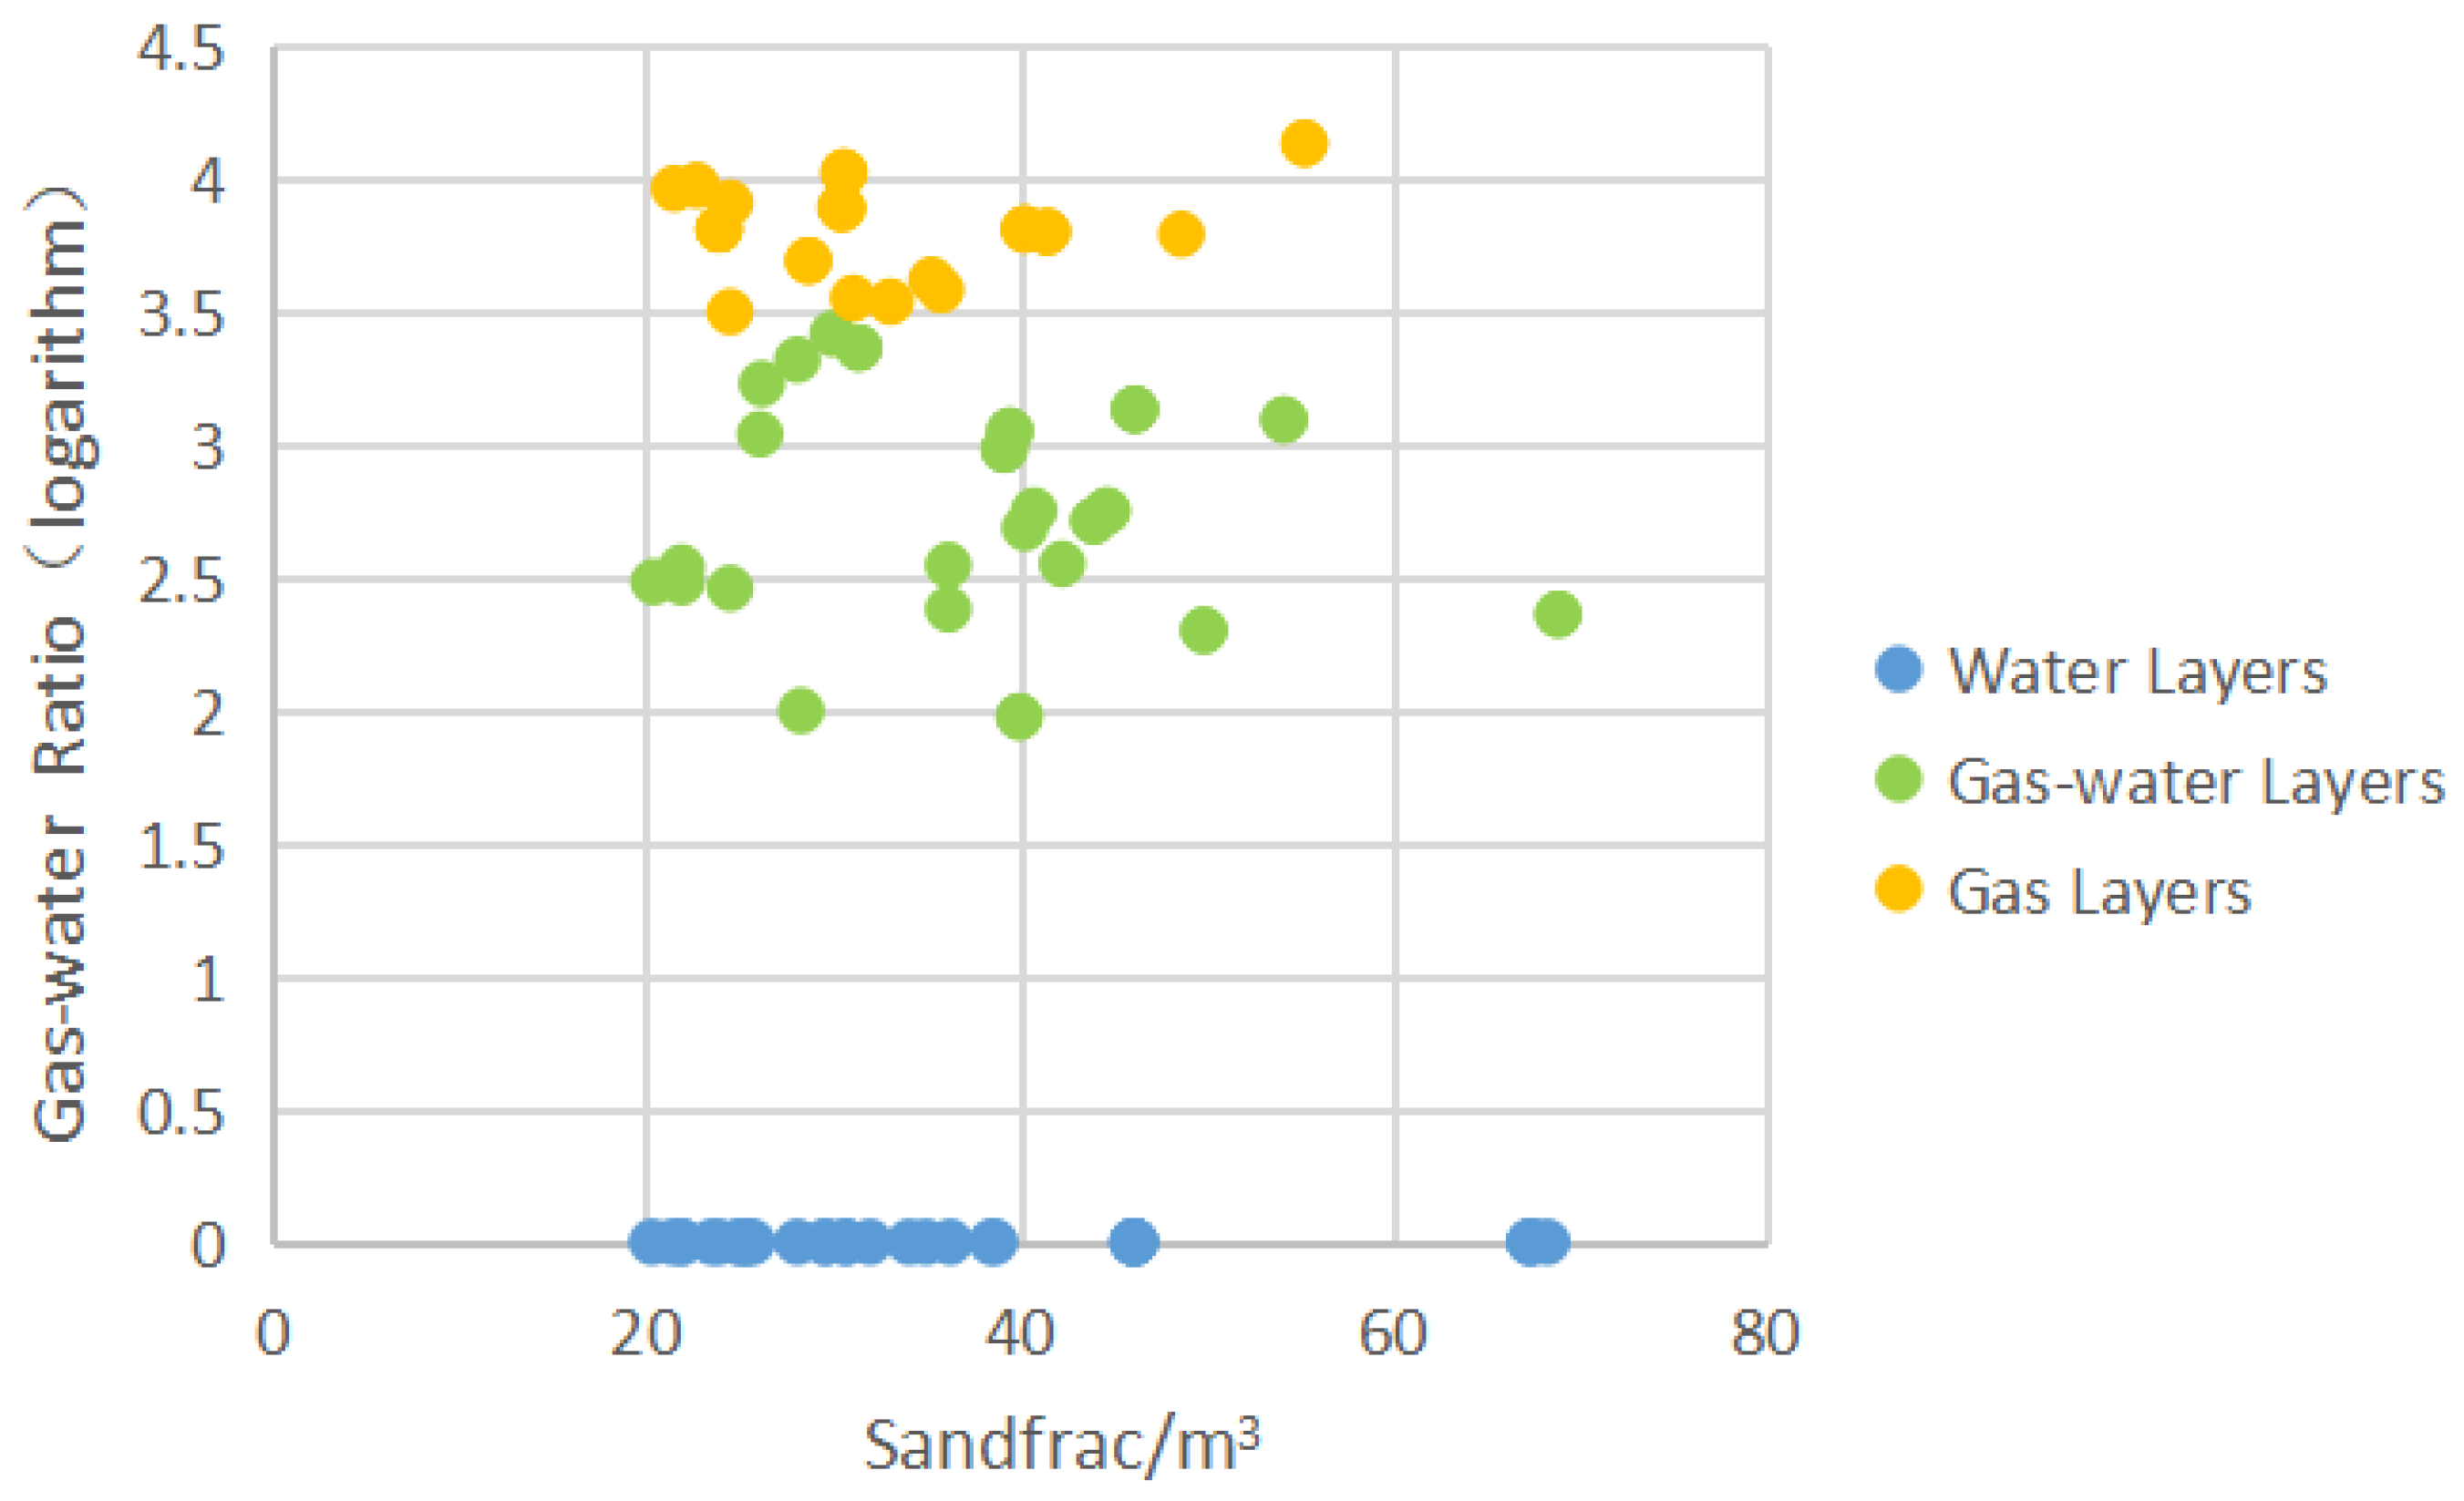
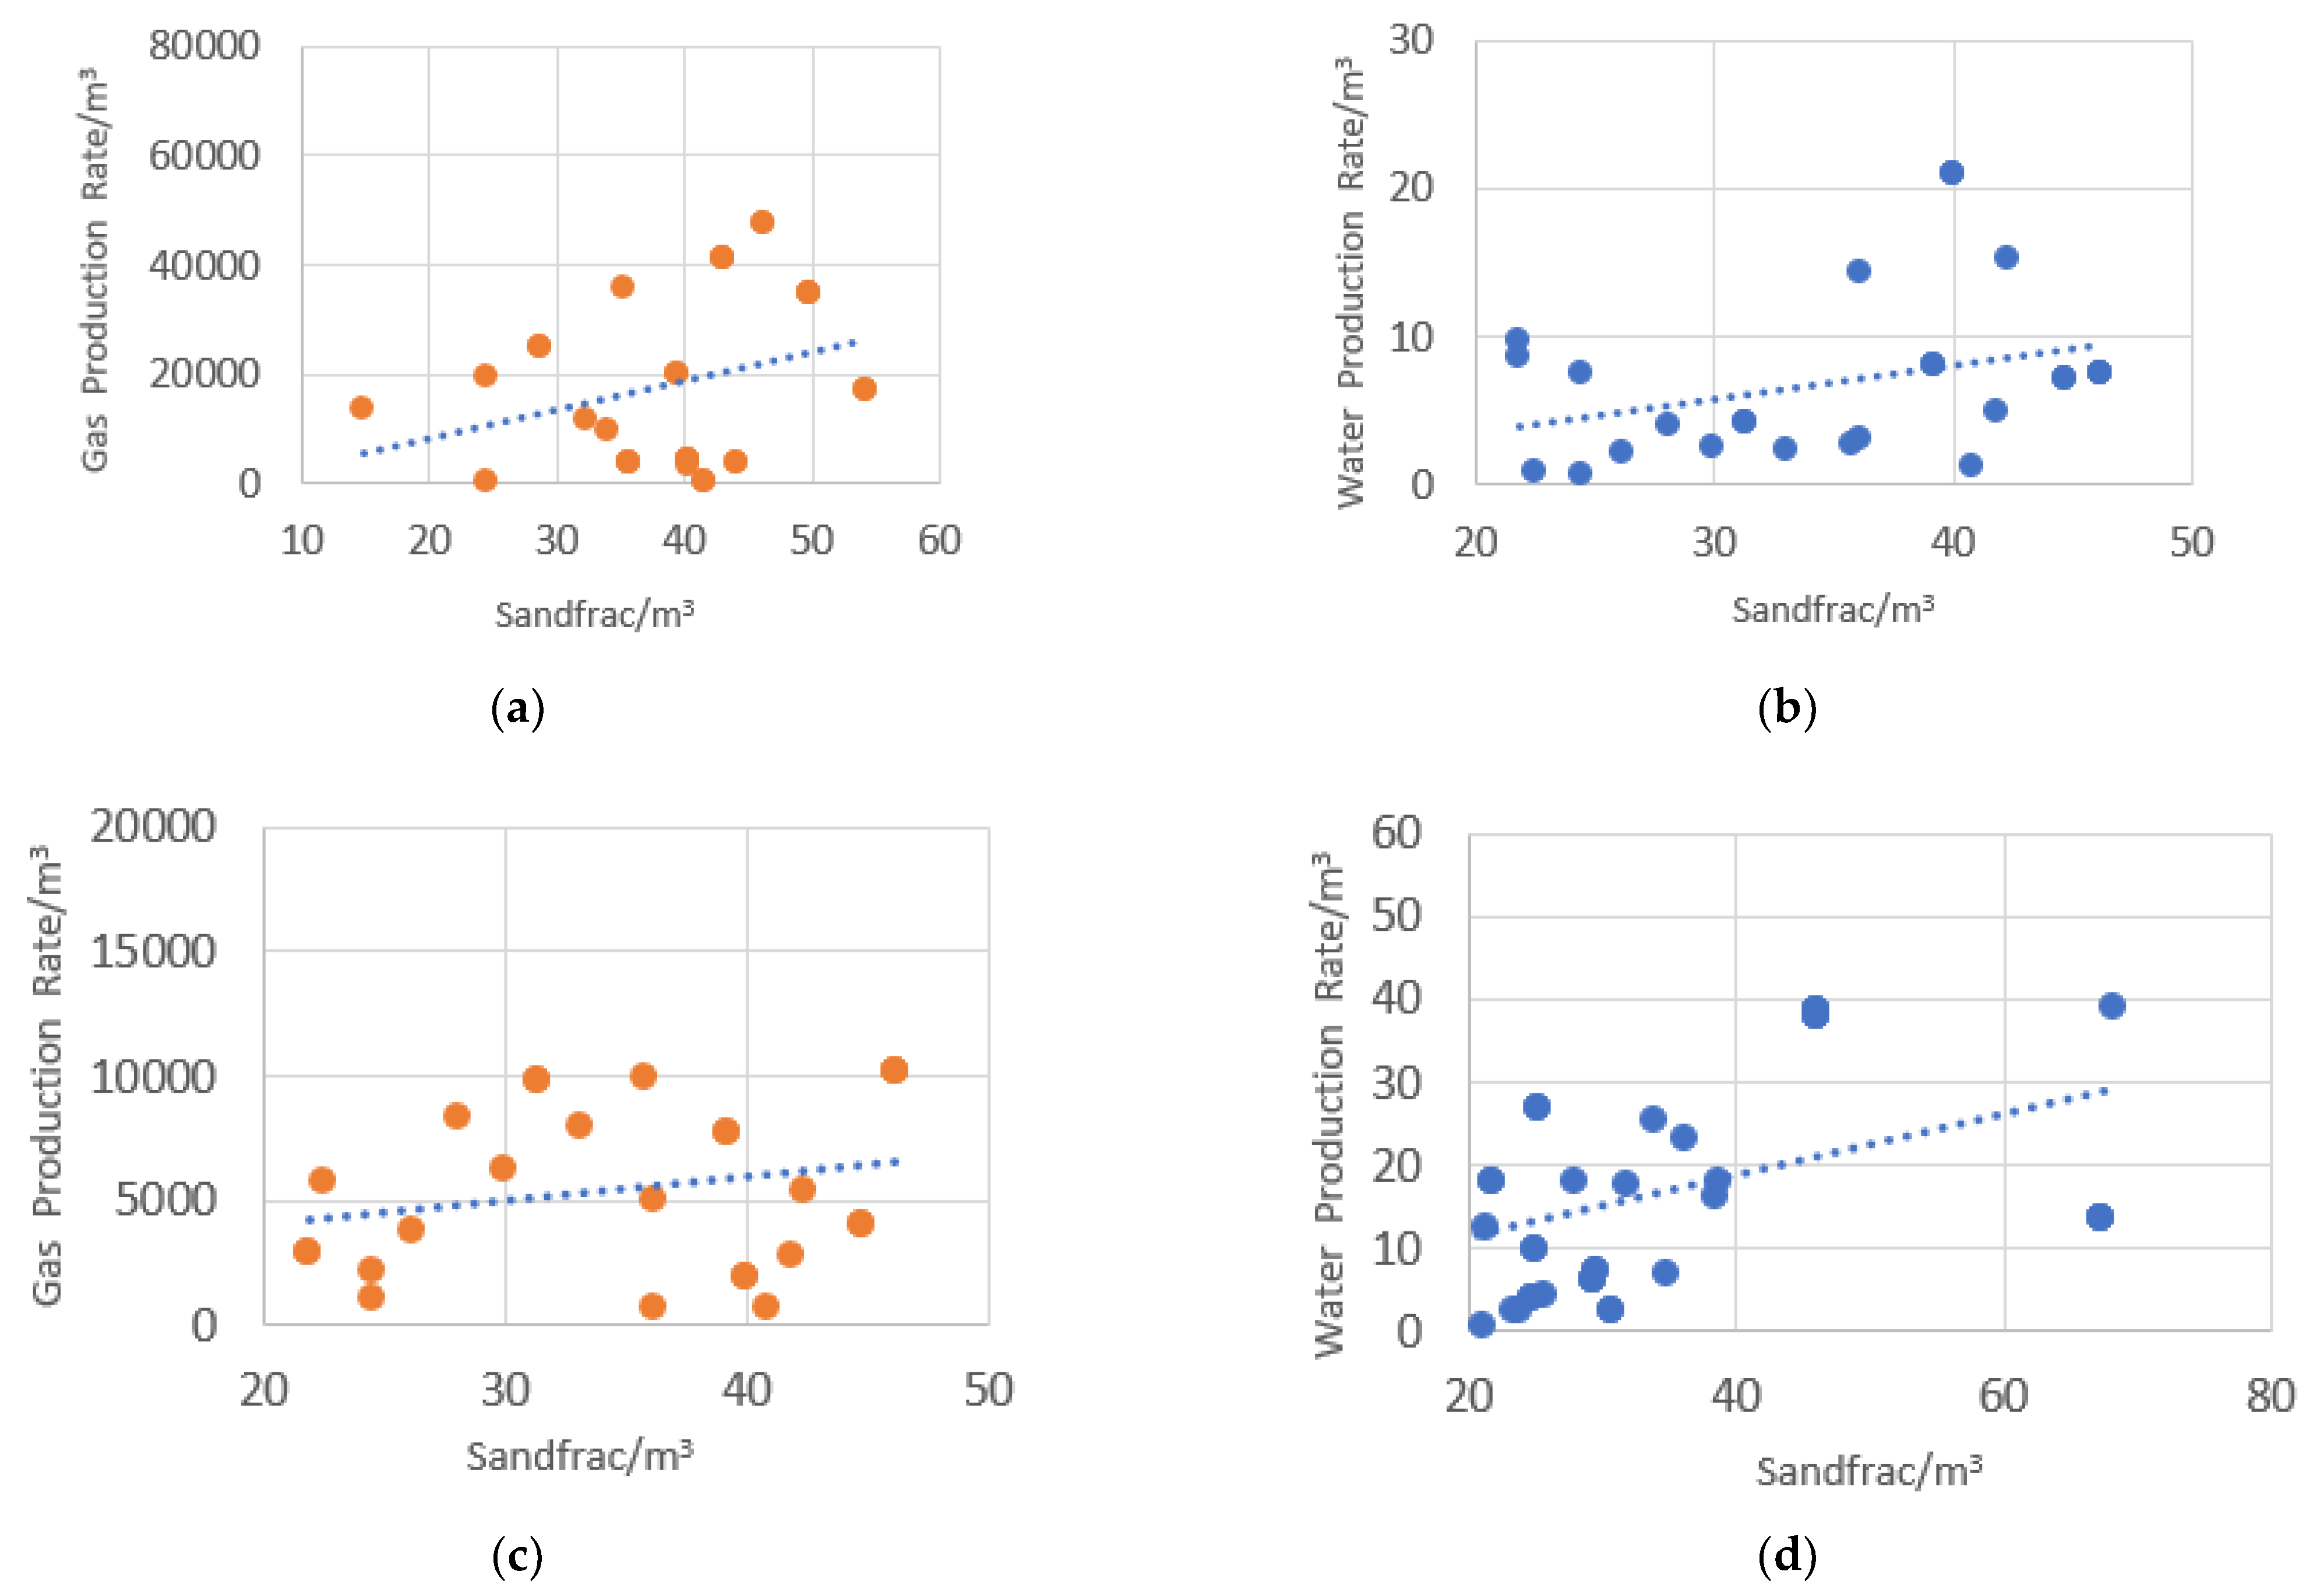
4.1.2. Injected Sand Volume

Sand volume is one of the important indicators for judging the fracturing reformation of the perforation section. When the amount of sand volume is insufficient, it will seriously affect the fracturing effect and post-fracturing productivity [59]. According to the statistics of actual well data in the study area, when the amount of injected sand volume is less than 20 m3, the consistency between the test data and the logging data is poor.
The following is a single well interpretation diagram of the perforation section of a typical well X6 (Figure 11). The perforation section has a relatively complete flowback. The flowback rate has reached 92.46%, but the amount of injected sand volume during the fracturing process is only 7.16 m3, the test gas production is 2015 m3, the water production is 0.55 m3, and the perforation conclusion is that gas and water are in the same layer. However, the gas logging of this perforation section shows good. The deep lateral resistivity value is 50.1 Ω·m, the porosity is 6.7%, and the logging curve reflects the diameter expansion and low mud invasion. The log interpretation conclusion should be closer to the water-bearing gas layer or the gas layer. Due to the small amount of injected sand volume, the test productivity is obviously insufficient. Therefore, when selecting the layers with better test quality as the standard sample, the sand volume should be selected. The layers with a volume greater than 20 m3 can be used to exclude insufficient test capacity or failure of fracturing reformation.
We selected 176 perforation sections with sand content greater than 20 m3 and flowback rate greater than 80% for statistical analysis (Figure 12). For perforation sections with three different fluid types, the conclusion is gas layer, gas–water layer (including gas-bearing water layers, water-bearing gas layers and gas–water layers), and water layer, there is a trend of positive correlation between gas or water production and injected sand volume. In other words, the gas production and water production will increase with the increase of sand injecting. Therefore, the amount of injected sand volume can be used as an important indicator of test quality evaluation.

4.2. Test Quality Classification

Because of the above analysis of sand injected and flowback rate, the test quality of the layers is reliable with sand injected volume of more than 20 m3 and flowback rate greater than 80%. Log data and test data have good consistency, so they can be used as standard samples for quality grading evaluation. Because there is a positive correlation between the injected sand volume and the gas/water production. Therefore, we drew the identification chart between the injected sand volume and the amount of liquid produced. Standard samples of gas, gas–water and water layers are verified based on test results. The measurement of test capacity uses gas–water ratio (logarithm) as parameter index. The calculation formula is as follows:
A = log ( Qg Qw ) ,
In the formula: A—gas–water ratio, Qg—gas production, Qw—water production.
Drawing the intersection chart of injected sand volume–gas/water ratio for the layers where the perforation conclusion is gas layer, gas–water layer, and water layer (Figure 13). As shown in Figure 12, the following conclusions: chart is clearly partitioned, gas–water ratio higher than 3.5 can be identified as a gas layer; less than 3.5 and greater than 0 can be identified as a gas–water layer; equal to 0 can be identified as a water layer, but if there is a situation where the gas production and water production are both 0 m3, we need to evaluate this layer separately based on the well logging data and fracturing.
Substituting the layers with an injected sand volume less than 20 m3 and flowback rate higher than 80% into the chart for inspection and identification, drawing the following inspection chart (Figure 14). It can provide qualitative identification and correction of the fluid type of each perforation section with low sand volume and low flowback rate. Finally, we screen out these poor-quality layers for further explanation and identification.

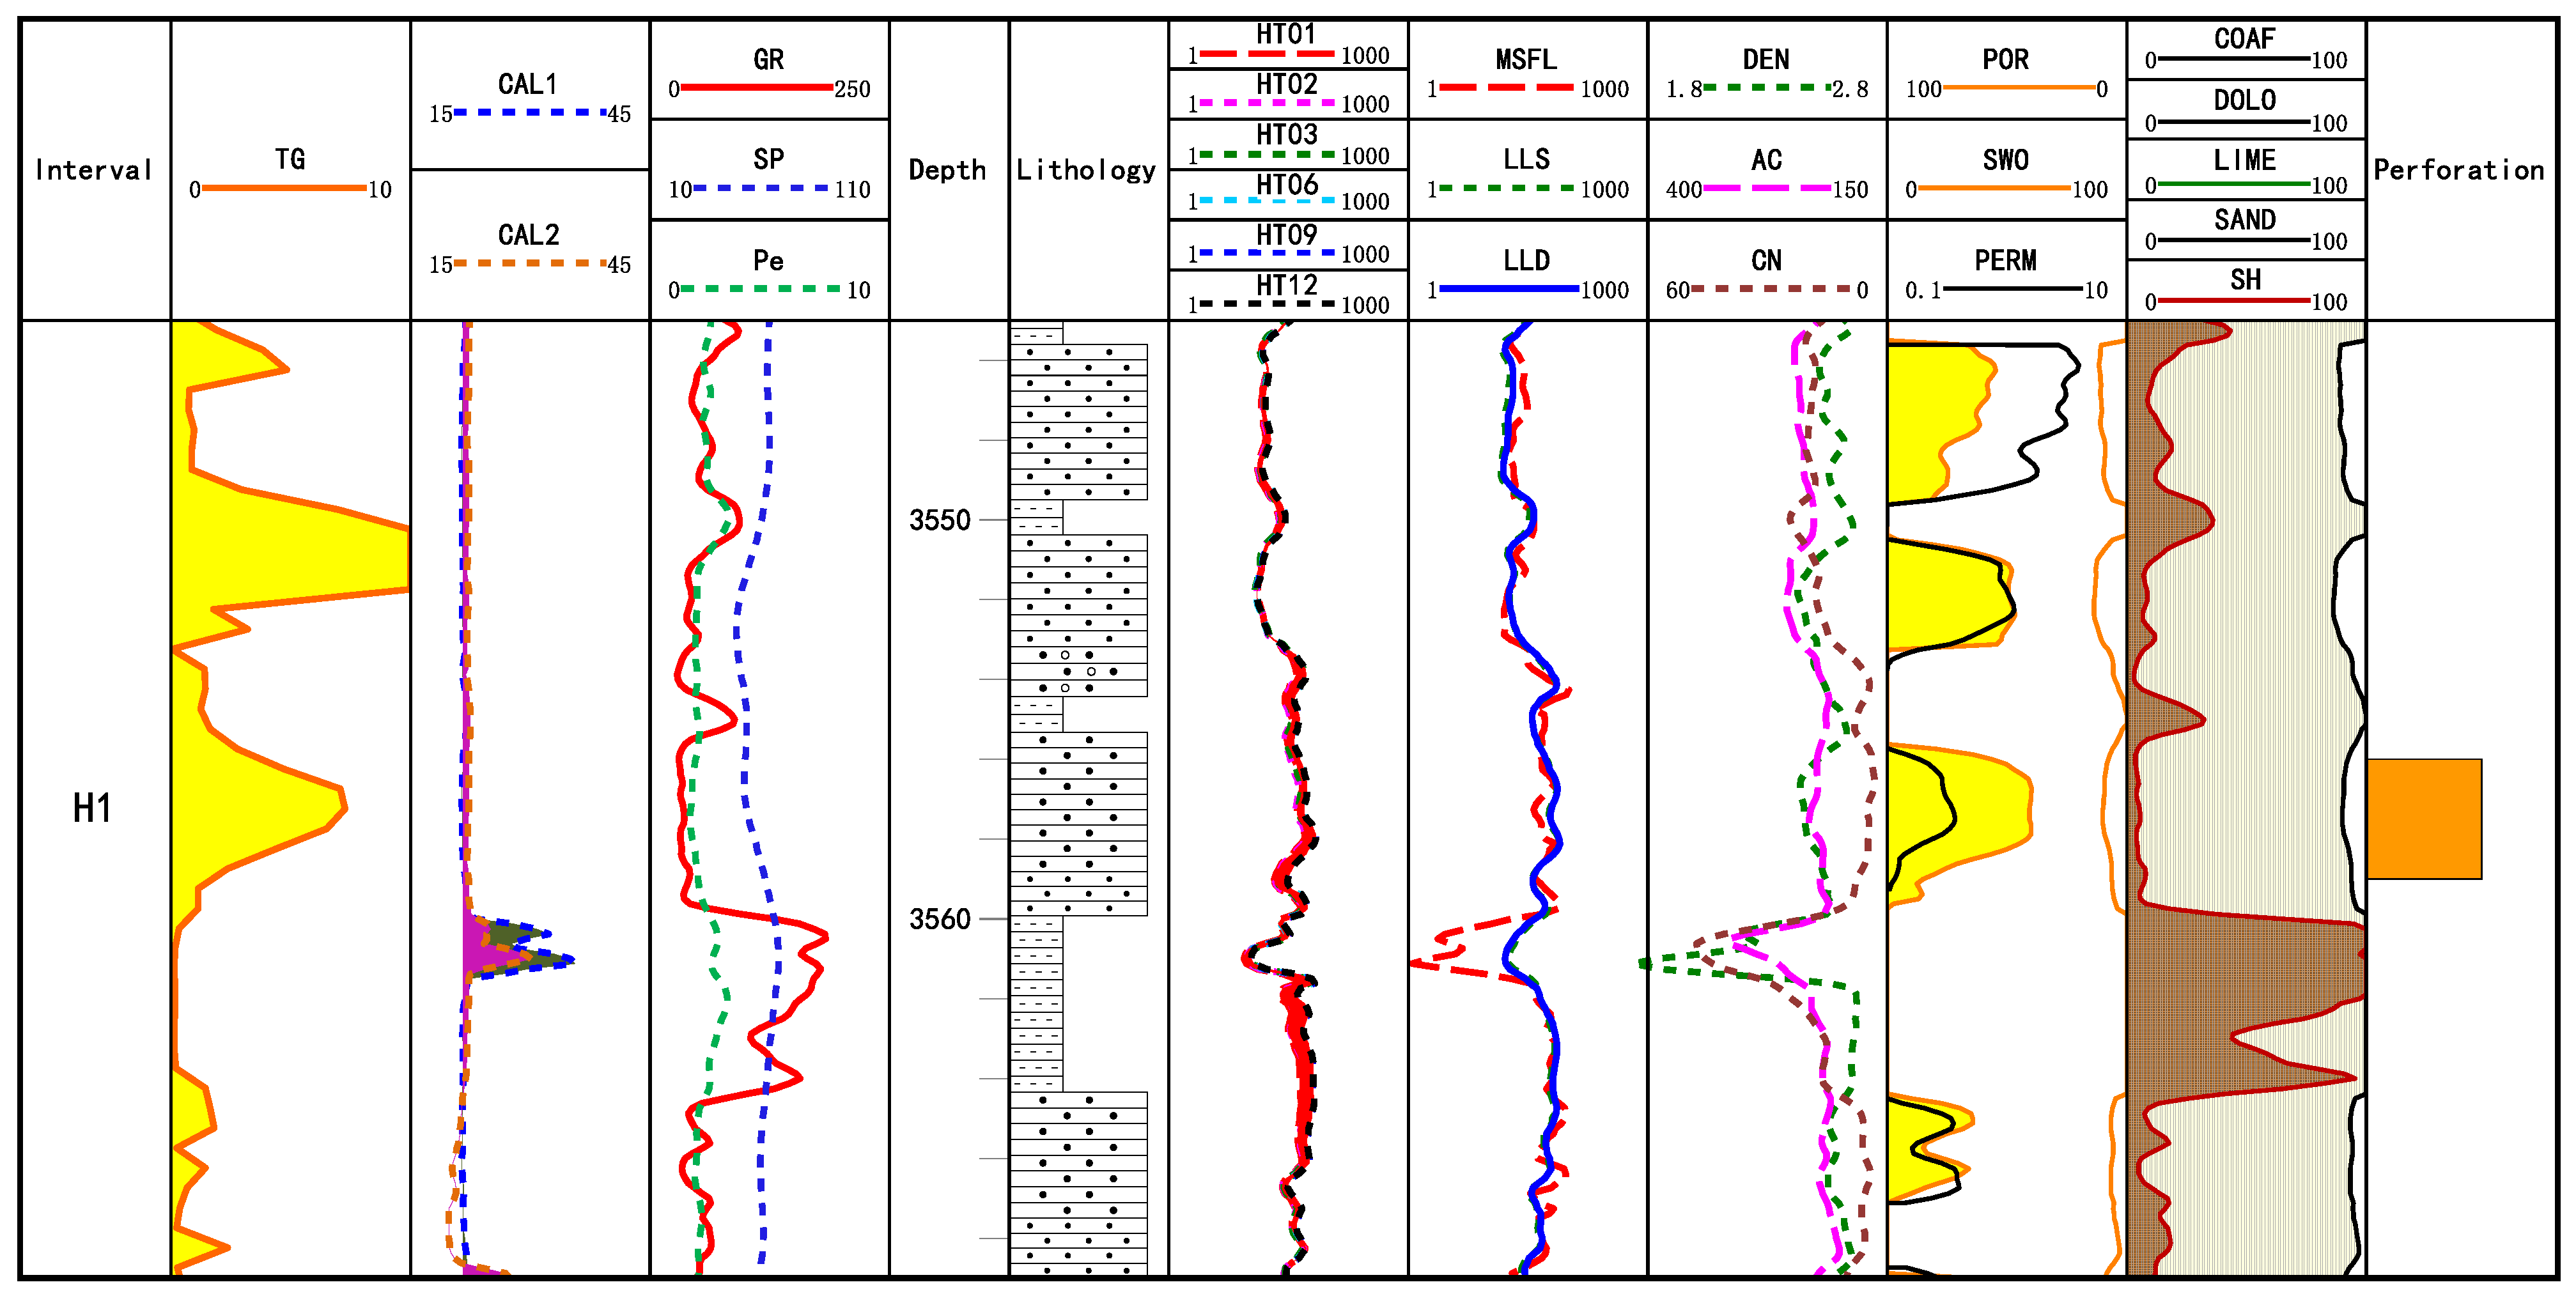
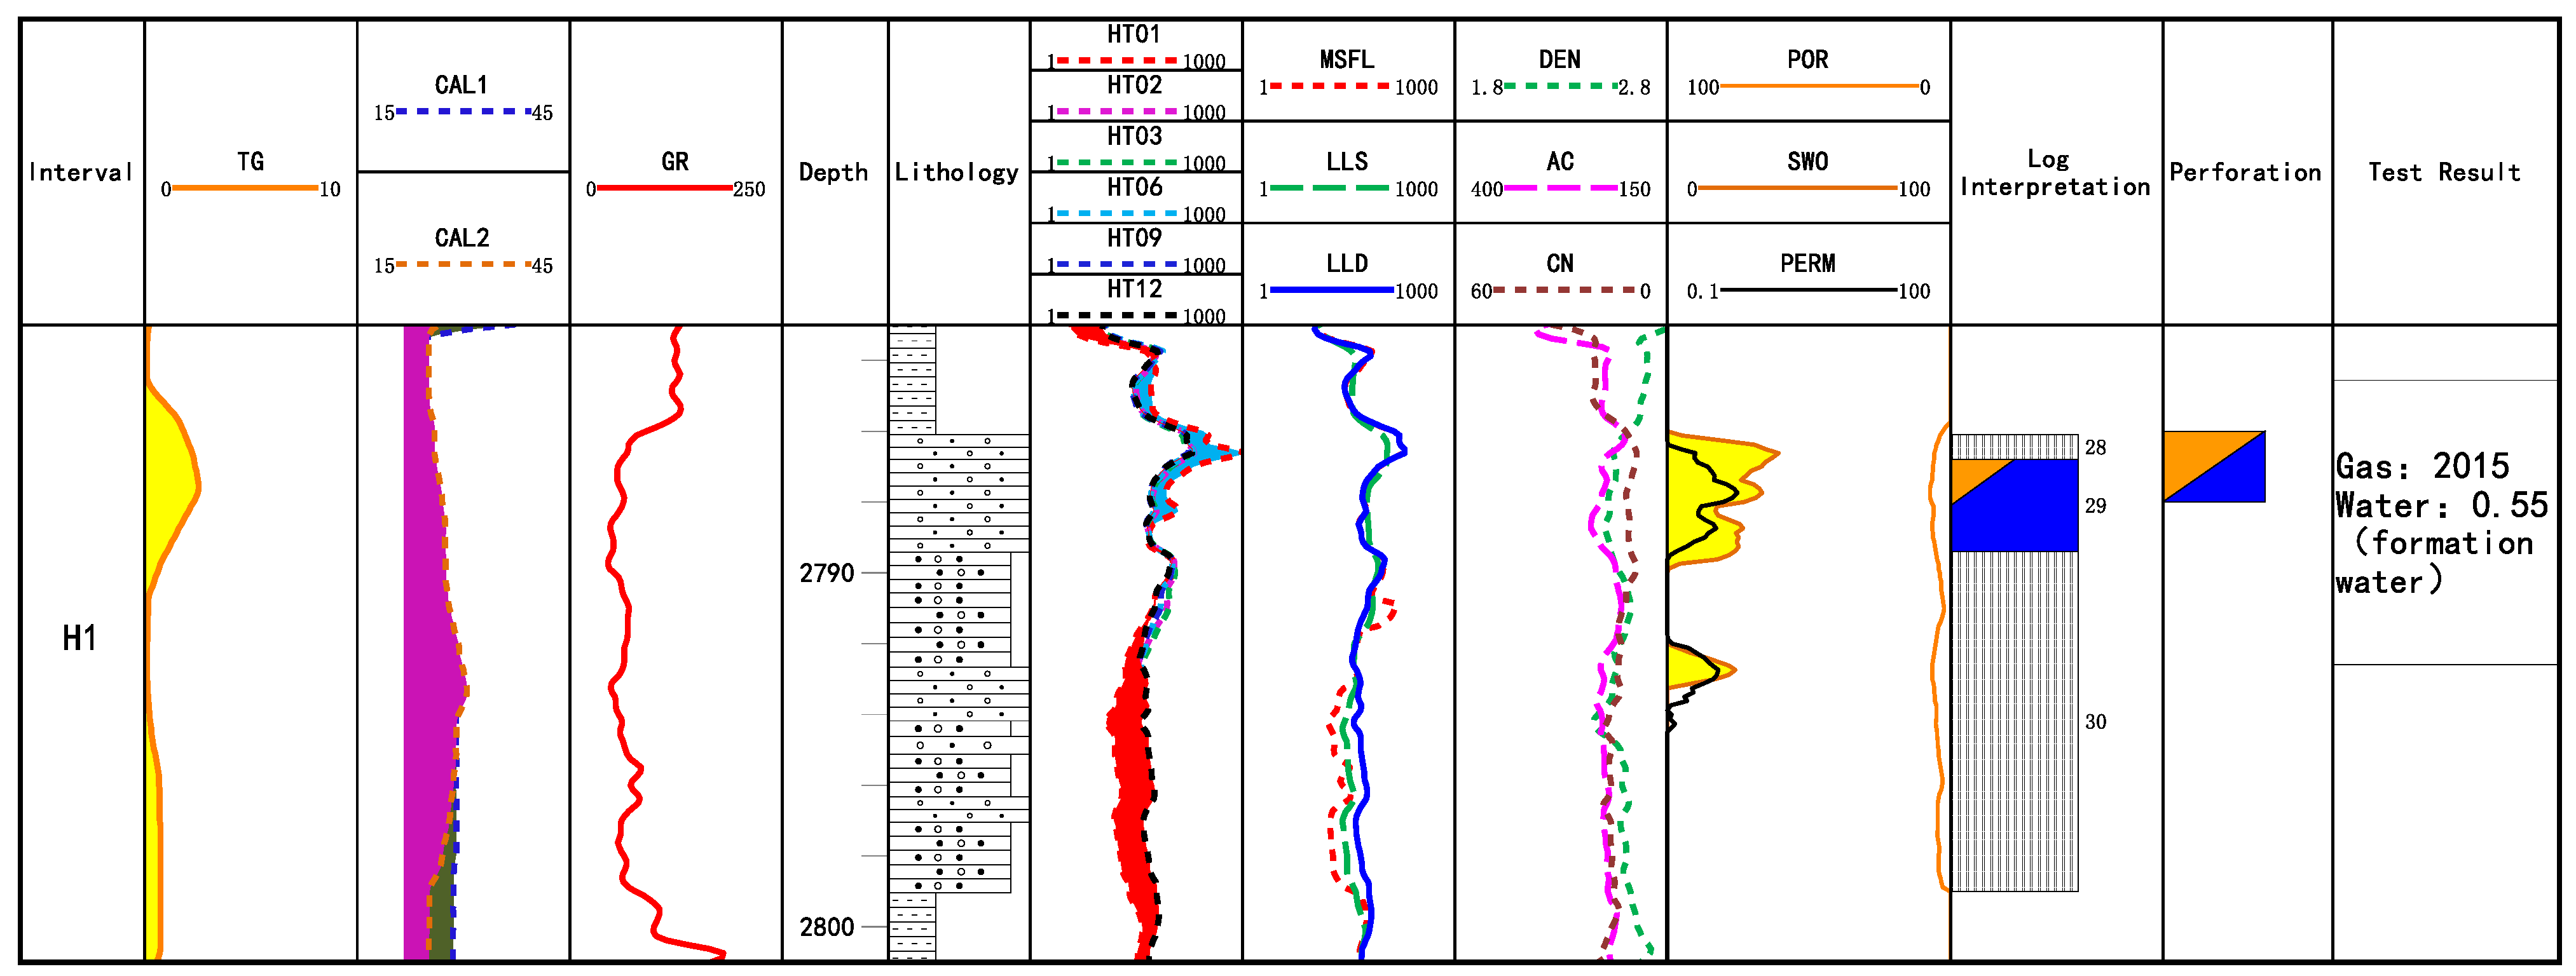
4.3. Test Quality Evaluation of Typical Layers (Examples)

The quality of the test results is judged based on the compliance of the chart. Recheck a total of 70 test layers with sand content less than 20 m3 and flowback rate less than 80%. The gas layers and the gas–water layers are bounded by a gas–water ratio of 3.5, and the water layers are bounded by a gas–water ratio of 0. Then the test results can be divided into three categories: level I (good test quality), level II (average test quality), and level III (low test quality). The review results (Figure 14) are as follows. The recheck results are as follows (Figure 15):
The test results of level I is reliable, and it can be used as the qualitative identification of the gas and water layer of the reservoir. Level II can be fine-tuned in the subsequent development process, but it does not have much impact on the overall development. Level III cannot be used as valid samples for the second logging interpretation conclusion verification. In-depth research needs to be integrated with other logging information. In view of the above three types of test results uncertainty, three typical layers with similar logging responses and sand volume are selected to illustrate the test results.
For the perforated layers of Well X7 (Figure 16), the conclusion of the perforation is gas layers. Due to the multi-layer test, the thickness of the layers is 6 m and 3 m, the average deep lateral resistivity is 27.5 Ω·m and 24.8 Ω·m, and the porosity is 10.2% and 12.2%. The electrical and physical properties are relatively good. During the construction, renovate the reservoir by injecting sand and fracturing, the sand volume is 30.6 m3, and the fracturing fluid completely flowed back. The production is obtained by the method of spraying and discharging, the gas production is 1064 m3, and the water production volume is very low. The gas test productivity of this layer is very good, and it is a typical gas layer after the test results are rechecked. In the follow-up development and production, it has obtained higher gas production. The average daily gas production in this layer is about 2500 m3. According to the conclusion of comprehensive logging interpretation, the test quality of this layer is good.
For the perforated layer of Well X8 (Figure 17), the conclusion of the perforation is a gas layer. The layer thickness of this layer is 4 m, the average deep lateral resistivity is 30 Ω·m, the porosity is 11.1%. The injected sand volume is 28.3 m3 and the working fluid completely flowed back, the test gas production volume is 686 m3, and the water production volume is 6.86 m3. The resistivity and porosity are good, and the test productivity is good as well, and only a small amount of water volume is produced. After rechecking the test results, it should belong to a typical gas–water layer, but the conclusion of perforation is a gas layer. The test quality of this layer belongs to level II. In the subsequent production and development, the development has stopped after the cumulative output of 4553 m3 had been obtained.
For the perforated layer of Well X9 (Figure 18), the conclusion of the perforation is a gas layer. The thickness of this layer is 5 m, the average deep lateral resistivity is 12.1 Ω·m, the porosity is 16.5%. The sand volume is 33.8 m3, the tested gas production volume is 0 m3, and the average daily water production volume is 0.3 m3. This layer is affected by the borehole expansion, the resistivity value of the logging response has a tendency to decrease, and the porosity logging curve increases. The physical properties of the reservoir are good, but the flowback rate of fracturing fluid is extremely low, only 18%. During sand fracturing, the layer should not be compressed. The conclusion of the test is that the layer is still a gas layer. Therefore, the test quality of this layer is poor. After the test result is rechecked, it should belong to the gas–water layer.

5. Conclusions and Discussions

(1)
Some test data of the tight gas reservoirs in the study area are inconsistent with the logging data. Consistent layers are screened out as standard samples with better test quality, and then we establish an identification chart. Then, we mainly carry out the uncertainty analysis of the quality of the test results and the quality classification evaluation for inconsistent layers.
(2)
The main reasons for the poor quality of the test results are as follows: differences in construction parameters (sand volume and flowback rate), poor or unsuccessful test results, incomplete flow-back of the working fluid, and difficulty in determining single-layer test results during multi-layer combined testing.
(3)
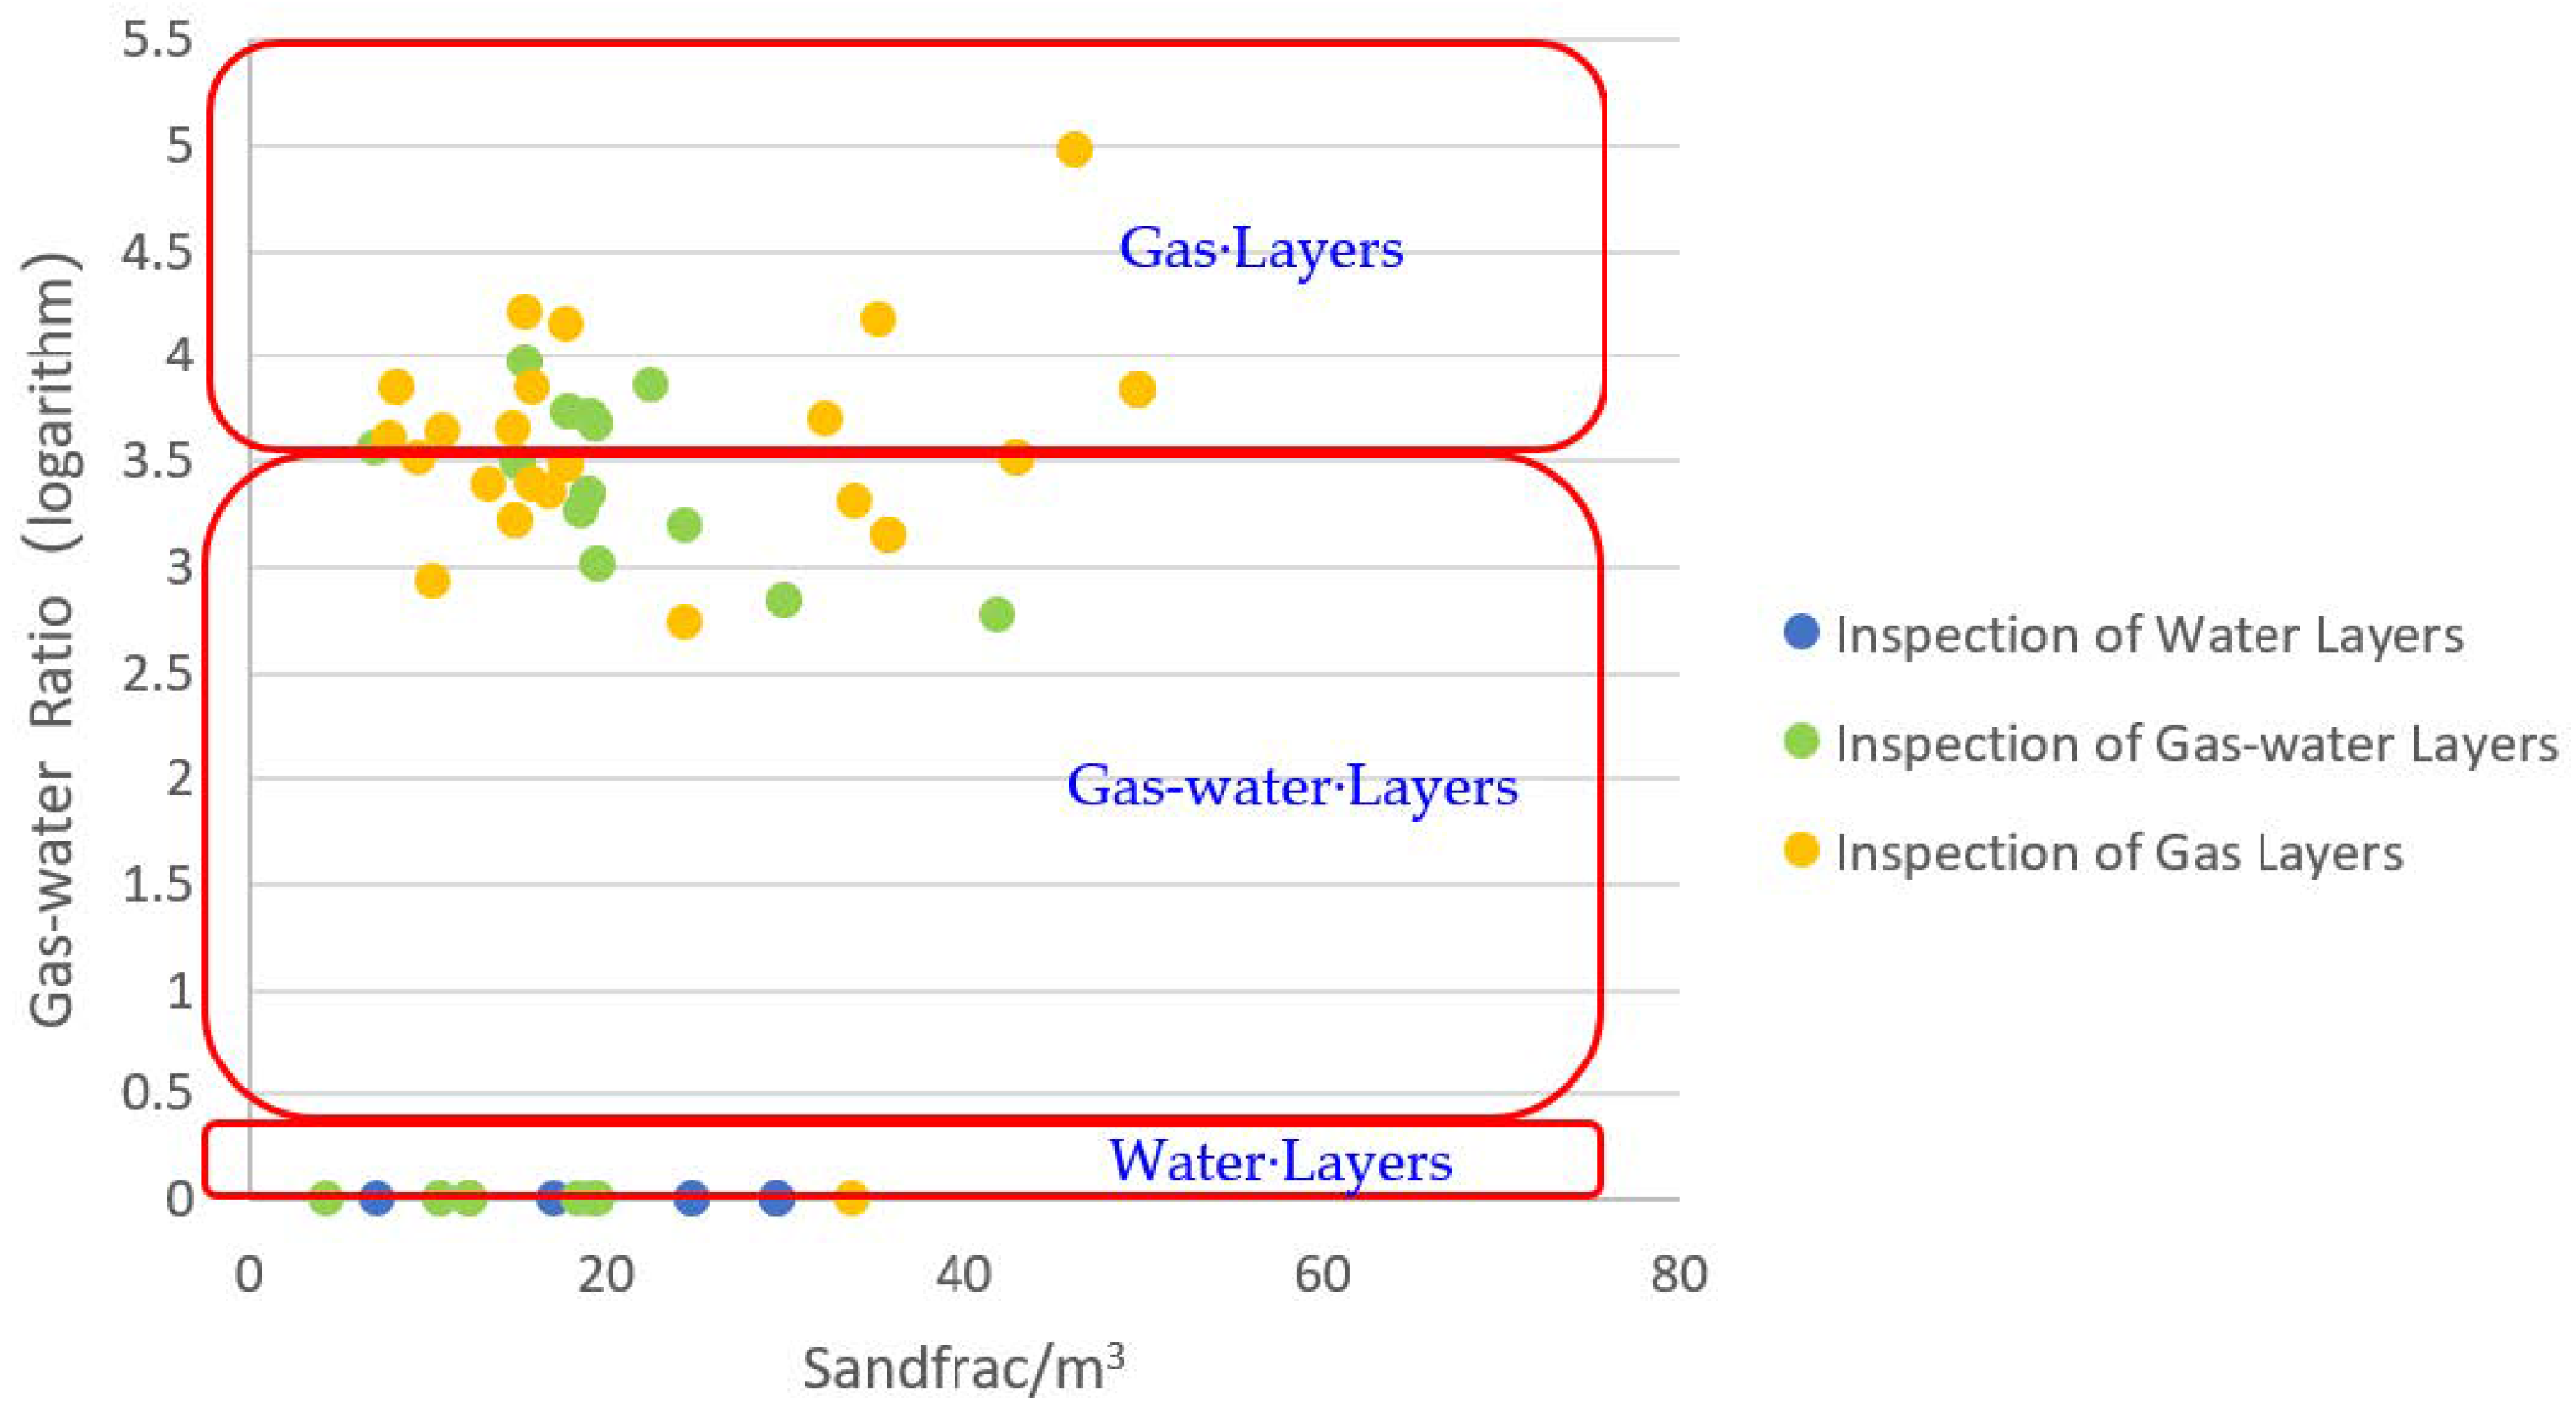
In order to reduce the impact of unreliable test results caused by construction conditions and parameters, a set of judgment standards is proposed. The layer with sand volume higher than 20 m3 and flowback rate higher than 80% has more reliable test quality, which is used as a standard sample for the sand volume–gas/water ratio identification chart to qualitatively identify and correct the fluid type of each perforation section.
(4)
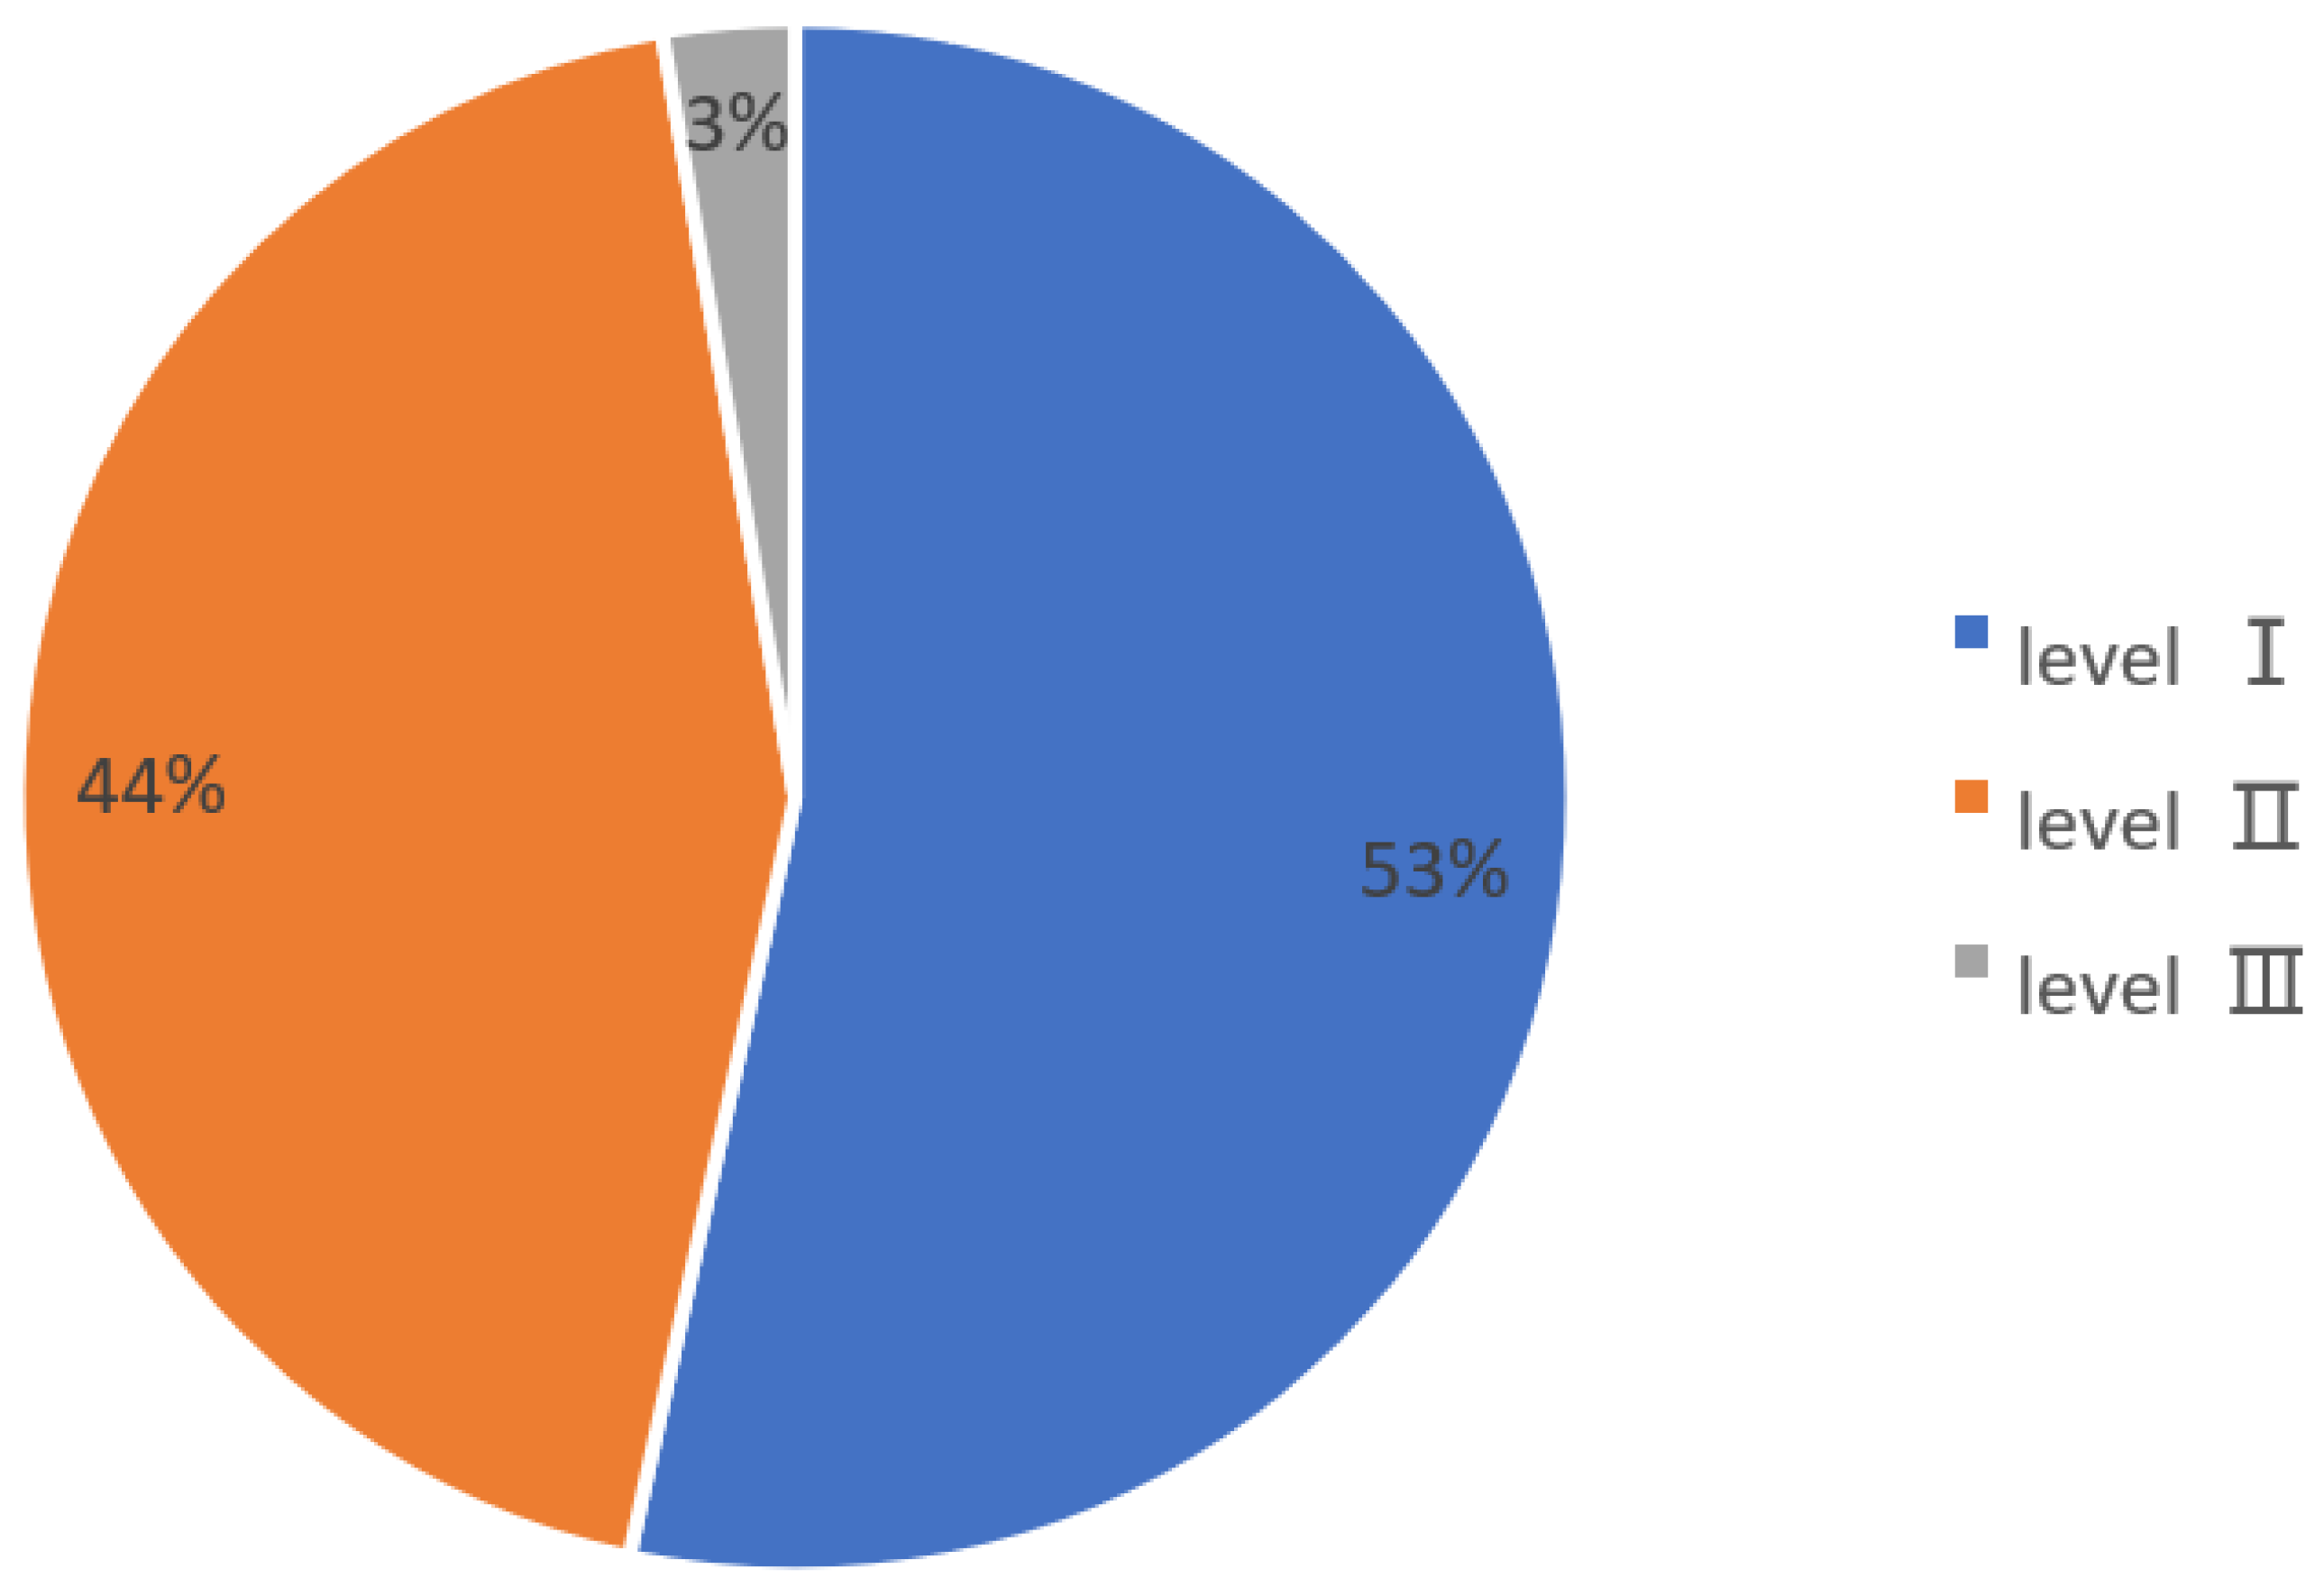
According to different gas test results, in the subsequent production and development process, the gas test conclusion of the layer with the test quality of Level I can be directly used as an effective test sample for the second logging interpretation. For Level II, a comprehensive interpretation must be carried out in conjunction with logging conclusions. Level III gas test conclusions are unreliable, the gas-bearing properties of the reservoir must be explained in combination with other data.
(5)
When verifying the test quality classification method according to the actual production data, the layers with the level I test quality and the level II test quality obtained good production benefits. The gas test conclusion of level III is unreliable. Although the quality of the gas test results is low, the gas-bearing properties of layers are not absolutely bad. These layers also need to be combined with other well data to determine production; otherwise, favorable gas layers may be ignored. At present, none of these level III layers are in production and cannot be verified by actual production data.
(6)
The test quality classification method formed based on the gas–water ratio identification chart can distinguish the pros and cons of the test quality, and provide an effective standard for the inspection of the gas–water identification of the reservoir. However, the specific construction parameters and the operation of the equipment during the gas test also have a certain impact on the judgment of the gas test conclusion. Further, the test conclusions in this study are only divided into three categories: gas layer, gas–water layer and water layer. The gas–water layer can be further divided in the future.

Author Contributions

Methodology, K.L.; software, Z.X.; validation, Y.L., J.H.; formal analysis, Z.X. and X.Z.; investigation, Z.X.; resources, H.D. and J.H.; visualization X.H.; data curation, X.Z.; writing—original draft preparation, Z.X. and K.L.; writing—review and editing, Z.X. and K.L.; supervision, H.D. and Y.L.; funding acquisition, K.L. All authors have read and agreed to the published version of the manuscript.

Funding

The authors are grateful for the Project Supported by the State Key Laboratory of Shale Oil and Gas Enrichment Mechanisms and Effective Development and the National energy shale oil research and Development Center (Grant No. 33550000-20-FW2099-0153).

Institutional Review Board Statement

Not applicable.

Informed Consent Statement

Not applicable.

Data Availability Statement

The study did not report any data.

Conflicts of Interest

The authors declare no conflict of interest.

References

  1. Zou, C.; Yang, Z.; Zhu, R.; Zhang, G.; Hou, L.; Wu, S.; Tao, S.; Yuan, X.; Dong, D.; Wang, Y.; et al. Petro China Research lnstitute of Petroleum Exploration & Development. Acta Geol. Sin. 2015, 89, 979–1007. [Google Scholar]
  2. Zhang, F.; Wang, Z.; Wu, F.; Gao, X.; Luo, R. Dynamic analysis on hydrocarbon migration of accumulation periods in low permeability-tight sandstone reservoir. J. China Univ. Pet. Ed. Nat. Sci. 2012, 36, 32–38. [Google Scholar]
  3. Pang, X.; Zhou, X.; Dong, Y.; Jiang, Z.; Jiang, F.; Fan, B.; Xing, E.; Pang, H. Formation mechanism classification of tight sandstone hydrocarbon reservoirs in petroliferous basin and resources appraisal. J. China Univ. Pet. Ed. Nat. Sci. 2013, 37, 28–37, 56. [Google Scholar]
  4. Hu, W.; Wei, Y.; Bao, J. Development of the theory and technology for low permeability reservoirs in China. Pet. Explor. Dev. 2018, 45, 646–656. [Google Scholar] [CrossRef]
  5. Lin, X.; Zeng, J.; Wang, J.; Huang, M. Natural Gas Reservoir Characteristics and Non-Darcy Flow in Low-Permeability Sandstone Reservoir of Sulige Gas Field, Ordos Basin. Energies 2020, 13, 1774. [Google Scholar] [CrossRef] [Green Version]
  6. Chu, H.; Liao, X.; Dong, P.; Chen, Z.; Zhao, X.; Zou, J. An Automatic Classification Method of Well Testing Plot Based on Convolutional Neural Network (CNN). Energies 2019, 12, 2846. [Google Scholar] [CrossRef] [Green Version]
  7. Zhao, J.; Fu, J.; Yao, J.; Liu, X.; Wang, X.; Wang, H.; Cao, Q.; Wang, X.; Ma, Y.; Fan, Y. Quasi-continuous accumulation model of large tight sandstone gas field in Ordos Basin. Acta Pet. Sin. 2012, 33, 37–52. [Google Scholar]
  8. Pang, X.; Jiang, Z.; Huang, H.; Chen, D.; Jiang, F. Formation mechanisms, distribution models, and prediction of superimposed, continuou hydrocarbon reservoirs. Acta Pet. Sin. 2014, 35, 795–828. [Google Scholar]
  9. Hu, X.; Zhang, G.; Wei, X.; Chen, S.; Li, H.; Liu, B.; Jia, C. Identification of gas-water reservoir and geneses of complicated gas-water relationships in southern region of Hangjinqi Area. J. Northeast Pet. Univ. 2019, 43, 41–48. [Google Scholar]
  10. Zhang, X.; Chen, A.; Dang, N.; Zhang, C.; Zhao, J.; Gao, X.; Lan, Y.; Chen, H. Tectono-sedimentary differentiation of lower Palaeozoic carbonate rock in Ordos basin, NW China and its implications for hydrocarbon-play generation. Carsologica Sin. 2020, 39, 215–224. [Google Scholar]
  11. He, D.; Bao, H.; Sun, F.; Zhang, C.; Kai, B.; Xu, Y.; Cheng, X.; Zhai, Y. Geologic structure and genetic mechanism for the central uplift in the Ordos Basin. Chin. J. Geol. Sci. Geol. Sin. 2020, 55, 627–656. [Google Scholar]
  12. Wang, R.; Wan, Z.; Xie, X.; Zhang, W.; Qin, S.; Liu, K.; Busbey Arthur, B. Clay mineral content, type, and their effects on pore throat structure and reservoir properties: Insight from the Permian tight sandstones in the Hangjinqi area, north Ordos Basin, China. Mar. Pet. Geol. 2019, 115, 104281. [Google Scholar] [CrossRef]
  13. Yang, G.; Huang, W.; Zhong, J.; Sun, N. Occurrence, Classification and Formation Mechanisms of the Organic-Rich Clasts in the Upper Paleozoic Coal-Bearing Tight Sandstone, Northeastern Margin of the Ordos Basin, China. Energies 2020, 13, 2694. [Google Scholar] [CrossRef]
  14. Zhu, Z.; Li, W.; Li, K.; Chen, Q.; Guo, Y.; Yuan, Z. The characteristic of sequence stratigraphy and sedimentary systems of Taiyuan-Xiashihezi formation in Hangjinqi area. J. Northwest Univ. Nat. Sci. Ed. 2010, 40, 1050–1054. [Google Scholar]
  15. Chang, X.; Sun, X.; Yang, M. Dicussing on Division Scheme of Sub-tectonic Units in Hangjinqi Area, Ordos Basin and the Geological Significance. Sci. Technol. Eng. 2013, 13, 8892–8899. [Google Scholar]
  16. Xue, H.; Zhang, J.; Wang, Y.; Xu, B.; Guo, H. Relationship Between Tectonic Evolution and Hydrocarbon in Hangijinqi Block of North Ordos Basin. Geotect. Metal. 2009, 33, 206–214. [Google Scholar]
  17. Liu, Y.; Shi, W.; Liu, K.; Wang, R.; Wu, R. Natural gas accumulation patterns of Upper Paleozoic in eastern Hangjinqi area, Ordos Basin. Lithol. Reserv. 2020, 32, 56–67. [Google Scholar]
  18. Xu, Q.; Shi, W.; Xie, X. Deep-lacustrine sandy debrites and turbidites in the lower Triassic Yanchang Formation, Southeast Ordos Basin, Central China:facies distribution and reservoir quality. Mar. Pet. Geol. 2016, 77, 1095–1107. [Google Scholar] [CrossRef]
  19. Xiong, Y.; Wang, L.; Tan, X.; Liu, Y.; Liu, M.; Qiao, Z. Dolomitization of the Ordovician subsalt Majiagou Formation in the central Ordos Basin, China: Fluid origins and dolomites evolution. Pet. Sci. 2021, 18, 362–379. [Google Scholar] [CrossRef]
  20. Guo, Y.; Li, W.; Guo, B.; Zhang, Q.; Chen, Q.; Wang, R.; Liu, X.; Ma, Y.; Li, Z.; Zhang, M.; et al. Sedimentary systems and palaeogeography evolution of Ordos Basin. J. Palaeogeogr. Chin. Ed. 2019, 21, 293–320. [Google Scholar]
  21. Wang, Z.; Zhou, J. Provenance system and sedimentary evolution model of the second Member of Lower Permian Shanxi Fm in the southeastern Ordos Basin. Nat. Gas Ind. 2017, 37, 9–17. [Google Scholar]
  22. Yin, X.; Jiang, S.; Chen, S.; Wu, P.; Gao, W.; Gao, J.; Shi, X. Impact of rock type on the pore structures and physical properties within a tight sandstone reservoir in the Ordos Basin, NW China. Pet. Sci. 2020, 17, 896–911. [Google Scholar] [CrossRef]
  23. Zhang, G.; Guo, S.; Zhang, S.; Chen, S. Analysis of sedimentary facies the 1st member of lower-Shihezi formation in Daniudi gas field, Ordos basin. J. Northeast Pet. Univ. 2017, 41, 7–8. [Google Scholar]
  24. Zhao, C.; Yu, X.; Fu, C.; Han, X.; Du, Y. Control Factors and Evolution Progress of Depositional system lransiton Trom Imeauen Iy nvel vela to Braided River Delta:Case study of Shan2 member to He8 member, Ordos Basin. Acta Sedimentol. Sin. 2019, 37, 768–784. [Google Scholar]
  25. Li, Z.; Huang, W. Lithofacies characteristics and sedimentary model of braided delta: A case study of He 8 member in the southern Sulige, Ordos Basin. Lithol. Reserv. 2017, 29, 43–50. [Google Scholar]
  26. Aqsa, A.; Shi, W.; Umer, A.; Xu, Q. Channel Identification Using 3D Seismic Attributes and Well Logging in Lower Shihezi Formation of Hangjinqi Area, Northern Ordos Basin, China. J. Appl. Geophys. 2019, 163, 139–150. [Google Scholar]
  27. Duan, Z.; Li, X.; Chen, C.; Ma, L.; Luo, Y. Gas and water distribution and its controlling factors of Xiashihezi Formation in J58 well area, Hangjinqi area. Lithol. Reserv. 2019, 31, 45–54. [Google Scholar]
  28. Dai, J.; Ni, Y.; Wu, X. Tight gas in China and its significance in exploration and exploitation. Pet. Explor. Dev. Online 2012, 39, 277–284. [Google Scholar] [CrossRef]
  29. Bai, D.; Yang, M.; Lei, Z.; Zhang, Y. Effect of tectonic evolution on hydrocarbon charging time: A case study from Lower Shihezi Formation (Guadalupian), the Hangjinqi area, northern Ordos, China. J. Pet. Sci. Eng. 2020, 184, 106465. [Google Scholar] [CrossRef]
  30. Zhang, Q. Application of Three-porosity Overlay Method and Its Difference Value Method in Gas Horizon ldentification of Yongzhujie Gas Field in Baoshan Basin. J. Oil Gas Technol. 2010, 32, 90–93. [Google Scholar]
  31. Mostafa, H.K.; Walid, M.M. Estimation of shale volume using a combination of the three porosity logs. J. Pet. Sci. Eng. 2003, 40, 145–157. [Google Scholar]
  32. Wang, N.; Liu, B.; Zhang, M. Method for the identification of Oil and Gas Reservoir Types with Logging Data—By Taking L Layer of Gas Field A in Indonesia for Example. J. Yangtze Univ. Nat. Sci. Ed. 2016, 13, 4, 36–40, 62. [Google Scholar]
  33. Cheng, X.; Lu, B.; Yu, K.; Dong, Z.; Yu, Z. Description of the complex gas-bearing sandstone reservoir characteristics parameters with conventional logging. Pet. Tubul. Goods Instrum. 2008, 61–64, 103–104. [Google Scholar]
  34. Ghadami, N.; Reza Rasaei, M.; Hejri, S. Consistent Porosity-permeability Modeling. Reservoir Rock Typin and Hydraulic Flow Unitization in a Giant Carbonate Reservoir. J. Pet. Sci. Eng. 2015, 131, 58–69. [Google Scholar] [CrossRef]
  35. Zhu, L.; Ma, Y.; Zhang, C.; Wu, S.; Zhou, X. New parameters for charactering the gas-bearing properties of shale gas. J. Pet. Sci. Eng. 2021, 201, 108290. [Google Scholar] [CrossRef]
  36. Ata, M.; Majid Nabi, B.; Mohsen, M.; Abolghasem, E. Introducing a method for calculating water saturation in a carbonate gas reservoir. J. Nat. Gas Sci. Eng. 2019, 70, 102942. [Google Scholar]
  37. Mostafa, A.; Bassem, S. Petrophysical evaluation of the hydrocarbon potential of the Lower Cretaceous Kharita clastics, North Qarun oil field, Western Desert, Egypt. J. Afr. Earth Sci. 2016, 121, 62–71. [Google Scholar]
  38. Liang, Z.; Cheng, Z.; Dong, X.; Hu, T.; Pan, T.; Jia, C.; Guan, J. A method to predict heterogeneous glutenite reservoir permeability from nuclear magnetic resonance (NMR) logging. Arab. J. Geosci. 2021, 14, 453. [Google Scholar] [CrossRef]
  39. Mohammad, H.; Ezatallah, K.; Ali, M.; Ali, M. Determining the gas and oil contact through wavelet analysis on nuclear magnetic resonance log data. J. Appl. Geophys. 2019, 168, 79–89. [Google Scholar]
  40. Zhang, Y.; Wu, J.; Zhu, G. NMR logging activation sets selection and fluid relaxation characteristics analysis of tight gas reservoirs: A case study from the Sichuan Basin. Nat. Gas Ind. B 2018, 5, 319–325. [Google Scholar] [CrossRef]
  41. Hu, F.; Zhou, C.; Li, C.; Xu, H.; Zhou, F.; Si, Z. Water spectrum method of NMR logging for identifying fluids. Pet. Explor. Dev. Online 2016, 43, 268–276. [Google Scholar] [CrossRef]
  42. Parchekhari, S.; Nakhaee, A.; Kadkhodai, A.; Khalili, M. Predicting the impact of hydrocarbon saturation on T2 distribution curve of NMR logs–A case study. J. Pet. Sci. Eng. 2021, 204, 108650. [Google Scholar] [CrossRef]
  43. Shi, W.; Wang, X.; Shi, Y.; Feng, A.; Zou, Y.; Steven, Y. Application of Dipole Array Acoustic Logging in the Evaluation of Shale Gas Reservoirs. Energies 2019, 12, 3882. [Google Scholar] [CrossRef] [Green Version]
  44. Li, N. Study on Fracturing Effect Evaluation Method of Low Porosity and Permeability Reservoir. J. Innov. Soc. Sci. Res. 2019, 6. [Google Scholar]
  45. Tang, H.; Whie, C.D. Mutivariate Statistical Log Log-faces Clssfication on a Shall Maine Reservoir. J. Pet. Sci. Eng. 2008, 61, 88–93. [Google Scholar] [CrossRef]
  46. Mlandal, R.P.; Rezaee, R. Facies classification with different machine learning algorithm—An efficient artificial intelligence technique for improved classification. ASEG Ext. Abstr. 2019, 2019, 1–6. [Google Scholar]
  47. Nadege, B.-F.; Laura, L.; Vicoria, B. Using Mlachine-earming for Depostional facies Prediction in a Complex Carbonate Reservoir. In Proceedings of the SPWLA 59th Annual Logging Symposium, London, UK, 2–6 June 2018. [Google Scholar]
  48. AI-Anazi, A.; Gates, I.D. A Suppor Vector Machine AIgorthim to Classif Litofacies and Model Permeability in Heterogeneous Reservoirs. Eng. Geol. 2010, 114, 267–277. [Google Scholar] [CrossRef]
  49. Xing, C.; Yin, H.; Liu, K.; Li, X.; Fu, J. Well Test Analysis for Fractured and Vuggy Carbonate Reservoirs of Well Drilling in Large Scale Cave. Energies 2018, 11, 80. [Google Scholar] [CrossRef] [Green Version]
  50. Awotunde, A.A. Estimation of well test parameters using global optimization techniques. J. Pet. Sci. Eng. 2015, 125, 269–277. [Google Scholar] [CrossRef]
  51. Murdoch, L.C.; Germanovich, L.N.; Roudini, S.; DeWolf, S.; Hua, L.; Moak, R. A Type-Curve Approach for Evaluating Aquifer Properties by Interpreting Shallow Strain Measured During Well Tests. Water Res. Res. 2021, 57, e2021WR029613. [Google Scholar] [CrossRef]
  52. Pan, H. Research on optimization of single well testing workload and efficiency. E3S Web Conf. 2021, 236, 02009. [Google Scholar]
  53. Palyanitsina, A.; Akhmedova, A. Optimization of transient well test technology for low permeability complex reservoir. J. Phys. Conf. Ser. 2021, 1728, 012016. [Google Scholar] [CrossRef]
  54. Jiang, J.; Sun, J.; Gao, J.; Shao, W.; Chi, X.; Chai, X. Numerical Simulation of Mud Invasion Around the Borehole in Low Permeability Reservoir and a Method for Array Induction Log Resistivity Correction. J. Jilin Univ. Earth Sci. Ed. 2017, 47, 265–278. [Google Scholar]
  55. Liu, Y.; Chen, W.; Zhang, S.; Shi, D.; Zhu, M. Assessment of gas production and electrochemical factors for fracturing flow-back fluid treatment in Guangyuan oilfield. Environ. Eng. Res. 2019, 24, 521–528. [Google Scholar] [CrossRef] [Green Version]
  56. Wang, M.; Juliana, Y.L. Numerical investigation of fluid-loss mechanisms during hydraulic fracturing flow-back operations in tight reservoirs. J. Pet. Sci. Eng. 2015, 133, 85–102. [Google Scholar] [CrossRef]
  57. Ali, Y.J.; Abdulaziz, M.A. Influences of uncertainty in well log petrophysics and fluid properties on well test interpretation: An application in West Al Qurna Oil Field, South Iraq. Egypt. J. Pet. 2019, 28, 383–392. [Google Scholar]
  58. Xia, D.; Yang, Z.; Li, D.; Zhang, Y.; Zhao, X.; Yao, L. Research on numerical method for evaluation of vertical well volume fracturing effect based on production data and well test data. J. Pet. Explor. Prod. 2021, 11, 1855–1863. [Google Scholar]
  59. Zhang, L.; Liu, X.; Zhang, Y. Fracturing sensitivity analysis of shale gas reservoir based on orthogonal experimental design. Unconv. Oil Gas. 2021, 8, 77–86. [Google Scholar]
  60. Li, Z. Research and Application of Deep Well Oil and Gas Testing Technology. China Pet. Chem. Stand. Qual. 2021, 41, 174–175. [Google Scholar]
  61. Yang, H.; Li, J.; Shi, X.; Zhu, J.; Deng, C.; Wang, D. Characteristics and significance of flow-back processes after fracturing in shale-gas reservoirs. J. China Univ. Pet. Ed. Nat. Sci. 2019, 43, 98–105. [Google Scholar]
  62. Fu, H. Pressure Behavior of the Multiple Fractured Horizontal Well Considering Fracturing Fluid Incompletely Flowback; China University of Petroleum: Beijing, China, 2017. [Google Scholar]
  63. Jiang, P.; Wang, W.; Li, J.; Wang, F.; Zhou, Y.; Liu, Y. Pressure control flowback technology for shallow shale gas wells: Taking Zhaotong National Shale Gas Demonstration Area as an example. Nat. Gas Ind. 2021, 41, 186–191. [Google Scholar]
  64. Huang, X.; Han, Y.; Yang, Q.; Zhou, Y.; Yuan, X.; Liu, Y. Gas Testing Flowback Rules of Shallow Shale Gas Horizontal wells in TY Block of Zhaotong. Xinjiang Pet. Geol. 2020, 41, 457–463. [Google Scholar]
  65. Jia, C.; Jia, A.; He, D.; Wei, Y.; Qi, Y.; Wang, J. Key factors influencing shale gas horizontal well production. Nat. Gas Ind. 2017, 37, 80–88. [Google Scholar]
  66. Zhang, W.; Guo, B.; Chen, L.; Qiu, S. Fracturing Practice Knowledge and Analysis of Postfrac Production Affecting Factors in 3# Coal Seam South of Qinshui Basin. Coal Technol. 2021, 40, 36–39. [Google Scholar]
  67. Hu, J.; He, S.; Li, Y.; Zhao, J.; Cui, L. Numerical Simulation of Productivity of Fractured Gas Well with Flowback Considered. Oil Field Equip. 2008, 5, 36–39. [Google Scholar]
Figure 1. Structural map of the Northern Ordos.
Energies 14 06991 g001
Figure 2. Gas layer identification flowchart.
Energies 14 06991 g002
Figure 3. Consistency of test data and logging data.
Energies 14 06991 g003
Figure 4. Inconsistent test data and logging data.
Energies 14 06991 g004
Figure 5. Log interpretation results of Well X3.
Energies 14 06991 g005
Figure 6. Log interpretation results of Well X4.
Energies 14 06991 g006
Figure 7. Log interpretation results of Well X2.
Energies 14 06991 g007
Figure 8. Log interpretation results of Well X5.
Energies 14 06991 g008
Figure 9. Log interpretation results of Well X4.
Energies 14 06991 g009
Figure 10. Statistical graphs of the flowback rate of perforation section of different fluid types. (a) gas layers, (b) gas and water layers, (c) water layers, (d) total perforation section.
Energies 14 06991 g010aEnergies 14 06991 g010b
Figure 11. Log interpretation results of Well X6.
Energies 14 06991 g011
Figure 12. Relationship between sand injected volume and gas/water production. (a) sand injected volume and gas production in gas layers, (b) sand injected volume and water production in gas and water layers, (c) sand injected volume and gas production in gas and water layers, (d) sand injected volume and water production in water layers.
Energies 14 06991 g012
Figure 13. Identification chart of sand injected volume/gas–water ratio.
Energies 14 06991 g013
Figure 14. Identification chart of injected sand volume/gas–water ratio (the injected sand volume is less than 20 m3 and the flowback rate is less than 80%).
Energies 14 06991 g014
Figure 15. Rechecked test results.
Energies 14 06991 g015
Figure 16. Log interpretation results of Well X7.
Energies 14 06991 g016
Figure 17. Log interpretation results of Well X8.
Energies 14 06991 g017
Figure 18. Log interpretation results of Well X9.
Energies 14 06991 g018
Publisher’s Note: MDPI stays neutral with regard to jurisdictional claims in published maps and institutional affiliations.

