Article

Energy and Emission Implications of Electric Vehicles Integration with Nearly and Net Zero Energy Buildings

1
VTT Technical Research Centre of Finland Ltd., P.O. Box 1000, FI-02044 Espoo, Finland
2
VITO, Boeretang 200, B-2400 Mol, Belgium
3
EnergyVille, Thor Park 8310, B-3600 Genk, Belgium
4
Faculty of Applied Engineering, University of Antwerp, Groenenborgerlaan 171, B-2020 Antwerpen, Belgium
*
Author to whom correspondence should be addressed.
Energies 2021, 14(21), 6990; https://doi.org/10.3390/en14216990
Submission received: 21 September 2021 / Revised: 17 October 2021 / Accepted: 21 October 2021 / Published: 25 October 2021
(This article belongs to the Special Issue Energy Efficiency Improvement Measures in Buildings)

Abstract

:
Buildings and the mobility sectors are the two sectors that currently utilize large amount of fossil-based energy. The aim of the paper is to, critically analyse the integration of electric vehicles (EV) energy load with the building’s energy load. The qualitative and quantitative methods are used to analyse the nearly/net zero energy buildings and the mobility plans of the Europe along with the challenges of the plans. It is proposed to either include or exclude the EV load within the building’s energy load and follow the emissions calculation path, rather than energy calculation path for buildings to identify the benefits. Two real case studies in a central European climate are used to analysis the energy performance of the building with and without EV load integration and the emissions produced due to their interaction. It is shown that by replacing fossil-fuel cars with EVs within the building boundary, overall emissions can be reduced by 11–35% depending on the case study. However, the energy demand increased by 27–95% when the EV load was added with the building load. Hence, the goal to reach the nearly/net zero energy building target becomes more challenging. Therefore, the emission path can present the benefits of EV and building load integration.

Graphical Abstract

1. Introduction

The European Union (EU) plans to limit and reduce emissions in order to curb the impact on the climate and reduce climate change. According to the EU’s 2030 climate and energy framework, the target is to reduce emissions by 55% compared to 1990 levels, increase energy efficiency by 32.5% and increase the share of renewables by 32% [1]. To achieve these targets, buildings have to be energy efficient and use a signification amount of locally generated renewable energy. Apart from energy efficiency measures, flexibility of a building’s energy use can assist in reducing operational costs, lower carbon emissions and support the operation of connected energy grids. To avoid curtailing renewable energy source (RES) when the grid is congested and reduce feed-in tariffs, buildings have to be flexible to manage energy consumption, thereby increasing the self-consumption of locally generated energy.
In many districts, cities and regions, buildings are nowadays designed to be nearly zero energy or net zero energy in order to achieve emission reduction targets and to mitigate climate change [1]. The EU, through the Energy Performance of Buildings Directive (EPBD) initiated in 2002 [2], as adopted in 2006 and updated in 2010 [3] and 2018 [4] and the revised EPBD aims to make all newly-constructed or heavily-renovated buildings adhere to a “nearly zero energy building NZEB” target as of 2021. The policy goal is to decarbonise the whole building stock by 2050. The European EPBD regulation is pushing to improve building efficiency, e.g., by imposing performance measures on new buildings and standardised information provision for existing buildings and the renovation of old buildings (e.g., through information provisions, such as energy performance certificates). The EPBD is a framework at the European level, while the implementation is to be detailed at member state (MS) level. Procedures, calculations and definitions differ greatly among EU MS due to local contexts and policy preferences. These calculations are generally based on the ISO EN 52000 series of standards, which defines a framework and calculations methods for assessing the energy performance of buildings [5]. Amongst others, the EPBD requires the construction of NZEB buildings as of 2021 (2019 for new public buildings), but the definition of ‘nearly zero energy’ is flexible and is to be specified by MS in their adoption of the Directive. MS are required to base the NZEB definitions on a techno-economic optimality analysis, also considering local specificities such as climate and primary energy conversion factors depending on local energy mixes [6,7]. As the assessment of ‘nearly zero energy’ buildings is at present most often based on calculated performance rather than actual measured data, the definition of the energy flows considered and the boundary conditions will affect the score. The assessment score can be positively affected if few energy loads are excluded and considered outside the boundary in the calculations. In this condition, the assessment will present a building to be energy efficient as the total energy demand will be low. On the other hand, the score can be negatively affected if some energy loads outside the building boundary are included in the calculations, as in this condition, the total energy demand of the building will increase and the building will appear to be inefficient and possibly not NZEB. Therefore, identification of energy flows and boundary is important. One of the energy flows which is most often omitted from NZEB definitions is the energy required for charging electric vehicles. Similarly, the nearly or zero energy building concept has received interest at political and international levels. For instance, the United States introduced the Energy Independence and Security Act of 2007 (EISA 2007) to support the building sector to establish zero energy commercial buildings. From 2010, new or renovated buildings have had to reduce fossil fuel-based energy consumption by 55% compared to 2003 levels. In addition, from 2030 onwards fossil-based energy consumption will have to be reduced by 100% compared to 2003, thus reaching a zero energy building target [8,9].
Increasing energy efficiency measures, such as using better thermal insulation in the building envelope or more efficient heating, ventilation and air conditioning (HVAC) systems, is the first step to apply in order to reduce overall energy demand. Next, on-site RES are deployed to deliver energy, thereby reducing carbon emissions [10]. Solar energy is the biggest RES source in the EU’s building sector, and can produce emission-free energy both in the form of heat and electricity [11,12]. Traditionally, solar energy is used either to deliver heating energy using a solar thermal (ST) collector or to produce electricity using photovoltaic (PV) panels. A hybrid system known as a photovoltaic-thermal (PV/T) system combines both functions, thus producing both heat and electricity [13]. However, PV is mostly used in buildings because of ease of installation, maintenance and lower price compared to other technologies [14,15]. Various studies report that these RES can cover the remaining energy demands to a large extent, e.g., providing 77% of the electricity demand of a Swedish case study building equipped with heat pumps and storage, or 61% of another Swedish case study where the PV system was integrated with heat storage [16]. Many studies show that the issue with the utilisation of PV is the mismatch between the demand of the building and the supply of energy from PV in northern and central Europe [17]. In these areas, electricity from PV is generated during the daytime or during summer, while the building’s demand is high during the evening or in winter, when PV does not produce enough electricity [18]. This issue can be solved by different methods, for instance: the excess energy produced by the photovoltaic can be stored in batteries, converted to heat, sold to the grid, or used to charge electric vehicles (EV) [14].
EV charging can have a large impact on the overall electricity demand of a building, whether it is a normal or NZEB design [19]. If the aim is to have a net zero annual energy balance (Net ZEB) and/or NZEB, the increased energy demand will have to be compensated by additional on-site RES. This might not be possible, as for example for PV, limiting factors can be the available roof size with a favourable orientation, a maximum installed capacity allowed by the local regulatory context, or economic investment limitations. A study carried out in Sweden [20] shows that when an EV is integrated with a net zero energy building with 25 m2 PV, it will require the PV to increase to 34 m2 to maintain net zero energy building status, because the demand of the building increases from 4.17 MWh/a to 5.7 MWh/a. In another study, the calculation shows that when EVs are integrated with the building, the solar fraction reduced by 20% and the house is no longer a net zero energy building [21]. If well integrated, EVs can be beneficial to the building operation, e.g., using smart charging to support maximisation of the self-consumption of RES and bidirectional charging. For example, a study [22] proposes using EVs as storage devices to address the intermittent nature of renewable energy generation. Another study shows that if EVs are included within building boundary, on-site energy matching can be increased [23].
In the definition of NZEB in EPBD-2010 [3], there is no preparatory requirement for vehicles in buildings. According to MS national building codes, each country decided which loads are included in the calculations. Other policies at an EU, national and regional level focus specifically on the mobility sector, which contributes around 27% of the total greenhouse gas emissions in the EU [24,25]. Therefore, to address this issue many cities and districts developed their policies and plans to reduce emissions caused by transportation [26]. Apart from aiming for a modal shift to public transport or bikes, a common strategy is to replace petrol- or diesel-powered vehicles with electric vehicles [27]. By 2018, it increased to over five million [28]. Moreover, it is expected that by 2030, the number of EVs would increase to up to 44 million [29]. A holistic approach is therefore needed to address the increased penetration of EVs in society.
According to the new amendment of the EPBD in 2018 [4], electric vehicle charging ducting for residential and non-renovated buildings that are subjected to major renovation are included in the NZEB requirements. In the future, buildings should consider the infrastructure required to support electric vehicle charging in the building’s design on a large scale. These new regulations, however, do not stipulate any update of EV-related energy flows in the definition and protocols for the calculation of energy performance certificates or defining NZEB standards. Furthermore, there are some other ambiguities in the EPBD 2018 amendment on the specifications of EV integration. For example, the ‘car park’ location is not specified, so it remains unclear to what extend ducting requirements apply when the parking is not in the building but adjacent to it or at a distance [30]. The requirements for electrical infrastructure do not specify whether the infrastructure includes the building and EV charging wiring together or separately. The ownership of the charging infrastructure is not clear either. Some recommendations that can be included in the EPBD and in the national regulations according to the Commission recommendations on buildings modernisation include [30]: accessibility requirements of charging points for the public and for people with disabilities, ducting specifications, fire safety requirements, smart metering requirements, vehicle to grid requirements, charging prices requirements, and consumer choice for electricity supplier requirements, especially for EV charging.
With the integration of many components, especially buildings and electric mobility, there is a shift in terms of transport energy on the building’s energy meters [31]. Due to the addition of EVs charging energy from the building’s energy meters, there are issues when comparing an NZEB or Net ZEB with and without EVs. Moreover, the building policy [4] and electricity-based mobility plans [32] show that the building and mobility sectors are considered separately. The higher penetration of EVs is for the purpose of emission reduction; however, with the integration of EVs in the building, the building’s primary energy use increases, resulting in a lower efficiency level of the building. Therefore, new methods are needed to show the advantage of integrating EVs with buildings. Moreover, studies that involve on-site measurements are required to argue about the concept of NZEB or Net ZEB with the inclusion or exclusion of EVs.
A novel approach is, therefore, needed to address the issues emerging from EV integration with buildings. The novelty and the research gap that is addressed in the paper are:
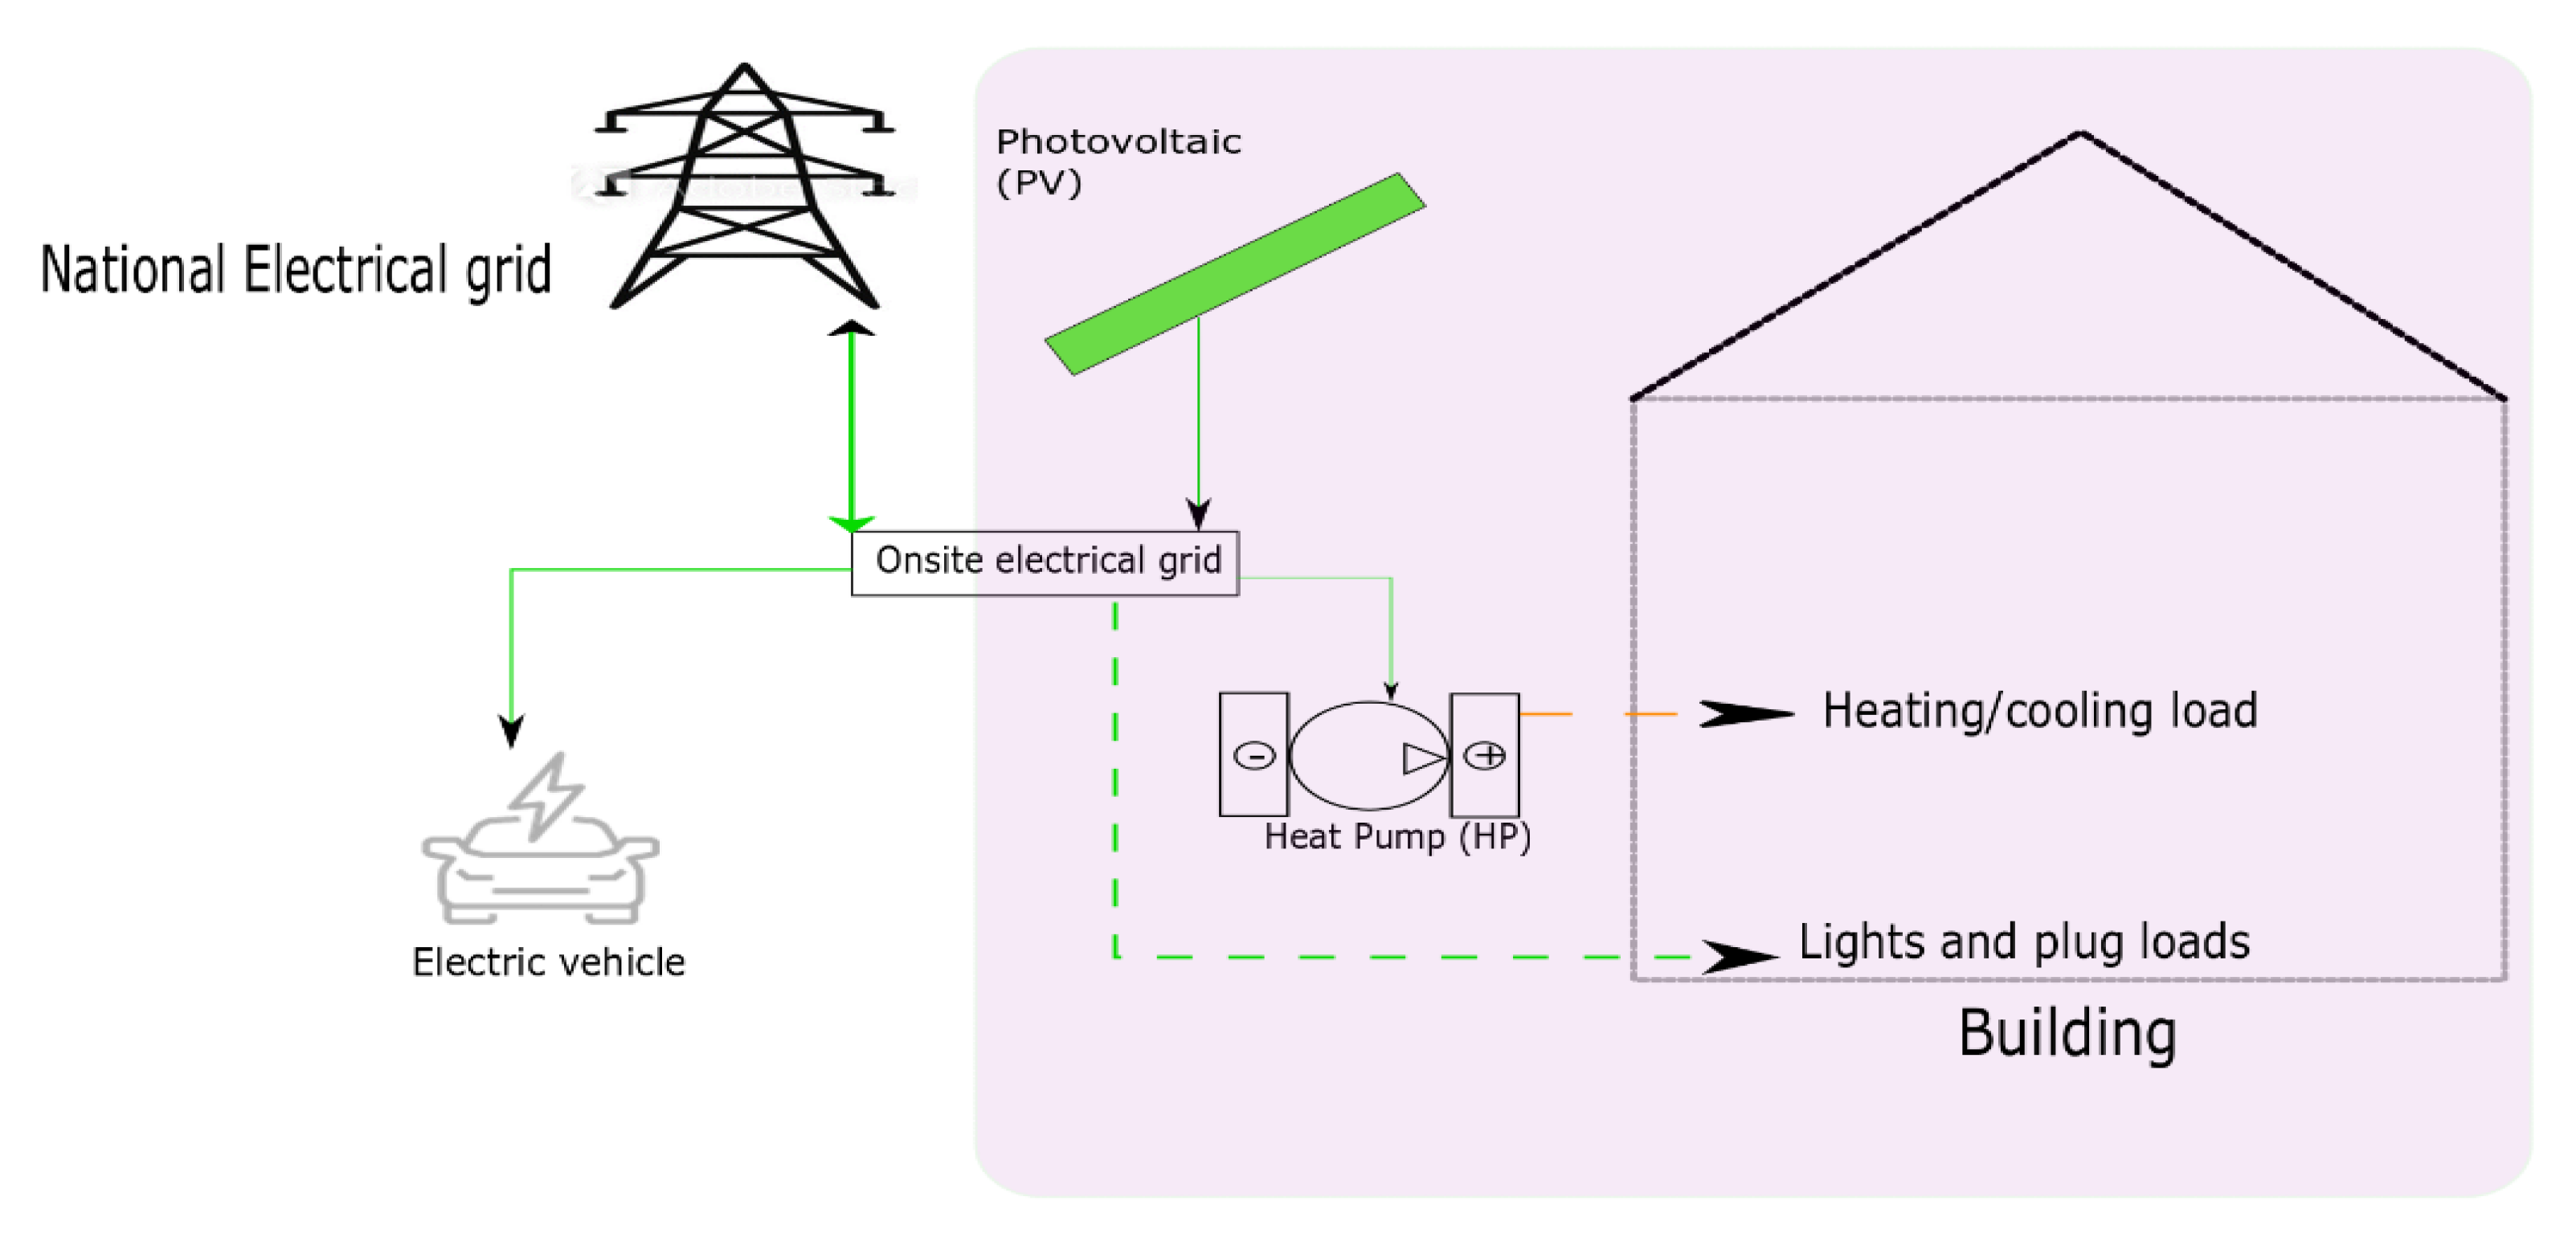
  • There is a shift of mobility energy in terms of the building’s energy meters. A gap exists in the methods of integrating the buildings and EVs due to the addition of EVs’ charging energy from the building’s energy meters [31]. Synchronisation is needed to support the energy efficiency of building and e-mobility integration. With the integration of EVs in a building, the primary energy use increases, resulting in lower performance levels of the building. However, new methods are needed to show the advantage of integrating EVs with buildings and replacing fossil fuel-based cars, especially in terms of emissions. These novel methods are proposed in the paper.
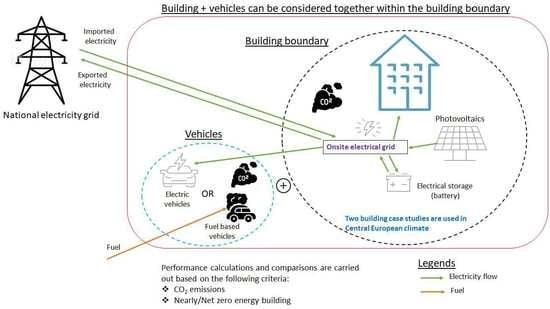
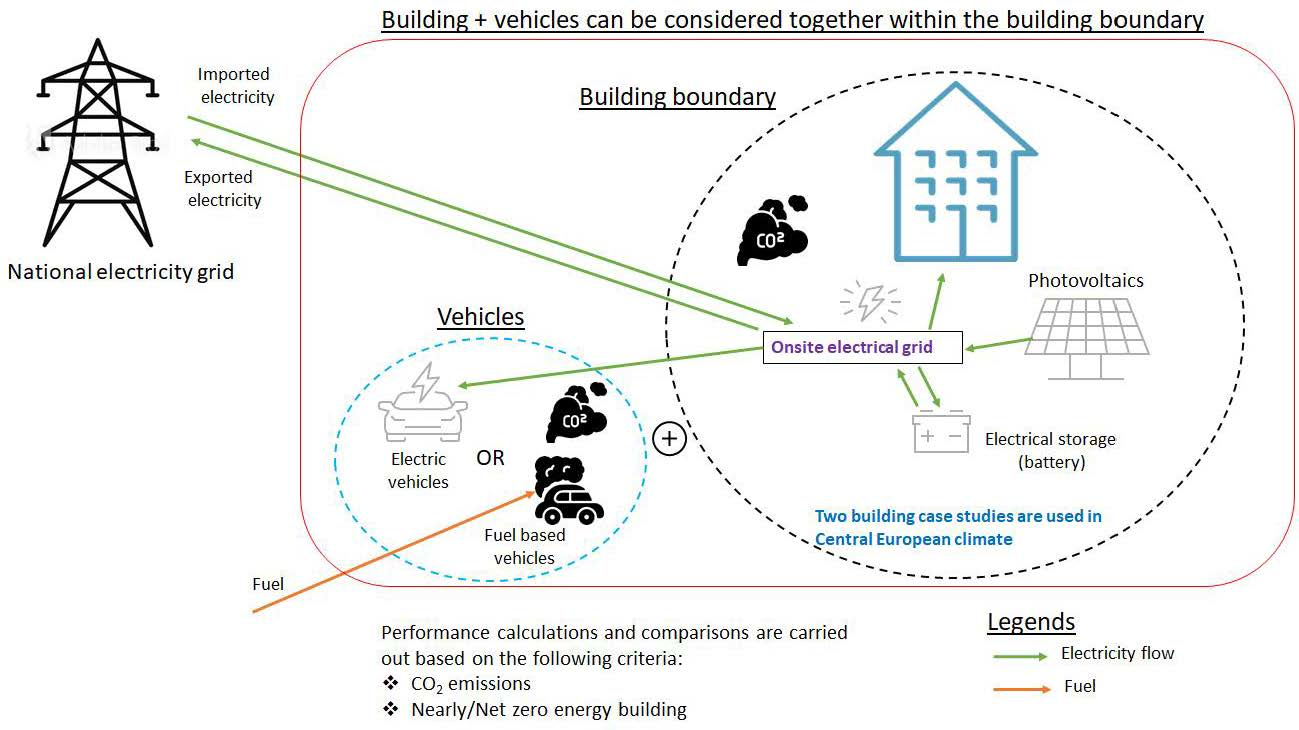
  • The current EU’s NZEB criteria laid down under the EPBD directive does not explicitly include the mobility within the building boundary and in the NZEB calculations. Therefore, a novel approach and method is discussed in the article to present the benefits of including mobility within the building boundary and NZEB/Net ZEB calculations. It is proposed to follow the emission calculation path rather than energy calculation path to show the benefits. This is further discussed by presenting two real measured case studies.
  • The studies discussed earlier are generally based on simulations; however, studies that involve real measurements are required to argue about the concept and impact on NZEB and Net ZEB criteria with the inclusion of EVs. Therefore, two real case studies are discussed in the paper to support the novel approach of including mobility and follow the emission path, rather than energy calculation path. It also demonstrates the benefits, in real case scenarios, of including mobility within the building’s energy balancing boundary.
The aim of the present study is to provide a comparison to the existing NZEB and Net ZEB criterion and the challenges when energy loads for battery-powered EV charging are considered as part of the building energy loads or if it is otherwise excluded. In addition, the total emission reduction potential from the building and mobility is discussed. This study first presents a qualitative policy study followed by quantitative analysis for two monitored buildings as case studies. The first case study is a single-family house (terraced dwelling located in the Netherlands) [33]. The data on the building from the Netherlands is considered as generic representative data in a normal Belgium environment. On the other hand, the second case study is a building from Belgium [34], which is considered a best-case scenario from the energy perspective, as it is an energy-efficient building and includes novel on-site technologies that produce and store energy. The study analyses the above two case studies when integrating electric vehicles within the building’s energy management. In the earlier publication on the same case studies the optimization strategy to maximize the building’s self-consumption, when the EVs are included was carried out [35]. The earlier study is extended in the present article to analyse the lessons in terms of opportunities or risks for incorporating EV charging in the NZEB and/or Net ZEB criterion and regulations.
The article is arranged in the following way. Section 2 discusses NZEB and Net ZEB definitions and regulations at the EU and MS levels. Section 2 also shows the extent to which EU member states consider EVs as one of their priority sectors for carbon reduction targets, and presents a critical analysis on the current policy challenges and approaches to the NZEB/Net ZEB and EV integration plans. Section 3 describes the methodology used in the article and Section 4 describes the results of the two monitored case studies and quantifies meeting the NZEB and Net ZEB criteria when EVs are included or excluded as a load in the building. Discussion is carried out in Section 5 and finally conclusion is made in Section 6.

2. NZEB Critical Analysis from the EV Penetration Point of View

2.1. NZEB and Net ZEB Definitions

According to the European Commission’s Energy Performance of Buildings Directive (EPBD, 2010/31/EU) [3] Article 2, a ‘nearly zero energy building (NZEB)’ means a building that has a very high energy performance, as determined in accordance with Annex I [note: of the EPBD regulation]. The nearly zero or very low amount of energy required should be covered to a very significant extent by energy from renewable sources, including energy from renewable sources produced on-site or nearby.’ The definition follows the efficiency-first principle: overall energy demand reduction is a key step to take before considering the integration of the renewable energy sources.
Another related concept is the net zero energy building. In this concept, energy balance is performed in such a way that the weighted imported credits equal the weighted exported credits over a specified duration, most commonly one year [36]. Both the NZEB and Net ZEB calculations are carried out in the present paper to analyse the energy performance of the building when EVs are integrated with the building.

2.1.1. Critical Analysis on the NZEB Criterion (Primary Energy) and Member State Plans

According to the EPBD definition, a building is an NZEB if the annual primary energy consumption of the building does not exceed a maximum defined value. Primary energy is calculated using primary energy conversion factors. These factors are used to convert the building’s energy demand into primary energy used to evaluate the building energy performance according to the European Building Performance Directive (EPBD) [3]. The primary energy conversion factors differ between EU member states, due to the different sources of energy generation, age and efficiency of the plants and the distribution networks.
Table 1 shows the primary energy requirements, and the energy use components included in the system boundary for calculations of NZEB at the national level for residential buildings in different EU countries. Table 1 shows that most of the countries have not included EVs and/or plug loads in the calculation boundary for the NZEB. However, EVs are included in the NZEB calculations in three countries only: Estonia, Lithuania and the Netherlands. This indicates that in general EVs have not been included as a load in the building’s energy performance calculations and assessments in most EU member states.
If the integration of EVs and/or plug loads becomes compulsory as part of future regulations, it will need a higher capacity of RE with greater investments in the building to reach NZEB and Net ZEB. On the other hand, e-mobility and renewable integrations are main elements of the EU’s clean energy package [40] and long-term vision for 2050 [10] goals to reduce the emissions from the European Union. Therefore, a better-integrated approach is needed to support sector integration.

2.1.2. EU Member States and Other Countries Plans for EV Integration

Many EU and other countries are aggressively planning and pushing the policy to replace fossil fuel-based mobility with electric-based mobility. Under sustainable and smart mobility strategies, there are plans to achieve 30 million zero-emission cars and three million public charging stations in Europe by 2030 [41]. Many plans and pilot projects are underway that focus on analysing the benefits and testing various business models to make electric-based mobility viable [42]. Below, the situation (based on [32,42]) in a few countries that are very actively promoting EVs in the policy and markets is presented;
  • Norway
Norway is leading the way in integrating EVs in the country. The state provides subsidies and incentives to stimulate the EV market. In addition to this, value added tax of 25% is not charged to the consumer when purchasing EVs, and other 70–90% road tax exemptions are included. The country is investing heavily in public charging stations and adding them to the city infrastructure. Incentives of up to EUR 2.1 million are also provided to encourage housing associations to install chargers [43].
  • The Netherlands
The country is aggressively pushing forward EV integration in society. It has the highest rate of public charging station and EVs per 100 km in Europe. There are purchase tax or lease tax exemptions for EVs and partial tax exemptions for hybrid EVs cars, depending on the CO2 emitted by the hybrid EVs. Investment in charging stations is partially deductible from income taxes. Moreover, neighbourhoods can request the installation of charging stations near the street. In this case, the buyer has to pay for the cost of the charging station, but they do not have to pay labour costs [43].
  • France
The French state provides a purchase subsidy of EUR 6000 to consumers if car emissions are lower than 20 g CO2/km. In addition, they provide EUR 5000 if an individual replaces their old fossil fuel-based car with an EV or hybrid EV car. The car owner can get a 50% discount or full exemption for the cost of licence plate registration. The charging station installation programme has been extended to fund the resourcing and installation of charging points up to 40% for public spaces and 50% for residential spaces. The state provides subsidies to districts that install charging stations based on demand from consumers. Each district can receive EUR 2160 for each station. Apartment owners can get 50% off the cost of charging station installation [43].
  • Germany
Germany plans to have 10 million EVs on its roads by the end of 2030. The German state wants to further stimulate the new EV sales market, and therefore they are providing more incentives to consumers of EVs, hybrid EVs or fuel cell-based cars beyond 2021. The German state provides a subsidy of EUR 4000 per EV and EUR 3000 per hybrid EV, and this may increase to EUR 6000 per EV and EUR 4500 per hybrid EV. EVs are exempted from 10 years of ownership tax if purchased between 2011 and 2025. Owners of plug-in hybrid vehicles can pay lower taxes, depending on CO2 emissions. The government invested EUR 300 million to install 10,000 standard and 5000 fast charging station between 2017–2020. The plan is to have around one million charging stations by 2030. The government pays around EUR 3000–12,000 towards the cost of a charging station ranging from 22–100 kW. If the charging station is above 100 kW, then the government pays a subsidy of EUR 30,000. The charging station’s connection to the low voltage grid is subsidised up to EUR 5000, and connections to the medium voltage grid is subsidised up to EUR 50,000. In addition, other tax benefits are provided to charging station owners, such as exemption for income tax that occurs due to charging station services [43].
  • Sweden
Sweden is aggressively pushing its agenda of introducing EVs. With incentives provided to EV owners, EV car sales have increased significantly. The country is further incentivising EV integration to become carbon neutral by 2045. The country is providing vehicle tax benefits for cars that have emissions lower than 60 g CO2/km, while vehicle tax on fuel-based cars is going to increase over time. Car owners can get EUR 6000 when they purchase EVs or plug-in hybrid EVs. Incentivisation programmes for the CO2 emissions reduction project are being introduced in Sweden, under which EV charging stations are also included. A grant of 50% towards are provided to organisations and housing companies if they install EV charging stations. Individual house owners can get up to 50% or EUR 960 for charging station components and labour costs [43].
It can be observed from the above examples that EVs are being promoted from the transport sector perspective. There is a gap or disconnection between the transport and building energy sectors. In the updated EPBD (2018) [4] it is assumed and expected that EV penetration could increase in the future, with more EVs load shifting into the building boundary and included within the building’s energy performance calculations. In the Net ZEB definition, generally EVs and plug loads are included in the calculations. Similarly, a new rating system, known as smart readiness indicator (SRI), is introduced by the European Commission in the EPBD [44] that rates the smart readiness of a building. SRI is a rating system established to promote smart buildings and technologies. One of the main criteria for rating a building’s smart readiness is to estimate whether a building is ready to include advanced features, such as demand side management, user comfort, flexibility options and EV as a load.

2.2. Proposed Approaches to the Policy Plans

The 2018 update of the EPBD requires EV charging points and ducting infrastructure namely conduits for electric cables that allows the installation of a charging point for parking spaces. If we assume that electric mobility will be part of the new regulations, this would of course have a big impact on the building’s total end-use of energy and, consequently, on its rated primary energy consumption. Two generic approaches can be considered to deal with EV energy loads in building performance assessments methods: (1) exclude EVs in the demand calculation of NZEB and Net ZEB (Section 2.2.1); or (2) include EV load in the assessment procedure and NZEB and Net ZEB calculation (Section 2.2.2).

2.2.1. Exclude EVs in the Demand Calculation of NZEB

One method could be to exclude the electric load of EVs from the building’s load and separately calculate the energy used for charging EVs. If the energy performance assessment is based on a calculation, this is straightforward. If the energy performance metric includes metered energy consumption, this approach would require further processing of the data. A separate smart energy meter could be used for measuring EV charging. This meter would separately measure the EV charging carried out both via the on-site renewable energy and via the grid to meet any shortfall in the charge. In this way, the EV and building’s electricity consumption can be measured separately, and the building’s energy performance can be assessed without interference with the EV energy consumption.

2.2.2. Include EV Load in the Assessment Procedure

Another approach could be to include EVs in the calculations when evaluating the building’s energy performance. The major difference between including the EV load and the other loads of the building is that the EV will be charged at home within the building’s boundary, but it will consume energy outside the boundary while the other loads of the building are consuming energy inside the building’s boundary. There can be two methods to consider regarding the inclusion of EVs in the building’s demand based on considering the primary energy or the CO2 emissions:
  • Increasing the permissible primary energy criterion for NZEB
Generally, primary energy is used to define the performance of buildings. In this approach, after using the renewable electricity generated on-site, the total electricity imported by the building to meet the electrical demand of both the building and EVs can be converted to equivalent primary energy due to the electricity import. Solely adding the EV loads to the calculated primary consumption of the building would result in an apparently poorer building performance. Therefore, the benchmark values (or permissible maximum limits; see Table 1 could be simultaneously increased when including EVs in the load calculations. This method can provide an impartial way to still treat the building as an energy-efficient building or NZEB and not penalise the building based on higher energy consumption due to the higher level of import of electricity for EV charging. In the case of a calculated energy performance assessment, this requires defining default values for EV energy demand. In the case of building performance assessment based on metered consumptions, this requires further consideration of defining the benchmark value, potentially reflecting vehicle type, typical mobility use, etc.
  • EV and fossil fuel-based cars’ CO2 emissions comparison
In this, approach both the electricity used for charging the EV and that used to meet the building’s electricity demand can be measured together using meters. The sum of this electricity can be converted to equivalent CO2 emissions using CO2 conversion factors. This is defined in terms of kg of CO2 emitted per kilowatt-hours of consumed electricity, which should exclude EV charging if the on-site building’s integrated renewable energy source is used. Similarly, the total amount of CO2 emitted by the same building using similar a fossil fuel-based (petrol/diesel) car within the building boundary, with a similar number of kilometres driven, can be estimated as well. The relative emission reduction or the difference between the CO2 emitted can be compared between these two scenarios. In this way, a building with a fossil fuel-based car and a building with an EV car can be compared in terms of the total net CO2 emissions. This method can provide a fair evaluation when mobility is considered within the building’s boundary and in the load calculations. EVs and on-site renewable sources together can certainly assist in reducing the fossil fuel import within the building boundary, i.e., fuel for the petrol car and grid electricity. Therefore, a benefit can be a reduction in emissions because of the main advantage coming from the lower emissions of the imported electricity used for the EVs compared with the emissions produced by fossil fuel cars. This method would encourage the replacement of fossil fuel vehicles with EVs as part of the building performance regulations.

2.2.3. Additional Services in Terms of Building Energy Performance and Flexibility

With the new concepts and technology such as smart meters, two-way grids and user-centric control systems, EVs could be used in different ways for increased benefits, such as in load shifting and vehicle-to-grid solutions [42].
  • Load shifting
EVs can be used as an energy flexibility option for demand-side management. EV charging can be shifted to the low-demand hours of the building and maximum renewable energy production, or during periods of low energy cost by using the online controller. The vehicle can act as a storage option, providing cheap electricity to the building during peak hours (e.g., evenings). This could improve the management of peaks in demand for electricity in the buildings. Ultimately, this can reduce the emissions, electricity consumption and the electricity cost of the building [23].
  • Vehicle to Grid (V2G)
Another method that can be used to make use of the EV storage capacity is to deliver electricity from the EV directly to the grid during peak periods. This functionality can be even more effective for balancing purposes and managing the electricity load. If V2G is quantified in the energy performance assessment of the building, the export of any excess electricity stored in the EV to the grid can assist in reaching Net ZEB targets.
  • Vehicle to Building (V2B)
The storage capacity of the batteries in EVs can also be utilised to arbitrage between different electricity tariffs throughout the day. This is relevant, as one fully-charged EV could theoretically power a household for one or more days depending on its battery size [42]. An EV can store cheap electricity from the grid or from renewable sources. This energy can be provided to the building during peak hours, or when renewable energy is not available. This can also assist a building to reach NZEB or Net ZEB levels. For example, with the typical European household demand of ~10 kWh per day, the fully-charged battery of a Nissan LEAF (24 kWh) would be able to deliver power for 1–2 days [42].

2.2.4. Challenges and Opportunities in Future Integration of EVs

In order to enable the smooth integration of EVs with NZEBs/Net ZEB, a novel approach is needed in terms of technical, economic and political aspects. Here are some of the challenges that have to be addressed:
  • Smart grids
The integration of EVs with buildings would have an impact not only on on-site electricity generation and demand, but also on the national grid. The present grids are sufficiently capable of supporting EV penetration [45]. However, with drastic financial support and policies to increase the penetration of EVs in the market, this would have an impact on the grid. The sudden increase or spike in peak demand would negatively affect NZEB performance and the grid. Therefore, a novel smart control of the grid is needed that can manage EV charging in order to smoothen sudden spikes or excessive loads on the grid.
  • Demand-side management
Demand-side management and flexibility are needed to support EV charging and building integration. EVs can be charged during periods when renewable generation is at its peak or electricity prices are lower, while other low priority demand can be adjusted to provide flexibility. This would need further research, and, in this case, demand flexibility can be monetised in order to support grid stability and power balancing.
  • Business models
New business models are needed to support EV and building integration. With the present situation, it is challenging to integrate EVs with buildings as EVs mainly act as a load. This not only reduces the technical but also reduces the economical and life cycle cost benefits of a building being NZEB. The business models that can support the vehicle-to-grid or vehicle-to-building integration, emission reduction-based financial benefits to the building, smart metering or EV battery integration as a flexibility option can be further researched. Building information modelling or digital building modelling (BIM) can be used as a mean to simulate and optimize building design and construction processes using comprehensive digital models. In terms of the construction, operation and entire life cycle of the building, the integration of BIM and lifecycle assessment (LCA) [46,47,48] offers significant advantage over traditional design and calculation methods. This is suitable for establishing a building management system that can also support the integration of EVs and buildings. This would help to analyse and find suitable economical models for EV and building integration.
  • Urban development plans and regulations
Urban development plans and regulations have to be designed in a way that allow the integration of EVs in building project plans from the beginning. Urban development is important as buildings, districts and energy system are designed based on these plans. If the regulations allow and support e-mobility and the building sector as a combined entity, then it could have a positive impact on the utilisation of renewables, energy efficiency and e-mobility. Communication about and knowledge of the benefits of such synergies have to be developed to promote EVs and NZEB/Net ZEB buildings together.
  • Energy performance certificates of the buildings
Energy performance certificates (EPC) are established in all EU member states to provide insights into the energy efficiency of newly constructed and existing buildings [49]. These certificates are required when building permits are needed and when the sale and purchase of the building is carried out. For the existing building stock, the certificates can also provide insights into the methods and ways to improve the energy performance of the building. Typically, the EPC scores are calculated based on national (or regional) calculation methods according to the EPBD set of standards (EN ISO 52000 series).
Most EPCs are based on estimations without physical energy audits, and generally they do not consider the interconnectivity of buildings. Recently, a new renovation wave strategy [50] was communicated by the European Commission, in which a revision of the EPC and a proposal to introduce mandatory minimum energy performance standards for all types of buildings in the EPBD would be discussed in the EU during 2021. With new smart measurement tools and meters to measure the actual energy performance of a building during its life cycle, the EU Commission proposes to update the EPC framework, considering the new performance measurement technologies. Furthermore, the renovation wave also supports the introduction of the SRI, which also integrates assessment of EV charging facilities as part of the evaluation of building smartness.
Within the EU’s member states, the issue of EV integration in the EPC can be discussed. Thanks to the renovation wave strategy [50] the energy efficiency of new and old buildings is projected to drastically improve. As a result, the relative share of EV energy consumption would become a large proportion of the total building demand. Therefore, in future scenarios where one wishes to include EVs in a building evaluation, the various methods discussed above to integrate EVs within a building’s balancing boundary can be followed. The emission reduction path of the EV + building integration, rather than the energy calculation path, along with other services in terms of building energy performance and flexibility can be followed. This could exhibit the benefits of including EVs within the building load calculation.

3. Methods

The analysis of two case studies is discussed in this section. The first case study uses measured data from a terraced single-family dwelling equipped with a heat pump and PV installation [33] and allows for a sensitivity analysis to evaluate representative cases in the Flemish context. In the second case study, measured data from a real case in Belgium has been used, adapted to make it more representative. As the latter building under consideration uses a wide advanced variety of renewable sources and storage technologies, the obtained results should be considered as a special case from which conclusions cannot be readily extrapolated. A more detailed overview of the specifications of each case study is given in the next sub-sections.

3.1. Case Studies

3.1.1. Input Data

Detailed measured data from the two distinct case studies are used and the general characteristics of the buildings are summarised in Table 2. In case of the logged subsystems, integrated values during a timestep are considered.
In order to evaluate whether the NZEB criterion (see Section 3.1.2) is met, the primary energy needed to provide the heating, cooling and Domestic Hot Water (DHW) demand of the building has to be known. As for both case studies the thermal energy system is fully electrified, the amount of electric power taken from the grid that is used for these purposes has to be known at every moment in time. The procedure to obtain this value depends on the specifics of each energy supply system and is detailed for each case study in the relevant sub-sections.

3.1.2. NZEB Definitions and Calculations Methods

The primary yearly energy needs (in kWh/m2 per year) of a dwelling in the current Flemish NZEB definition are obtained as the sum of the energy required for heating, cooling, DHW production and auxiliary equipment (pumping and ventilation), while the locally produced PV energy is subtracted from the demand. The energy for EVs, plug loads and home batteries are excluded from this NZEB calculation. The energy is evaluated on a yearly basis, which means that the actual amount of PV self-consumption and its seasonal/daily distribution cannot be deduced from this. Any surplus production is considered useful, implicitly also when using the grid as a virtual storage system (at times of large PV energy surplus that cannot be absorbed by home- or EV batteries) but to the limit that no yearly surplus is gained (Equation (1)),
E P r i m a r y , y e a r l y = max ( 0 ,   (   1   y e a r E h e a t i n g ,   c o o l i n g ,   D H W ,   a u x i l a r y 1   y e a r E P V ) f p r i m a r y ) ,  
In the expression above, f p r i m a r y is the primary energy factor that connects the primary and final energy use of the building when dealing with electric power. In the calculation, f p r i m a r y is equal to 2.5 [51], as all thermal energy is generated using electric power as primary source. E h e a t i n g ,   c o o l i n g ,   D H W ,   a u x i l a r y is the electric energy required for heating, cooling, DHW production and auxiliary equipment. E P V is the electric energy produced by the PV panels. To qualify as a NZEB building, E P r i m a r y , y e a r l y should not exceed a prescribed value which depends on the volume and exposed façade area of the building. In the results below this evaluation will be referred to as ‘yearly values’. In this case it is sufficient to determine the yearly electricity demand of the thermal energy system as well as the yearly local PV production. In case PV production exceeds the electricity demand of the thermal energy system, E P r i m a r y , y e a r l y = 0   kWh . Otherwise, electricity has to bought from the grid to produce thermal energy and the required primary energy is calculated according to Equation (1).
Next to the Flemish NZEB definition above, an alternative instantaneous evaluation method proposed by the authors is also investigated, considering the net energy streams during a given timestep (5 or 15 min depending on the case study). In this case, there is a primary energy use (in kWh/m2) assigned to the electricity that has to be bought from the grid when the electric load of the thermal energy system exceeds the PV production by using the formula (Equation (2)) below:
E P r i m a r y , i n s t a n t = 1   y e a r max ( 0 ,   E h e a t i n g ,   c o o l i n g , D H W , a u x i l i a r y E P V ) f p r i m a r y ) ,
In the results below this evaluation will be referred to as ‘Instant values’. Next to the yearly and instant evaluations defined above, also the inclusion of EV charging is analysed in the case studies.
In case of the instant evaluation (Equation (2)), starting from the data measured in the case studies (different electric loads and PV production), the electric energy balance is established at every timestamp by using the following merit order. If available, electric energy locally produced by the PV installation is provided to the thermal energy system. Any surplus PV production is used to fulfil the electric vehicles charging load. Next, the remaining PV production is used to cover the plug loads and lighting. After all electric loads have been covered, any remaining PV production is injected into the grid. If the local PV production is insufficient to cover the electric loads, the deficit is bought from the grid.
All input data can be scaled to analyse the influence of changes in heat pump (HP) load, EV mileage or size of the PV installation. The analysis is performed using a spreadsheet calculation in MS Excel.

4. Results

4.1. Case Study 1: Terraced Single-Family Dwelling

In this case study, measured data from a single-family house (a terraced dwelling located in the Netherlands), is analysed following the procedure (Flemish NZEB definition) described above. The house (with a footprint of 37.9 m2) is significantly renovated to meet Dutch NZEB standards, including a PV installation composed of 28 panels, each 280 Wpeak (total capacity of 7.84 kWp). Thermal energy for both heating and DHW is produced by an air-source heat pump. The data used covers the period from September 2017 to September 2018. The schematic diagram of case study 1 is shown in Figure 1. Only the electrical flow (green solid and dotted lines) paths are considered for calculations. The solid green lines are considered for calculation in the NZEB case, while the green solid + dotted lines are considered for the Net ZEB criteria. Moreover, in electrical load the solid green lines are considered for the calculation of NZEB criterion, while the solid + dotted green lines are considered for the Net ZEB criterion.
The Netherlands requires more stringent conditions for buildings to qualify as NZEB compared to Flanders: 0 kWh/m2/a including all loads (including plug loads, lighting, appliances, in addition to heating, cooling and ventilation). Therefore, the 7.84 kWp PV installation on the house is over-dimensioned with respect to the total electric load of the house of 3750 kWh per year, as the average PV production is estimated to be 1000 kWh per kWp installed. The plug load demand is around 1373 kWh per year for this building. Note that the measured HP demand is 1940 kWh per year and the EV consumption is 18.75 kWh per 100 km.
In the following analysis the load of the HP, the PV production and the EV mileage are varied to analyse the impact on meeting the Flemish NZEB criteria. It should be noted that climatological conditions as well as the typography of the building and user behaviour between the Netherlands and Flanders are comparable.

4.1.1. Input Data Specifications

Next to the total electric load of the building, the electric consumption of the HP, including circulation pump, is measured individually. The power consumption of the ventilation system was estimated to be constant at 50 W based on known ventilation mass flows and ventilation system specifications. On the production side the electric energy delivered by the PV installation is measured. The remaining plug loads are then defined as the difference between the total electrical load of the dwelling and the part related to the energy supply system. Data is available with a five-minute resolution. No EVs are present at the location of this case study. In the analysis, the charging profile that was measured in the second case study was used (see Section 4.2).

4.1.2. Flemish NZEB Criteria

According the Flemish NZEB definition, the building should not require more than 30% of the primary energy of the 2005 reference building. Based on the dimensions of the dwelling (volume: 299 m3, exposed surface area of 162 m2) the maximal amount of primary energy required for heating, domestic hot water production and auxiliary components should not therefore exceed 18,578 MJ, or 5160 kWh, per year to qualify as NZEB. This corresponds to at most 45 kWh/m2/a.

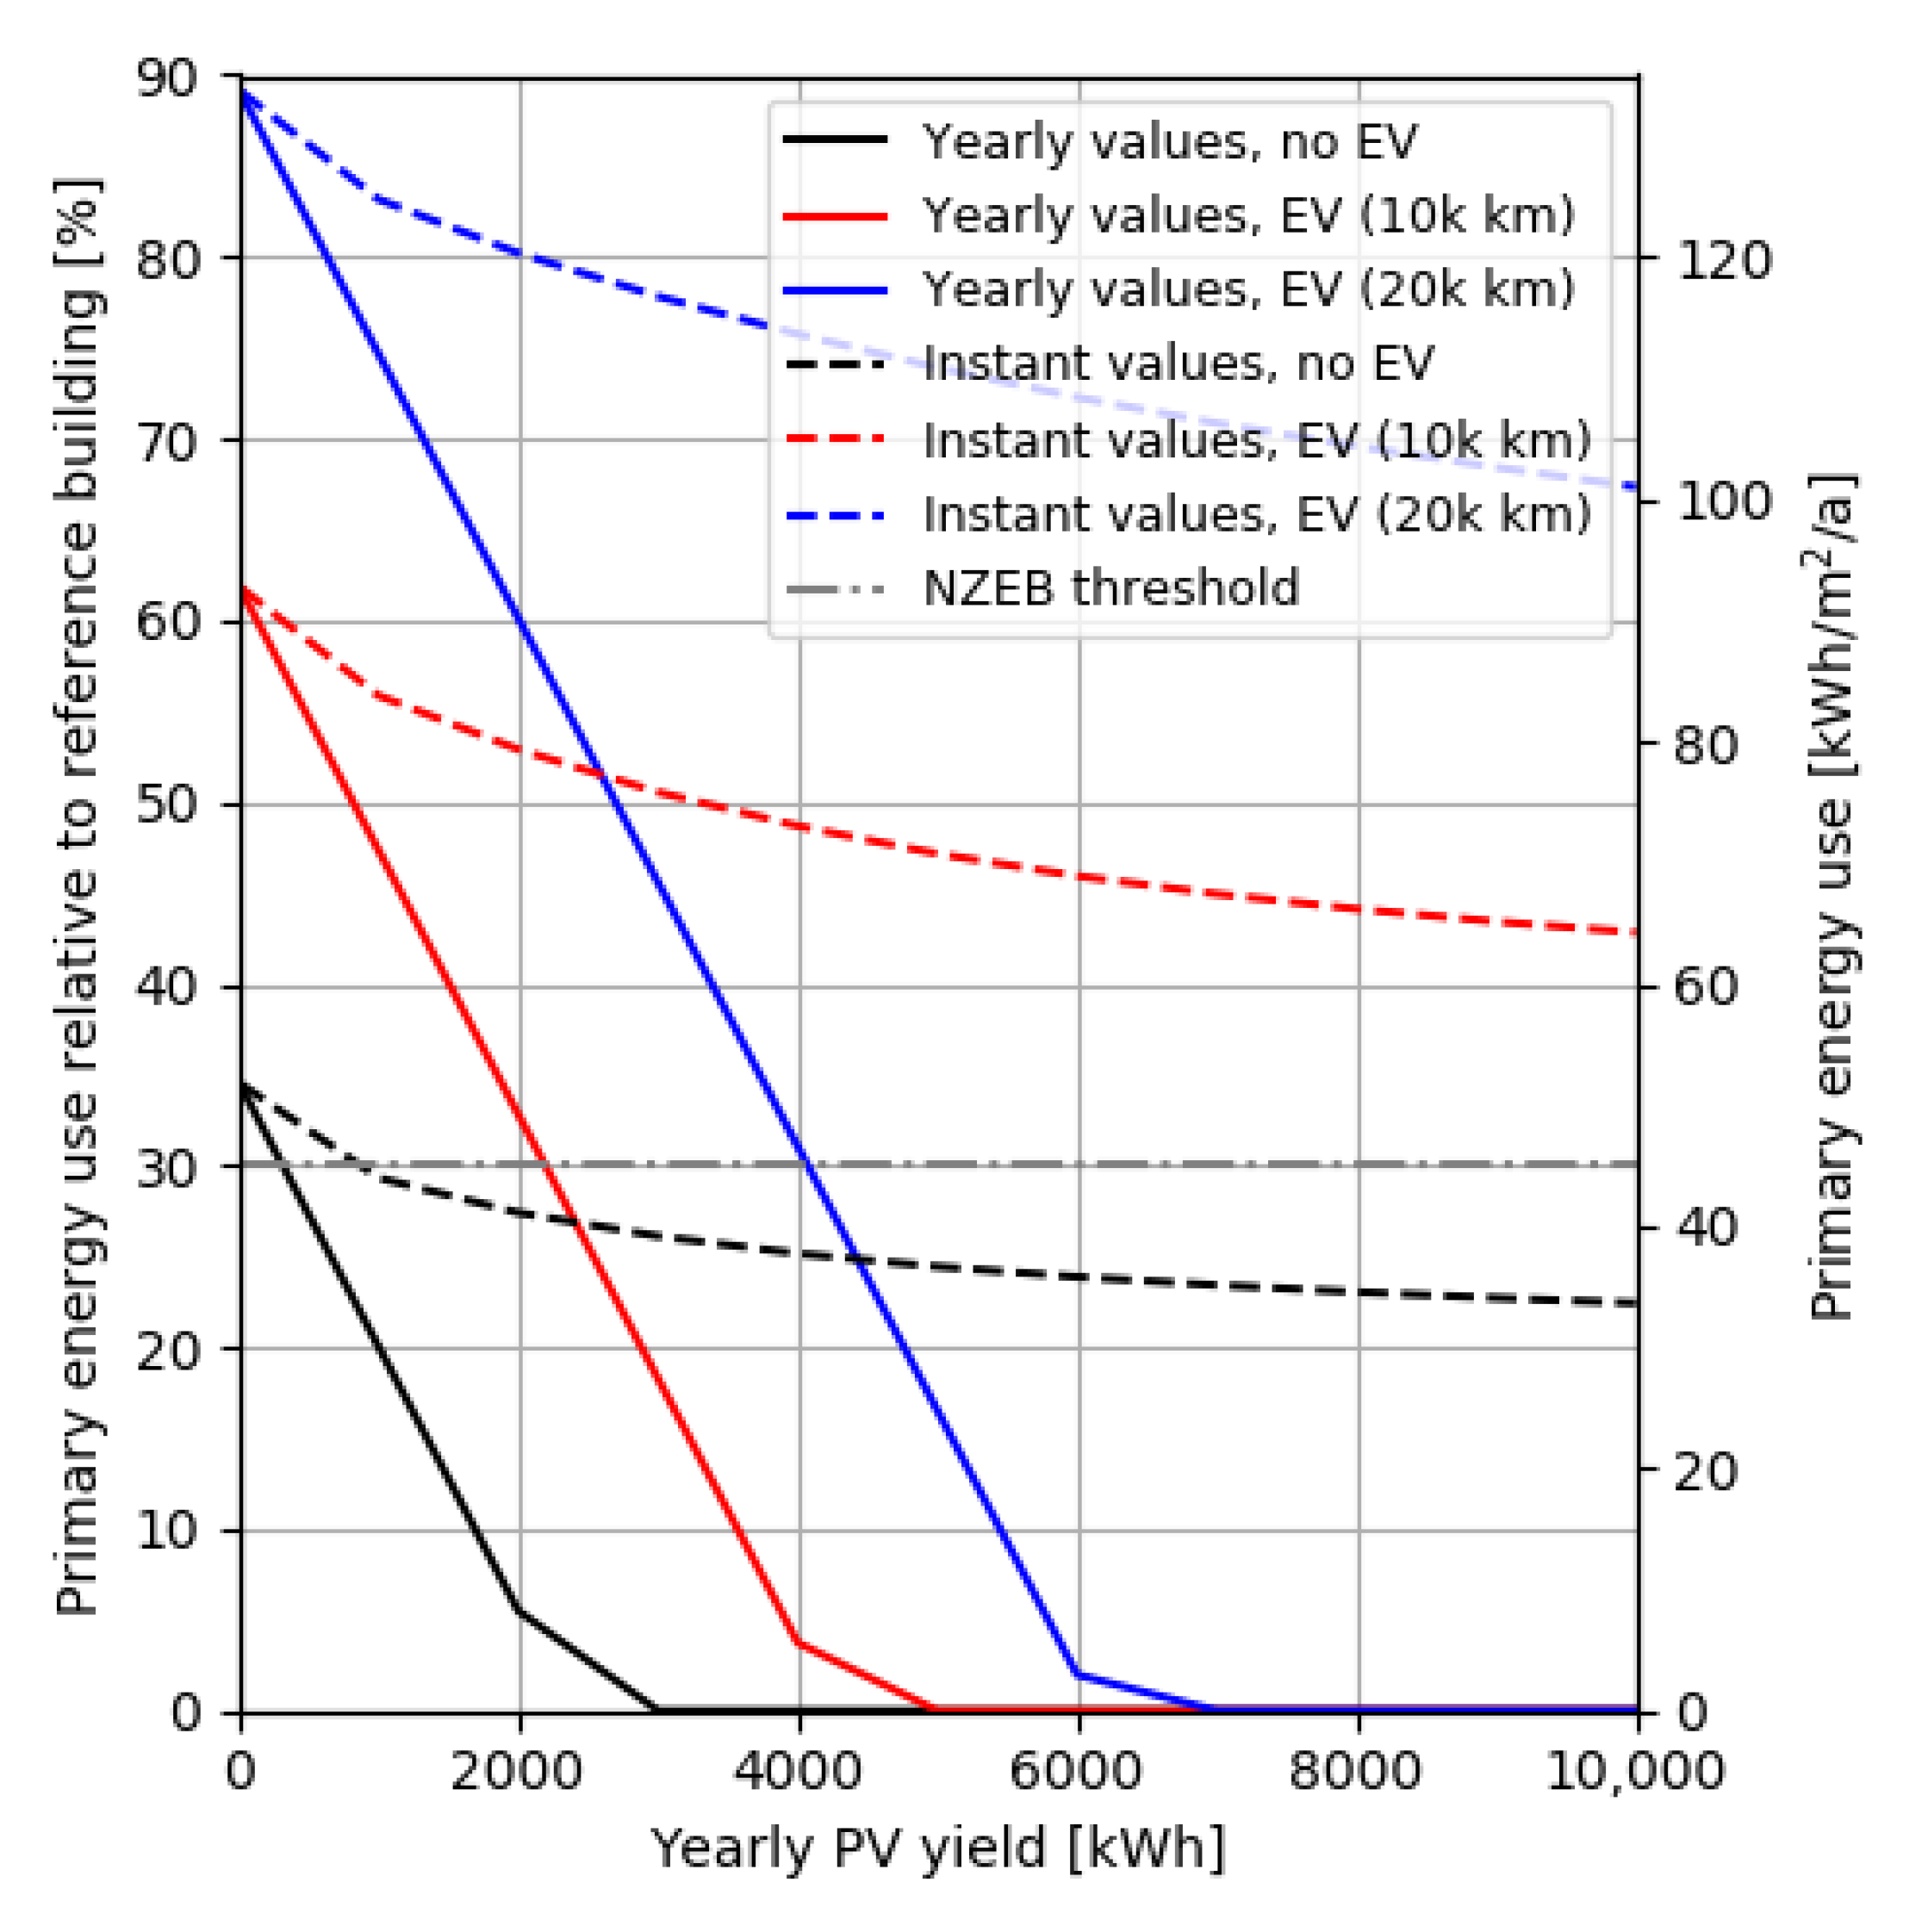
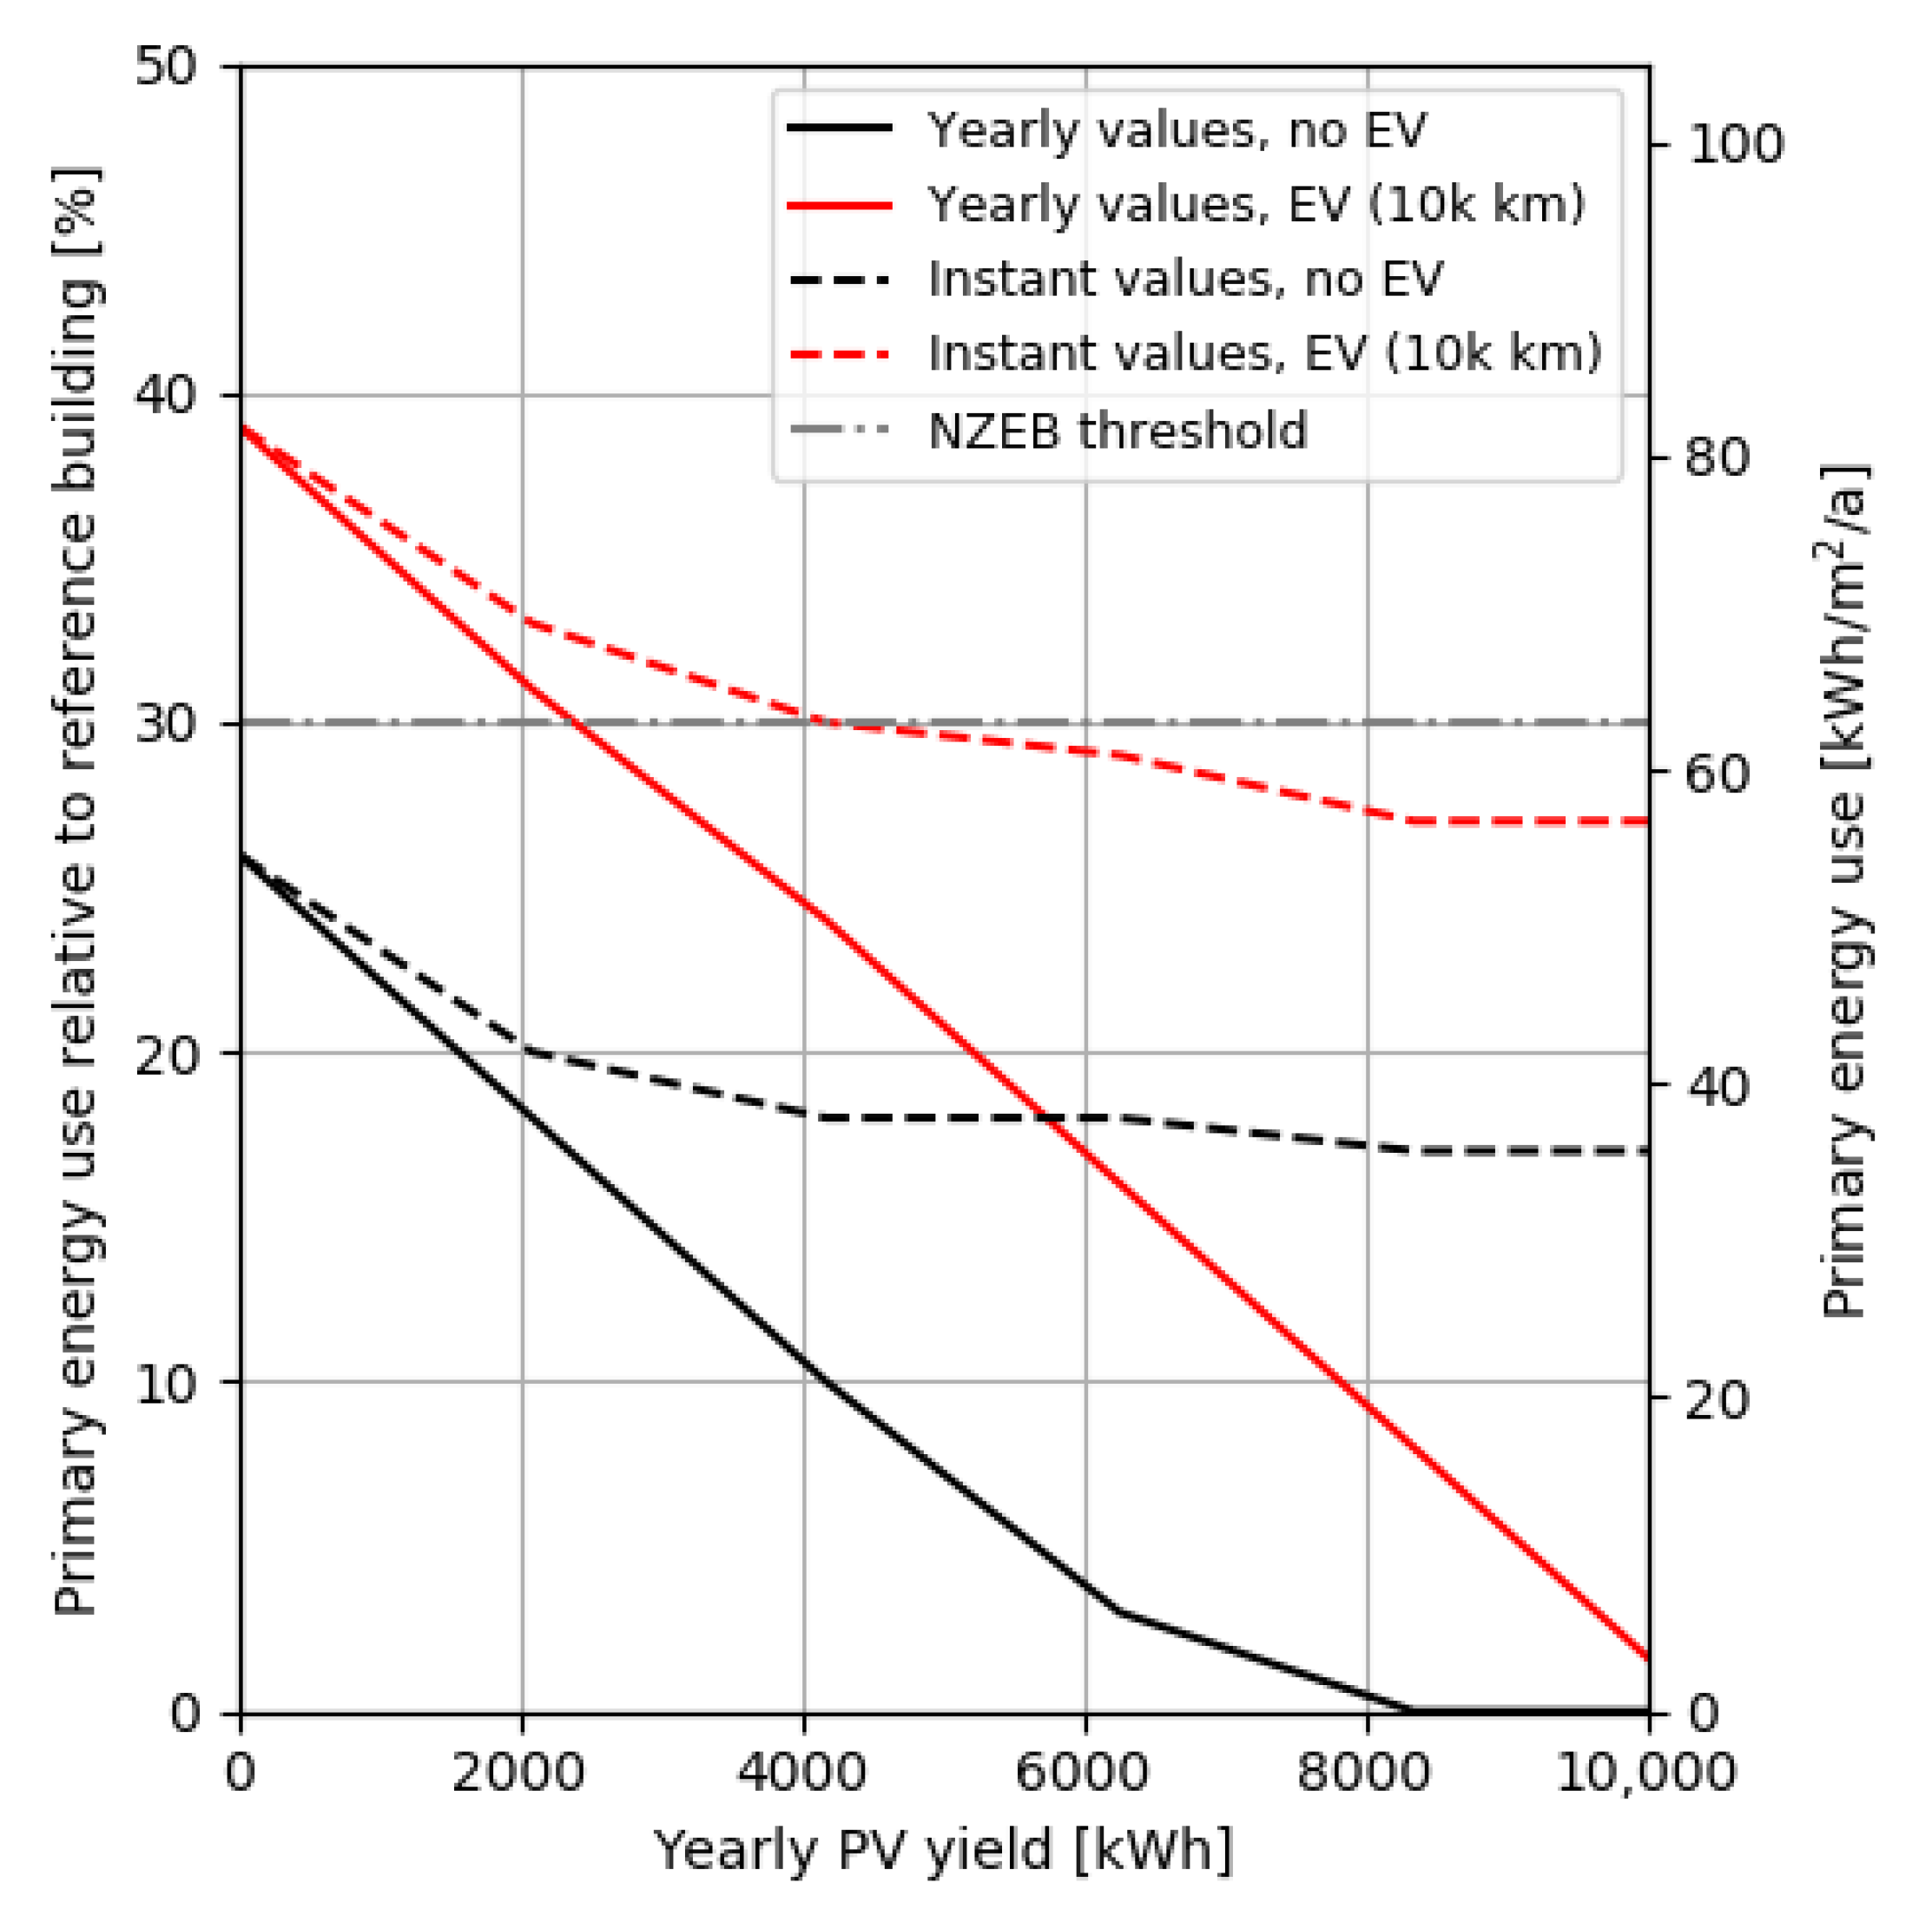
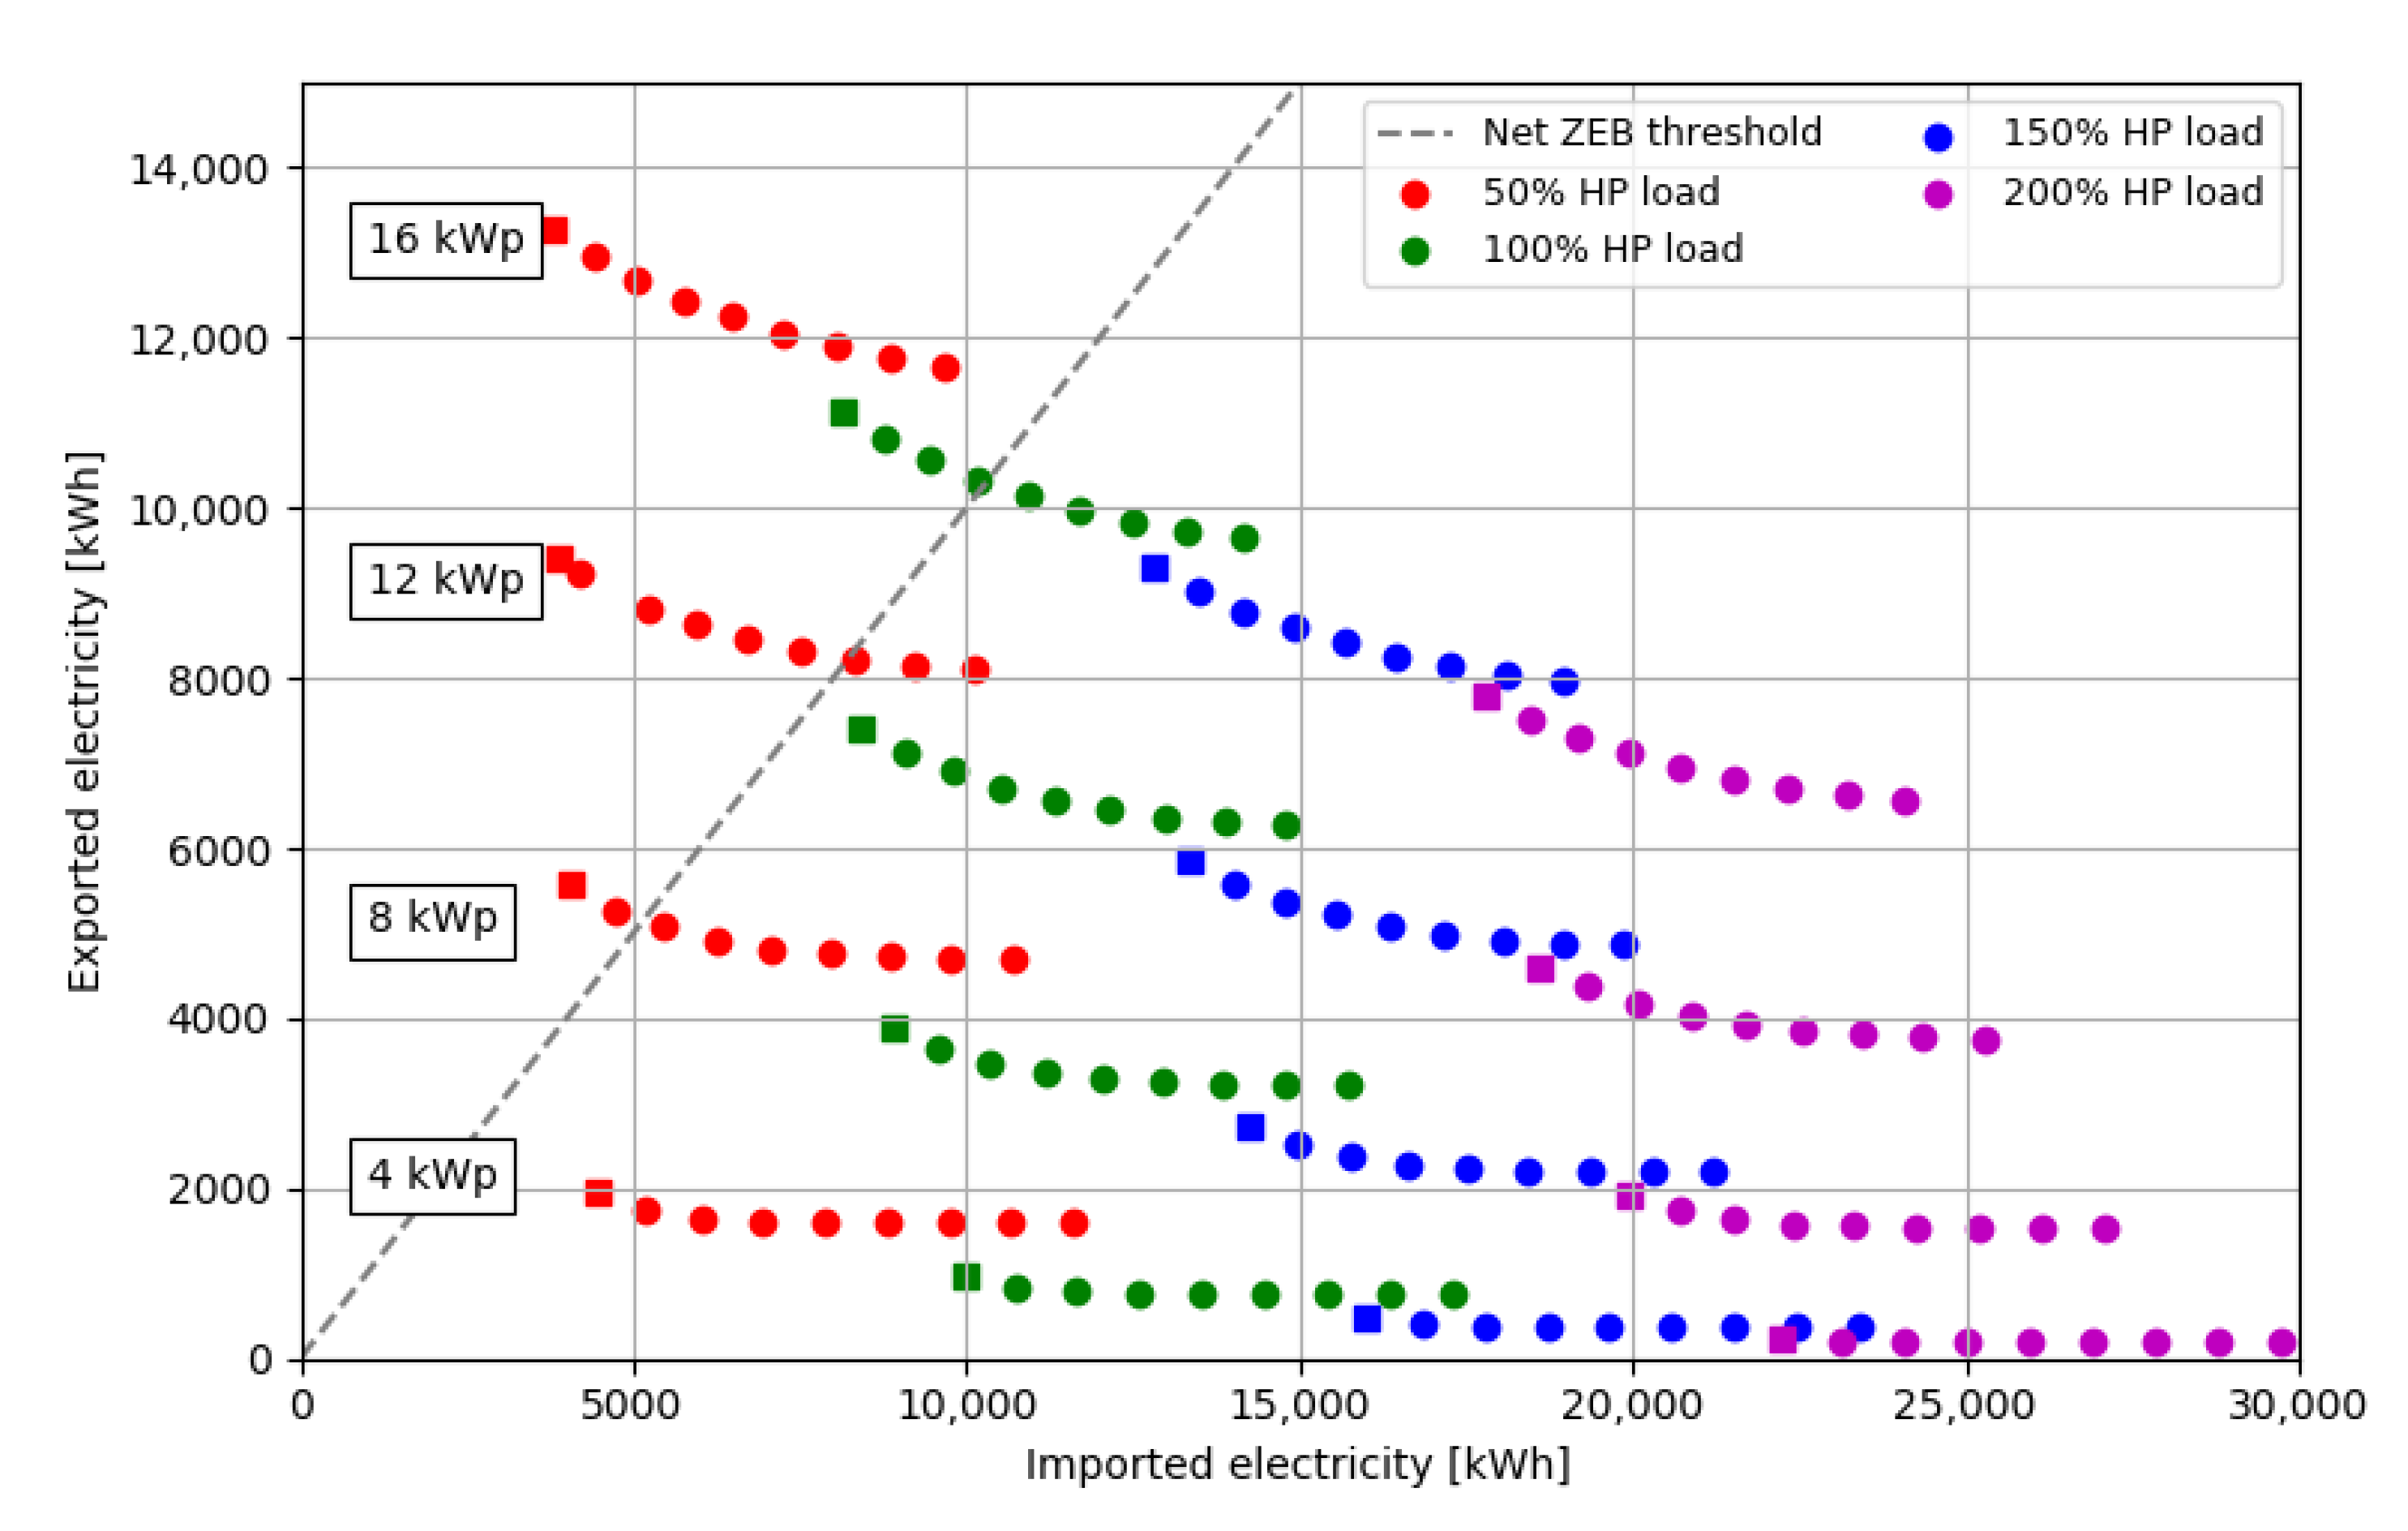
4.1.3. Sensitivity Analysis 1: PV Sizing

Figure 2 shows the primary energy results for three different cases:
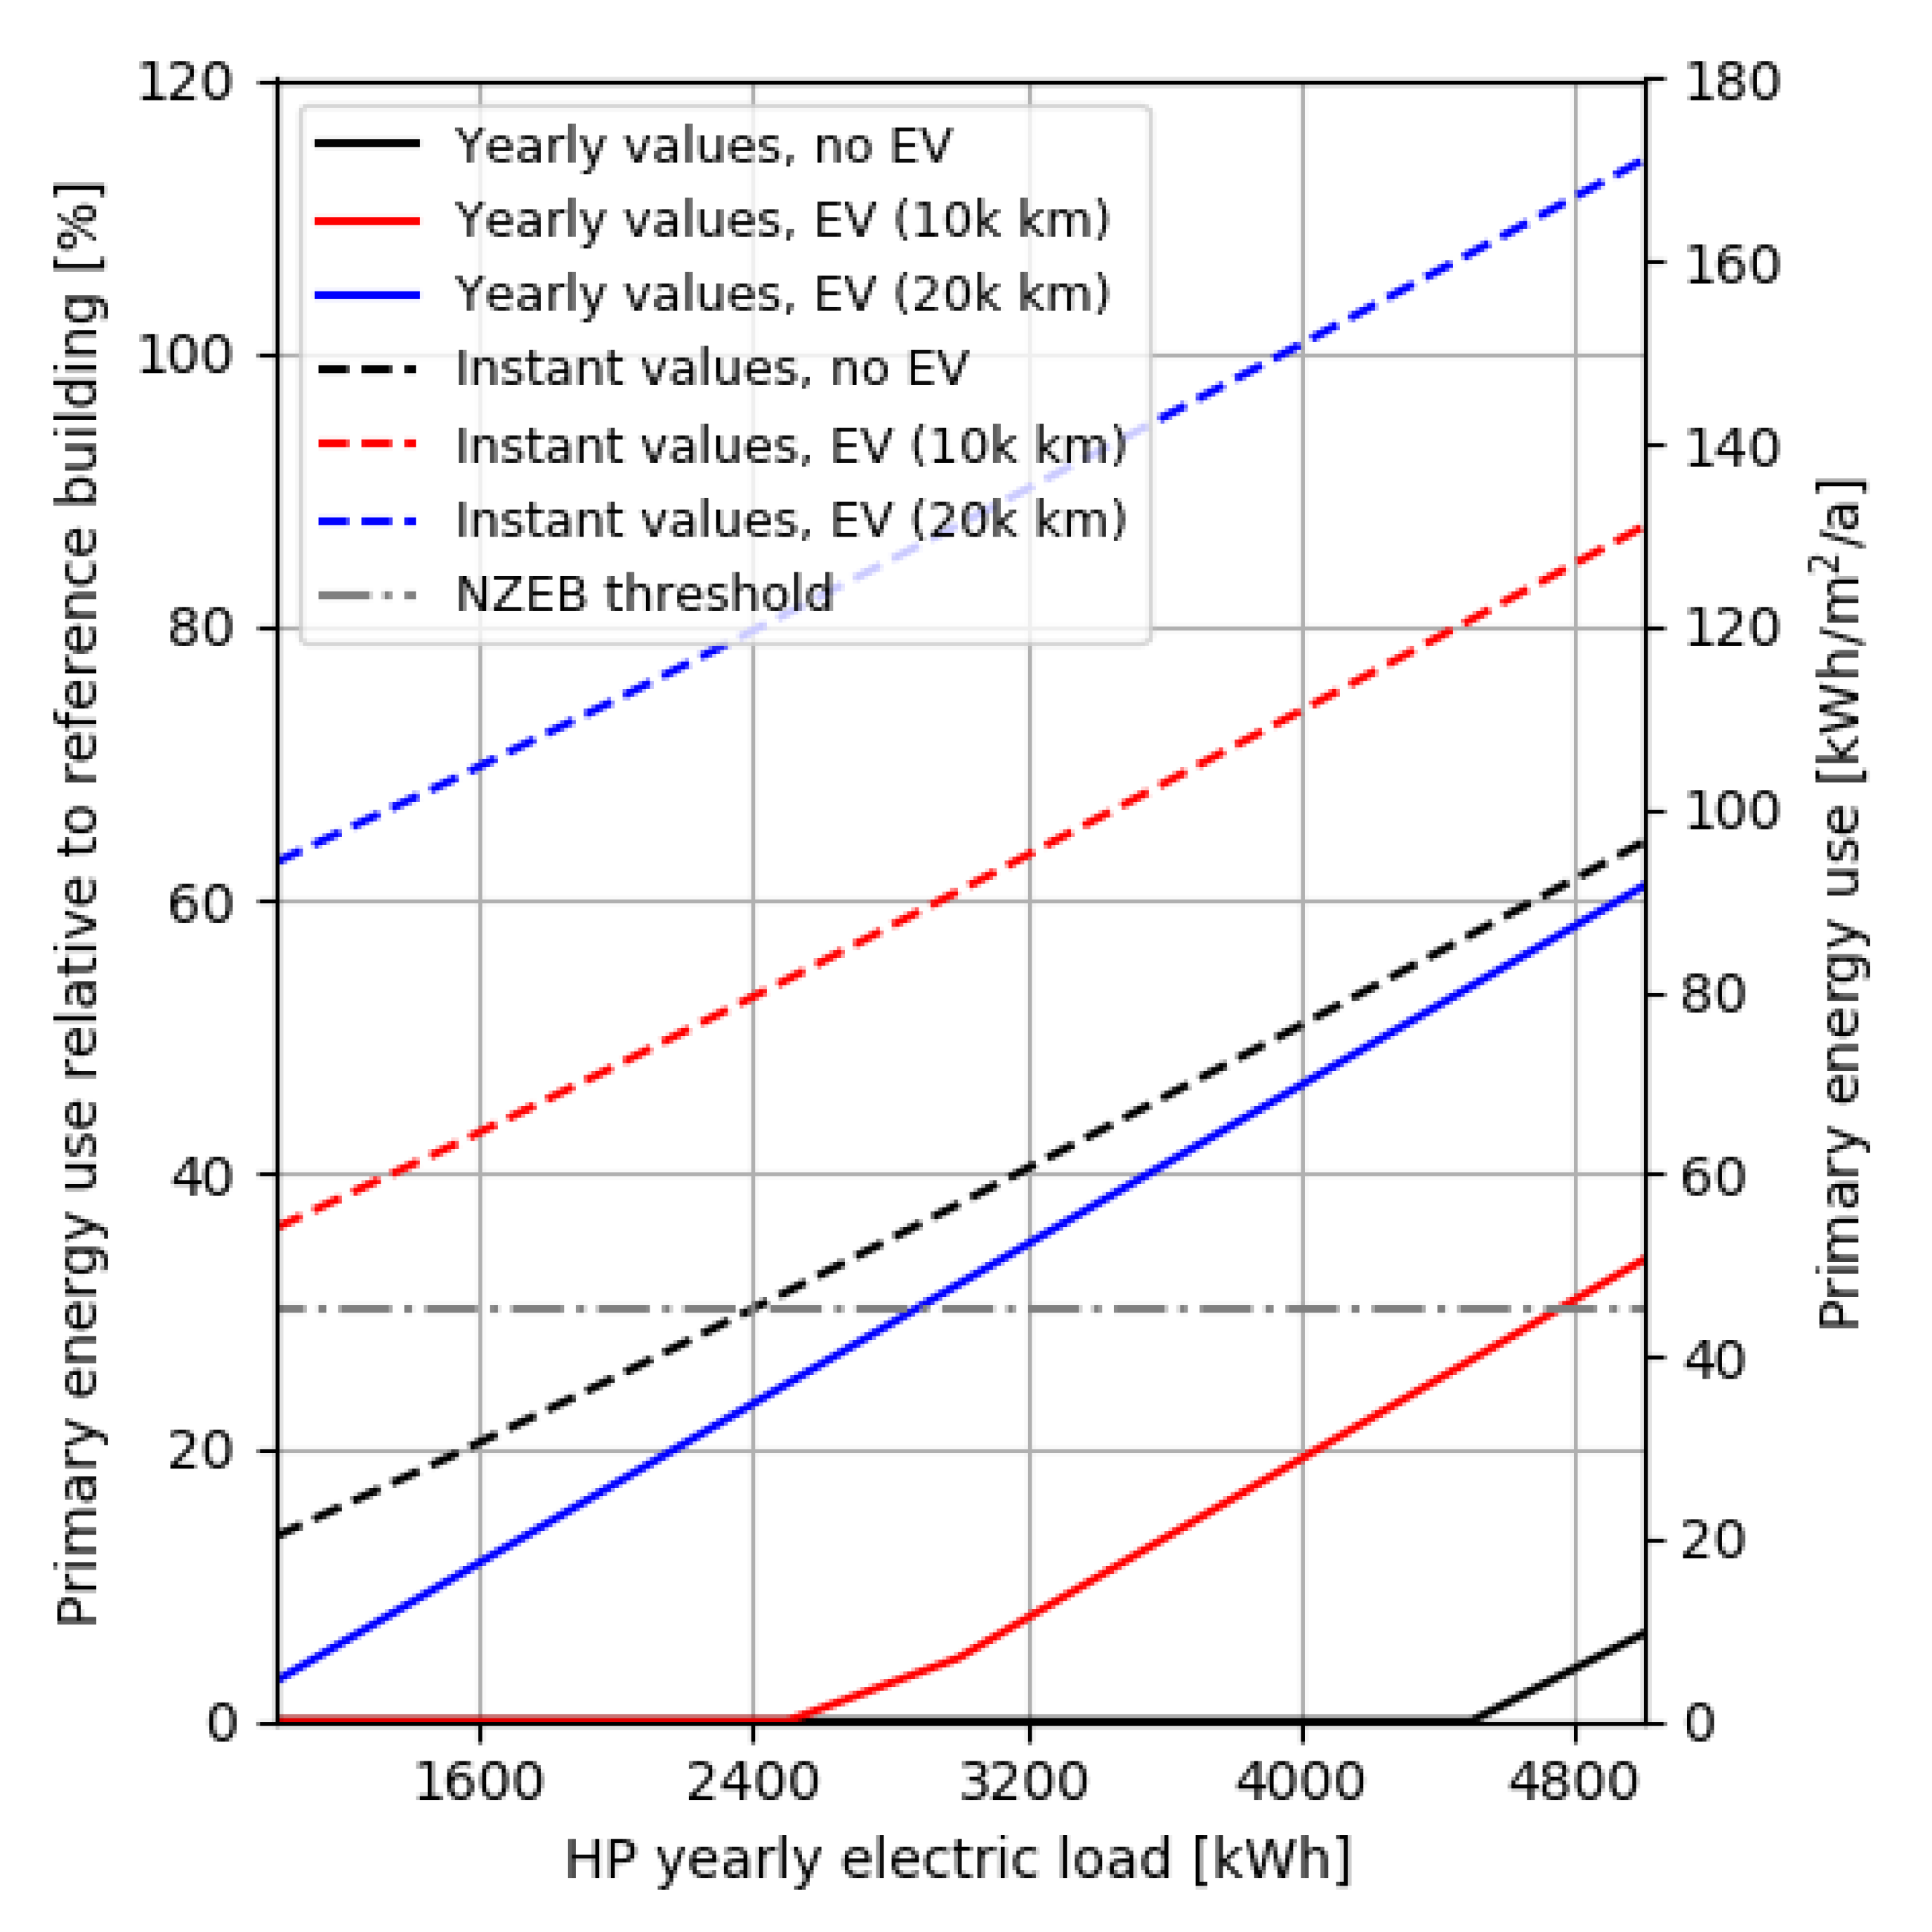
  • EVs are not included in the NZEB calculation or there is no EV on site (black line);
  • EV mileage is 10,000 km per year (blue line)
  • EV mileage is 20,000 km (red line)
The dashed lines indicate the instant calculation method, while the solid lines follow the current definition based on yearly values. The green dashed/dotted line is the NZEB threshold. The size of the PV installation is varied, while the HP demand is kept at 100% of the measured value. From Figure 2 it can be seen that PV is required to meet the NZEB standard, even in the absence of EVs. If EVs (up to 20,000 km annual mileage) were included in the current NZEB definition, a typical installation of 5 kWp, producing on average 5000 kWh per year, would be sufficient to comply with NZEB requirements.
The situation changes when the instantaneous calculation method is applied. In this case, for the two EV annual mileages of 10,000 and 20,000 km, the NZEB requirements cannot be met when including these loads as EV charging mostly occurs at night. A smarter and more flexible way of EV charging and potentially HP usage, taking maximum advantage of the surplus local PV production, would be valuable and required in this case as increasing the dimensions of the PV installation alone is not sufficient to meet the required NZEB threshold.

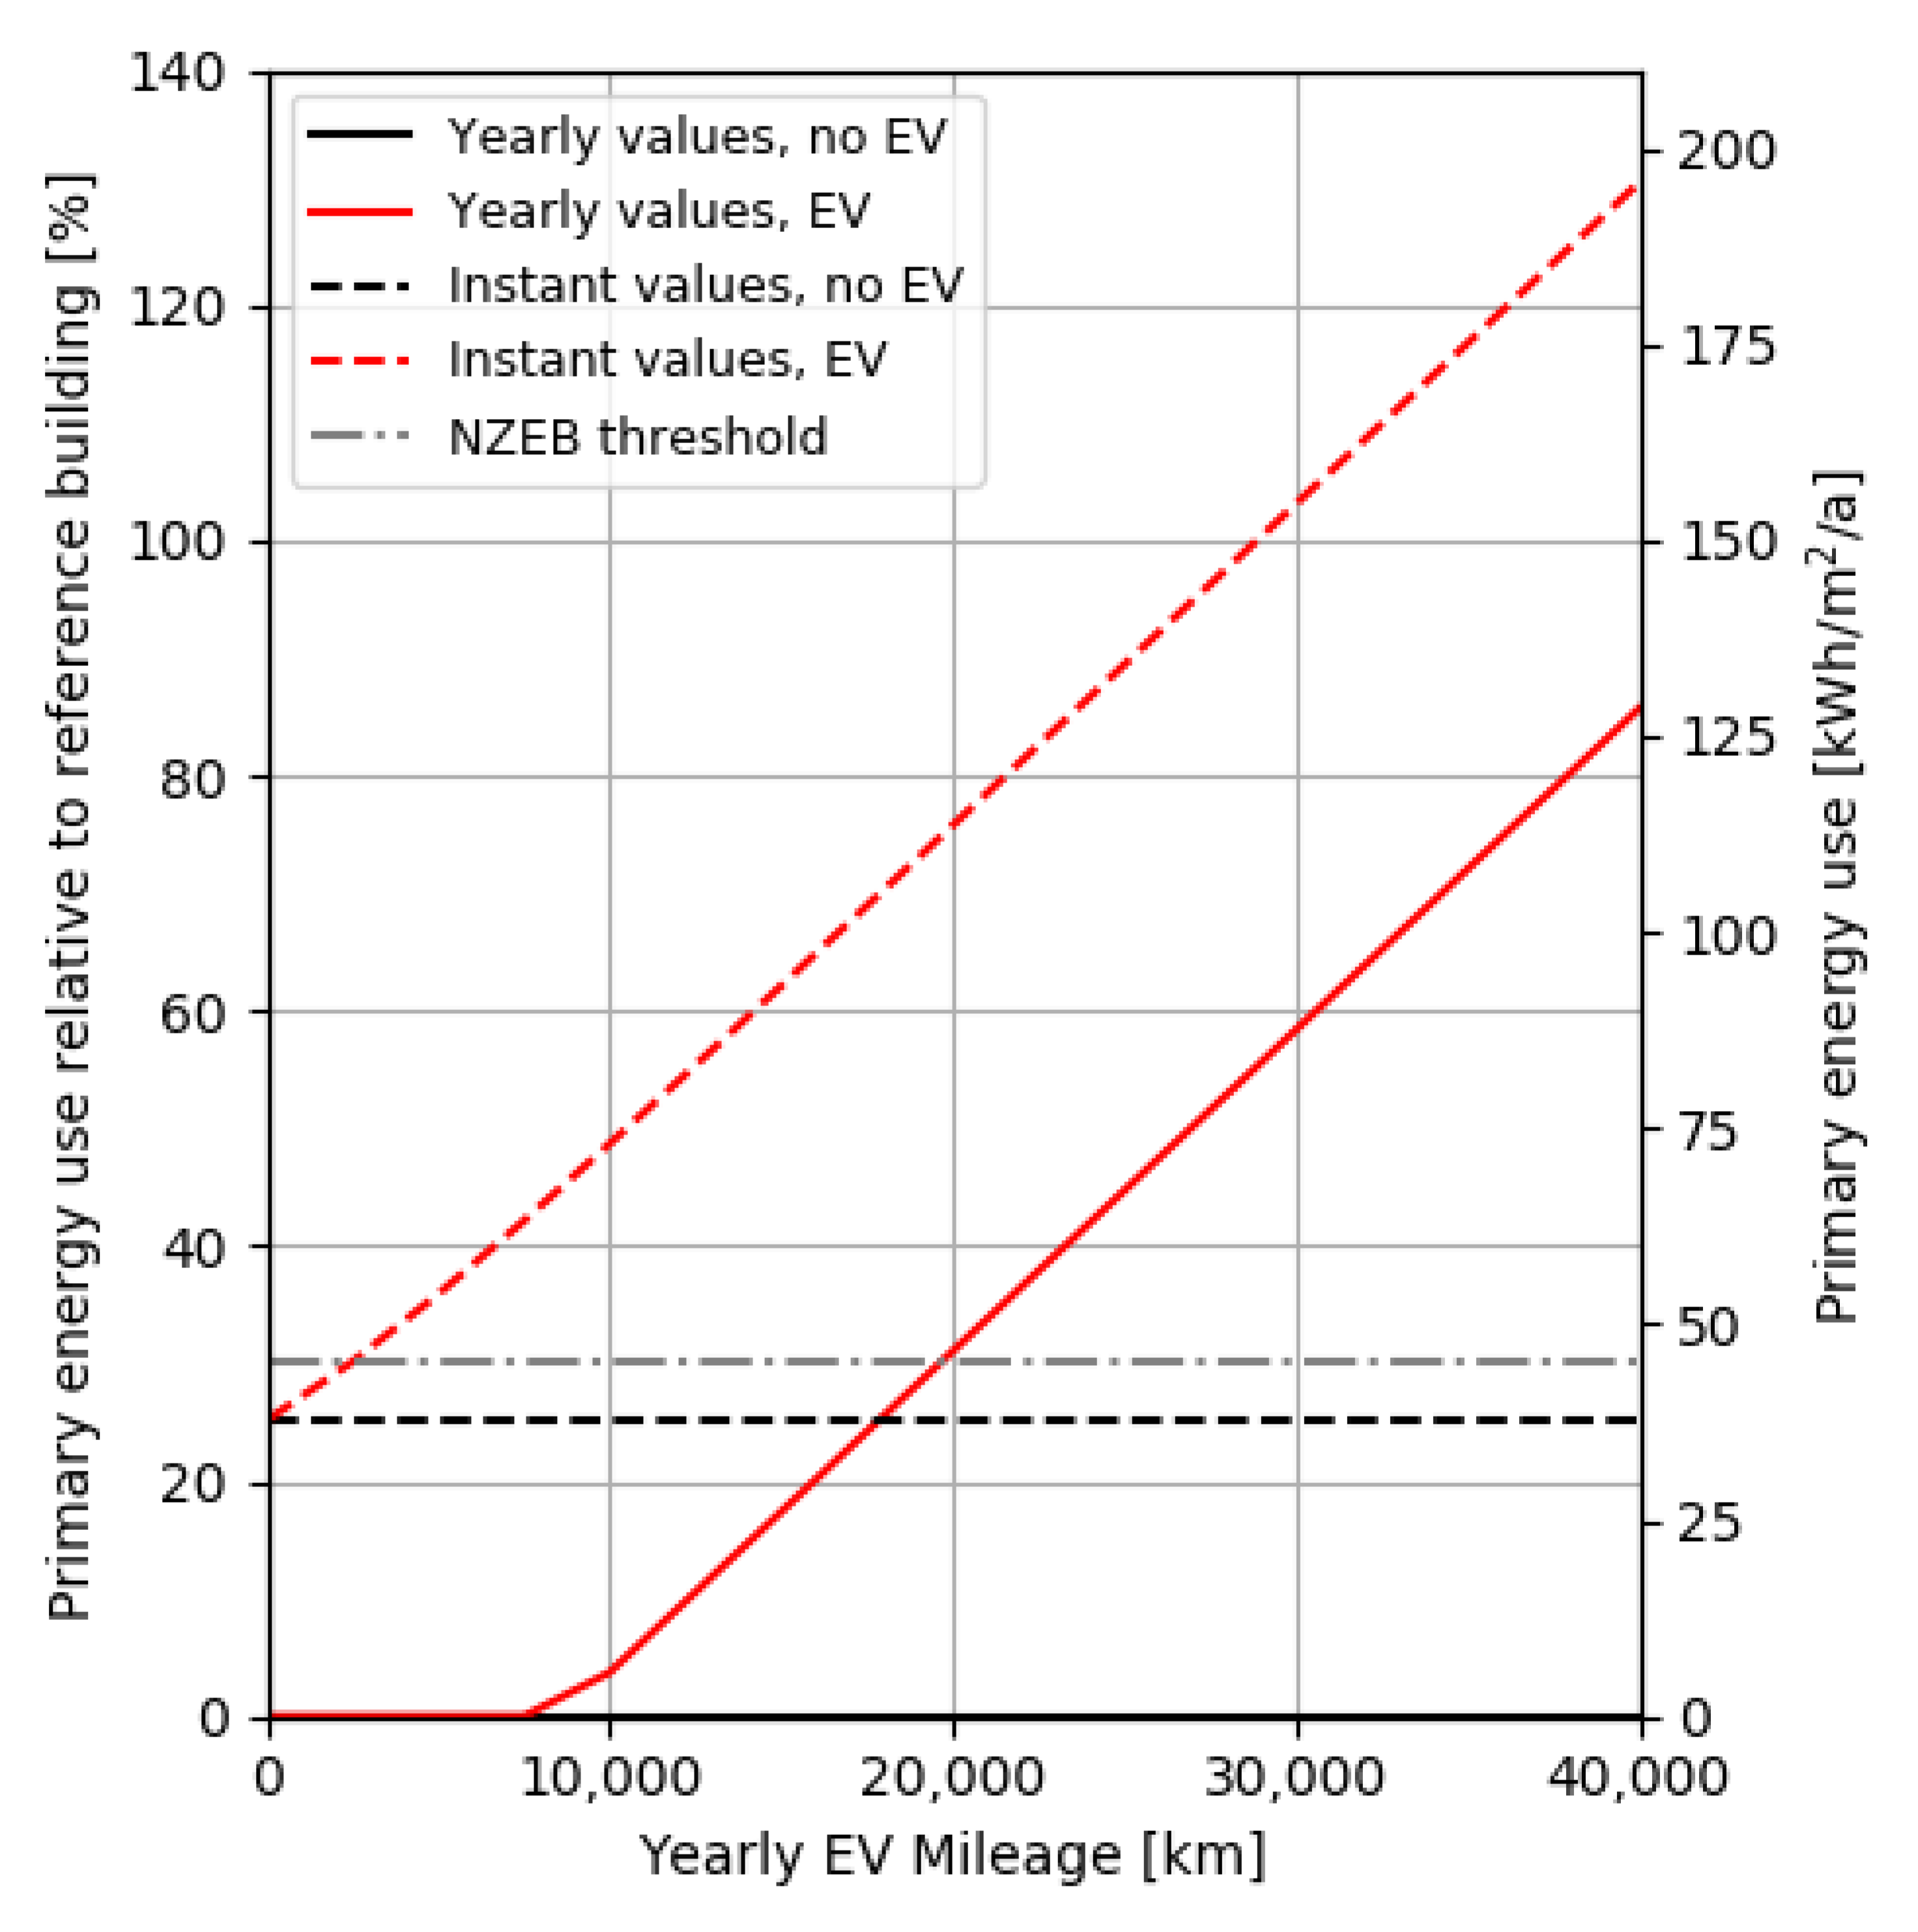
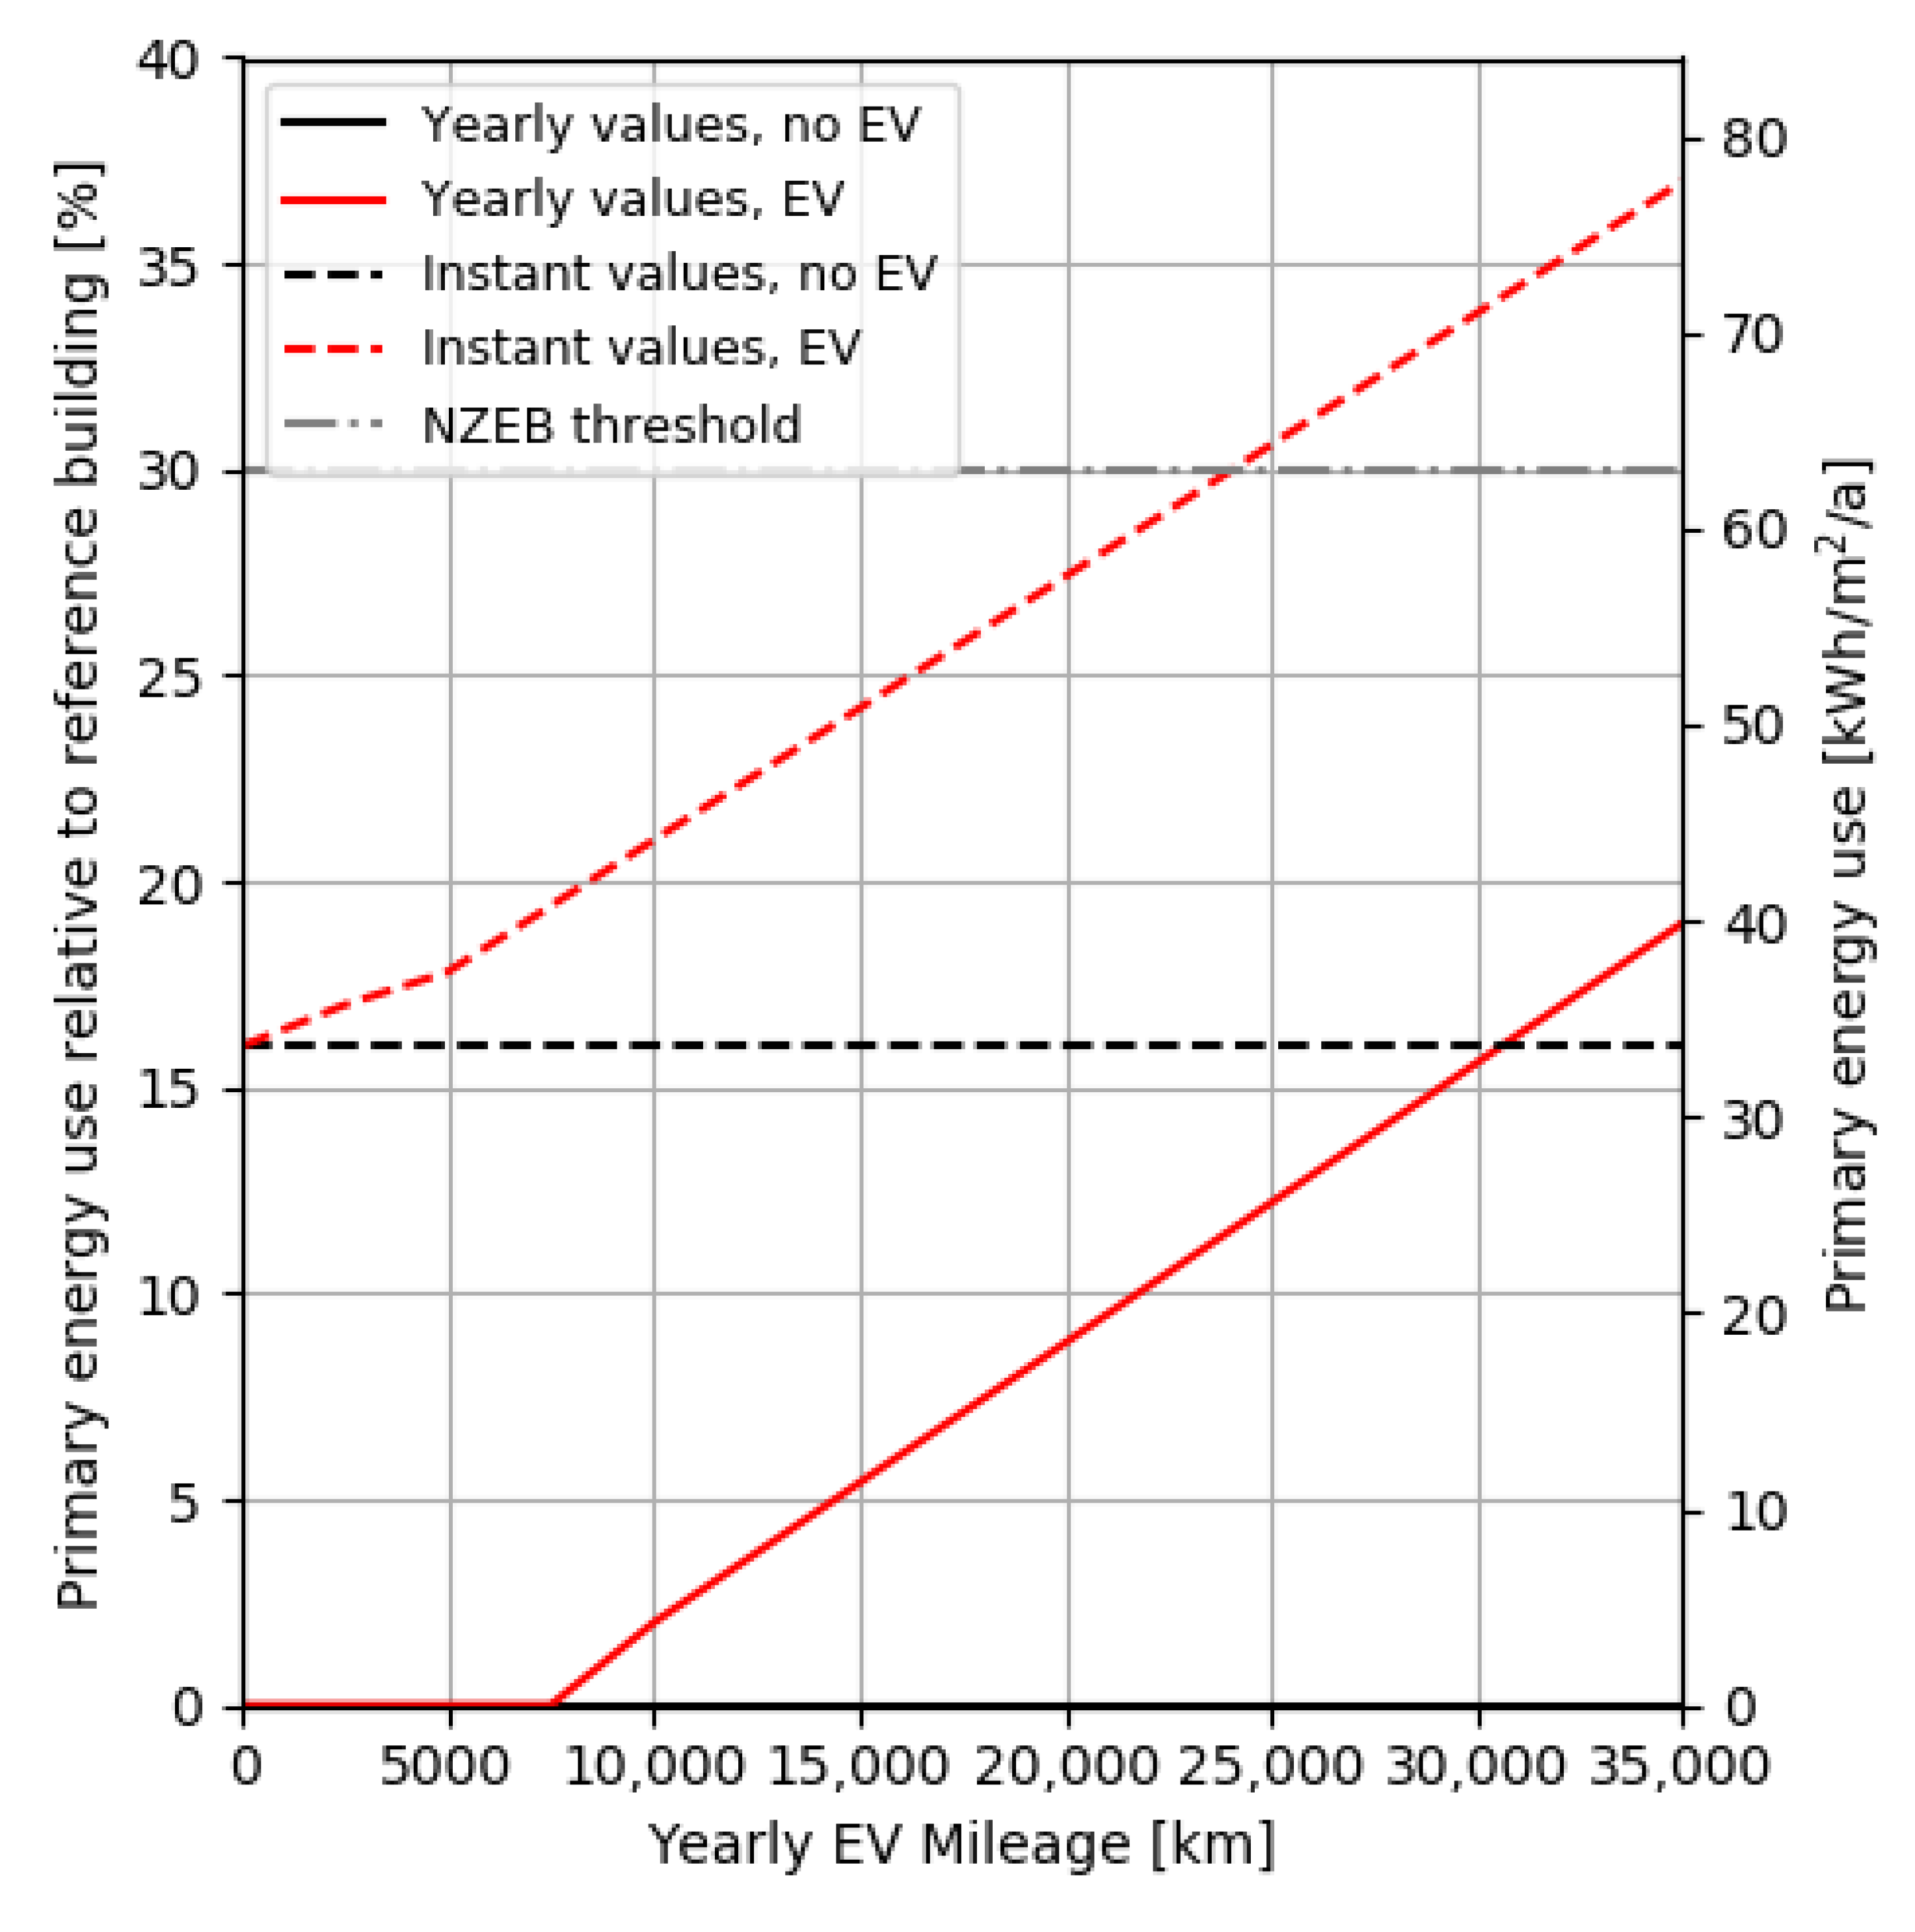
4.1.4. Sensitivity Analysis 2: EV Mileage

In this scenario, a common approach in Flanders, (Figure 3), the assumed PV installation has a capacity 4 kWp (yearly production of 4000 kWh), which is sufficient to cover the measured total energy usage of the dwelling of 3750 kWh per year 5. On top of this, EV charging is included, with a yearly mileage between 0 and 40,000 km. The black lines only include the thermal and auxiliary component for heating in the calculation (current NZEB definition), while the red curves also include the EV demand.
Figure 3 shows that when EVs are excluded, the yearly consumption of the primary energy (solid black line) is zero as the import of electricity to meet the building’s heating demand is zero and the building is able to meet the NZEB criteria. On the other hand, Figure 3 shows that when EVs are included in the traditional yearly evaluation (solid red line), about 20,000 km per year can be covered with the PV while still meeting the NZEB requirements; above 20,000 km the NZEB requirements are violated on a yearly estimation. This means that larger PV is needed, or EVs must be excluded from the calculations if NZEB requirements are still to be met. It can also be noted that using the instant evaluation method that considers an EV annual mileage of up to 2000 km (dashed red line) in the calculation also meets the NZEB standard. However, the requirements are violated after this limit, indicating the need for a more flexible charging profile and/or larger PV installation.

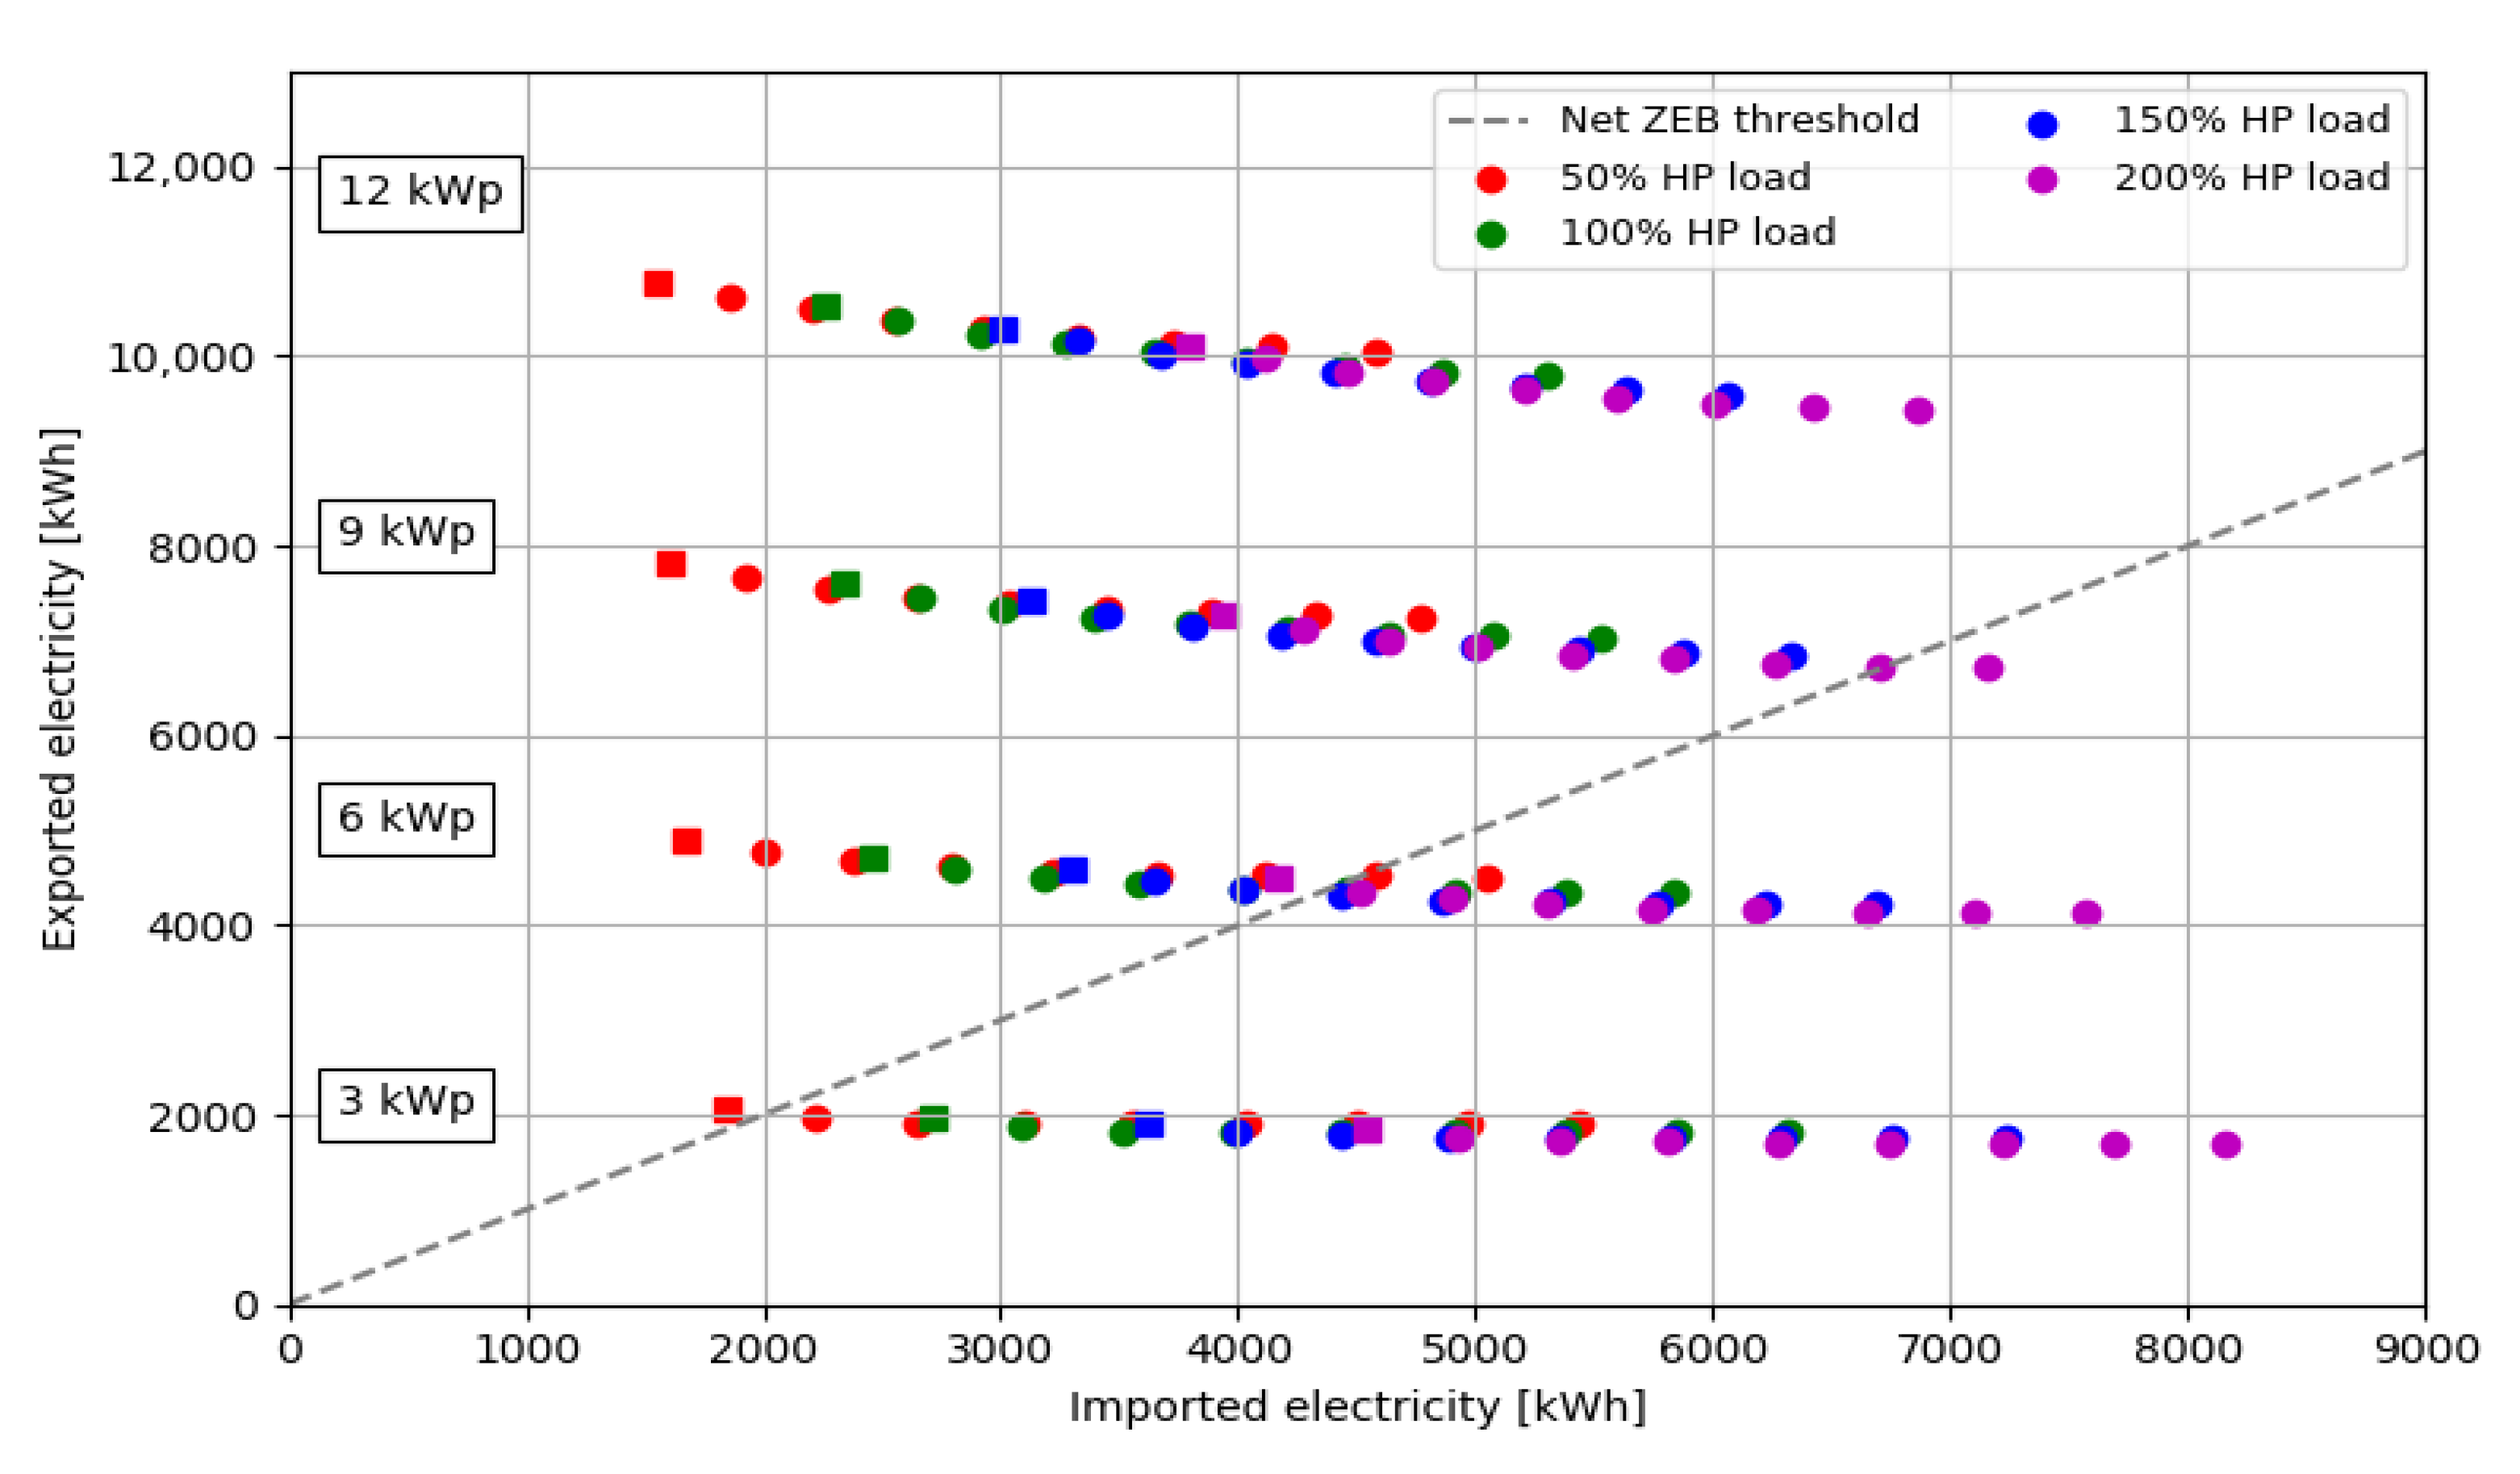
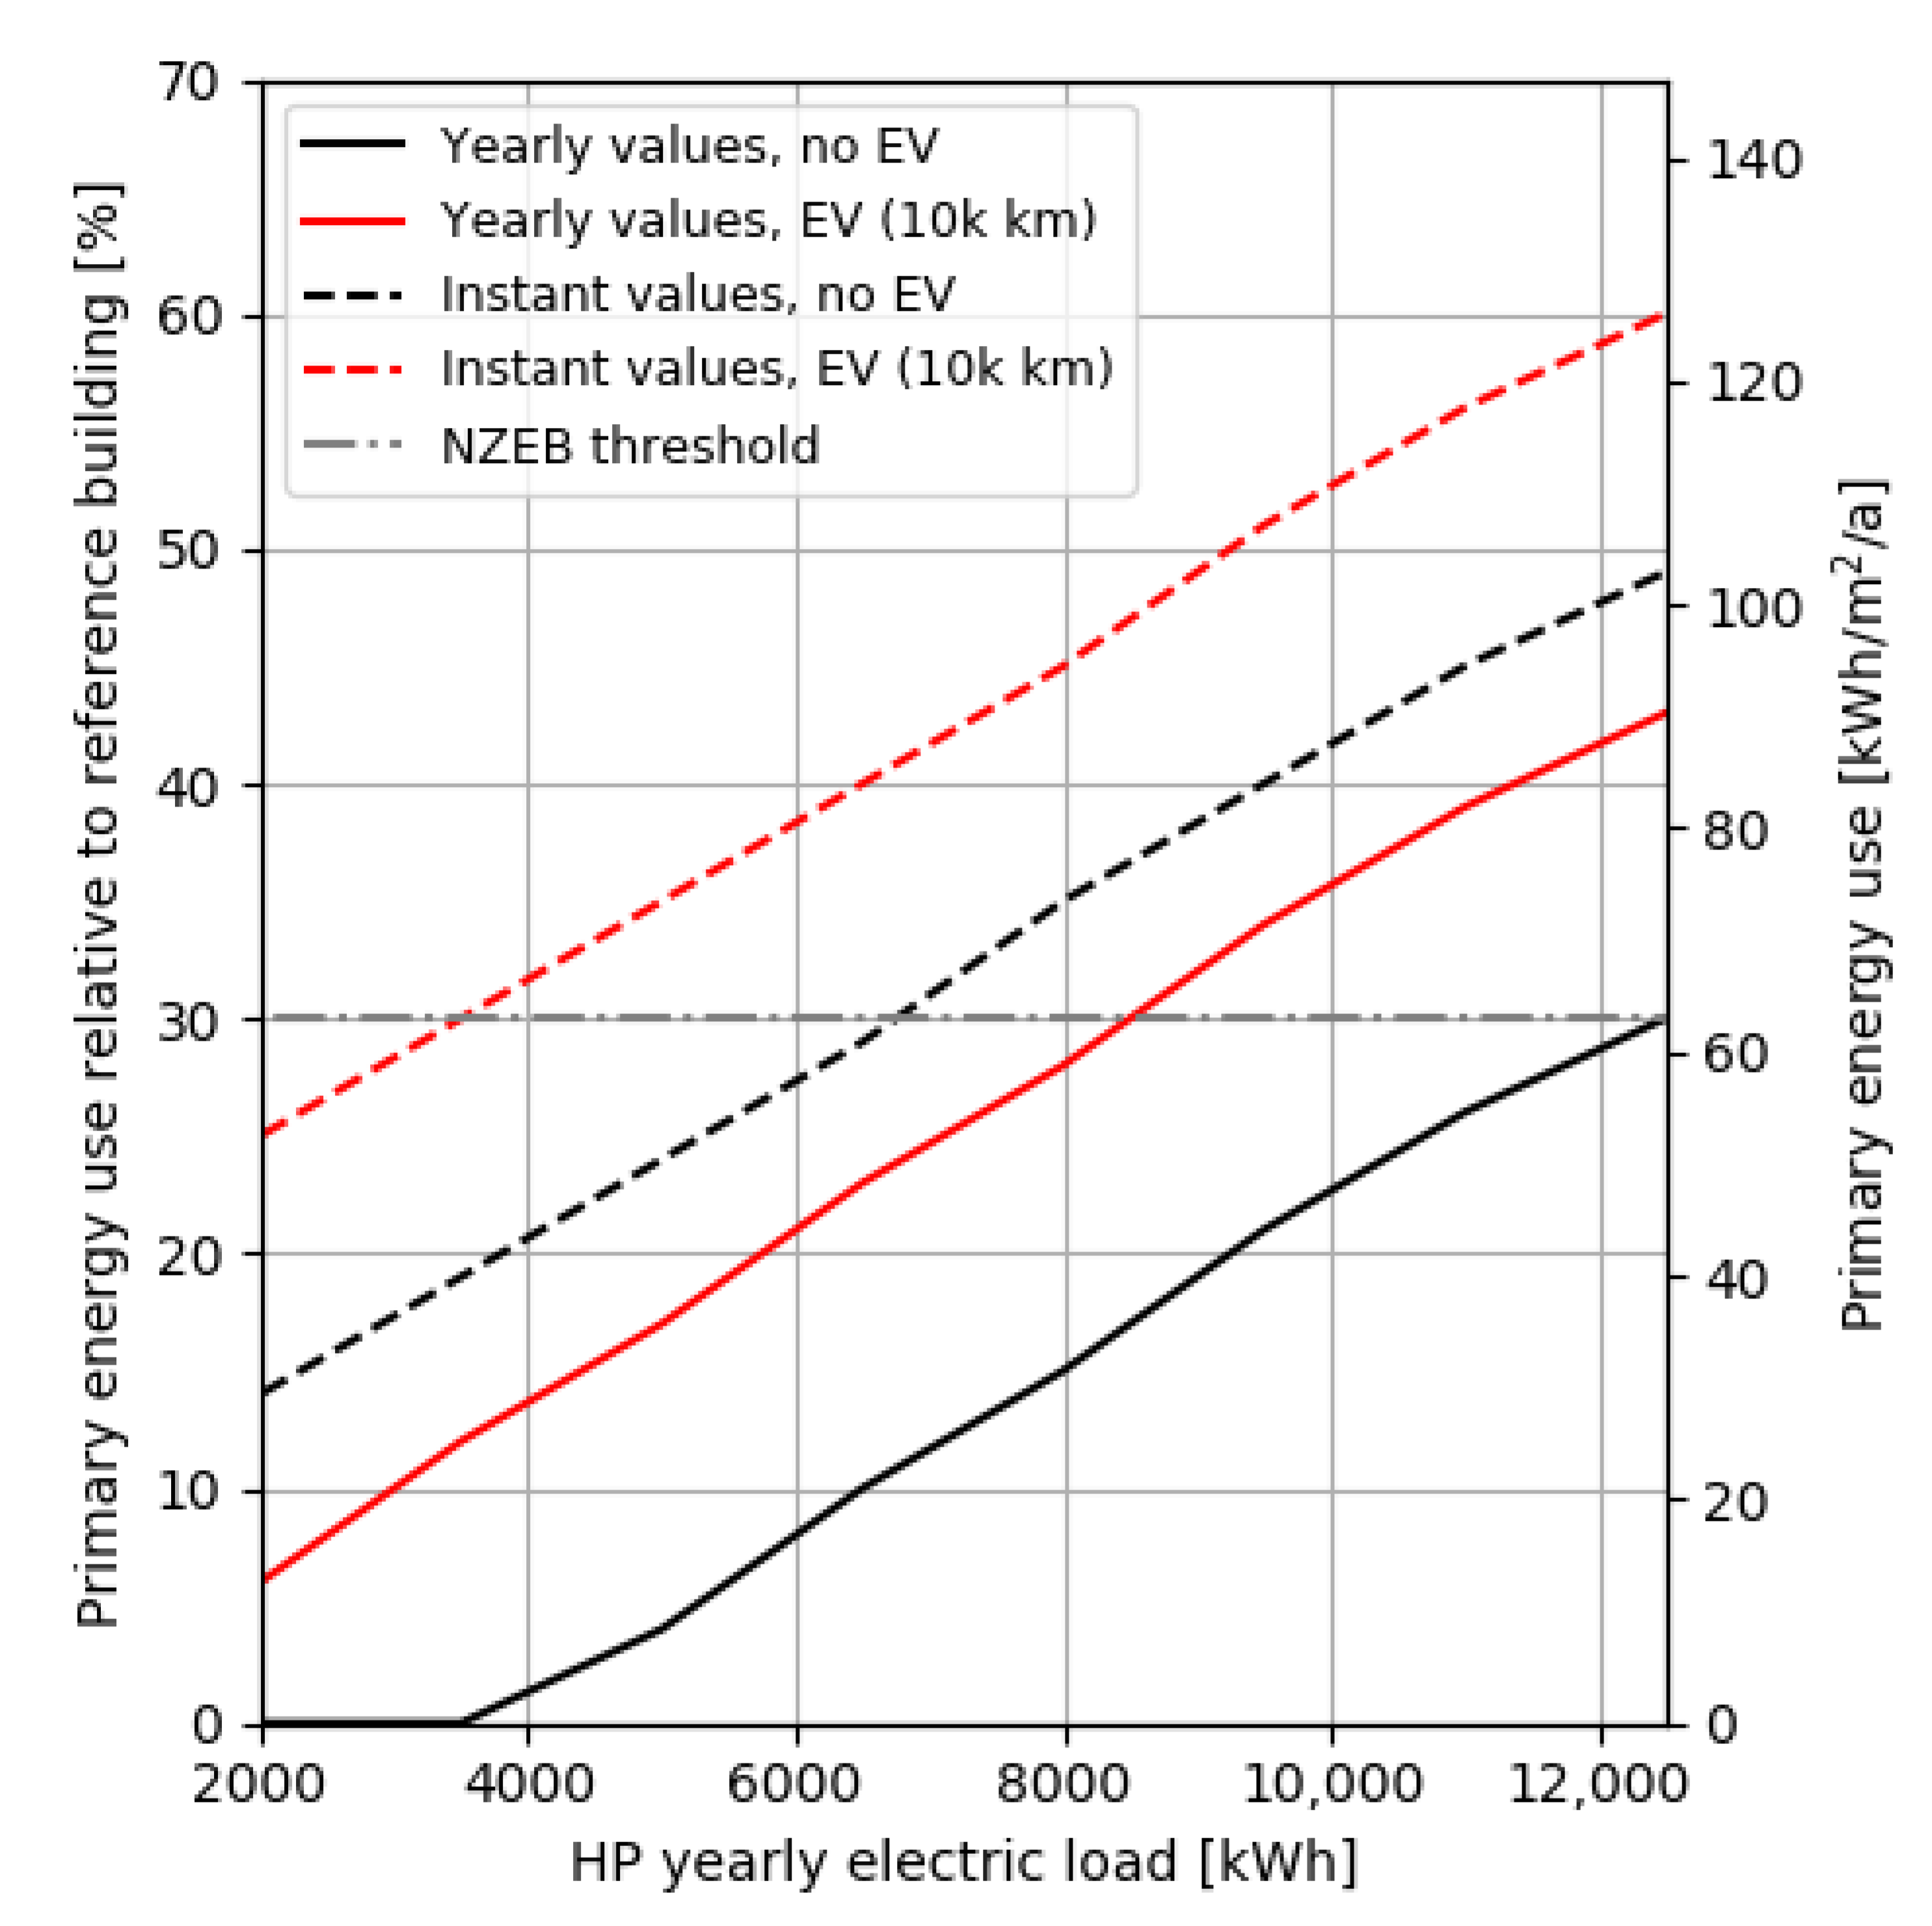
4.1.5. Sensitivity Analysis 3: Heat Load

In this scenario, the PV capacity is fixed at 5 kWp, while the total electricity demand of the HP varies between 1000 and 5000 kWh per year (Figure 4). Note that the measured HP demand is 1940 kWh per year. Again, two sub-scenarios that include EV with a total yearly mileage of 10,000 and 20,000 km respectively have been considered (Figure 4). Similarly, to the previous scenarios, the inclusion of EVs in the current yearly calculation method will not lead to violations in most situations where both the heat demand and EV usage are not excessive. However, when the instant method is applied, the situation changes as the 30% threshold cannot be achieved for the present configuration.

4.1.6. Net ZEB Estimation

Considering the Net ZEB definition, Figure 5 shows the results for different scenarios in case study 1. The square data points indicate scenarios where no EV charging is present. HP demand varies between 50% and 200% of the measured value in steps of 50%, while the EV mileage ranges between 2500 km and 20,000 km. The step increase between the two consecutive points is 2500 km for the EV mileage. Each colour represents scenarios with the same HP demand but with varying EV mileage. In Figure 5 the square data points indicate scenarios without EV and different HP demand loads (different colours). Circles are scenarios that include EV charging with a step increase of 2500 km. Plug loads are also included but are kept fixed at the measured values. For this case, when the PV capacity is 6 kWp, the building is Net ZEB when an EV is excluded; however, in many scenarios the building violates the Net ZEB status when an EV is added and the EV mileage is high. Therefore, to reach Net ZEB, a higher capacity of PV (>9 kWp) is needed when an EV is included within the building calculation boundary as the energy demand increased. Otherwise, the building can be considered Net ZEB if EVs are excluded, even if the PV capacity is smaller (6 kWp) as the total electricity demand is low. This shows that fulfilling the Net ZEB and NZEB criteria of the building is significantly affected by the type of load included in the calculations.

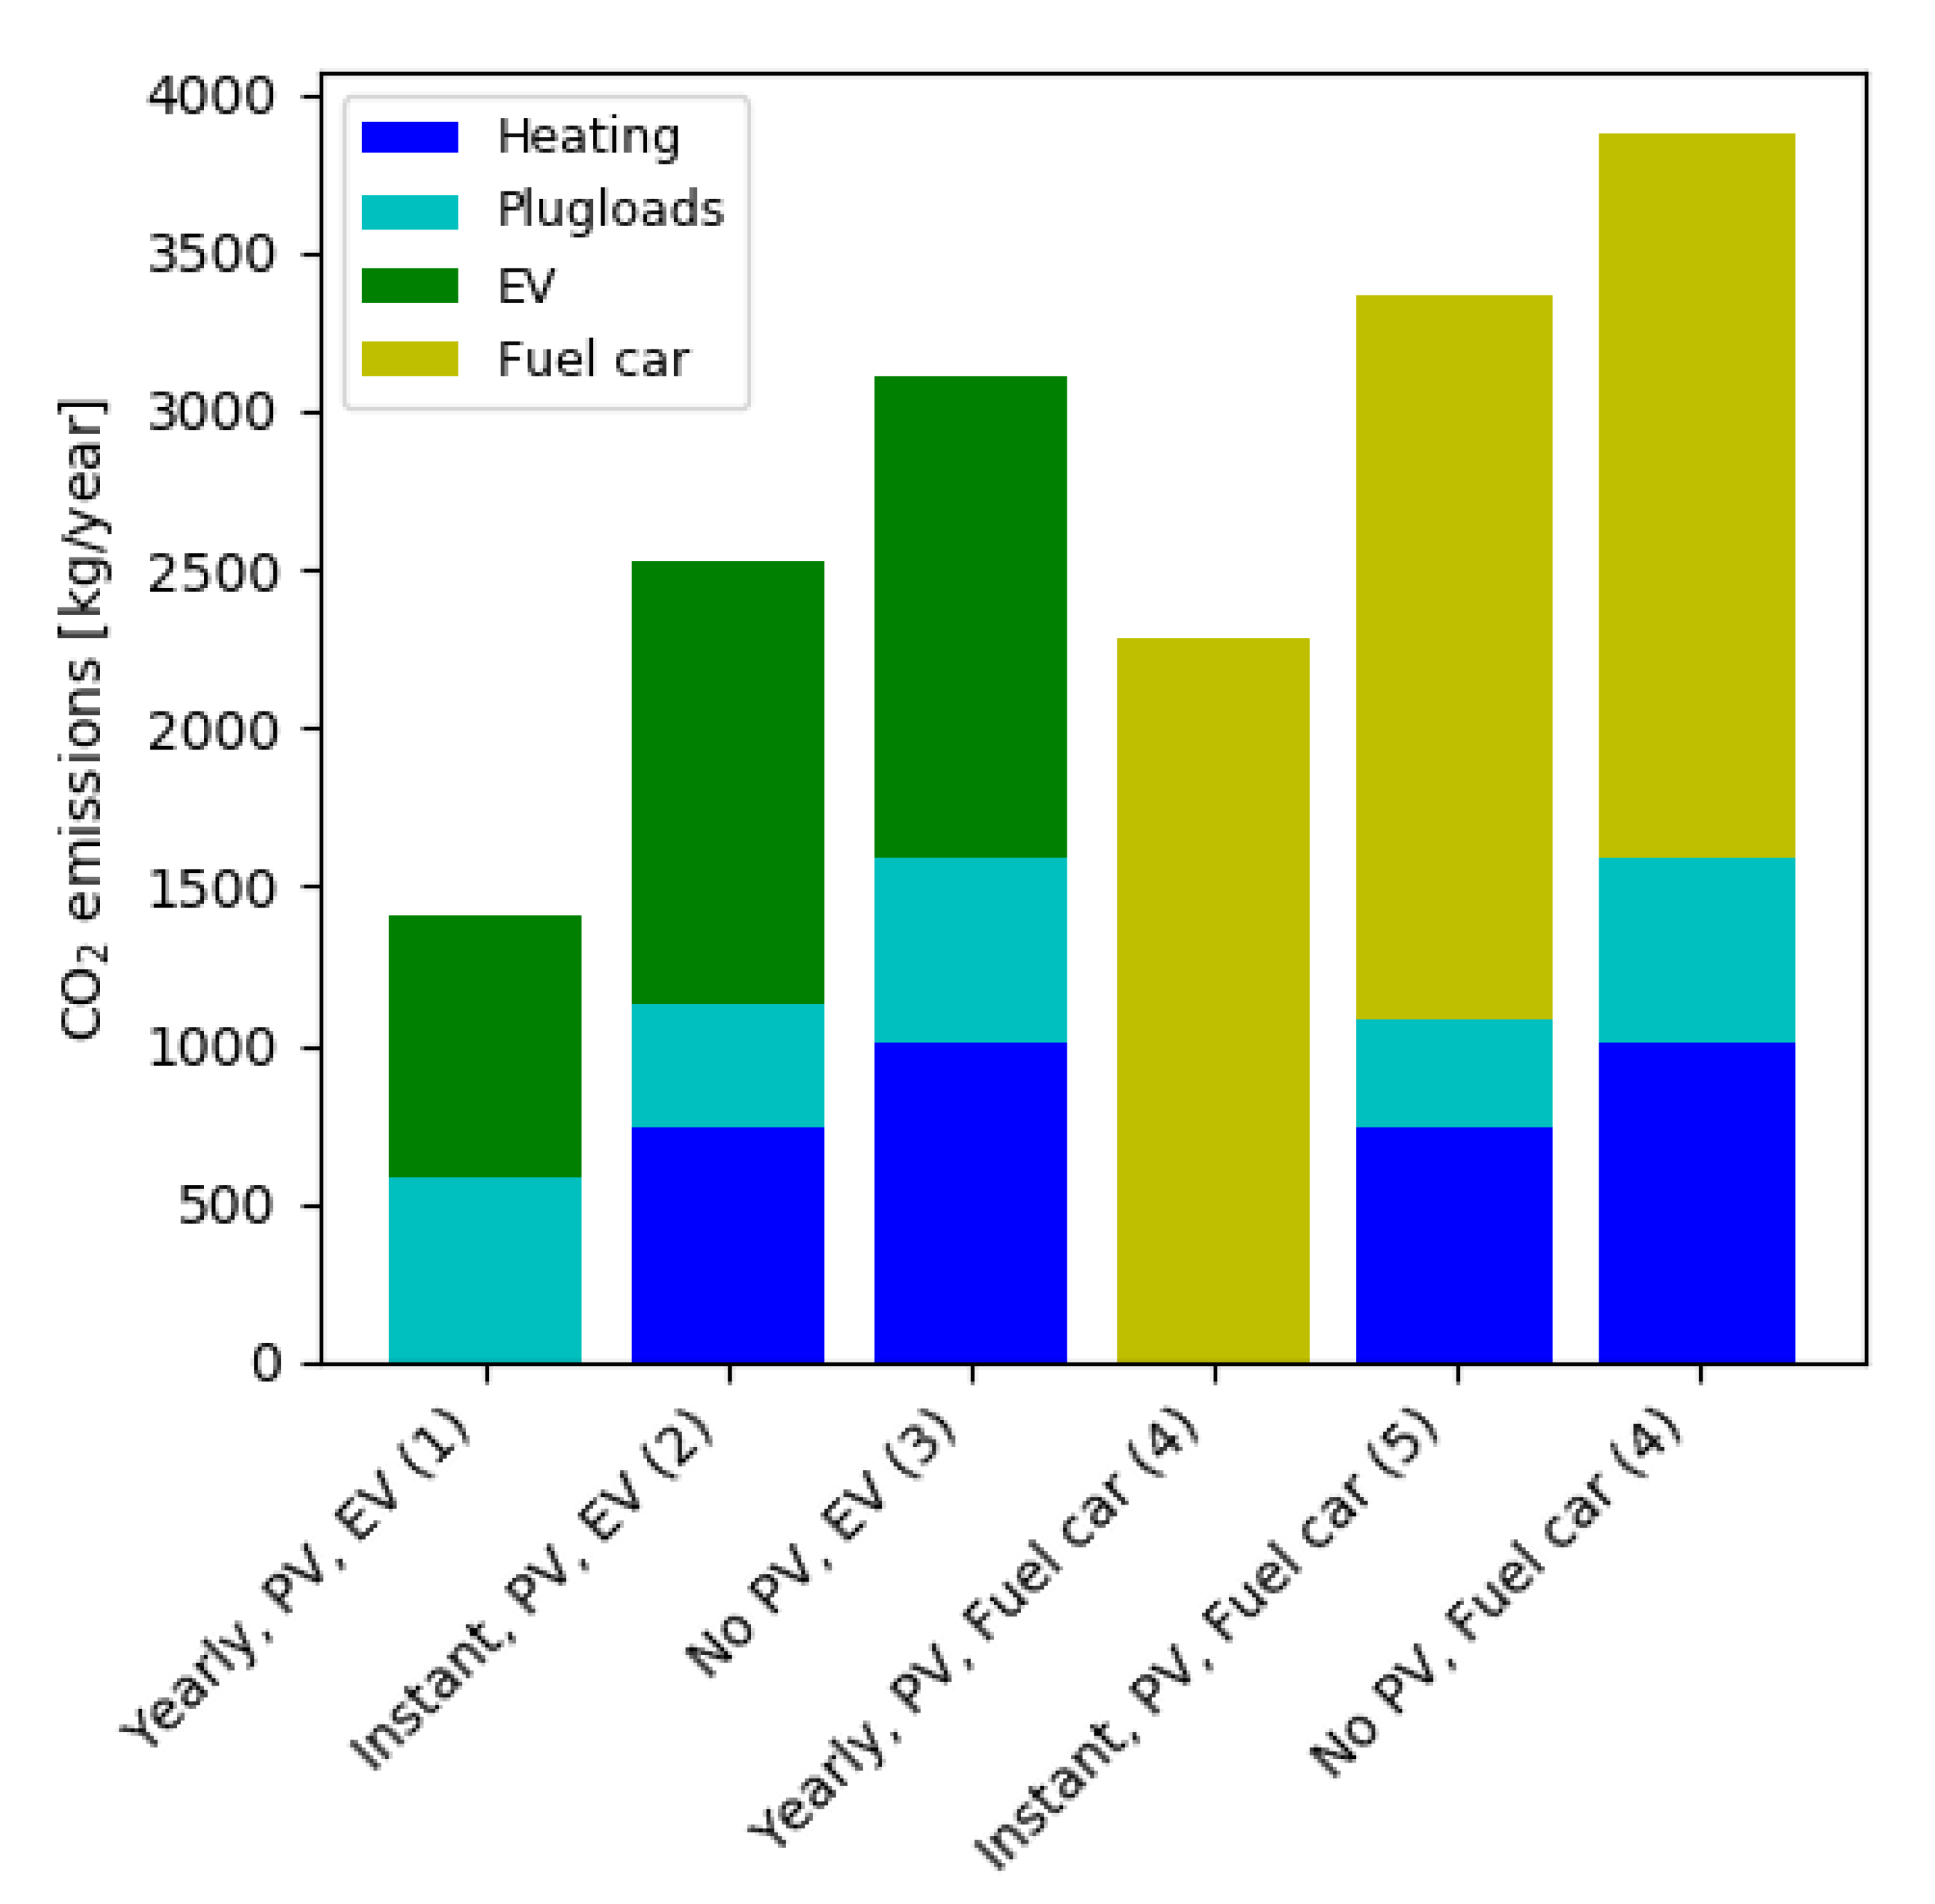
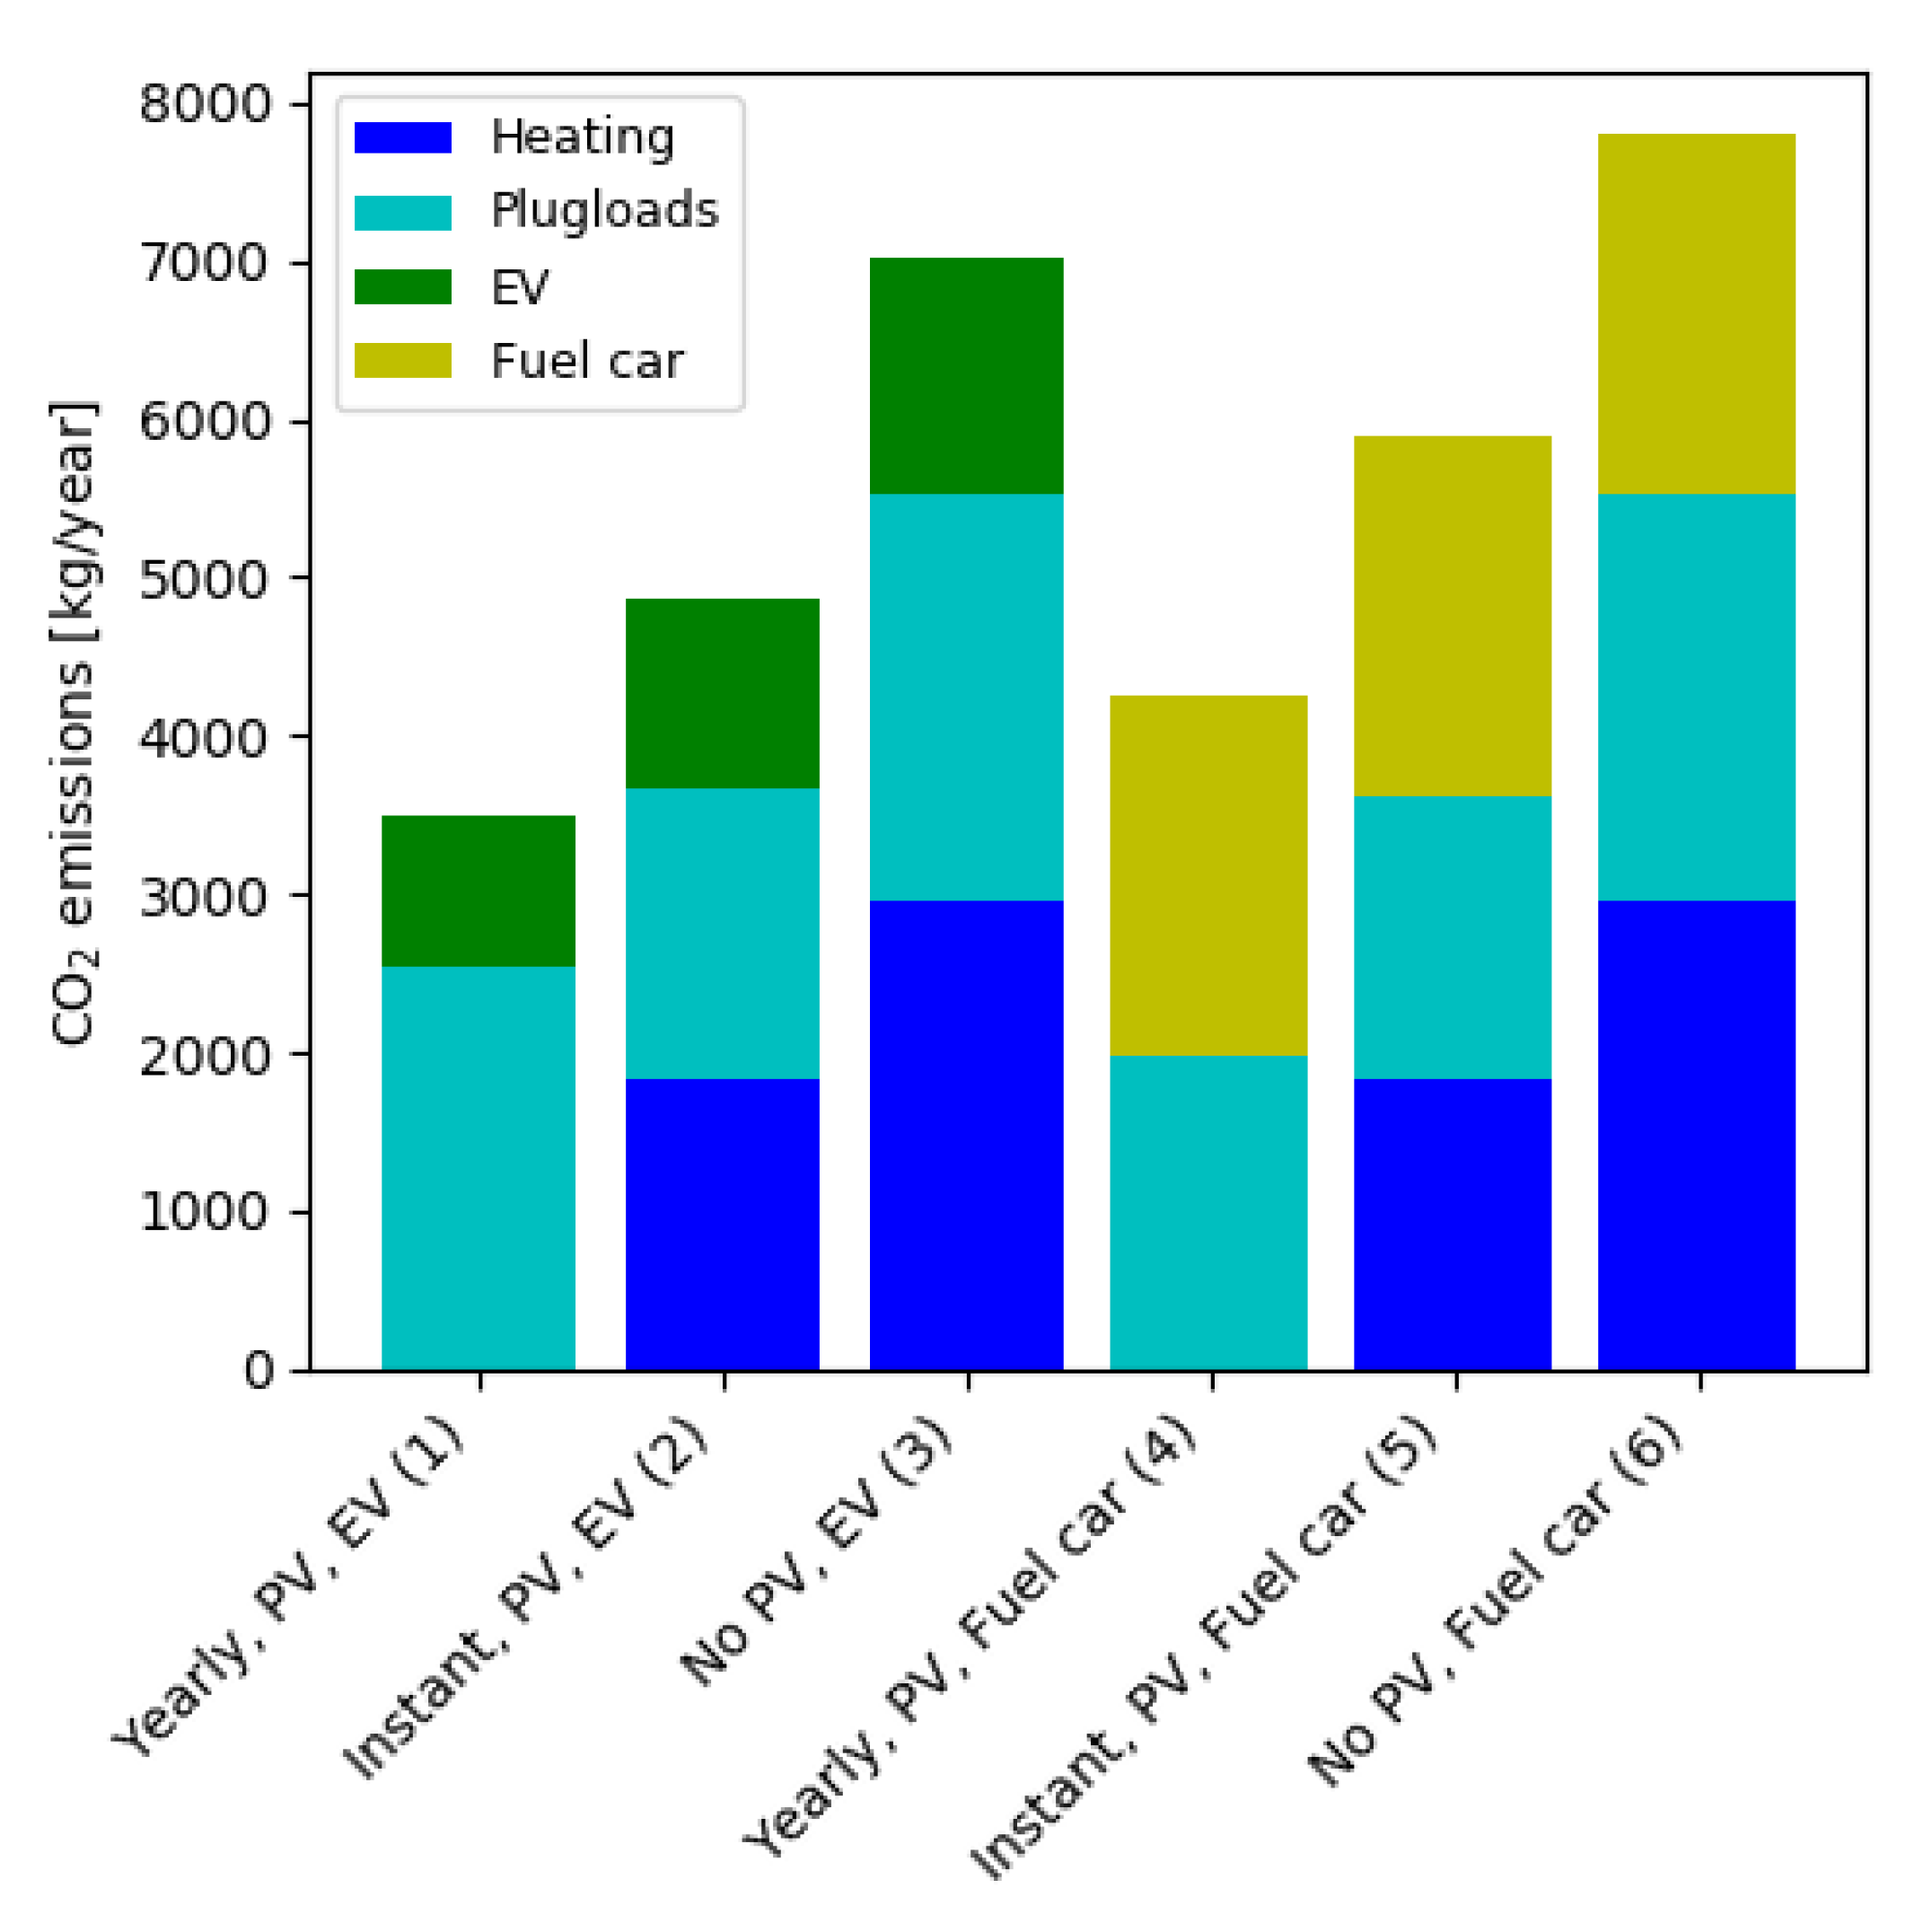
4.1.7. CO2 Emissions

In this sub-section, a comparison of CO2 emissions related to the heating system, remaining plug loads and mobility, either by EV or by fossil fuel car, is made. A yearly mileage of 20,000 km is assumed. For a fossil fuel car, average CO2 emissions of 120 g per km are assumed [52]. CO2 emissions for imported primary energy are 169.6 g per kWh [53] and the EV consumption is 18.75 kWh per 100 km [54]. When the EV is charged with electricity taken from the grid, the CO2 emissions would thus be 79.5 g per km. A 4 kWp PV installation is used, which covers the yearly load as can be seen by scenario 4 in Figure 6, where all CO2 emissions are due to mobility. Electricity produced by PV is first used by the thermal energy system, followed by EV charging (if present) and plug loads.
When considering the net yearly balance between demand and supply (scenarios 1 and 4), where the EV replaces the fossil fuel-based car, the total CO2 emissions can be reduced by 38%. It should be noted that the EV is not free of CO2 emissions. In the case of the instantaneous evaluation (scenarios 2 and 5), a reduction of 25% in CO2 emissions is possible. In this evaluation, purely dwelling-related emissions are slightly lower in the case of a fossil fuel-based car, as part of the locally produced PV energy can be consumed by the plug loads instead of the EV. For completeness, scenarios 3 and 6 do not include PV and lead to the highest emissions. Replacing the fossil fuel car with an EV leads to a reduction of 20% in emissions in this case.

4.2. Case Study 2: Belgian Single Family House

This case study was part of the project, with the aim of demonstrating the added value of storage on minimising the impact on the local electricity grid at a residential level. The storage technologies that are embedded on the site are two types of batteries, seasonal thermal storage, short-term thermal storage and a shallow geothermal system. The recently renovated building, which combines residential and office functions, surpasses the passive house standards. A total of 350 m2 is heated using a 1 kW electric heat pump. Heat recovery from shower water reduces the energy needs for domestic hot water preparation, while the mechanical ventilation ensures good indoor air quality on a zone level. In addition, energy-efficient appliances as well as LED lighting are in place. Some of the 33 PV panels were hybrid PV thermal panels (PVT). Heat from the PVT panels is used to thermally regenerate the shallow geothermal field while increasing the electricity production efficiency. Solar thermal collectors are also present and can generate heat at higher temperatures. This heat can be used directly for space heating, domestic hot water production, or stored in the seasonal storage tanks. Next to this, two electric vehicles are present. The schematic diagram of case study 2 is shown in Figure 7. Only the electrical flows (green) paths are considered in the calculations, while the heat flow path (brown) is not considered. Moreover, for the electrical load, the solid green lines are considered in the calculation of NZEB criterion, while the solid and dotted green lines are considered in the Net ZEB criterion. Lastly, the batteries are excluded from this case study in order to simplify the calculations and make it closely comparable with case study 1.
The demonstration must be considered as a showcase to integrate different renewable energy sources and cannot be considered as an average Flemish dwelling. The analysis below therefore indicates the effect of including an EV in the NZEB evaluation in a highly renewable energy setting with both the yearly and instant evaluation methods. It should also be noted that the building serves both as a residence and as office space.

4.2.1. Input Data Specifications

Sub-metering is performed on the heat pump and ventilation system. Power consumption of the eight circulation pumps is estimated based on the measured pump status, pumping characteristics, known pressure drop and mass flow rates. Additionally, a constant 250 W power consumption is added for all peripherals of the energy system including control, actuators, monitoring and data logging.

4.2.2. Base Case Results

Table 3 summarises the main energy and economic key figures for the measuring period. Despite the high amount of PV production, locally produced electricity only accounts for 50% of the electricity demand, with 57% of the locally produced electricity being self-consumed. Without PV, the demo case would lead to 7309 kg of CO2 emissions due to electricity use, which can be reduced by 3680 kg or approximately 50% by local PV production. From Table 3, the difference from case study 1 in terms of total load is also clear: 13,008 kWh per year compared to 3750 kWh per year for case study 1.
A monthly breakdown of the electricity demand and local production at the case study site is presented in Figure 8. The total electrical load shows a small degree of seasonality. When combining all loads, PV production exceeds demand only in June and July. When excluding EV demand, the base load for May and August are also covered. During the remainder of the year, a net supply from the grid is required.
The energy system also exhibits a small seasonal pattern, peaking during the heating season. A relative increase during the summer months (June to September) can also be observed. This is due to elevated pumping power required in the cooling circuit of the PVT panels. It should also be noted that the solar thermal collectors directly deliver a large proportion of the thermal energy demand for both space heating and domestic hot water production.
Based on the EV charging load and assumed 18.75 kWh per 100 km driven based on the specifications of both EVs, the yearly mileage of both EVs combined equals 19,000 km.

4.2.3. NZEB Criteria and EV Inclusion

According to Table 1, the NZEB definition for the region of Flanders in Belgium stipulates that a building have a primary energy need of at most 30% compared to the reference building. This value is calculated based on the volume and envelope area of the building itself and is equal to 242,848 MJ of primary energy. Hence, to qualify as a NZEB, the case study’s primary energy used for heating, cooling and DHW production, including all peripherals, should not exceed 72,854 MJ or 20,237 kWh per year, corresponding to 57.8 kWh/m2/a. As more site energy is produced by PV (8345 kWh per year) than is consumed by the thermal energy system (6989 kWh per year), there is no primary energy need of the thermal energy system and the NZEB condition is met. Alternatively, when the instantaneous method is considered, 4610 kWh per year of grid electricity is required. This is equivalent to a primary energy demand of 11,525 kWh per year or 17% of the reference building, meaning that the building also meets the criterion when employing this method. When including EVs in the calculation, the additional amount of primary energy required is 5529 kWh per year or 8% of the reference building, and the building still meets the requirements. In addition, when considering the self-consumption of PV energy, this value becomes 18,542 kWh per year or 27% of the reference building, also meeting the criterion. In the next sub-section, the input data will be varied to investigate the influence of the size of the PV installation on the conditions to meet the NZEB criterion for this case study in a similar way to case study 1.

4.2.4. Sensitivity Analysis 1: PV Sizing

The size of the PV installation is varied between 0 kWp (no PV) and 20 kWp (2.5 times the current size). The PE use with respect to the reference building is shown in Figure 9. The solid lines show the evaluation based on the yearly values, while the dashed lines consider instant evaluation. The black lines do not include the EV in the calculation, while the red lines do.
With no EV included, following the yearly evaluation NZEB definition, the requirement is met even without a PV installation. When an EV is included in this evaluation, a small PV installation with a yearly yield of 2 kWh would be required to meet the NZEB condition.
When considering the instantaneous energy streams and PV self-consumption (dashed lines), the evaluation of scenarios both excluding and including the energy required by the EVs asymptotically approaches the values of 16% and 25%, respectively, for an infinitely large PV installation. Increasing the dimensions of the PV installation will lead to more overproduction in summer, while additional self-consumption in winter increases more slowly. As the heating system also requires electricity during the night, a PV installation alone cannot provide all the instantaneous electricity required by the energy system at each instance. However, the NZEB criterion is met by the instantaneous evaluation with 5 kWp PV installation when including the EV load. On the other hand, the scenario without the EV can reach the NZEB criterion as shown in the figure both in terms of yearly and instantaneous evaluation.

4.2.5. Sensitivity Analysis 2: EV Mileage

The results of changing the EV load are shown in Figure 10. As shown in the figure, the amount of EV use does not influence the relative PE use factor in case the EVs are neglected in the calculation. Figure 10 shows that when the EV is excluded, the yearly consumption of the primary energy (solid black line) is zero as the import of electricity to meet the building’s heating demand is zero and the building is able to meet the NZEB criteria. When the EV loads are included in the PE use factor calculation, the load factor increases linearly with the mileage. As the EV charging load is small compared to the energy system load, the NZEB criterion is met for EV mileage up to 50,000 km (yearly values) or 24,000 km (instantaneous evaluation).

4.2.6. Sensitivity Analysis 3: Heat Load

The electricity demand of 6989 kWh by the energy system is high compared to the Belgian average of 2000 to 3500 kWh for a single family heated by a heat pump (see also case study 1). It should be noted here that the electric consumption of the heat pump in the demo case alone is 2581 kWh, which can be considered as average. The main contribution to the electricity demand of the thermal energy supply system is due to the large number of pumps and the complexity of the system. In this section, the electric power demand of the heat pump is scaled between 2000 and 12,000 kWh. The consumption of the other components in the energy supply system is not altered.
The results are given in Figure 11. For the yearly NZEB evaluation, the condition is met for HP electric loads of 8200 kWh (including EV) and 12,000 kWh (excluding EV), which is significantly higher than the present demand by the HP. These values reduce to 3300 kWh and 6700 kWh, respectively, in the instantaneous evaluation. The present case study 2 reaches the NZEB criteria both for the yearly and instant values when the EV is excluded.

4.2.7. Net ZEB Estimation

The Net ZEB calculation for case study 2 is shown in Figure 12. The square data points indicate scenarios where no EV charging is present. Each colour represents scenarios with the same HP demand but varying EV mileage. Different EV mileages (up to 40,000 km) and HP demands (50% to 200% of the measured profile) are considered. The square data points indicate scenarios without EVs and different HP demand loads (different colours) in Figure 12. Circles are scenarios that include EV charging with a step increase of 5000 km in Figure 12. Plug loads are also included but are kept fixed at the measured values. Considering the present case study, which meets the Flemish NZEB definition for a large variety of cases as was shown before, Figure 12 on the other hand shows that it is very difficult to reach the Net ZEB balance in most cases. This is due to high demand of the EV and plug loads. On the other hand, when the EV load is excluded, the points move closer to the Net ZEB balance line. A larger PV installation is required (instead of the current ~8 kWp) to meet the Net ZEB standard for realistic scenarios, including EV charging.

4.2.8. CO2 Emissions

Figure 13 shows the yearly carbon footprint of case study 2 for scenarios that do not include PV (scenarios 3 and 6) and those that include PV (1, 2, 4 and 5). Sub-scenarios are present including either EV or fossil fuel-based cars. In cases where PV is present, both the yearly and instant methods are considered. For the scenarios not including PV, emissions due to the residential electrical loads are the same and any difference is due to the difference in mobility. Replacing the fossil fuel-based car with an EV leads to a 10% reduction of CO2 emissions in the absence of PV. Depending on the evaluation method, a reduction of 17% (instant) to 18% (yearly) can be achieved.

5. Discussion: Way Forward

The two distinct case studies show how the interplay between local PV production on the one hand and electricity demand by the thermal energy system and EV charging on the other has an impact on meeting the NZEB and/or Net ZEB criterion. These case studies show that the inclusion of EV within the building calculation boundary has an impact on the evaluation of the building. The building can comply with the NZEB and Net ZEB definitions or not, depending on whether the EV load and/or plug loads are excluded or included in the building’s calculations.
It is observed in case study 1 that in the scenarios when the electrical power required for heating and EV charging is included, the building is not able to meet the NZEB criterion depending on the PV capacity and EV mileage. The PV size and EV mileage usage along with the HP demands have an impact on the performance of the building. It is found that when the PV size is small and high EV mileage is included, the NZEB criteria is not met. In order to meet the NZEB, either the PV size has to be increased or the EV mileage has to be reduced or totally excluded. In case study 1, the Net ZEB criterion is met in most cases when an EV is excluded, even when the PV capacity is small. However, when an EV is included in many cases, especially when the PV capacity is medium or small, the building is not able to reach Net ZEB.
On the other hand, the combination of a well-insulated building and a high share of renewables included in case study 2 shows that for this particular building, meeting the current Flemish NZEB definition is achievable in most cases, even when EVs are included in the calculation. It should be stressed that case study 2 is not representative of an average Flemish dwelling. However, when the Net ZEB is calculated for the same building, it is not able to reach Net ZEB in many cases especially when an EV is included. On the other hand, the building is able to reach or come closer to the Net ZEB level when EVs are excluded in few cases.
The differences in meeting the criterion are observed when comparing the NZEB and Net ZEB calculations for case studies 1 and 2. The stark difference between the two case studies as well as the potential to qualify as either NZEB or Net ZEB building is highly related to the EVs and plug loads that are included in the Net ZEB calculation but are omitted in the Flemish NZEB calculation. The total EV demand along with other electrical load is around 9586 kWh of electricity in case study 2, while for case study 1 only 4940 kWh is the total EV demand, along with other electrical loads. Compared to EVs the demand for the mobile phones, tablets s etc. is around 2–13 kWh [55], which is very low compared to the EV demand, therefore EV inclusion within the building load calculations is important as it can have impact on the energy performance of the building. Due to the high electrical demand of the EV and other loads in case study 2, the Net ZEB criterion is not met in many scenarios. Therefore, a larger PV installation is needed to compensate for the large electrical demand of the EV and other loads in case study 2 compared to case study 1. Generally, the building moves away from the NZEB and/or Net ZEB criterion if the EV is high and the PV size is limited. In the future, all the plug loads such as laptops, mobile phones, tablets and batteries etc. loads can be included along with the EVs in the building load calculations to calculate the energy performance and emissions.
The discrepancy in the Net ZEB and NZEB status for the same building, as shown in the article, is dependent on the calculation method as it is outlined by the respective definition. In NZEB calculation, the plug loads and EVs are excluded according to the Flemish definition. However, in the Net ZEB calculation the plug loads and EVs can be included. This shows that the definition and methodology used in NZEB, and Net ZEB calculations may not provide a complete picture of the benefits of using renewables and EVs in buildings in terms of energy performance. Moreover, it may not show the benefit of replacing fossil fuel-based cars with EVs, as fossil fuel-based cars are not included in the calculations. In terms of energy calculations, it is observed that the NZEB and Net ZEB is highly dependent on the type of load included. The total electrical load increases with an EV; however, the benefit comes from the emission perspective as shown above in Figure 6 and Figure 13. Therefore, the calculations and framework have to be designed in a similar way that follows the same perspective.
Rather than going in this direction, the benefit of using renewables and EVs in a building can be shown in a better way when using the emission path. The final target and legislation is designed to reduce the emissions from the buildings and transport sector as discussed above [1]. The benefit of EV integration and replacement of a fossil fuel-based car with an EV can be seen in the emissions calculations (in Table 4).
This approach showed a better comparison than the energy-based calculations. The idea to include EVs is to reduce the overall emissions in the city or district; therefore, a fair comparison is to follow the emission comparison path as shown in Table 4. This can show the benefits of including PV, HP and EVs within the building boundary. It is observed in both case studies 1 and 2 that when a fossil fuel-based car is considered within the building’s boundary and it is replaced by an EV, the total emissions from both buildings are reduced (in Table 4). Therefore, the emissions path is more appropriate to be followed as a method to evaluate the building’s performance, rather than energy-based method. This approach can be considered to evaluate the performance of the buildings under EPBD directives and can be included in the EPC when vehicles are considered within the building boundary. This method would already include the emissions being generated while using either fossil-based energy or renewable energy in the building. Therefore, it is suggested to use emissions as the estimation criterion for the building to be declared as a sustainable or zero emission buildings (in terms of operational emission), and then a zero-energy building.

6. Conclusions

It is expected that with the increase in EV implementation, together with a reduction in building-related energy demand because of efficiency improvements, EVs will become a significant proportion of the load if it is included in a building’s load. Currently, transport is considered outside the boundary of the building in most building performance assessment methods. From technical and wider perspectives, one would encourage the integration of EVs with buildings and the shift from fossil fuel-based vehicles. However, from a policy perspective and from the NZEB/Net-ZEB definition, there may be conflicts. This is because by integrating the extra EV load within the building’s boundary, energy consumption would increase and consequently the building may shift away from the NZEB level unless the definitions and calculation methods are adapted.
Possible routes are suggested for considering EV loads in buildings’ energy performance assessments:
  • Exclude EVs from the building boundary.
  • Include EVs in the building boundary,
    Increase the permissible criterion of primary energy under NZEB.
    Estimate and calculate the building’s performance based on the CO2 emissions.
Based on the analysis of the presented case studies, it is observed that:
  • In both the two case studies presented in this paper, the Net ZEB calculations and NZEB calculation showed discrepancies when calculated to meet the respective criteria. It is highly dependent on the PV capacity, plug loads and EV load.
  • More dynamic NZEB evaluation methods based on instantaneous coverage of the load will cause violations of the requirement in many cases, especially when EVs are included.
  • Larger capacities of RE generations are needed in the NZEB buildings to remain within the allowable limits of NZEB or Net ZEB when an EV is integrated.
  • A well-insulated single-family dwelling equipped with PV, PV/T and tanks to cover the yearly electricity demand of a house should be able to meet the Flemish NZEB requirement, which also includes the charging demand of EVs.
  • When an EV is included with the building, the primary energy usage increases; however, the overall emissions decrease when compared with fossil-fuel driven cars.
  • One method to maintain the NZEB level of the calculated building is to alter the NZEB permissible limits within the regulations to allow building’s with EVs to remain within the NZEB regulations.
  • Another method is to follow the emissions path, rather than the energy path, which can show the benefits of the inclusion of the EV with the building. The emission estimation path provided a better picture of the benefits of including EVs within the building’s calculation boundary, instead of the energy calculation path. Therefore, this method can be used to show the performance of the building (in terms of emissions) and benefits of including renewables, storages and other technologies such as EVs within the building boundary.
Some of the main challenges regarding the proposed approaches to the policy plans (in Section 2.2) are:
  • Urban plans (spatial and land-use plans) in cities are important. These plans manage the physical development (including settlement structure, open space management, transport infrastructure, etc.) that are in line with overarching and cross-cutting strategic goals and targets of local or regional governments. It might be needed to translate this vision regarding the NZEBs and EVs integration into the urban plans. This may require coordination and multiple stakeholders’ engagement activities. However, in the present situation, the initial challenge and priority remains the energy efficiency issue of all the buildings, after which EVs can be included.
  • In the EU countries changes in the NZEB balancing criterion with or without EVs may become a challenge and may need a new method to include EV in the calculations. With the SRI implemented and with the new energy performance certificates (EPC) framework under discussion during 2021 under the EPBD, it is expected that EVs might be included in the discussion for the new EPC framework. The challenge remains that different cars have different efficiency and consumption levels; moreover, these depend very strongly on actual user behaviour and driving style.
The study shows the benefits of including EVs within the building boundary, when following the emission path. In the future, EVs can support higher RES integration with the building. With better battery management controls, improvement in battery performance and improvement in EV design, it is expected that the present efficiency of EVs will improve in the future. In the future, study can be carried out to analyse the impact of the EV loads on the nearly or positive energy district and buildings in different climatic regions. In addition, an optimization strategy to maximize the building’s self-consumption, when the EVs are charging can be studied for different cases. Our research can be extended to design innovative and intelligent building information models, compare building sustainability assessment systems, plan the integration of life cycle assessment and building information modelling, study and optimize the life cycle of energy efficient buildings while improving the sustainability of buildings and the built environment. A broader discussion on this topic is needed at the European level to address barriers and opportunities. In addition, a newer approach, framework and/or concepts are needed to harvest, include and quantify the building and EV integration benefits.

Author Contributions

Conceptualization, H.u.R., A.H. and F.R.; methodology, H.u.R., J.D., S.V., A.H. and F.R.; software, J.D. and H.u.R.; validation, H.u.R., J.D., A.H. and S.V.; formal analysis, H.u.R., J.D., S.V., A.H. and F.R.; investigation, H.u.R., J.D., S.V. and A.H.; resources, H.u.R. and F.R.; data curation, J.D., S.V. and H.u.R.; writing—original draft preparation, H.u.R., J.D., S.V. and A.H.; writing—review and editing, H.u.R., J.D., S.V., A.H. and F.R.; visualization, J.D. and H.u.R.; supervision, A.H. and F.R.; project administration, F.R. and A.H.; funding acquisition, F.R. All authors have read and agreed to the published version of the manuscript.

Funding

“European Union’s Horizon 2020 research and innovation programme H2020-LC-EEB-03-2019, and New developments in plus energy houses (IA), under the project name ‘EXCESS’, grant number 870157” and “The APC was funded by VTT Technical Research Center of Finland”. The funding bodies had no such involvement in preparing the manuscript, methods and results, etc. and this manuscript reflects only the authors’ views and does not necessarily reflect the opinion of the European Commission. Neither the EU nor any of its institutions or agencies can be held responsible for any use that may be made of the information contained herein.

Institutional Review Board Statement

Not applicable.

Informed Consent Statement

Not applicable.

Data Availability Statement

The data presented in this study are available on request from the corresponding author.

Acknowledgments

The authors would like to acknowledge the IEA Energy in Buildings and Communities (EBC) Annex 83 Positive Energy Districts, VTT, for cooperation. The funding bodies had no such involvement in preparing the manuscript, methods and results, etc. and this manuscript reflects only the authors’ views and does not necessarily reflect the opinion of the European Commission. Neither the EU nor any of its institutions or agencies can be held responsible for any use that may be made of the information contained herein.

Conflicts of Interest

The authors declare no conflict of interest. The funders had no role in the design of the study; in the collection, analyses, or interpretation of data; in the writing of the manuscript, or in the decision to publish the results.

References

  1. European Commission. 2030 Climate & Energy Framework|Climate Action. Available online: https://ec.europa.eu/clima/policies/strategies/2030_en (accessed on 4 November 2019).
  2. European Commission. DIRECTIVE 2002/91/EC OF THE EUROPEAN PARLIAMENT AND OF THE COUNCIL of 16 December 2002 on the Energy Performance of Buildings. Available online: https://eur-lex.europa.eu/legal-content/EN/TXT/PDF/?uri=CELEX:32002L0091&qid=1518605577723&from=EN (accessed on 14 December 2020).
  3. European Commission. Directive 2010/31/EU of the European Parliament and of the Council of 19 May 2010 on the Energy Performance of Buildings. Available online: https://eur-lex.europa.eu/legal-content/EN/TXT/PDF/?uri=CELEX:32010L0031&from=EN (accessed on 30 March 2020).
  4. European Union Commision. DIRECTIVE (EU) 2018/844 OF THE EUROPEAN PARLIAMENT AND OF THE COUNCIL of 30 May 2018 Amending Directive 2010/31/EU on the Energy Performance of Buildings and Directive 2012/27/EU on Energy Efficiency. Available online: https://eur-lex.europa.eu/eli/dir/2018/844/oj (accessed on 12 April 2020).
  5. ISO/TC 163 Thermal Performance and Energy Use in the Built Environment. ISO 52000-1:2017-Energy Performance of Buildings—Overarching EPB Assessment—Part 1: General Framework and Procedures. Available online: https://www.iso.org/standard/65601.html (accessed on 8 July 2020).
  6. D’Agostino, D.; Mazzarella, L. What is a Nearly zero energy building? Overview, implementation and comparison of definitions. J. Build. Eng. 2019, 21, 200–212. [Google Scholar] [CrossRef]
  7. Garde, F.; Donn, M. IEA SHC Task 40/EBC Annex 52 Towards Net Zero Energy Solar Buildings: A Review of 30 Net ZEBs Case Studies. Available online: http://www.enob.info/en/net-zero-energy-buildings/map/ (accessed on 2 March 2021).
  8. Crawley, D.B.; Pless, S.; Torcellini, P. Getting to Net Zero. Ashrae J. 2009, 51, 18–25. [Google Scholar]
  9. United States Environmental Protection Agency. Energy Independence and Security Act of 2007|Greening EPA|US EPA. Available online: https://www.epa.gov/greeningepa/energy-independence-and-security-act-2007 (accessed on 24 August 2020).
  10. European Commission. 2050 Long-Term Strategy|Climate Action. Available online: https://ec.europa.eu/clima/policies/strategies/2050_en (accessed on 4 November 2019).
  11. Fortum Solar Energy-Facts and Advantages about Solar Power|Fortum. Available online: https://www.fortum.com/about-us/our-company/our-energy-production/solar-power-unlimited-source-energy (accessed on 6 November 2019).
  12. Epp, B. Denmark: New Solar District Heating World Record. Available online: https://www.solarthermalworld.org/news/denmark-new-solar-district-heating-world-record (accessed on 6 November 2019).
  13. Moradi, K.; Ali Ebadian, M.; Lin, C.X. A review of PV/T technologies: Effects of control parameters. Int. J. Heat Mass Transf. 2013, 64, 483–500. [Google Scholar] [CrossRef] [Green Version]
  14. Rehman, H.U.; Hirvonen, J.; Kosonen, R.; Sirén, K. Computational comparison of a novel decentralized photovoltaic district heating system against three optimized solar district systems. Energy Convers. Manag. 2019, 191, 39–54. [Google Scholar] [CrossRef]
  15. Stephan, A.; Stephan, L. Achieving net zero life cycle primary energy and greenhouse gas emissions apartment buildings in a Mediterranean climate. Appl. Energy 2020, 280, 115932. [Google Scholar] [CrossRef]
  16. Thür, A.; Calabrese, T.; Streicher, W. Smart grid and PV driven ground heat pump as thermal battery in small buildings for optimized electricity consumption. Sol. Energy 2018, 174, 273–285. [Google Scholar] [CrossRef]
  17. Rehman, H. Techno-Economic Performance of Community Sized Solar Heating Systems in Nordic Conditions. Available online: https://aaltodoc.aalto.fi/handle/123456789/34808 (accessed on 4 November 2019).
  18. Rehman, H.; Hirvonen, J.; Sirén, K. Performance comparison between optimized design of a centralized and semi-decentralized community size solar district heating system. Appl. Energy 2018, 229, 1072–1094. [Google Scholar] [CrossRef]
  19. Gunkel, P.A.; Bergaentzlé, C.; Græsted Jensen, I.; Scheller, F. From passive to active: Flexibility from electric vehicles in the context of transmission system development. Appl. Energy 2020, 277, 115526. [Google Scholar] [CrossRef]
  20. Munkhammar, J.; Grahn, P.; Widén, J. Quantifying self-consumption of on-site photovoltaic power generation in households with electric vehicle home charging. Sol. Energy 2013, 97, 208–216. [Google Scholar] [CrossRef]
  21. Newsom, G.; Gupta, S.; Smith, J. Research Gap Analysis for Zero-Net Energy Buildings California Energy Commission; Itron Inc.: Davis, CA, USA, 2019. [Google Scholar]
  22. Buonomano, A. Building to Vehicle to Building concept: A comprehensive parametric and sensitivity analysis for decision making aims. Appl. Energy 2020, 261, 114077. [Google Scholar] [CrossRef]
  23. Cao, S. The impact of electric vehicles and mobile boundary expansions on the realization of zero-emission office buildings. Appl. Energy 2019, 251, 113347. [Google Scholar] [CrossRef]
  24. European Environment Agency. Greenhouse Gas Emissions from Transport in Europe—European Environment Agency. Available online: https://www.eea.europa.eu/data-and-maps/indicators/transport-emissions-of-greenhouse-gases/transport-emissions-of-greenhouse-gases-12 (accessed on 3 April 2020).
  25. Eurostat Energy, Transport and Environment Statistics; The Publications Office of the European Union: Luxembourg, 2019. [CrossRef]
  26. Eurostat-Statistical Office of the European Communities. Energy, Transport and Environment Indicators; Publications Office of the European Union: Luxembourg, 2011; ISBN 9789279213847.
  27. Wang, B.; Xu, M.; Yang, L. Study on the economic and environmental benefits of different EV powertrain topologies. Energy Convers. Manag. 2014, 86, 916–926. [Google Scholar] [CrossRef]
  28. International Energy Agency. Global EV Outlook 2018–Analysis-IEA. Available online: https://www.iea.org/reports/global-ev-outlook-2018 (accessed on 3 April 2020).
  29. International Energy Agency (IEA). Global EV Outlook. 2019. Available online: https://www.iea.org/reports/global-ev-outlook-2019 (accessed on 7 February 2020).
  30. European Commission. Commission Recommendation (EU) 2019/1019 of 7 June 2019 on Building Modernisation (Text with EEA Relevance). Available online: https://eur-lex.europa.eu/legal-content/EN/TXT/?uri=CELEX%3A32019H1019 (accessed on 7 November 2020).
  31. Rohloff, A.; Roberts, J.; Goldstein, N. Impacts of Incorporating Electric Vehicle Charging into Zero Net Energy (ZNE) Buildings and Communities. In Proceedings of the ACEEE Summer Study on Energy Efficiency in Buildings, Pacific Grove, CA, USA, 15–20 August 2010; pp. 312–324. [Google Scholar]
  32. Morris, C. 8 European Countries & Their EV Policies|CleanTechnica. Available online: https://cleantechnica.com/2018/11/04/8-european-countries-their-ev-policies/ (accessed on 24 April 2020).
  33. Soares, A.; Geysen, D.; Spiessens, F.; Ectors, D.; De Somer, O.; Vanthournout, K. Using reinforcement learning for maximizing residential self-consumption–Results from a field test. Energy Build. 2020, 207, 109608. [Google Scholar] [CrossRef]
  34. Korvola, T.; Abdurafikov, R.; Reda, F. Control strategies for a residential property with solar building, thermal and electricity storages. EuroSun Conf. 2018, 77–88. [Google Scholar] [CrossRef]
  35. Rehman, H.U.; Korvola, T.; Abdurafikov, R.; Laakko, T.; Hasan, A.; Reda, F. Data analysis of a monitored building using machine learning and optimization of integrated photovoltaic panel, battery and electric vehicles in a Central European climatic condition. Energy Convers. Manag. 2020, 221, 113206. [Google Scholar] [CrossRef]
  36. Sartori, I.; Napolitano, A.; Voss, K. Net zero energy buildings: A consistent definition framework. Energy Build. 2012, 48, 220–232. [Google Scholar] [CrossRef] [Green Version]
  37. European Commission. Nearly Zero-Energy Buildings|Energy. Available online: https://ec.europa.eu/energy/topics/energy-efficiency/energy-efficient-buildings/nearly-zero-energy-buildings_en (accessed on 19 April 2020).
  38. Buildings Performance Institute Europe (BPIE). Nearly Zero Energy Buildings Definitions Across Europe; Buildings Performance Institute Europe: Brussels, Belgium, 2015. [Google Scholar]
  39. D’Agostino, D. Assessment of the progress towards the establishment of definitions of Nearly Zero Energy Buildings (nZEBs) in European Member States. J. Build. Eng. 2015, 1, 20–32. [Google Scholar] [CrossRef]
  40. European Union Commission. Clean Energy for All Europeans Package|Energy. Available online: https://ec.europa.eu/energy/en/topics/energy-strategy/clean-energy-all-europeans (accessed on 13 February 2020).
  41. European Commission. A Fundamental Transport Transformation: Commission Presents its Plan for Green, Smart and Affordable Mobility. Available online: https://ec.europa.eu/commission/presscorner/detail/en/ip_20_2329 (accessed on 18 December 2020).
  42. Amsterdam Roundtables Foundation; McKinsey & Company Electric Vehicles in Europe: Gearing Up for a New Phase? Available online: https://www.mckinsey.com/~/media/McKinsey/Locations/EuropeandMiddleEast/Netherlands/OurInsights/ElectricvehiclesinEuropeGearingupforanewphase/ElectricvehicleinEuropeGearingupforanewphase.ashx (accessed on 23 May 2020).
  43. Balzhäuser, S. EV And EV Charger Incentives in Europe: A Complete Guide for Businesses and Individuals. Available online: https://wallbox.com/en_us/guide-to-ev-incentives-europe (accessed on 24 April 2020).
  44. VITO; Waide Strategic Efficiency; ECOFYS; OFFIS. Smart Readiness Indicator for Buildings. Available online: https://smartreadinessindicator.eu/ (accessed on 12 August 2020).
  45. Pavíc, I.; Pandžíc, H.; Capuder, T. Electric vehicle based smart e-mobility system—Definition and comparison to the existing concept. Appl. Energy 2020, 272, 115153. [Google Scholar] [CrossRef]
  46. Röck, M.; Hollberg, A.; Habert, G.; Passer, A. LCA and BIM: Visualization of environmental potentials in building construction at early design stages. Build. Environ. 2018, 140, 153–161. [Google Scholar] [CrossRef]
  47. Tsikos, M.; Negendahl, K. Sustainable Design with Respect to LCA Using Parametric Design and BIM Tools. In Proceedings of the World Sustainable Built Environment Conference, Hong Kong, China, 5–7 June 2017. [Google Scholar]
  48. European Commission. Final Report Summary-EEBGUIDE (Operational Guidance for Performing Life Cycle Assessment Studies of the Energy Efficient Buildings Initiative)|FP7|CORDIS|European Commission. Available online: https://cordis.europa.eu/project/id/285490/reporting (accessed on 10 October 2021).
  49. Ministry of the Environment Energy Certificate for Buildings. Available online: https://www.ymparisto.fi/en-US/Building/Ecoefficiency_and_energy_consumption_in_buildings/Energy_certificate_for_buildings (accessed on 26 August 2020).
  50. European Commission. Renovation Wave: Doubling the Renovation Rate to Cut Emissions, Boost Recovery and Reduce Energy Poverty. Available online: https://ec.europa.eu/commission/presscorner/detail/en/IP_20_1835 (accessed on 29 October 2020).
  51. European Union. Directive 2012/27/Eu of the European Parliament and of the Council of 25 October 2012 on Energy Efficiency, Amending Directives 2009/125/EC and 2010/30/EU and Repealing Directives 2004/8/EC and 2006/32/EC. Available online: https://eur-lex.europa.eu/legal-content/EN/TXT/HTML/?uri=CELEX:32012L0027&from=EN#d1e32-33-1 (accessed on 18 December 2020).
  52. Fontaras, G.; Zacharof, N.G.; Ciuffo, B. Fuel consumption and CO2 emissions from passenger cars in Europe–Laboratory versus real-world emissions. Prog. Energy Combust. Sci. 2017, 60, 97–131. [Google Scholar] [CrossRef]
  53. European Environment Agency (EEA). Greenhouse Gas Emission Intensity of Electricity Generation—European Environment Agency. Available online: https://www.eea.europa.eu/data-and-maps/daviz/co2-emission-intensity-6#tab-googlechartid_googlechartid_chart_111_filters=%7B%22rowFilters%22%3A%7B%7D%3B%22columnFilters%22%3A%7B%22pre_config_date%22%3A%5B2016%3B2018%5D%7D%3B%22sortFilter%22%3A%5B%22index_2018%22%5D%7D (accessed on 16 December 2020).
  54. EV Database Energy Consumption of Full Electric Vehicles. Available online: https://ev-database.org/cheatsheet/energy-consumption-electric-car (accessed on 16 December 2020).
  55. Manchester, S.C.; Swan, L.G. Off-grid mobile phone charging: An experimental study. Energy Sustain. Dev. 2013, 17, 564–571. [Google Scholar] [CrossRef]
Figure 1. Main equipment installed on-site, heat paths (brown) and electricity paths (green) are shown.
Energies 14 06990 g001
Figure 2. Effect of scaling the size of the PV installation on meeting the Flemish NZEB qualification.
Energies 14 06990 g002
Figure 3. Effect of EV mileage on the primary energy usage and NZEB qualification.
Energies 14 06990 g003
Figure 4. Effect of the yearly HP load on NZEB qualification.
Energies 14 06990 g004
Figure 5. Net ZEB evaluation for different scenarios including PV sizing, HP demand and EV mileage.
Energies 14 06990 g005
Figure 6. CO2 emissions for the yearly and instantaneous evaluation methods including EV (leftmost) and fossil fuel car (rightmost) cases.
Energies 14 06990 g006
Figure 7. Main equipment installed on-site, heat paths (brown) and electricity paths (green) are shown.
Energies 14 06990 g007
Figure 8. Monthly breakdown of the case study’s different loads (stacked bars) and local PV production (line).
Energies 14 06990 g008
Figure 9. Influence of PV sizing on the relative PE use of case study.
Energies 14 06990 g009
Figure 10. PE use factors as a function of EV mileage.
Energies 14 06990 g010
Figure 11. Influence of heat pump load on PE use factor.
Energies 14 06990 g011
Figure 12. Net ZEB evaluation for different scenarios including PV sizing, HP demand and EV mileage.
Energies 14 06990 g012
Figure 13. CO2 emissions for the yearly and instantaneous evaluation methods including EV (leftmost) and fossil fuel car (rightmost) cases.
Energies 14 06990 g013
Table 1. The main loads included in the NZEB calculations at the national level in EU countries [37,38,39].
CountryResidential Building Primary Energy Requirements (kWh/m2/a)Electric VehicleAuxiliaryLightingPlug Loads
Austria160x
Belgium (Flanders)30% of the reference buildingxxx
Bulgaria30–50x
Croatia33–41xx
Cyprus100xxx
Czech Republic75–80% of the PE factorxx
Denmark20???
Estonia50–100✔ (if included in the boundary)
Finland170–110?
France40–65xx
Germany40% of the PExx
GreeceNot defined????
Hungary50–72x?
ItalyClass A1xx
Latvia95x
LithuaniaClass A+ +
LuxemburgClass AAAxxx
Malta40xx
Netherlands0
Poland60–75xxxx
Portugal?x??
Slovakia32–54xxx
SpainClass A????
Sweden30–75?x?
United Kingdom44xx
✔ = included in the calculations; x = not included in the calculations; ? = not defined/unclear.
Table 2. Overview of available data type for the two case studies.
ParameterCase Study 1: Terraced Single-Family DwellingCase Study 2: Belgian Single Family House
Building purposeResidentialMixed residential/office
Building footprint [m2]37.9184.6
Building volume [m3]2991409
Location [Lat, Lon]52°11 N 5°18 E50°50 N 4°39 E
Logged subsystems
Electricity to/from grid [kWh]YY
PV production [kWh]YY
EV load [kWh]No EV presentY
Total electric load (incl. lighting, appliances, …) [kWh]YY
Electricity spot price [€/kWh]NY
Energy to/from batteries [kWh]No batteries presentY
Battery state-of-charge [kWh]No batteries presentY
HP electric load [kWh]YY
Ventilation system electric load [kWh]NY
Pump status [On/off]NY
Data range15 September 2017–15 September 20181 May 2017–1 May 2018
Data resolution5 min15 min
Table 3. Energy and economic baseline figures for the selected case.
ParametersValues
PV production8345 kWh/a
Electricity, from grid11,789 kWh/a
Electricity, to grid3558 kWh/a
Net, from grid8231 kWh/a
EV load3567 kWh/a
Base load, total13,008 kWh/a (Energy system = 6989 kWh/a + Plug loads = 6019 kWh/a)
PV coverage50.3%
PV self-consumption57.4%
Electricity, cost of buying€3513.60/a
Electricity, income from selling€1095.43
Electricity, net cost€2418.16
Table 4. Comparison between the CO2 emissions for case studies 1 and 2 (with EVs and fuel cars).
Case Study 1: EV (kg CO2/Year)Case Study 1: Fuel Car (kg CO2/Year)Case Study 2: EV (kg CO2/Year)Case Study 2: Fuel Case (kg CO2/Year)
No PV 3100380070007900
Yearly, with PV1400240035004100
Instant, with PV2500340050006000
Publisher’s Note: MDPI stays neutral with regard to jurisdictional claims in published maps and institutional affiliations.

