1. Introduction
There are a vast number of solutions for implementing an electrical part of an unmanned aerial vehicle (UAV). The simplest topology is to directly connect the load to the fuel cell outlet. The disadvantage of this solution is the increased voltage at the output in the no-load operation mode. Another drawback is the fact that during takeoff and landing, the UAV requires three to five times more energy in comparison with its consumption in the cruise mode. Moreover, the total time of such overloads accounts for 2% to 4% of the total flight time. To avoid using overweight fuel cells capable of withstanding such peak overloads, buffer energy storage devices are applied [
1]. In the majority of cases, lithium polymer batteries act as storage devices. The solution to combine capacities from two energy sources is shown in
Figure 1.
For unmanned aerial vehicles, the circuit in
Figure 1a is more relevant, since it allows maintaining the voltage on the tire in a given narrow corridor, in contrast to the circuit in
Figure 1b and, at the same time, it has a lower mass than the circuit in
Figure 1c due to the absence of a DC–DC battery converter. However, no issues related to calculating the required capacity of such a battery are considered in the publications. Mathematical models of power plants considering the effect of the charging and discharging of a battery on the operating modes of the voltage converter components are not considered either. The weight of the battery backup power supply represents a significant part of the weight of the UAV power plant electrics. The choice of its capacity (i.e., the weight) is one of the main tasks when designing such power plants. In this regard, it is appropriate to have a mathematical model of the electrical complex, which will allow obtaining data on the operating mode of the battery at a given power consumption of the UAV.
The complexity of the design process of the electrical part of the power unit lies in the fact that the voltage of the stack of fuel cells depends nonlinearly on the current consumption, which is why the known ratios for calculating converters operating from DC voltage sources need to be improved. The specific algorithm of the power plant control system, which limits the power consumption from the stack in the overload mode and stabilizes the battery charge current in the nominal mode, also does not allow using standard calculation methods.
In [
2], some methods to design a power unit that comprises a fuel cell for an aircraft are presented. However, the present paper does not cover the issues of developing a DC–DC converter and its influence on the other system elements.
In a great number of papers [
3,
4,
5,
6,
7], such issues as a reduction in the current pulse of the fuel cell and an increase in the converter reliability by enhancing the number of parallel operating phases are studied. Such solutions to the power unit implementation are justified for land and water transport as well as for stationary consumers. When the power units are used as the main source of energy on aircraft, the requirements for specific energy intensity and surface power density dominate. The mass should be as small as possible. An increase in the number of converter phases and the use of supercapacitors lead to significant mass and dimension increase. UAV propulsion systems often use a low voltage, in the range of 12 to 36 V, while powerful fuel cells consist of several dozen interelectrode units (IEU). Thus, the voltage converter should be step down.
The work proposes a mathematical model of a power unit that is based on an iterative calculation of a step-down voltage converter operating from a fuel cell battery with a nonlinear current–voltage curve.
2. Method for Calculating the Converter
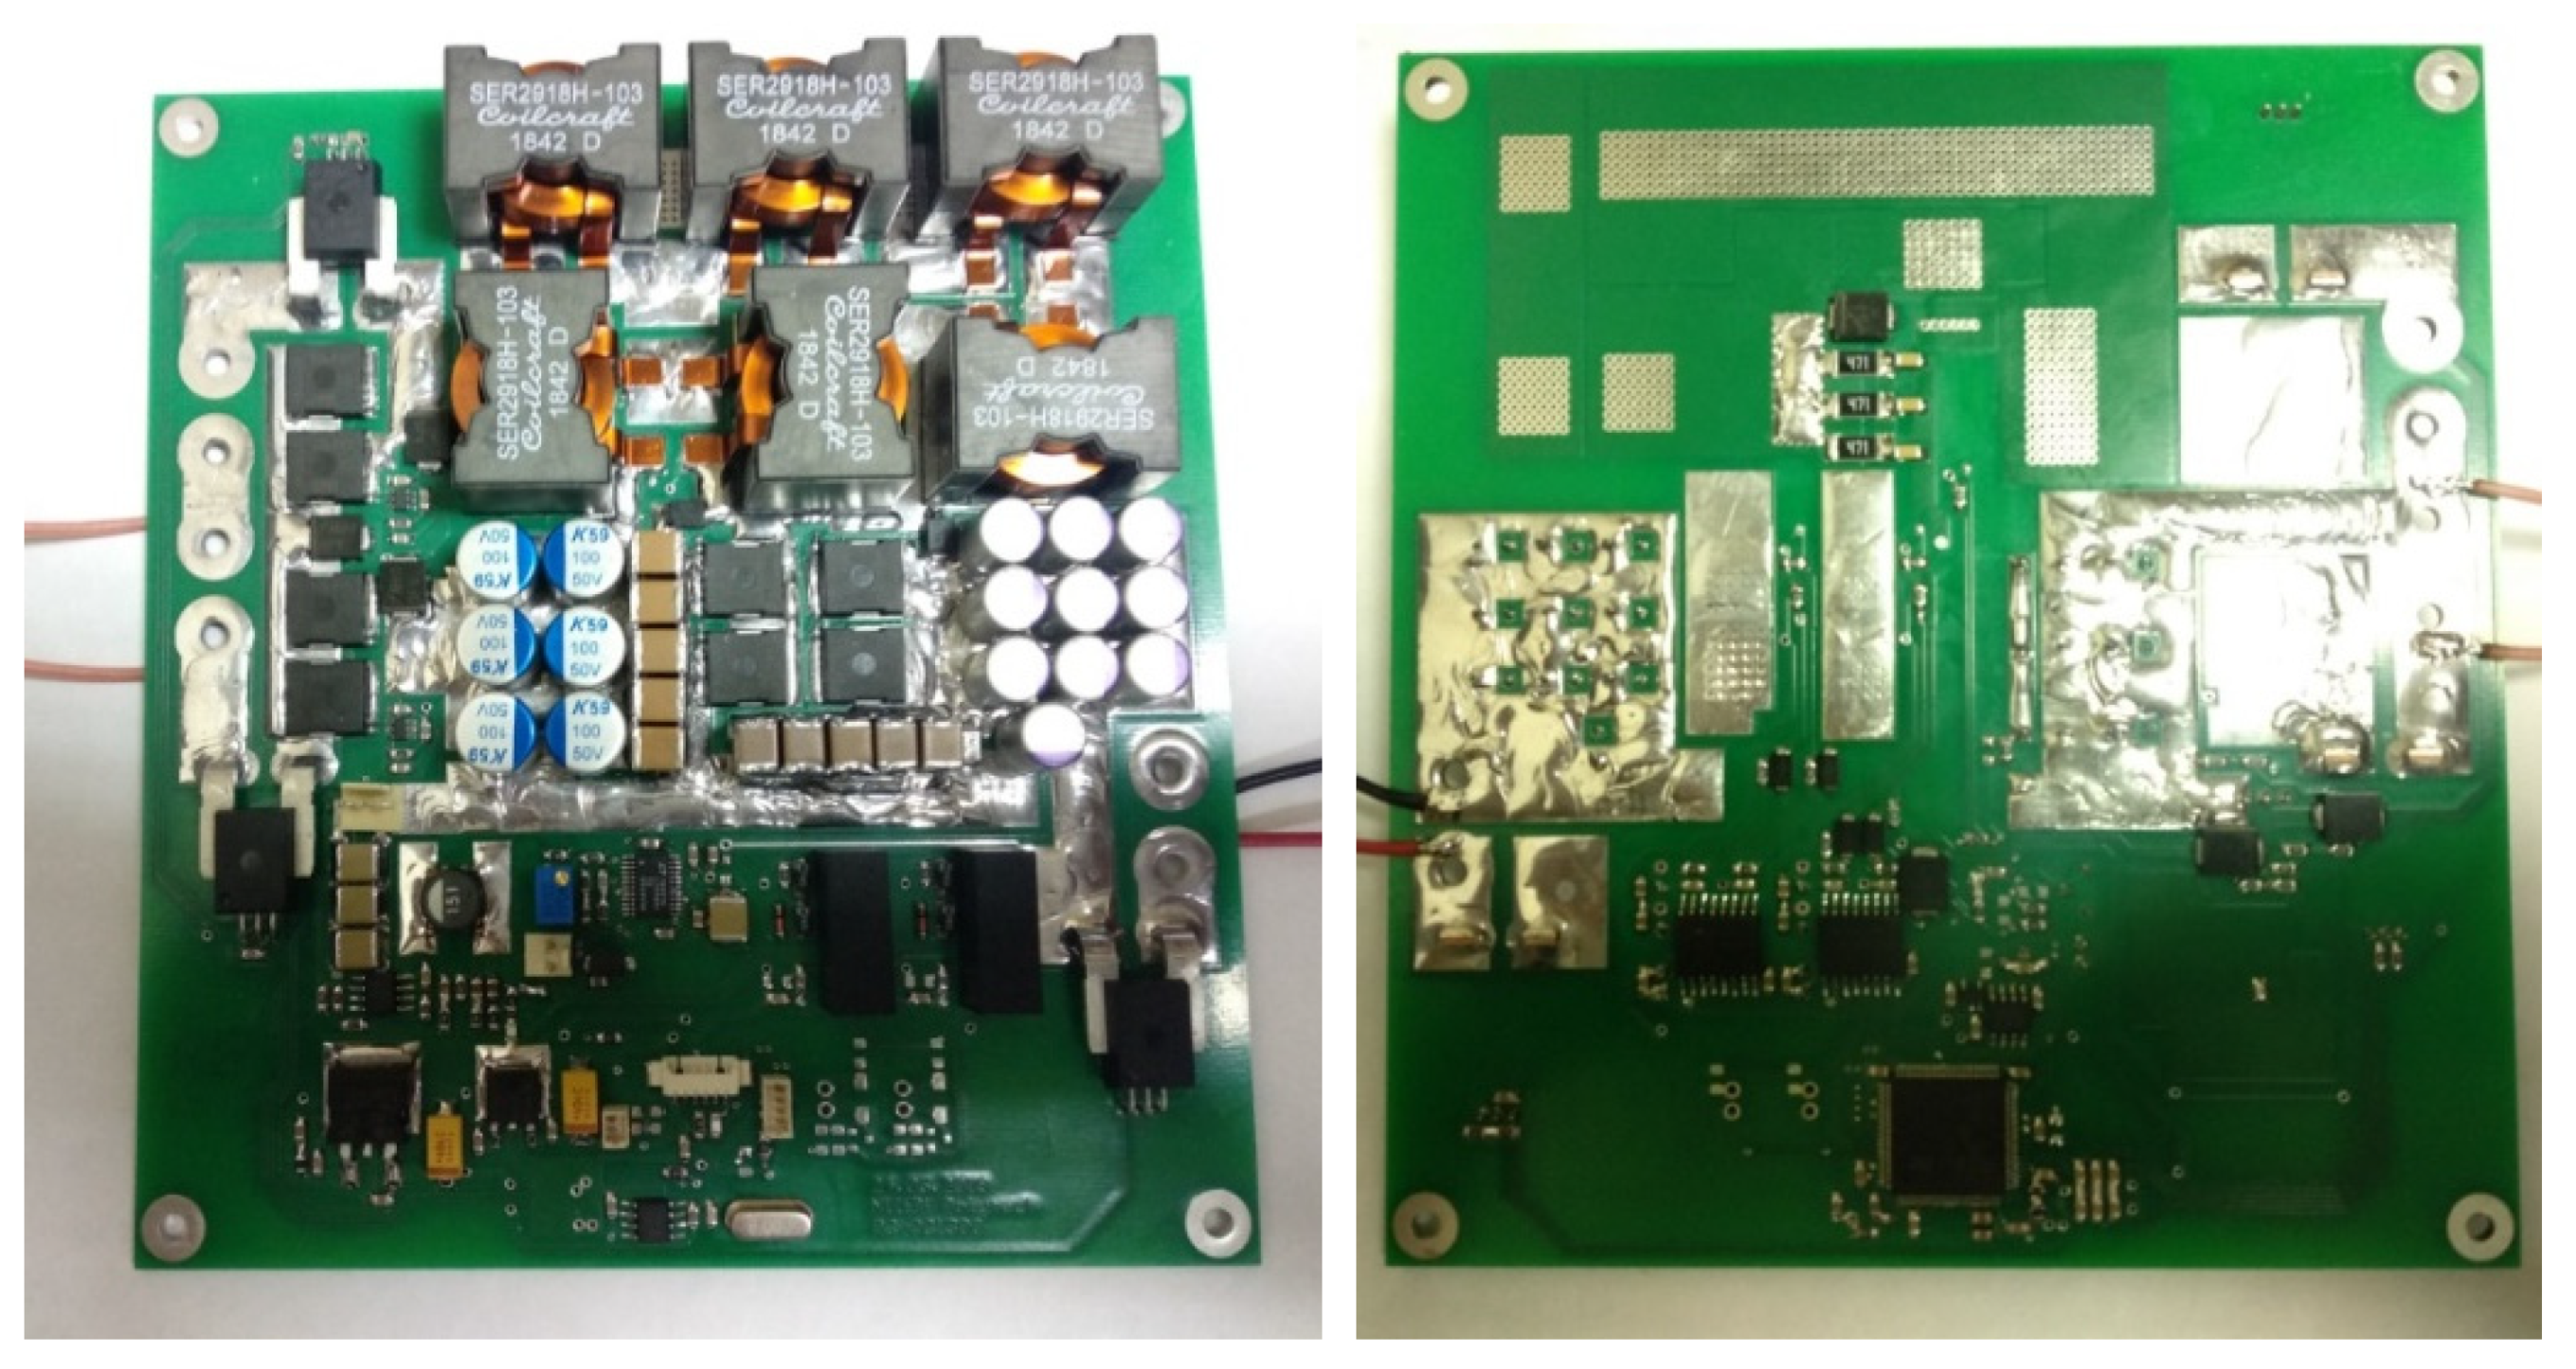
For UAV, the buck-converter circuit (step-down, copper, buck converter), which is shown in
Figure 2, seems to be the most effective. When designing a converter, it is necessary to analyze the processes in the power supply system; calculate the voltages and currents in the elements; and determine the duty factor of the pulse-width modulation (PWM), the parameters of the choke, and the most-loaded modes of electronic components.
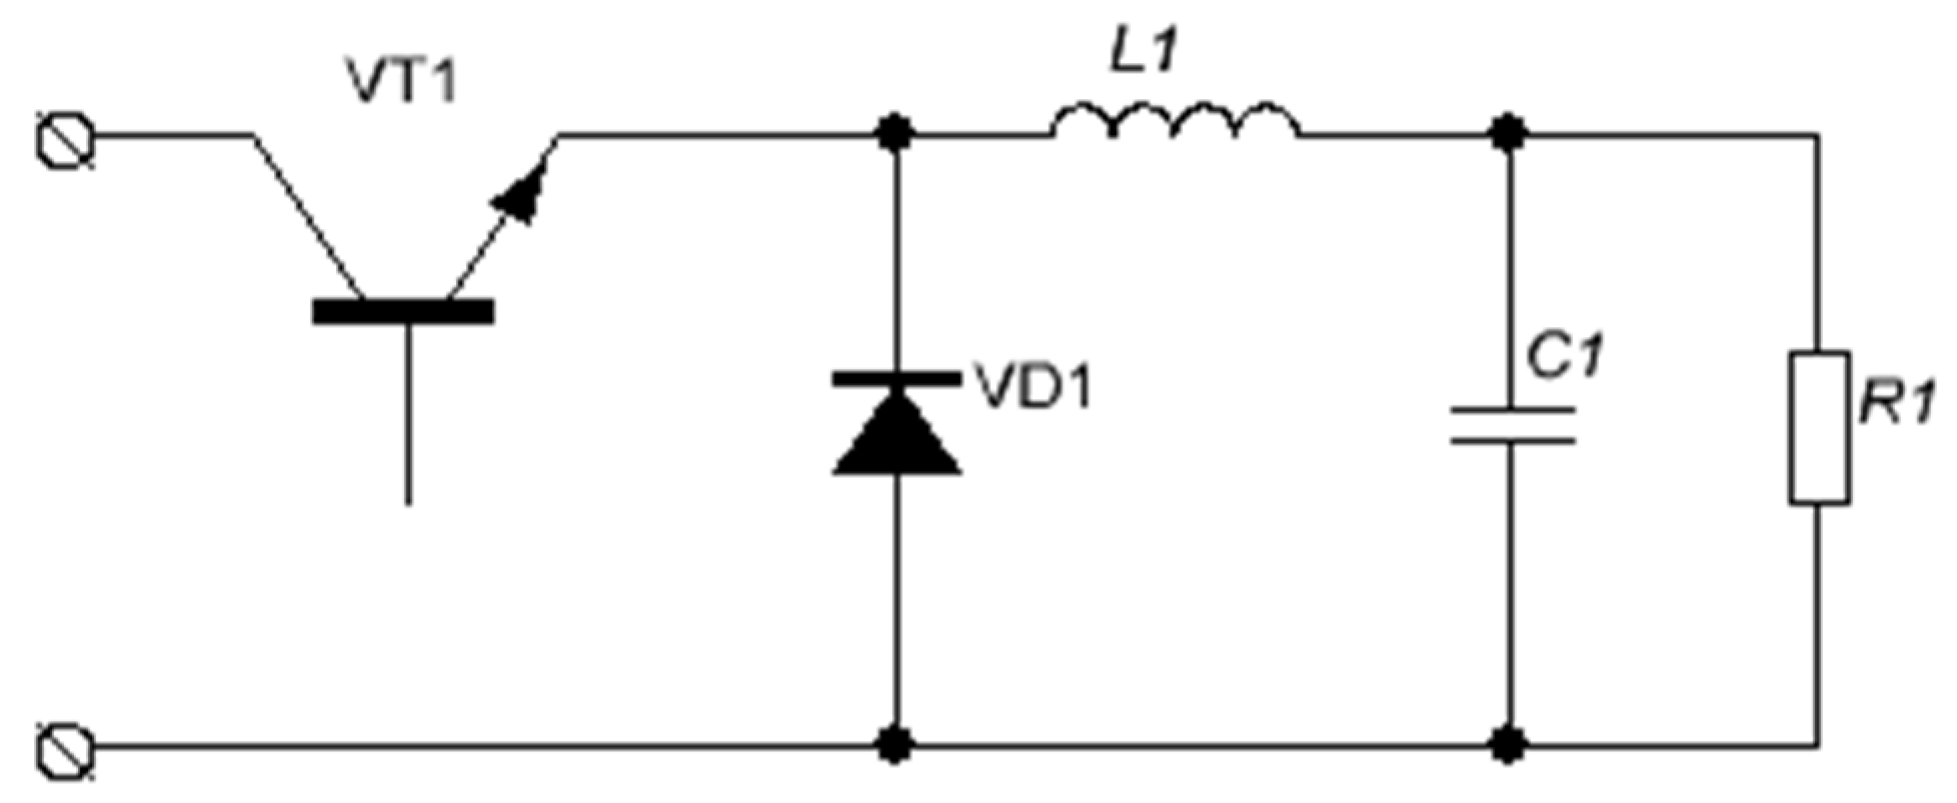
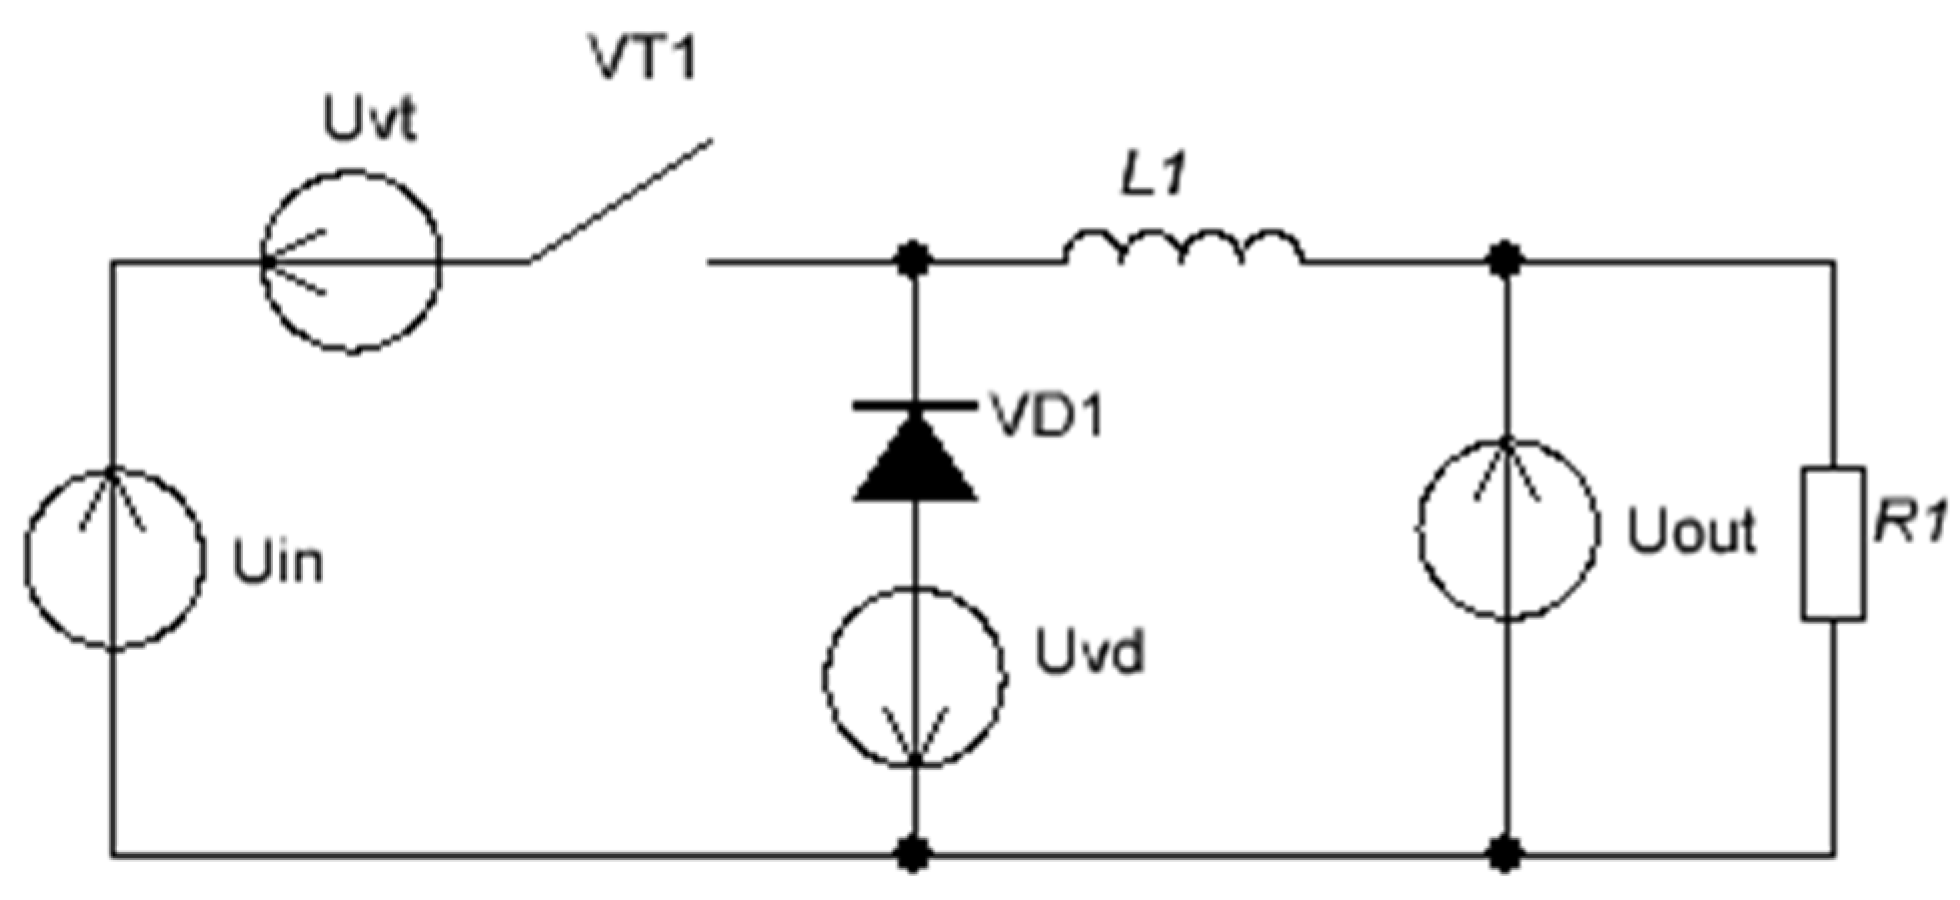
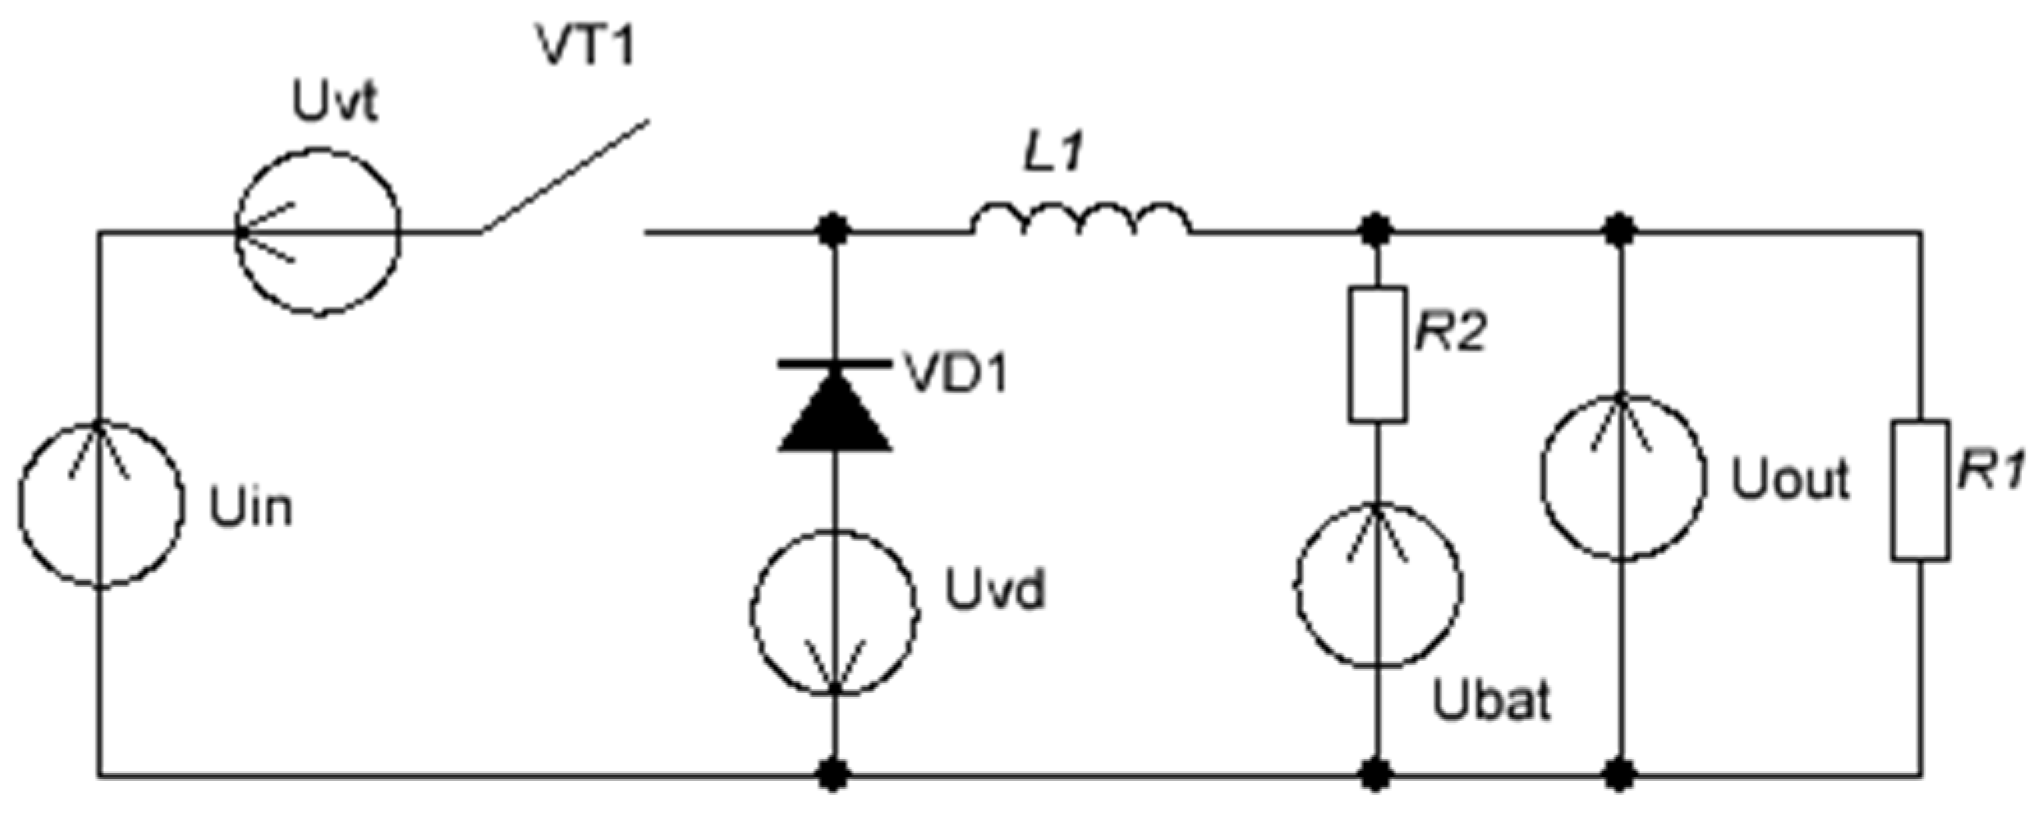
To derive the corresponding calculation formulas, the substitution circuit is used, shown in
Figure 3. The transistor voltage was modeled by the electromotive force (EMF) source with voltage Uvt, the voltage drop on the diode is represented by the source Uvd, the output voltage is taken equal to Uout, and the input voltage is modeled by the source Uin. The active resistance of all parts of the circuit and the internal resistance of the EMF sources are taken to be zero.
The main dependencies on which the calculation is based are the formulas for determining the amplitude of the choke current in the discontinuous (DCM, Equation (1)) and continuous (CCM, Equation (2)) current modes [
8], modified by the authors, by introducing voltages on the transistor and the diode. The discontinuous current mode is understood as a mode of operation of the converter when at the moment of the PWM pause, the choke current has the time to drop to zero. The continuous current mode is understood as the operating mode when at the moment of the PWM pause, the choke current decreases to some non-zero value. The authors have provided Equation (3) for determining the choke operation mode.
Having determined the mode of the choke current and its amplitude value, it is possible to calculate all the other electrical parameters of the circuit, including the duty cycle of the PWM. The resulting correlations are tested by computer simulation in the LTspice IV program. The converter model comprises ideal elements with lumped parameters that are placed in separate voltage sources. The simulation results confirm the correctness of the assumptions made to derive the formulas. The calculated data correspond to the characteristics and parameters obtained by simulating various operating modes of the circuit.
The input voltage, its source being the fuel cell stack, is nonlinearly dependent on the current draw. Therefore, in the process of calculation, it is necessary to consider a continuous dependence . The abovementioned current–voltage characteristic (CVC) correlation can be obtained either experimentally or by tuning the mathematical model of the fuel cell battery. In the first case, a set of CVC points can be interpolated by cubic splines, for example, in the MathCAD program. The second solution for obtaining the CVC of a stack is discussed below.
Nowadays, the mathematical model of a fuel cell that comprises the Nernst potential difference and voltage drops in different parts of the CVC is the most popular one [
9,
10,
11,
12,
13,
14,
15]. A similar model that additionally takes into account the transportation of liquid water is used in various multiphysics simulation environments, such as Amesim or Openmodelica [
16]. When calculating the operating mode of the converter, it is sufficient to use a simpler model that simulates the CVC of a stack depending on its geometry, operating temperature, and gas pressures:
where
is the Nernst potential,
is a voltage drop in the initial part of the CVC (activation voltage),
is a voltage drop across active resistance in the working part of the CVC,
is a voltage drop in the CVC part where the mass transfer begins (concentration voltage).
The input parameters of the model are as follows:
K, operating temperature of the stack; atm, absolute partial air pressure; atm, absolute partial pressure of hydrogen; %, oxygen content in the air; Дж/(molkg), universal gas constant; Kл/мoль, Faraday constant; B, standard electrode potential for the reaction under normal conditions; enthropy; K, temperature of normal conditions; , number of electrons involved in the reaction; cm2, area of the active part of the interelectrode unit (IEU); cm, Nafion membrane thickness; , , , , , and , empirical coefficients; A, maximum current at which the CVC begins to bend down; Ohm, electrode resistance; Bar, absolute partial pressure of oxygen.
Activation voltage:
where
mol/cm
3 is the oxygen concentration in the gas/catalyst bed and
is the current through the fuel cell.
The coefficients
can be either determined empirically or calculated by the formula given in [
11]. They depend on protons, water, and hydrogen concentration.
Concentration tension is the Tafel equation.
Internal resistance voltage
, where
is the membrane resistance [
17].
Here, the membrane resistivity is stated in the following way:
The experimental CVC of the stack and the least-squares method were used to tune the model. For this, the correlation between the output voltage of the stack and the input parameters is written in the following form:
Then, in a cyclic calculation, by enumerating the values of the parameter in a given range and determining the sum of the squared differences between the experimental CVC and the CVC of the model with the current value of , an option with the highest index of coincidence of characteristics is found. The resulting parameter is used as the input when calculating the next parameter , and so on, in the loop. After calculating the last parameter b, the sum of the squared differences between the experimental CVC and the CVC of the model are determined with the obtained values . Further, the obtained parameters are used as initial approximations for the next iteration and the process is then repeated. The results of the calculation are the parameters that correspond to the minimum sum of the squared differences, that is, the highest index of coincidence of the correspondence between the experimental CVC and the CVC of the model.
The ranges of variation in the coefficients while selecting the model parameters were as follows:
from −2 to +2 1000 points
from −0.01 to +0.01 1000 points
from −0.01 to +0.01 1000 points
from −0.1 to +0.1 1000 points
from +14 to +23 1000 points
from 0 to +0.2 1000 points
from −2 to +2 1000 points
The current varied from 0.1 to 38 A, which corresponded to 50 points on the CVC.
As a result of the approximation by the least-squares method, the following values of the coefficients are obtained: ; ; ; ; ; Oм; and .
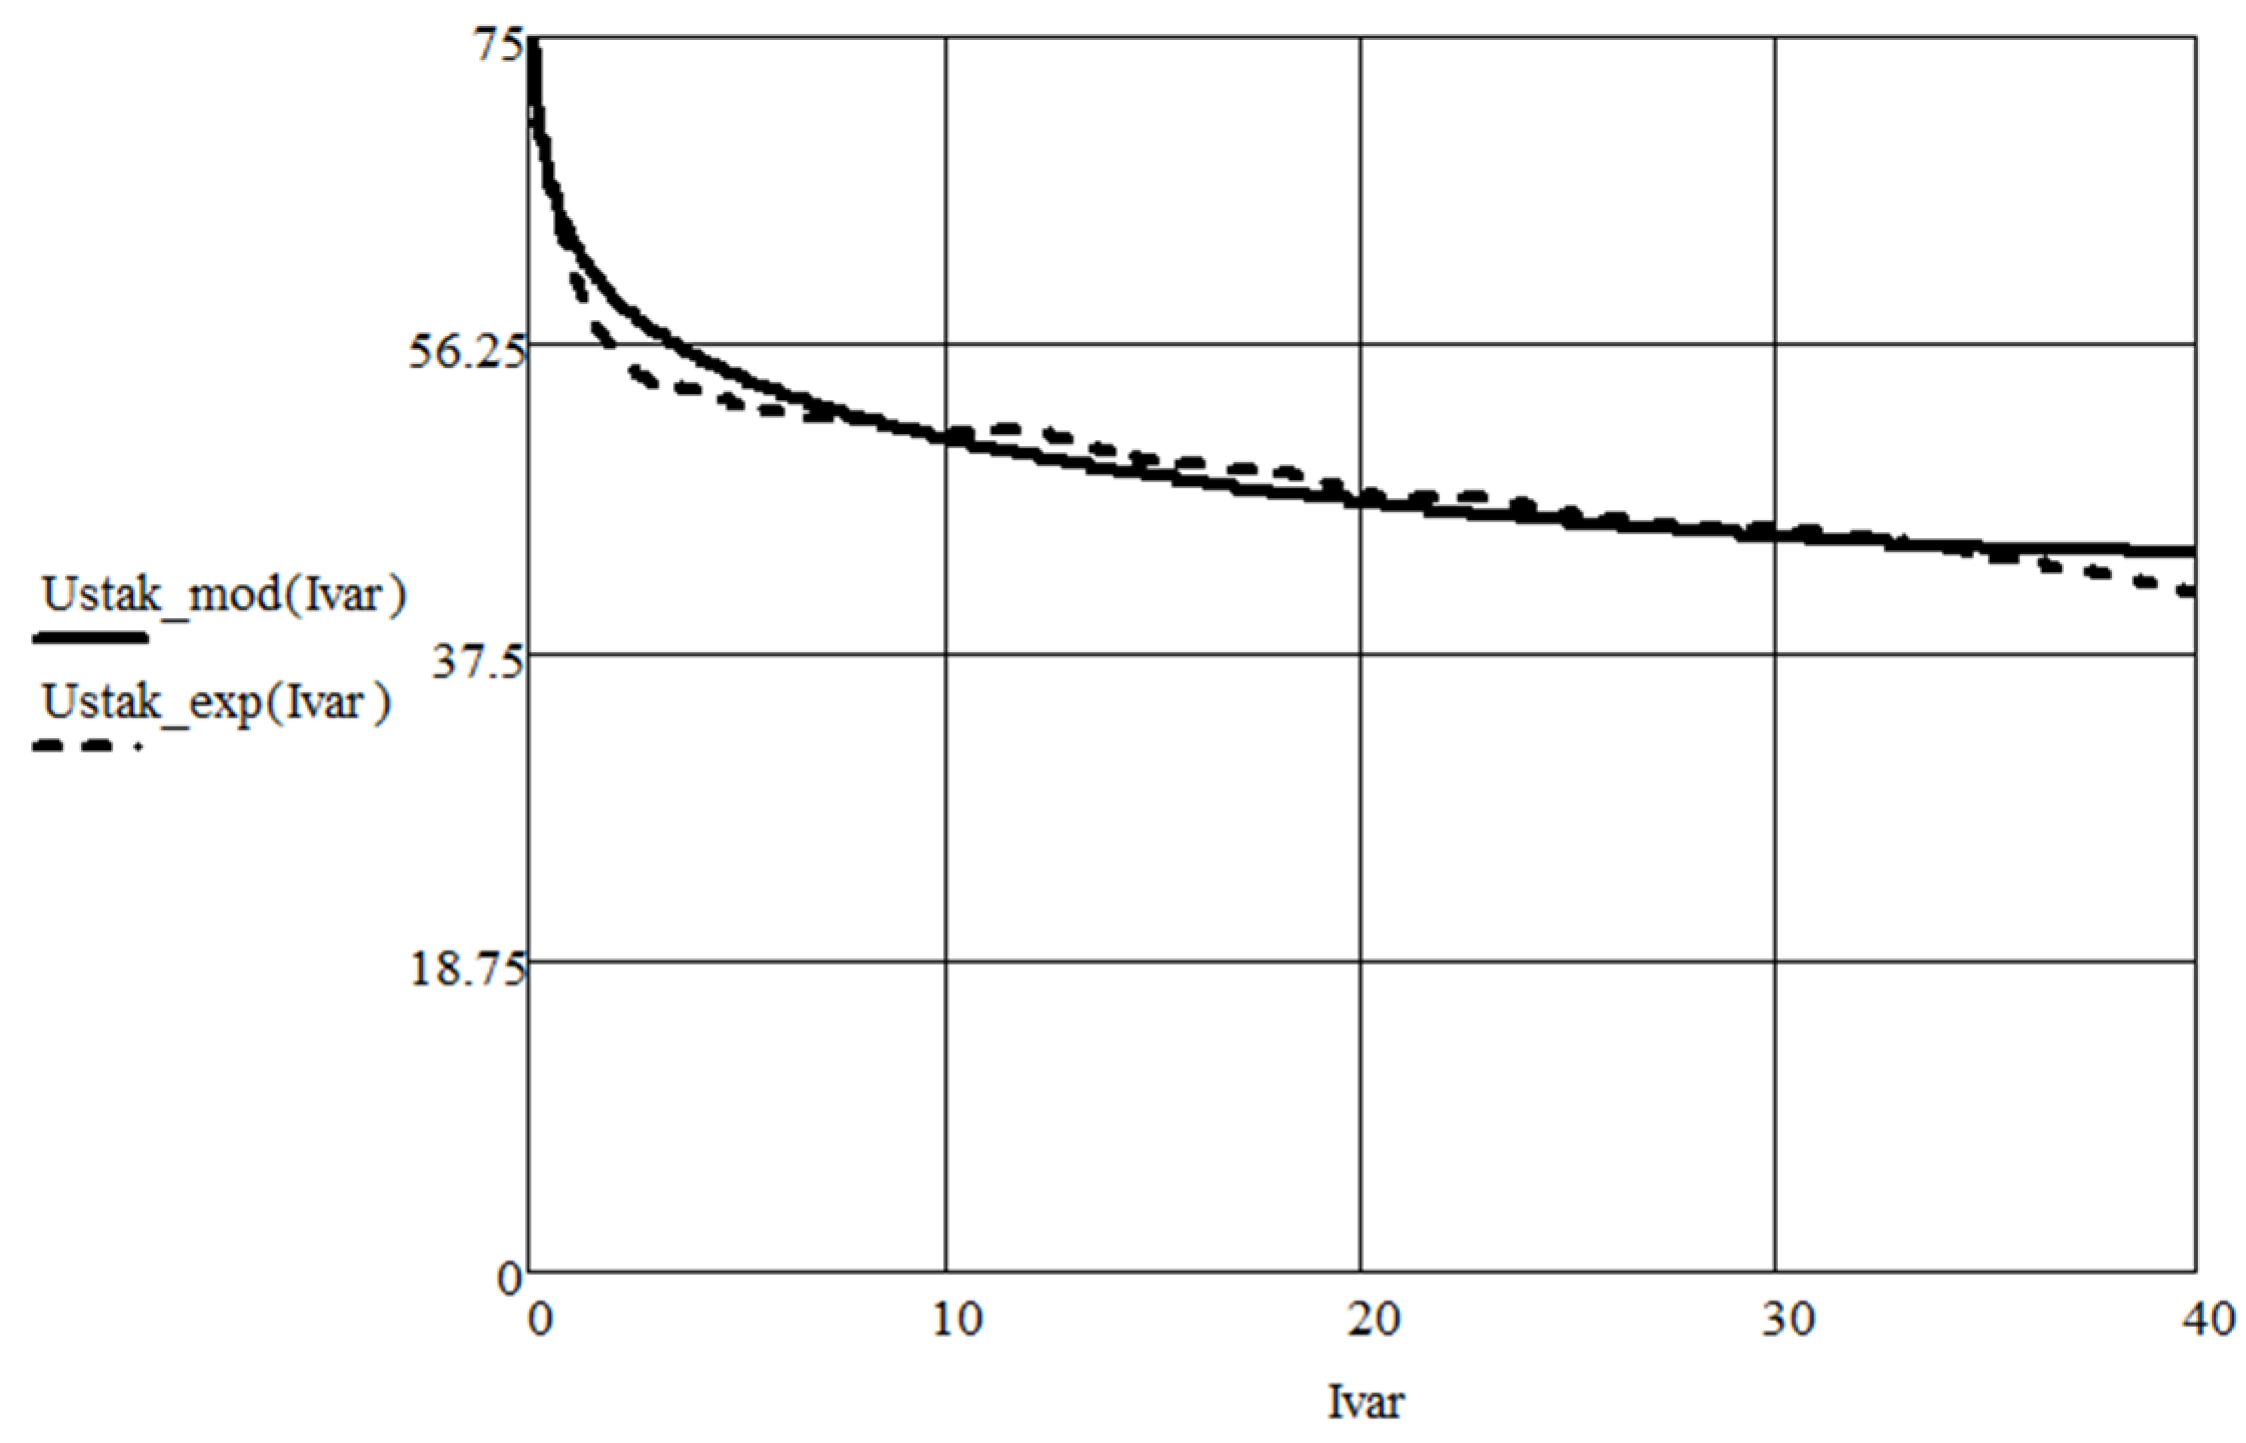
The current–voltage characteristic that is implemented in the model with the obtained coefficients is shown in
Figure 4 as a solid curve. As can be seen on the graph, the characteristic of the model coincides with the experimental one in a satisfactory way.
The estimation of the modeling error was carried out by calculating the root-mean-square deviation of the dependence obtained by calculation from the experimentally obtained data:
where
= VAC FC experimental point number,
= number of experimental points,
= VAC experimental points, and
= points obtained as a result of a numerical experiment.
The relative modeling error reaches 5.8% at the beginning of the graph in
Figure 4 and then it decreases and does not exceed 3% in the measuring section of the VAC. The obtained modeling accuracy is sufficient for practical use.
Bearing in mind the correlation , it is possible to determine the voltage at the input of the converter at the present value of the current consumed. In this case, the current consumed by the converter depends on the input voltage. The problem when the calculation results affect the initial data of the same calculation can be solved by the iteration method. In this case, the algorithm for calculating a converter powered by a fuel cells stack is as follows:
Initial data for the calculation are set. Parameters can be both fixed and varied: .
The initial approximation of the current consumed by the converter is set: .
The initial approximation of the input voltage of the converter (output voltage of the stack) is determined according to the abovementioned characteristic: .
The draw of the current consumed by the converter during operation from the voltage obtained at the first iteration is calculated as follows:
The module of the residual between new, obtained, and previous values of the input current is calculated.
If the residual modulus exceeds the set current draw value, then a new value of the input current is applied to the CVC of the stack correlation and a new approximation of the input voltage of the converter is determined. Then step 4 takes place and the cycle repeats itself one more time.
To exit the iteration loop, it necessary to reach the specified value of the residual modulus between the previous and the successive value of the desired input current or to reach the number of iterations of the maximum permissible value.
In case the calculations are correct, the value of the input voltage of the converter is obtained, which is the value of the stack voltage decreased according to the present input parameters. With this value of this voltage, all other parameters of the circuit are determined.
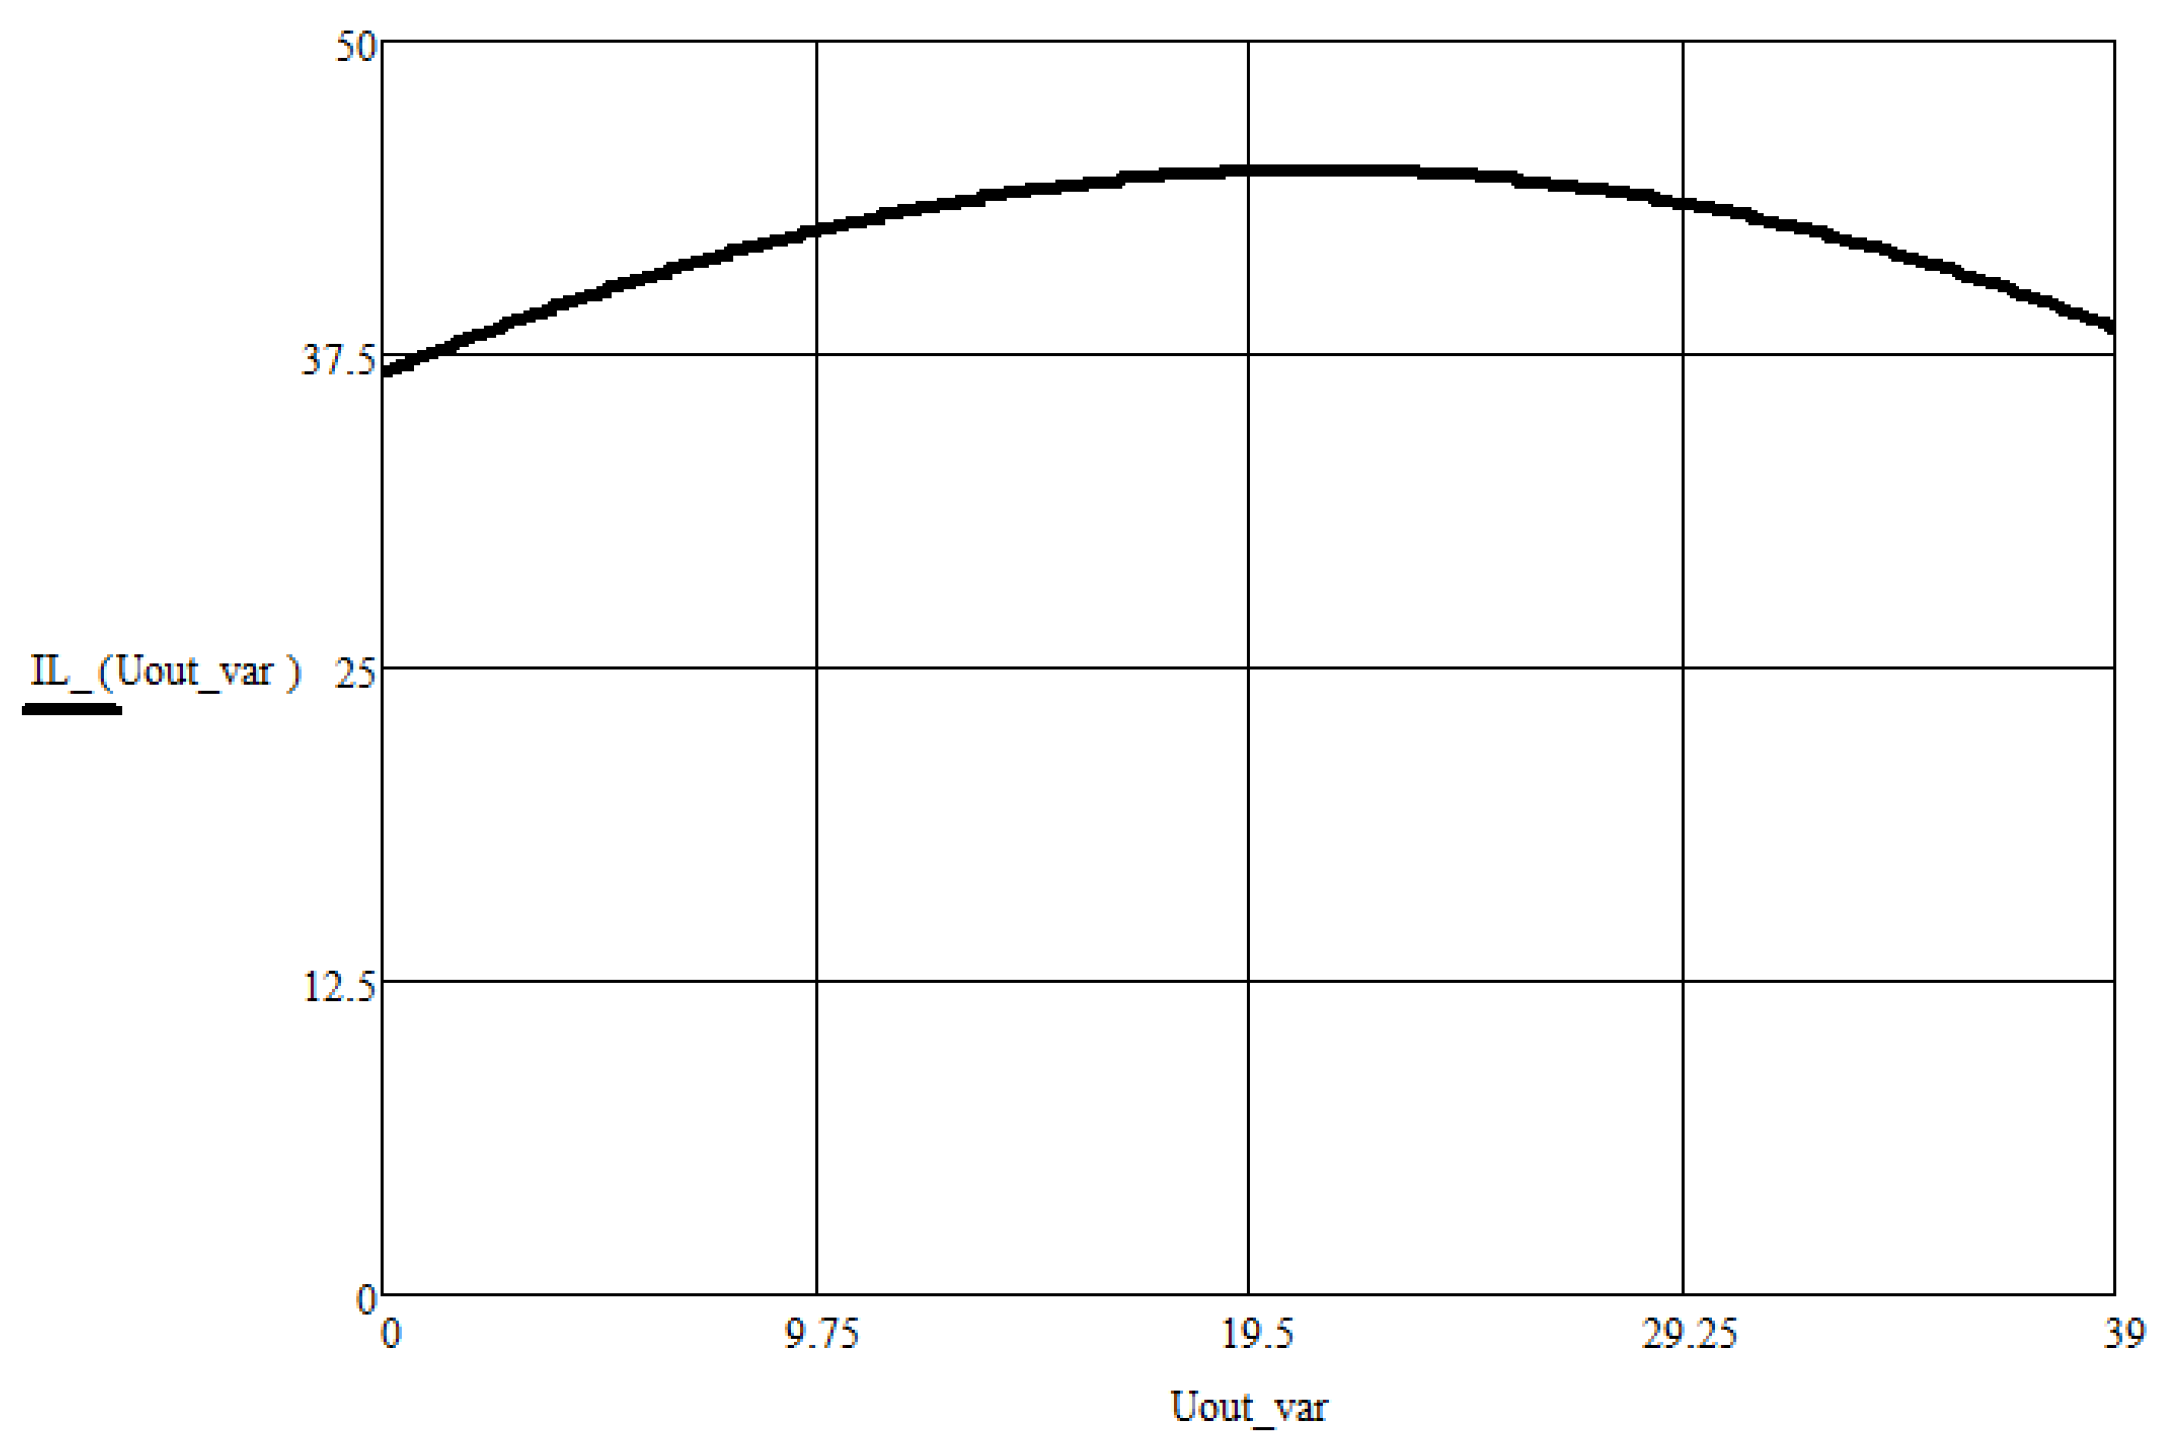
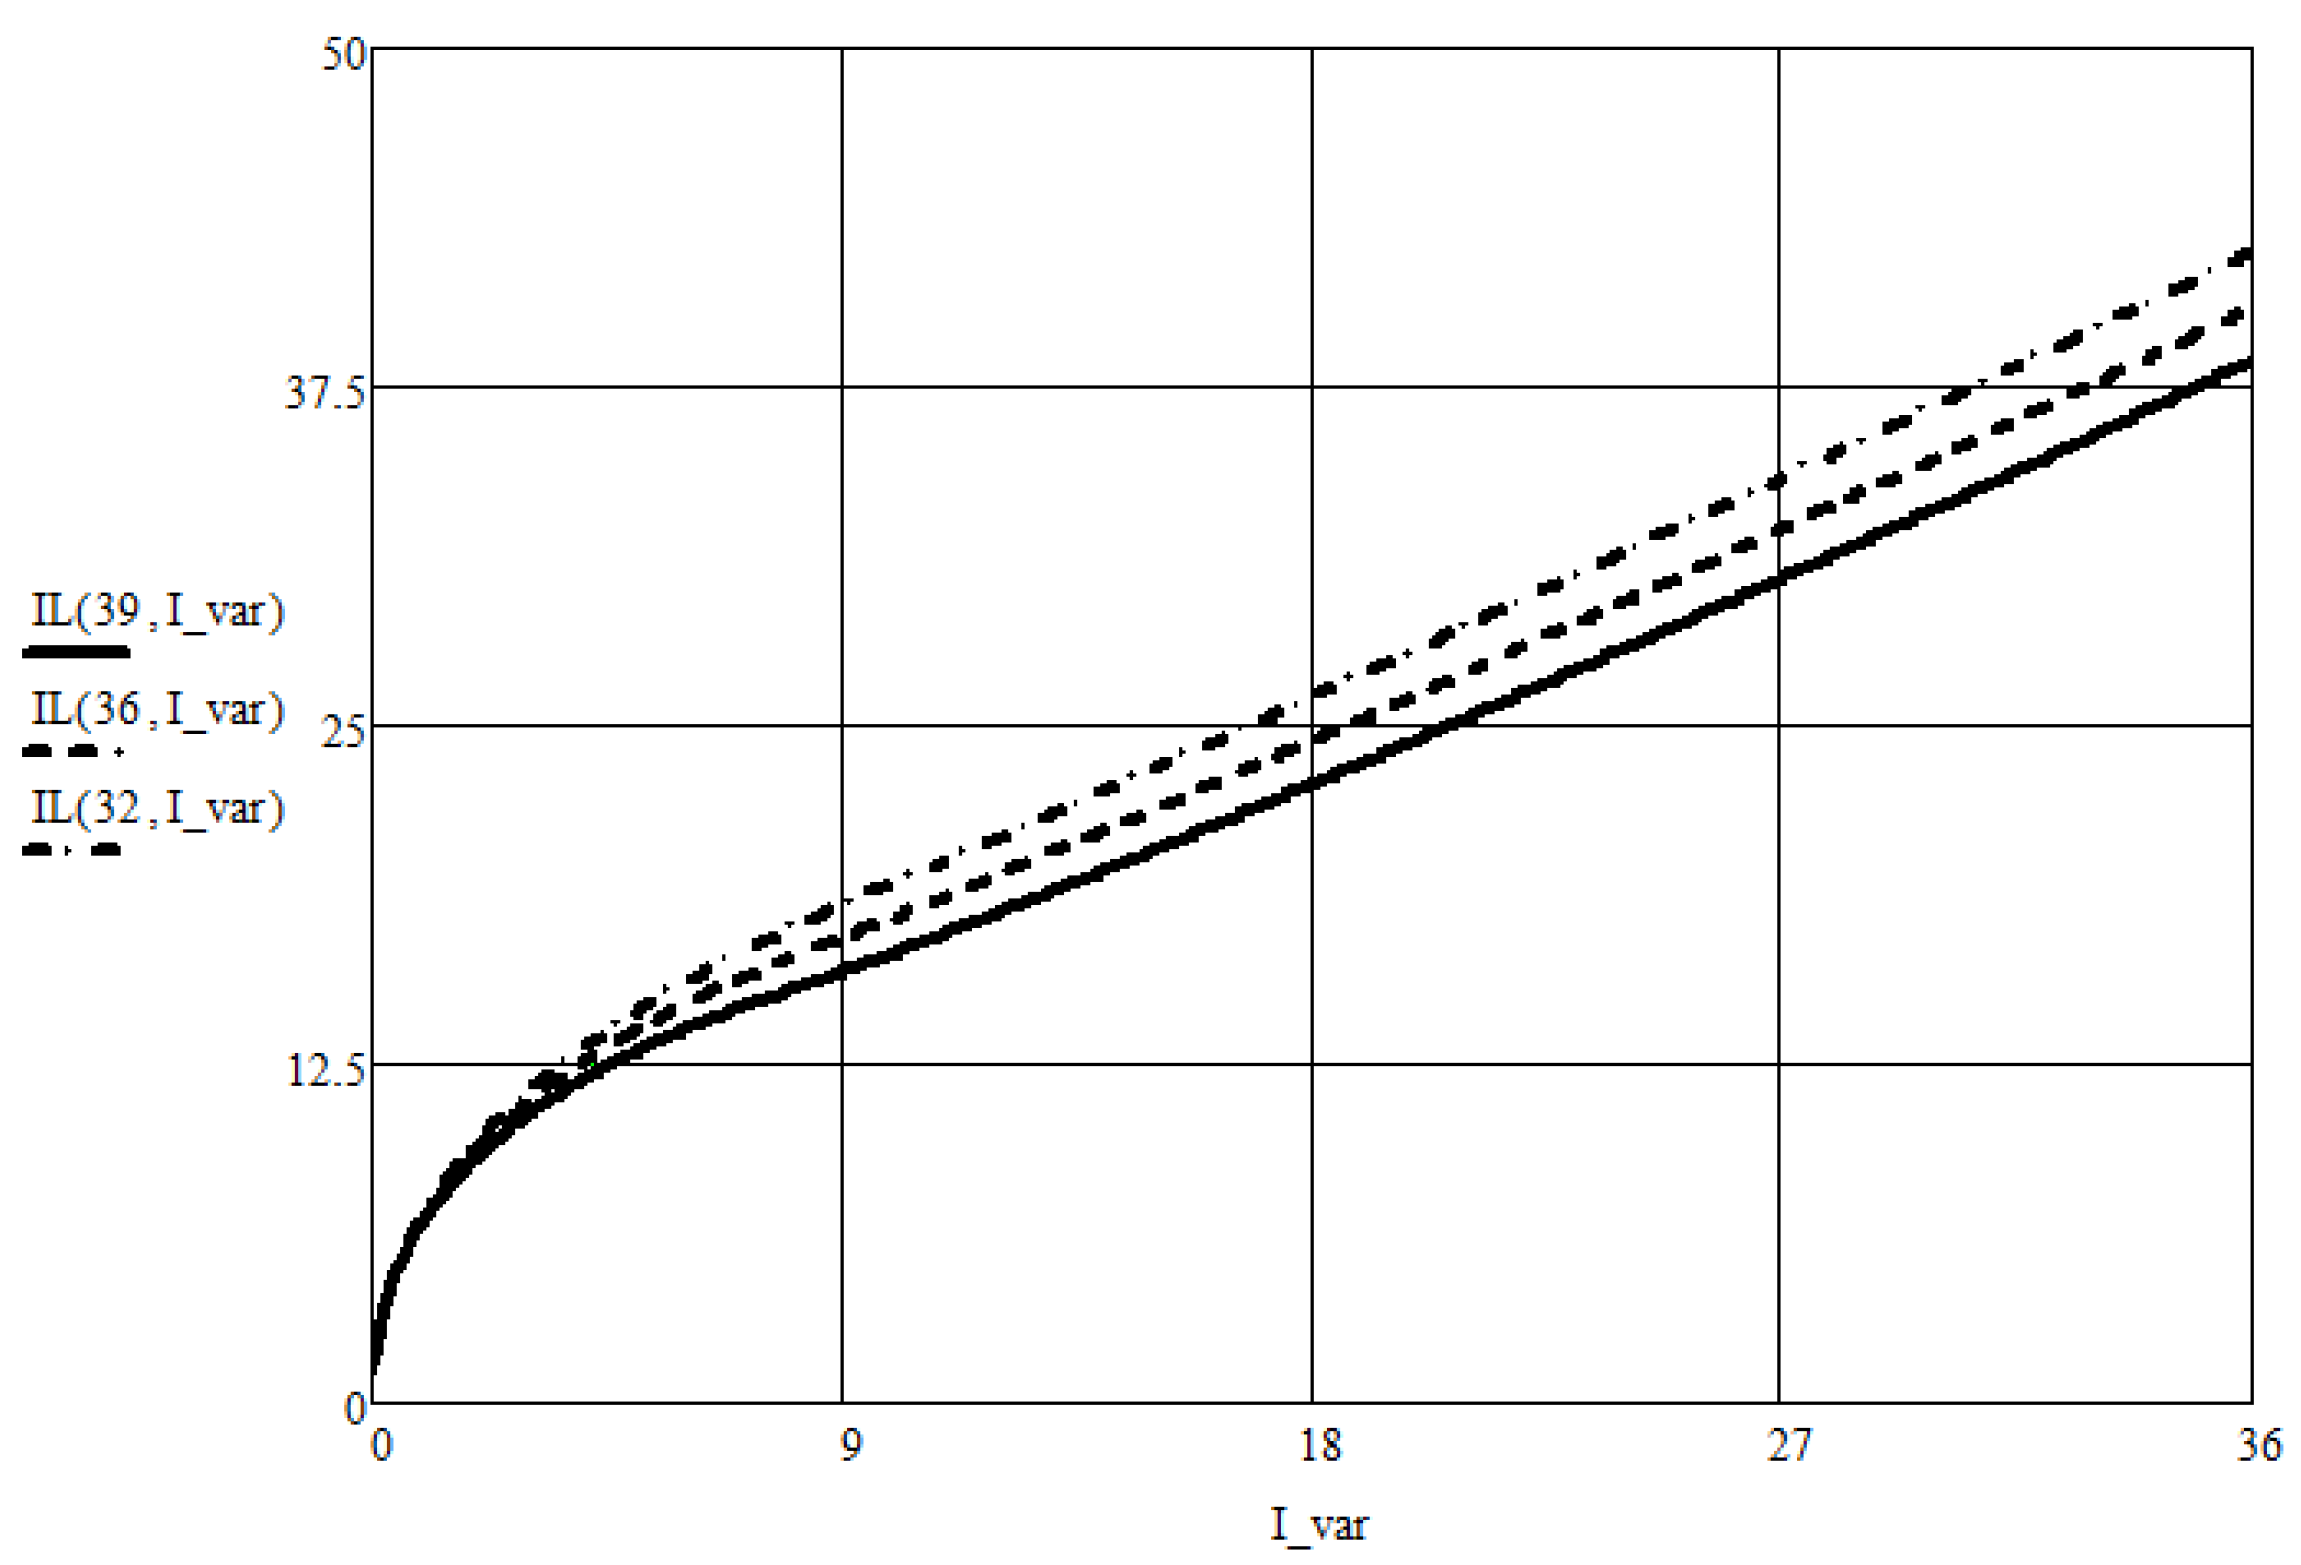
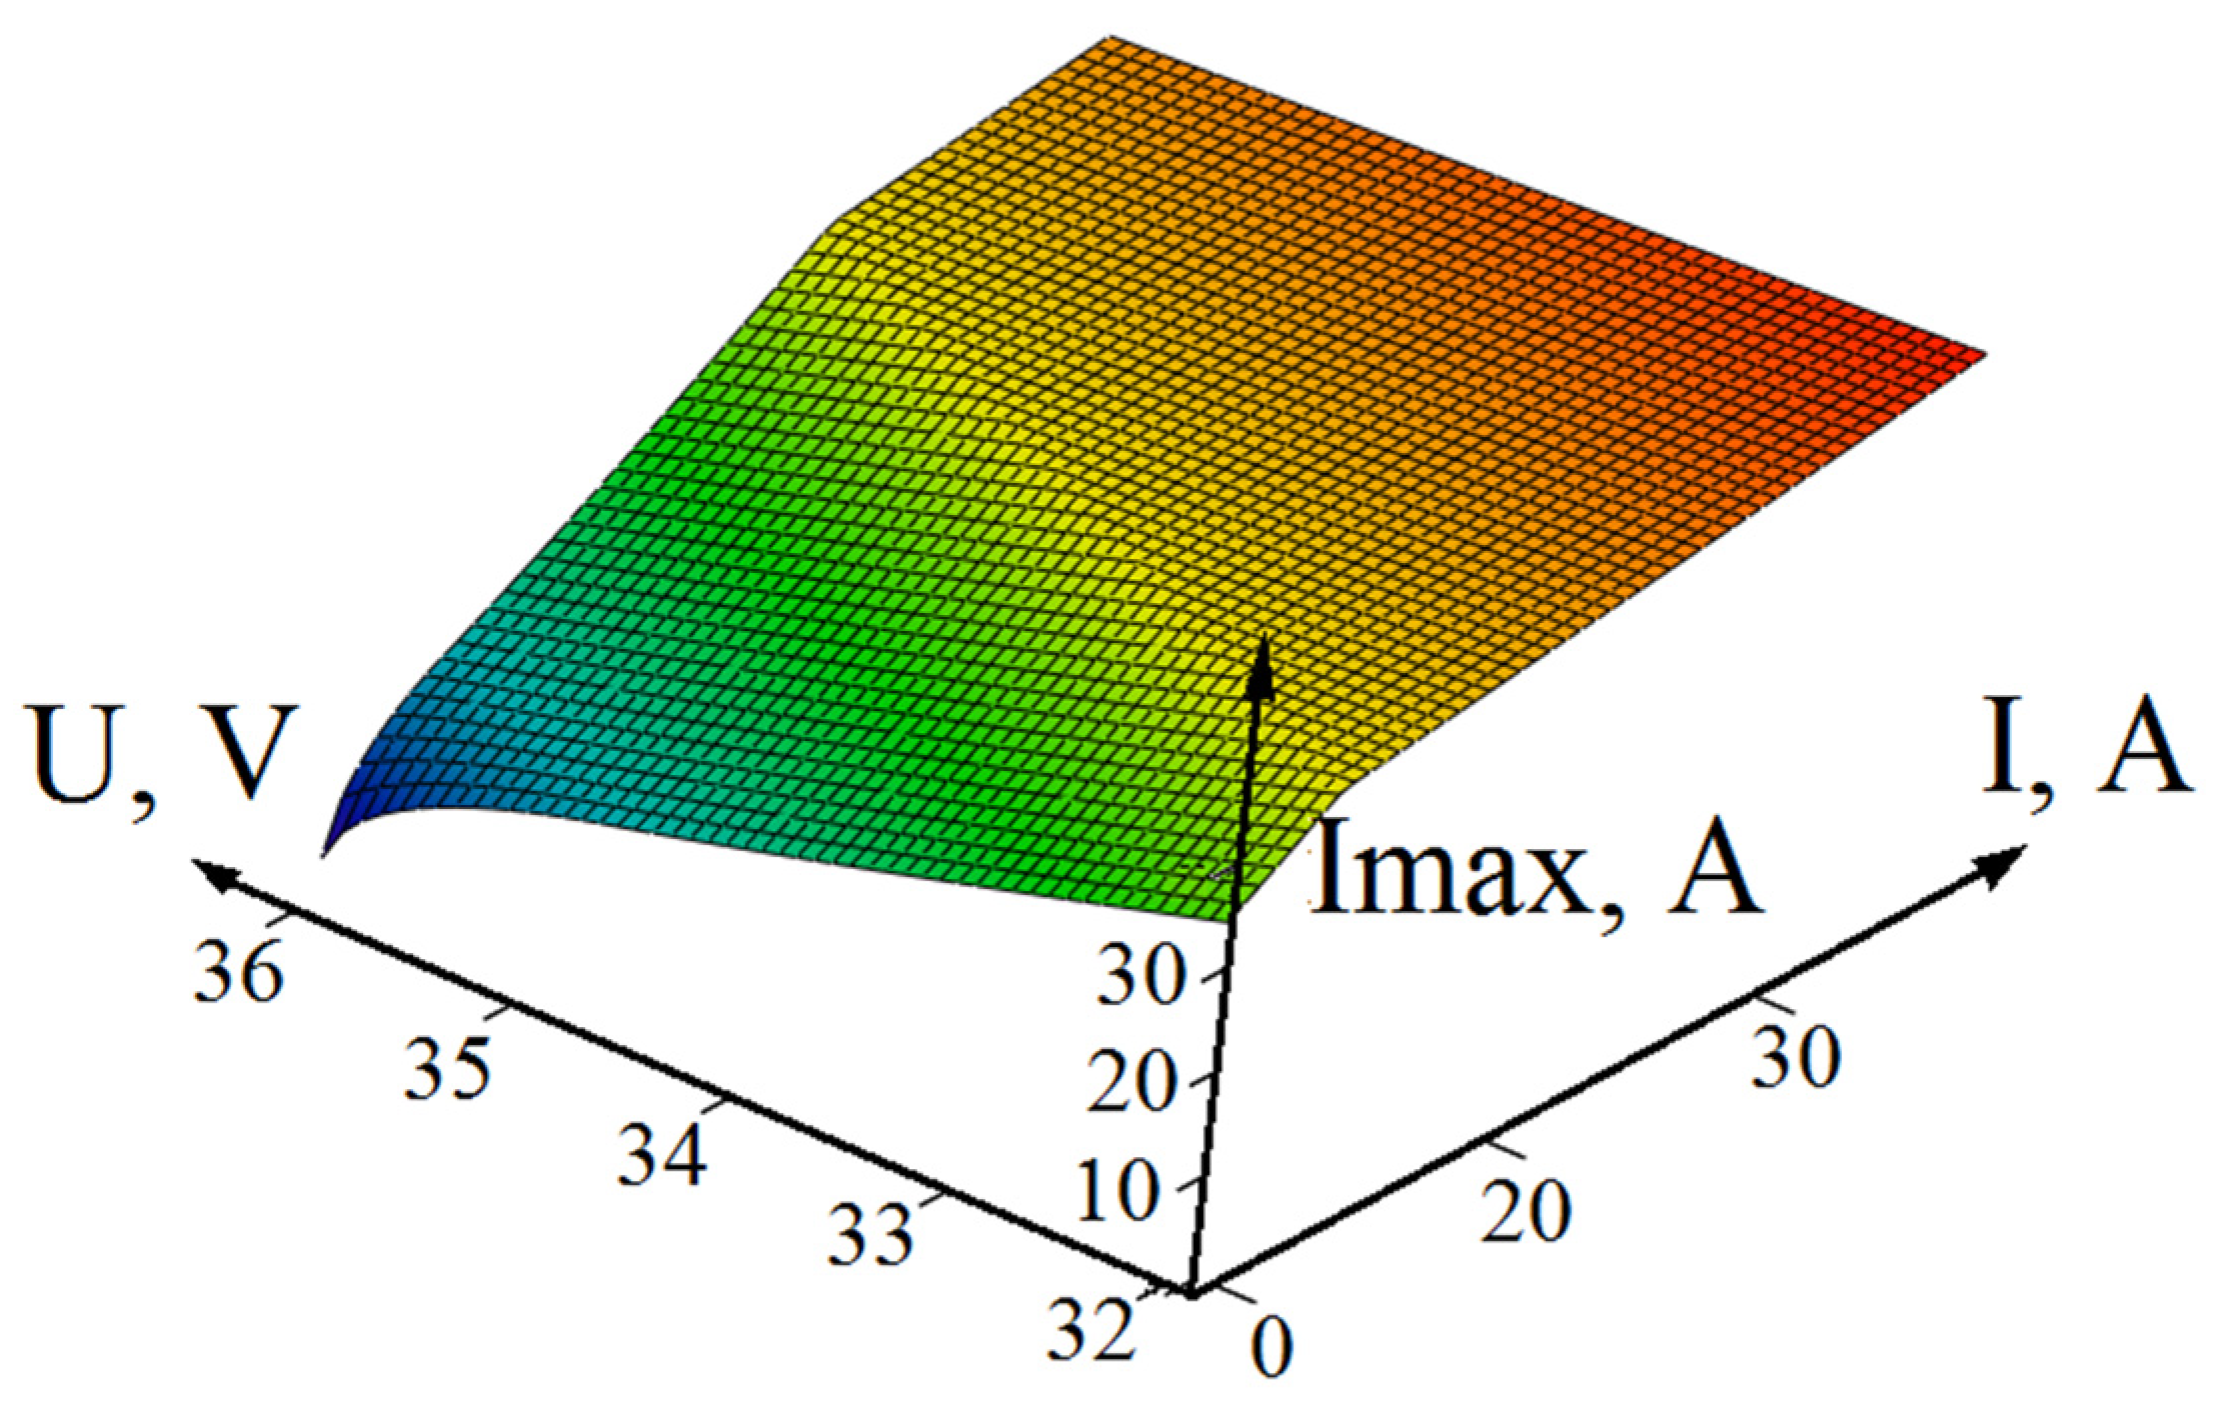
The algorithm is developed in the MathCAD program. All the initial data (except for the desired parameter that is fixed) on the correlation graphs that relate to the amplitude of the choke current, which depicts the ratio between the output current and the output voltage, are obtained. With the obtained graphs, it becomes possible to determine the most intense choke and semiconductor elements operation mode. At the same time, the obtained graph dependencies allow one to select a choke for the saturation current, the induction swing, and the effective current value, as well as to select semiconductor elements for maximum and average currents and calculate the value of the cycle-by-cycle current limiting pickup setting for the control system. Cycle-by-cycle current limitation refers to converter protection that is shaped by the control system and represents the limitation of the PWM pulse width when the choke current amplitude of a given value is reached. The calculation results are shown in
Figure 5 and
Figure 6.
As can be seen from the graphs, the maximum value of the choke current corresponds to a voltage of 22 V, which is less than the nominal output voltage of 36 V. At the start of the converter, the output voltage increases and takes its value, so the value of the current protection setting should be higher.
3. Summation of Multiple Power Supplies
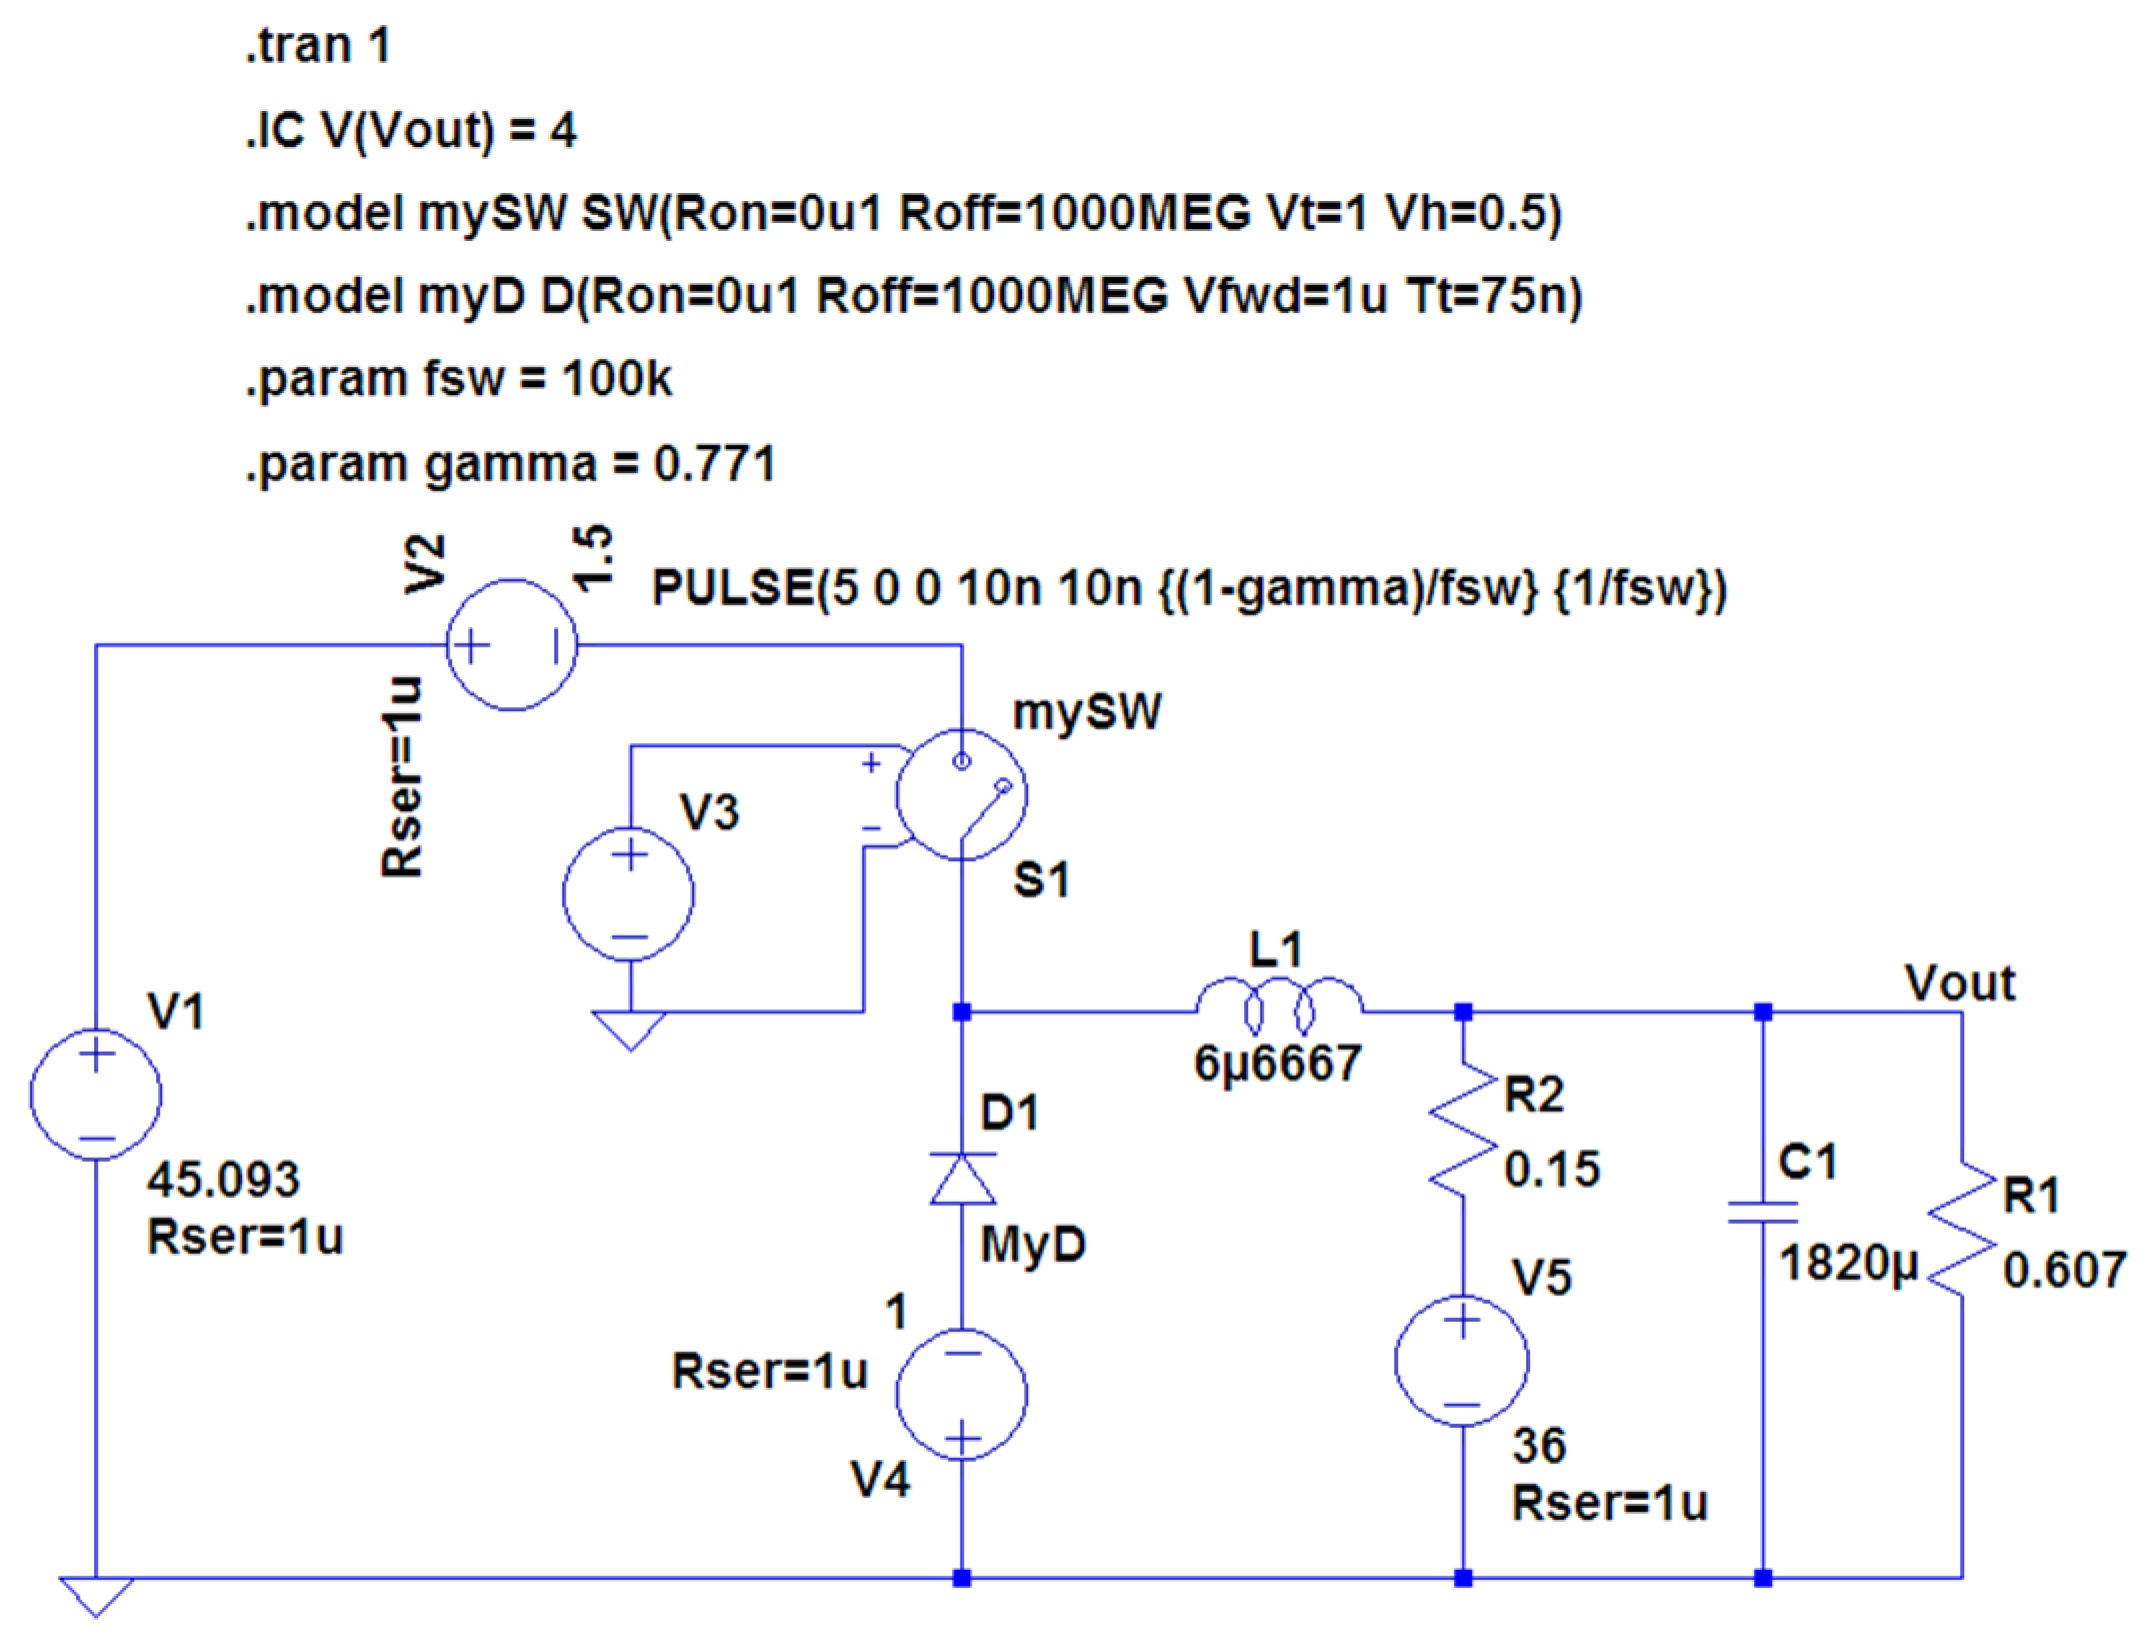
In accordance with the proposed structure of the electrical complex, the voltage converter is to be supplemented with a storage battery, which is expected to compensate for peak power overloads. The battery is directly connected at the output of the inverter in parallel with the load. The equivalent circuit of such a converter is shown in
Figure 7. Here, the storage battery is presented with a simple IR model [
18,
19,
20] as an EMF source with Ubat voltage and its internal resistance R2. The reactive elements of the equivalent circuit of the storage battery are not used, since the calculation is carried out for the steady-state operation mode of the converter.
We shall consider the integration mode of such a power unit. In the nominal power mode, the battery is fully charged and does not draw any current. As the load current increases, the power drawn from the fuel cells stack accordingly increases to a predetermined value. Typically, the maximum power of the stack is taken to be such an operating mode when the voltage across one interelectrode unit (IEU) decreases down to 0.5–0.6 V. The power value corresponds to certain values of the current
and voltage
on the CVC of the stack. With a further increase in current, the control system begins to reduce the output voltage relative to nominal so that the power consumption from the stack remains constant and equal to the maximum determined value. The correlation for the output voltage of the converter in the input power limitation mode is as follows:
where
is the converter output current and
is the specified nominal output voltage of the converter.
The dependence is the same for the modes of discontinuous (DCM) and continuous (CCM) currents of the choke.
If a storage battery is connected to the output, then the integration mode is carried out as follows: In the initial state, the voltages at the output of the converter and the battery are equal. When the current of fuel cell stack exceeds the maximum value, the control system reduces the output voltage and the battery begins to compensate for part of the power consumption. As the discharge proceeds, its EMF decreases. When the overload mode is off, the voltage at the output of the converter rises and becomes higher than the battery voltage, so the process of charging the battery begins. The charge/discharge current is determined by the internal battery resistance and the difference in the values of the battery EMF and the output voltage of the converter.
The converter switches to the power limitation mode when the load current exceeds the following value:
In accordance with Kirchhoff’s laws, a formula is derived to determine the output current of the converter in this mode:
where
,
, and
.
With the converter current draw value, it becomes possible to determine its output voltage according to the abovementioned formula to set the power limitation mode and find the magnitude and direction of the current of the battery:
If the load current is lower than the maximum value and the power limitation mode is off, the output load voltage is nominal. In this case, the charge current is constant and does not depend on the load current, in which case, the converter current can be found as follows:
Combining the equations above, it is possible to set the dependencies for the output current and voltage of the dependencies taking the integration mode into account:
Substituting the obtained values of the current and voltage of the converter into the abovementioned algorithm of iterative calculation, it is possible to obtain the voltage value at its input, that is, the point on the CVC of the stack that corresponds to the present load current of the power unit. Considering the input and output voltages and current of the converter, it is possible to determine the amplitude of the choke current and calculate all the other parameters of the power circuit.
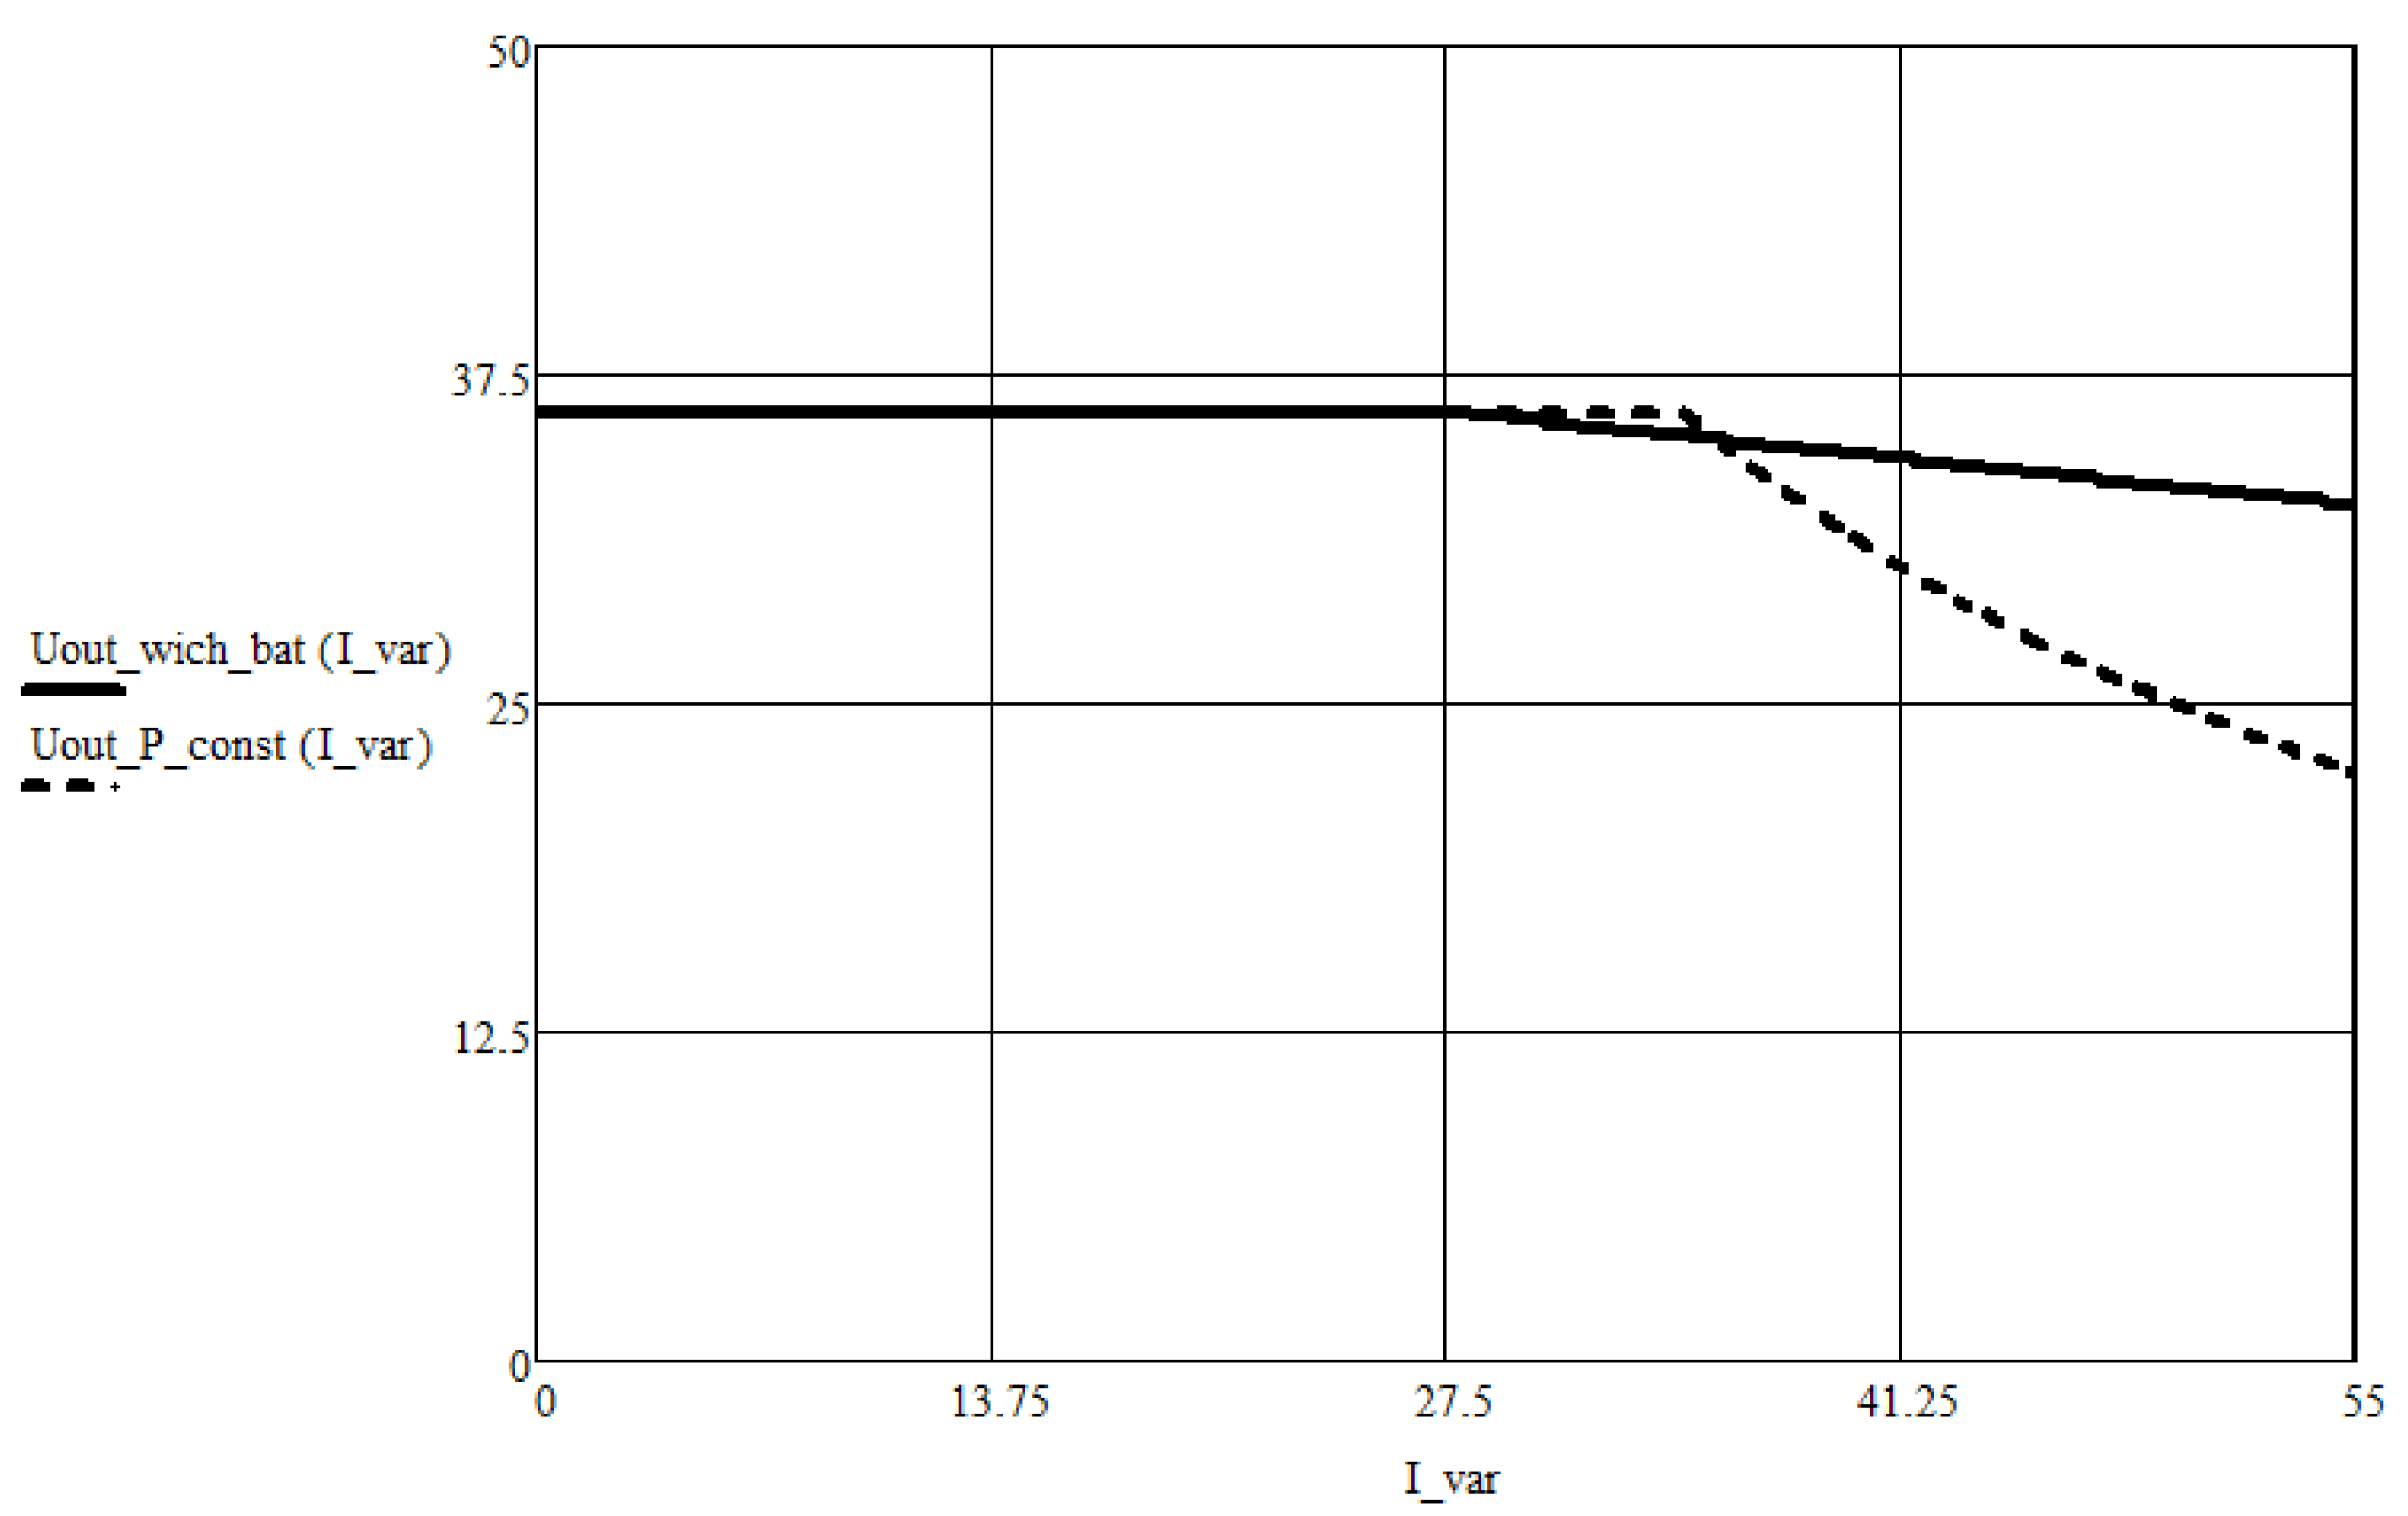
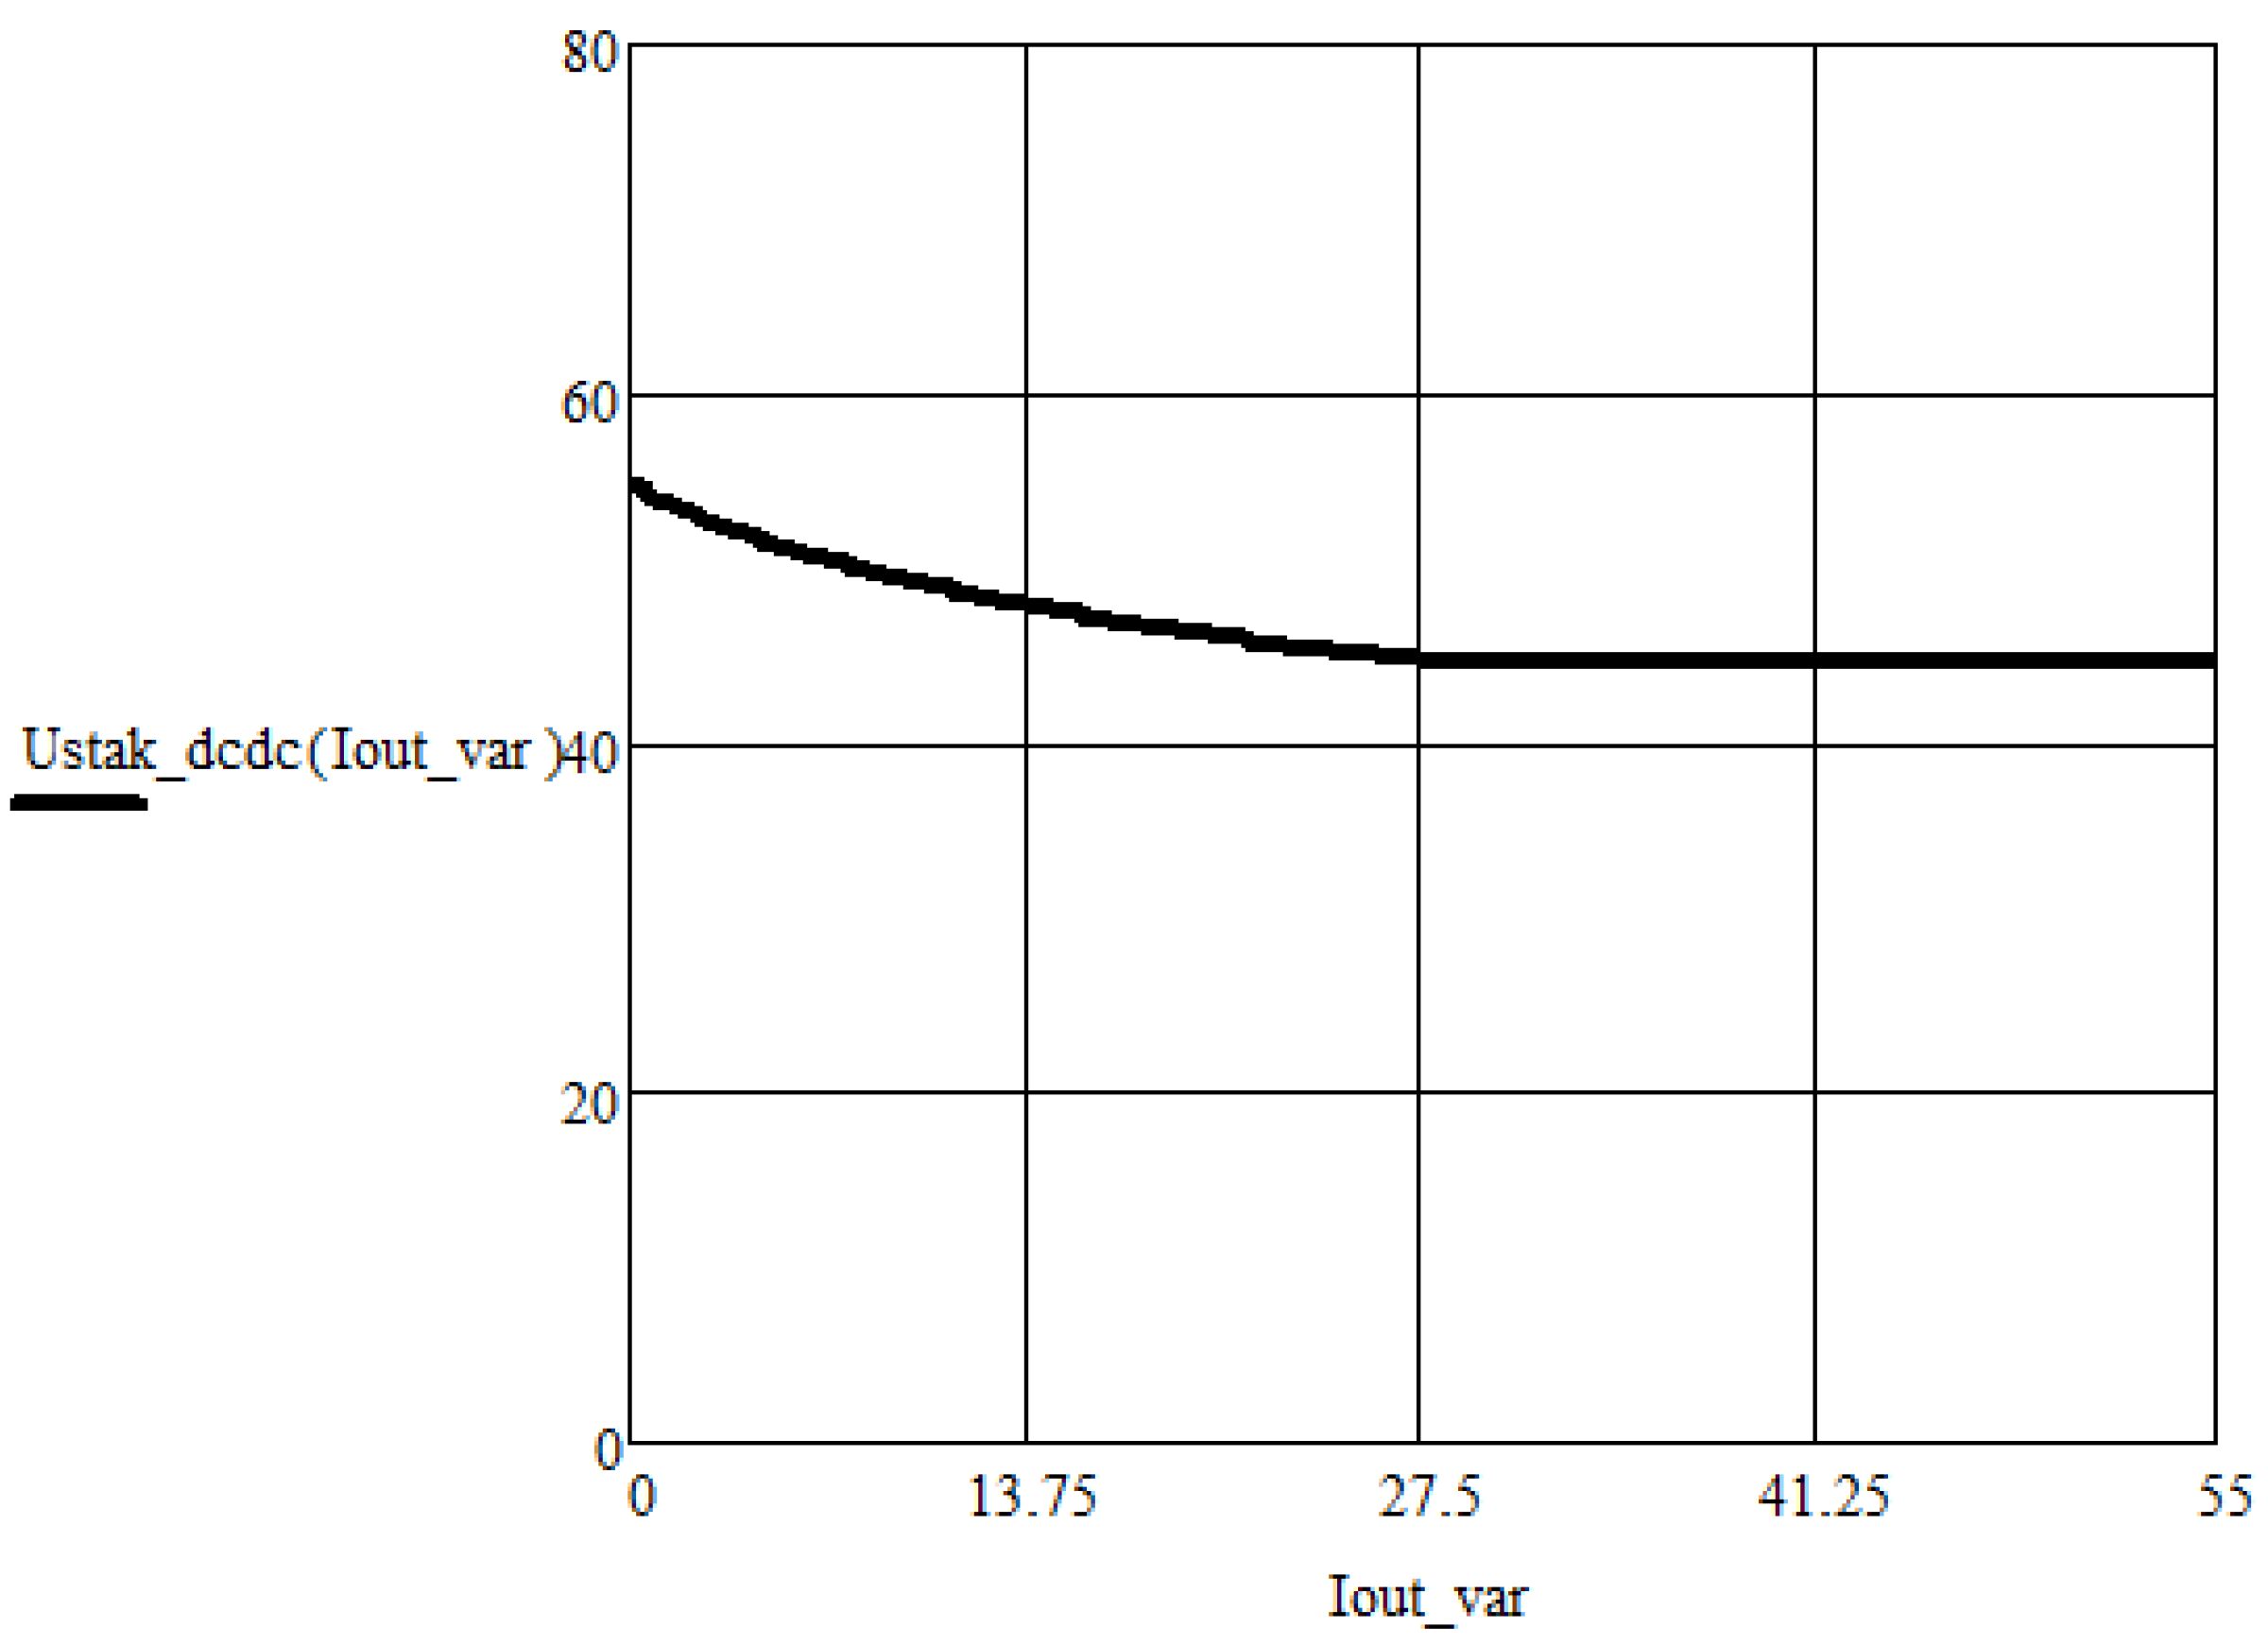
Figure 8 shows the external characteristic of the voltage converter in the power limitation mode when a buffer accumulator is absent (dashed line) and present (solid line). The figure shows that the battery makes it possible to raise the output voltage to the required level at the moment of overload. At the same time, a voltage drop to a value below the nominal level is observed a little earlier due to the fact that part of the output energy is spent on charging the battery. When there is no battery backup power supply, in case of overload (34 … 55 A), the output voltage drops sharply to stabilize the power consumption from the fuel cell.
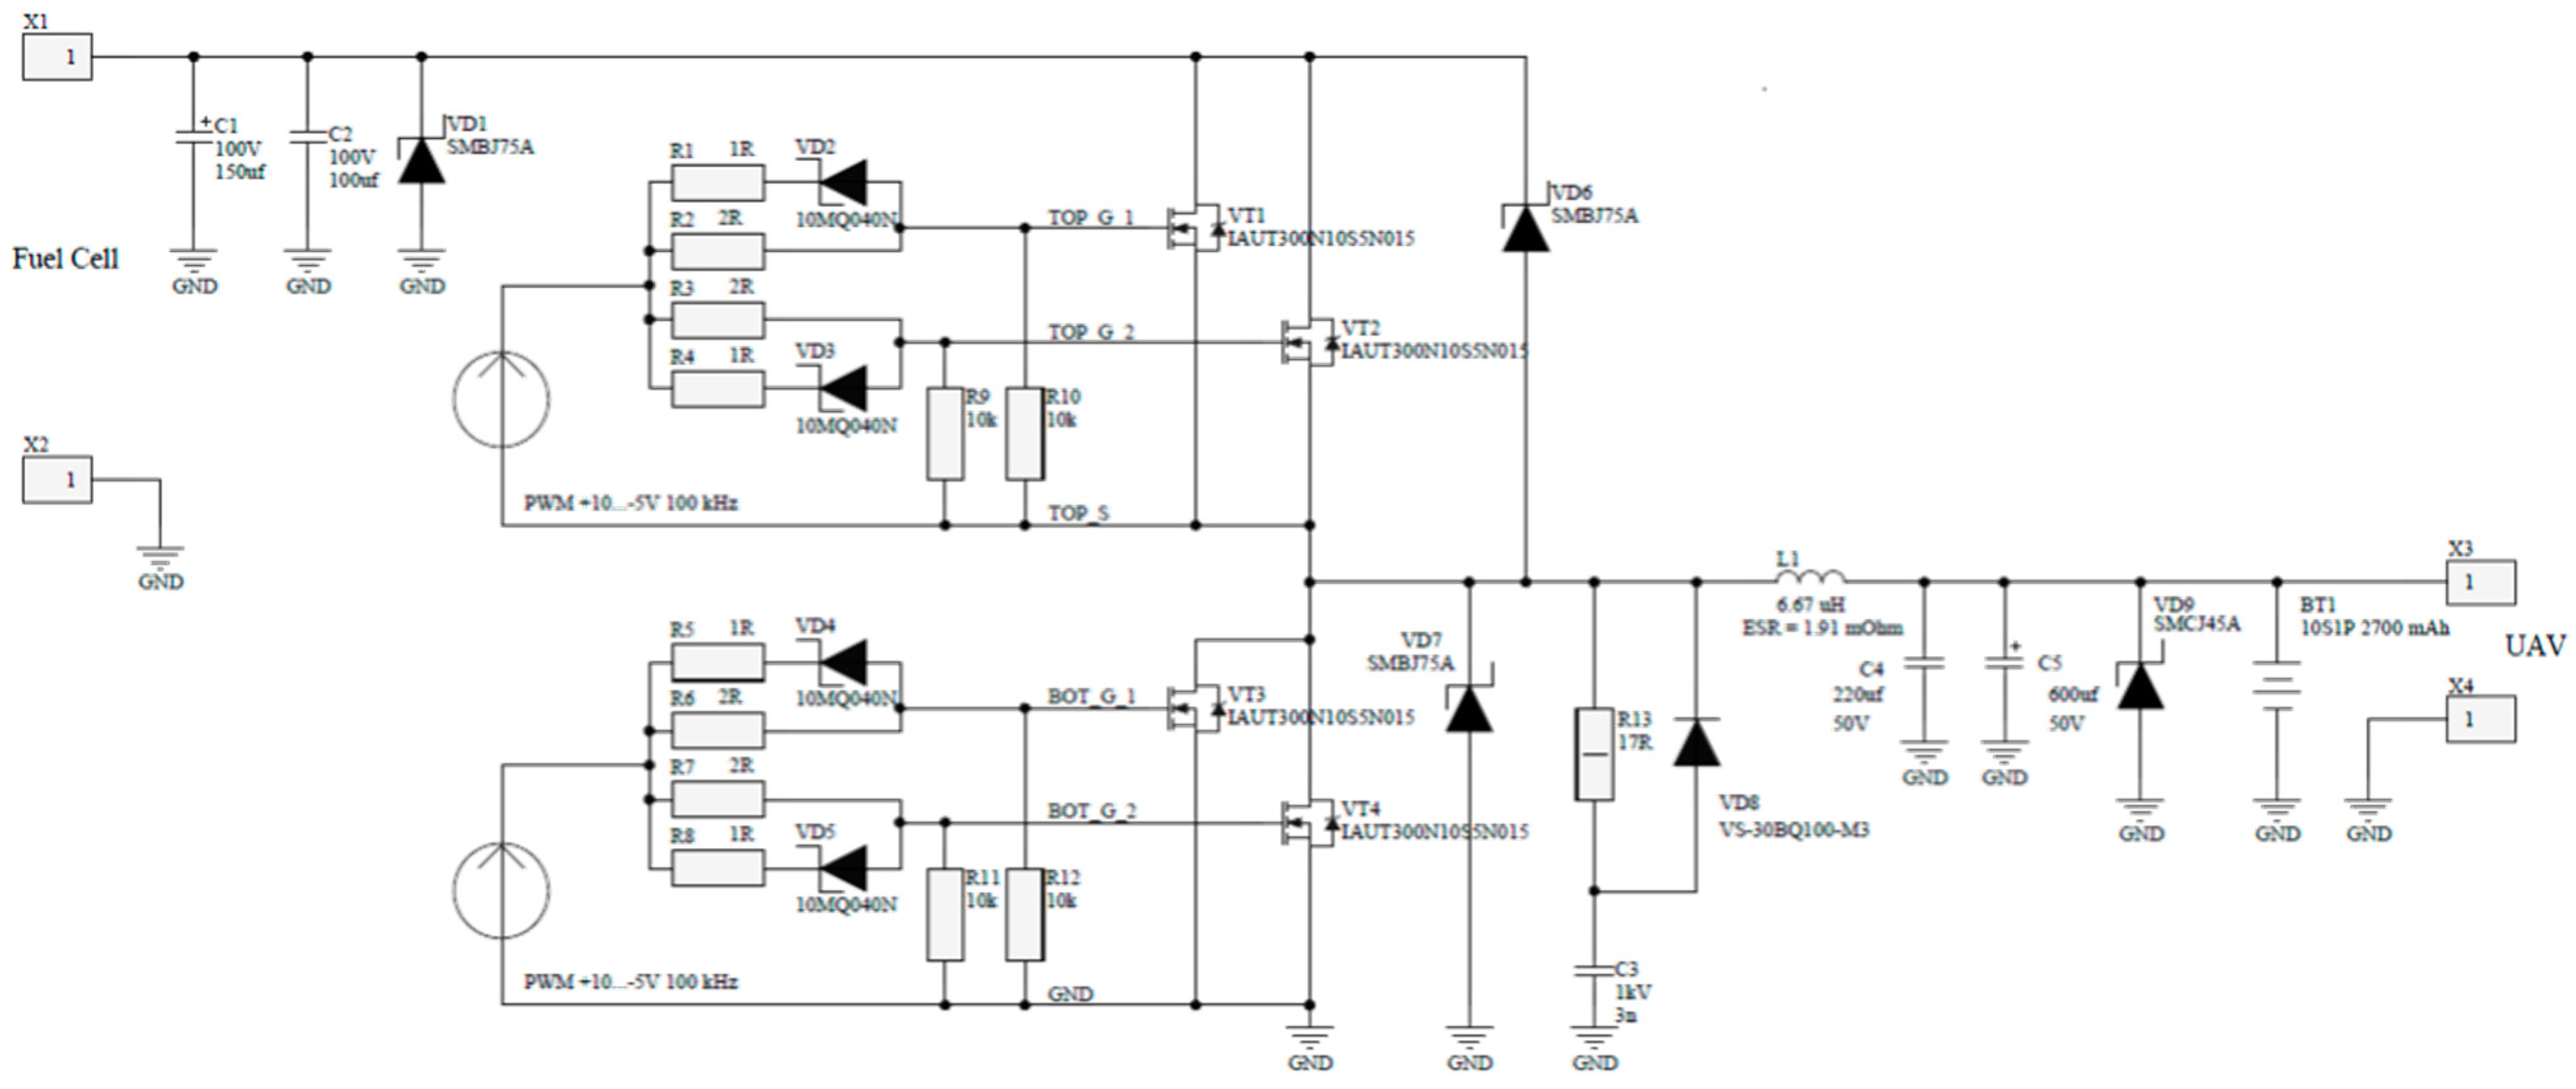
The calculation formulas are tested on a computer model in the LTspice IV program (
Figure 9) and demonstrate good agreement with the simulation results. The deviation of the calculated data obtained by Equations (11–17) from the data obtained by modeling the circuit in the LTspice IV software was estimated by determining the relative magnitude of the error under various operating modes. The calculation error was determined for the amplitude, mean, and effective values of currents and voltages of the circuit according to the equation
where
= calculated parameter and
= parameter obtained as a result of simulation using LTspice software.
The relative error did not exceed the engineering accuracy of 5%, which indicates the correctness of the proposed calculation and the assumptions made.
Thus, the model of a stack of fuel cells was combined with the developed method for calculating the converter, with the mode of integration of power supplies taken into account. A comprehensive mathematical model of the electrotechnical complex of a power unit based on fuel cells was obtained. With the magnitude of the choke current amplitude and the PWM duty cycle in all operating modes, it is possible to calculate the effective and average currents in the circuit elements and the heat losses in them. Thus, due to the fact that all dependencies are obtained in a general form, it becomes possible to figure out the most-loaded modes and optimize power units in terms of efficiency, varying any initial parameters. Thus, determining the current through the battery in the overload and charge modes, it is possible to determine the capacity it requires to ensure the maximum flight duration.
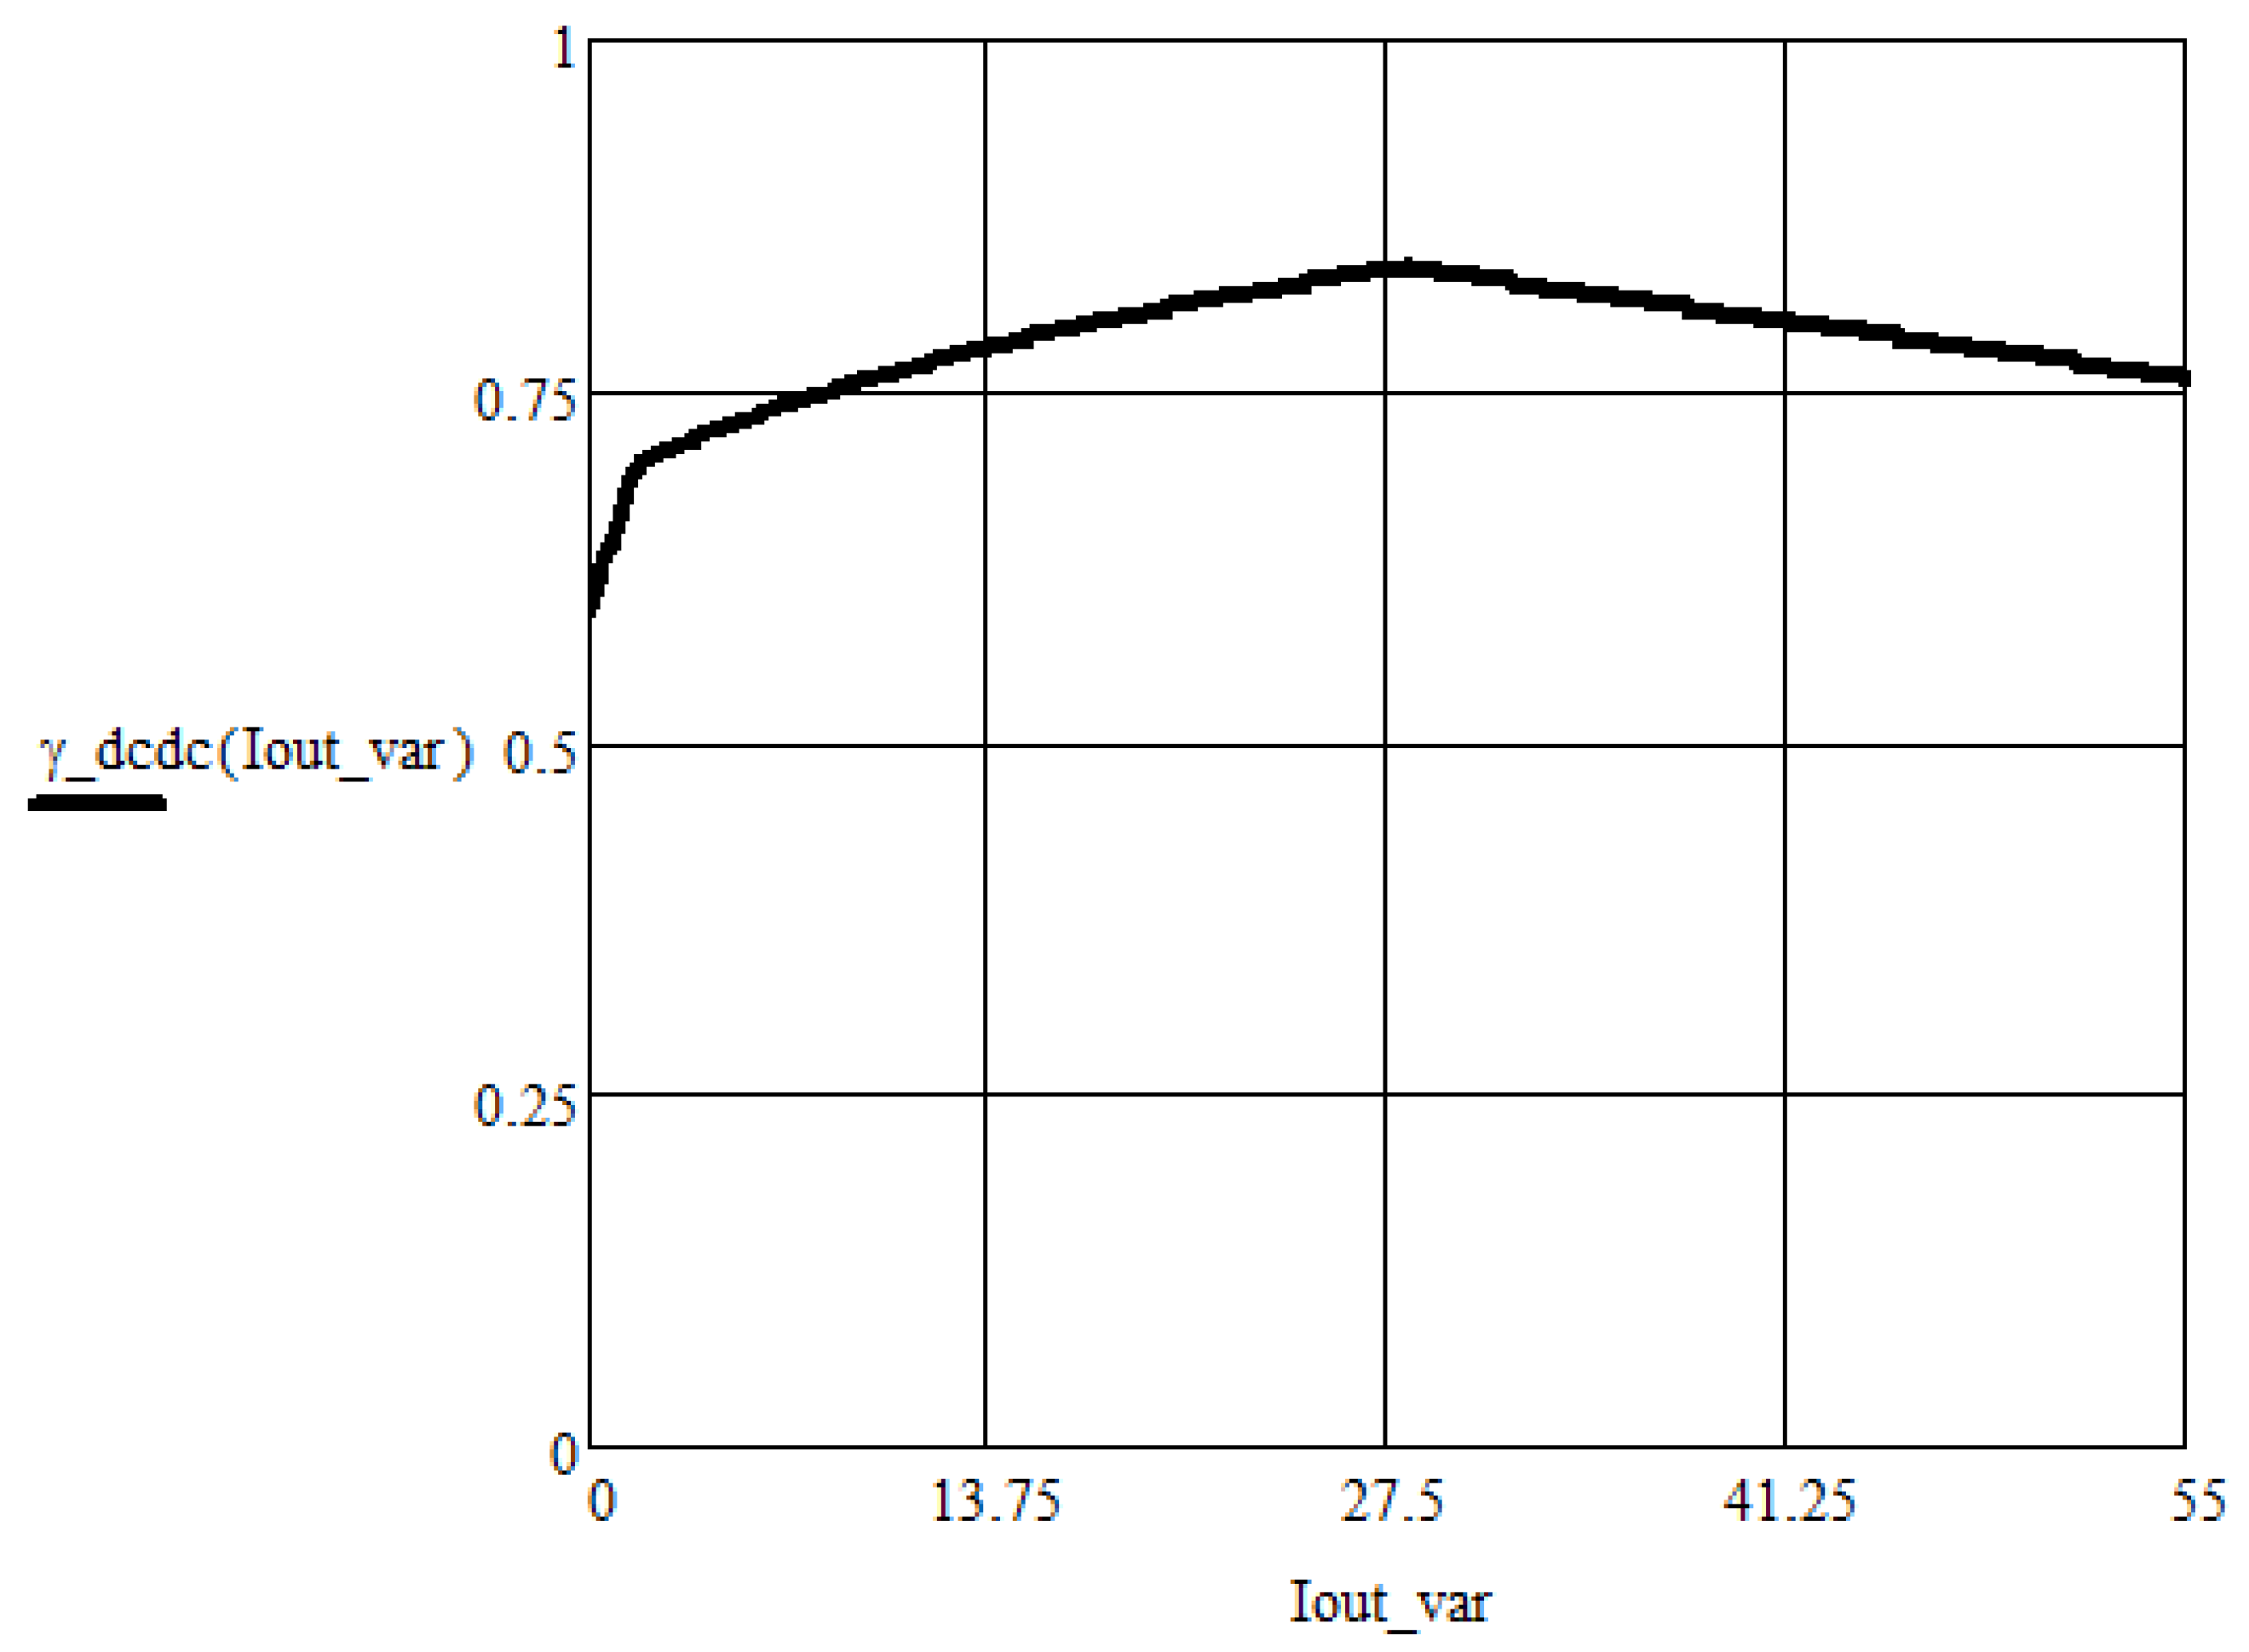
Figure 10,
Figure 11 and
Figure 12 show the dependency graphs of some parameters of the converter on the load current when the power consumption is limited to 1300 W. These graphs are given as an example to demonstrate the capabilities of the proposed calculation method. The most loaded operation modes of elements are determined by the maximum or minimum of the corresponding surfaces or two-dimensional graphical dependencies. According to the graph shown in
Figure 10, it is possible to determine the highest-amplitude current in the choke for all modes of operation, which corresponds to the maximum output current and the minimum battery voltage.
The first kink, at the beginning of the PWM duty cycle, is explained by the transition from discontinuous mode to continuous mode of the choke current. The duty cycle increases as the load current increases until the maximum power consumption is reached, after which it decreases again to stabilize.
As is clear from the calculated formulas and graphs, the value of the maximum power setting should be selected so that the output power of the converter is slightly higher than the load required to supply the load in nominal mode in order to ensure the battery charge after it passes the peak overload (
Supplementary materials).


 ,
, 


