Article

Catalyst Distribution Optimization Scheme for Effective Green Hydrogen Production from Biogas Reforming

Department of Fundamental Research in Energy Engineering, AGH University of Science and Technology, 30-059 Krakow, Poland
*
Author to whom correspondence should be addressed.
Energies 2021, 14(17), 5558; https://doi.org/10.3390/en14175558
Submission received: 31 July 2021 / Revised: 29 August 2021 / Accepted: 1 September 2021 / Published: 6 September 2021
(This article belongs to the Special Issue Fuel Cell-Based and Hybrid Power Generation Systems Modeling)

Abstract

:
Green hydrogen technology has recently gained in popularity due to the current economic and ecological trends that aim to remove the fossil fuels share in the energy mix. Among various alternatives, biogas reforming is an attractive choice for hydrogen production. To meet the authorities’ requirements, reforming biogas-enriched natural gas and sole biogas is tempting. Highly effective process conditions of biogas reforming are yet to be designed. The current state of the art lacks proper optimization of the process conditions. The optimization should aim to allow for maximization of the process effectiveness and limitation of the phenomena having an adverse influence on the process itself. One of the issues that should be addressed in optimization is the uniformity of temperature inside a reactor. Here we show an optimization design study that aims to unify temperature distribution by novel arrangements of catalysts segments in the model biogas reforming reactor. The acquired numerical results confirm the possibility of the enhancement of reaction effectiveness, coming from improving the thermal conditions. The used amount of catalytic material is remarkably reduced as a side effect of the presented optimization. To ensure an unhindered perception of the reaction improvement, the authors proposed a ratio of the hydrogen output and the amount of used catalyst as a measure.

1. Introduction

The hydrogen industry is currently at the beginning of an undeniable peak. The energy industry has started to pursue technology related to the production and consumption of hydrogen, to meet the ecological regulations introduced by the governmental organizations [1]. The trend gains its strength not only due to a pure interest in the fuel cells technology itself but also because of a rapidly growing necessity of energy storage. The demand for energy storage comes from its periodic oversupply from renewable sources [2]. The leading technologies used for production of hydrogen are hydrocarbons reforming and water electrolysis [3,4]. Water electrolysis from renewables would be the first choice, considering the ecological aspect. However, the technology is still under development and requires further research before its use would be economically encouraged [5]. The present state of the art makes the use of the water electrolysis justified only in applications implementing renewable energy sources, in which no other possibility of the surplus energy consumption is available [6]. Therefore, the majority of the hydrogen produced worldwide comes from the reforming of hydrocarbons [7]. The reforming sovereignty was established due to a relatively low cost of hydrogen production and the reaction placing second, considering the lowest environmental impact [8]. Production of hydrogen on the way of the reforming reaction is assured in the nearest future due to a lack of better alternatives. Furthermore, the size of the natural gas establishment induces no possibility of its immediate shutdown [9,10]. Even though the governmental regulations call for a termination of fossil fuel exploitation, it is impossible to achieve instantly. Thus, natural gas production is inevitable in the nearest future. Although, emissions coming from the energy production using natural gas may be heavily limited, if the natural gas would be converted into hydrogen, on the way of the steam reforming reaction. Considering the current economic sentiments, the reform of hydrocarbons remains the most feasible way of hydrogen production. To decrease the conversion process’ environmental impact, a carbon-capture system can be introduced [11,12]. Furthermore, reform of biogas-enriched natural gas may be a reasonable solution for even better addressing of the ecological issue of the process [13], as biogas is qualified as a renewable energy source [14]. However, biogas production may often require additional energy input, limiting its feasibility. An interesting take on the clean biomass transformation is presented by Gonclaves et al. [15]. Processing of sole biogas, and its integration with a carbon capture system would reduce the reforming’s environmental impact to a minimum [16]. Based on the presented literature review, scientific efforts on the development of the reforming process can not yet be forfeited. Despite its almost century-old history, the reforming technology remains flawed. Carbon deposition and degradation of the catalytic material, due to the thermal stress induced by temperature gradients, are the most remarkable issues [17,18]. Proper maintenance of the thermal conditions during the reaction has been already proven to alleviate the catalyst degradation [19]. Moreover, proper moderation of the temperature field inside the reactor has been reported to increase the overall process’ efficiency [20]. Our team has developed an original strategy to address the issue of temperature gradients occurring in the reactor [21]. The presented article proposes an application of the macro-patterning concept. The concept predicts the division of the reactor’s volume into separate segments, and their further filling with alternating catalytic and non-catalytic materials [21]. The main goal of macro-pattering is to allow for the moderation of the thermal conditions inside the reforming reactor. The strategy is combined with an evolutionary optimization to find the most optimal design of the catalytic insert for the reforming of biogas. The application of macro-patterning is predicted to improve the thermal conditions during the process. The conditions improvement would result in enhancement of the reaction thermodynamics, effecting in reduction of the carbon deposition and premature catalyst degradation [19,22]. The model biogas being the subject of this analysis is assumed to consist only of CH 4 and CO 2 . The influence of other biogas components is out of the scope of the presented research [23]. The analysis prepared for the needs of the presented research included:
  • Preparation of the numerical simulation considering reforming of model biogas
  • Application of the macro-patterning concept for the reactor’s geometry
  • Combining the prepared numerical model with a genetic algorithm to find the most optimal catalyst insert design

2. Mathematical Model

2.1. Chemical Reactions

The presented research included formulation of an adequate mathematical model. The analysis of the biogas reforming process can be considered as a quasi three-dimensional, due to the reactor’s geometry and its axial symmetry. Thanks to the axial symmetry, the computational domains may be simplified to two-dimensions, when proper conditions are constituted within the model (Section 3.1) [24]. The geometry implemented into the model of biogas reforming process is presented in Figure 1.
Due to the process character, two main chemical reactions are implemented in the mathematical model [25,26]. According to the previously conducted research, inclusion of the methane-steam reforming (MSR) (Equation (1)), dry reforming (DRY) (Equation (2) and water–gas-shift reaction (WGS) (Equation (3)) is sufficient for acquiring relevant results [27,28]. The reactions are described using the following equations:
CH 4 + H 2 O 3 H 2 + CO , Δ H MSR = 206.1 kJ mol ,
CH 4 + CO 2 2 H 2 + 2 CO , Δ H DRY = 247 kJ mol ,
CO + H 2 O H 2 + CO 2 , Δ H WGS = 41.15 kJ mol .
The enthalpy change Δ H are taken from literature [21,29]. To allow the inclusion of the reactions into the model, knowledge of their rates is essential. According to the research conducted by Brus et al. [30], the effective rate of MSR and DRY reactions can be expressed with a common equation:
R eff = w ˙ cat A MSR exp E a R ¯ T p CH 4 α p H 2 O + p CO 2 β .
The individual reaction rates for the MSR and DRY reactions can be distinguished as follows:
R MSR = R eff p H 2 O p CO 2 + p H 2 O ,
R DRY = R eff p CO 2 p CO 2 + p H 2 O .
The WGS reaction has a more unpredictable nature. Thus, preparation of a formula, returning proper values regardless of the process conditions, is not plausible. However, according to Ahmed and Föger, the WGS reaction can be assumed to maintain equilibrium under specific conditions [31]. The correctness of the described approach is confirmed by other research [32,33,34]. The boundary conditions applied in the presented research, described in Section 3.1, are designed to satisfy the equilibrium assumption. Therefore, the WGS rate is calculated using the following procedure:
K WGS = k WGS + k WGS = p CO 2 p H 2 p CO p H 2 O = exp Δ G WGS 0 R ¯ T .
Combining of the Equations (4) and (7) allows for formulation of the WGS reaction rate equation, as follows:
R WGS = k WGS + p CO p H 2 O + k WGS p H 2 p CO 2 .
The values of partial pressures, included in the Equations (4)–(8), are derived from an analysis of the reactions’ stoichometry [30].

2.2. Heat and Mass Transfer

The prepared mathematical model has the fundamental transport equations incorporated. Considering the defined computational domain, the equations are formulated for a two-dimensional case. Therefore, the model’s equations are calculated for the longitudinal and radial directions only. The fluids taking part in the reaction are considered Newtonian and incompressible. Thus, the continuity equation (Equation (9)) takes the following form [35]:
ρ 0 U x x + 1 r r ρ 0 U r r = 0 .
The materials serving as the catalytic insert are porous. Therefore, the terms of the momentum conservation equation have to contain parameters depending on the structure morphology [36]. A separate equation for each dimension is formulated (Equations (10) and (11)):
ρ 0 ε 0 2 U x U x x + U r U x r = P x + μ ε 0 2 U x x 2 + 1 r r r U x r μ K p U x ρ 0 c ine K p U x U x 2 + U r 2 ,
ρ 0 ε 0 2 U x U r x + U r U r r = P r + μ ε 0 2 U r x 2 + 1 r r r U r r U r r 2 μ K p U r ρ 0 c ine K p U r U x 2 + U r 2 ,
The use of metallic foams implies a necessity of application of a relevant model, allowing us to calculate the effective thermal conductivity coefficient of the material λ eff [37,38]. Knowledge of a proper λ eff value is vital for the calculation of the energy conservation equation (Equation (12)) [36]. An adequate model is prepared, described in detail within our previous article [39].
ρ 0 C p U x T loc x + U r T loc r = x λ eff T loc x + 1 r r r λ eff T loc r + Q s ,
where the heat sources/sinks Q s depend on enthalpy changes Δ H and rates of the MSR, DRY and WGS [25,30], and are defined using following equations:
Q MSR = Δ H MSR R MSR ,
Q DRY = Δ H DRY R DRY ,
Q WGS = Δ H WGS R WGS .
The species conservation is calculated using molar fractions of species taking part in the reaction (Equation (16)). The formulated equation was derived from the Fick’s law of diffusion [40]:
ρ 0 U x Y j x + U r Y j r = x ρ 0 D j , eff Y j x + 1 r r r ρ 0 D j , eff Y j r + S j .
The mass sources and sinks S j depend on the MSR, DRY and WGS rates and molar masses of the species taking part in the reaction [41,42]. The exact equations defining the values of S j are described in the Table 1.

3. Numerical Model

Proceeding with computations of the prepared mathematical model, requires its implementation within a relevant numerical procedure. To allow doing so, a discretization of the computational domain is necessary. The governing equations are applied into the numerical model using the Finite Volume Method [24,43]. The generalized transport equation, representing the partial differential Equations (9)–(12) and (16), takes the following form [24,44]:
Ψ x ϕ x + Ψ r ϕ r = x Γ ϕ x + 1 r r r Γ ϕ r + S ¯ .
The source terms S ¯ in Equation (17) are gathered in the Table 2. The values presented in the Table 2 are relevant for segments filled with the catalytic material. When a non-catalytic segment is considered, the source terms values are set to 0. The chemical reactions are assumed to be suppressed, just after the gases mixture enters the non-catalytic region of the reformer [21]. To acquire the discrete transport equation (Equation (18)), integration of the Equation (17) is conducted. After the application of simple, mathematical transformations, the discrete transport equation is expressed as follows:
Ψ x ϕ e Ψ x ϕ w r m Δ r + r Ψ r ϕ n r Ψ r ϕ s Δ x = Γ e ϕ E ϕ P δ x Γ w ϕ P ϕ W δ x r m Δ r + r Γ n ϕ N ϕ P δ r r Γ s ϕ P ϕ S δ r Δ x + S ¯ r m Δ r Δ x ,
a P ϕ P = a E ϕ E + a W ϕ W + a N ϕ N + a S ϕ S + b ,
a P = a E + a W + a N + a S ,
b = S ¯ r m Δ r Δ x .
The coefficients a j represent the fluxes crossing the faces of the control volumes. The fluxes are calculated using the Power Law scheme [24]. The subscripts N, E, S, W correspond to the compass directions, and represent the faces above, right, below and left to the currently analyzed node.
The SIMPLE algorithm is implemented into the numerical model, for calculation of the pressure corrections. The use of the SIMPLE algorithm is necessary to calculate fluid velocity in the specific regions of the reactor [24,45]. The systems of equations created during the discretization processes are further applied to the numerical procedure, and solved using the Gauss-Seidl iterative method [46].

3.1. Boundary Conditions

The presented numerical procedure is considered a quasi three-dimensional case. Thanks to the axial symmetry of the reactor, the computational domain is reduced to two dimensions [47]. The symmetry boundary conditions are applied at the axis of the reactor, simultaneously allowing for an acceleration of the computations. Afterward, thirty separate segments are designated. The segments divide the reactor into separate zones in the longitudinal direction. Each of the segments has th exact same dimensions and is predicted to be filled with a catalytic nickel/yttria-stabilized-zirconia (Ni/YSZ) composite or with a stainless steel metallic foam serving as a non-catalytic segment. The presence of the metallic foam segments serves to reheat the gases mixture before entering the subsequent catalytic segment. Therefore, the gases are carrying more energy, allowing for an intensification of the reforming process inside the proceeding catalytic region of the reactor. The prepared numerical procedure requires the definition of x adequate values of the thermal conductivity coefficients λ for the two materials. Considering the process temperature taking values between 800 and 900 K, the λ value for the Ni/YSZ is set at 22 W m 1 K 1 [48] and for the metallic foam at 30 W m 1 K 1 [49]. The reactors length L is equal to 0.3 m and the inlet velocity u in is set at 0.15 m s 1 . The reactor’s wall is assumed to be made of stainless steel and to have a thickness of 2 × 10 3 m. The non-slip and Neumann boundary condition, with the heat flux equal to 0, are set at the reactor’s wall. The feedstock entering the reactor is considered to acquire the reactor’s temperature immediately. The properties of specimens being the subject of the analysis are taken from the literature [50]. The numerical grid’s dimensions are set at 150 elements in the longitudinal direction, and 25 elements in the radial direction. A sensitivity analysis of the grid resolution and model’s falsification procedures are described in detail in our previous work [21]. All of the described boundary conditions are summarized in Figure 2.

4. Optimization Procedure

The optimization conducted in the presented analysis predicts the finding of the most optimal alignment of the catalytic and non-catalytic materials. The pursued optimal alignment has to lead to a unified distribution of temperature field without any significant losses in the produced hydrogen yield. The defined optimization problem is an arduous task due to the amount of possible segments configurations. Each segment can be distinguished as a catalytic or non-catalytic. Moreover, every single segment may vary in the values of porosity ε and average pore size d p . The large variety of possible solutions induces the presence of numerous local extrema. Due to the problem characteristics, the genetic algorithm (GA) is chosen as the optimization technique. The genetic algorithm is a mature optimization concept, with a stochastic nature [51]. The GA is reported to return satisfying results for optimizations regarding adversely conditioned search spaces [52,53,54]. The genetic algorithm is successfully applied in researches considering the optimization of the steam reforming reaction [39,55,56]. Due to the algorithm having its roots in the process of natural selection, vocabulary originating from genetics is introduced to the nomenclature. A single solution is referred to as a specimen. Each specimen consists of segments, going by the name of chromosomes. A single segment has an individual set of parameters, called genes. In the case of the presented research, genes represent if a single segment has catalytic properties and its values of ε and d p . A single iteration of the genetic algorithm includes the calculation of the reforming simulation for a set of specimens. The set is referred to as a population [57]. A numerical procedure is prepared for the needs of the presented research. The procedure starts with the preparation of the initial population. The chromosomes for the first set of solutions are initialized randomly. The algorithm is coupled with an in-house solver of the reforming process [39]. After randomization of the initial parameters, their values are loaded into instances of the reforming simulation. Afterward, the computation is commenced and proceeds until the convergence criteria for each specimen are met. The numerical procedure is assumed to converge after differences in values of the heat sources, acquired for two subsequent iterations, are lower than 10 5 . The sufficiency of the given threshold is proven in our previous research [21,39]. After converging each specimen, evaluation of the results is performed, based on user-defined fitness functions [51]. The higher the overall fitness f of a specific reactor, the higher are its chances to pass its chromosomes to the proceeding population. Each subsequent population is prepared using the crossover procedure. First, a set of parent specimens is chosen, basing on the roulette rule [39,51]. Afterward, the algorithm randomly selects a pair of reactors from the parents’ set and translates their chromosomes’ values into a single binary string. Then, the strings are split at the randomly selected crossover point, and their corresponding parts are interchanged. The operation results in the creation of a pair of specimens, inheriting the chromosomes from two different parents. The crossover procedure is repeated until a population of the same size is created. After each crossover, a mutation procedure is performed [58]. The procedure predicts flipping of a single bit in the binary string, occurring with a probability specified by the user. The mutation is introduced to prevent the GA from finding a local extremum instead of the global one. Another benefit of the mutation is the possibility of introducing new genes, which acquiring would be impossible in the way of the sole crossover. After having the new population defined, the GA calls the reforming simulation over the created specimens and its procedure is repeated. The presented analysis predicted thirty subsequent iterations of the genetic algorithm. Each population is constrained to include thirty specimens. The number of reactors in a single generation was reduced to be only thirty, due to an enormous computation cost of the numerical simulation of the reforming process [39]. The goal of the presented optimization procedure is to define catalyst distribution, allowing for unification of the temperature field with simultaneous maintenance of the methane conversion, at levels similar to the conventional reforming reactors. To define the robustness of the acquired optimization results, two different fitness functions are defined. The first function analyzes the amount of methane converted during the process. The amount of methane processed during the reaction is calculated basing on the methane (CH 4 ) fraction at the inlet and the outlet of the reformer, according to the following formula:
f CH 4 = f r a c CH 4 in f r a c CH 4 out f r a c CH 4 in ,
where f r a c CH 4 in and f r a c CH 4 out stand for the methane fraction at the inlet and the outlet of the reactor, respectively. The second function considers minimization of the temperature gradients occurring inside the reformer. The algorithm analyzes the local temperature differences for each of the created control volumes (Section 3). The procedure iterates over each of the nodes and computes values of the temperature T differences between the analyzed node P and its neighbors: N, E, S, W. When all the differences are calculated, the highest difference is set as Δ T loc i , j of an analyzed control volume, where i and j represent the column and row number of the numerical grid (Equation (23)).
Δ T loc i , j = max | T P i , j T N i , j | , | T P i , j T E i , j | , | T P i , j T S i , j | , | T P i , j T W i , j | .
After having calculated Δ T loc i , j values for each of the control volumes, the highest found is set as the temperature difference representing the whole reactor Δ T , according to the following formula:
Δ T = max T loc 1 , 1 , T loc 1 , 2 , , T loc i , j .
The overall temperature fitness f T is calculated using the following equation:
f T = 1 Δ T Δ T max ,
where Δ T max represents the maximal temperature difference, occurring in the reactor with continuous and homogeneous catalyst. The Δ T max for the needs of the presented research is set at 25 K. After having computed the f CH 4 and f T values, the overall fitness f is calculated using Equation (26)
f = ω 1 · f CH 4 + ω 2 · f T ,
where ω 1 and ω 2 represent the weights. The weights values are 0.6 for ω 1 and 0.4 for ω 2 . The summarized procedure of the genetic algorithm is presented as a block schema in Figure 3.

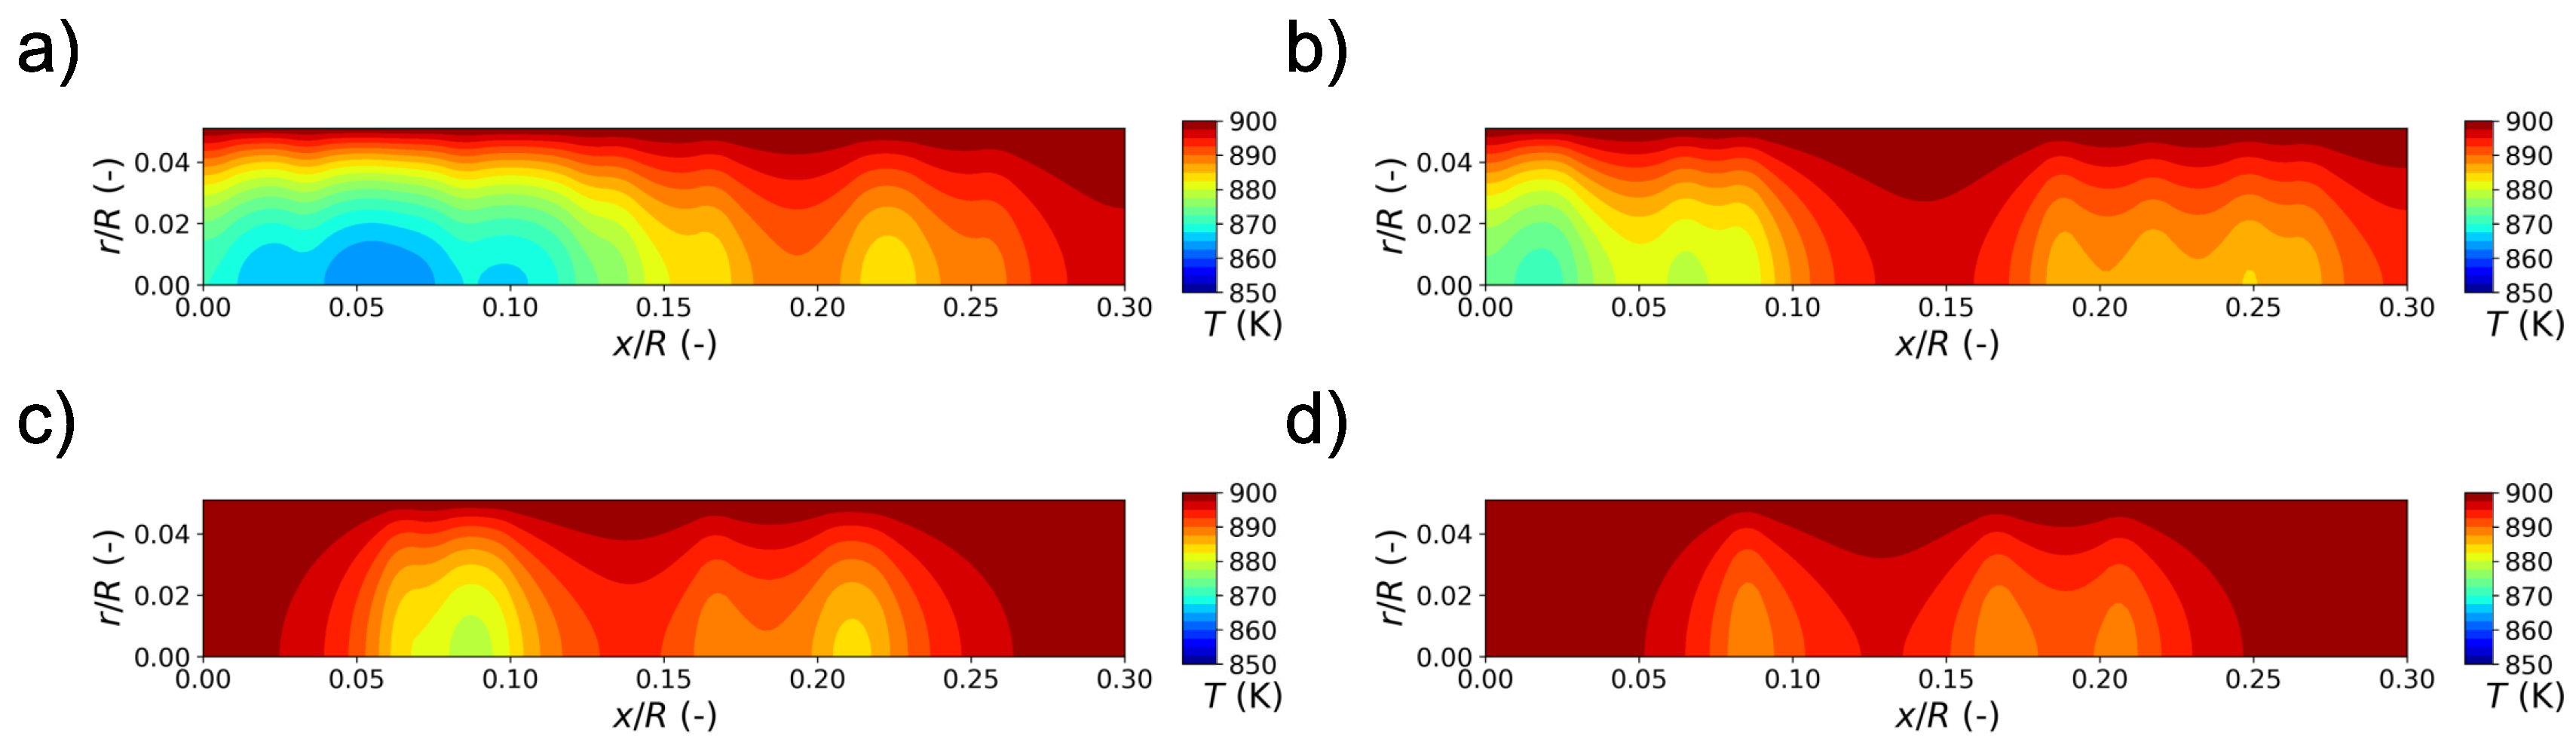
5. Numerical Results

The presented analysis included computation of the genetic algorithm procedure, for three different compositions of the inlet gas. The compositions are described in detail in Table 3. The different ratios of chemical specimens are defined in the numerical code by setting corresponding values of steam-to-carbon (SC) and carbon-to-carbon (CC) ratios [23]. The reference cases (Figure 4a–c) are reactors with homogenous and continuous catalytic material. The porosity of the catalytic material is set at 50% for each of the reference cases. The temperature field for the cases has a noticeable decrease in the temperature values at the inlet of the reactor (Figure 4a–c). The decrease occurs due to the reaction’s activation. The temperature distribution becomes more uniform, closing to the end of the reactor. The unification is induced by the reaction progress. As there is less methane for conversion left, the reaction decreases in its intensity, consuming lower amounts of energy locally. The main goal of the carried optimization, is to unify the temperature field in the whole reactor, simultaneously preventing significant reduction of the methane conversion rate. The comparison of the temperature fields for subsequent generations in presented in Figure 5, Figure 6 and Figure 7. To provide insight into the whole GA progress, the temperature fields of example reactors for different biogas compositions, from the initial generation are presented in Figure 5a1, Figure 6b1 and Figure 7c1. A single reactor is chosen for each composition. The optimization process is carried out for thirty subsequent generations. Temperature fields for the most optimal solutions acquired for the 30th, 30th and 30th generations are presented in Figure 5a2–a4 (composition (1)), Figure 6b2–b4 (composition (2)) and Figure 7c2–c4 (composition (3)). The information on fitness values is presented in Table 4. According to the data presented in Figure 5, Figure 6 and Figure 7 and in Table 4, the algorithm manages to enhance the thermodynamic conditions inside the reformer. A visible improvement is reported for each of the inlet gas compositions. Detailed analysis of Table 4 gives information that methane conversion is decreased for each biogas compositions, when comparing with the reference cases. The methane conversion’s decrease is directly caused by the reduction of the amount of the catalyst used for the most optimal solutions found (Table 5). The exact values of chemical specimens conversion are presented in Table 6. Considering the scale of the catalyst use limitation, forces to analyze the results from a different perspective. The use of the catalyst is reduced by circa 90% for each case, while the methane conversion fell only by circa 40%. A green hydrogen productivity ζ is introduced for a better insight on the increase of the effectiveness of the biogas reforming. The ζ parameter is an exact ratio of the hydrogen output and amount of the used catalyst ι for a specific reactor (Equation (27)).
ζ = H 2 output ι
The observed phenomenon clearly indicates improvement of the overall process effectiveness (green hydrogen productivity). Simultaneously confirming observations reported by Ricca et al. and Settar et al. [59,60]. Therefore, the presented results prove the macro-patterning concept, to be a valid strategy for an optimization of the biogas steam reforming. The acquired results indicate the necessity of defining of the minimal catalyst amount in the algorithm to prevent the limitation of the catalyst use of the reported magnitude. The methane conversion could be maintained by changing of the reactor dimensions [21]. However, an additional optimization procedure for defining the optimal radius and length of the reactor would be necessary.

6. Conslusions

The presented paper focuses on the optimization of the temperature distribution inside a biogas reforming reactor. The research pursues optimal distribution of the catalytic material to ensure enhancement of the reaction effectiveness. The optimization procedure succeeds in modification the reactors’ design for the creation of a more unified thermal field. The reported results indicate a decrease in the hydrogen yield. However, the amount of the catalytic material used for the most optimal cases was reduced by: 83% for composition (1), 90% for composition (2) and 94% for composition (3). Considering the ratio of the hydrogen yield and the reduction of the used catalyst amount, the research confirms the improvement of the thermodynamic conditions inside the reactor, to be a valid strategy for increasing the biogas reforming effectiveness. The capabilities of the presented optimization strategy are most visible in the case of the composition (3). The optimization carried out for the composition (3) not only leads to an improvement in the thermal conditions but also manages to maintain conversion rate at a similar level as for the initial population. Following the presented results, the optimization procedure requires improvement before future calculations. For acquiring results of a higher quality, a sensitivity analysis of the evaluation procedure has to be conducted. The reaction effectiveness is ranked by evaluation of the biogas conversion rate. Hydrogen output at the end of the process should be considered instead of the methane fraction. The influence of magnitudes of the ω 1 and ω 2 values has to be investigated. Currently, the calculation of a thirty-generation algorithm run takes about 500 h. Therefore, the robustness of the numerical procedure has to be improved before the conduction of the sensitivity analysis. During the optimization, the overall amount of the catalyst used in the reactors is reduced significantly. A constrain defining a minimal amount of the catalyst used should be added to the algorithm’s procedure to allow the unification of the temperature distribution, preventing losses in the amount of hydrogen produced.

Author Contributions

Conceptualization, M.P., G.B., J.S.S.; methodology, M.P., G.B., J.S.S.; software, M.P., G.B.; validation, M.P., G.B., J.S.S.; formal analysis, M.P., G.B., J.S.S.; numerical investigation M.P.; resources, G.B.; data curation, M.P.; writing—original draft preparation, M.P.; writing—review and editing, M.P., G.B., J.S.S.; visualization M.P.; supervision, G.B., J.S.S.; project administration, J.S.S.; funding acquisition, J.S.S. All authors have read and agreed to the published version of the manuscript.

Funding

The authors acknowledge the support of the Initiative for Excellence—Research University Project at AGH University of Science and Technology and AGH Grant No. 16.16.210.476.

Institutional Review Board Statement

Not applicable.

Informed Consent Statement

Not applicable.

Data Availability Statement

All data available on request.

Acknowledgments

The presented research was conducted using the computational power provided by PLGrid.

Conflicts of Interest

The authors declare no conflict of interest.The funders had no role in the design of the study; in the collection, analyses, or interpretation of data; in the writing of the manuscript, or in the decision to publish the results.

References

  1. Sazali, N. Emerging technologies by hydrogen: A review. Int. J. Hydrog. Energy 2020, 45, 18753–18771. [Google Scholar] [CrossRef]
  2. Widera, B. Renewable hydrogen implementations for combined energy storage, transportation and stationary applications. Therm. Sci. Eng. Prog. 2020, 16, 100460. [Google Scholar] [CrossRef]
  3. Ayodele, F.O.; Mohammad, N.; Mustapa, S.I.; Ayodele, B.V. An overview of economic analysis and environmental impacts of natural gas conversion technologies. Sustainability 2020, 12, 148. [Google Scholar] [CrossRef]
  4. Schmidt, O.; Gambhir, A.; Staffell, I.; Hawkes, A.; Nelson, J.; Few, S. Future cost and performance of water electrolysis: An expert elicitation study. Int. J. Hydrog. Energy 2017, 42, 30470–30492. [Google Scholar] [CrossRef]
  5. Mutlu, R.N.; Kucukkara, I.; Gizir, A.M. Hydrogen generation by electrolysis under subcritical water condition and the effect of aluminium anode. Int. J. Hydrog. Energy 2020, 45, 12641–12652. [Google Scholar] [CrossRef]
  6. Brauns, J.; Turek, T. Alkaline water electrolysis powered by renewable energy: A review. Processes 2020, 8, 248. [Google Scholar] [CrossRef] [Green Version]
  7. Baykara, S.Z. Hydrogen: A brief overview on its sources, production and environmental impact. Int. J. Hydrog. Energy 2018, 43, 10605–10614. [Google Scholar] [CrossRef]
  8. Kannah, R.Y.; Kavitha, S.; Karthikeyan, O.P.; Kumar, G.; Dai-Viet, N.V.; Banu, J.R. Techno-economic assessment of various hydrogen production methods—A review. Bioresour. Technol. 2021, 319, 124175. [Google Scholar] [CrossRef]
  9. Pegram, J.; Falcone, G.; Kolios, A. A review of job role localization in the oil and gas industry. Energies 2018, 11, 2779. [Google Scholar] [CrossRef]
  10. Tao, S.; Chen, S.; Pan, Z. Current status, challenges, and policy suggestions for coalbed methane industry development in China: A review. Energy Sci. Eng. 2019, 7, 1059–1074. [Google Scholar] [CrossRef] [Green Version]
  11. Sharma, I.; Friedrich, D.; Golden, T.; Brandani, S. Exploring the opportunities for carbon capture in modular, small-scale steam methane reforming: An energetic perspective. Int. J. Hydrog. Energy 2019, 44, 14732–14743. [Google Scholar] [CrossRef]
  12. Lee, H.; Jung, I.; Roh, G.; Na, Y.; Kang, H. Comparative analysis of on-board methane and methanol reforming systems combined with HT-PEM fuel cell and CO2 capture/liquefaction system for hydrogen fueled ship application. Energies 2020, 13, 224. [Google Scholar] [CrossRef] [Green Version]
  13. Alves, H.J.; Bley Junior, C.; Niklevicz, R.R.; Frigo, E.P.; Frigo, M.S.; Coimbra-Araújo, C.H. Overview of hydrogen production technologies from biogas and the applications in fuel cells. Int. J. Hydrog. Energy 2013, 38, 5215–5225. [Google Scholar] [CrossRef]
  14. Gregorie, E.F.J.; Lamb, J.J.; Lien, K.M.; Pollet, B.G.; Burheim, O.S. Hydrogen and Biogas. In Micro-Optics and Energy: Sensors for Energy Devices; Lamb, J.J., Pollet, B.G., Eds.; Springer International Publishing: Cham, Switzerland, 2020; pp. 131–155. [Google Scholar] [CrossRef]
  15. Gonçalves, A.; Puna, J.F.; Guerra, L.; Campos Rodrigues, J.; Gomes, J.F.; Santos, M.T.; Alves, D. Towards the Development of Syngas/Biomethane Electrolytic Production, Using Liquefied Biomass and Heterogeneous Catalyst. Energies 2019, 12, 3787. [Google Scholar] [CrossRef] [Green Version]
  16. Zhao, X.; Joseph, B.; Kuhn, J.; Ozcan, S. Biogas Reforming to Syngas: A Review. iScience 2020, 23, 101082. [Google Scholar] [CrossRef]
  17. Meloni, E.; Martino, M.; Palma, V. A Short Review on Ni Based Catalysts and Related Engineering Issues for Methane Steam Reforming. Catalysts 2020, 10, 352. [Google Scholar] [CrossRef] [Green Version]
  18. Buchireddy, P.R.; Peck, D.; Zappi, M.; Bricka, R.M. Catalytic hot gas cleanup of biomass gasification producer gas via steam reforming using nickel-supported clay minerals. Energies 2021, 14, 1875. [Google Scholar] [CrossRef]
  19. Mozdzierz, M.; Brus, G.; Sciazko, A.; Komatsu, Y.; Kimijima, S.; Szmyd, J.S. Towards a Thermal Optimization of a Methane/Steam Reforming Reactor. Flow Turbul. Combust. 2016, 97, 171–189. [Google Scholar] [CrossRef] [Green Version]
  20. Palma, V.; Ricca, A.; Martino, M.; Meloni, E. Innovative structured catalytic systems for methane steam reforming intensification. Chem. Eng. Process. Process Intensif. 2017, 120, 207–215. [Google Scholar] [CrossRef]
  21. Pajak, M.; Mozdzierz, M.; Chalusiak, M.; Kimijima, S.; Szmyd, J.S.; Brus, G. A numerical analysis of heat and mass transfer processes in a macro-patterned methane/steam reforming reactor. Int. J. Hydrog. Energy 2018, 43, 20474–20487. [Google Scholar] [CrossRef]
  22. Tomiczek, M.; Kaczmarczyk, R.; Mozdzierz, M.; Brus, G. A numerical analysis of heat and mass transfer during the steam reforming process of ethane. Heat Mass Transf. 2018, 54, 2305–2314. [Google Scholar] [CrossRef]
  23. Nishino, T.; Szmyd, J.S. Numerical analysis of a cell-based indirect internal reforming tubular SOFC operating with biogas. J. Fuel Cell Sci. Technol. 2010, 7, 0510041–0510048. [Google Scholar] [CrossRef]
  24. Patankar, S.V. Numerical Heat Transfer and Fluid Flow; Hemisphere: Washington, DC, USA, 1980. [Google Scholar]
  25. Xu, J.; Froment, G.F. Methane steam reforming: II. Diffusional limitations and reactor simulation. AIChE J. 1989, 35, 97–103. [Google Scholar] [CrossRef]
  26. Komatsu, Y.; Kimijima, S.; Szmyd, J.S. A Performance Analysis of a Solid Oxide Fuel Cell—Micro Gas Turbine Hybrid System Using Biogas. ECS Trans. 2009, 25, 1061–1070. [Google Scholar] [CrossRef]
  27. Sciazko, A.; Komatsu, Y.; Brus, G.; Kimijima, S.; Szmyd, J.S. A novel approach to improve the mathematical modelling of the internal reforming process for solid oxide fuel cells using the orthogonal least squares method. Int. J. Hydrog. Energy 2014, 39, 16372–16389. [Google Scholar] [CrossRef]
  28. Brus, G.; Nowak, R.; Szmyd, J.S.; Komatsu, Y.; Kimijima, S. An Experimental and Theoretical Approach for the Carbon Deposition Problem during Steam Reforming of Model Biogas. J. Theor. Appl. Mech. 2015, 53, 273–284. [Google Scholar] [CrossRef]
  29. Mazhar, A.; Khoja, A.H.; Azad, A.K.; Mushtaq, F.; Naqvi, S.R.; Shakir, S.; Hassan, M.; Liaquat, R.; Anwar, M. Performance Analysis of TiO2-Modified Co/MgAl2O4 Catalyst for Dry Reforming of Methane in a Fixed Bed Reactor for Syngas (H2, CO) Production. Energies 2021, 14, 3347. [Google Scholar] [CrossRef]
  30. Brus, G.; Komatsu, Y.; Kimijima, S.; Szmyd, J.S. An analysis of biogas reforming process on Ni/YSZ and Ni/SDC catalysts. Int. J. Thermodyn. 2012, 15, 43–51. [Google Scholar] [CrossRef]
  31. Ahmed, K.; Föger, K. Approach to equilibrium of the water-gas shift reaction on a Ni/zirconia anode under solid oxide fuel-cell conditions. J. Power Sources 2001, 103, 150–153. [Google Scholar] [CrossRef]
  32. Sciazko, A.; Komatsu, Y.; Brus, G.; Kimijima, S.; Szmyd, J.S. A novel approach to the experimental study on methane/steam reforming kinetics using the Orthogonal Least Squares method. J. Power Sources 2014, 262, 245–254. [Google Scholar] [CrossRef]
  33. Iwai, H.; Yamamoto, Y.; Saito, M.; Yoshida, H. Numerical simulation of intermediate-temperature direct-internal-reforming planar solid oxide fuel cell. Energy 2011, 36, 2225–2234. [Google Scholar] [CrossRef]
  34. Brus, G.; Kimijima, S.; Szmyd, J.S. Experimental and numerical analysis of transport phenomena in an internal indirect fuel reforming type Solid Oxide Fuel Cells using Ni/SDC as a catalyst. J. Phys. Conf. Ser. 2012, 395. [Google Scholar] [CrossRef]
  35. Fanchi, J.R. Reservoir Simulation. In Integrated Reservoir Asset Management; Fanchi, J.R., Ed.; Gulf Professional Publishing: Boston, MA, USA, 2010; pp. 223–241. [Google Scholar]
  36. Carbonell, R.G.; Whitaker, S. Heat and Mass Transfer in Porous Media. In Fundamentals of Transport Phenomena in Porous Media; Bear, J., Corapcioglu, M.Y., Eds.; Springer: Dordrecht, The Netherlands, 1984; pp. 121–198. [Google Scholar] [CrossRef]
  37. Bhattacharya, A.; Calmidi, V.V.; Mahajan, R.L. Thermophysical properties of high porosity metal foams. Int. J. Heat Mass Transf. 2002, 45, 1017–1031. [Google Scholar] [CrossRef]
  38. Dai, Z.; Nawaz, K.; Park, Y.G.; Bock, J.; Jacobi, A.M. Correcting and extending the Boomsma-Poulikakos effective thermal conductivity model for three-dimensional, fluid-saturated metal foams. Int. Commun. Heat Mass Transf. 2010, 37, 575–580. [Google Scholar] [CrossRef]
  39. Pajak, M.; Buchaniec, S.; Kimijima, S.; Szmyd, J.S.; Brus, G. A multiobjective optimization of a catalyst distribution in a methane/steam reforming reactor using a genetic algorithm. Int. J. Hydrog. Energy 2021, 46, 20183–20197. [Google Scholar] [CrossRef]
  40. Mozdzierz, M.; Chalusiak, M.; Kimijima, S.; Szmyd, J.S.; Brus, G. An afterburner-powered methane/steam reformer for a solid oxide fuel cells application. Heat Mass Transf. 2018, 54, 2331–2341. [Google Scholar] [CrossRef] [Green Version]
  41. Tan, W.C.; Iwai, H.; Kishimoto, M.; Brus, G.; Szmyd, J.S.; Yoshida, H. Numerical analysis on effect of aspect ratio of planar solid oxide fuel cell fueled with decomposed ammonia. J. Power Sources 2018, 384, 367–378. [Google Scholar] [CrossRef]
  42. Mozdzierz, M.; Brus, G.; Sciazko, A.; Komatsu, Y.; Kimijima, S.; Szmyd, J.S. An attempt to minimize the temperature gradient along a plug-flow methane/steam reforming reactor by adopting locally controlled heating zones. J. Phys. Conf. Ser. 2014, 530. [Google Scholar] [CrossRef]
  43. Ferziger, J.H.; Peric, M. Computational Methods for Fluid Dynamics; Springer: New York, NY, USA, 2002. [Google Scholar] [CrossRef] [Green Version]
  44. Chalusiak, M.; Wrobel, M.; Mozdzierz, M.; Berent, K.; Szmyd, J.S.; Brus, G. A numerical analysis of unsteady transport phenomena in a Direct Internal Reforming Solid Oxide Fuel Cell. Int. J. Heat Mass Transf. 2019, 131. [Google Scholar] [CrossRef]
  45. Wang, H.; Wang, H.; Gao, F.; Zhou, P.; Zhai, Z.J. Literature review on pressure–velocity decoupling algorithms applied to built-environment CFD simulation. Build. Environ. 2018, 143, 671–678. [Google Scholar] [CrossRef]
  46. MacCormack, R.W.; Candler, G.V. The solution of the Navier-Stokes equations using Gauss-Seidel line relaxation. Comput. Fluids 1989, 17, 135–150. [Google Scholar] [CrossRef]
  47. Mozdzierz, M.; Brus, G.; Kimijima, S.; Szmyd, J.S. Numerical analysis of helium-heated methane/steam reformer. J. Phys. Conf. Ser. 2016, 745, 032081. [Google Scholar] [CrossRef] [Green Version]
  48. Powell, R.; Tye, R.; Hickman, M. The thermal conductivity of nickel. Int. J. Heat Mass Transf. 1965, 8, 679–688. [Google Scholar] [CrossRef]
  49. Zhao, C.Y.; Lu, T.J.; Hodson, H.P.; Jackson, J.D. The temperature dependence of effective thermal conductivity of open-celled steel alloy foams. Mater. Sci. Eng. A 2004, 367, 123–131. [Google Scholar] [CrossRef]
  50. Todd, B.; Young, J.B. Thermodynamic and transport properties of gases for use in solid oxide fuel cell modelling. J. Power Sources 2002, 110, 186–200. [Google Scholar] [CrossRef]
  51. Golberg, D.E. Genetic Algorithms in Search Optimization & Machine Learning; Addison-Wesley Longman Publishing Co., Inc.: Boston, MA, USA, 1989. [Google Scholar] [CrossRef]
  52. Zhang, G.; Yu, L.; Shao, Q.; Feng, Y. A Clustering Based GA for Multimodal Optimization in Uneven Search Space. In Proceedings of the 2006 6th World Congress on Intelligent Control and Automation, Dalian, China, 21–23 June 2006; Volume 1, pp. 3134–3138. [Google Scholar]
  53. Das, S.; Maity, S.; Qu, B.Y.; Suganthan, P. Real-parameter evolutionary multimodal optimization—A survey of the state-of-the-art. Swarm Evol. Comput. 2011, 1, 71–88. [Google Scholar] [CrossRef]
  54. Zou, P.; Rajora, M.; Liang, S.Y. Multimodal Optimization of Permutation Flow-Shop Scheduling Problems Using a Clustering-Genetic-Algorithm-Based Approach. Appl. Sci. 2021, 11, 3388. [Google Scholar] [CrossRef]
  55. Rajesh, J.K.; Gupta, S.K.; Rangaiah, G.P.; Ray, A.K. Multiobjective optimization of steam reformer performance using genetic algorithm. Ind. Eng. Chem. Res. 2000, 39, 706–717. [Google Scholar] [CrossRef]
  56. Azarhoosh, M.J.; Ebrahim, H.A.; Pourtarah, S.H. Simulating and Optimizing Auto-Thermal Reforming of Methane to Synthesis Gas Using a Non-Dominated Sorting Genetic Algorithm II Method. Chem. Eng. Commun. 2016, 203, 53–63. [Google Scholar] [CrossRef]
  57. Ye, G.Z.; Kang, D.K. Extended Evolutionary Algorithms with Stagnation-Based Extinction Protocol. Appl. Sci. 2021, 11, 3461. [Google Scholar] [CrossRef]
  58. De Falco, I.; Della Cioppa, A.; Tarantino, E. Mutation-based genetic algorithm: Performance evaluation. Appl. Soft Comput. 2002, 1, 285–299. [Google Scholar] [CrossRef]
  59. Ricca, A.; Palma, V.; Martino, M.; Meloni, E. Innovative catalyst design for methane steam reforming intensification. Fuel 2017, 198, 175–182. [Google Scholar] [CrossRef]
  60. Settar, A.; Abboudi, S.; Lebaal, N. Effect of inert metal foam matrices on hydrogen production intensification of methane steam reforming process in wall-coated reformer. Int. J. Hydrog. Energy 2018, 43, 12386–12397. [Google Scholar] [CrossRef]
Figure 1. Domain defined for a biogas reforming reactor.
Energies 14 05558 g001
Figure 2. The boundary conditions applied in the analysis of biogas reformer.
Energies 14 05558 g002
Figure 3. The block schema of the genetic algorithm procedure.
Energies 14 05558 g003
Figure 4. The temperature distribution for different biogas compositions (uniform catalyst distribution—reference case): (a) composition (1), (b) composition (2), (c) composition (3).
Energies 14 05558 g004
Figure 5. The temperature distribution for biogas composition (1): (a) initial, composition (1), (b) 10th gen., (c) 20th gen., (d) 30th gen.
Energies 14 05558 g005
Figure 6. The temperature distribution for biogas composition (2): (a) initial, (b) 10th gen., (c) 20th gen., (d) 30th gen.
Energies 14 05558 g006
Figure 7. The temperature distribution for biogas composition (3): (a) initial, (b) 10th gen., (c) 20th gen., (d) (3) 30th gen.
Energies 14 05558 g007
Table 1. Mass generation.
SpeciesMass Generation MSRMass Generation WGSMass Generation DRYSummarized Generation
H 2 3 R MSR M H 2 R WGS M H 2 2 R DRY M H 2 3 R MSR M H 2 + R WGS M H 2 + 2 R DRY M H 2
CO R MSR M CO R WGS M CO 2 R DRY M CO R MSR M CO R WGS M CO + 2 R DRY M CO
CO 2 0 R WGS M CO 2 R DRY M CO 2 R WGS M CO 2 2 R DRY M H 2
CH 4 R MSR M CH 4 0 R DRY M H 2 R MSR M CH 4 R DRY M H 2
H 2 O R MSR M H 2 O R WGS M H 2 O 0 R MSR M H 2 O R WGS M H 2 O
Table 2. Source terms in Equation (17).
Equation S ¯
(10) P x μ K p U x ρ 0 c ine K p U x U x 2 + U r 2
(11) P r μ K p U r ρ 0 c ine K p U r U x 2 + U r 2 μ U r ε r 2
(12) Q s
(16) S j
Table 3. Variants of the inlet gas compositions.
No.CH 4 CO 2 H 2 OSCCC
(1)23%30%46%2.01.3
(2)20%40%40%2.02.0
(3)18%50%32%2.02.9
Table 4. Fitness values and conversion acquired for the most optimal specimens in the subsequent generations and for the reference cases.
Gen.Composition (1)Composition (2)Composition (3)
f T f CH 4 f f T f CH 4 f f T f CH 4 f
REF0.060.840.530.070.860.540.100.880.56
INIT0.010.660.400.010.720.430.020.620.38
10th0.170.570.410.040.610.380.290.520.42
20th0.330.550.460.430.610.540.440.490.47
30th0.610.430.510.670.500.570.640.520.58
Table 5. The amount of catalyst used in comparison with the reference cases.
Gen.Composition (1)Composition (2)Composition (3)
ι ζ ι ζ ι ζ
REF100%0.40100%0.38100%0.29
30th17%0.9410%1.86%2.17
ζ —green hydrogen productivity (-); ι —amount of the catalyst used.
Table 6. Conversion of methane and carbon dioxide.
Gen.Composition (1)Composition (2)Composition (3)
CH 4 CO 2 CH 4 CO 2 CH 4 CO 2
REF84%19%86%21%88%23%
30th43%2%50%4%52%8%
ζ —green hydrogen productivity (-); ι —amount of the catalyst used.
Publisher’s Note: MDPI stays neutral with regard to jurisdictional claims in published maps and institutional affiliations.

