1. Introduction
One of the most important characteristics of a power connection is its reliability—the reliability of generation, distribution and transmission of energy to its end users. The reliability of the medium voltage network is an important element in ensuring a failure-free power supply to consumers. For this purpose, an increasing number of devices are installed, which helps to analyze the state of the power network elements on an ongoing basis [
1]. Due to a large amount of data, an appropriate processing and storage process should be ensured [
2,
3]. The medium voltage (MV) power grid is an intermediary between high-voltage and low-voltage grids with phase-to-phase voltage in the range from 1 to 60 kV. The most commonly used voltages in Poland are 15 kV (representing about 60% of the entire MV network) and 20 kV (due to the international unification of the network in Europe). The MV grid consists of overhead and cable power lines and electrical substations. The environment in which the investment is implemented determines the choice of the method of energy supply. Power cable lines are preferred in urban areas, and by contrast, overhead power lines are a solution used in rural and suburban areas. In the case of medium-voltage power networks, reliability analysis focuses primarily on cable lines, which are an important part of this type of network. The failure of any element of its structure may not only have a negative impact in the form of a power outage but may also pose a threat to the surrounding environment and cause serious financial losses to distributors.
There are several types of failure in cable lines [
4,
5]:
- 1.
An incorrect connection of the cable shield and damage to the cable sheath (approx. 25%);
- 2.
Earth fault (up to 5%);
- 3.
Phase-to-phase short circuit (approx. 70%).
A power grid failure can be defined as a short- or long-term disruption of the system operation, resulting in the power loss of its consumers. Depending on the degree of damage to the components, the process of restoring the power connection to the working condition can take from seconds to several days, causing serious economic losses to energy companies. Short circuits are the main cause of faults in cable lines, where the most dangerous type is a single-phase fault with the neutral point earthed by a resistor. The most common type of failure occurring on overhead power lines is the output voltages caused mainly by external factors such as changes in the weather.
To effectively manage the MV grid infrastructure, it is not enough to analyze data and perform emergency measurements. It is necessary to perform diagnostic measurements during the operation of power grids [
6]. In the case of medium-voltage cable lines, it is mainly [
7,
8]:
- 1.
The measurement of partial discharges;
- 2.
The measurement of the dielectric loss factor.
Performing diagnostic and emergency measurements, as well as proper data analysis, also has an impact on the quality of power supply to recipients [
9,
10,
11].
There are many methods presented in the literature to locate and identify the type of failure [
12,
13,
14,
15,
16]. At the same time, each of the presented methods has some limitations and disadvantages due to the large number of parameters that affect the measurement [
17,
18,
19,
20].
Obtaining information on the condition of the power grid elements enables network operators to further plan renovation and modernization works [
21,
22,
23]. Moreover, it allows the planning of the further effective expansion of the power grid [
24,
25]. Since diagnostic or even emergency measurements may prevent further degradation of the cable, they should be performed immediately after the occurrence of appropriate circumstances [
26]. This makes it possible to eliminate the proliferation of failure effects and transform an ordinary failure into a catastrophic failure [
9,
10,
11,
12].
Despite significant advances in modern technology for assessing the condition of power grids, the reliability of MV power connections is a global problem due to frequent failures. A better knowledge and understanding of data from previous years can play a major role in predicting the future behavior of the power grid and can reduce the intensity of its failure. It is of great importance to develop a broader knowledge about the reliability of MV power connections because only then can the electrical network achieve the best parameters and optimize the negative impact on the environment. For this purpose, this article uses the data provided by the grid operator regarding the failure frequency of power grids over the last few years, which would enable the use of the obtained results to assess failure rates for other networks located on the continent. Therefore, this article, in the second section, presents the method of assessing the reliability of the power grid of a selected grid operator. The third section presents the results of the power grid reliability indicators, the comparison of actual data with the theoretical models used in terms of failure rate assessment and the simulation results of a selected power grid element. The fourth section discusses the possibilities of using the obtained results in further research. The fifth section presents a summary and conclusions for this article.
2. Materials and Methods
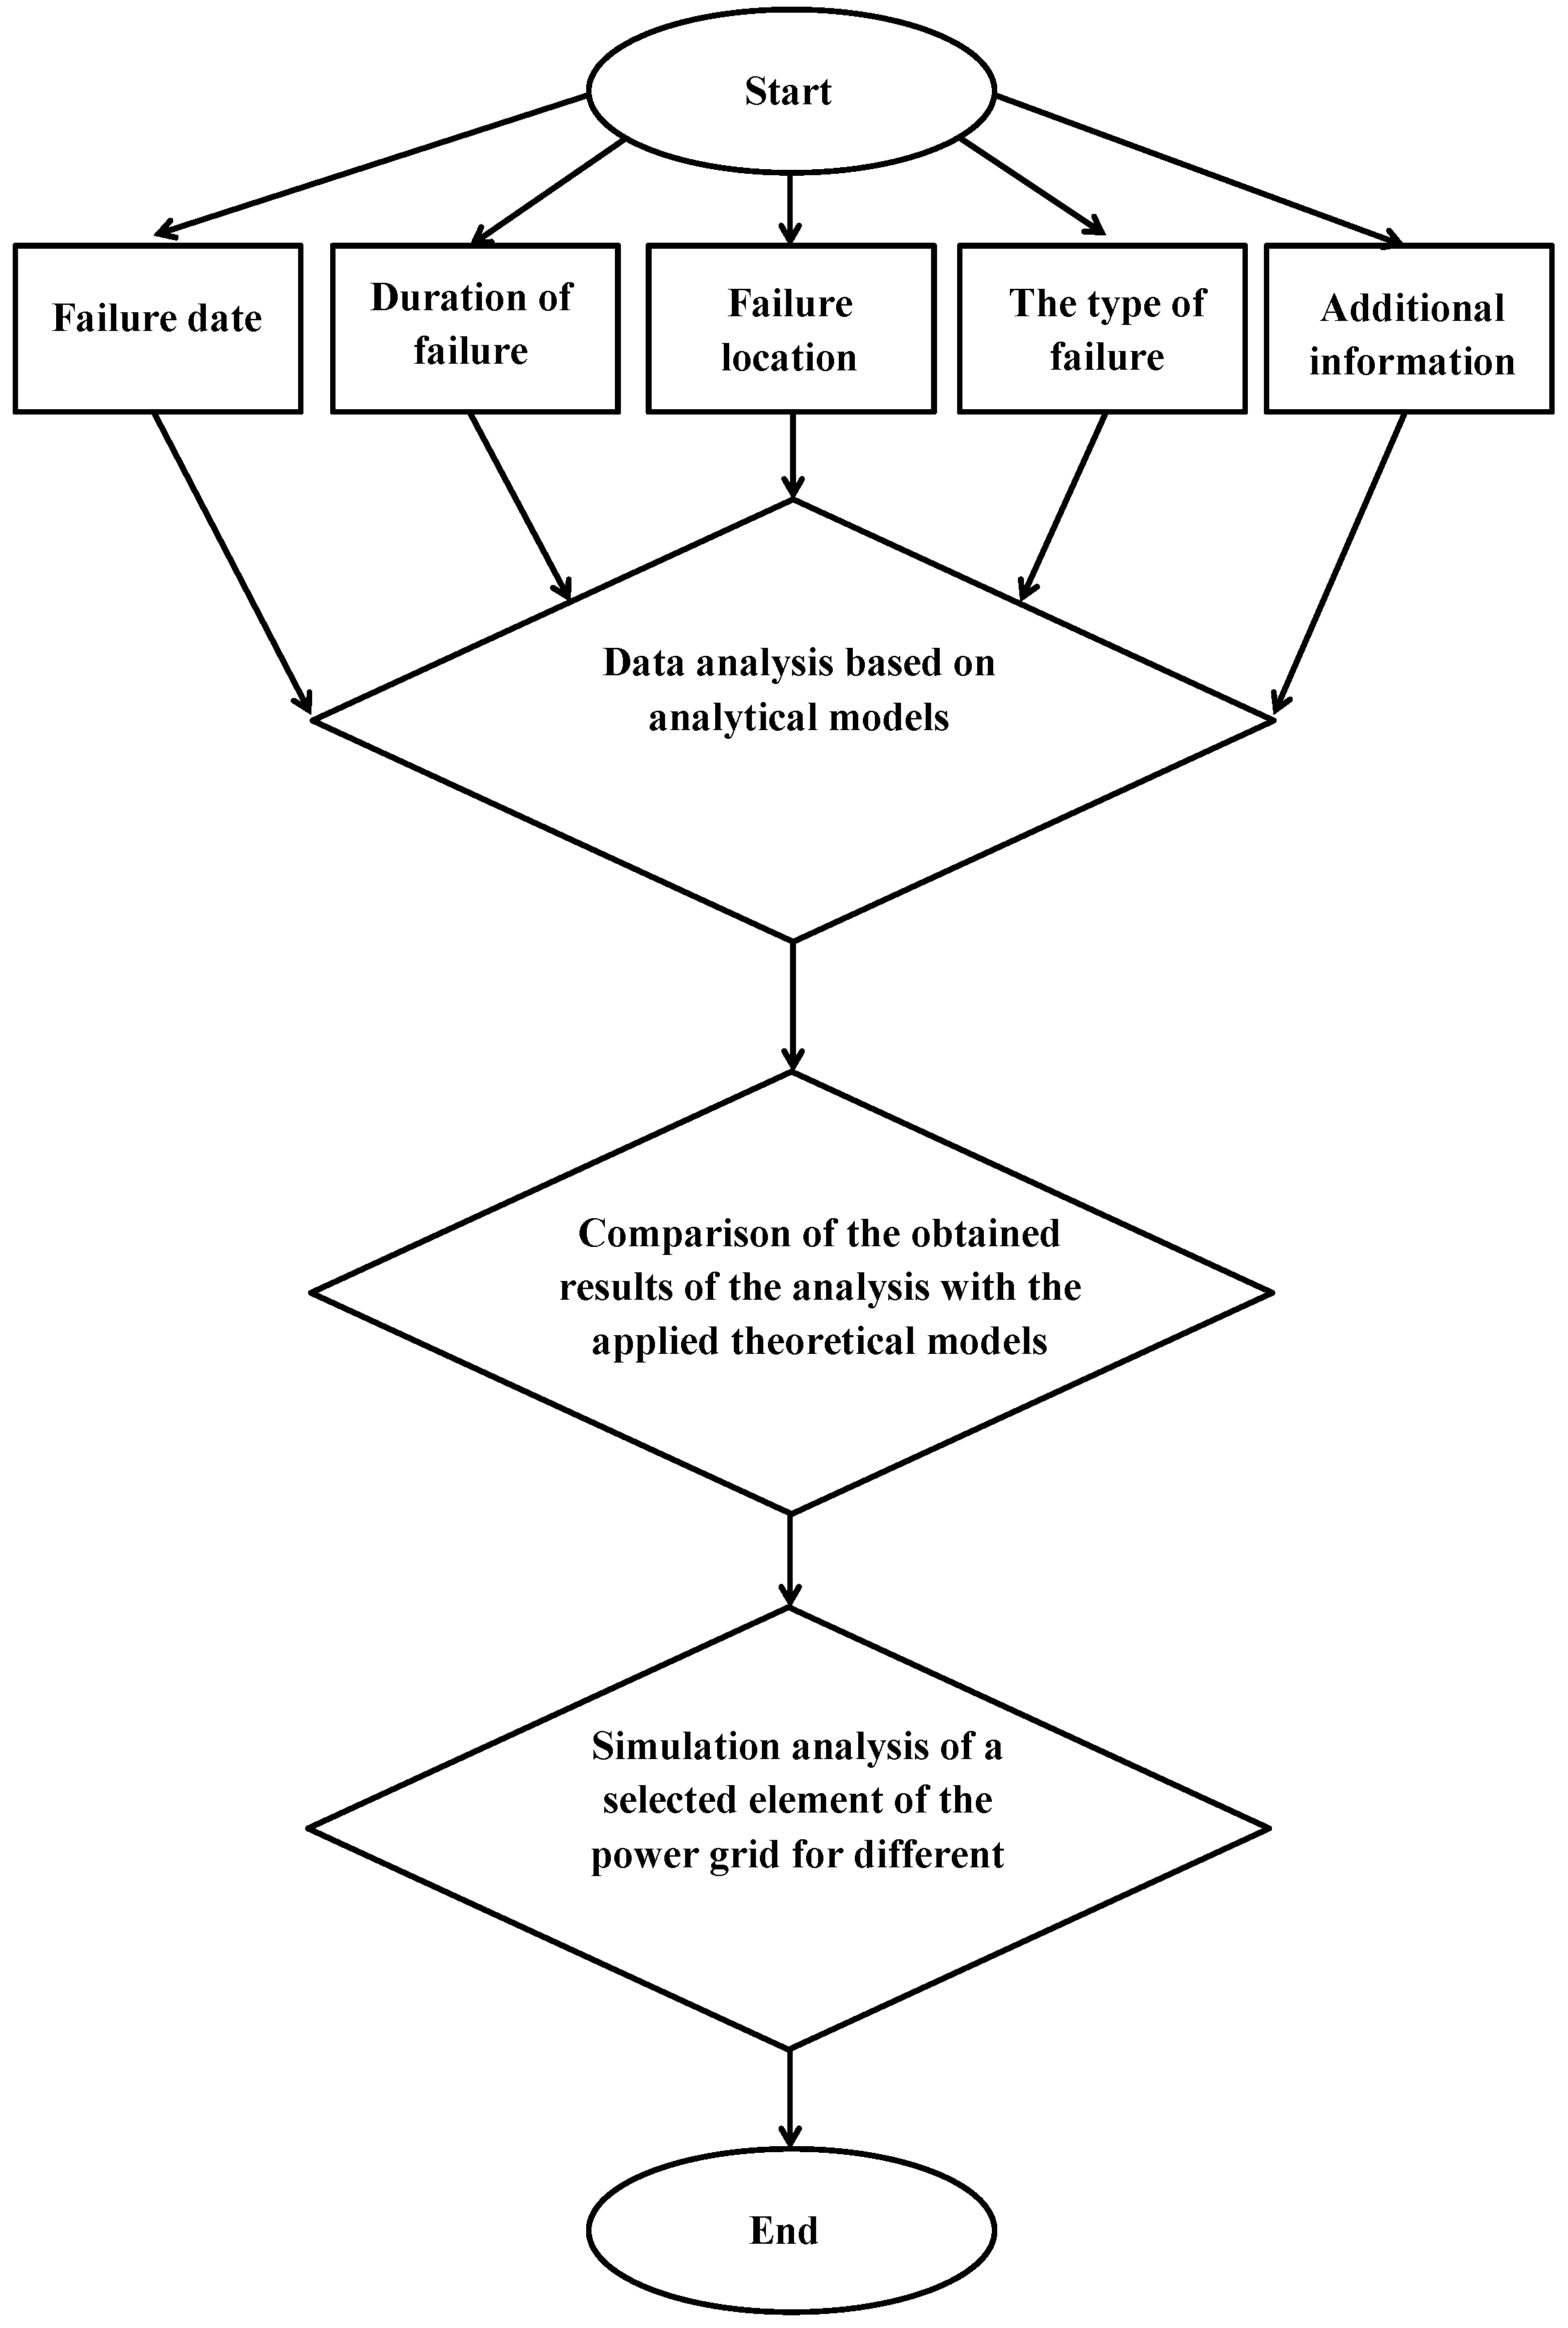
The analyses, both basic as well as those performed with the use of mathematical models, were based on the data provided by the selected grid operator and distributor of electricity. The presented calculations and charts were made using the programs Excel and MATLAB. The simulation of the connector head was executed with the usage of the ANSYS program. To illustrate the course of the research, a diagram showing the stages of the analysis is shown in the
Figure 1.
2.1. Basic Analysis of Data Regarding the MV Power Connection Failure
To perform a basic analysis of existing failures, we began by examining the gathered data and classifying the types of breaks based on their duration. As a result, we have five different time frames shown below:
Transient (microbreaks)—lasting less than 1 s;
Short—lasting between 1 s and 3 min;
Long—lasting between 3 min and 12 h;
Very long—lasting between 12 and 24 h;
Catastrophic—lasting more than 24 h.
This type of breakdown allowed us to create percentage charts and calculate the energy quality indicators required by the minister of economy regulations based on the following formulas [
27]:
—System Average interruption Duration Index—a duration indicator of average long breaks (
1).
where
is the sum of the restoration time times the number of customers affected and
is total number of customers served.
—Momentary Average Interruption Frequency Index—a frequency indicator of average short breaks (
2).
where
is the sum of the breaker operations times the number of customers affected and
is total number of customers served.
—System Average Interruption Frequency Index—a frequency indicator of average long breaks (
3).
where
is the total number of customers interrupted and
is the total number of customers served.
2.2. Mathematical Models of MV Reliability Analysis
Mathematical models enable a deeper analysis which could also result in the ability to predict the grid’s behavior in the upcoming years. The analysis is carried out using functions, formulas, approximations and the calculation of reliability indicators. The results of mathematical models are often unknown, especially with simplified assumptions during the performed calculations due to the poor degree of their study.
Examples of existing reliability models that can be used to analyze power connection reliability:
Analysis of the seasonality and causes of failure;
The influence of ambient temperature on the intensity of failures;
Failure duration analysis;
Duration of emergency shutdowns analysis;
Power outage duration analysis;
Analysis of the amount of electricity not delivered to the consumers.
In this analysis, two theoretical models were used which were further investigated by making the necessary calculations to test their effectiveness.
2.2.1. The Influence of Ambient Temperature on the Intensity of Failures
As we all know, not only do external factors affecting cable and overhead power lines change according to weather seasons, but the same thing applies to the demand for electricity. The increase in electricity demand has an impact on the network causing overloads which can result in power failures. The data presented in Table 2 refer to breakdowns happening in their specified months from the years 2016 to 2020, without the segregation of planned and unplanned failures. The seasonal variability of failure frequency is described by the following approximation function
(
4) [
28]:
where:
i—the next number of the month;
—the coefficients of the approximation function concerning the seasonal variability of the failure frequency presented in
Figure 2.
2.2.2. Failure Duration Analysis
The duration of the number of breakdowns is determined by the time from its occurrence to the moment at which power is restored and supplied to the consumers. Depending on the severity of the failure, this time is longer. The duration of failures was defined by the formulas below (
5)–(
7) [
29]:
where:
—sample mean value;
—the middle of the i-th class of distribution series;
—the number of failures in the i-th class of the distribution series;
n—the total number of failures;
K—the number of classes of distribution series.
Confidence interval for the mean:
where:
—the value of a random U variable with a standardized normal distribution, determined for a given confidence coefficient 1-a from the normal distribution table;
s—the standard deviation of the sample calculated according to the formula:
For a more precise analysis of power connections, we can also determine the following coefficients [
30]. The average intensity of damage and renewal (
8):
where:
—the number of failures observed;
l—the middle of the i-th class of distribution series;
—observation time [years].
The relationship from which the failure coefficient can be determined (
9):
Average intensity renewal (
10):
The probability density function of the log-normal distribution was determined by the following formulas (
11)–(
14):
where:
m—expected value of a random variable;
—standard deviation of a random variable.
where:
—the probability of a failure within a given time interval;
—the average value of failure duration in a given interval;
z—the total number of failures.
2.3. Simulating the Failure Rate of a Selected MV Grid Element
To explain in detail the processes that take place in the event of a failure, a simulation analysis of the most expensive element of the cable line—the cable head—was performed. For this purpose, its numerical model was developed. Therefore, the subject of this section was to investigate the temperature flow and the possibility of damage as a result of a connector head in an emergency state. The created model was tested at the rated current of 630 A (in normal and maximum ambient temperature) and in an emergency state (single-phase short circuit) for the value of 2 kA.
For this purpose, Equations (
15) and (
16) were used [
31]. As part of this analysis, the following assumptions were made. Heat is transferred from the tested element by conduction when the tested cable head is in the ground:
where
is the ambient temperature,
T—temperature on the surface of the cable,
K—thermal conductivity,
h—heat-transfer coefficient and
Q—heat source. The boundary condition determines the temperature
through the equation:
The actual dimensions of the cable head were assumed for the analysis in accordance with the manufacturer’s data sheet.
Creating the Model
Due to the privacy policies of the companies constructing electrical power equipment, the created model of the connecter head may not fully reflect the real product in terms of dimensions and materials. Some elements might have been omitted due to the inaccuracy of the information found in the literature or the complexity of their application. Soot, a commonly used filter, is one such element. The created model was based on catalog data regarding CTS 630A 24 kV 95–240 EGA, which are available on the manufacturer’s website.
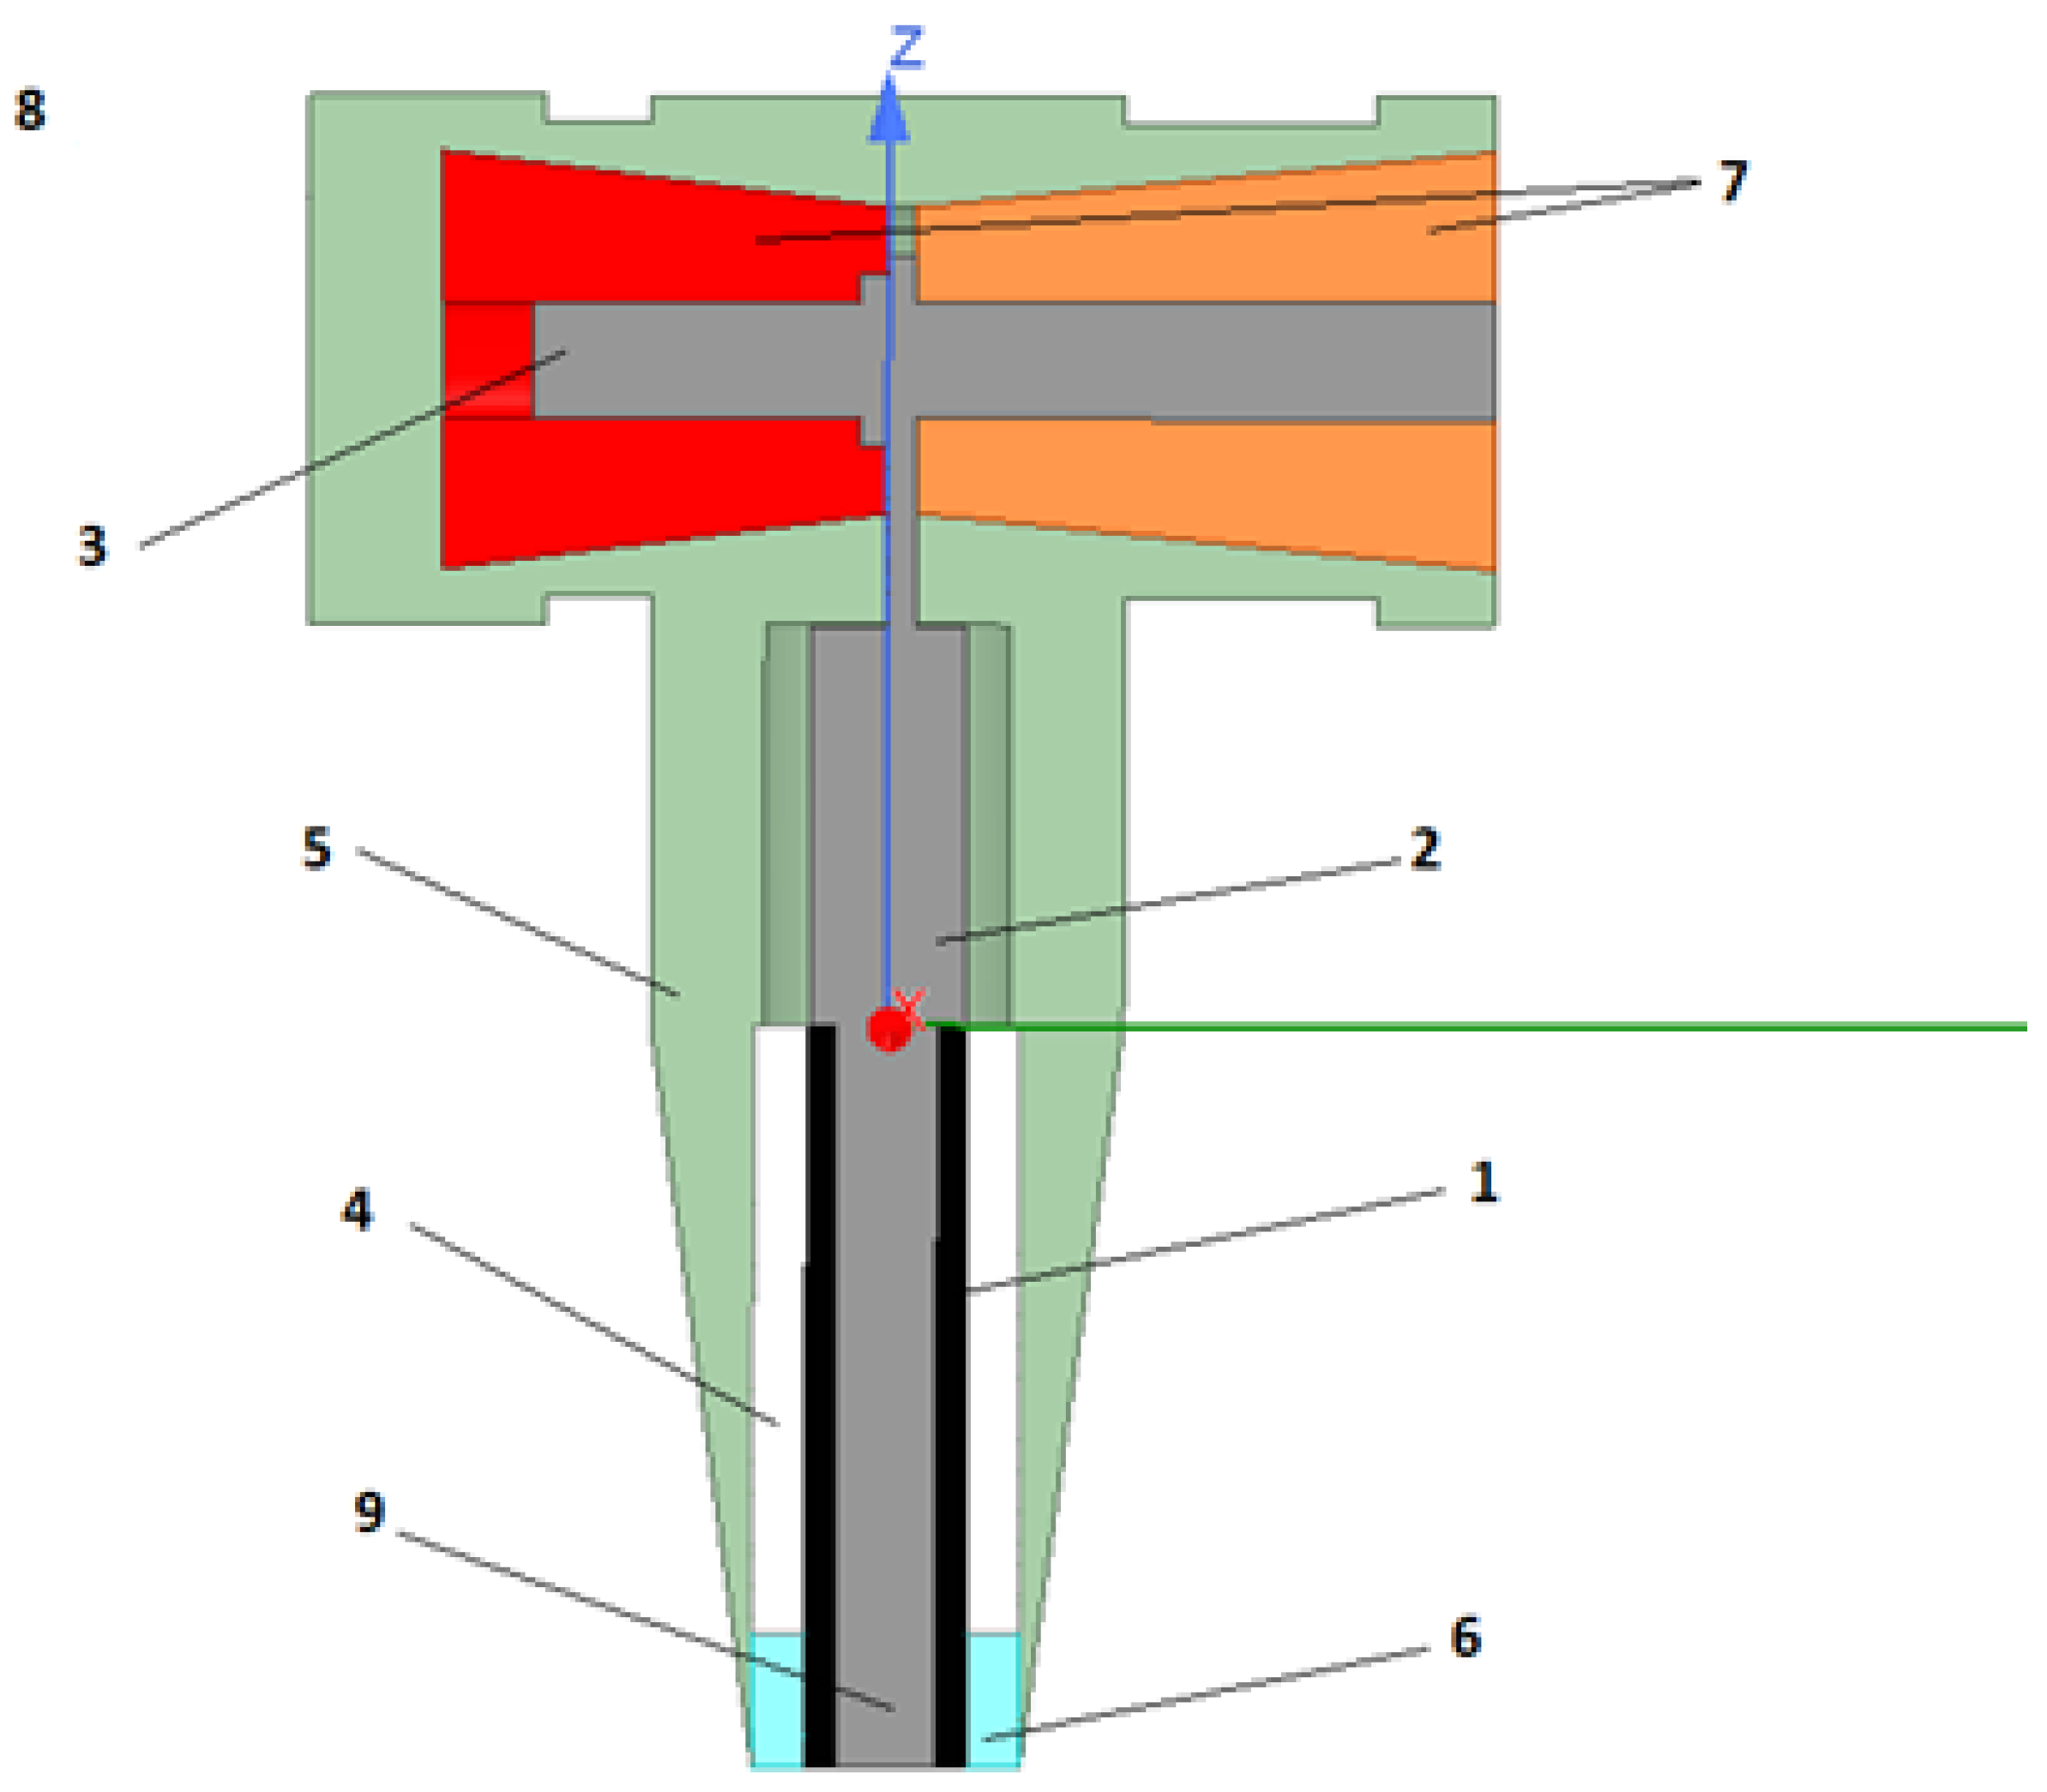
The model shown in
Figure 2 consists of conductive parts made of aluminum such as the cable’s working core (9), a cable lug (2) and the fastening screw (3). Polyethylene parts that have a protective role include the conductor sheath (1) and an additional layer of tape (6). The main structure of our connector head (5) should be made from HTV silicone, but in this case, just like the element controlling the distribution of the electric field (4), it was made out of regular silicone. Insulating plugs with a capacitive voltage divider (7) were made of EPDM (hard rubber). The last element (8) in our case was air.
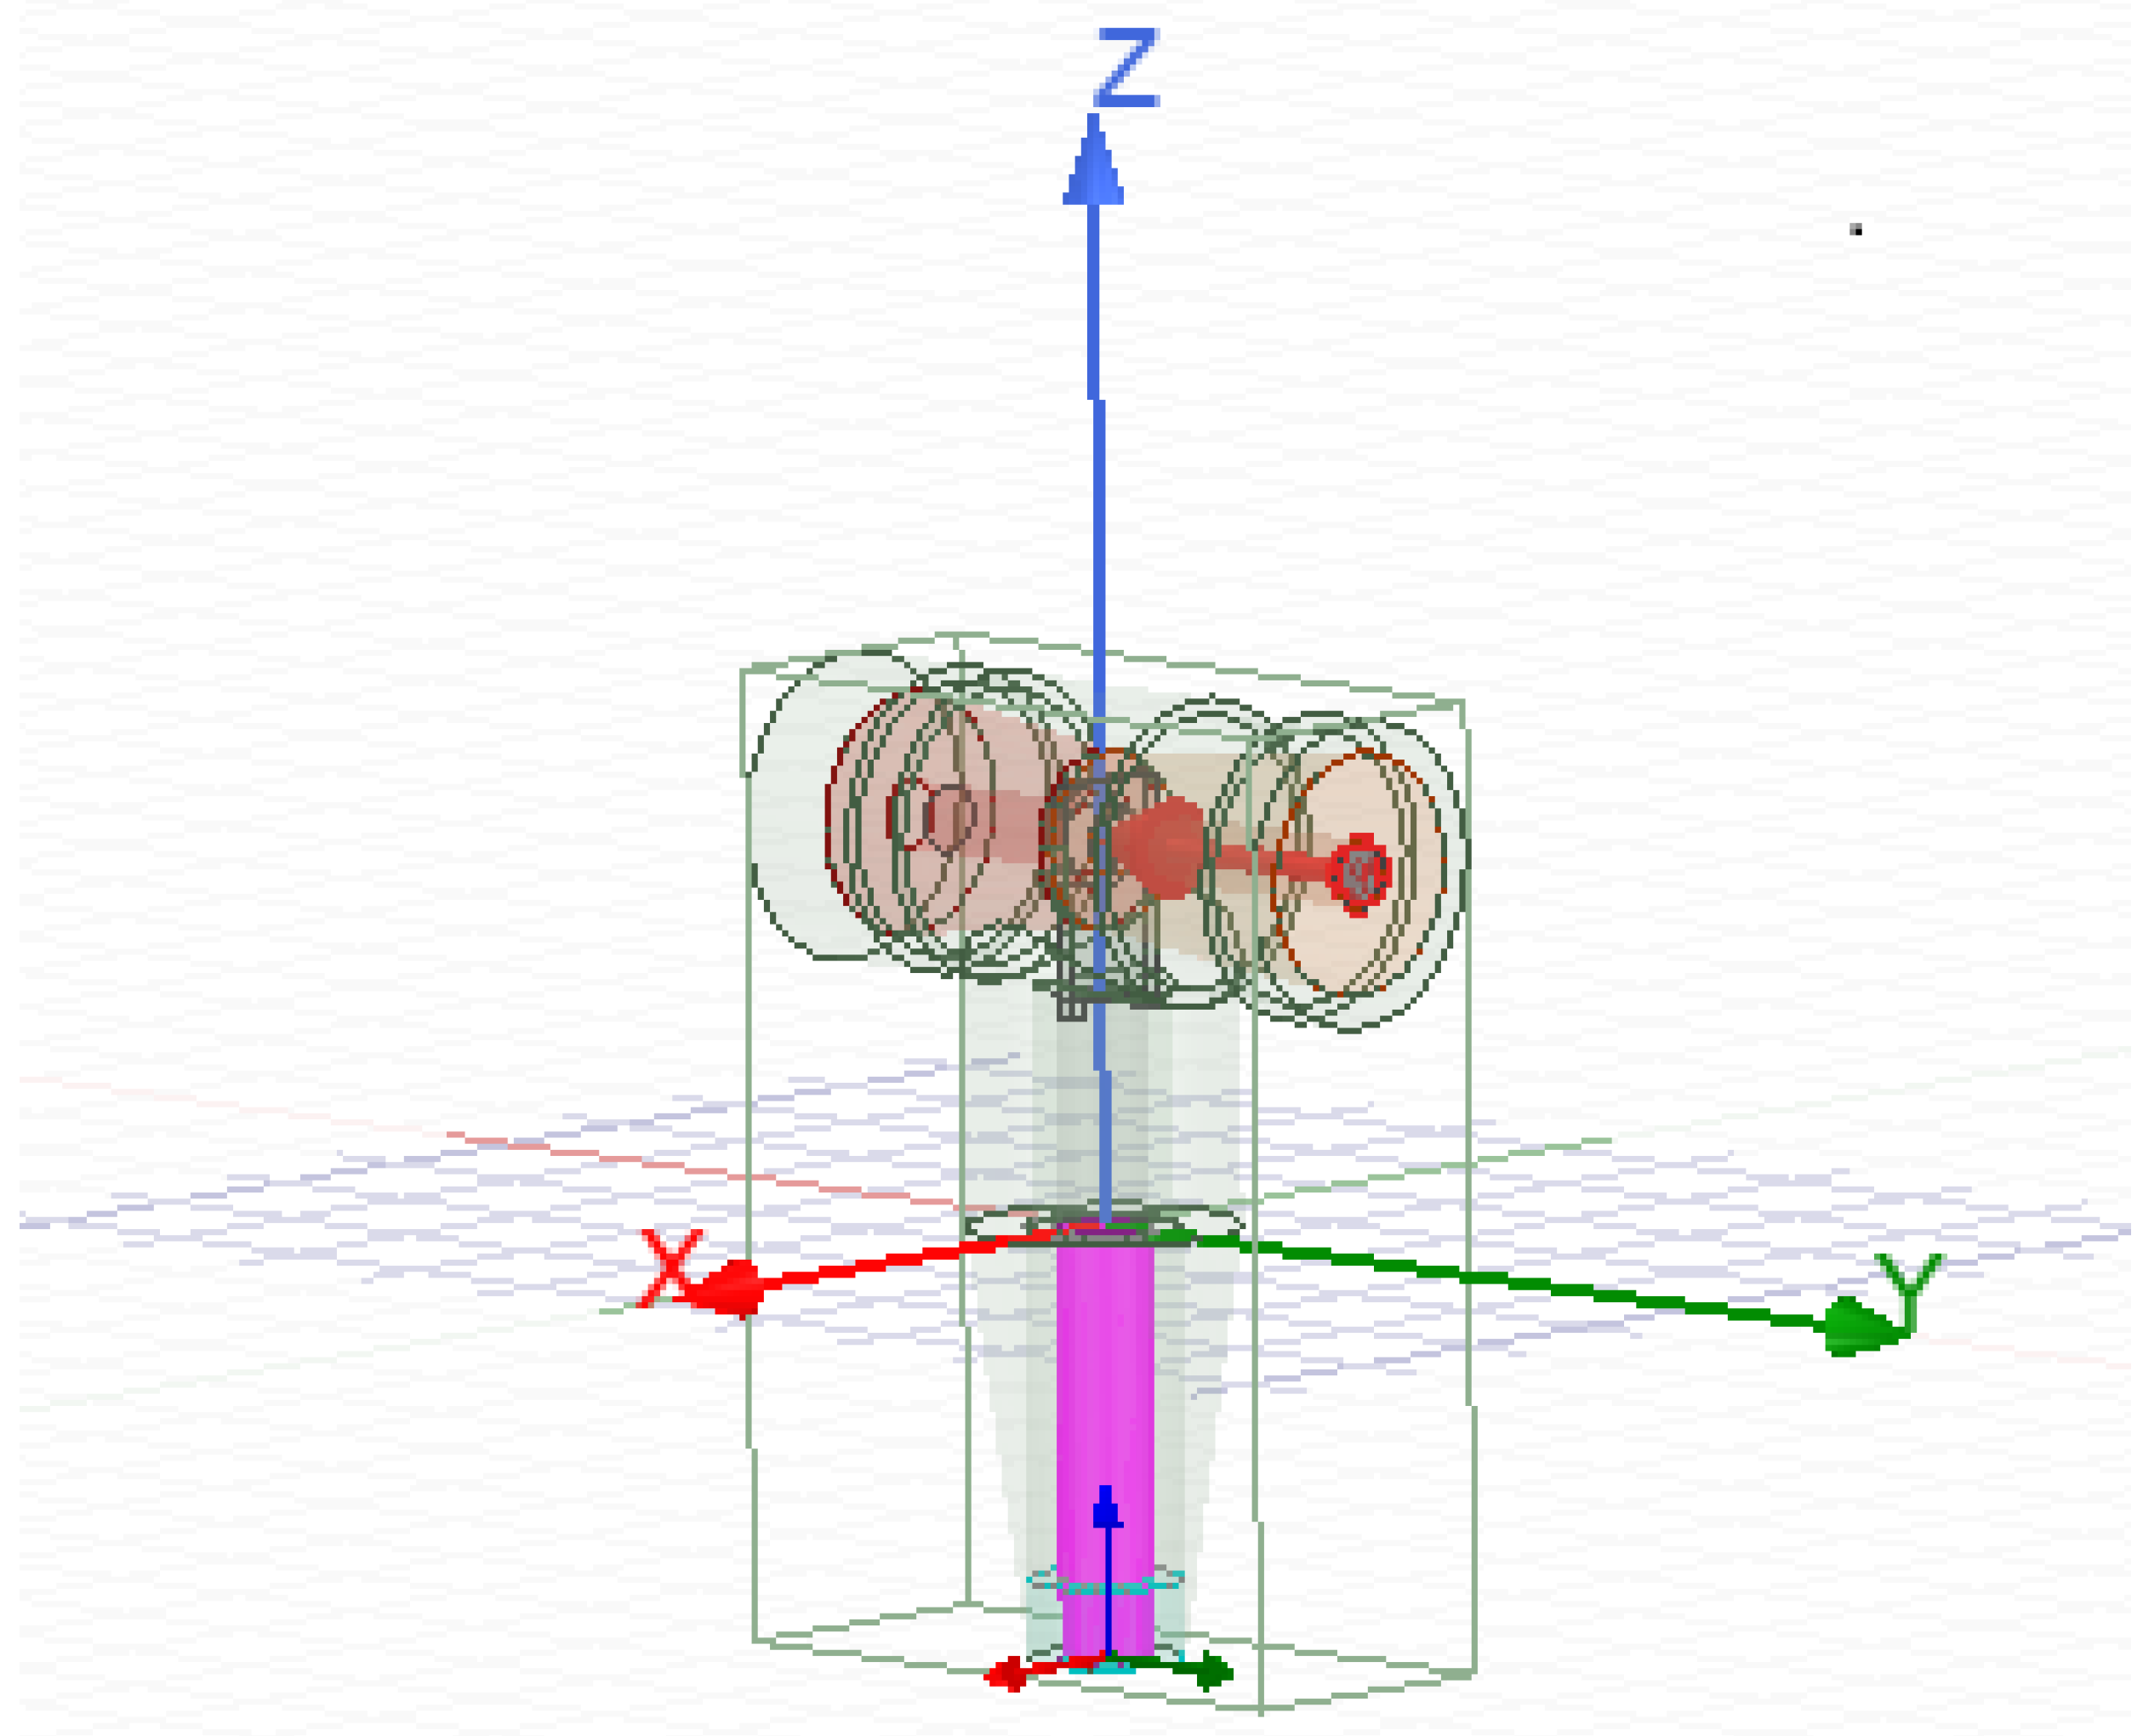
The Dirichlet condition was used for the numerical model under consideration. It is assumed that the current flows in the working conductor of the cable and the head is placed in the air (
Figure 3).
3. Results
3.1. Basic Analysis of Data Regarding MV Power Connection Failure
The percentage chart shown in
Figure 4 presents the types of interruptions depending on their duration together with the energy consumption points affected by the lack of power, while the
Table 1 presents the calculated values of quality indicators SAIDI, SAIFI and MAIFI concerning the duration of failures during the supply of electricity. The analysis was performed using data covering the years from 2016 to 2020.
As we can see in
Figure 1, when it comes to the breakdown of failures according to their duration, the long breaks (lasting between 3 min and 12 h) were the most common ones. Additionally, they are the main cause of the lack of power for energy consumption points. It is worth noting that the consumption points can be repeated, meaning that one customer may have several breakdowns throughout the year. Short breaks were the second most common types of failure (lasting between 1 s and 3 min) when it comes to duration and affected consumers. However. short breaks are mostly repaired by automatic reclosing safety circuits. Due to the short period of power failure, the damage caused by them is much smaller than those with longer duration. Very long and catastrophic breaks do not appear as frequent in comparison to short and long breaks. It would take a serious type of damage or extended modernization works (which is rare, due to the proper planning of such projects) for them to occur. However, it strongly impacts the power grid when they occur. It should be mentioned that only a small fraction of the power interruptions present in the data was caused by renovation works. Nonetheless, the number of customer minutes (reaching millions) should make the reader aware of how often such power outages occur.
Table 1 presents the values of SAIDI, MAIFI and SAIFI quality indicators concerning only the MV range (normally these quality indicators are calculated in the combination of MV and HV together, which could cause a difference in the results). In accordance with the previous charts, the domination of long breaks results in a higher SAIDI value. The highest values of SAIDI and MAIFI were recorded in 2017 and the lowest in 2020. The obtained results prove the reliability of the Innogy distributors MV network. This could be caused by modernizations carried out every year and because of the preferred method of transmitting energy via cable lines (their territory mostly covers urbanized areas), which protects the cables from most weather hazards.
3.2. Mathematical Models of MV Reliability Analysis
The Influence of Ambient Temperature on the Intensity of Failures
The data presented in
Table 2 refer to breakdowns happening in their specified months from the years 2016 to 2020, without the segregation of planned and unplanned failures.
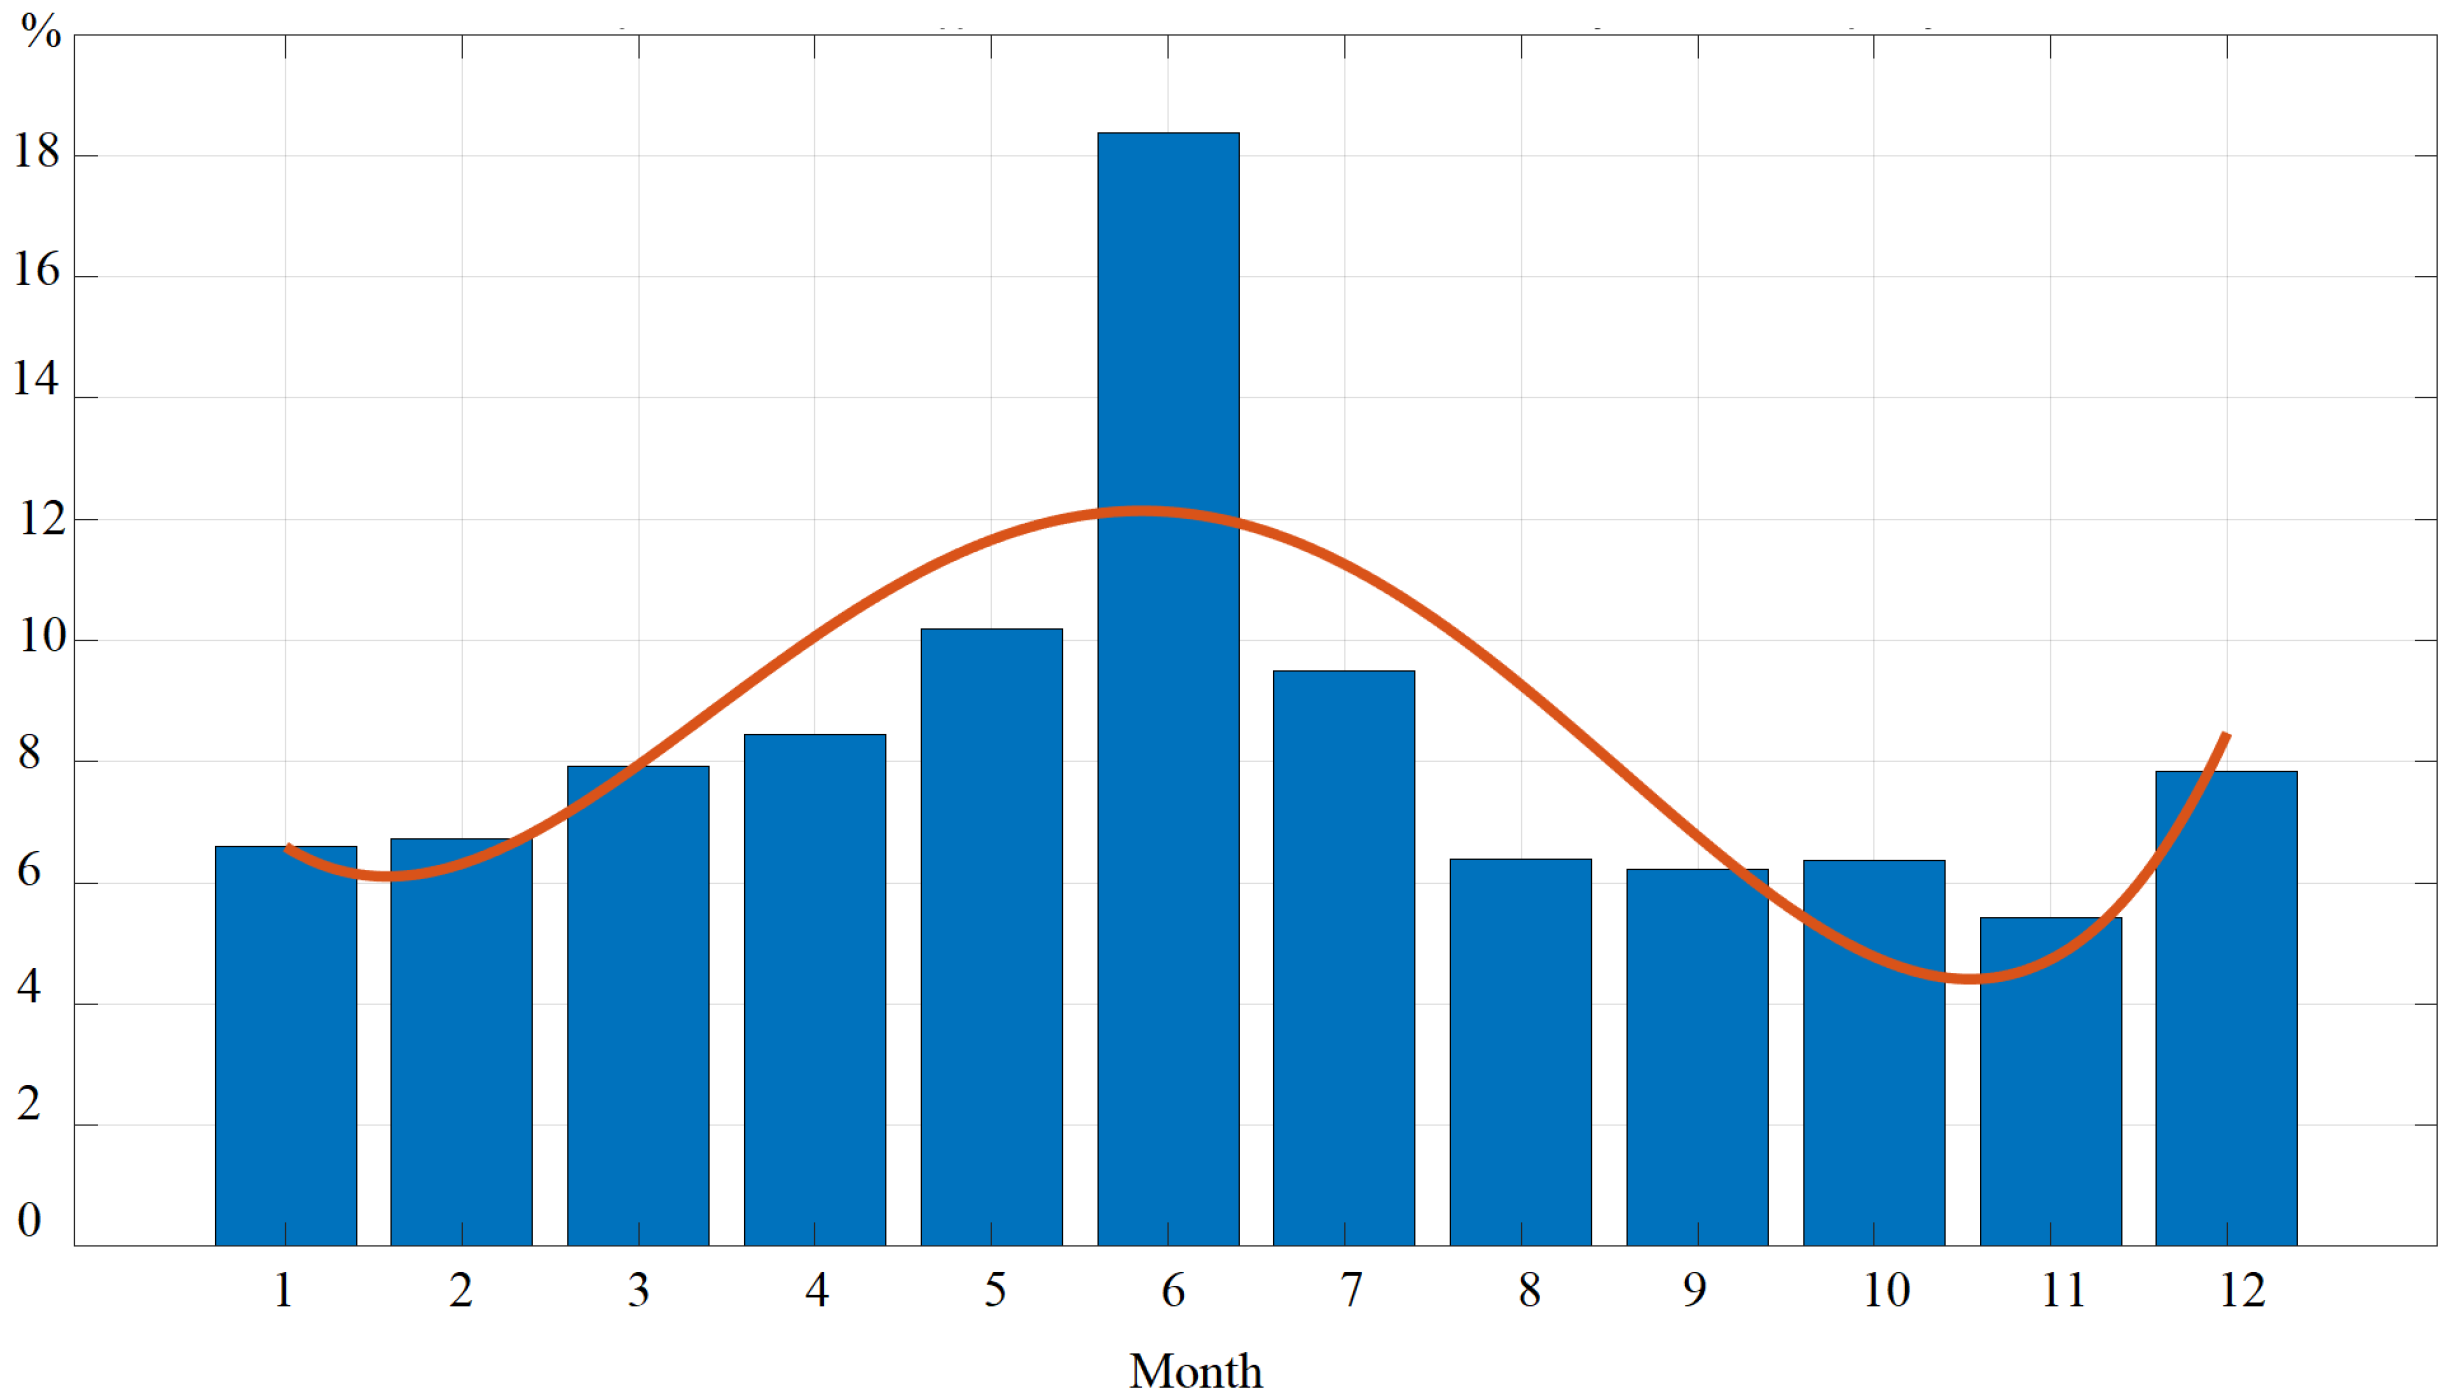
The data from
Table 2 are presented in
Figure 5 in the form of a histogram along with the approximation function.
The coefficients of the approximation function concerning the seasonal variability of the failure frequency achieved the following values:
a = 0.016957677738928;
b = −0.406303661616160;
c = 2.968451704545441;
d = 6.594720522532989;
e = 10.611287878787873.
Based on
Figure 5, which shows the percentage ratio of the number of failures occurring in each month of the year, we can see that the most breakdowns appear during the summer. We would like to point out that the chart includes both planned and unplanned breakdowns, which could have caused the dominance of the warmer months over the rest. During the summer season, numerous modernizations, repairs and new connections of the power grid are fulfilled due to favorable weather conditions (the possibility of earthworks) and social conditions (a significant part of people spent their time outside of the home). It should be noted that during the years 2016–2020 there was no specific month that would lower the failure statistics, which means that breakdowns occur evenly throughout the year for systemic and external reasons.
The main cause of MV power lines which had a significant impact on the number of noted breakdowns where earthworks with or without the use of an excavator, reaching about 44 percent of all damages. The second most common cause was fallen trees reaching up to 10 percent, most likely concerning the overhead power lines. Breakdowns caused by bad weather conditions, mainly storms and lighting discharges reached about 6 percent of all damages. It can be concluded that the main reasons causing power interruptions are external or atmospheric, in which the human factor played the biggest role due to irregularities during the performance of works. It should also be emphasized that the area covered by the selected grid operator consists monthly of urbanized areas that are highly dominated by the exploitation of power by underground cable lines. The density of underground networks and the built-up area increase the probability of occurring damage during the executed earthworks. In other suburban or rural areas of Poland, the atmospheric causes could play a more major role due to preferred overhead power lines.
3.3. Failure Duration Analysis
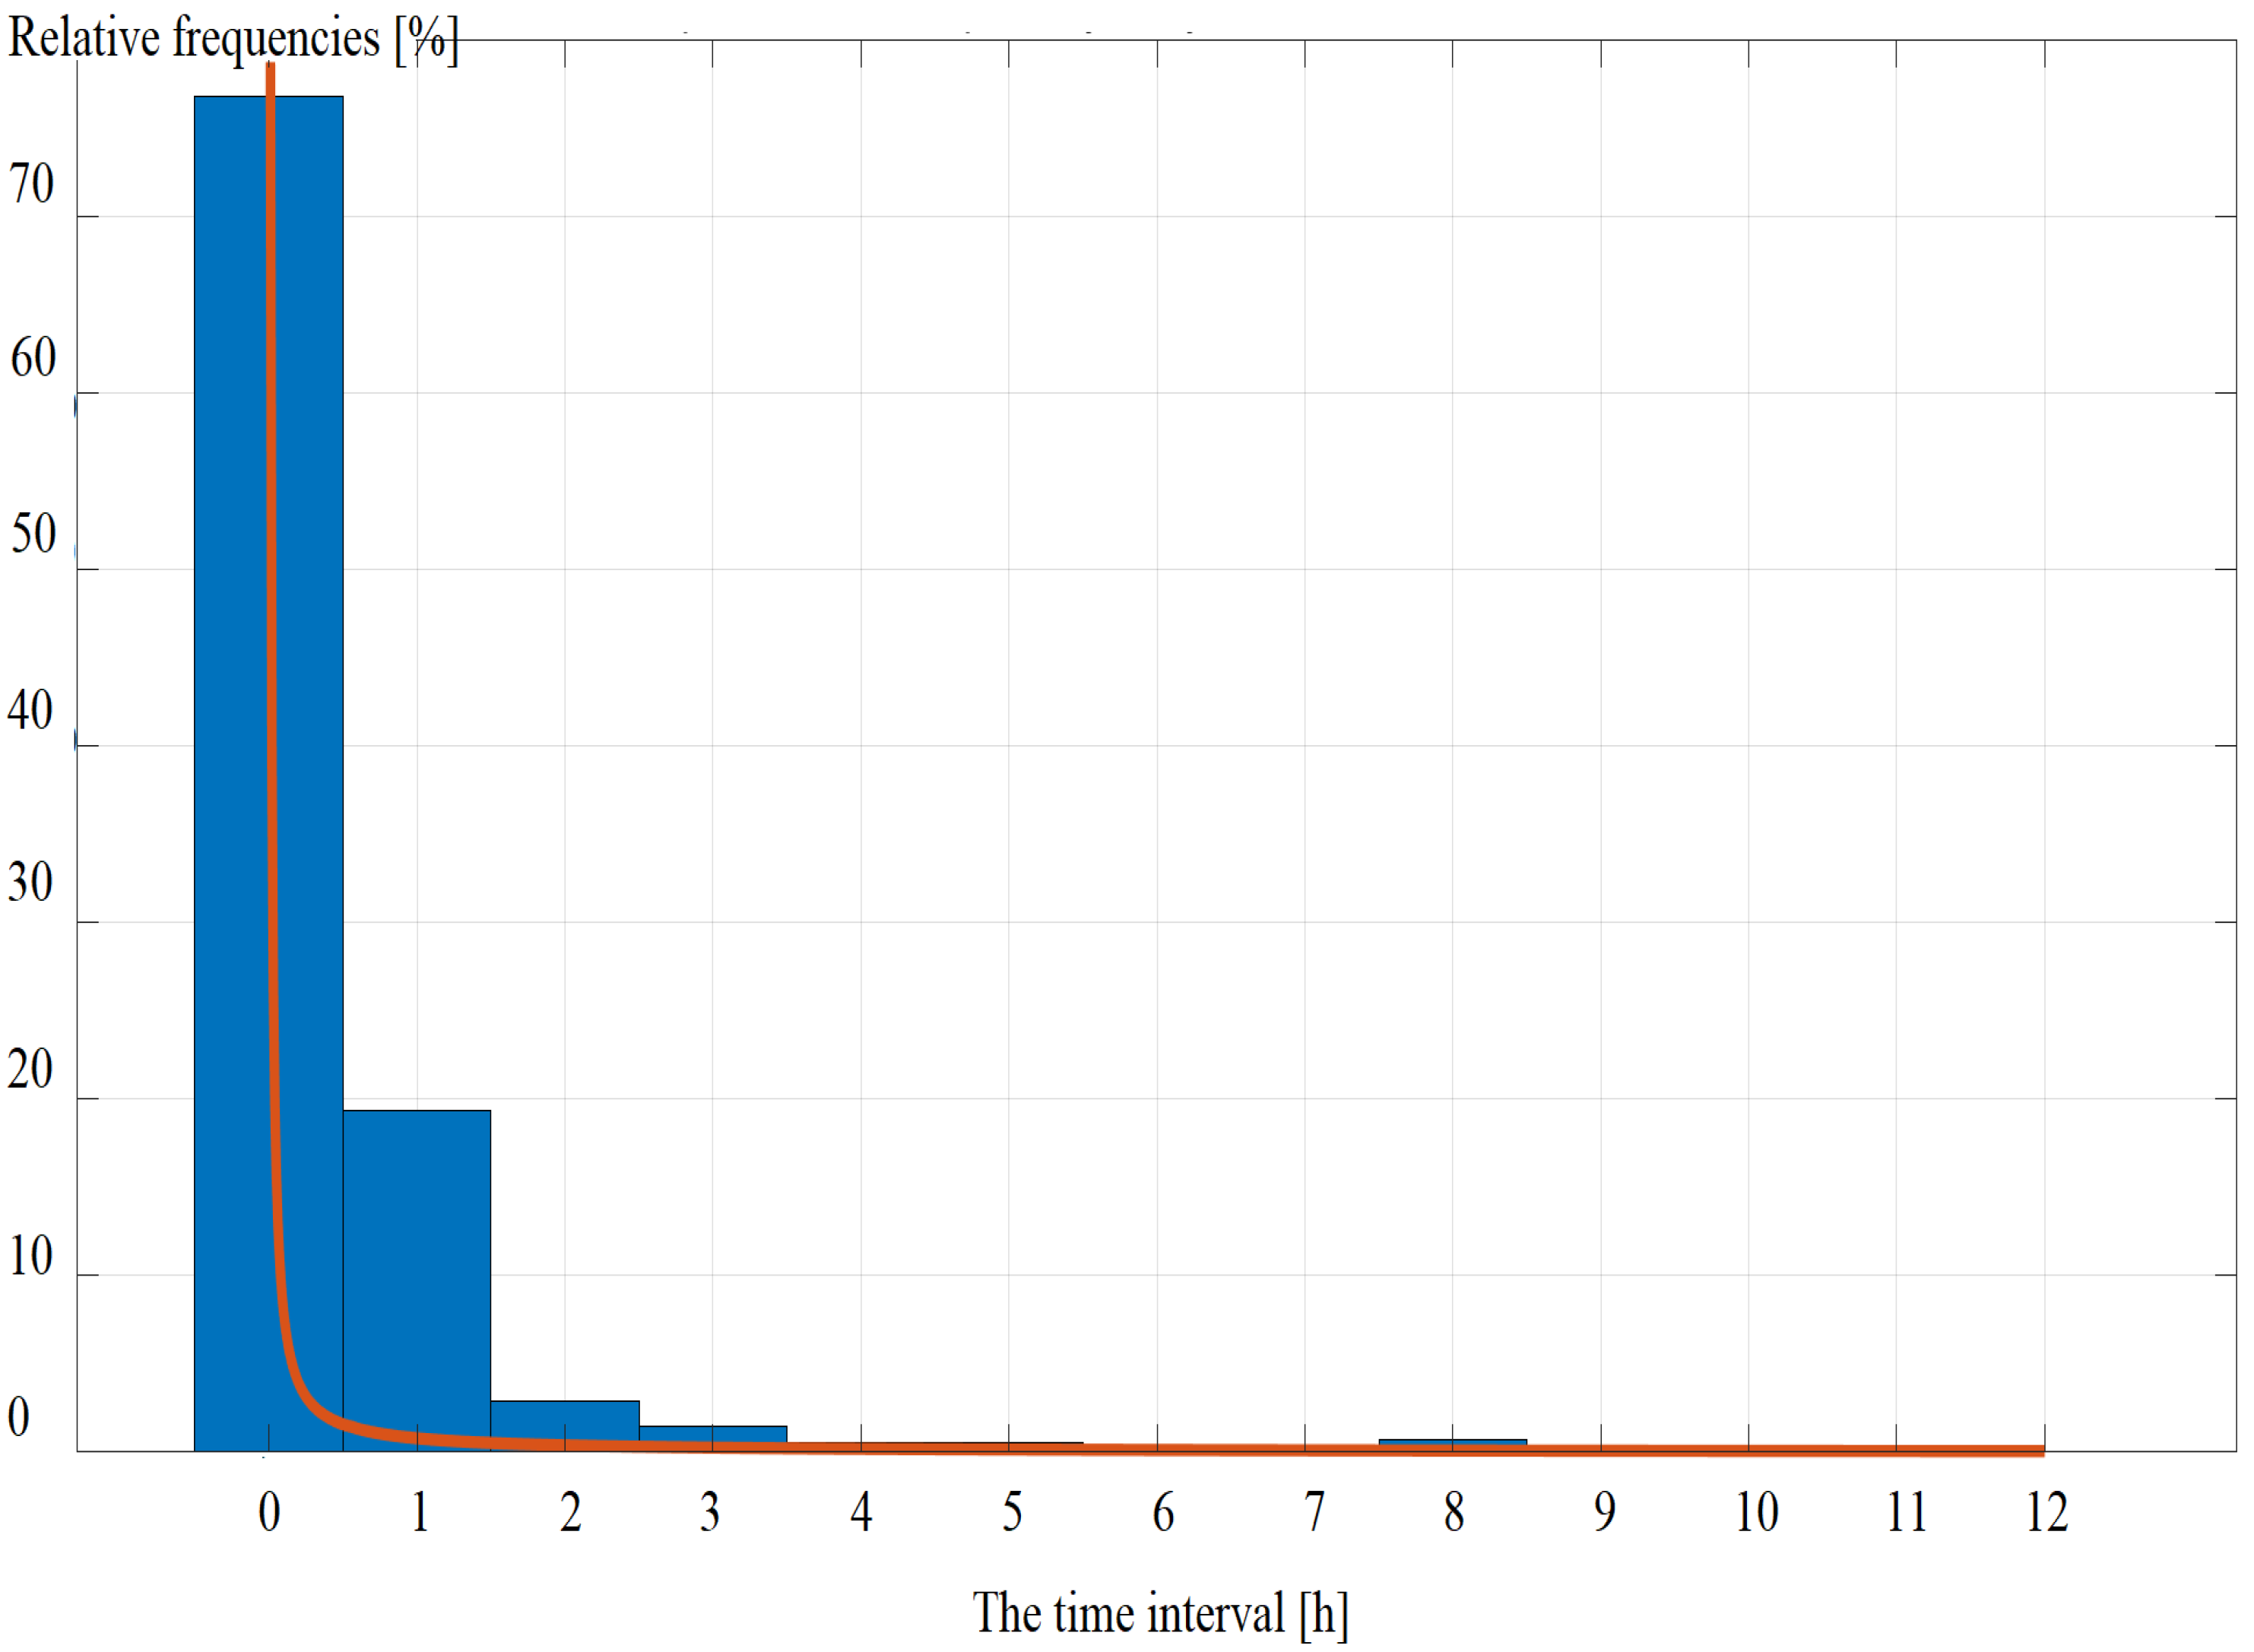
The calculated probability density function of the log-normal distribution by the formula achieved the proper shape expected from the mathematical model of duration failure. However, this does not change the fact that for a specific time interval of long breaks, the frequency of failures decreases with the increase in duration. The determined distribution parameters achieved the following values:
m = 0.554 and
= 6.531. The achieved results are presented in
Table 3 and
Figure 6.
3.4. Simulating the Failure Rate of a Selected MV Grid Element
Testing the Connector Head Model
At the rated current, the model reached a voltage of 19.7 kV (the maximum operating voltage is 24 kV) in
Figure 7, and the operating temperatures of all elements were within the range of 35–67 ℃. Despite the simplified structure of the model, the temperature spread for individual materials was correct, and none of the operating conditions were exceeded
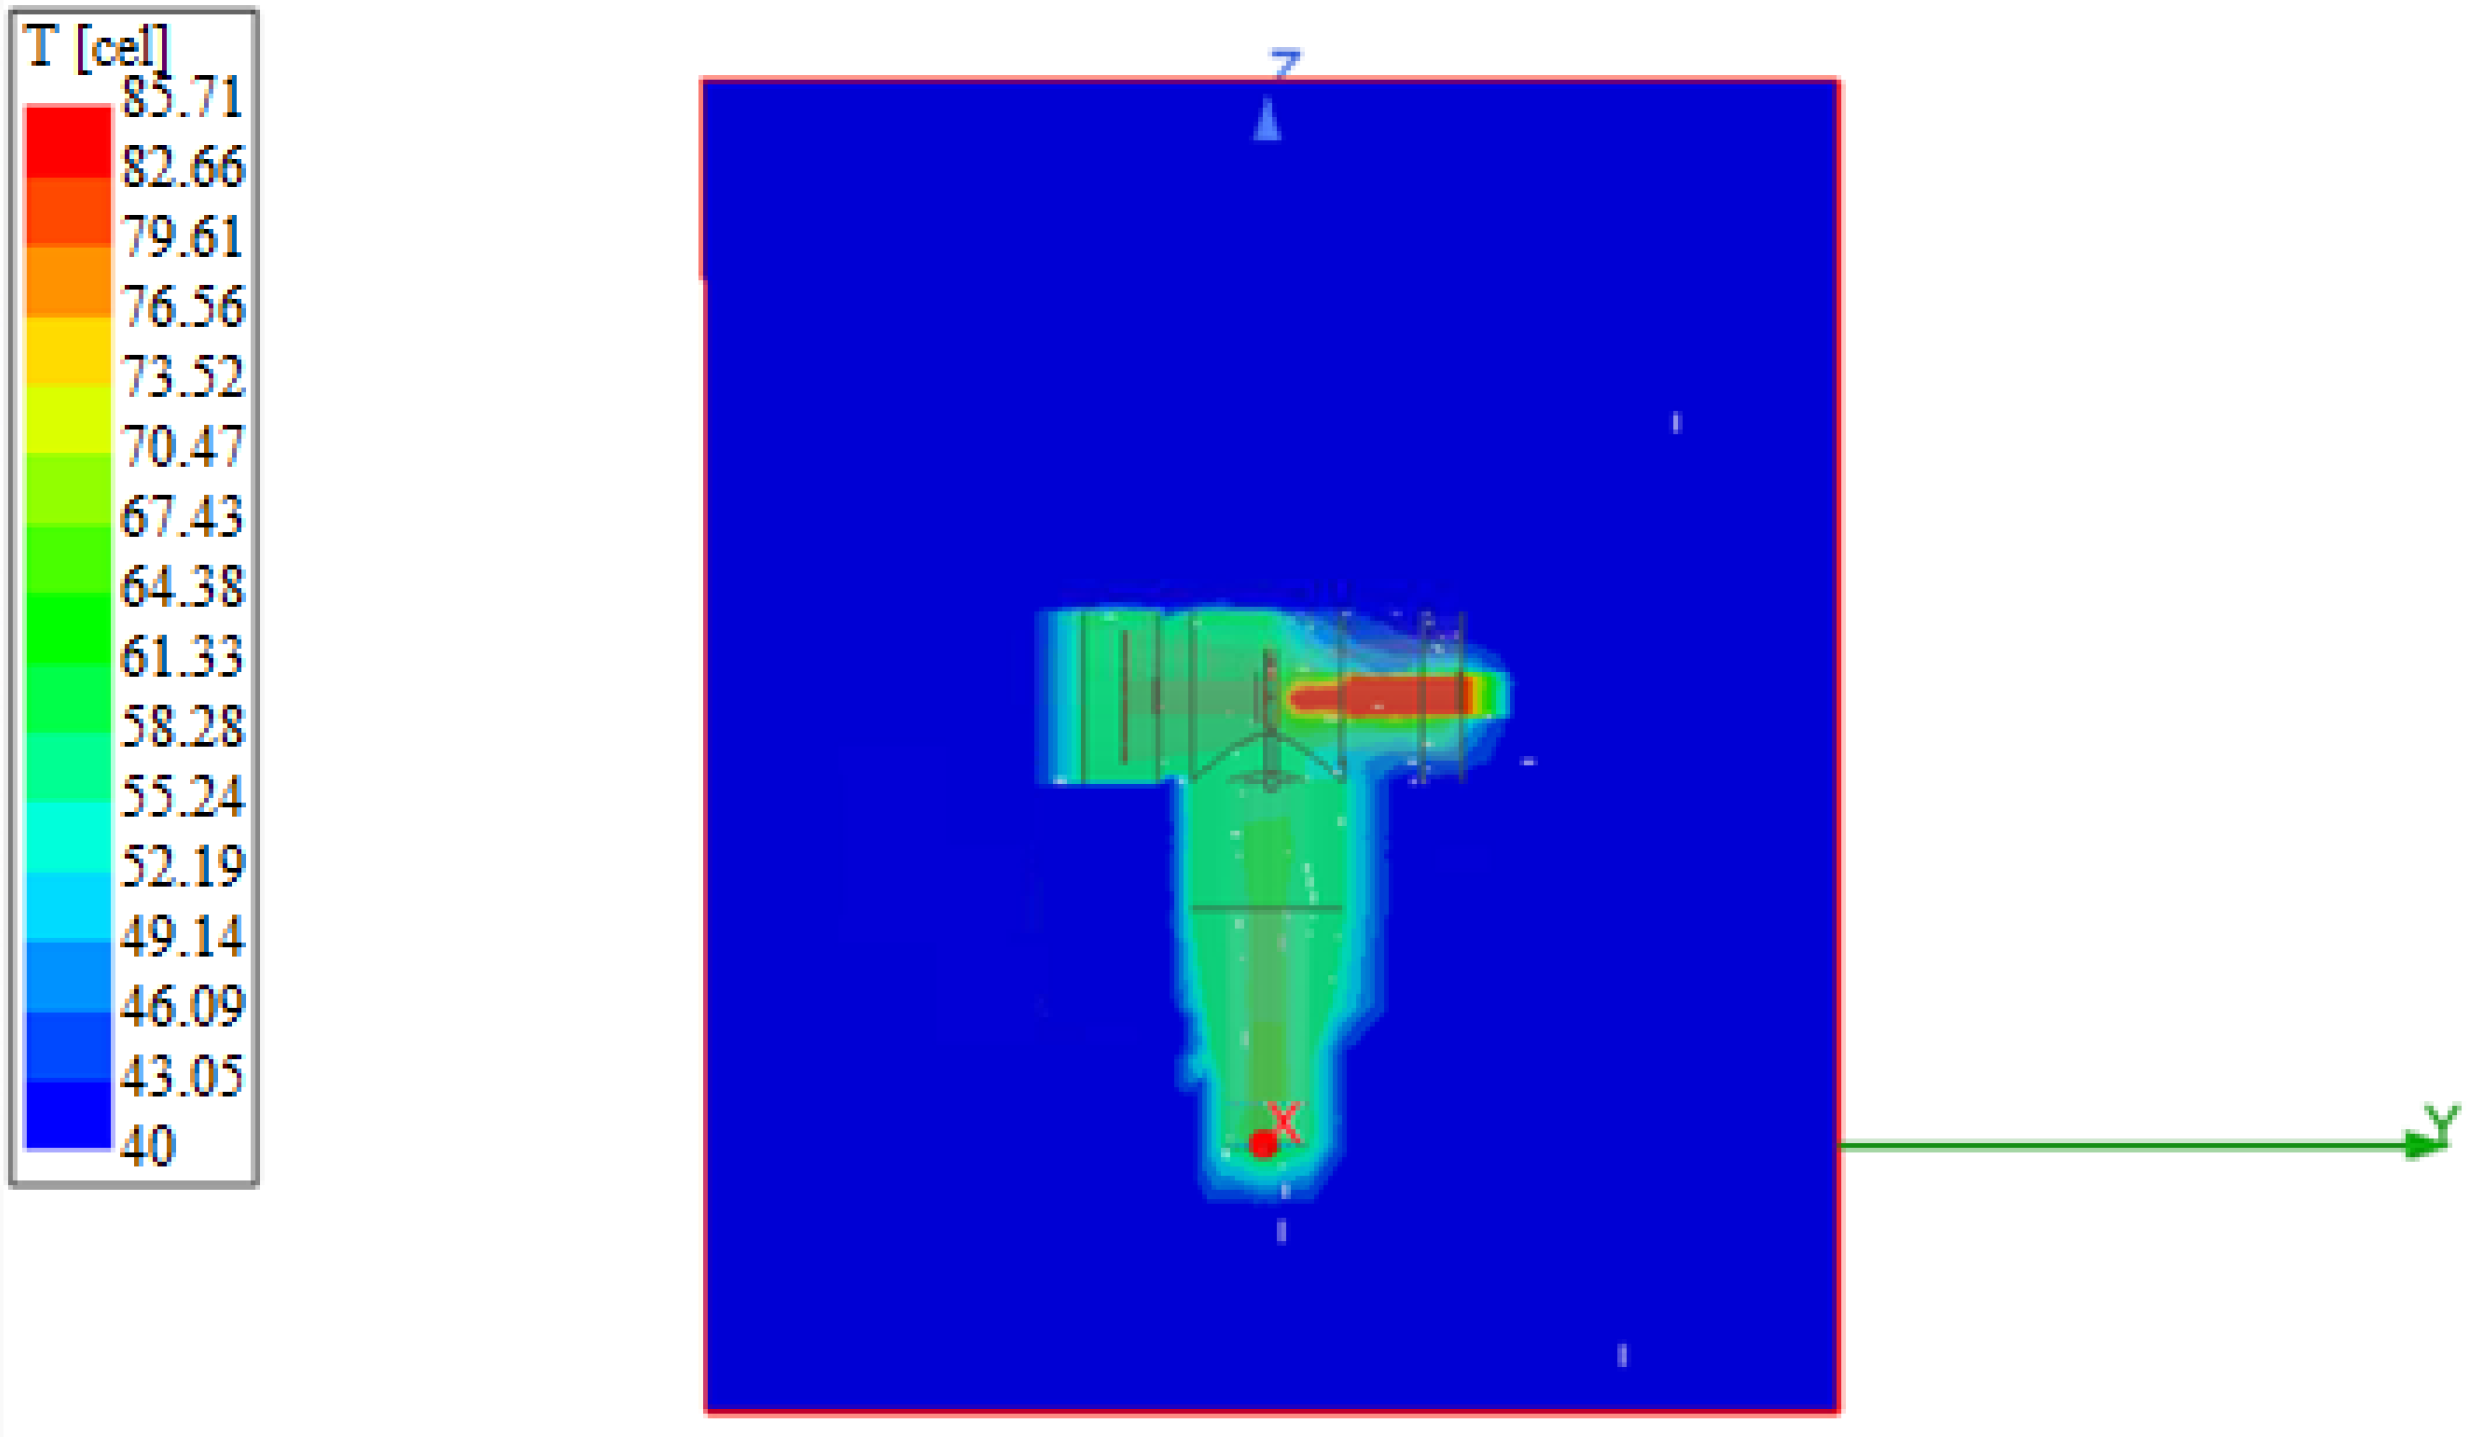
Figure 8. The discussed model takes into account the unfavorable temperature conditions in summer, when the air temperature is maximum and the air cooling effect does not have a significant effect. The temperature change by 20 ℃ to the permissible maximum ambient temperature in MV stations of 40 ℃ caused a temperature change of all elements to the value of 55–85 ℃ (
Figure 9).
Exceeding the permissible temperature would damage the head. In the event of an emergency (short circuit) for the 2kA current injected into the head, the obtained values significantly exceeded the permissible operating ranges of the head building materials
Figure 10. In some cases, the temperature reached ten times higher permissible temperature in the range of 436–606 ℃. Reaching such temperatures may result in partial or complete damage to the head and the need to replace it. The Dirichlet condition was used on the analyzed numerical model of the cable head. On the outer wall of the analysis area is an assumed condition—due to the design of the head, it does not have a great impact on the temperature value on the surface of the head (it was tested by moving the edges of the area away until their influence ceased). The analyzed numerical model reflects the processes that may lead to exceeding the operating temperature of the head permitted by the manufacturer. First of all, the temperature of the head is influenced by the ambient temperature and the temperature of the cable core.
4. Discussion
The topic of reliability of MV power connections is a very extensive task. Although mathematical models cannot always be used for real data and sometimes require appropriate modifications or simplifications, perhaps the development of this field will contribute to their clarification, making it possible to obtain more precise results using them. An important factor in the obtained results may be the fact that the data on which the calculations were based came from one source, i.e., selected grid operator and concerned mainly urbanized areas. Different operators may have different structures or different characteristics of their power grid, which results in different failure causes and intensities. Therefore, analytical models should be developed that are dedicated to specific areas, which would allow for more precise analysis at the stage of calculations. In addition, the discussed topic is interesting and perspective, because it was partially considered as part of the implementation of an internal grant for employees of the Warsaw University of Technology supporting scientific activities in the discipline of Automation, Electronics and Electrical Engineering.
5. Conclusions
The reliability of MV power connections is a topic for investigation and study. Unfortunately, the reliability of the system is influenced not only by human factors but also by those that are not influenced by distributors, e.g., weather conditions. However, by appropriate analysis of data from previous years with the use of statistics and models, it is possible to predict and prevent the frequency of its failure and improve its efficiency. The simulation of the connector head shows how important each element of the power system is in the process of electricity transmission and how damage to even the smallest device results in a network failure and a break in energy supply to consumers. As a result of the research presented in this article, the following results were obtained:
- 1.
The obtained SAIDI, MAIFI and MAIFI indicators prove the reliability of MV power connections belonging to Innogy. In 2019 and 2020, the main causes of the MV grid failure were earthworks, fallen trees and atmospheric causes (storms). Such results were obtained due to the dominant number of cable lines over overhead lines in urbanized areas in the area belonging to a given operator. Most failures occur in the summer, which is most likely caused by modernization and connection works.
- 2.
In the case of failure duration analysis, it was shown that mathematical models cannot always be used for real data and sometimes need appropriate modifications or simplifications. At the same time, it was possible to reflect the analytical model used by referring to a particular range of real data. All the coefficients and the probability density function of the log-normal distribution were determined for the range of long breaks (3 min–12 h) from 2020. The average failure duration was 0.9 [h], and the obtained graph and function, in line with theoretical assumptions, show the disappearance of the short-circuit frequency with the increase in the time interval.
- 3.
In the case of the numerical model of the cable head, the voltage of 19.7 kV appears on the cable head at the rated current (maximum operating voltage is 24 kV) and the operating temperatures of all elements are within the range of 35–67 ℃. Despite the simplified structure of the model, the temperature spread for individual materials was correct, and none of the operating conditions were exceeded. The temperature change by 20 ℃ to the allowable maximum ambient temperature in MV stations of 40 ℃ caused the temperature of all elements to rise to the level of 55–85 ℃. Exceeding the permissible temperature in a given case may result in damage to the head. In the event of an emergency (short circuit) for the 2 kA current injected into the head, the obtained values significantly exceeded the permissible operating ranges of the head materials. In some cases, the temperature reached a ten times higher permissible temperature in the range of 436–606 ℃. Reaching such temperatures may result in partial or complete damage to the head and the need to replace it.
The conducted research confirmed the complexity of MV power connections and their dependence on various factors. At the same time, the current method of managing the power grid ensures its effective functioning and development.
Author Contributions
Conceptualization, M.B. and P.H.; methodology, M.B. and P.H.; software, P.H.; validation, M.B. and P.H.; formal analysis, M.B. and P.H.; resources, M.B. and P.H.; data curation, P.H.; writing—original draft preparation, M.B. and P.H.; writing—review and editing, M.B. and P.H.; visualization, P.H.; supervision, M.B. and P.H.; project administration, M.B.; funding acquisition, M.B. All authors have read and agreed to the published version of the manuscript.
Funding
This research received no external funding.
Institutional Review Board Statement
Not applicable.
Informed Consent Statement
Not applicable.
Data Availability Statement
Not applicable.
Conflicts of Interest
The authors declare no conflict of interest.
References
- Schütze, A.; Helwig, N.; Schneider, T. Sensors 4.0—Smart sensors and measurement technology enable Industry 4.0. J. Sens. Sens. Syst. 2018, 7, 359–371. [Google Scholar] [CrossRef]
- Kim, B.-S.; Kim, K.-I.; Shah, B.; Chow, F.; Kim, K.H. Wireless Sensor Networks for Big Data Systems. Sensors 2019, 19, 1565. [Google Scholar] [CrossRef] [PubMed] [Green Version]
- Borecki, M. Risk level analysis in the selected (initial) stage of the project life cycle. Manag. Prod. Eng. Rev. 2020, 11, 104–112. [Google Scholar]
- Lowczowski, K.; Nadolny, Z.; Olejnik, B. Analysis of Cable Screen Currents for Diagnostics Purposes. Energies 2019, 12, 1348. [Google Scholar] [CrossRef] [Green Version]
- Lowczowski, K.; Lorenc, J.; Andruszkiewicz, J.; Nadolny, Z.; Zawodniak, J. Novel Earth Fault Protection Algorithm Based on MV Cable Screen Zero Sequence Current Filter. Energies 2019, 12, 3190. [Google Scholar] [CrossRef] [Green Version]
- Noske, S.; Rakowska, A. Partial discharge measurements as a source of information about the technical condition of PILC insulated MV cables. In Proceedings of the CIRED 2013, Stockholm, Sweden, 10–13 June 2013. [Google Scholar]
- Mampaey, B.; Lucignano, T.; Ahern, C.; Ainsley, A.; Bochenski, B.; Cabau, M.; Charvet, J.; Donoso, G.; Fossi, A.; Goto, Y.; et al. Maintenance of HV Cable Systems; CIGRE BT No. 825; CIGRE: Paris, France, 2021. [Google Scholar]
- Zhan, L.; Huang, T. Study of Recognition and Location of Partial Discharges in XLPE Cable under Damped AC Voltage. In Proceedings of the 48 CIGRE Session, Paris, France, 24 August–3 September 2020; p. B1-213. [Google Scholar]
- Borecki, M.; Ciuba, M.; Kharchenko, Y.; Khanas, Y. Substation reliability evaluation in the context of the stability prediction of power grids. Bull. Pol. Acad. Sci. Techn. Sci. 2020, 68, 769–776. [Google Scholar]
- Borecki, M.; Ciuba, M.; Kharchenko, Y.; Khanas, Y. Main aspects influencing the evaluation of atmospheric overvoltages in high-voltage networks. Bull. Pol. Acad. Sci. Techn. Sci. 2021, 1–8. [Google Scholar] [CrossRef]
- Le, T.D.; Petit, M. An Optimisation algorithm for Earth fault location. In Proceedings of the 24th International Conference on Electricity Distribution, Glasgow, Scotland, 12–15 June 2017. [Google Scholar]
- Farughian, A.; Kumpulainen, L.; Kauhaniemi, K. Earth Fault Location Using Negative Sequence Currents. Energies 2019, 12, 3759. [Google Scholar] [CrossRef] [Green Version]
- Dashti, R.; Salehizadeh, S.M.; Shaker, H.R.; Tahavori, M. Fault Location in Double Circuit Medium Power Distribution Networks Using an Impedance-Based Method. Appl. Sci. 2018, 8, 1034. [Google Scholar] [CrossRef] [Green Version]
- Borecki, M. A Proposed new approach for the assessment of selected operating conditions of the high voltage cable line. Energies 2020, 13, 5275. [Google Scholar] [CrossRef]
- Kilickiran, H.C.; Akdemir, H.; Sengor, I.; Kekezoglu, B.; Paterakis, N.G. A Non-Standard Characteristic Based Protection Scheme for Distribution Networks. Energies 2018, 11, 1241. [Google Scholar] [CrossRef] [Green Version]
- Borecki, M.; Sobolewski, K. An elimination method for an emergency situation in Gas-insulated switchgear in power grids. IEEE Trans. Power Deliv. 2021, 99, 1–9. [Google Scholar] [CrossRef]
- Tsimtsios, A.M.; Nikolaidis, V.C. Application of distance protection in mixed overhead-underground distribution feeders with distributed generation. J. Eng. 2018, 2018, 950–955. [Google Scholar] [CrossRef]
- Bernadić, A.; Leonowicz, Z. Fault location in power networks with mixed feeders using the complex space-phasor and Hilbert–Huang transform. Int. J. Electr. Power Energy Syst. 2012, 42, 208–219. [Google Scholar] [CrossRef] [Green Version]
- Sunil, D.V.; Yadaiah, N. An expert system for fault location in distribution feeder line. In Proceedings of the 2017 International Conference on Energy, Communication, Data Analytics and Soft Computing (ICECDS), Chennai, India, 1–2 August 2017. [Google Scholar]
- Vieira, F.; Santos, P.H.M.; Filho, J.M.C.; Leborgne, R.C.; Leite, M.P. A Voltage-Based Approach for Series High Impedance Fault Detection and Location in Distribution Systems Using Smart Meters. Energies 2019, 12, 3022. [Google Scholar] [CrossRef] [Green Version]
- Aizenberg, I.; Belardi, R.; Bindi, M.; Grasso, F.; Manetti, S.; Luchetta, A.; Piccirilli, M.C. Failure Prevention and Malfunction Localization in Underground Medium Voltage Cables. Energies 2021, 14, 85. [Google Scholar] [CrossRef]
- Neier, T.; Knauel, J.; Bawart, M.; Atipov, D.; Kim, S.-M. A statistical method for statistical appraisal of the power cable conditions based on the TD and PD diagnostics result. In Proceedings of the E3S Web of Conferences, Kazan, Russia, 18–20 September 2019; p. 2014. [Google Scholar]
- Smit, J.; Van Riet, M.; Staarink, B. Non-destructive after laying test with PD localization. In Proceedings of the 10th International Conference on Insulated Cables, JICABLE 2019, Versailles, France, 23–27 June 2019; p. D3.4. [Google Scholar]
- Monatanari, G.C.; Seri, P.; Hebner, R.E. A scheme for the Health Index and residual life of cables based on measurement and monitoring of diagnostic quantities. In Proceedings of the 2018 IEEE Power and Energy Society General Meeting PESGM, Portland, OR, USA, 5–9 August 2018. [Google Scholar]
- Aizpurua, J.I.; Stewart, B.; McArthur, S.D.J.; Jajware, N.; Kearns, M. Towards a hybrid power cable health index for medium voltage power cable condition monitoring. In Proceedings of the 37th IEEE Electrical Insulation Conference, Calgary, AB, Canada, 16–19 June 2019. [Google Scholar]
- Shafiq, M.; Kiitam, I.; Taklaja, P.; Kütt, L.; Kauhaniemi, K.; Palu, I. Identification and location of PD defects in medium voltage underground power cables using high frequency current transformer. IEEE Access 2019, 7, 103608–103618. [Google Scholar] [CrossRef]
- Li, Z.; Wu, W.; Zhang, B.; Tai, X. Analytical Reliability Assessment Method for Complex Distribution Networks Considering Post-Fault Network Reconfiguration. IEEE Trans. Power Syst. 2020, 35, 1457–1467. [Google Scholar] [CrossRef]
- Chojnacki, A.Ł. Reliability models of MV overhead lines with bare conductors. Elektr. Inf. 2016, 2016, 5. [Google Scholar]
- Sozanski, J. Reliability of Electricity Supply; WNT: Warsaw, Poland, 1982. [Google Scholar]
- Mach, E. Machine Reliability; Publishing House of the PO.: Opole, Poland, 2001. [Google Scholar]
- Chen, Z.; Le, Y.; Liu, H.; Yang, F.; Hu, W.; Hu, K.; He, T. Study of Temperature Field and Ampacity of 110kV AC Submarine Cables under Different Laying Conditions. J. Phys. Conf. Ser. 2019, 1346, 1. [Google Scholar] [CrossRef]
Figure 1.
Block diagram of the proposed method of analyzing medium-voltage connections.
Figure 1.
Block diagram of the proposed method of analyzing medium-voltage connections.
Figure 2.
A 2D cross-section of the connector head in the ANSYS environment. A conductor sheath (1), a cable lug (2), a fastening screw (3), a element controlling the distribution of the electric field (4), a connector head (5), an additional layer of tape (6), a capacitive voltage divider (7), air (8) and a cable’s working core (9).
Figure 3.
Numerical model of the head placed in the air.
Figure 3.
Numerical model of the head placed in the air.
Figure 4.
Graph comparison of the types of failures to the number of energy consumption points victims—from 2016 to 2020.
Figure 4.
Graph comparison of the types of failures to the number of energy consumption points victims—from 2016 to 2020.
Figure 5.
Empirical values and the approximation function of the seasonal variability of MV failure frequency.
Figure 5.
Empirical values and the approximation function of the seasonal variability of MV failure frequency.
Figure 6.
Empirical and theoretical probability density function of MV line renewal duration (numbers 0–12 define the failure interval in an increasing way: 0: 0–1 (h), 1: 1–2 (h), 2: 2–3 (h) …).
Figure 6.
Empirical and theoretical probability density function of MV line renewal duration (numbers 0–12 define the failure interval in an increasing way: 0: 0–1 (h), 1: 1–2 (h), 2: 2–3 (h) …).
Figure 7.
The voltage level of the conductive elements, I = 630 A.
Figure 7.
The voltage level of the conductive elements, I = 630 A.
Figure 8.
Temperature flow in a connector head, I = 630 A for an ambient temperature of 20 ℃.
Figure 8.
Temperature flow in a connector head, I = 630 A for an ambient temperature of 20 ℃.
Figure 9.
Temperature flow in a connector head, I = 630 A for an ambient temperature of 40 ℃.
Figure 9.
Temperature flow in a connector head, I = 630 A for an ambient temperature of 40 ℃.
Figure 10.
Temperature flow in the connector head, = 2 kA.
Figure 10.
Temperature flow in the connector head, = 2 kA.
Table 1.
Energy quality indicators—from 2016 to 2020.
Table 1.
Energy quality indicators—from 2016 to 2020.
| Years | SAIDI | SAIFI | MAIFI |
|---|
| 2016 | 39.96 | 0.83 | 0.55 |
| 2017 | 45.13 | 0.85 | 0.60 |
| 2018 | 39.15 | 0.81 | 0.51 |
| 2019 | 30.85 | 0.72 | 0.61 |
| 2020 | 26.93 | 0.55 | 0.56 |
Table 2.
Breakdown frequency of MV lines in their individual months through the years 2016–2020.
Table 2.
Breakdown frequency of MV lines in their individual months through the years 2016–2020.
| Month | 1–2 | 3–4 | 5–6 | 7–8 | 9–10 | 11–12 |
|---|
| Intensity of breakdowns (%) | 13.32 | 16.37 | 28.55 | 15.90 | 12.59 | 13.27 |
Table 3.
Calculation results—long breaks variant.
Table 3.
Calculation results—long breaks variant.
| Calculation Results Concerning the Duration of Long Breaks |
|---|
| Duration of failure | = 0.90 (h) |
| Standard deviation | S = 1.17 (h) |
| Confidence interval for the mean | 0.87 (h) < < 0.93 (h) |
| Publisher’s Note: MDPI stays neutral with regard to jurisdictional claims in published maps and institutional affiliations. |
© 2021 by the authors. Licensee MDPI, Basel, Switzerland. This article is an open access article distributed under the terms and conditions of the Creative Commons Attribution (CC BY) license (https://creativecommons.org/licenses/by/4.0/).


