1. Introduction
In recent years, energy production systems based on photovoltaic power generation have pursued a more efficient structure to provide better reliability and enhanced energy efficiency. Accordingly, the designs involving operation and maintenance processes are becoming even more complex, as they are required to improve safety and sustainability levels while reducing or optimizing overall operational costs, which is one of the major concerns of energy suppliers as well as system operators. In the era of big data, although some digital tools such as R-Studio, Python, Simulation, and OMNeT++ as well as mixed-reality technologies and digital mockups are still playing a vital role in constructing an optimal energy production system or an operation system when creating/analyzing value chains in the system, the problems associated with the availability of big data and its representation should be studied further while attempting to improve interface and interaction paradigms [
1].
Thus, this paper proposed a power production scheme that can find an optimal virtualization solution for a power plant using either fossil energy or new and renewable energy based on a game theory employing power demand forecasts.
Meanwhile, among the current energy forms that humans can use conveniently without putting in much effort, the most typical ones are oils, coals, and gases. However, it has been expected that these energy forms will not last for even 100 years if the current situation (usage) persists.
These energies have been thought to be the easiest forms of energy that can be used by humans, and even though they may not completely diminish according to the first law of thermodynamics, the second law of thermodynamics indicates that they will gradually convert into forms that humans will have much difficulty in handling. From this perspective, the efficient use of energy and the securing of available energy sources has become critical. Although the Republic of Korea (ROK) is converting various types of energy sources into electric power through thermal/hydroelectric/nuclear power generation, their government is pushing ahead with a policy to reduce the use of nuclear energy due to its explicit/implied risks while trying to secure alternative energy sources at the same time to compensate for the reduction in the total energy supply. The currently available alternatives include existing thermal power generation that uses energy sources that are expected to deplete in the near future or new and renewable energy-based power generation, which still offers quite a low level of efficiency but that is able to provide power indefinitely [
2,
3,
4].
Another method that could increase the total amount of energy is to reduce the use of energy itself, which can be accomplished in many ways: either by suspending the supply, such as in the case of what North Korea often does, encouraging people to use types of anachronistic lighting sources such as candles, or persuading citizens to save energy according to their consciences by emphasizing the necessity of saving energy. Nevertheless, it is clear that these methods are incongruous in our modern society, where production and consumption are considered to be a crucial part of capitalism. Materializing the policies that go against people’s ideas and estimating their effectiveness requires deep considerations, which can be summarized as “How do we establish or use policies or methods that do not contradict the spirit of capitalism, produce energy that can be minimized for use, and improve the inefficiency of the entire process of power generation, distribution, and consumption to supply just enough power to where it is required?”.
Compared to non-renewable energy-based power generation, it is not easy to determine power generation capacity for photovoltaic power generation accurately, as a number of conditions that are required in our modern society have to be satisfied: balancing out power demand and supply optimally, determining how much energy is needed in power generation system where supply should always exceed demand, and estimating the exact demand. Additionally, following the direction of the 4th industrial revolution, the range of determinants that has to be expected to predict the variables affecting the demand and demand itself will be increased, and the computation load for this is increasing rapidly as well. This means that the range of available data is continuously increasing and that the form of such data is expanding from structured data into unstructured data. Among the several types of unstructured data, a series of text-type data, which people read, understand, and use for simple reasons, was extracted from Internet news to determine their relationship with power demands in an attempt to propose an advanced power production mechanism.
The core of this paper is the prediction of electricity demand and new renewable energy production. Predicting power demand allows you to plan how much power you need to supply, and a more accurate forecast would lower your power reserve ratio. However, reducing the power reserve ratio increases the risk of blackouts, which is a situation that must be avoided by the power supplier. On the other hand, by increasing the power reserve ratio, the risk of blackout may be lowered, but the remaining power is either discarded or stored with the anticipation of some loss. It cannot be denied that the need to avoid a blackout is far more important than having to deal with a loss in the stored power, but a situation in which a certain amount of power is wasted is also equally undesirable. For this reason, the need to forecast the demand for electricity accurately is the most sought-after solution. If the amount of electricity supplied can be correlated to the production of new renewable energy, then the waste of electricity can be dramatically reduced. Therefore, this research was conducted in the direction of predicting the demand for electricity and the production of new renewable energy by using big data whilst dealing with it in one power system and maintaining the stability of the power supply but avoiding wastage of power at the same time.
This paper suggests a direction to solve the problem of connection between the existing power grid and the new renewable energy grid, which can be said to be an inefficient part of the current power generation/supply system, by improving the prediction accuracy of new renewable energy production and by proposing a method to improve the accuracy of electricity demand forecasting using big data.
Through this, it will be possible to minimize the amount of reserve power produced for the safety of the power supply, to reduce unnecessary energy waste, and to minimize the production losses of new renewable energy that occurs through a storage process such as ESS.
2. Related Work
In the midst of the 4th industrial revolution, modern society is moving further from connecting individuals to establishing a connection with “things” so that humans are faced with the data of movement from existing clear and manageable forms of energy into unlimited forms of energy, which largely increase the range of available data. Such continuously expanding data are now called “big data”, collectively.
Big data refers to large 1-dimensional data that is often generated from applying loose limitations to available data and includes structured data existing in the form of hypertext markup language (HTML), extensible markup language (XML), R studio, Python, or weblog; semi-structured data such as metadata or schema; and unstructured data, which take the form of text, audio, or video. Such big data are considered to be an extended resource that has suitable applications for advanced IT/ICT technologies and services. Big data have been largely expanded recently due to an increase in the total data volume and the diversification of data types so that an efficient and rapid database processing method has become a requirement.
In the case of ESS, energy conversion efficiency is about 90%, and in the case of pumped-storage hydroelectricity, the Yecheon Pumped Storage Power Plant, whose construction was completed in 2011, shows an energy conversion efficiency of about 84%. ESS has a disadvantage, as the energy storage capacity is small and the installation cost is high compared to the storage amount, but it has the advantage of being able to provide energy demand and supply sites closer to each other and is not affected by topographical characteristics.
On the other hand, in the case of pumped-storage hydroelectricity, the initial installation cost is high, the conversion efficiency is lower than that of ESS, and the distance between the locations where energy is stored and where it is consumed are located far away from each other. The advantage here is economic proficiency due to the extended lifespan of ESS equipment, which is much farther ahead. Regardless of the methodology, the fact is that the most efficient approach is to minimize the storage of energy as much as possible. In the case of coal power generation, coal is burned and converted into electrical energy. Electrical energy is difficult to store as it is. When this energy is converted into a storable form of energy and then back to electrical energy, approximately 10 to 20 percent of the energy is converted into an energy form that is not useful for human use, such as thermal energy. This energy conversion is unnecessary and should be avoided if possible. A simple way to avoid this would be to eliminate the production of unnecessary energy altogether. This is achievable through accurate calculations of the required amount of energy. The objective would be to only generate the required amount of energy that is necessary and to totally consume the amount of energy that is generated so that unnecessary conversion can be eliminated. However, in the case of electric energy, this objective is far from easy to achieve.
The difficulty of achieving this objective lies in the vastly differing energy consumption needs of varying people in differing industries depending on external and internal needs. In light of this difficulty, an estimation within a certain range of how much energy would be consumed is still possible.
This paper presents a method of minimizing energy storage systems such as ESS or pumped-water power generation. This can be summarized in two main ways. The first is to increase the accuracy of forecasting electricity demand. The second is to minimize the storage process of ESS or pumped-water power generation by fusing the electricity produced by new renewable energy with the existing power grid. This paper explains the possibility of incorporation into the existing power grid through the method of predicting the production of new and new renewable energy.
2.1. The Necessity of Big Data for Prediction of Power Demands
The number of samples that would produce a statistically meaningful result is considered to be 100 [
4,
5] so that the results obtained for samples exceeding this number will be treated in the same way, whereas a group of monitoring data collected from 100 PV systems is assumed to be less significant, and therefore, each system should be analyzed independently. Wider confidence levels and higher risk of errors in hypothesis testing can be expected with small sample sizes [
2].
The DuraMAT [
6], IEA PVPS Task 13 [
7], BDPV [
8], Sonnenertrag [
9], and PVOutput [
10] big data servers and NREL’s PV Fleet Performance Data Initiative [
11] were set up in addition to EARL PV’s big data bank to analyze and evaluate the performance of the 100,000 PV systems constructed in the U.S. [
12]. Similar studies for global PV systems were conducted [
13,
14,
15,
16], including some of the European systems [
17,
18,
19]. The performance evaluation results obtained by analyzing a huge volume of datasets in those data banks displayed a global picture of the PV systems around the world, especially for small-sized PV installations that are for residential use [
2].
These days, a huge volume of data is continuously stored in data banks at very short time intervals in a variety of formats, which require more efficient data technology to process, analyze, and retrieve some useful information to assist corporate management in making decisions [
20,
21,
22,
23]. In today’s business environment, such data require real-time-based analysis, as the old data often do not reflect current situations. There are some research papers that deal with big data for PV operation and maintenance [
23,
24,
25,
26], PV-battery operation optimization [
27,
28], and image processing [
29,
30], processes that usually generate a huge volume of data. The key role of [
24] is to provide an idea for the infrastructure that manages the big data generated from PV systems. A typical infrastructure comprises data acquisition, processing, storage, monitoring, and analysis stages. Reviews for research works on data acquisition and management, modeling, diagnosis, and output forecasting are presented in [
24] and describe the contributions made by AI and data mining when pinpointing the PV system components that do not work properly or system flaws. Then, the PV forecasting models are categorized into three types [
3].
Meanwhile, a proposal for a distributed system that stores a large volume of data or big data generated from a PV system or a weather station is presented in [
26], where efficient data storage and analysis processes are described along with a HBase database and were employed to perform data analysis and day-ahead forecasting based on ANN. The performance of the forecasting algorithm is analyzed on a 24 h basis (structured) or a specific hour (non-structured) basis.
Big data analytics and machine-learning techniques for the monitoring and control of a complex energy production systems such as PV systems are described in [
31], where their weight on output forecasting function is considered. Due to the complicated system structure, a large volume of data flows in from the sensors or is generated from cloud computing and/or by ever-advancing transmission and communication techniques. Ref. [
32] deals with current big data technologies and studies their applicability to energy management systems where a series of issues concerning big data have yet to be solved. As the sensors used in power generation systems are becoming much more sophisticated, the volume of data that they can acquire is increasing as well, providing a better ground for decision-making, often leading to financial benefits. As mentioned earlier, big data technologies can be useful for forecasting, as they offer efficient methods of data extraction/reduction or distributed learning [
33]. The assessment of the big data analytics applications to power generation systems is presented in [
34].
Based on the architectures, model types, and methodologies, the authors classified big data analytics for the power generation systems. Their recent research works have also dealt with a deep-learning algorithm for a time series big data (2-years-worth of datasets) in a feed-forward neural network, which was used to forecast the outputs of the PV system in Australia. The algorithm’s high performance was verified by the accuracy of the forecasting results [
35].
At the same time, decision trees and gradient boosted trees, and random forests, were used to forecast Spanish power consumption and Australian PV power generation levels. Machine-learning and Spark data processing were applied to these tasks. Comparisons were made between the forecasting results obtained with ensemble models and artificial neural network, deep-learning, and pattern sequence-based forecasting results, which exhibited superiority over the previously mentioned methods [
36]. Meanwhile, an interesting big data-based forecasting algorithm using nearest neighbors was also proposed in [
37], where the algorithm was written for a distributed computing system adopting Spark. Then, the algorithm was tested against a large dataset generated from the aforementioned Spanish power consumption record. Several big data solutions for handling big datasets for forecasting power consumption [
38,
39] and demand response management [
3,
40] have been proposed as well.
Earlier, the idea that data becomes information when a certain meaning has been given to it was defined. Similarly, such news can be used by people as information that has some significance, but its usage usually ends up in simply delivering information between individuals. A collection of these data can be regarded as big data because by extracting a series of data relevant to electric power and analyzing their relationships, it will be possible to estimate future power demands. Thus, this paper attempts to generate power demand information by defining each news article with a symbol mentioned earlier and by forming a meaning by combing them [
41,
42].
If the relationship between energy and information is as such, then it is possible to consider electric power as a sort of energy that can be utilized to satisfy human needs and desires, with data having some meaningful relationship, which also means that such needs or desires have a certain relationship with the use of power and that such a relationship determines the demand [
43].
The initial cost of energy production through nuclear generation may be relatively low, but considering the costs involved in the management of nuclear waste and the future burden of risk that humans will have to bear, it can never be considered cheap. Eliminating nuclear plants is one of the few surest directions that humans have, and alternative energy sources can be divided into two options: existing limited energy sources and renewable ones. However, in the former case, a stable supply cannot be guaranteed due to geographic bias or global political struggles so that the countries such as the ROK, who do not have many deposits of natural resources remain disadvantaged in the energy market. Unlimited renewable energies such as solar rays or wind can be alternatives, as they are less biased and are more difficult to monopolize, making them free from environmental contamination and other associate risks.
Nevertheless, renewable energies also have demerits. That is, they often cannot balance out supply and demand. For example, the amount of power generated by solar generation will vary between day and night or will change depending on the weather (e.g., foggy or rainy day). It is difficult to control power consumption according to such variables, so if the demands can be predicted to a certain degree of accuracy, power can be supplied steadily by taking additional measures when the energy produced with renewable energy is not enough to meet the demand. That being said, the task of estimating future demands is quite difficult, and when the demand is over-estimated, it is be possible to prevent some of the worst cases such as blackouts, but it is difficult to efficiently store all of the generated power, inevitably wasting some of it. This goes against the principles of capitalism, as the energy itself is considered capital. In contrast, if less power has been produced based on inaccurate forecasting, then there is potential for the worst-case scenario of not being able to supply power to where it is really needed, sometimes resulting in a blackout situation, which must be avoided in today’s industrialized world.
In the case of nuclear power, it has the advantage of being inexpensive and useful under the premise that it is well managed. However, the advantage of being cheap is limited to the production processes of nuclear power plants. Nuclear power generation produces electrical energy and nuclear waste. Nuclear waste must be managed very carefully over a long period of time.
In the Republic of Korea, in the case of low–intermediate-level radioactive waste, a low–intermediate-level radioactive waste repository has been completed and is currently operational in in Gyeongju, and “high-level waste” is temporarily stored in the nuclear power plant [
44,
45,
46,
47]. The treatment of such nuclear waste incurs significant costs, and nuclear energy production costs are not cheap when these costs are included. Even if the premises of good management is followed, due to force majeure events that humans cannot handle, such as natural disasters, the probability of the worst-case situation is inherent. In particular, if those premises are violated, then the risks are incomparable to anything else.
The current trend in the electric power industry is to reduce the scale of nuclear generation due to its potential risks so that the shortage is often covered with other energy sources such as new and renewable energies, especially solar energy. However, due to the inherent limitations of solar energy, its range of fluctuation in energy production makes it difficult to utilize such solar energy-based power generation at full scale. To surmount this problem, the use of an energy storage system (ESS) to store surplus energy or other energy sources in parallel can be considered, but still, an accurate prediction of future energy demands is still required. Until now, the demand forecast has been made based on correlations between weather temperature and demand, but past blackout incidents have raised doubt about these methods. Therefore, it is essential to avoid the worst-case scenarios, such as blackout or wasting energy, due to overproduction.
2.2. Contribution
There are some limitations in the utilization of currently available energies that can be classified into several types based on their sources. Electricity or electrical energy has been preferred by human society due to its controllability and applicability. Electricity is an indispensable part of our modern society, but it can only be utilized further if it can be stored cost-effectively for later use. Energy is often lost during power production, transmission, and storage processes, reducing cost-efficiency. The seasonal characteristics of the ROK’s weather are not favorable for photovoltaic power generation. That is, although the hot and humid summer season with intense sunlight can help photovoltaic power generation systems to actively produce electricity, a month-long rainy period with typhoons reduces its efficiency at the same time. Additionally, the dry and cold winter season with occasional heavy snow is a negative factor for the system to produce electricity at a constant rate, making it difficult to schedule or to forecast the production level. The fluctuations or insufficiency in power generation can be compensated by adding another type of generation method that uses new and renewable (non-renewable) energy resources. The use of a game theory-based approach is useful for such a production mechanism whose main objective is to generate electricity steadily and to avoid any power interruptions.
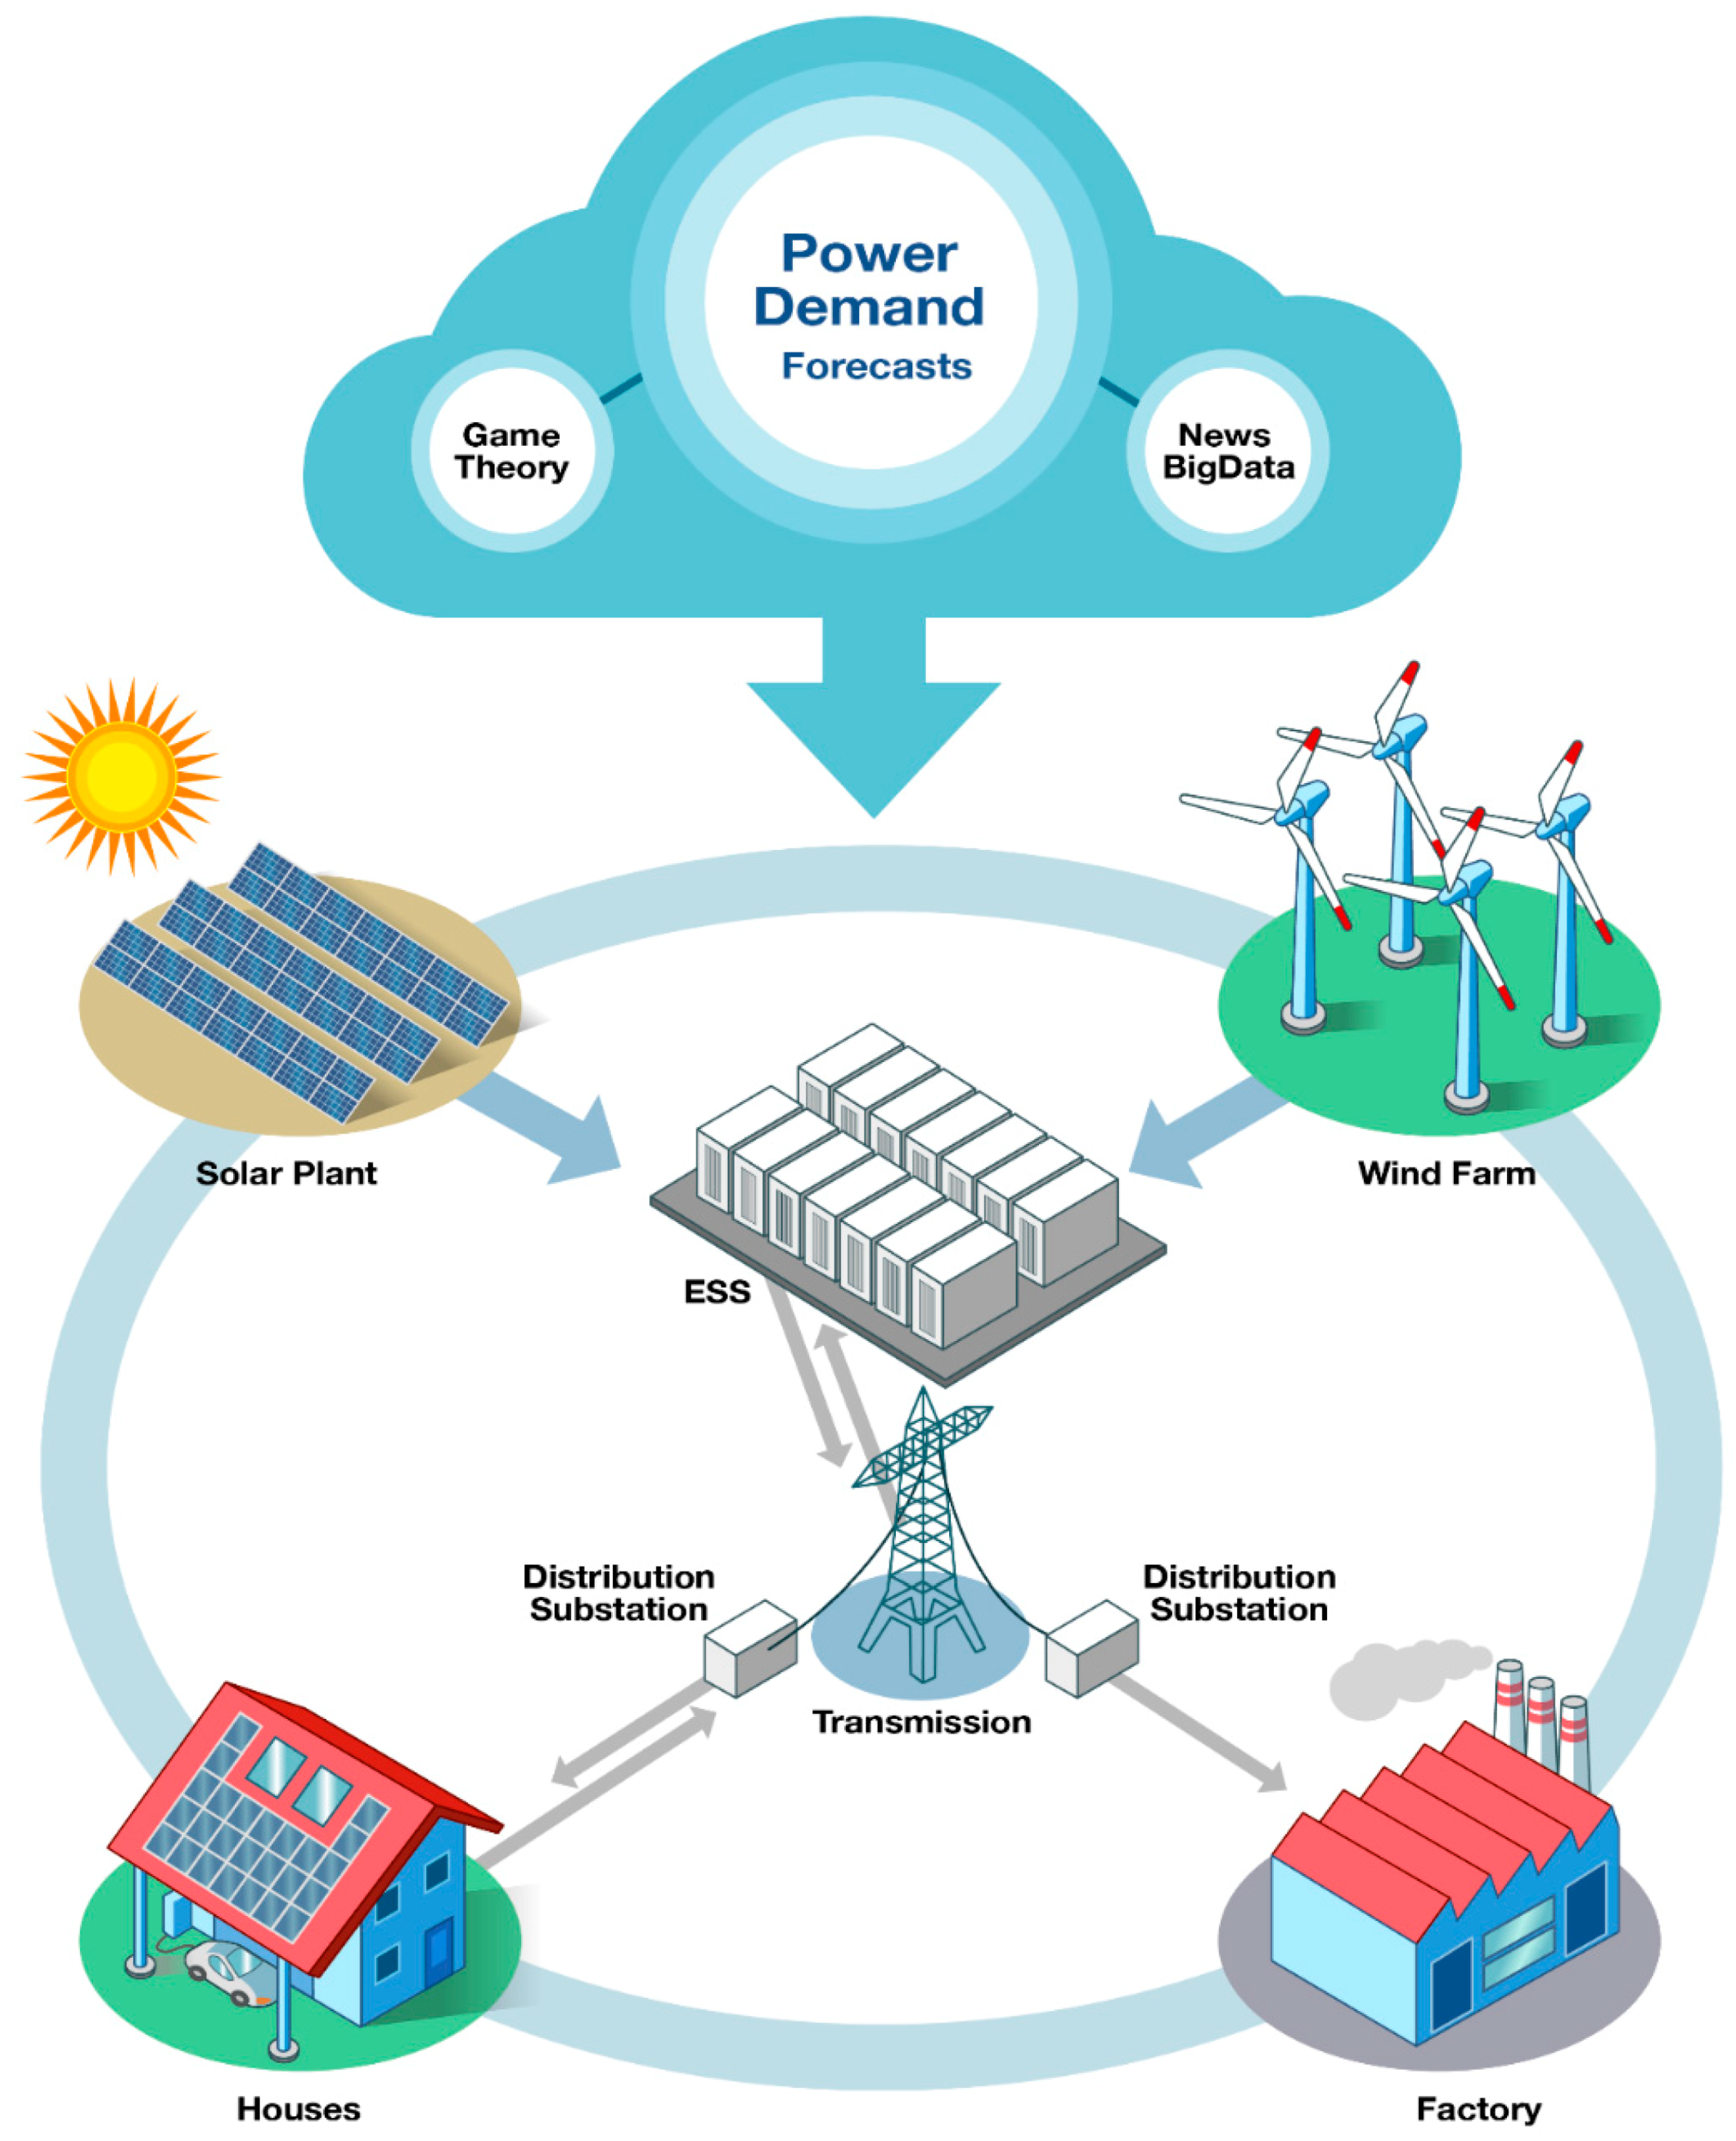
Figure 1 shows a graphical abstract of flexible and balanced electric power production-big data virtualization based on a photovoltaic power plant.
Thus, this paper focuses on finding correlations between text-form data (unstructured), which are data found in online news articles, and the power demand of the time needed to forecast the future demand. Considering the relationship factors between temperature and demand has been a basic and common step in forecasting tasks, but they alone cannot guarantee accuracy. The correlations identified in this research based on both structured and unstructured data can provide a virtualization solution to this problem. All of these factors and correlations were applied in the process of developing a more efficient and accurate power production model based on game theory.
3. Game-Theoretical Expression of Scenarios of Power Production: Focusing on Photovoltaic Power Plant
Game theory explains the existence of strategic mutual dependency when a player’s benefit or payoff is also affected by another performer’s behavior that is not limited to his/her own actions. Under such dependency, it reasonable to decide one’s own action after predicting the opponent’s actions first. Game theory is described in a paper examining the benefit of decision-making followed by a prediction of the results of this decisions under this specific environment [
48].
The game theory can be largely divided into two categories: simultaneous and sequential games. The former is one that is played without having any information about the opponent’s actions, such as the game of rock-paper-scissors, whereas the latter is played after acquiring information on which decision the player makes. When establishing a scenario for optimizing power supply using a power production method based on a renewable energy source or a non-renewable energy source, itis possible to consider that the scenario would be of a sequential game, as the communications involving the individual node’s power production information are not conducted simultaneously but because the information about each node’s action can only be recognized only after it has arrived, and since the player will not be able to know the information until then, it is appropriate to regard the scenario as a simultaneous game.
Therefore, nuclear energy would be valued as a suboptimal solution in a situation where the level of research for renewable energy is low, but it is difficult to postulate that this train of thought would be permanent. Developing a technology to the extent where the risks due to nuclear energy production can be completely negligible is not considered to be impossible. However, at the present development timeframe for such a technology when compared with the commercialization of new renewable energy (especially solar power), the expectation is that it would be significantly delayed, as so much capital investment into new renewable energy is being undertaken. Therefore, the present paper was developed by focusing on the integration of new and renewable energy into the existing power grid.
Figure 2 shows a description of power production situations based on a renewable/non-renewable energy source as an extensive-form game.
Figure 3 shows a description of power production situations based on a renewable/non-renewable energy source as a normal-form game.
The players playing their respective roles in the game, their strategies, and the payoff for each strategy are the key components in depicting a game.
Although a number of nodes (number of players I = {1, 2, …, N}) are required when establishing a home network due to the characteristics of ZigBee, the number is limited to two in this case for the briefness, clarity, and readability in describing the game. The strategy set of each player is Si = {1, 2, 3,..., K}, ∀i⊆I, and the term “strategies”, when used here refers to all of the possible actions the player can take. The two types of nodes that represent the different types of power production sources (i.e., power production source based on either a renewable energy source or a non-renewable energy source) are the players, and they both have two kinds of strategies: producing a sufficient amount of power, or vice versa. After defining the strategy sets of all of the players, the individual strategy space is defined, which can be expressed as Π (i = 1~N) Si. Each pair of strategies selected by each player is called a strategy set, which can be represented as a vector (1XN), and such vectors represented as a payoff matrix in the above normal game. In the function πi: S→R, the payoff is a quantified representation of the payoff to be provided to the player, which can be represented as a payoff matrix, as shown in
Figure 3.
There can be four power production cases for these two nodes. Let us designate the non-renewable (renewable) energy-based power production as A (B) and the ordered pair of their strategies as {A [sufficient], B [sufficient]}. This means that both A and B are trying to avoid the worst-case scenario of a blackout, and their strategies correspond to the two “Avoid”, and the payoff is 3,3, as shown in the normal game. Even though the risk of blackout has been reduced by their strategies, it is still preferable to avoid such a situation, as the surplus power may be wasted due to the inefficiency in storing the power itself. In the case of {A [sufficient], B [insufficient]} or {A [insufficient], B [sufficient]}, the production is balanced and corresponds to the Nash equilibrium in the scenario [
49].
Finally, the scenario involving {A [insufficient], B [insufficient]} corresponds to the two “Go Straight” options, with a payoff of 1,1, which corresponds to the worst-case situation of a blackout.
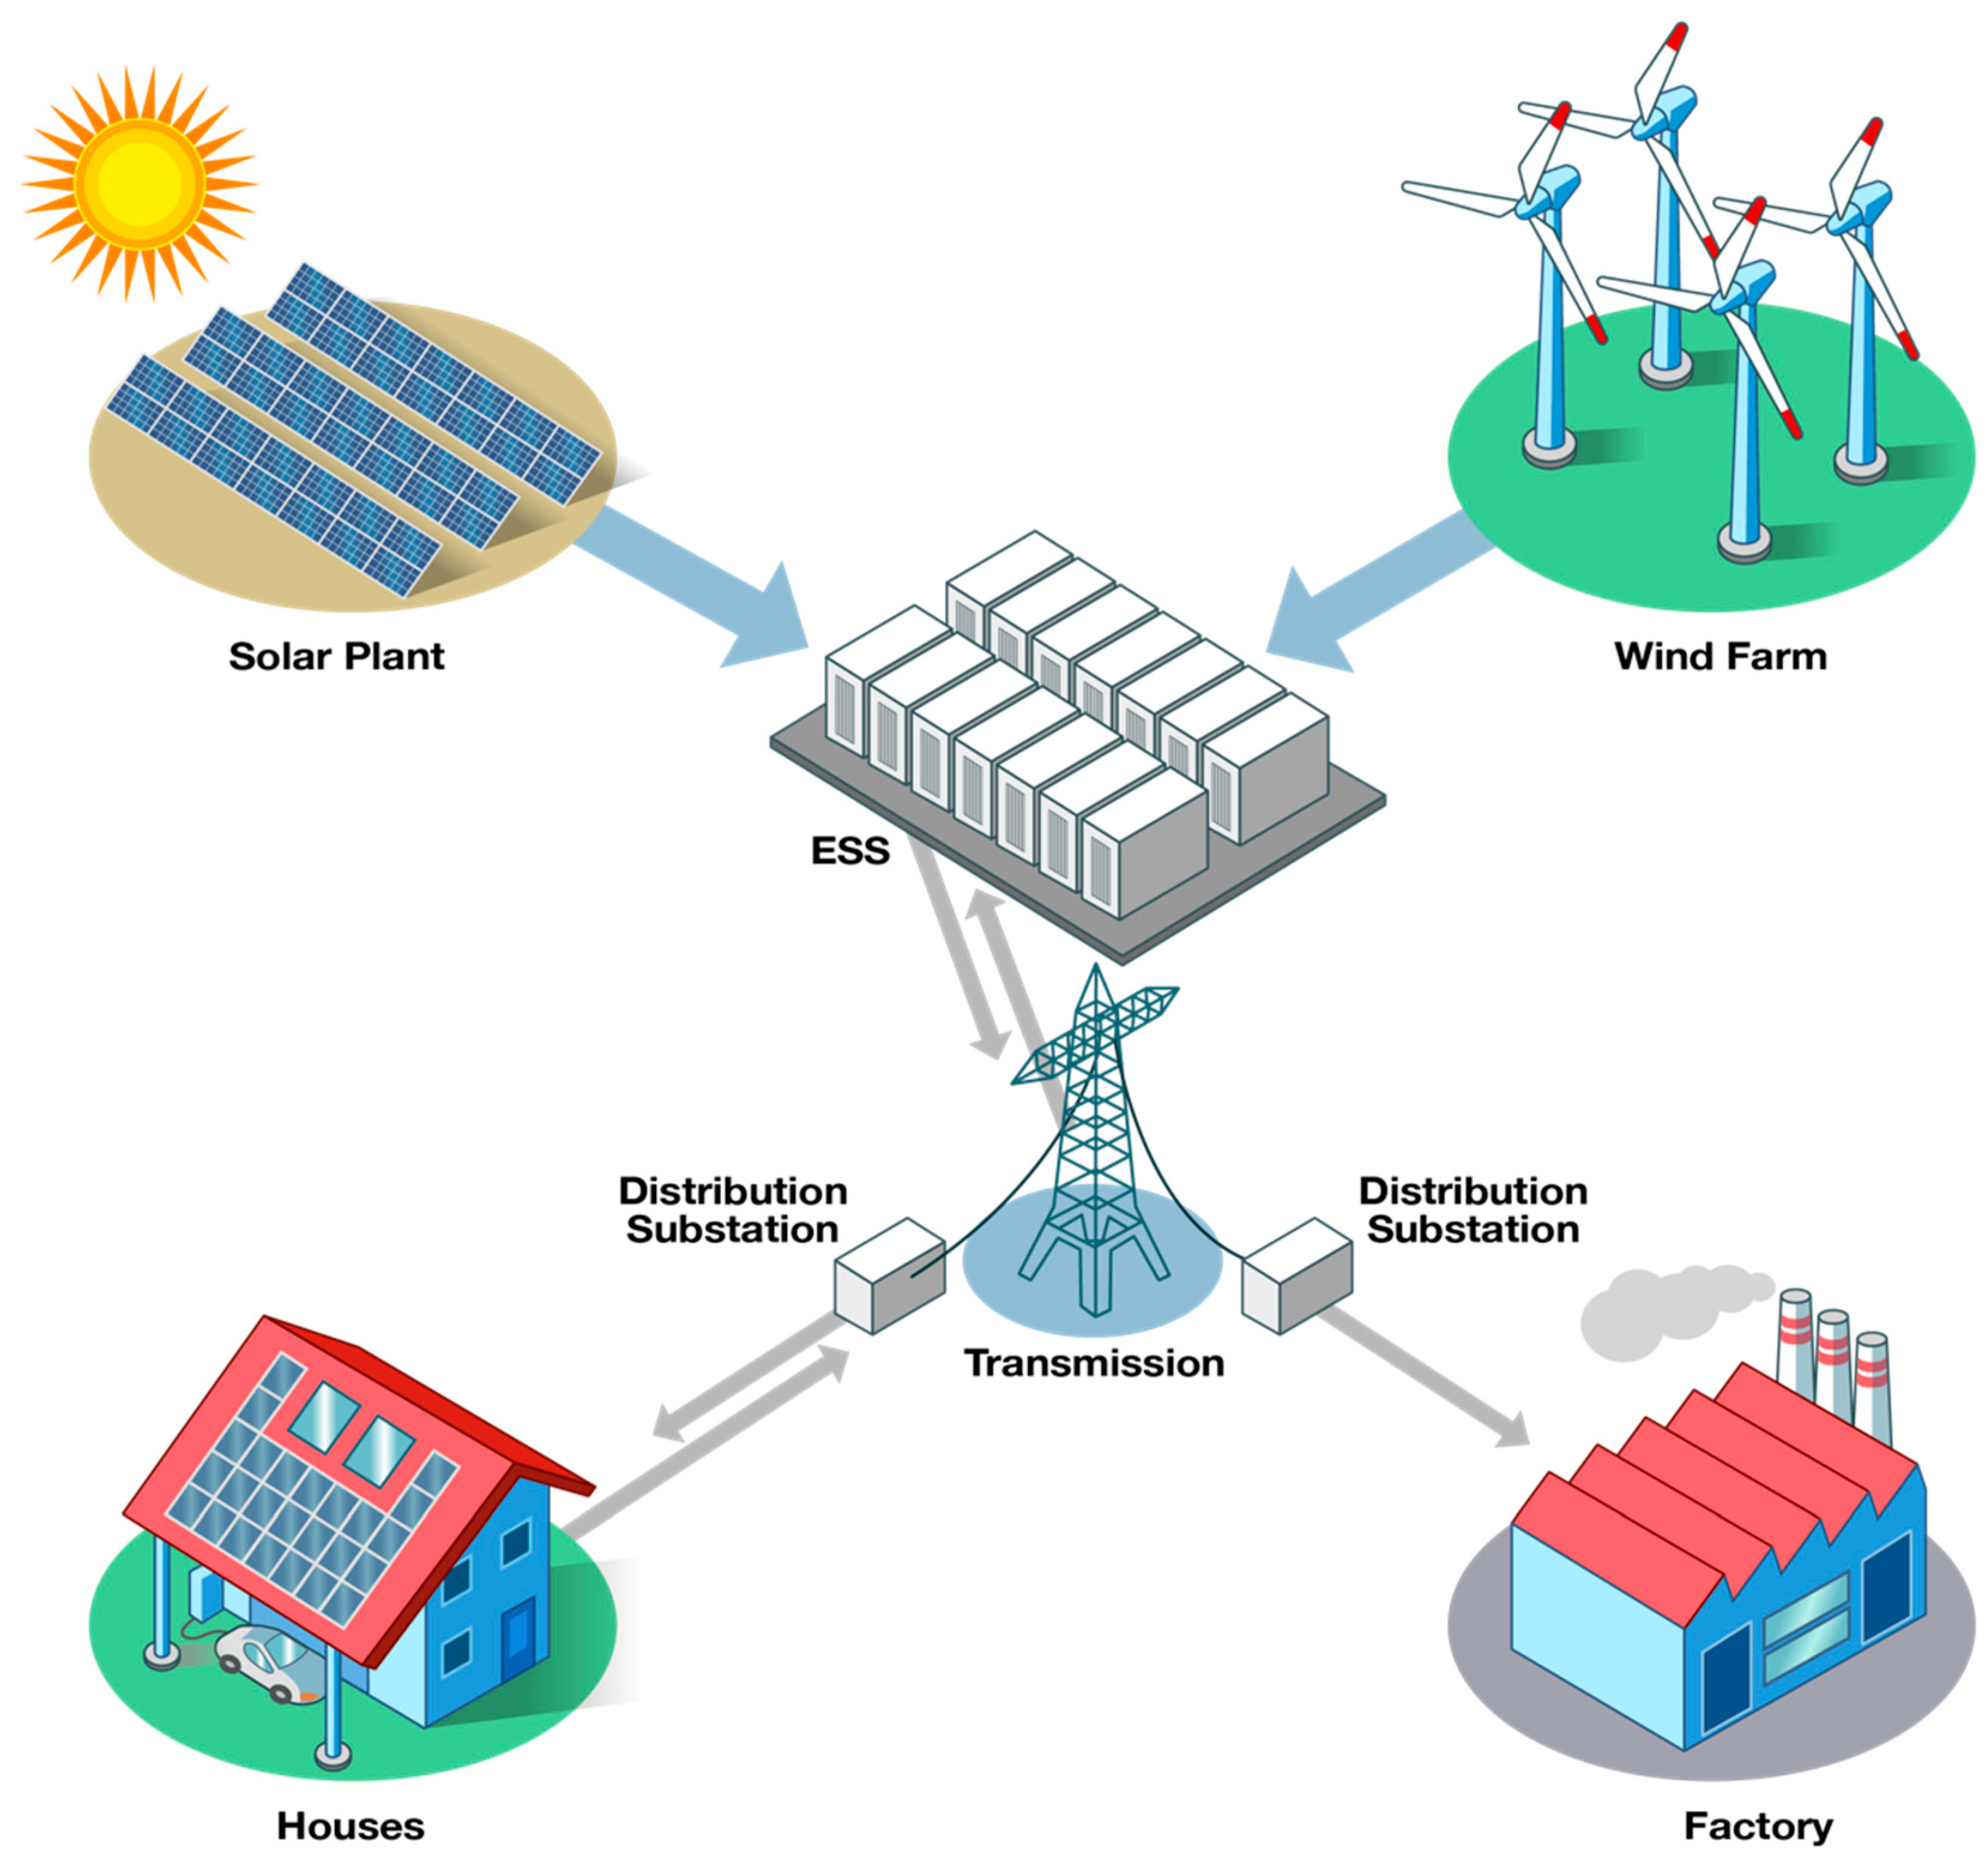
Figure 4 shows a power grid based on renewable energies.
To put it plainly, an energy storage system (ESS) is one that aims to improve the efficiency of power use by storing the produced energy in a battery beforehand to supply it when it is needed, similar to a pumped storage power system where water is pumped up when there is enough power to transform electric energy into potential energy. This system prevents power shortages and plays a key role in commercializing new and renewable energies such as solar or wind energy. However, these two types of energies, in particular, are often largely influenced by natural conditions or geographical conditions so that it is difficult to maintain a continuous supply due to the fluctuating power output. Additionally, there can be a time gap between the point of power production and the need, which interrupts a stable supply of energy and the popularization of new and renewable energies. Due to the seasonal characteristics of the Korean peninsula, there are some negative elements in the use of these energies: the distinctive four seasons have their own individual clear changes. There is a cycle of three cold days and four warm days or yellow dust in spring and a long rainy season is typical in the summer, whereas the autumn and winter seasons often present clear skies and severe cold, respectively. Among the different weather conditions seen throughout the year, the rainy season in the summer can be disastrous for the use of renewable energies, as such a season or typhoons do not satisfy the environmental requirements for producing enough energy [
50].
Such instability caused by the largely fluctuating output of solar generation is not easy to overcome, as such a fluctuation is influenced by environmental conditions that cannot be completely controlled by today’s technology. Therefore, if it is possible to predict future demands instead, some other measures (e.g., increasing thermal power generation, etc.) can be devised to overcome this problem.
Use of Unstructured Data
Unstructured data are data that are not structured or patterned, so it is a quite difficult task to extract useful information from the huge amount of data shared on the Internet based on a certain relationship. Additionally, there are cases where the answers can be obtained by one’s own insight into data rather than from the data itself, or new insights are gained through analysis [
51].
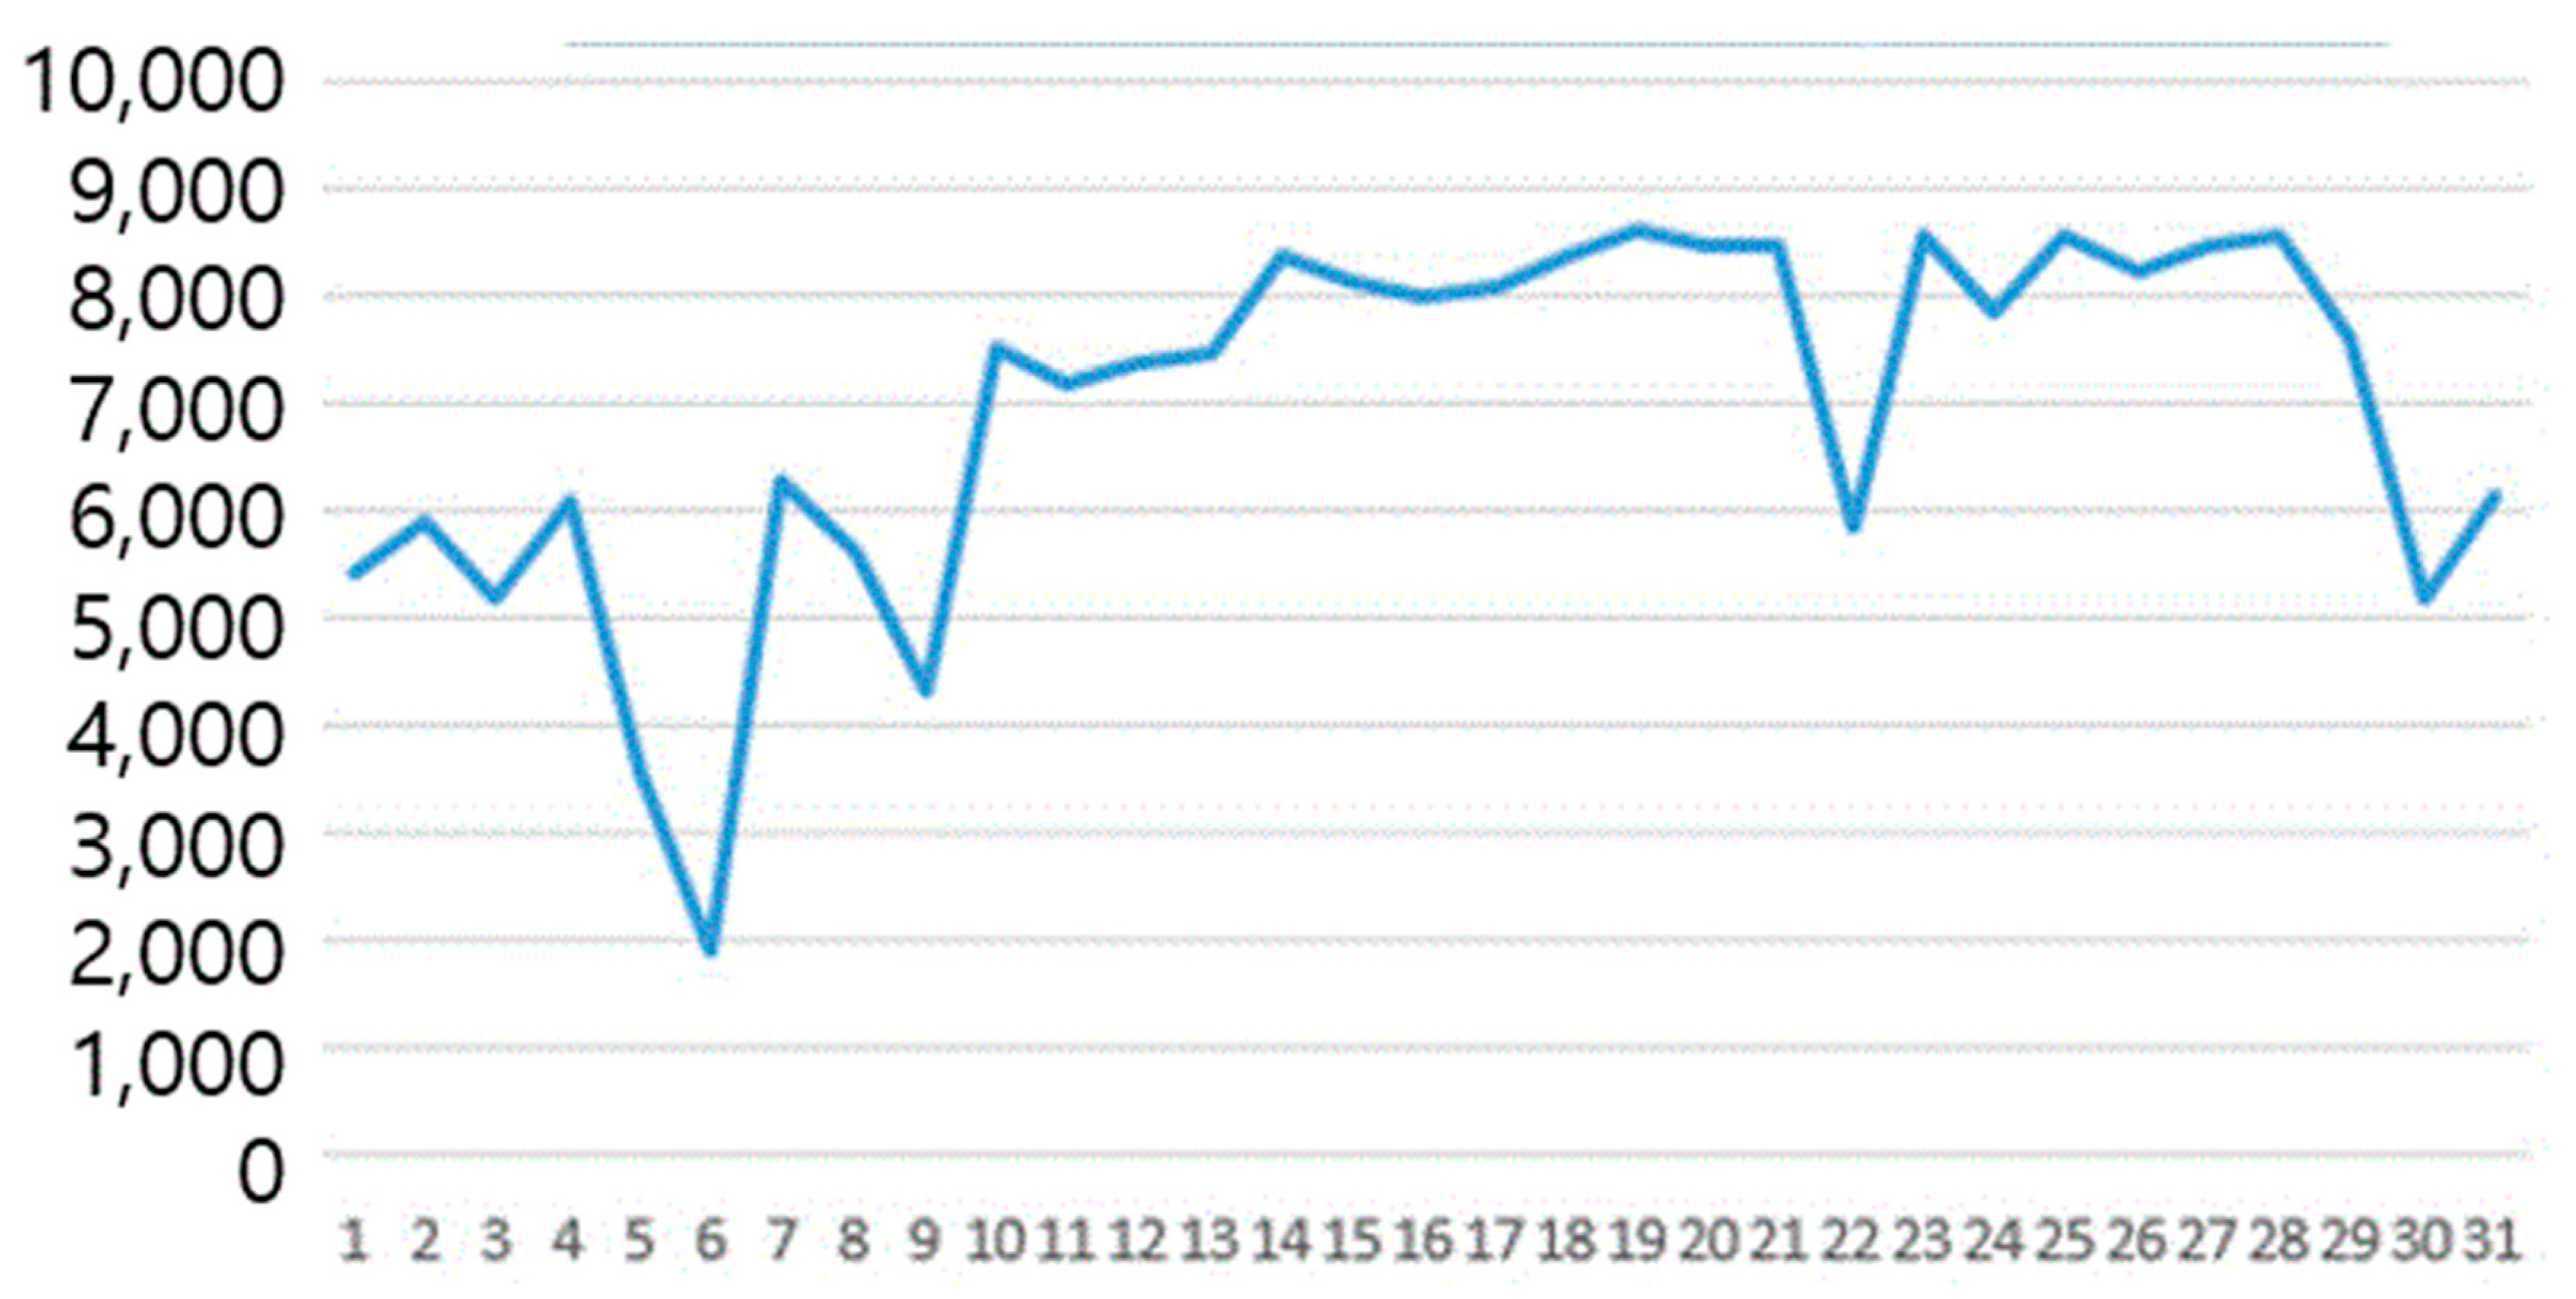
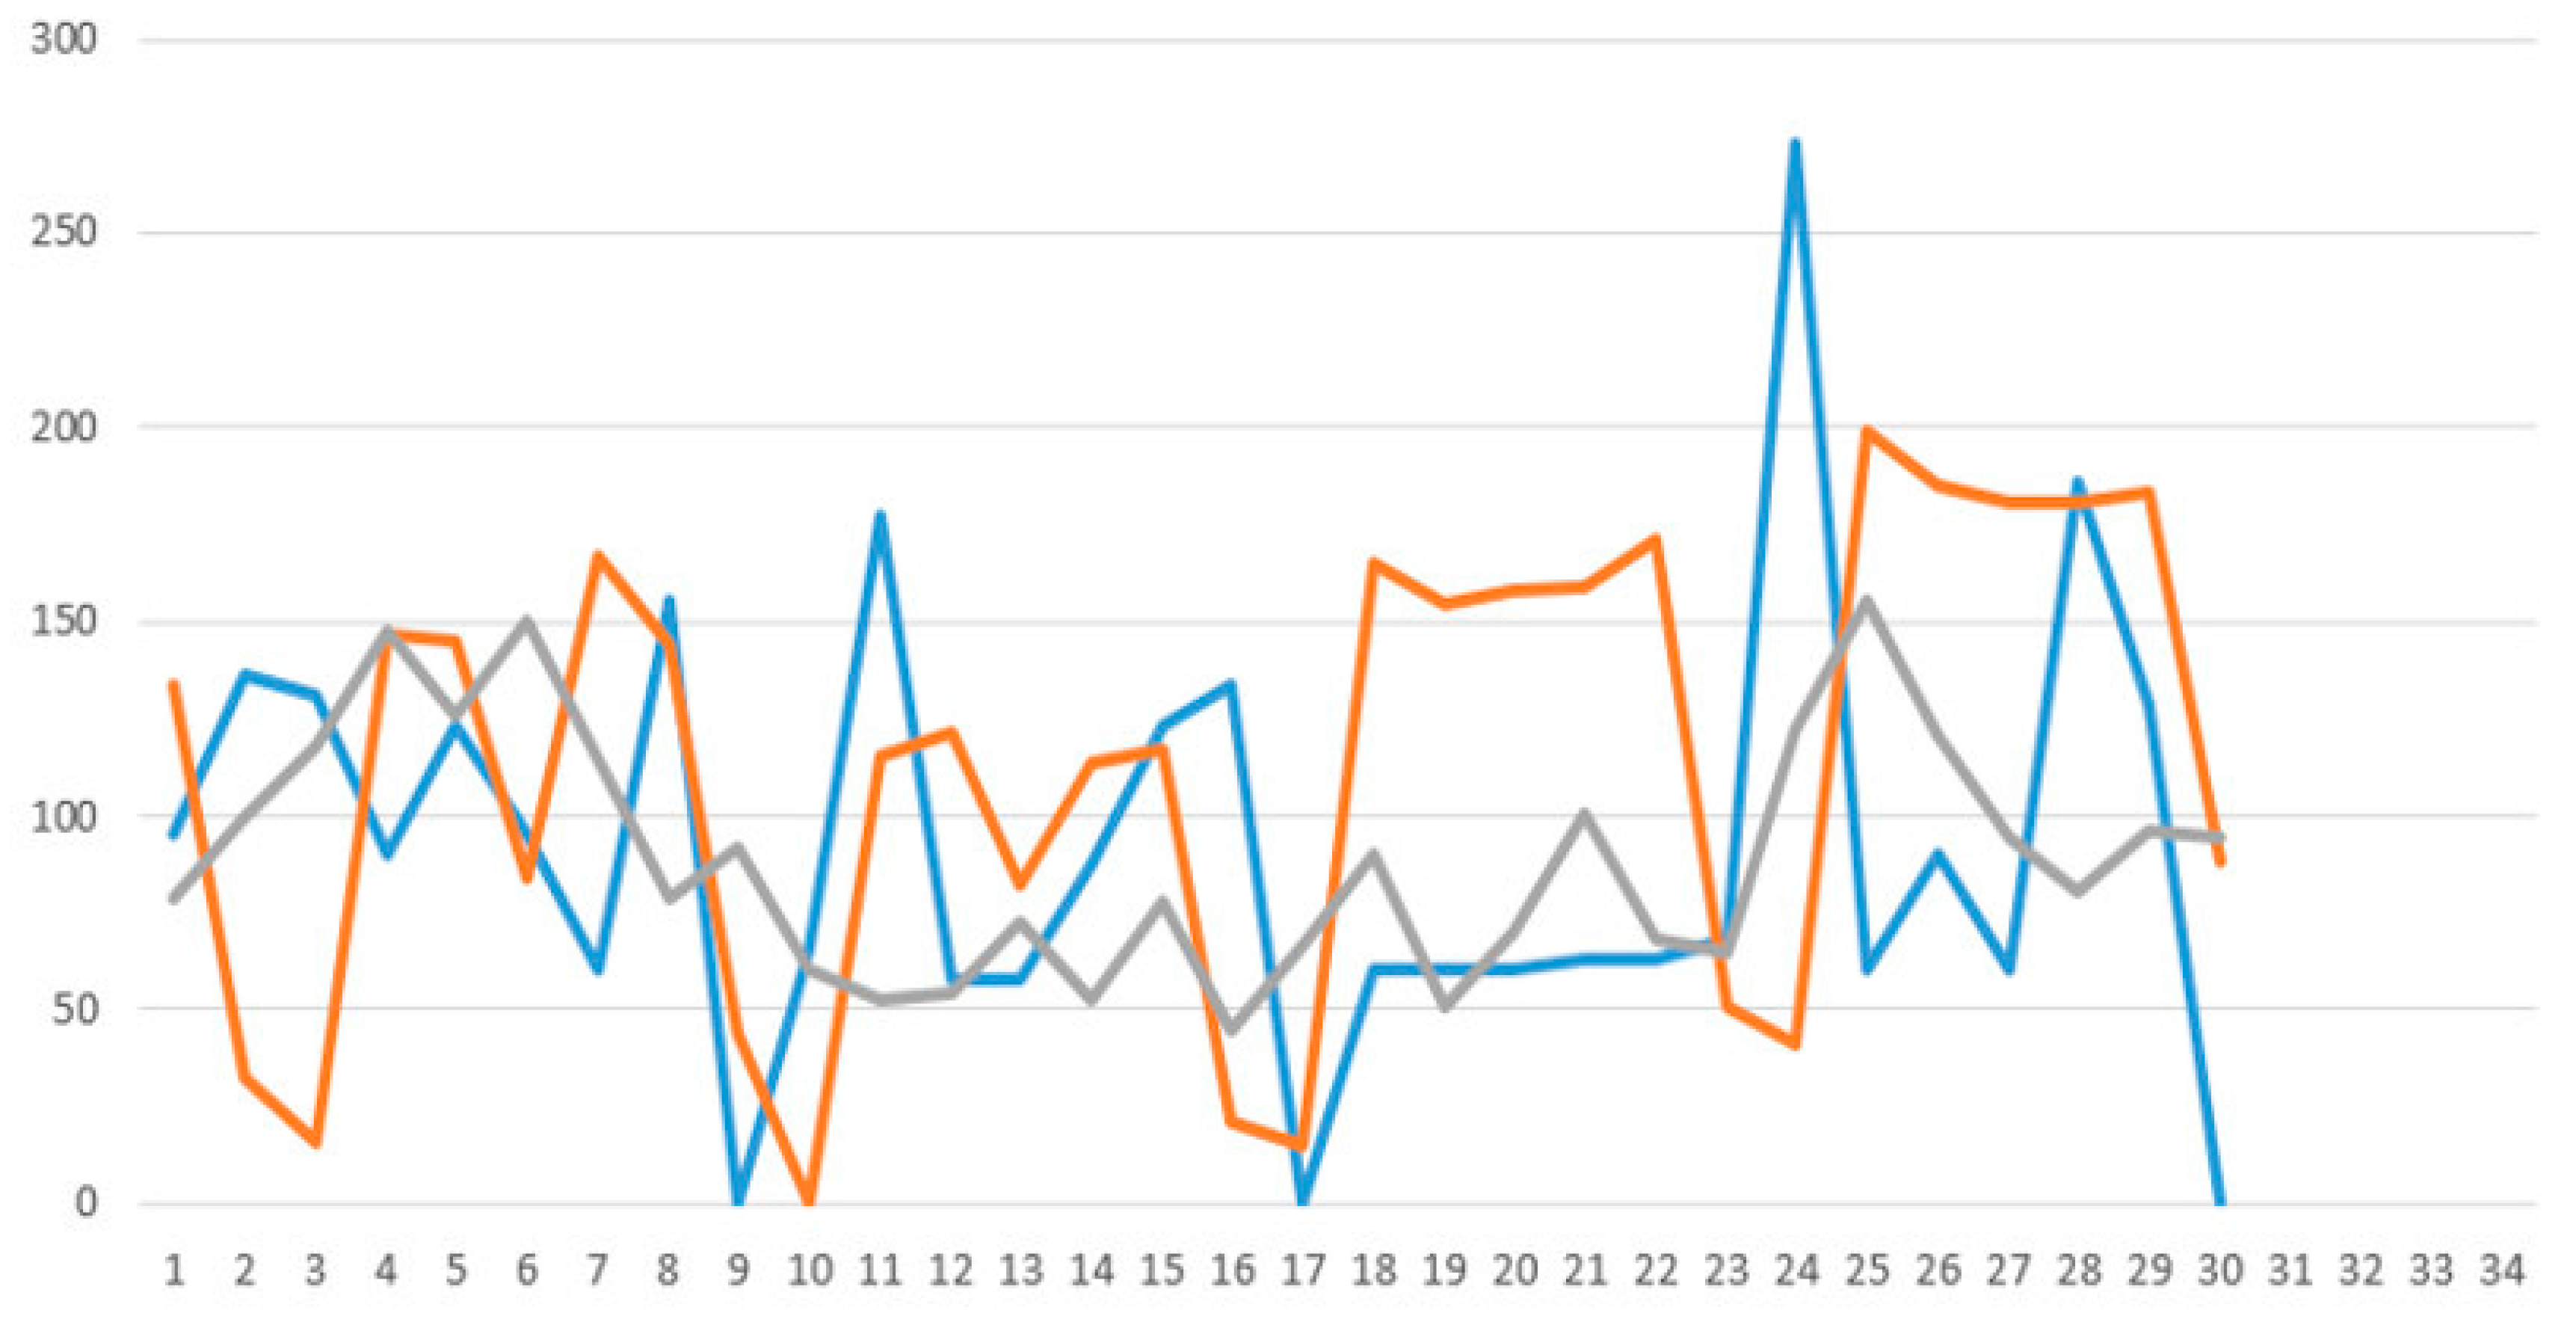
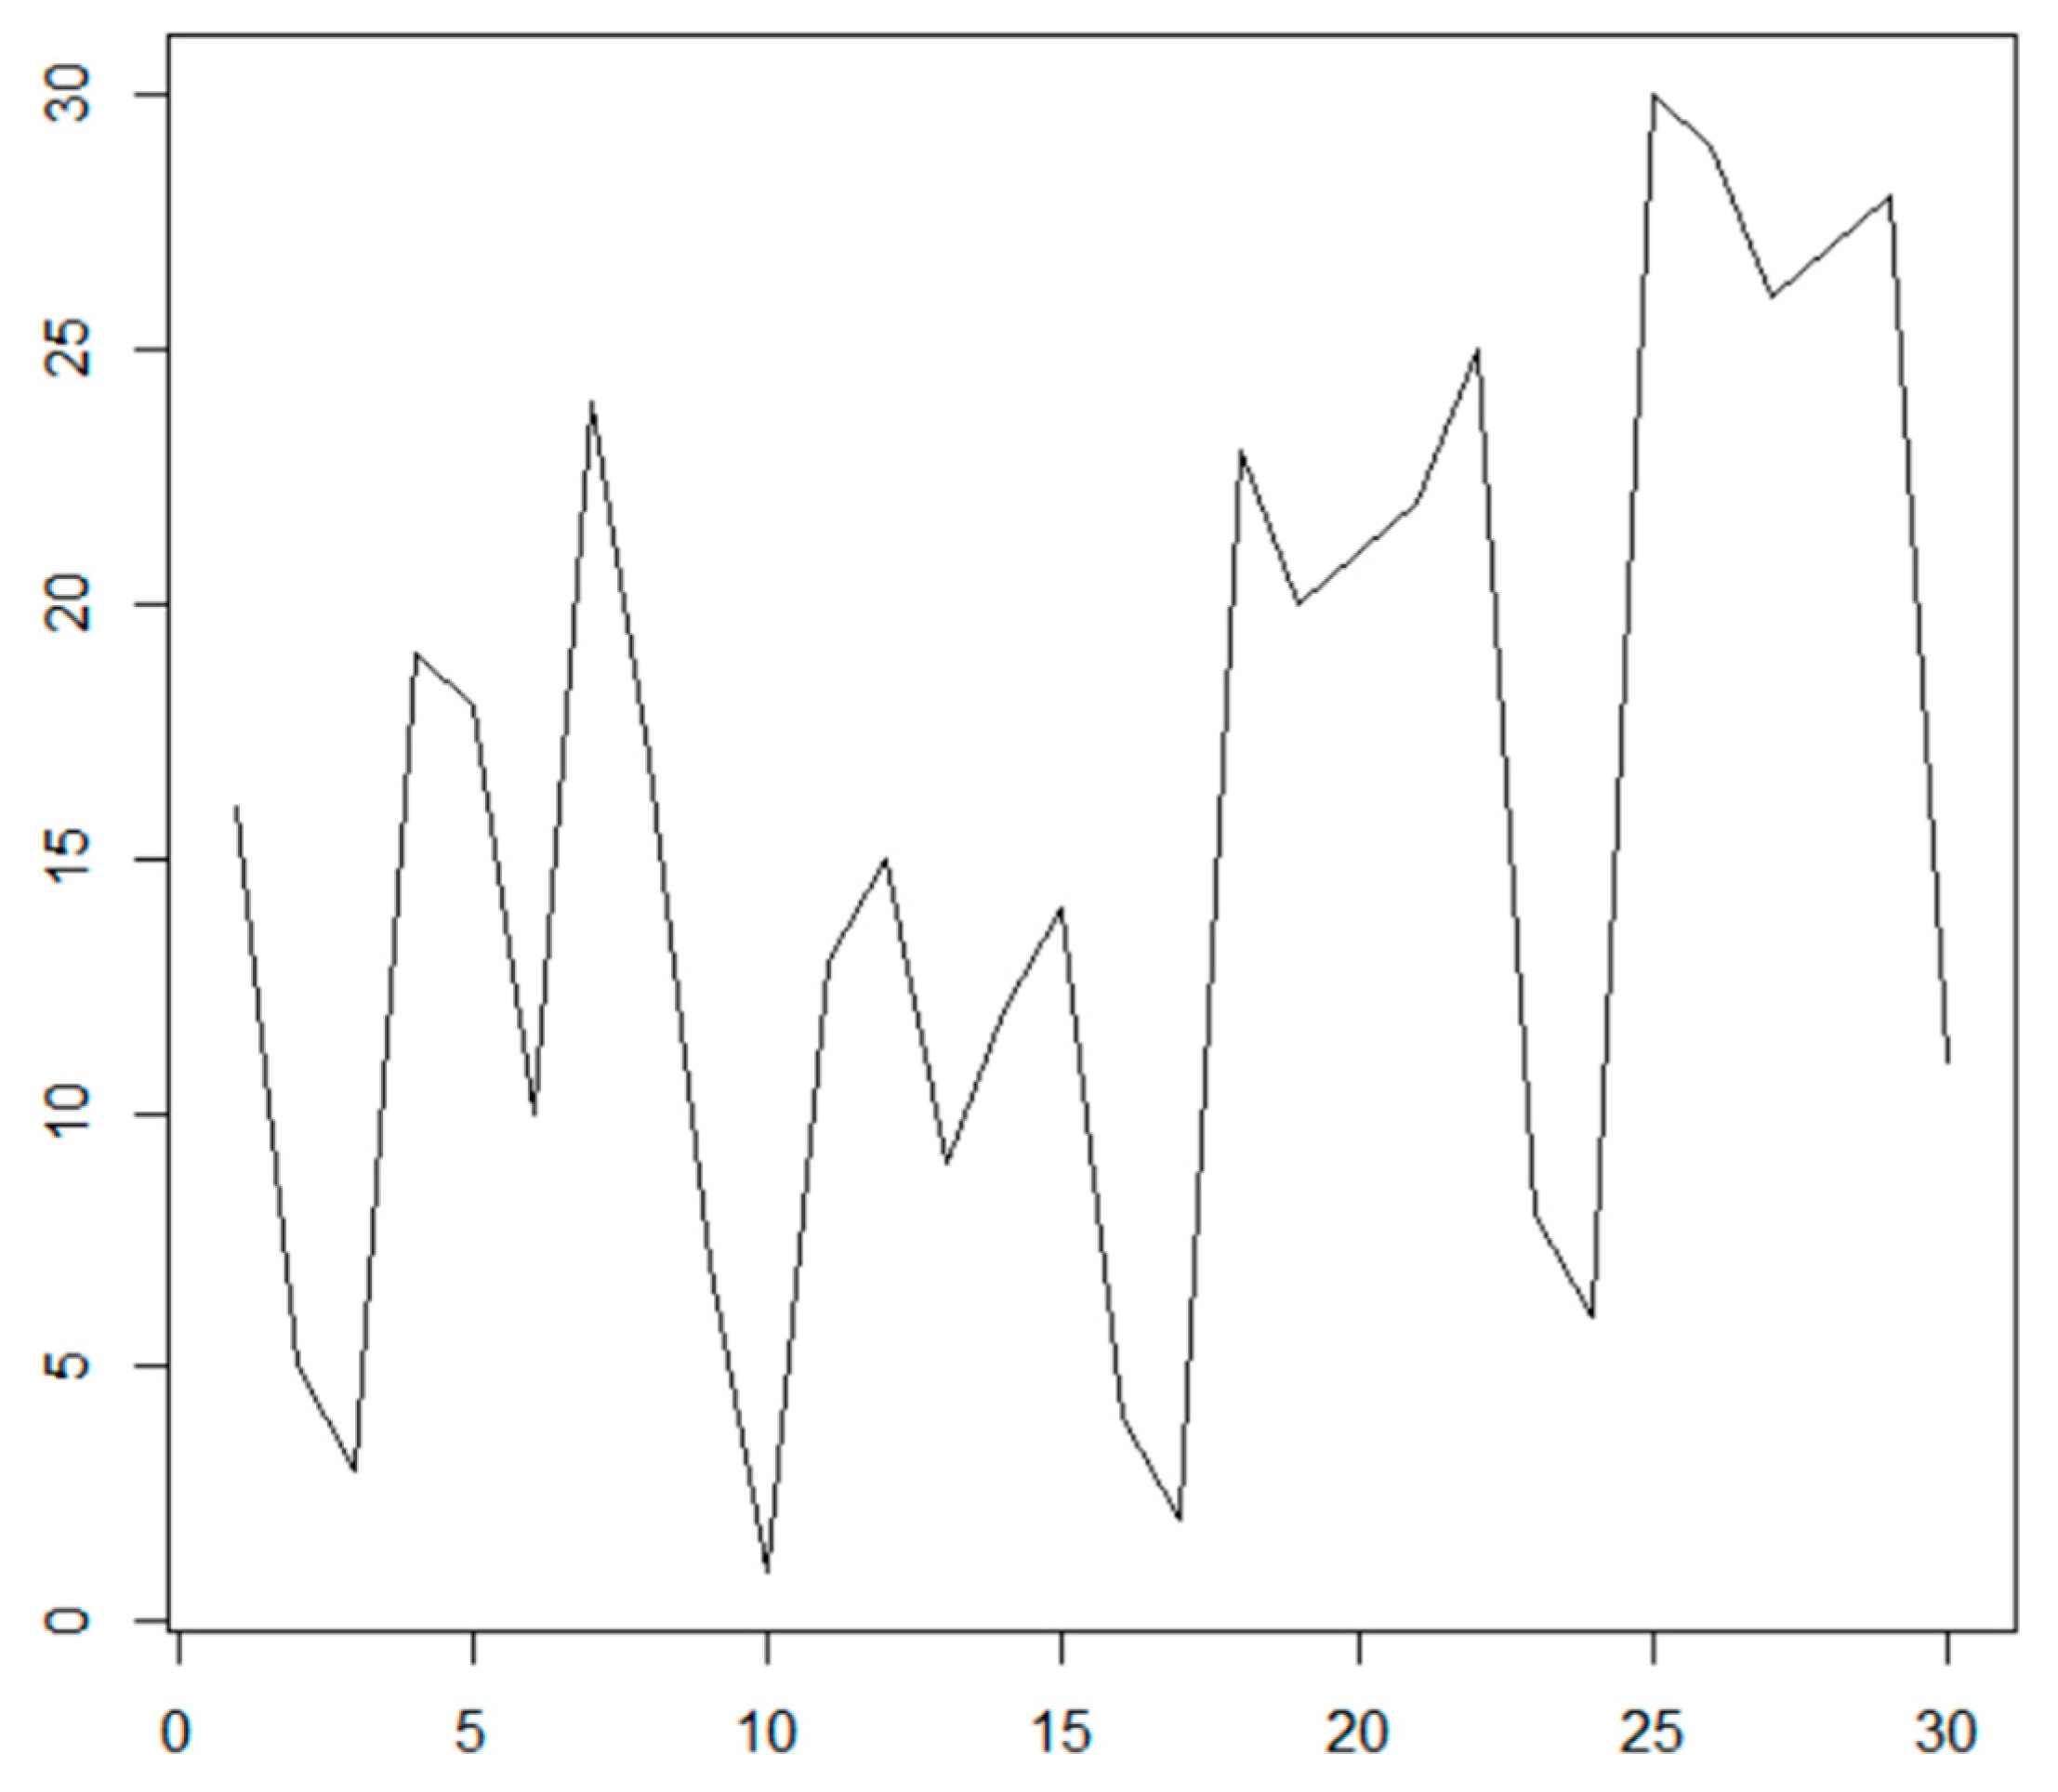
Figure 5 shows the daily maximum power demand (June 2018). Additionally,
Figure 6 shows the daily search frequency for “intense heat” (June 2018) on the Korea EPSIS Electricity Statistics Information System/June 2018 Electricity Consumption/MW [
52].
(Daily maximum power demand
N/maximum power demand in June) ∗ 100
(N = daily maximum power demand, Max (N) = the maximum value among N values, M = search frequency of ‘intense heat’).
Therefore,
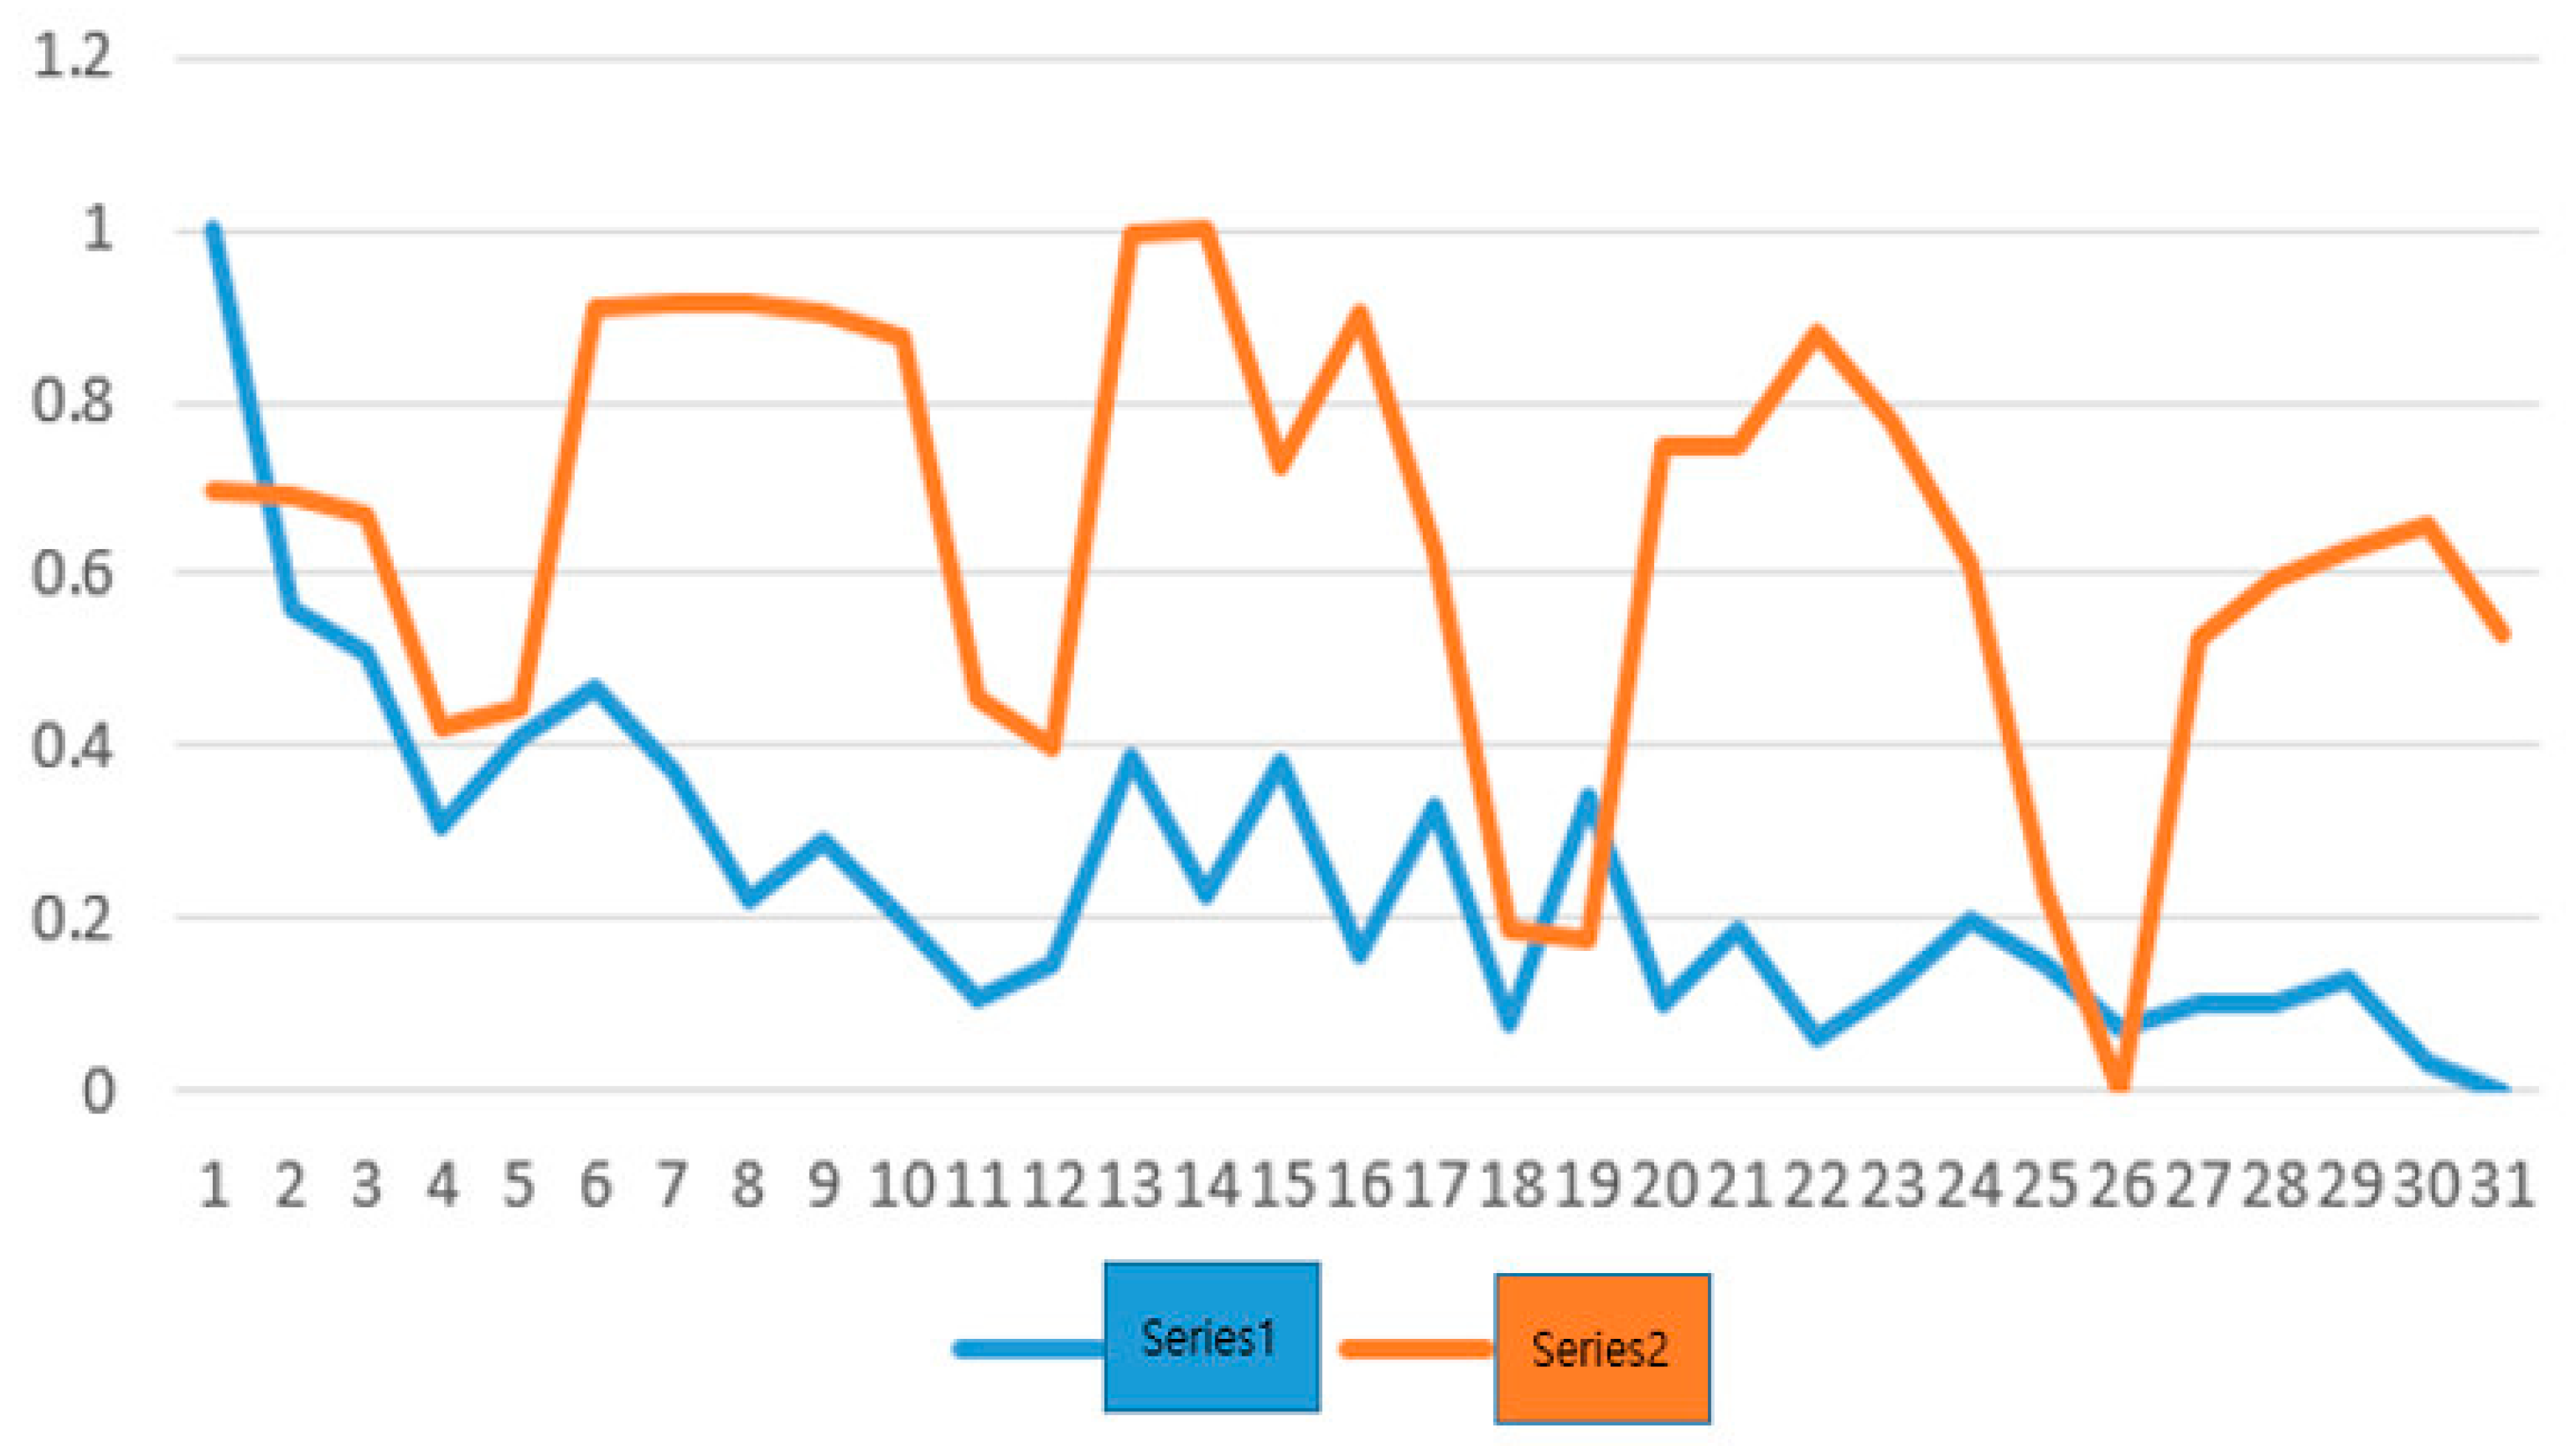
and
are the respective values of series 1 and 2, which were obtained by comparing the search frequency of “intense heat” and the daily maximum power demand according to a scale.
Figure 7 shows the daily search frequency for “intense heat” (June 2018). Additionally,
Figure 8 shows the Yeongam Photovoltaic Power Plant Power generation information for June 2018.
The weather conditions in June of 2018 can be described as follows: It was rainy in the southern provinces and in Jejudo on the 5th, from the 10th to the 11th, and the 19th under the influence of a trough or atmospheric pressure, whereas the central region experienced rain from the 9th to the 10th and the 14th to the 15th due to a northern trough, but the regional difference was small, as was the amount of precipitation. There was a significant relationship between power demand and rain during this month. There was light rain around the Gangwon and Yeongdong areas that took place from the 9th to the 16th due to east winds and atmospheric instability under the influence of the high pressure occurring in the East Sea, but from the 11th to the 13th, there was a small amount of showers around the inland regions due to atmospheric instability caused by the cold air positioned above our country. Further, it rained from the 19th (Jejudo island at ROK) to the 26th (southern and central regions at ROK due to the seasonal rain front. It was possible to confirm that the power demand decreased on the rainy days of June.
It is also possible to confirm that the power demand during the rainy days of June 2018 reduced significantly, as had solar power generation. This is due to the fact that people’s use of energy to maintain a pleasant environment becomes lower on rainy days, as the temperature is reduced on these days and because the efficiency of solar power generation drops, as cloudy and rainty days disrupt the solar rays that reach the earth’s surface [
53].
(N = daily maximum power demand, Max (N) = the maximum value among N values, M = search frequency of ‘intense heat’).
The respective values of Series 1 and 2, which were obtained by comparing the search frequency of “intense heat” and the daily maximum power demand according to a scale.
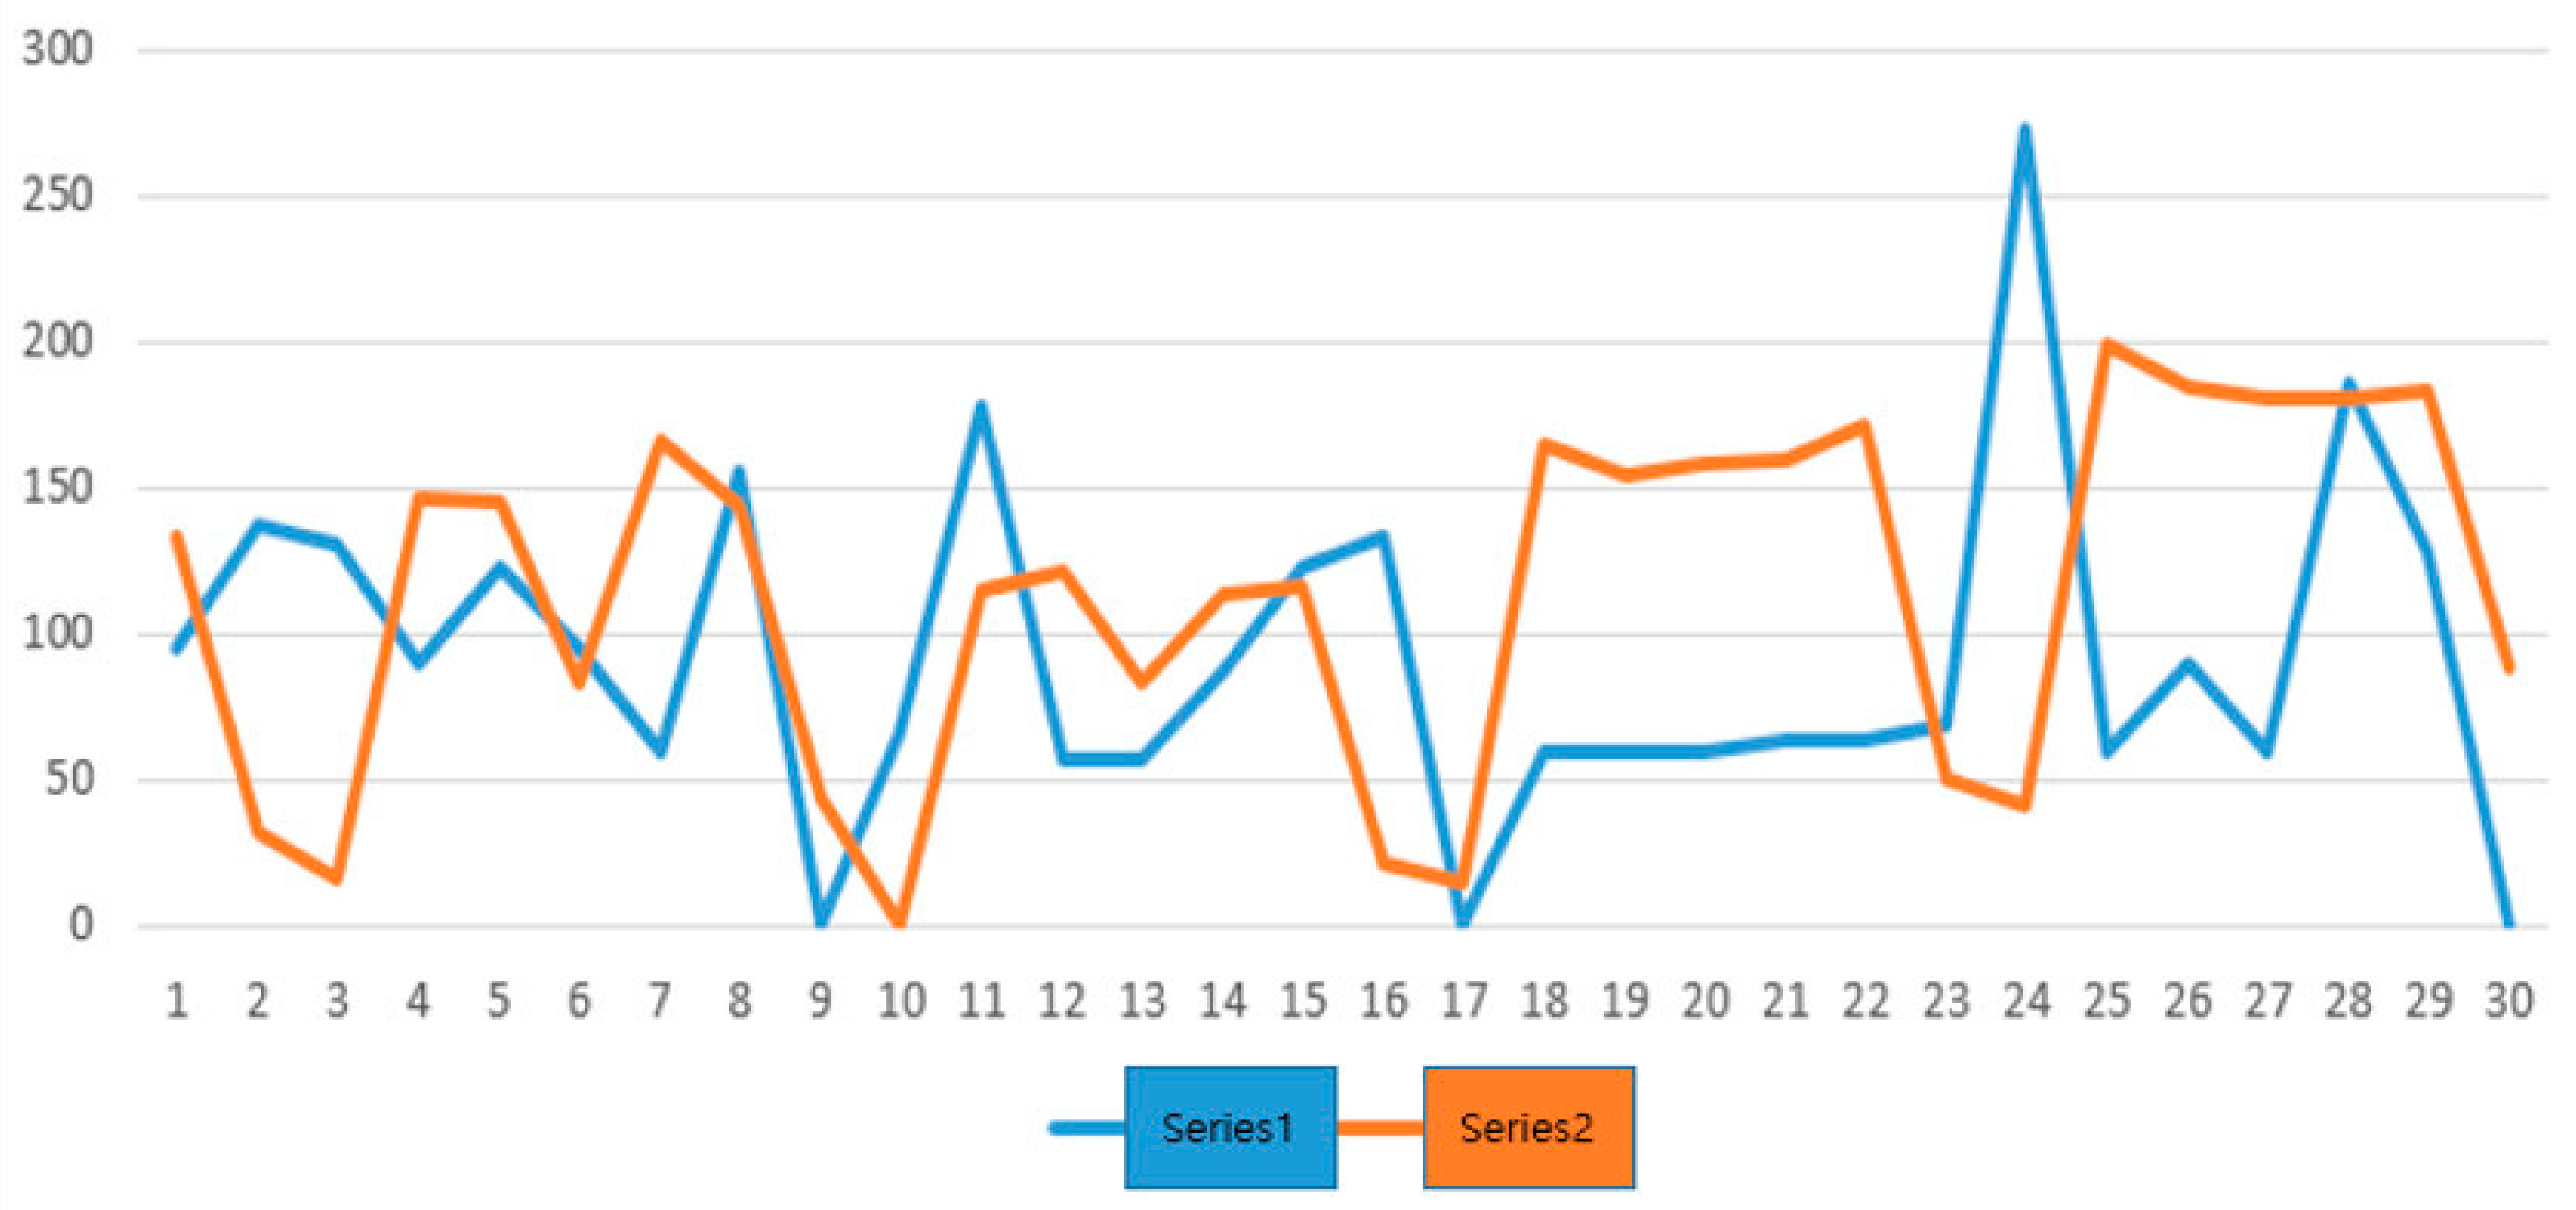
Figure 9 shows daily power demand and the search frequency for “intense heat” in July 2018.
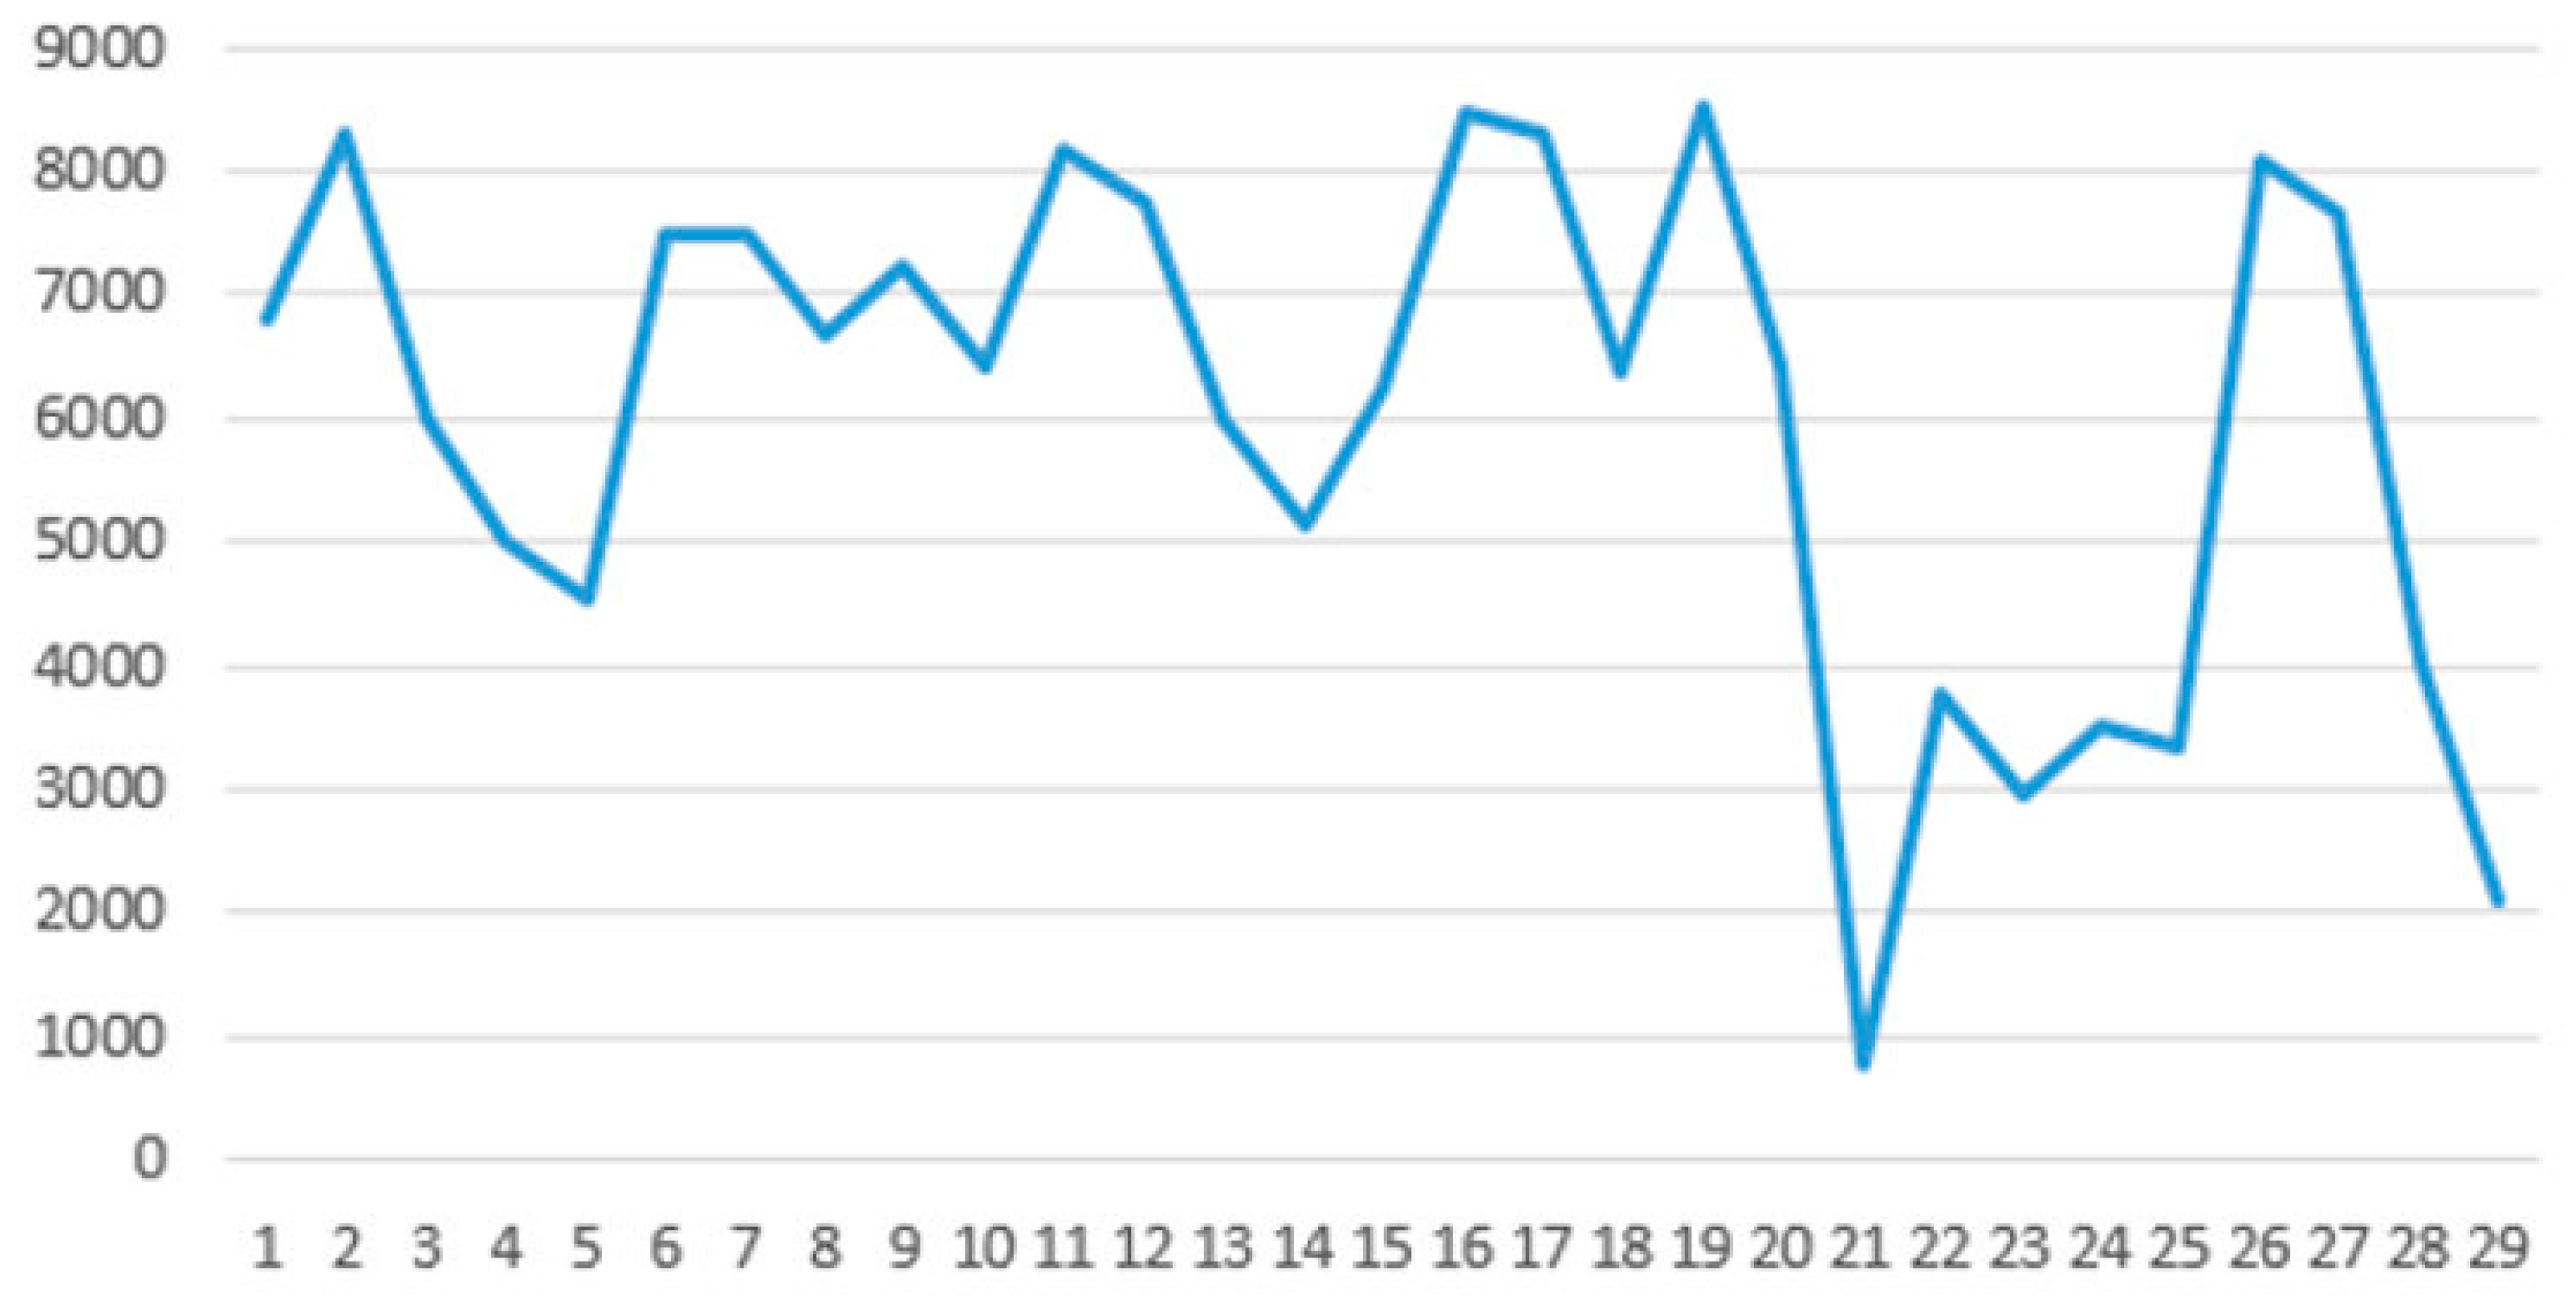
Figure 10 shows Yeongam Photovoltaic Power Plant Power generation in July 2018.
In the picture below, Series 1 refers to the frequency at which a particular word appears, whereas Series 2 indicates the power consumption of each corresponding year. The climate in July of 2018 was as follows: The average number of days experiencing intense heat and tropical nights in the capital area was 11.3 days (normally 1.6 days) and 9.3 days (normally 2.2 days), respectively, the second highest numbers since 1973.
Meanwhile, No. 10 typhoon Ampil moved to the north and weakened in People’s Republic of China on 24th, causing an inflow of hot vapor into the Korean peninsula, which increased the level of intense heat and expanded the range of tropical nights. In addition, an eastern air current flew into the peninsula due to the No. 12 typhoon Jongdari, which had been weakened in Japan, causing continuous intense heat and tropical nights in the capital area from the 29th to the 31st along with strong solar radiation and foehn wind.
Figure 11 shows the daily power demand and search frequency for “intense heat” in August 2018. Additionally,
Figure 12 shows Yeongam Photovoltaic Power Plant Power generation in August 2018. In terms of rainfall, the precipitation level increased due to the No. 7 typhoon Prapiroon, which moved north, and the seasonal rain front in early July, but the precipitation ended up being lower than average after the rainy season had ended, resulting in mostly sunny skies.
In the picture below, Series 1 refers to the frequency at which a particular word appears, whereas Series 2 indicates the power consumption of each corresponding year. The climate in July of 2018 was as follows: Under the extremely hot weather caused by the high pressure positioned near our country and the strong solar radiation in early August, the typhoon Jongdari, which had been weakened into a tropical low pressure system, renewed the daily maximum extreme temperature in the areas around the western regions as it passed from Japan to the southern part of Jejudo Island and joined with an eastern wind and topographic effect (foehn). After the No. 19 typhoon Soulik (22~24th) passed, solar radiation became weak, and the heat gradually diminished due to frequent rain under the influence of a stationary front formed near our country. The precipitation increased until mid-August due to easterly winds and atmospheric instability, but most areas, excluding the eastern seaboard, experienced less rainfall. There was a lot of rain in the latter part of August because of the typhoon arriving at the Korean peninsula and a stationary front causing a similar level of precipitation as before: the high pressure located at the north-eastern part caused an inflow of cool and humid eastern wind, causing a great deal of rainfall around the eastern seaboard areas during the early and mid-parts of August (1~15th), and at the same time, there were many inland rain showers due to strong atmospheric instability caused by the clash between the cool and humid air flowing in from the east-north high pressure system and the hot and humid air flowing in from the edge of the North Pacific high pressure system.
Affected by the typhoon Leepi (Rumbia), which weakened into a tropical low-pressure system, there was little rainfall during the period of 15~16 (20~21) in the eastern seaboard region (northern central) areas due to hot vapor. Then, from 2w to 24, No. 19 typhoon Soulik arrived near the Mokpo area after passing through the western sea and proceeded into the Chungbuk province and the southern part of the Gangwon province. There was a great deal of precipitation in the Jeonam province, Jejudo as well as in the areas around Jirisan and the Taebaek mountains. After Soulik passed through the peninsula, cold air was formed above the northern part of the country, while a narrow vapor tunnel running from south to north formed. This tunnel allowed the inflow of a large amount of vapor from the tropical low-pressure system positioned at the southern part of China, causing strong local precipitation and nationwide rainfall. Meanwhile, it was possible to confirm a large decrease in solar power generation during all of these weather conditions, starting from the 20th of August, supporting the facts mentioned above [
54].
Figure 13 shows daily power demand and search frequency for “intense heat” and “air conditioner” in August 2018.
The average values calculated between the search frequencies for “air conditioner” on Google, the average temperature fluctuations, and the maximum power consumption in June, July, and August had a significant relationship between them. Considering the relationship between rainfall and power demand that was mentioned earlier, the high temperature and humidity in the summer season in the ROK, which often impairs the quality of life, largely affect power demand and make it difficult to make a prediction. Air conditioners are a tool that can control such an environment, and the significant relationship between the search frequency for this piece of equipment and power demand reveals that humans are beings that seek well-being in their lives and can forecast future weather to a certain degree, as they are familiar with the characteristics of the weather conditions where they live and share this information and common responses with others through a network connection. Humans exist in the relationship between temperature and power demand, so if it is possible to read the minds of many, then it will also be possible to increase the accuracy of power demands as well.
4. Photovoltaic Power Plant Big Data Collection through Web Crawling
Web crawling refers to a series of behaviors that can be used to process and analyze the big data that are collected on the Internet, giving us the ability to extract significant meaning from a huge dataset scattered everywhere in a form that makes it difficult to apply other processing or analysis methods.
Figure 14 shows the big data visualization of the terms that frequently appeared in the “social” category. Additionally,
Table 1 shows a translation of the big data visualization of the top 40 categories.
The news is a program that delivers information that is generated in time and space to people and is usually transmitted through the Internet, TVs, or newspapers as a medium. A term Internet news describes news delivered through the Internet, allowing information to be shared and communicated with people quickly, even when it appears in a limited form. This medium is becoming more and more efficient following the development of information and communication technologies.
NAVER Co., Ltd. is South Korea’s largest web search engine as well as a global ICT brand that provides services including LINE messenger, which currently has over 200 million users from around the world, the SNOW video app, and the digital comics platform, NAVER WEBTOON [
55].
Among Internet news, Naver is currently publishing an average of 25,886 articles daily after receiving them from more than about 453 press and 67 media services since launching their news search service, which was developed to transmit news published by 15 newspaper companies and news agencies in May 2000. The percentage of their mobile web news reached up to 52.5% as of the third week of July 2014, and today, they ahold a dominant position as an Internet news provider. Although their news consists of unstructured data taking different structures and forms that are generated, modified, and stored daily, they still rely on people using these different information structures [
56,
57,
58,
59,
60,
61,
62,
63,
64].
This paper makes an assumption that there are data that can help to forecast power demand among data that are processed, transformed, and provided in a form that allows people to easily access and understand the information generated in time and space, and the accuracy of such forecasting can be enhanced by using these data.
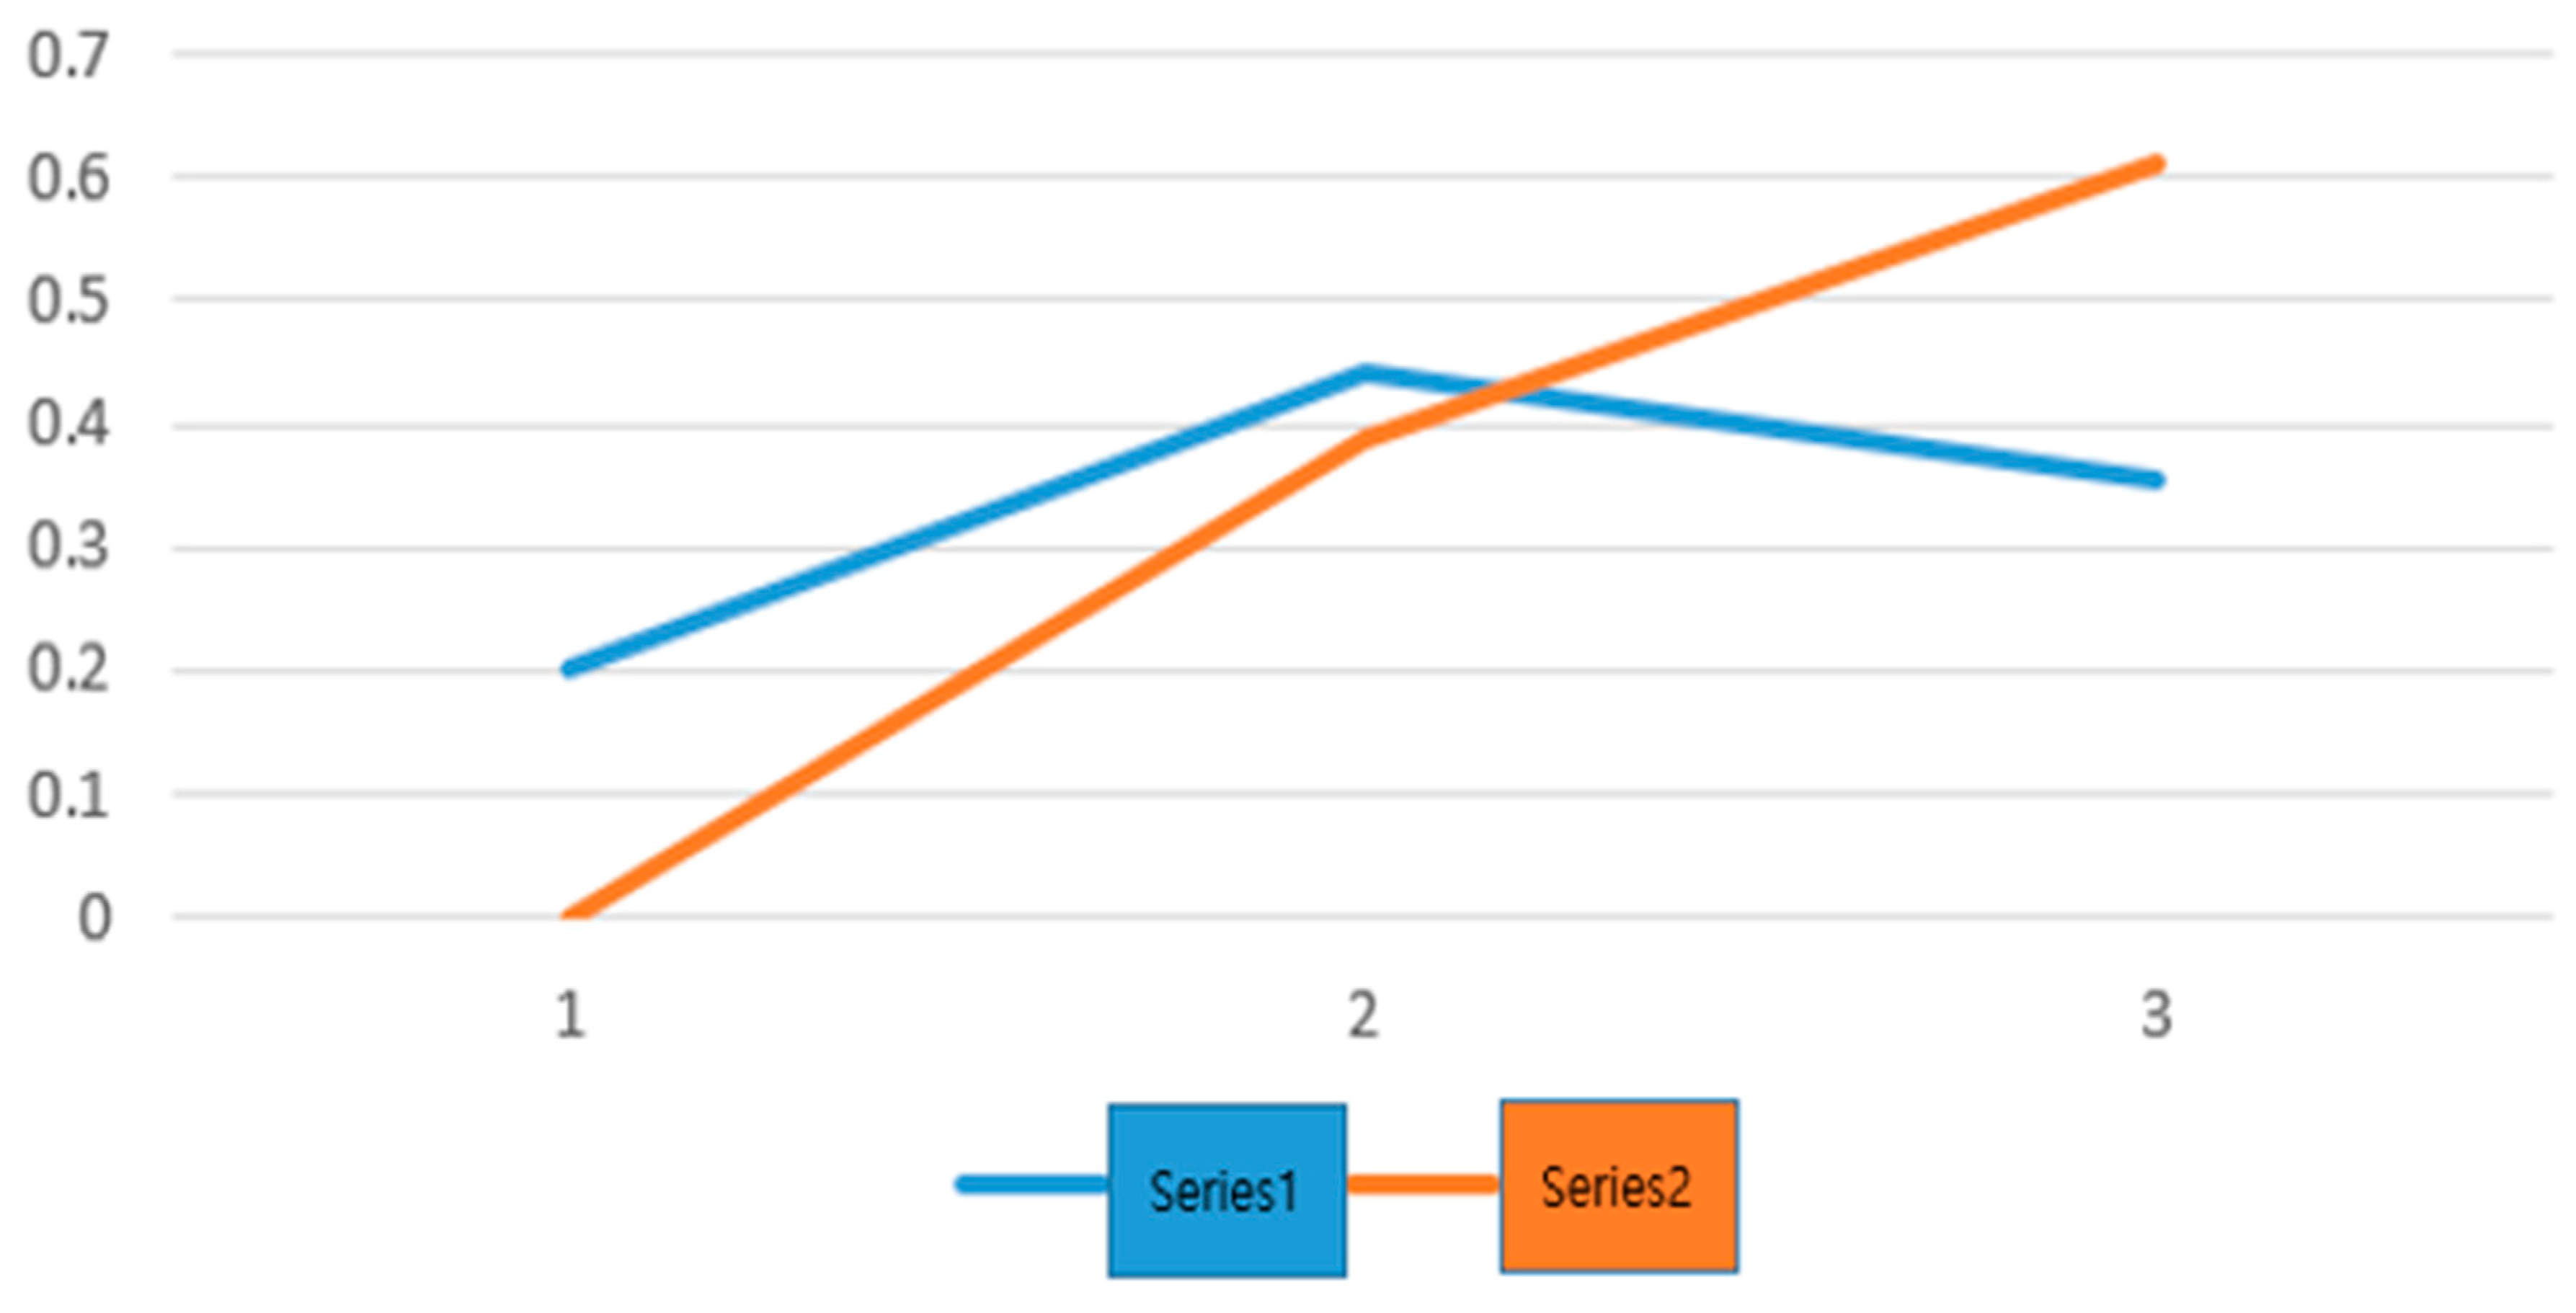
To support this assumption, a correlation between the frequency of a particular word and the power consumption in the corresponding time frame was compared for the three most frequently appearing words in Naver news articles published in the “Living Culture” section, which were crawled to investigate the frequency of each word on a monthly basis to check the correlation between the frequency and the changes in power demand. All of the orange lines (Series 2) in the pictures below represent the average of the maximum power in the period from June to August, whereas the blue lines (Series 1) indicate the appearance frequency of a particular word in the same period. At the same time, the values of Series 1 were obtained by (number of appearances of a particular word in each month/total number of appearances of the same word in the period from June to August), whereas the values of Series 2 were calculated by [(each month’s average maximum power—average lowest maximum power in the period from June to August)/(sum of average lowest maximum powers in the period from June to August)]. Such calculations were made to complement the problem of not being able to compare the values on the graphs due to basic power consumption values.
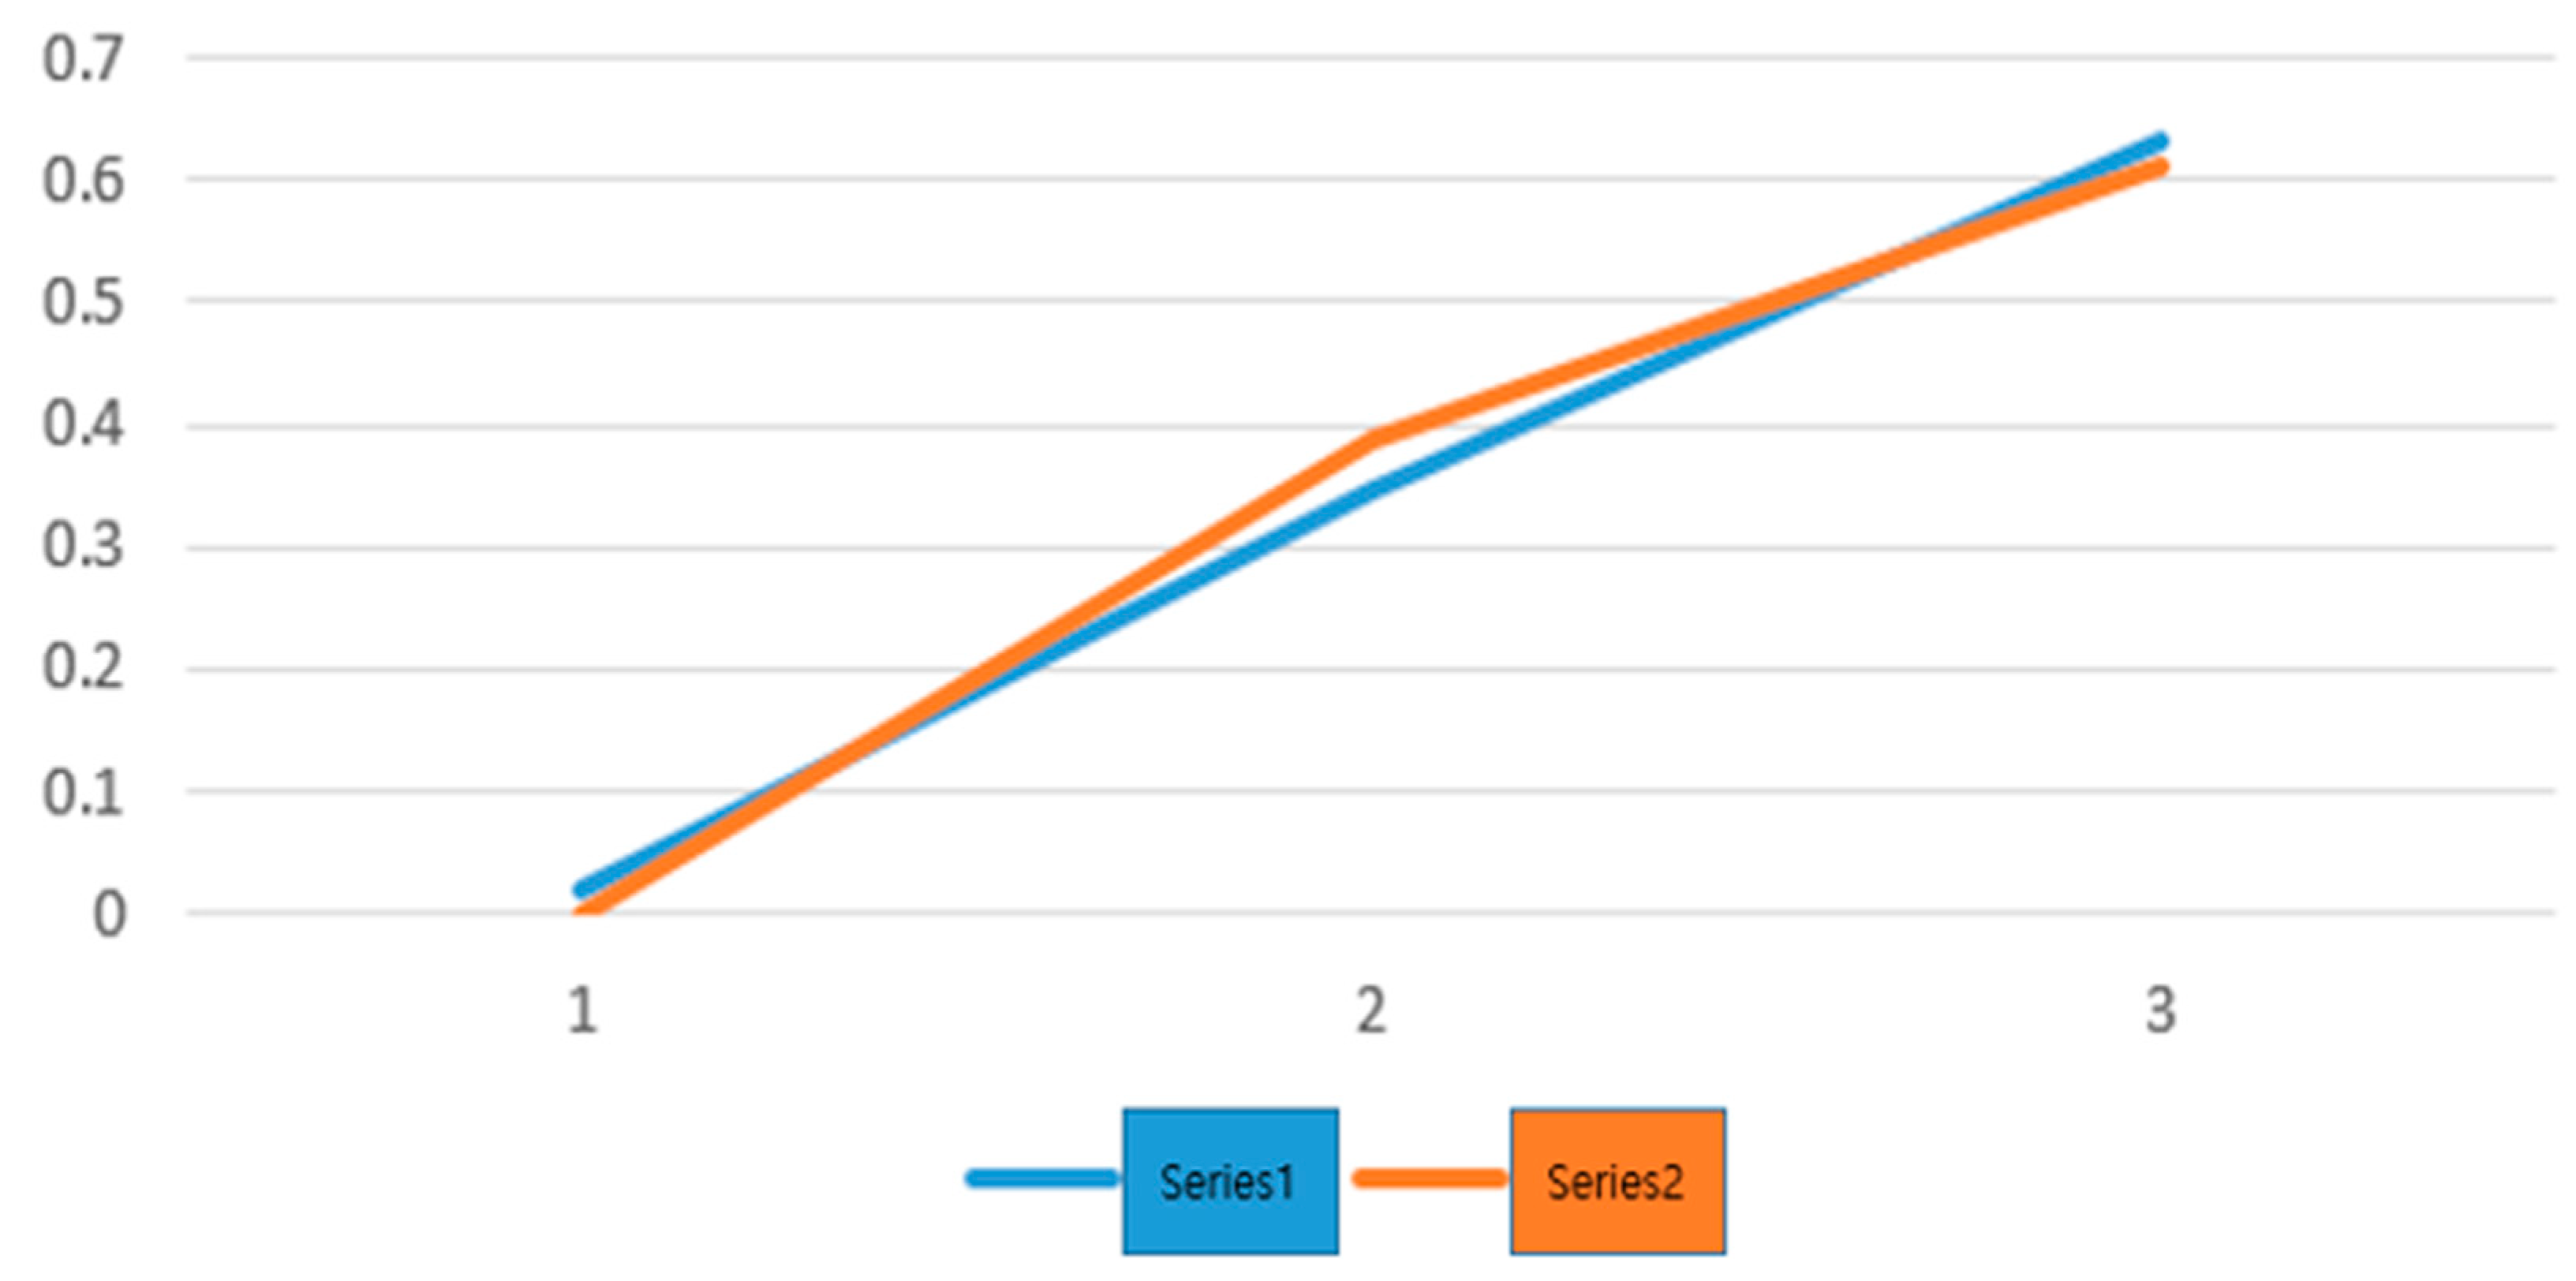
Figure 15 shows a comparison between the appearance frequency of “intense heat” and maximum power in the “Living Culture” section of Naver news, 2016.
In the picture below, Series 1 refers to the frequency appearance at which a particular word, whereas Series 2 indicates the power consumption of each corresponding year.
The term “intense heat” appeared 829 times in Naver news articles during the period from June to August 2016 and 46 times in June (approx. 5.5%). The average maximum power in June of 2016 was approx. 66,208 MW, and depending on the method of calculation, this value may correspond to 0%. The number of appearances of the same term in July (August) was 260 (523), which corresponds to approx. 31% (63%), whereas the average maximum power in the same month was approx. 71,773 MW (74,996 MW), which corresponds to approx. 39% (35%), depending on the calculation method [
57,
65,
66].
Figure 16 shows a comparison between the appearance frequency of ”tropical night” and maximum power in the “Living Culture” section of Naver news, 2016.
The total number of appearances of the term “tropical night” in news articles provided by Naver in the period from June to August of 2016 was 346, and 7 of which were in June, corresponding to approx. 2%. The average maximum power in June of 2016 was approx. 66,208 MW, and depending on the method of calculation, this value may correspond to 0%. The number of appearances of the same term in July (August) was 120 (219), which corresponds to approx. 35% (63%), whereas the average maximum power in the same month was approx. 71,773 MW (74,996 MW), corresponding to approx. 39 (35%), depending on the calculation method.
Figure 17 shows a comparison between the appearance frequency of “mosquito” and the maximum power in the “Living Culture” section of Naver news, 2016.
The total number of appearances of the term “mosquito” in Naver news articles during the period from June to August of 2016 was 129, 26 of which were in June, corresponding to approx. 20%. The average maximum power in June of 2016 was approx. 66,208 MW, and depending on the method of calculation, this value may correspond to 0%. The number of appearances of the same term in July (August) was 57 (46), which corresponds to approx. 44% (36%), whereas the average maximum power in the same month was approx. 71,773 MW (74,996 MW), corresponding to approx. 39 (35%), depending on the calculation method [
58].
Figure 18 shows a comparison between the appearance frequency of “intense heat” and maximum power in the “Living Culture” section of Naver news, 2017.
The total number of appearances of the term “intense heat” in Naver news articles in the period from June to August of 2017 was 1015, 187 of which were in June, corresponding to approx. 18%. The average maximum power in June of 2017 was approx. 67,000 MW, and depending on the method of calculation, this value may correspond to 0%. The number of appearances of the same term in July (August) was 454 (374), which corresponds to approx. 45% (37%), whereas the average maximum power in the same month was approx. 76,000 MW (74,000 MW), corresponding to approx. 56% (44%), depending on the calculation method.
Figure 19 shows a comparison between the appearance frequency of “tropical night” and maximum power in the “Living Culture” section of Naver news, 2017.
The total number of appearances of the term “tropical night” in Naver news articles during the period from June to August of 2017 was 333, four of which were in June, corresponding to approx. 1%. The average maximum power in June of 2017 was approx. 67,000 MW, and depending on the method of calculation, this value may correspond to 0%. The number of appearances of the same term in July (August) was 210 (119), which corresponds to approx. 63% (36%), whereas the average maximum power in the same month was approx. 76,000 MW (74,000 MW), corresponding to approx. 56% (44%), depending on the calculation method.
Figure 20 shows a comparison between the appearance frequency of “mosquito” and maximum power in the “Living Culture” section of Naver news, 2017.
The total number of appearances of the term “mosquito” in Naver news articles during the period from June to August of 2017 was 88, 22 of which were in June, corresponding to approx. 25%. The average maximum power in June of 2017 was approx. 67,000 MW, and depending on the method of calculation, this value may correspond to 0%. The number of appearances of the same term in July (August) was 35 (31), which corresponds to approx. 40% (35%), whereas the average maximum power in the same month was approx. 76,000 MW (74,000 MW), corresponding to approx. 56% (44%), depending on the calculation method.
Figure 21 shows comparison between the appearance frequency of “intense heat” and maximum power in the “Living Culture” section of Naver news, 2018.
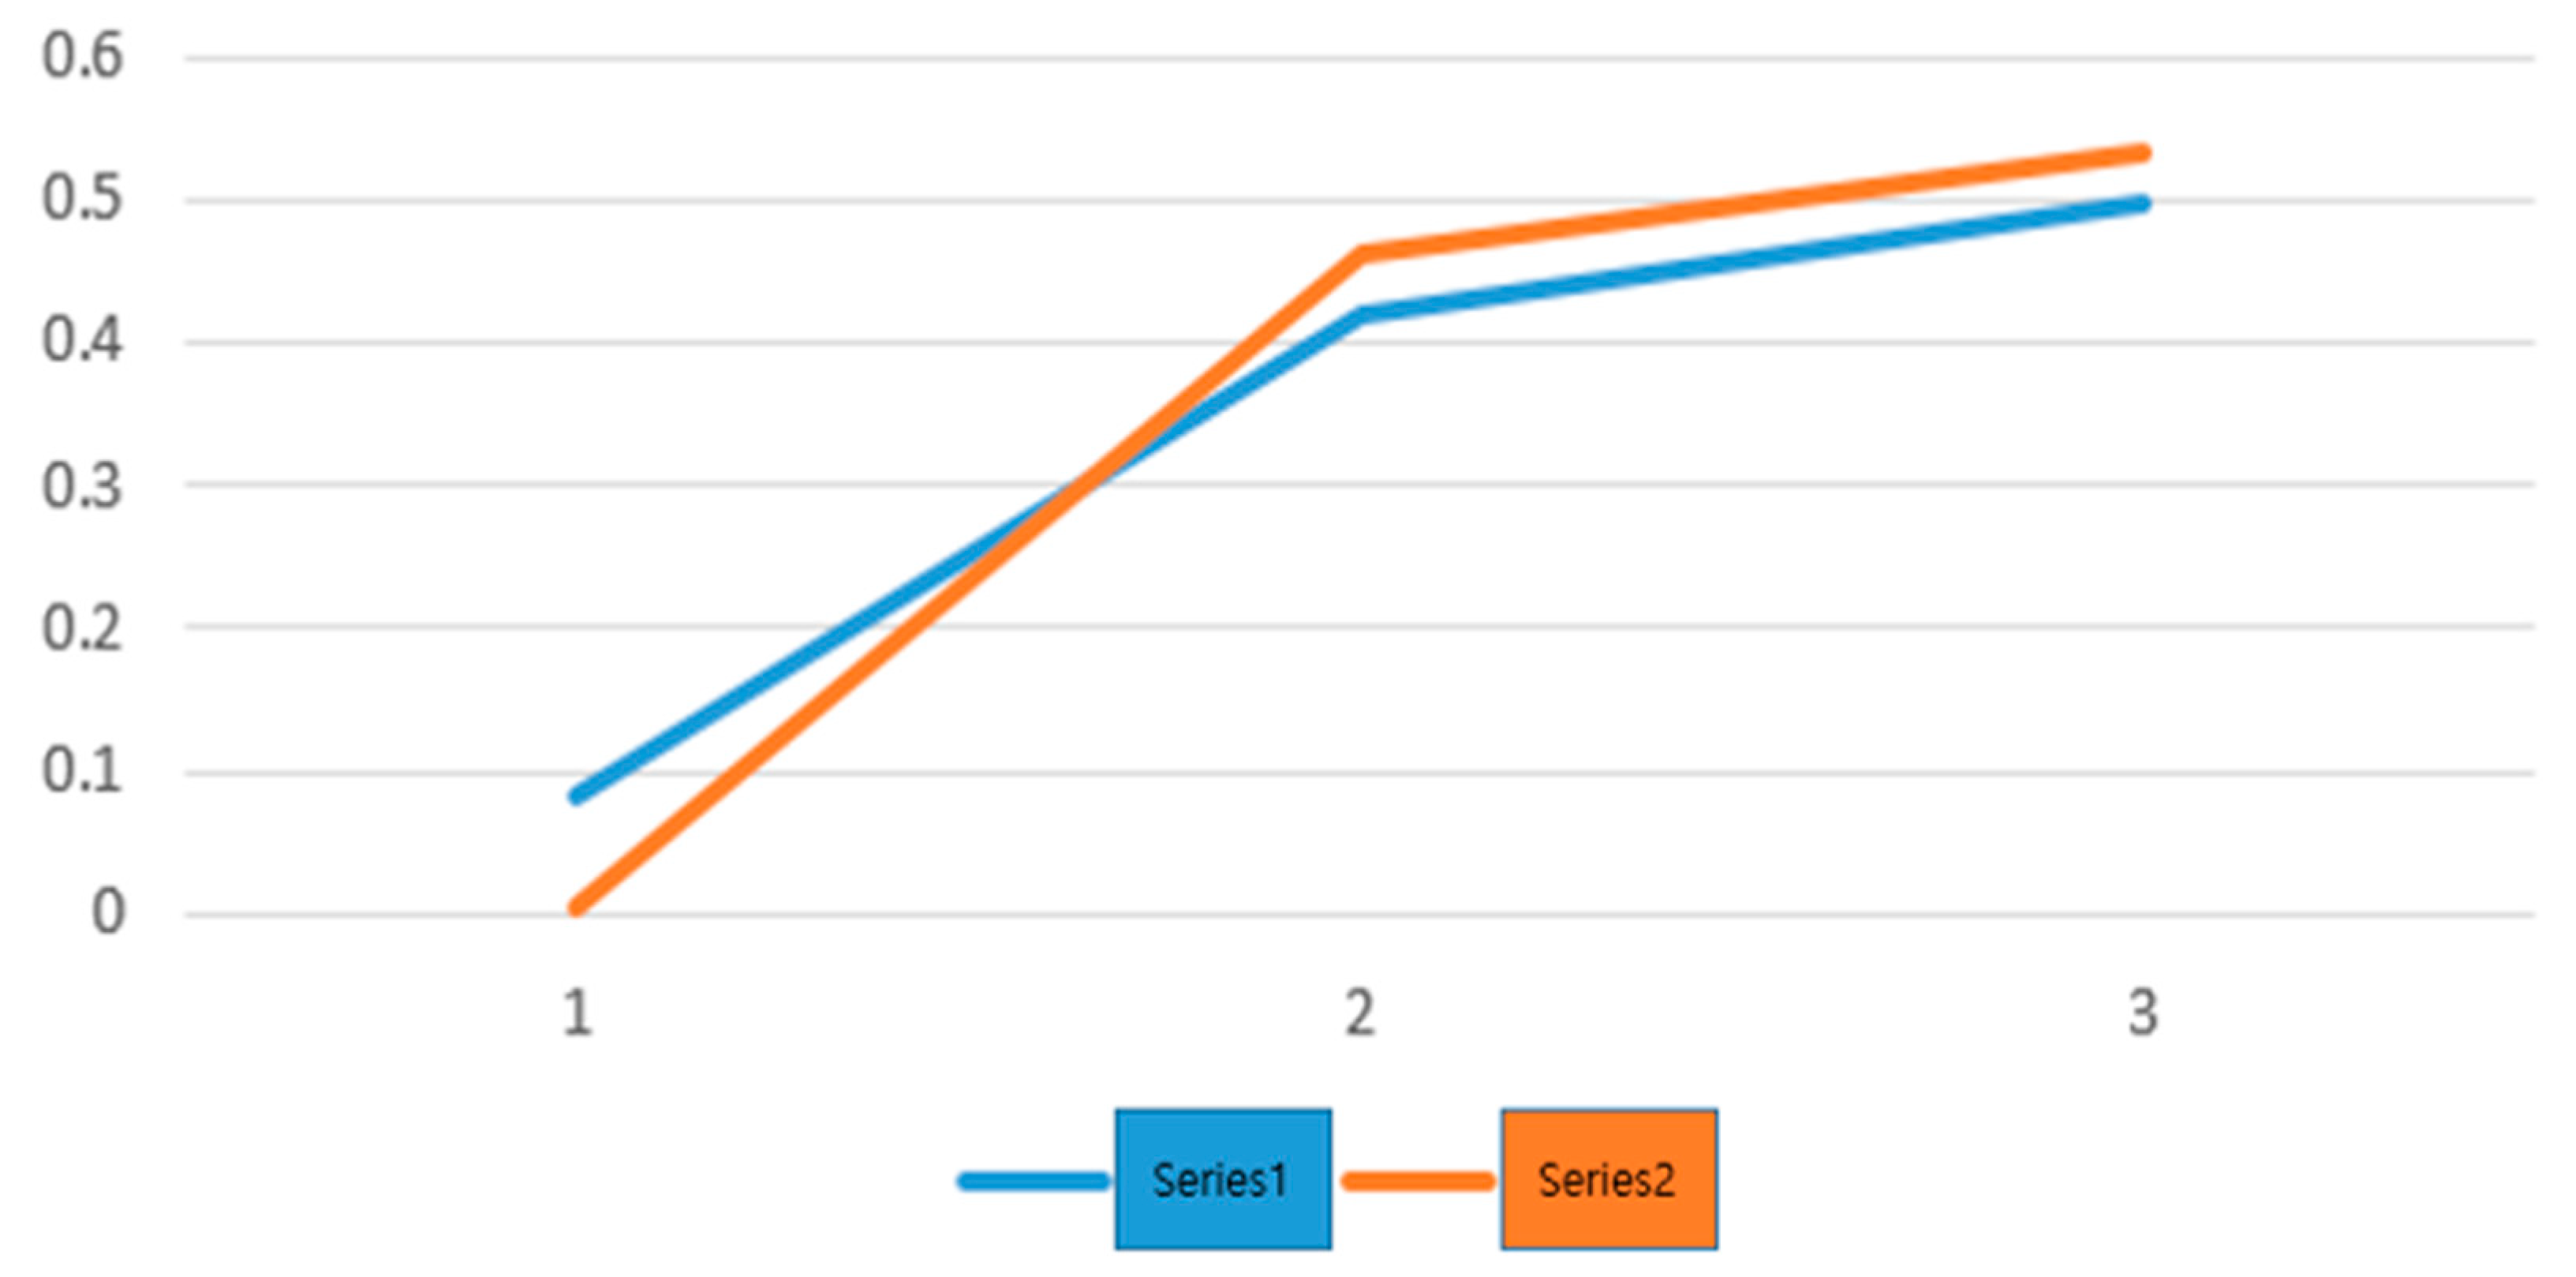
The total number of appearances of the term “intense heat” in Naver news articles during the period from June to August 2018 was 1823, 148 of which were in June, corresponding to approx. 8%. The average maximum power in June of 2017 was approx. 68,000 MW, and depending on the method of calculation, this value may correspond to 0%. The number of appearances of the same term in July (August) was 767 (908), which corresponds to approx. 42% (50%), whereas the average maximum power in the same month was approx. 79,000 MW (80,000 MW), corresponding to approx. 50% (53%), depending on the calculation method.
Figure 22 shows a comparison between the appearance frequency of “tropical night” and maximum power in the “Living Culture” section of Naver news, 2018.
The total number of appearances of the term “tropical night” in Naver news articles in the period from June to August 2017 was 333, four of which were in June, corresponding to approx. 1%. The average maximum power in June of 2017 was approx. 67,000 MW, and depending on the method of calculation, this value may correspond to 0%. The number of appearances of the same term in July (August) was 210 (119), which corresponds to approx. 63% (36%), whereas the average maximum power in the same month was approx. 76,000 MW (74,000 MW), corresponding to approx. 56% (44%), depending on the calculation method.
Figure 23 shows a comparison between the appearance frequency of “mosquito” and maximum power in the “Living Culture” section of Naver news, 2018.
The total number of appearances of the term “mosquito” in Naver news articles during the period from June to August 2018 was 65, 14 of which were in June, corresponding to approx. 22%. The average maximum power in June of 2018 was approx. 68,000 MW, and depending on the method of calculation, this value may correspond to 0%. The number of appearances of the same term in July (August) was 32 (19), which corresponds to approx. 49% (29%), whereas the average maximum power in the same month was approx. 79,000 MW (80,000 MW), corresponding to approx. 46% (53%), depending on the calculation method.
Figure 24 shows the longitudinal comparison of appearance frequency of relevant words. Meanwhile,
Figure 25 shows a comparison between the appearance frequency of “mosquito” and maximum power in the “Living Culture” section of Naver news, 2018. Additionally,
Figure 26 shows a comparison between the appearance frequency of “mosquito” and maximum power in the “Living Culture” section of Naver news, 2018.
5. Development of Efficient Electric Power Production Mechanism through Big Data Based Demand Forecasting: Focusing on Photovoltaic Power Plant
The energies that we commonly use can be divided into fossil energy and new and renewable energy depending on the method of production. The former uses fossil fuels to produce, and it is easier to control and secure the absolute amount compared to the latter. However, since the latter uses wind and solar heat or rays, which are abundantly available in nature, its availability is unlimited. However, according to the second law of thermodynamics, those energies transform into a form that gradually makes it difficult to use. This applies to both types of energies as well as electrical energy, which is considered to be the most convenient form of energy that humans can use. The most ideal or economic way of using electric energy is to completely use up the amount that has been produced, but in reality, balancing production and consumption is quite difficult, so the over-produced surplus power is usually stored by using pumped-storage or ESS, but their efficiency is still quite questionable. There are two approaches to solve such a problem: the first one is controlling power generation based on an accurate power demand forecasting, and the second one is controlling fossil energy production based on the power demand estimated through a power production forecasting of new and renewable energies. These two methods are useful in minimizing surplus power [
41,
59,
60,
61,
62,
63,
64].
Based on the difference between the frequency of appearance for the word “heat wave” in June and July and the word “tropical night” in August, the maximum power consumption was forecast. In 2016, the rates for tropical night were 37% and 63% in June, July, and August, respectively (−13%). Additionally, in 2017, the rates for the same word were 64% and 36%, respectively (+14%). Meanwhile, the maximum power consumption in August 2018 was 80 million kW, causing a difference of 13.50 million kW with the forecast load for August. On the other hand, the maximum power usage in July was 79 million kW, so estimating the power production based on a +14% increase would result in a power forecast of 90.06 million kW, giving a 3.44 million kW more accurate calculation compared to the 13.50 million kW calculated between the maximum power consumption between July and August (forecast) [
65,
66].
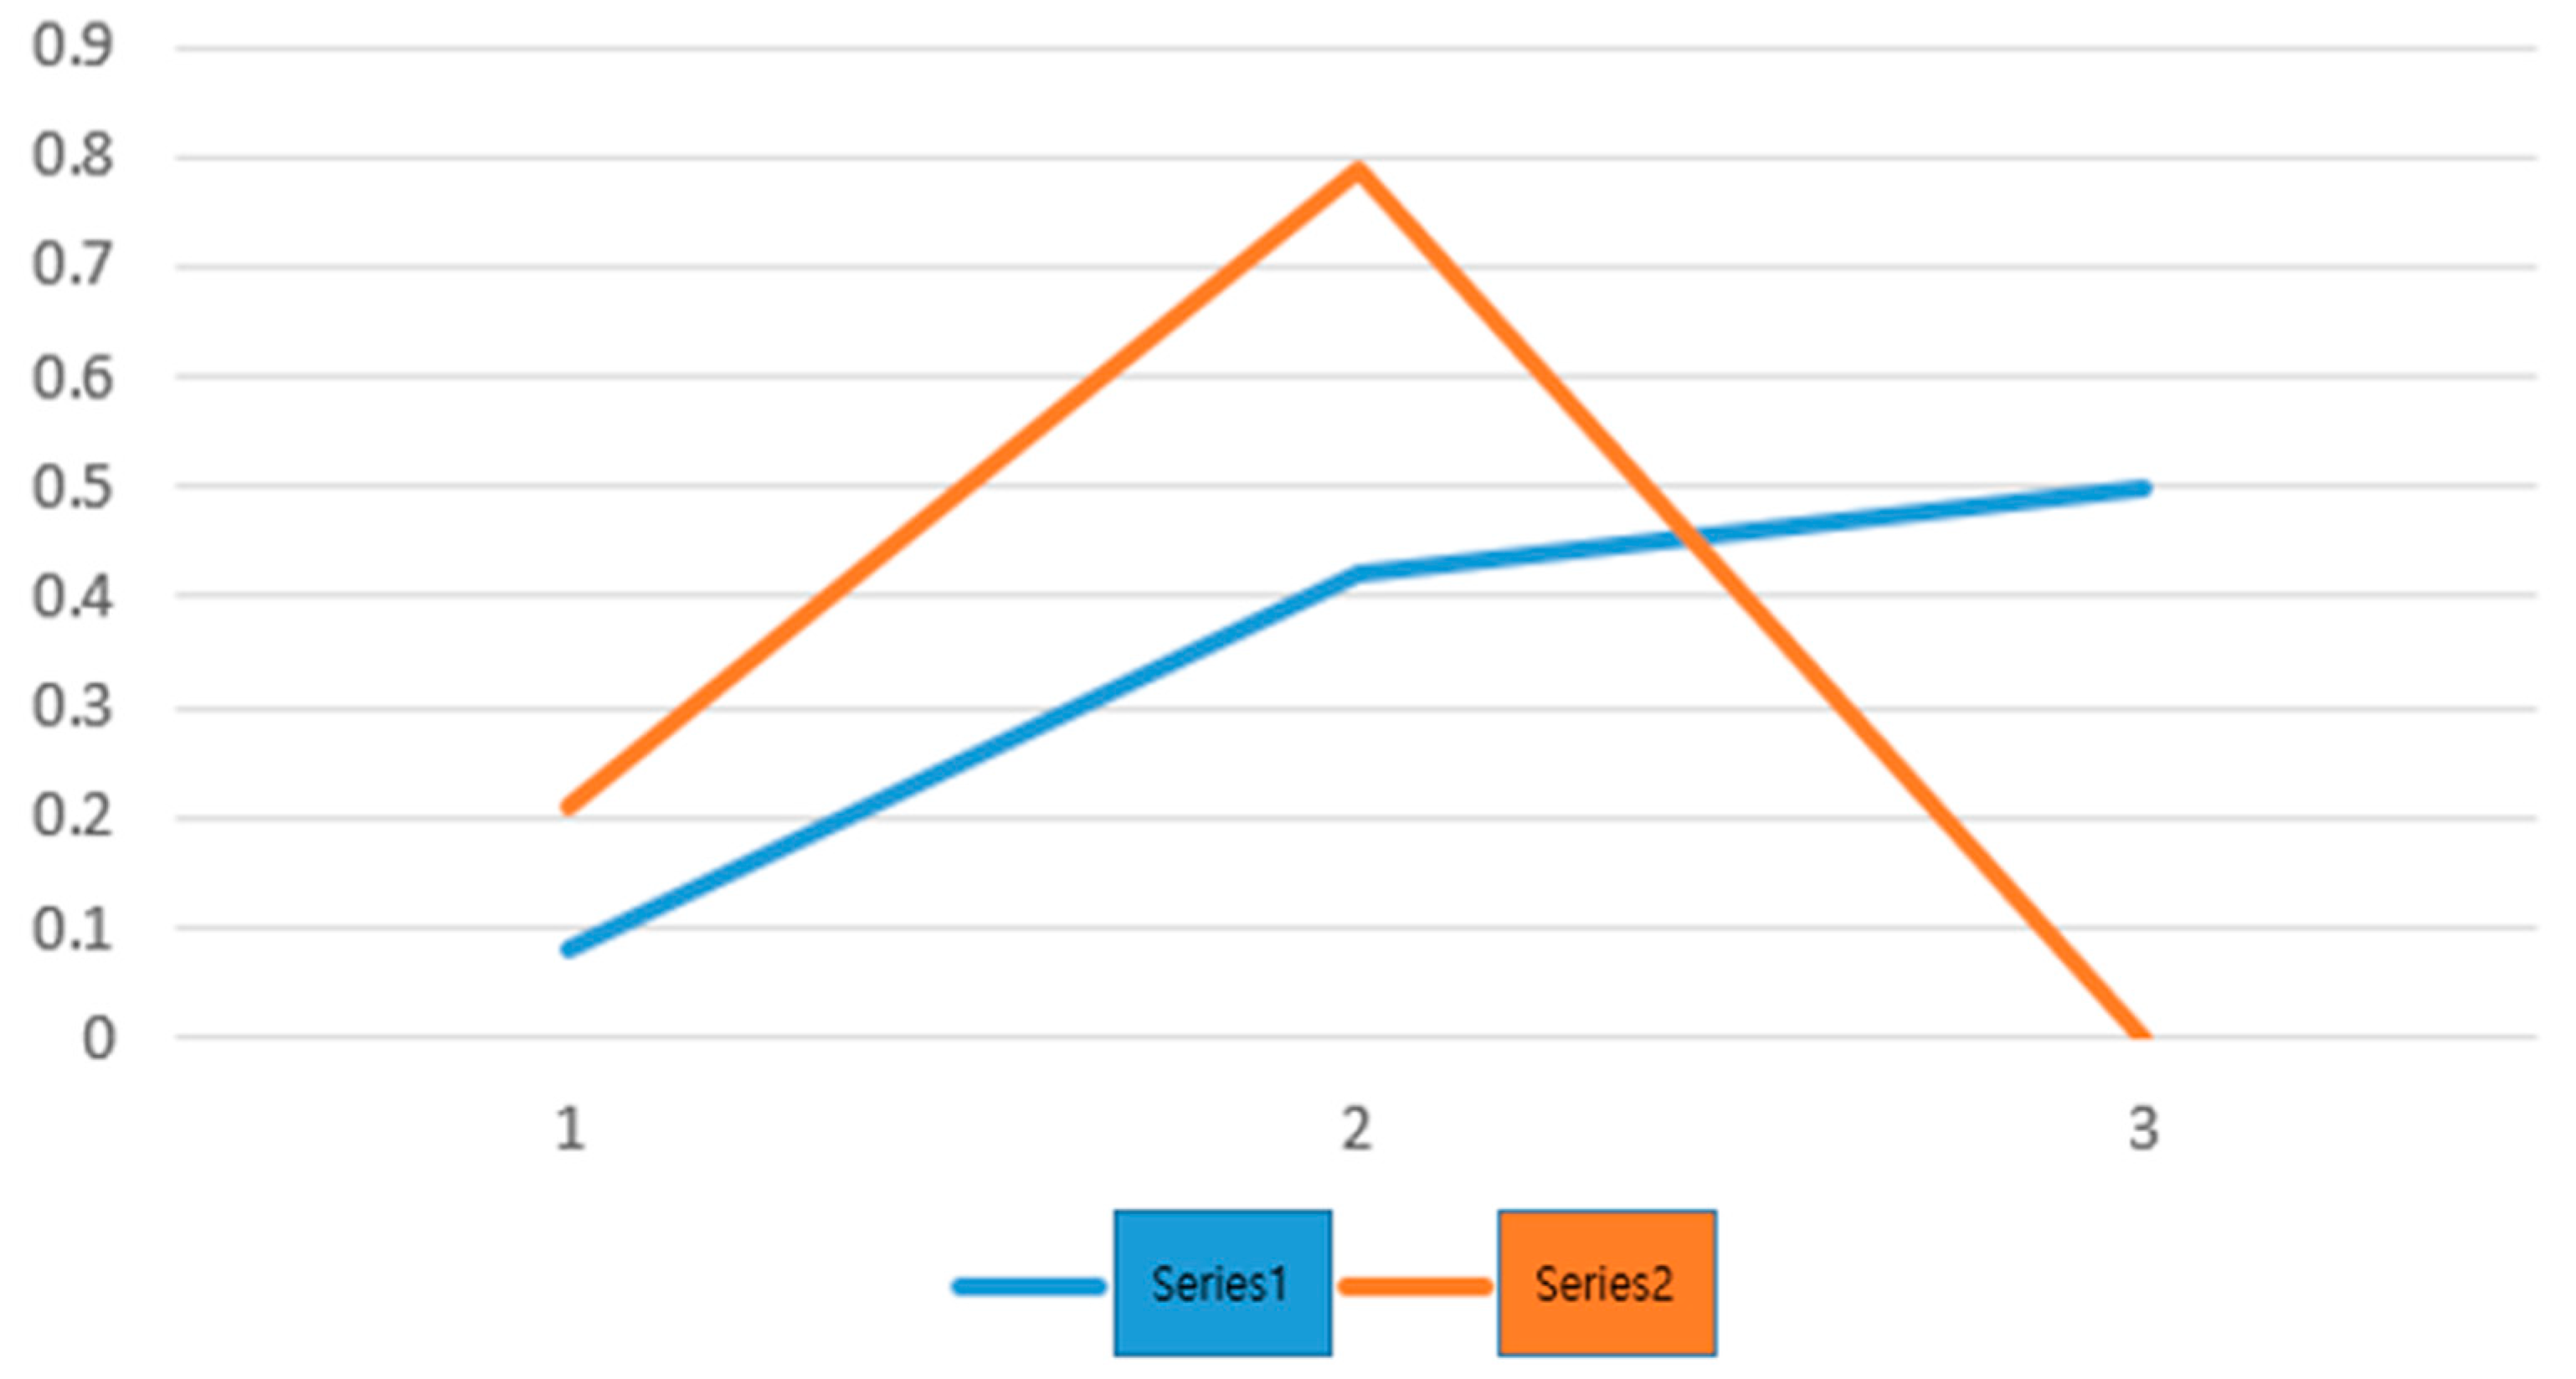
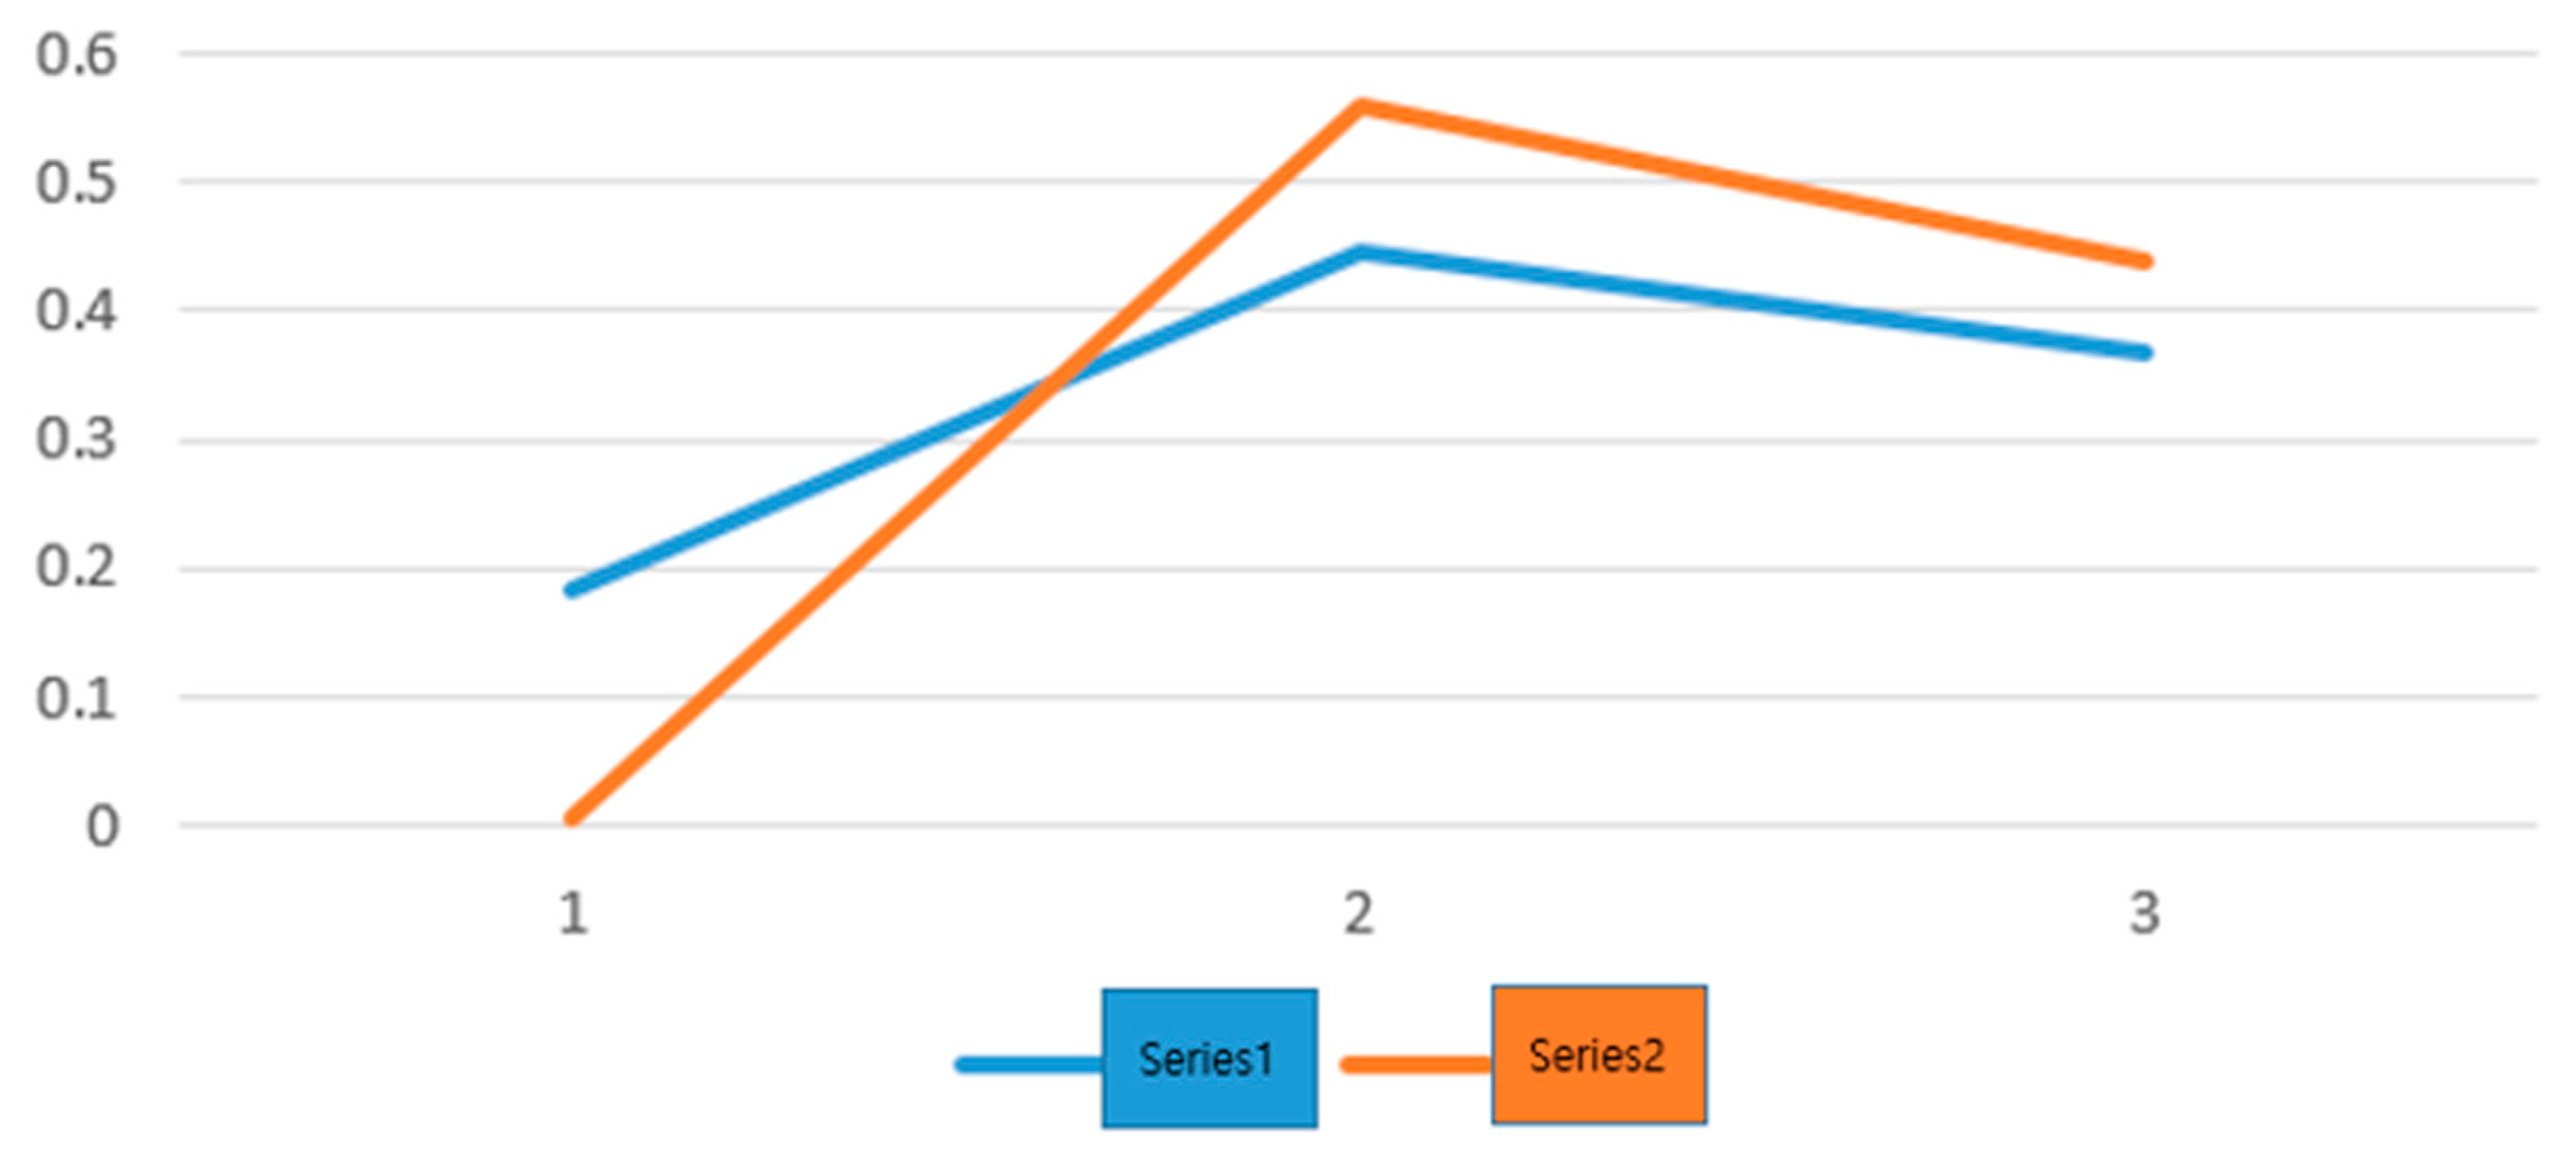
Figure 27 shows the frequency of appearance for the word “heat wave” and the changes in photovoltaic power generation in June, July, and August 2016.
In this case, Series 1 refers to the changes in photovoltaic power generation, whereas Series 2 indicates the appearance rates of the word “heat wave”.
The total number of appearances of the word heat wave in Naver News during this period was 829, 46 of which appeared in June, corresponding to approx. 5.5%. Then, the number in July (August) was 260 (523), which corresponds to approx. 31% (63%).
Factors that affect solar power generation include insolation, temperature, cloudiness, and weather variables. Among them, in the case of solar power generation and insolation, there is a statistically significant positive correlation between power generation at all quantile levels [
42,
66]. This means that there is a direct proportional correlation between the amount of solar power generation and the amount of insolation. From the big data analysis, it can be said that there is a positive correlation between the frequency of searching for “heat wave” and the amount of insolation. Since there are many variables interspersed between the number of times that people search for heat waves and the positive correlation of insolation, a simple “heat search frequency” cannot assume a positive correlation between insolation. However, the “heat search frequency” under big data has a positive correlation with the amount of insolation, and useful data processing can be seen to be possible from the graphical presentations of Series 1 and Series 2 when the number of outliers is included in the big data.
Series 1 is the average value of power generation for the Yeongam Solar Power Plant” in Korea for each month between June and August 2016. This value has a positive correlation with the search frequency of “heat wave” and predicts the amount of solar power generation, thereby showing that using the search frequency can contribute to the improvement of the accuracy of power generation forecasting.
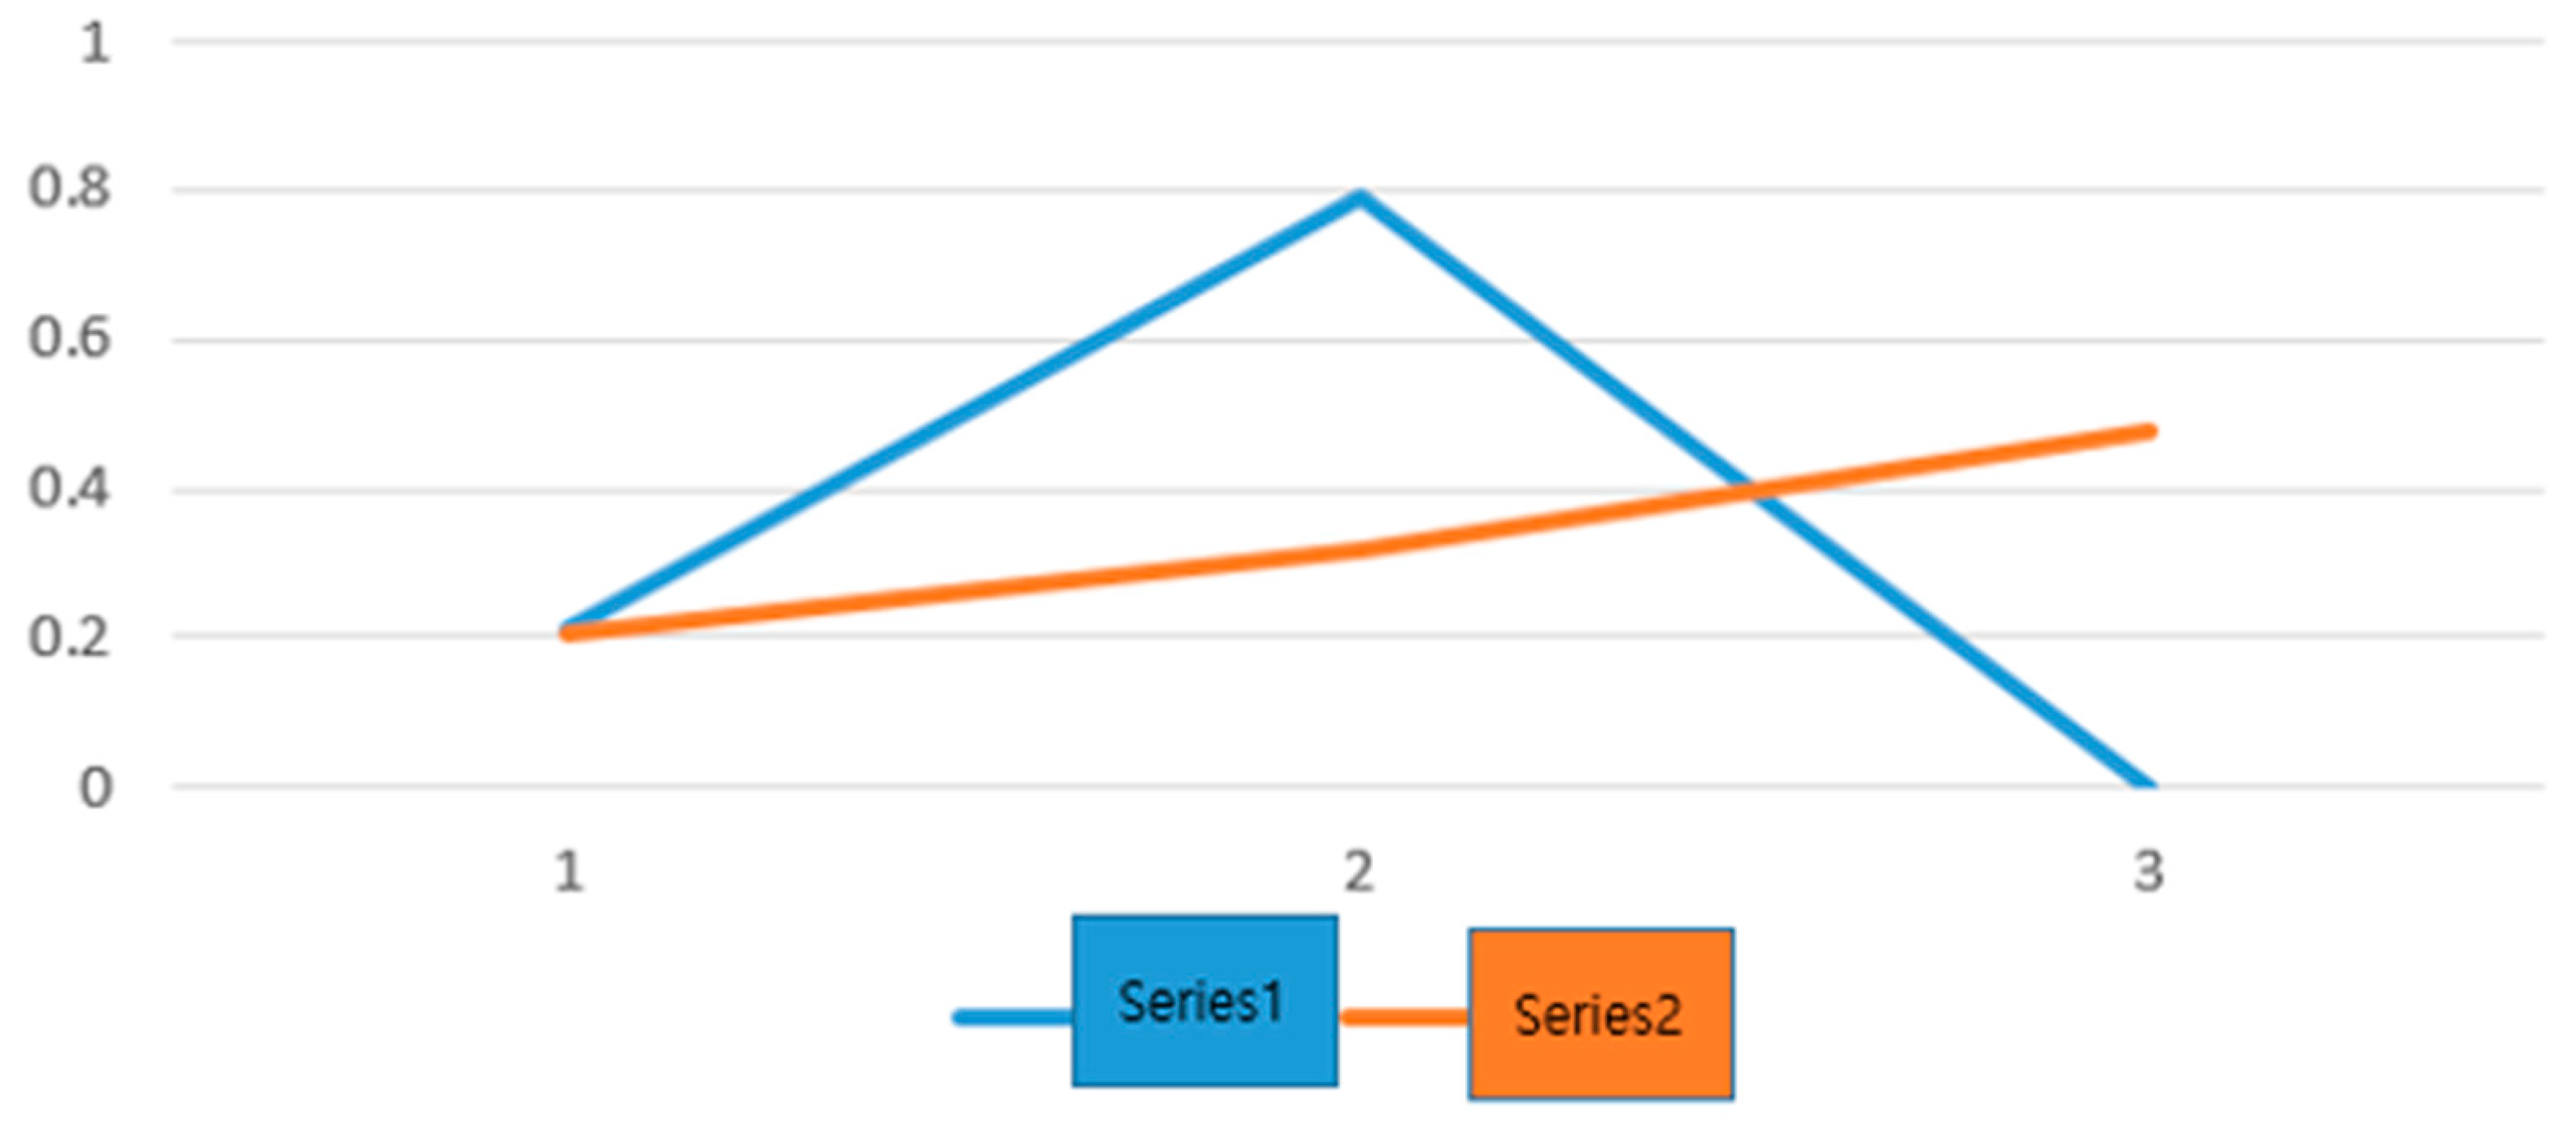
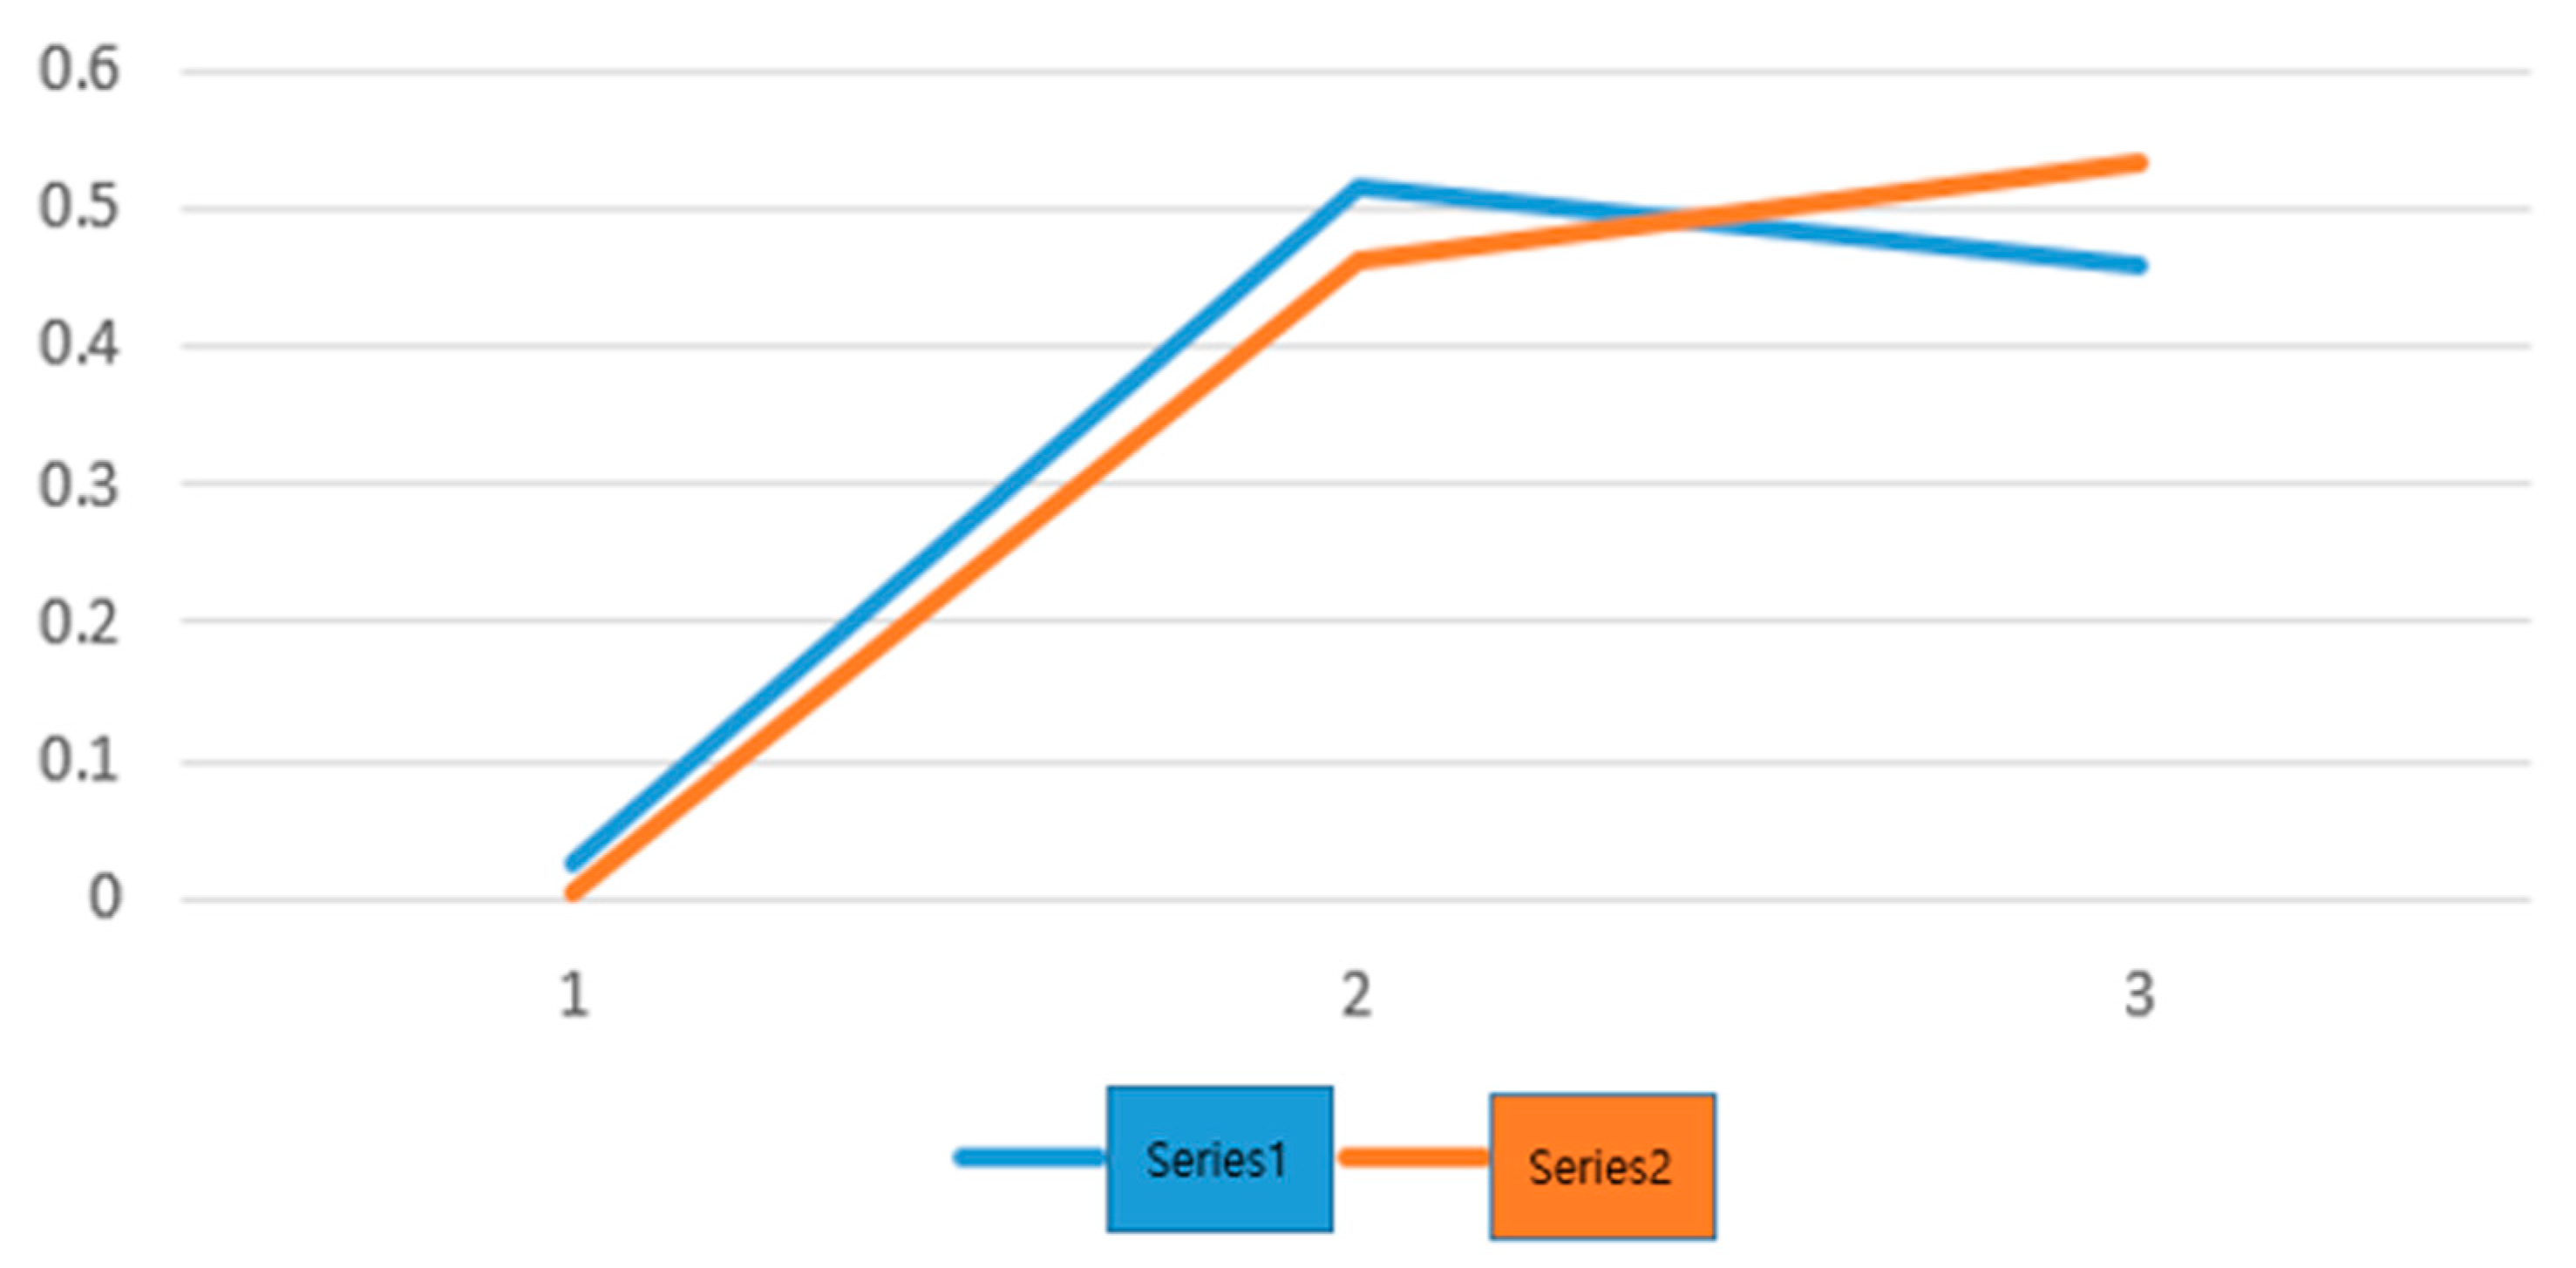
Figure 28 shows the frequency of appearance for the word “tropical night” and the changes in photovoltaic power generations in June, July, and August 2016.
In this case, Series 1 refers to the changes in photovoltaic power generation, whereas Series 2 indicates the appearance rates of the word “tropical night”.
The total number of appearances of the word heat wave in Naver News in this period was 346, seven of which appeared in June, corresponding to approx. 2%. Then, the number in July (August) was 120 (219), which corresponds to approx. 35% (63%).
The power generated at the Yeongam Photovoltaic Power Plant in June (July, and August was 3.4 MW, 3.7 MW, 4.4 MW, respectively. The calculation results considering the 14% increase from the power production in July was 4.218, a 0.182 MW less amount than the actual production of 4.4 MW.
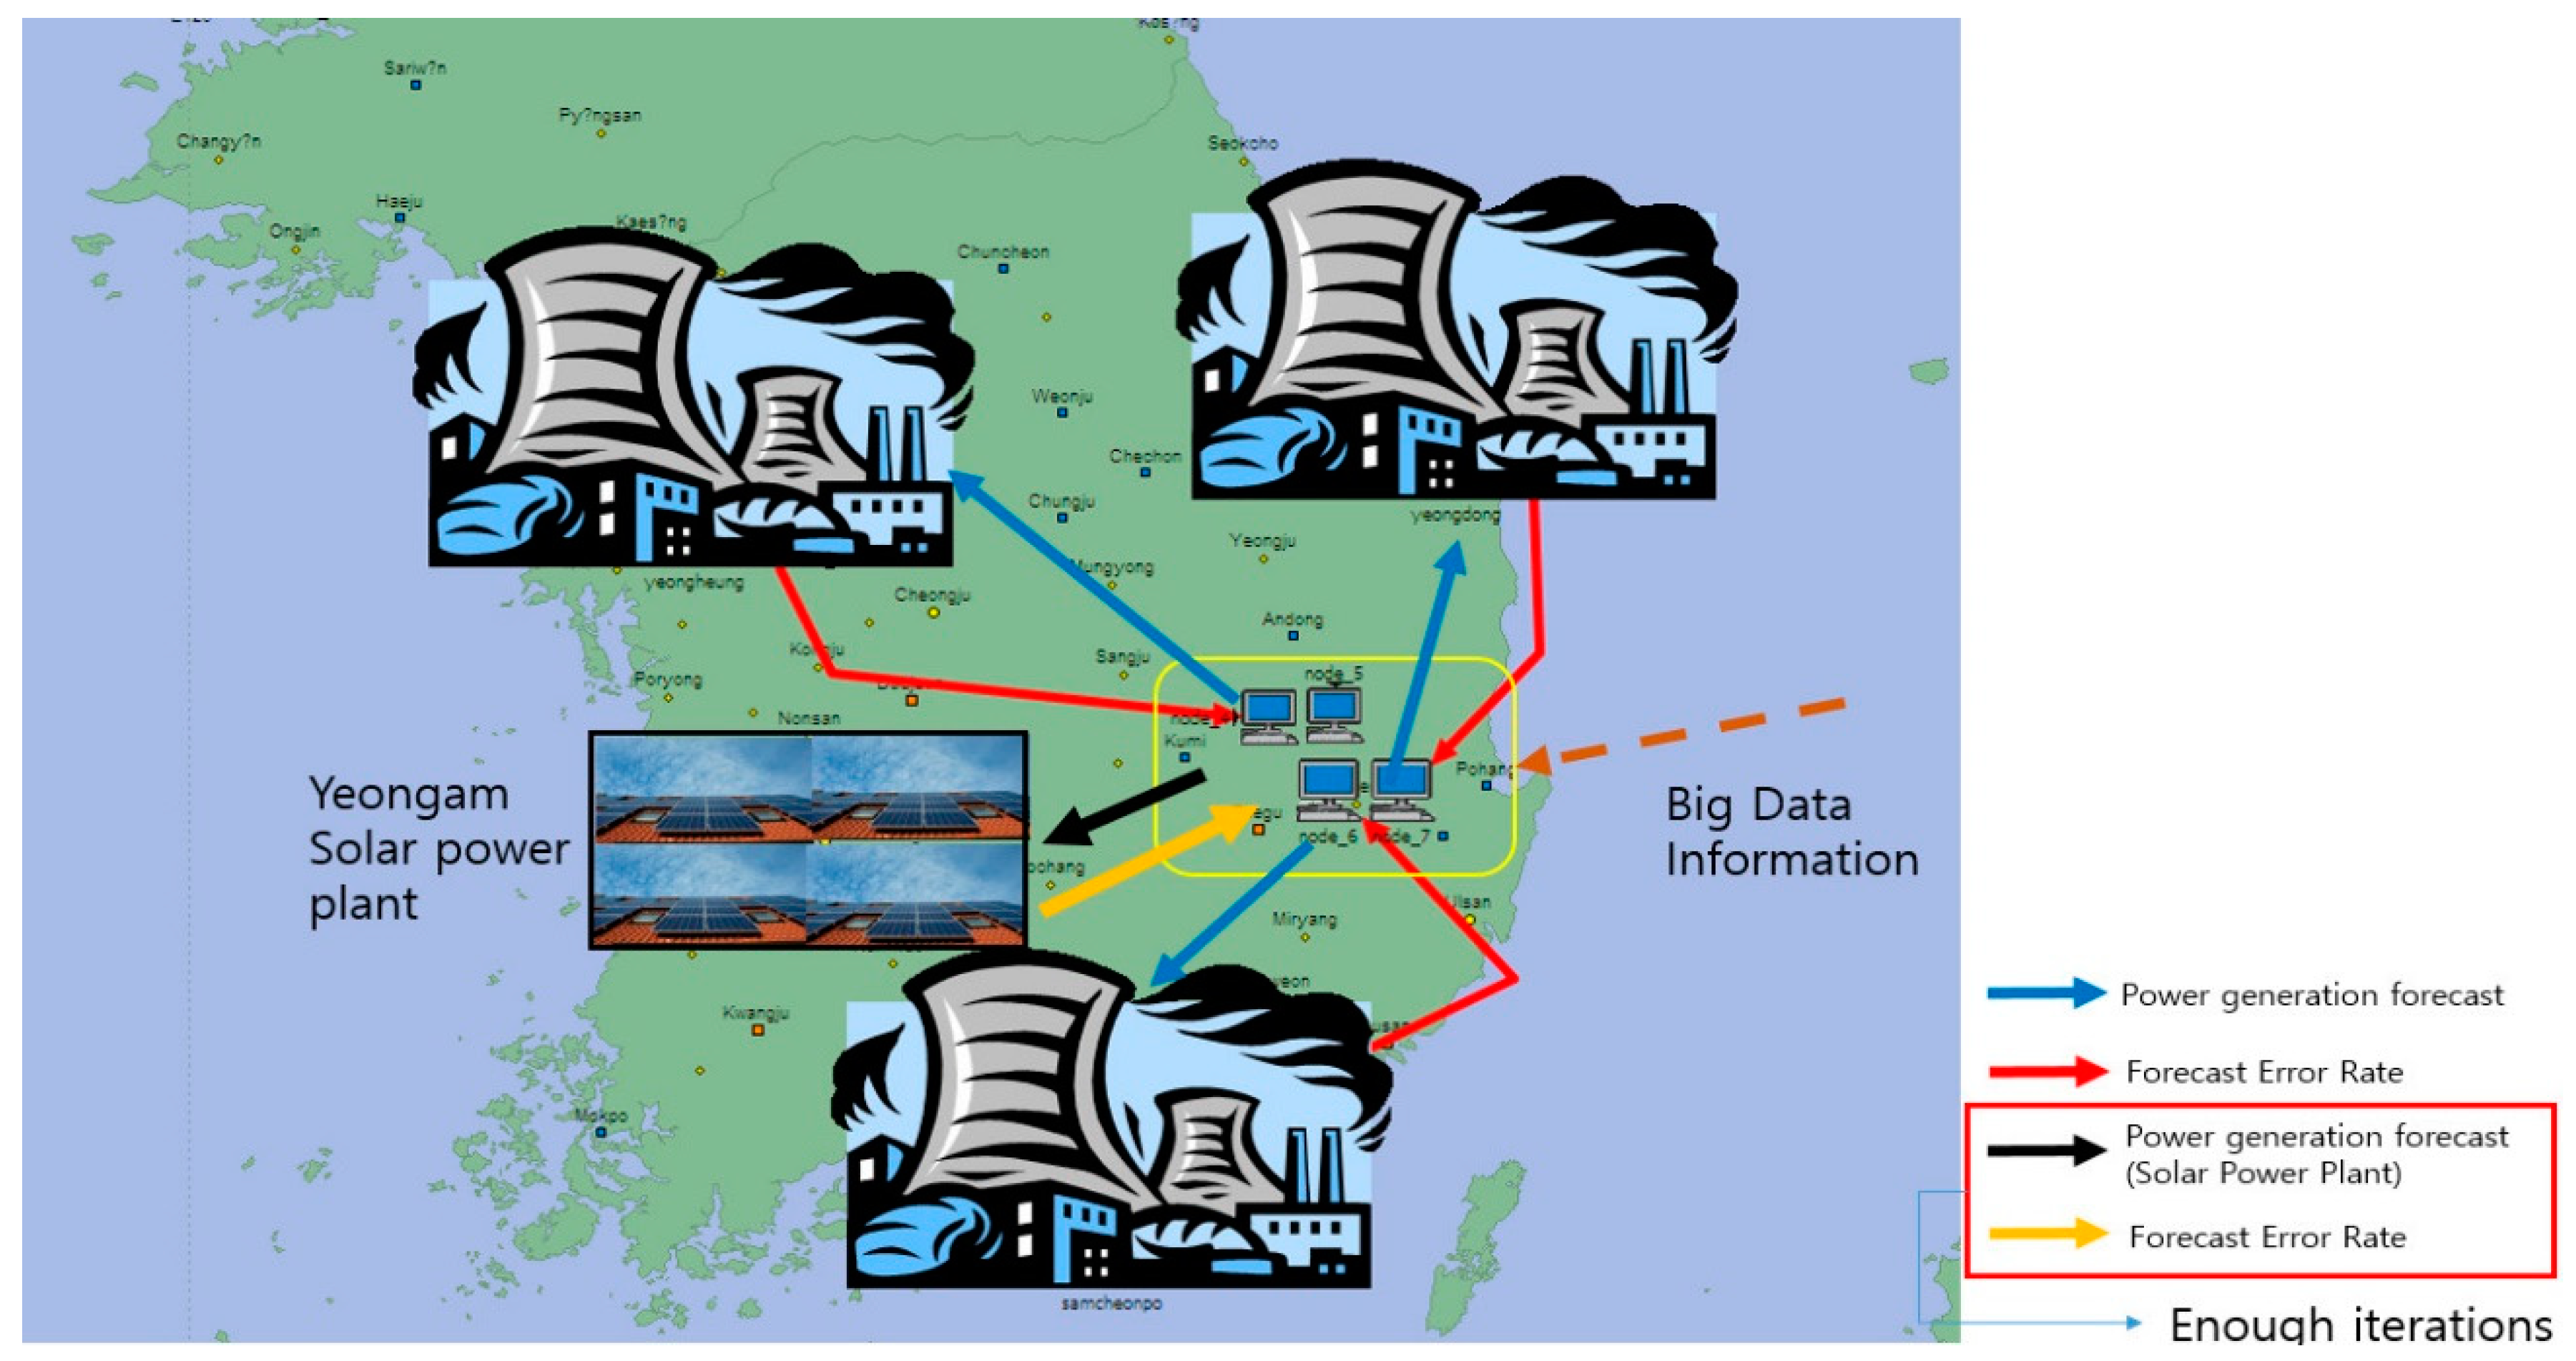
Figure 29 shows the development of an efficient power generation mechanism using information obtained by processing the big data collected using a web crawling functional system diagram. Additionally,
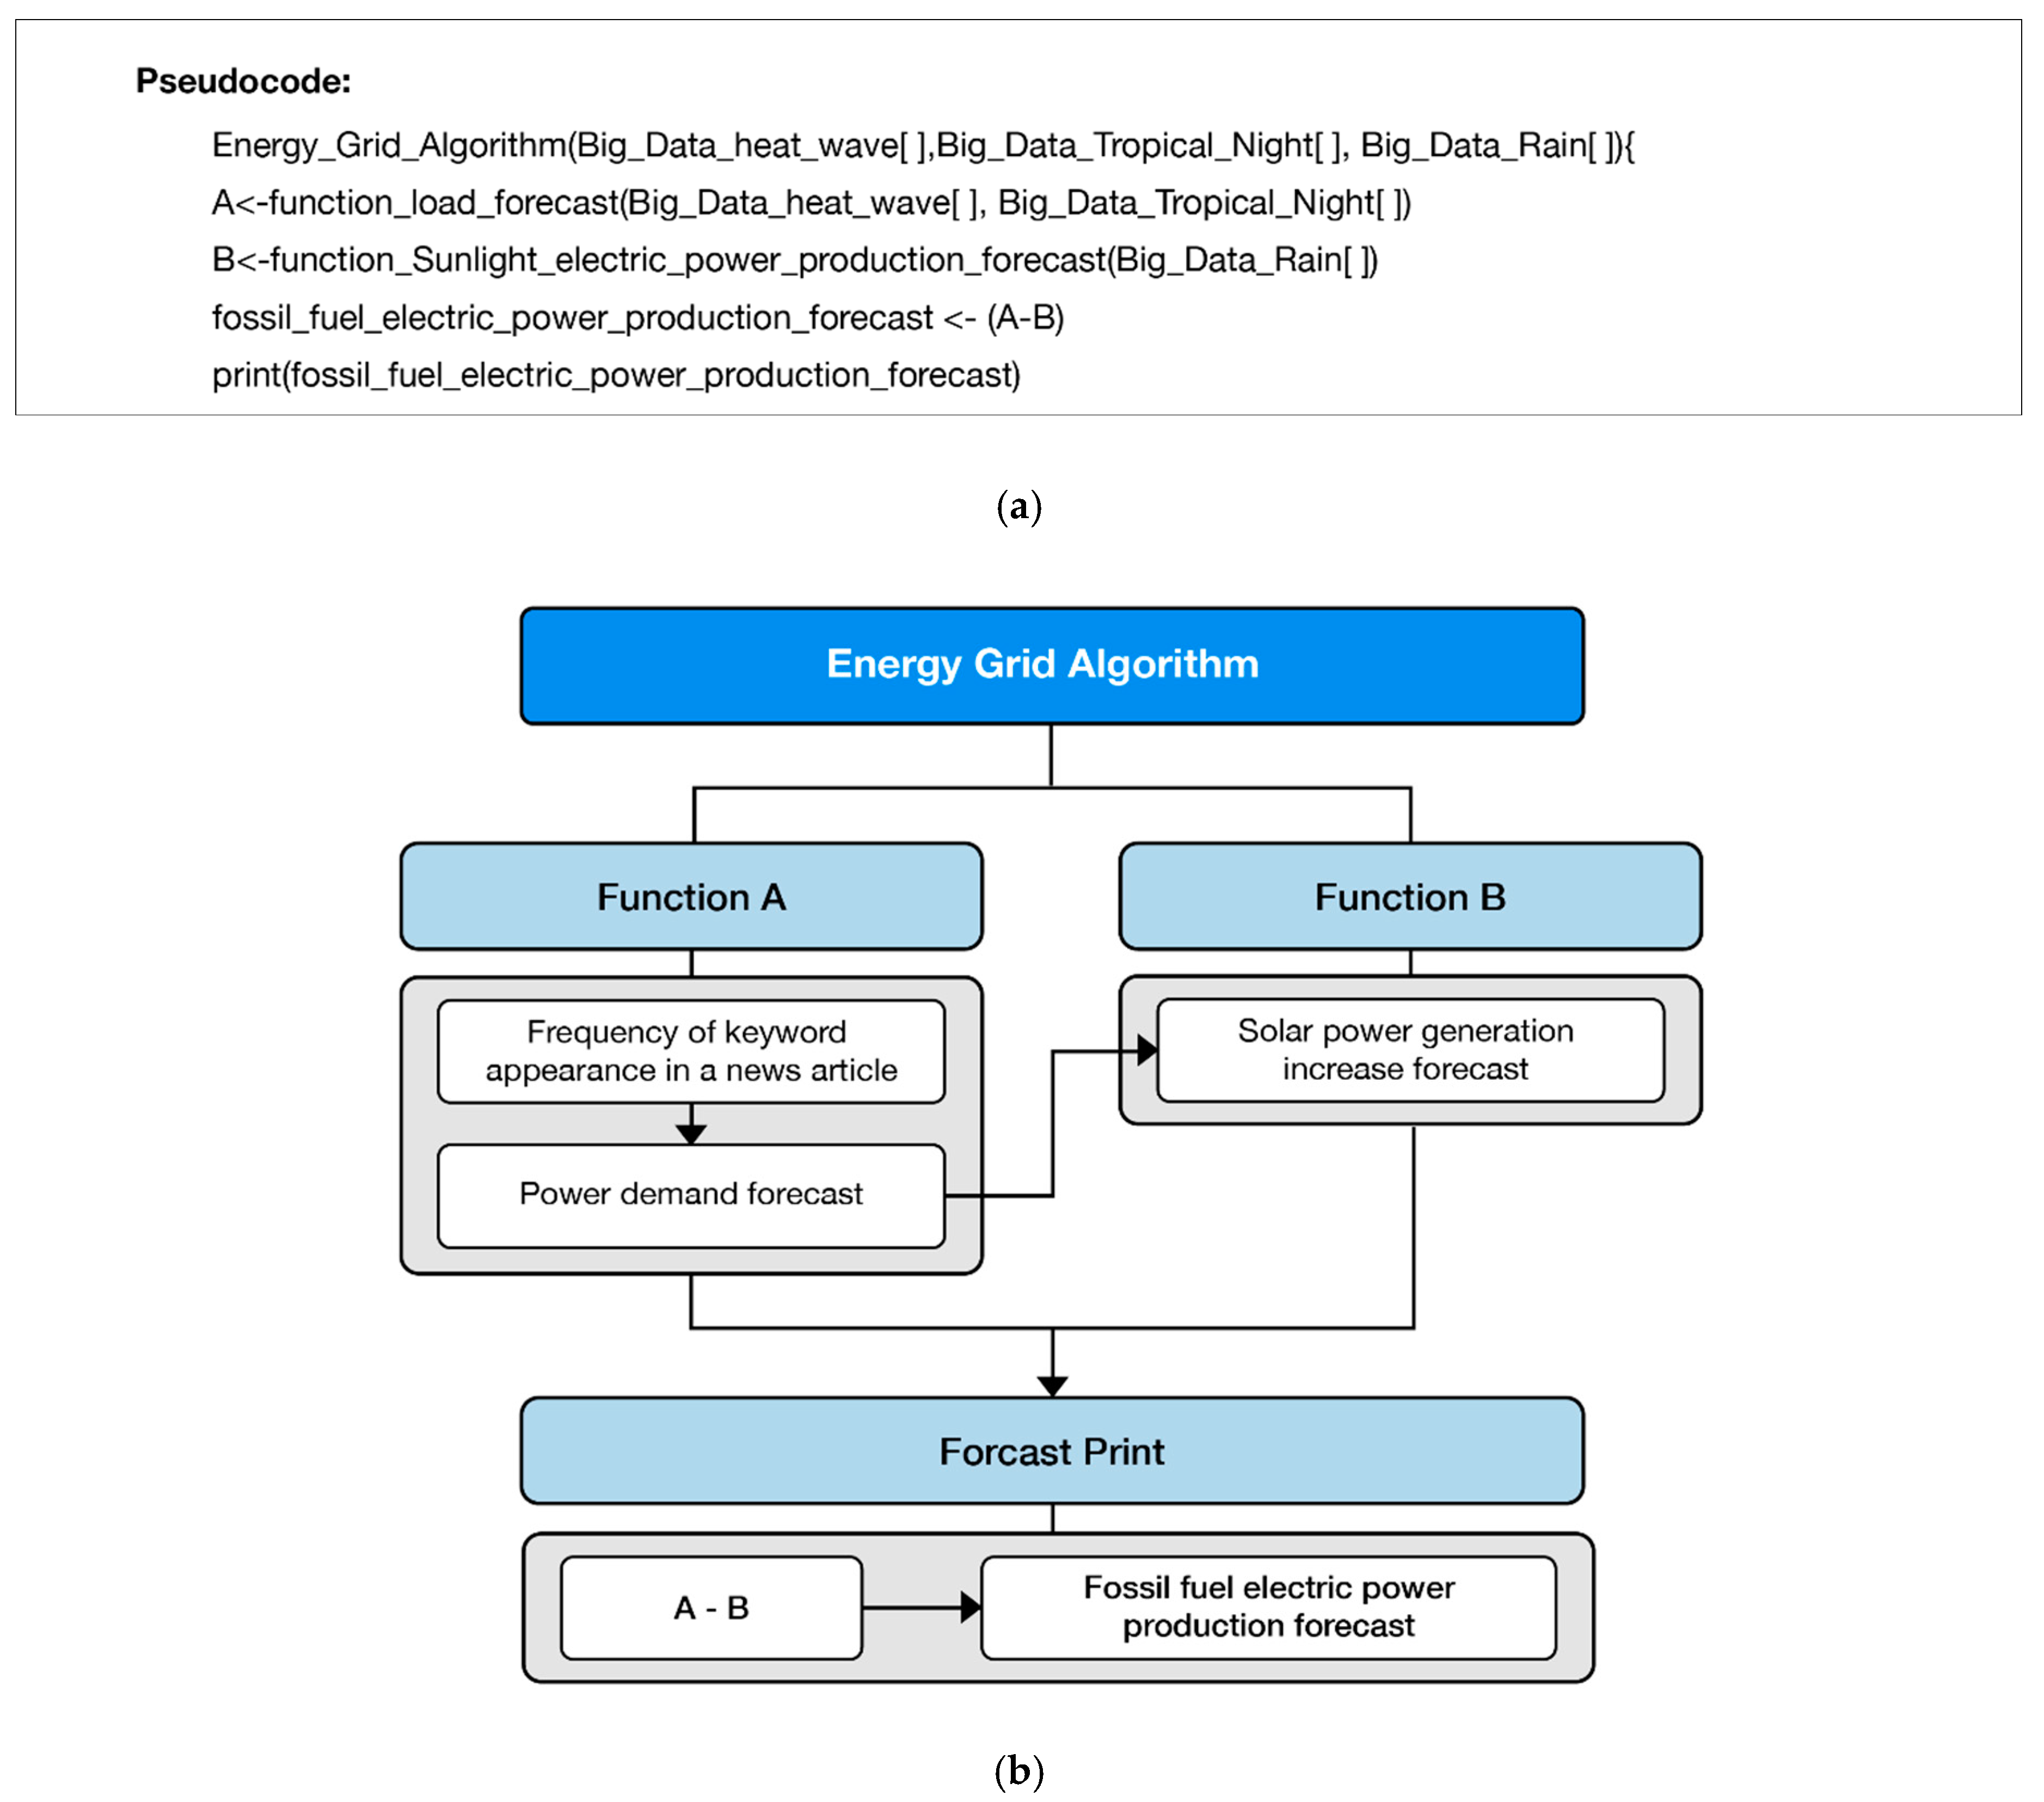
Figure 30 shows a pseudocode/flowchart of the fossil fuel electric power production forecast.
Pseudocode: This pseudocode outputs a fossil energy-based power generation estimated from solar energy generation by employing the power demand forecast based on the big data used as an input. Meanwhile, the function {function_load_forecast()} is a pseudo function that returns (output) how much more power should be consumed after receiving the frequency of keyword appearance in a news article determined as being relevant for input earlier [
61,
62,
63].
The function {function_Sunlight_electric_power_production_forecast()} is a function that returns (output) how much solar power generation would increase after receiving the frequency of keyword appearance in a news article determined as being relevant input earlier.
An X variable appearing in the above pseudocode indicates the average power consumption to which the result calculated from a subtraction operation between two return values will be added and stored in a variable fossil_fuel_electric_power_production_forecast. This variable is then used as a power consumption estimate with which the fossil-based energy generation will be determined [
61,
66].
In the above picture, the computers in the yellow box are a sort of a central processing machine that collects, processes, or analyzes big data and uses the analysis results to issue a command that is necessary for the operation of both solar power plants and fossil energy-based power plants. This central processing machine revises/supplements the production forecast through a repetitive exchange of information concerning the production forecast calculated based on big data and its error rate. The information consisting of a fossil energy-based power production forecast and error rate is then used to minimize the error margin during power production. Since the production volume is proportional to the fossil energy input, there is not a huge need for repetitive information exchange, which different from solar power plants [
42].
Power plants using either renewable energy or non-renewable energy may face four situations, depending on their respective power production level: sufficient or insufficient. When designating the non-renewable energy-based power production as A and the renewable energy-based power production as B, an ordered pair {A [sufficient], B [insufficient]} represents the case where both A and B produce enough power and are able to avoid the worst case of a blackout, corresponding to two “Avoid” in a normal game, and the payout is 3.3. This means that the risk of a blackout has been reduced, but still, such a situation should be avoided, as power could be wasted due to the inefficiency of storing the surplus power.
In the case of {A [sufficient, B [insufficient} or {A [insufficient], B [sufficient]}, the production in both A and B are balanced, corresponding to the Nash equilibrium in the scenario. Meanwhile, the case {A [insufficient], B [insufficient]} represents two “Go Straight” situations in a normal game, with the payout of 1,1 corresponding to the worst situation, where a blackout is a strong possibility. The variable fossil_fuel_electric_power_production_forecast in the pseudocode prioritizes the avoidance of the worst situation in game theory and moves in the direction of the Nash equilibrium [
41,
59].
Additionally, it was confirmed that there was a negative correlation between each of the power production volumes (June, July, and August 2018) for the Yeongam Solar Power Plant, which is considered to be an alternative to the nuclear power plants in the Republic of Korea, and the frequency of appearance of a word “rainfall”. This means that the accuracy of the solar power production forecast can be increased with such a correlation. Forecasting the power demand/production in a solar power plant is similar to performing a calculation with a function that can be affected by numerous inputs, so even though using big data may help to improve the accuracy, it is not easy to find an optimal virtualization solution just by identifying a number of correlations.
6. Conclusions
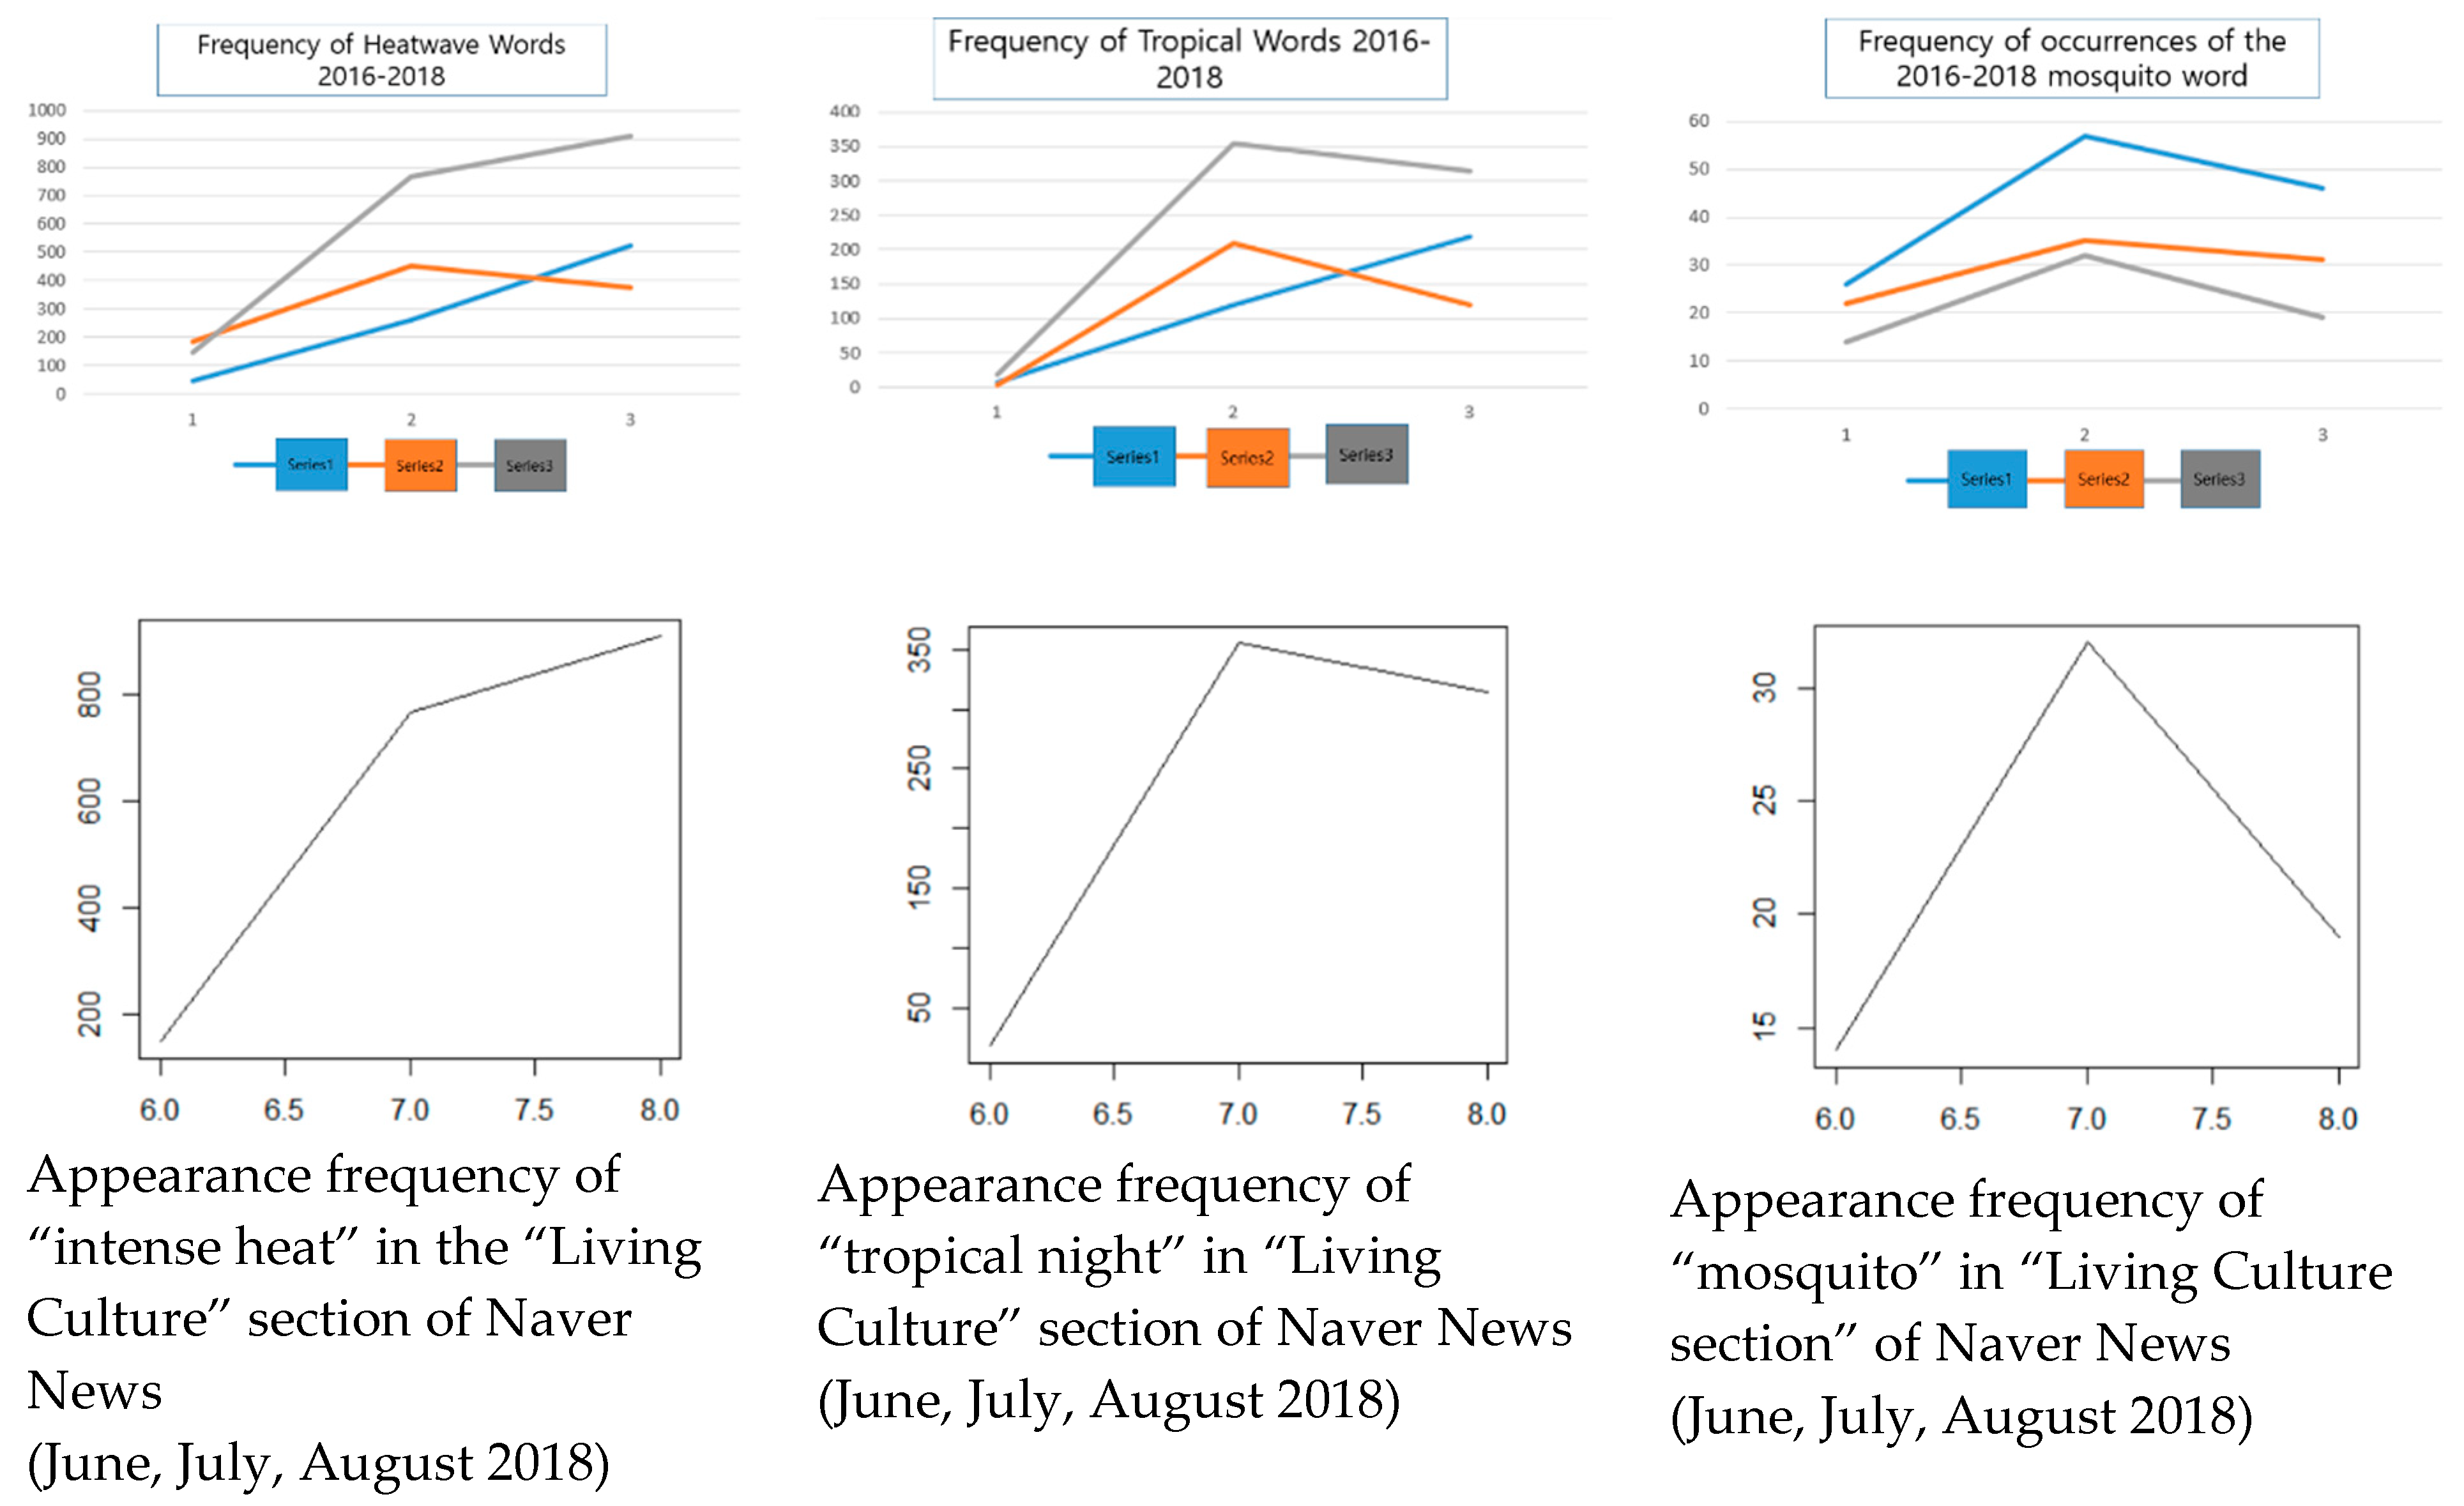
The above graphs were used for a longitudinal comparison of the average appearance frequency of words related to the summer season in the “Life and Culture” section of Naver, an Internet search and news site, from 2016 to 2018. The words were “intense heat”, “tropical night”, and “mosquito”, and unlike the results obtained from the horizontal comparison, it was difficult to relate “intense heat” with “tropical night”. Instead, the word “mosquito” most commonly appeared in July, and this is because of the fact that the mosquito hatching time is usually in midsummer, a period that provides the right temperature, humidity, and blood-sucking environment.
This paper analyzed the correlations between power demand and three particular words obtained by analyzing news articles collected through web crawling for a three-year starting from 2016. The analysis result showed that the frequency of words “intense heat” and “tropical night” had a strong quantitative correlation with the fluctuations in the maximum power in the summer season, whereas the word “mosquito” did not show any significant correlation.
Additionally, the longitudinal correlation analysis revealed that the frequency of the two words mentioned above did not have any particular longitudinal correlations but “mosquito” showed the highest value in July due to its biological characteristics. Therefore, it is possible to conclude that the respective appearance frequencies are correlated with maximum power consumption, and such a finding can be useful for enhancing the accuracy of future power consumption forecasting.
This paper proposed a power production scheme that can find an optimal virtualization solution for a power plant using either fossil energy or new and renewable energy based on game theory employing power demand forecasts. Considering the fact that electric power is quite difficult to store and brings about much inefficiency during its process, the goal was to maintain the minimum storage level by controlling power production levels. Fossil energy-based power production can be controlled relatively more easily compared to solar power production. Thus, the proposed production scheme will be able to utilize limited energies more efficiently and will be able to increase cost effectiveness while allowing solar power plants to operate in a more controlled production environment to provide an effective means of reducing pollutants such as fine dust, greenhouse gases, or the other toxic materials that are harmful to people’s health and mental state as well as the global environment.


