Article

A Comparative Study of High-Temperature Latent Heat Storage Systems

1
Department of Energy Science and Engineering, University of Queensland-Indian Institute of Technology Delhi Academy of Research (UQIDAR), Indian Institute of Technology, Delhi 110016, India
2
Department of Energy Science and Engineering, Indian Institute of Technology, Delhi 110016, India
3
School of Mechanical and Mining Engineering, University of Queensland, Brisbane 4072, Australia
*
Author to whom correspondence should be addressed.
Energies 2021, 14(21), 6886; https://doi.org/10.3390/en14216886
Submission received: 1 September 2021 / Revised: 7 October 2021 / Accepted: 11 October 2021 / Published: 20 October 2021
(This article belongs to the Special Issue Thermal Energy Storage for Concentrated Solar Thermal Applications)

Abstract

:
High-temperature latent heat storage (LHS) systems using a high-temperature phase change medium (PCM) could be a potential solution for providing dispatchable energy from concentrated solar power (CSP) systems and for storing surplus energy from photovoltaic and wind power. In addition, ultra-high-temperature (>900 °C) latent heat storage (LHS) can provide significant energy storage density and can convert thermal energy to both heat and electric power efficiently. In this context, a 2D heat transfer analysis is performed to capture the thermo-fluidic behavior during melting and solidification of ultra-high-temperature silicon in rectangular domains for different aspect ratios (AR) and heat flux. Fixed domain effective heat capacity formulation has been deployed to numerically model the phase change process using the finite element method (FEM)-based COMSOL Multiphysics. The influence of orientation of geometry and heat flux magnitude on charging and discharge performance has been evaluated. The charging efficiency of the silicon domain is found to decrease with the increase in heat flux. The charging performance of the silicon domain is compared with high-temperature LHS domain containing state of the art salt-based PCM (NaNO3) for aspect ratio (AR) = 1. The charging rate of the NaNO3 domain is observed to be significantly higher compared to the silicon domain of AR = 1, despite having lower thermal diffusivity. However, energy storage density (J/kg) and energy storage rate (J/kgs) for the silicon domain are 1.83 and 2 times more than they are for the NaNO3 domain, respectively, after 3.5 h. An unconventional counterclockwise circular flow is observed in molten silicon, whereas a clockwise circular flow is observed in molten NaNO3 during charging. The present study establishes silicon as a potential PCM for designing an ultra-high-temperature LHS system.

1. Introduction

Increased global energy consumption, limited reserve of fossil fuels, and their harmful impact on the environment have compelled a paradigm shift towards sustainable energy sources [1]. Renewable energy sources, especially solar and wind energy can act as potential alternatives to address the challenges faced due to conventional fuels. Solar energy is considered the most attractive sustainable renewable resource due to its relatively low cost and abundance. However, the spatial mismatch and temporal intermittency of solar energy necessitate efficient energy storage systems, in order to bridge the gap between energy supply and demand [2,3].
Thermal energy storage (TES) can address the discontinuity of solar energy by storing heat during the duration of sunshine hours and releasing it during periods with no sun [4,5]. Moreover, TES enables an increase in overall efficiency and better reliability in an energy system which can lead to better economics, reductions in investment and running costs, and a lower rate of pollution of the environment [6]. Hence, TES is becoming an integral component of third generation CSP which can simultaneously improve the dispatchability of solar energy, reliability and effectiveness of CSP systems.
Third generation CSP with high-temperature TES has more potential to generate dispatchable electricity with a low cost of levelized cost of energy (LCoE). This can be attributed to the integration of advanced power cycles (supercritical CO2 cycle) which have high thermodynamic efficiency to high-temperature CSP systems. Therefore, the central receiver system is regarded as the most viable option for third generation CSP, compared to PTC and LFR in the USA, China, and the EU [7]. Moreover, co-production of process heat and power from TES can be regarded as an ideal technology only at high temperatures (>900 °C) [8]. In addition, high-temperature thermal energy has higher exergy content compared to low-temperature thermal energy according to the law of quality. Hence, third generation CSP coupled with high-temperature TES can be considered a suitable approach to generating cost-effective power with a span of storage durations.
Thermal energy storage can be achieved in a medium using three techniques: (1) sensible heat storage (SHS), (2) latent heat storage (LHS), and (3) thermochemical heat storage (TCHS) [9]. SHS is defined as the storage and release of energy due to temperature gradient in a medium. LHS is defined as the storage and release of energy isothermally through phase transition of a medium. Thermo-chemical heat storage (TCHS) systems store and release energy through reversible endothermic and exothermic reactions. The three technologies can be compared on the aspects of energy storage density, technology maturity and commercial viability [10]. TCHS has high energy storage density and is still in the early phase of research. SHS, the only practical developed technology for CSP, has the lowest energy density, leading to large volume and cost. The LHS system, which has a relatively high energy density compared to SHS, has been commercialized for low- and medium-temperature applications such as thermal comfort in buildings [11]. Hence, the potential of a high-temperature LHS system needs to be evaluated to be integrated with high-temperature CSP applications.
Low thermal conductivity, lower thermal stability, and medium heat of fusion of PCMs in available LHS systems are the major obstacles to their wide-scale deployment, even though they have large energy storage density. There are different methods to enhance thermal performance in traditional latent storage systems using fins, cascading different PCMs, and encapsulating PCMs [12]. However, these methods have the limitations of reducing the storage volume of PCMs, leading to a decrease in energy density potential during the charging/discharging of the LHS system [13]. A probable alternative could be utilizing metallic PCMs that have large thermal conductivity, heat of fusion and high thermal stability. Generally, the latent heat of fusion and thermal stability increase with melting temperature for PCMs [14]. Hence, there is a growing interest in research for PCMs that have high melting temperatures.
The contemporary research on high-temperature PCMs is mostly focused on inorganic salts and metallic PCMs. However, metallic PCMs present some specific benefits over salts, such as little or no subcooling, lower volumetric change during phase transition and high thermal conductivity (>>1 W/m K) [15]. Eutectic metals were initially proposed as ideal high-temperature PCMs to accumulate heat for industrial processes in 1979 [16]. A TES system was devised employing a eutectic mixture of silicon and aluminum (AlSi12) in 2001 [17]. Kotze et al. developed a prototype using AlSi12 as PCM and mathematical model to compare the prediction of model with the test rig to better understand the behavior of the LHS system [18]. Six alloys of aluminum and silicon were evaluated to examine their suitability as high temperatures (550–1200 °C) PCM for thermal storage [19]. Karim et al. [20] proposed Al-Si-Ni and Mg-Si metallic eutectics as suitable high-temperature (above 900 °C) PCMs. Moreover, Si, Al, and B operating at temperatures >900 °C can have energy densities 20 times higher than commercialized inorganic salts.
Discontinuity on the melting/solidification front and the transient motion of the phase change front make it challenging to obtain a precise analytical solution for the phase transition process [21]. Limited experimental studies are performed for high-temperature LHS [22]. Most experimental studies are performed for organic PCMs such as paraffin and n-octadecane operating at a low- to medium-temperature range. This necessitates a growing demand to develop computational models to comprehensively study the phase transition of high-temperature PCMs. Khare et al. [23] evaluated the ecological impact of the few metals such as Al, Mg, and Zn, and mixtures: Al60Mg34Zn6 and Al88Si12. It is observed that the key challenges to the wide-scale deployment of metallic PCM as storage media is their chemical reactivity and interaction with PCM enclosures.
Although numerical models can change widely based on the type of systems, utilizing numerical investigation is necessary due to its cost-effectiveness and reduced time. Yadav and Sameer, 2019 [24] performed both experimental and numerical studies to analyze the melting of paraffin wax in a rectangular domain for four uniform heat fluxes. Kheirabadi and Groulx [25] investigated the melting of lauric acid in rectangular enclosures using COMSOL Multiphysics to observe the effect of mushy zone parameters. Assis et al. [26] performed experimental and numerical studies to analyze the melting of paraffin wax in spherical enclosures using air on top of PCM. The velocity distribution and convective heat flux were observed inside molten silicon having same Prandtl number and different Rayleigh numbers (Ra = 100, and Ra = 1000) during melting [27]. The solidification of silicon in a closed truncated-cone domain was investigated without considering the density variation between solid and molten silicon [28]. Zeneli et al. [29] performed a numerical analysis of a silicon-based LHS system for different shape containers, considering the buoyancy-empowered free convection and volume change during melting. Ray et al. [30] analyzed the melting performance of silicon for different dimensions of rectangular enclosures, and obtained a correlation of liquid fraction as a function of dimensionless numbers. To summarize, a comprehensive numerical investigation to elucidate both charging and discharge performance of high-temperature LHS containing metallic PCM is still to be explored in depth. There is no quantitative study to substantiate the potential of metallic silicon compared to conventional high-temperature salt-based PCM to develop high-temperature LHS, to the best of authors’ knowledge.
It is evident from the preceding discussion that limited research has been performed to evaluate the thermal (charging and discharging) performance of high-temperature LHS containing metallic PCM. Hence, a comprehensive study is required to determine the thermo-fluidic performance during charging and discharging of high-temperature LHS. The present article illustrates the effective heat capacity formulation utilized to mathematically model the conjugate heat transfer during melting and solidification of high-temperature PCM in rectangular enclosures. The critical thermal performance parameters, such as charging/discharging rate and energy storage density of high-temperature LHS having metallic PCM (silicon) and inorganic salt (sodium nitrate) are compared. The influence of the orientation of the domain and heat flux magnitude on thermal performance is evaluated.

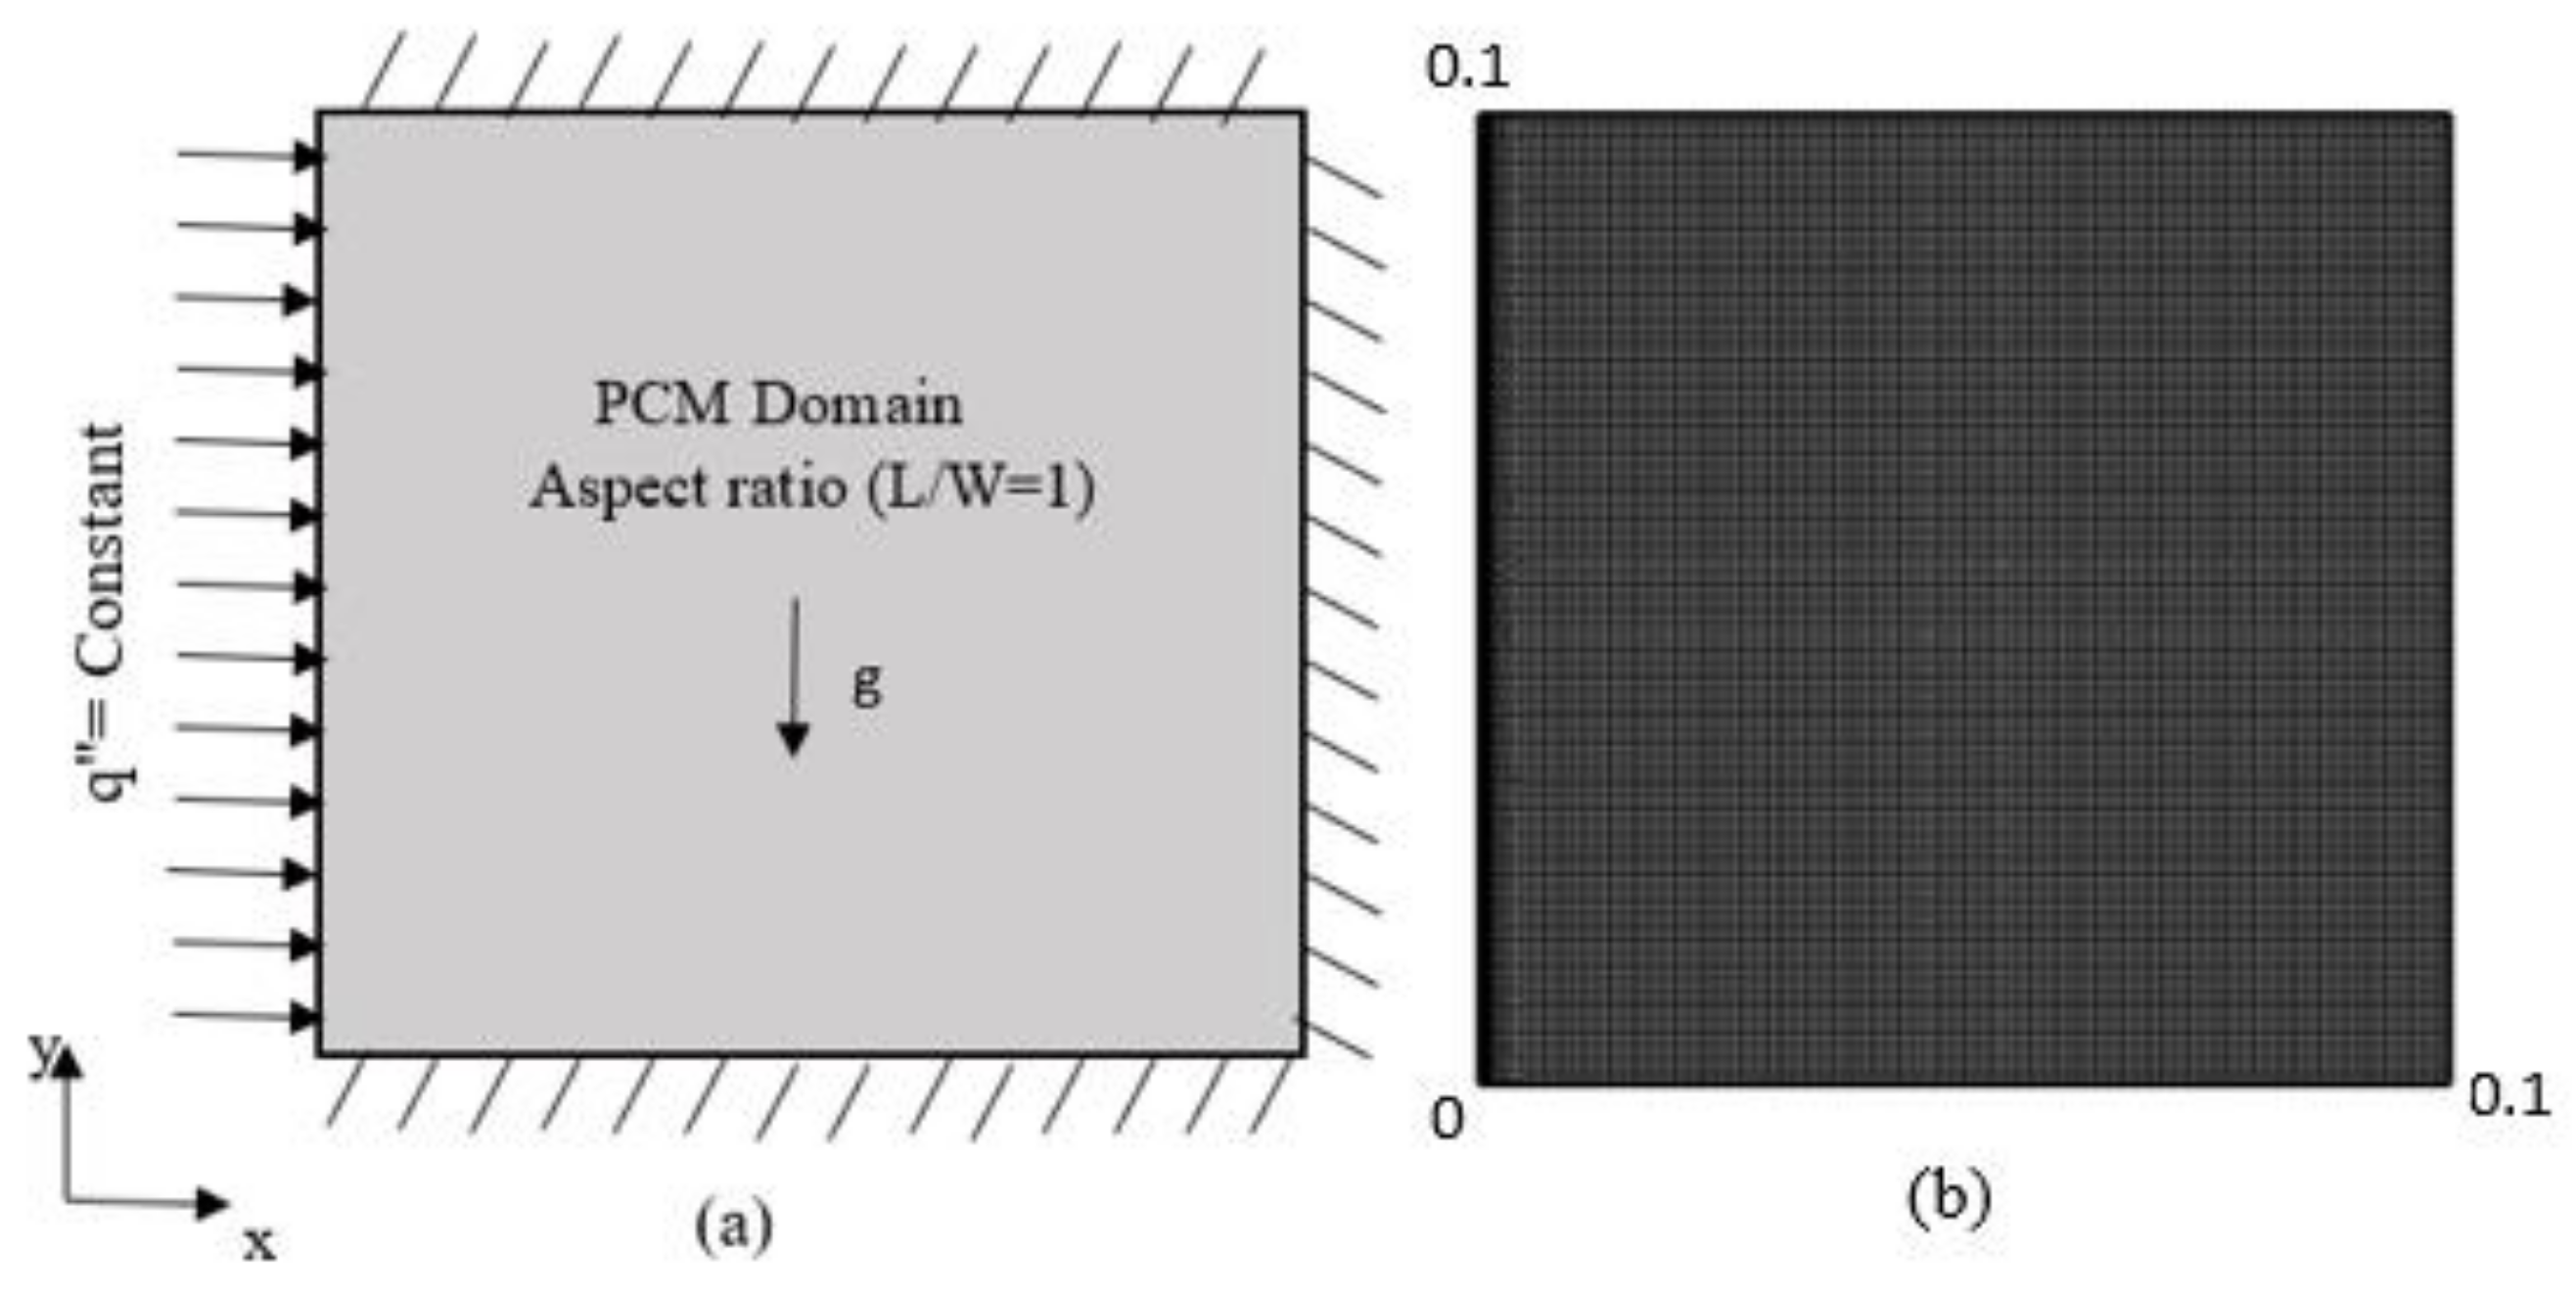
2. System Description

A rectangular geometry is treated as the physical domain to analyze the melting and solidification of high-temperature LHS containing silicon or NaNO3. The physical domain can be considered as a PCM chamber containing solid PCM. The chamber boundaries are supposed to be made of highly conductive silicon carbide (SiC). An electrical heating rod can be used as a heat source for melting PCM at the mid cross-section of the chamber. The surface of the heating rod can be provided with uniform heat flux. One side of the heating rod in the physical domain is treated as the computational domain.
A rectangular configuration has been picked as the physical domain due to its numerous applications in energy storage, casting, etc. The computational domain can be considered as the 2D representation of the physical domain as it has a unit thickness normal to the plane of paper. A plane of symmetry is considered in the z-direction, neglecting all possible 3D effects. Figure 1a,b can be depicted as the 2D computational domain and discretized domain, respectively. The physical domain is subjected to isoflux on the left boundary with insulated boundary conditions on other surfaces. The thermophysical properties of silicon and NaNO3 used in the analysis are presented in Table 1.
The initial and boundary conditions, and fixed parameters for charging/melting of both domains are presented in Table 2. The initial and boundary conditions for the solidification/discharging of domains are the same except the opposite direction of heat flux (outward normal from the left surface) and initial temperature of domain. For example, the initial temperature of PCM is above the melting point for the discharging process, i.e., 590 K for NaNO3 and 1698 K for Silicon.
The comparison of thermal performance between the two domains is performed by fixing the same specific parameters for both cases, as listed in Table 2.

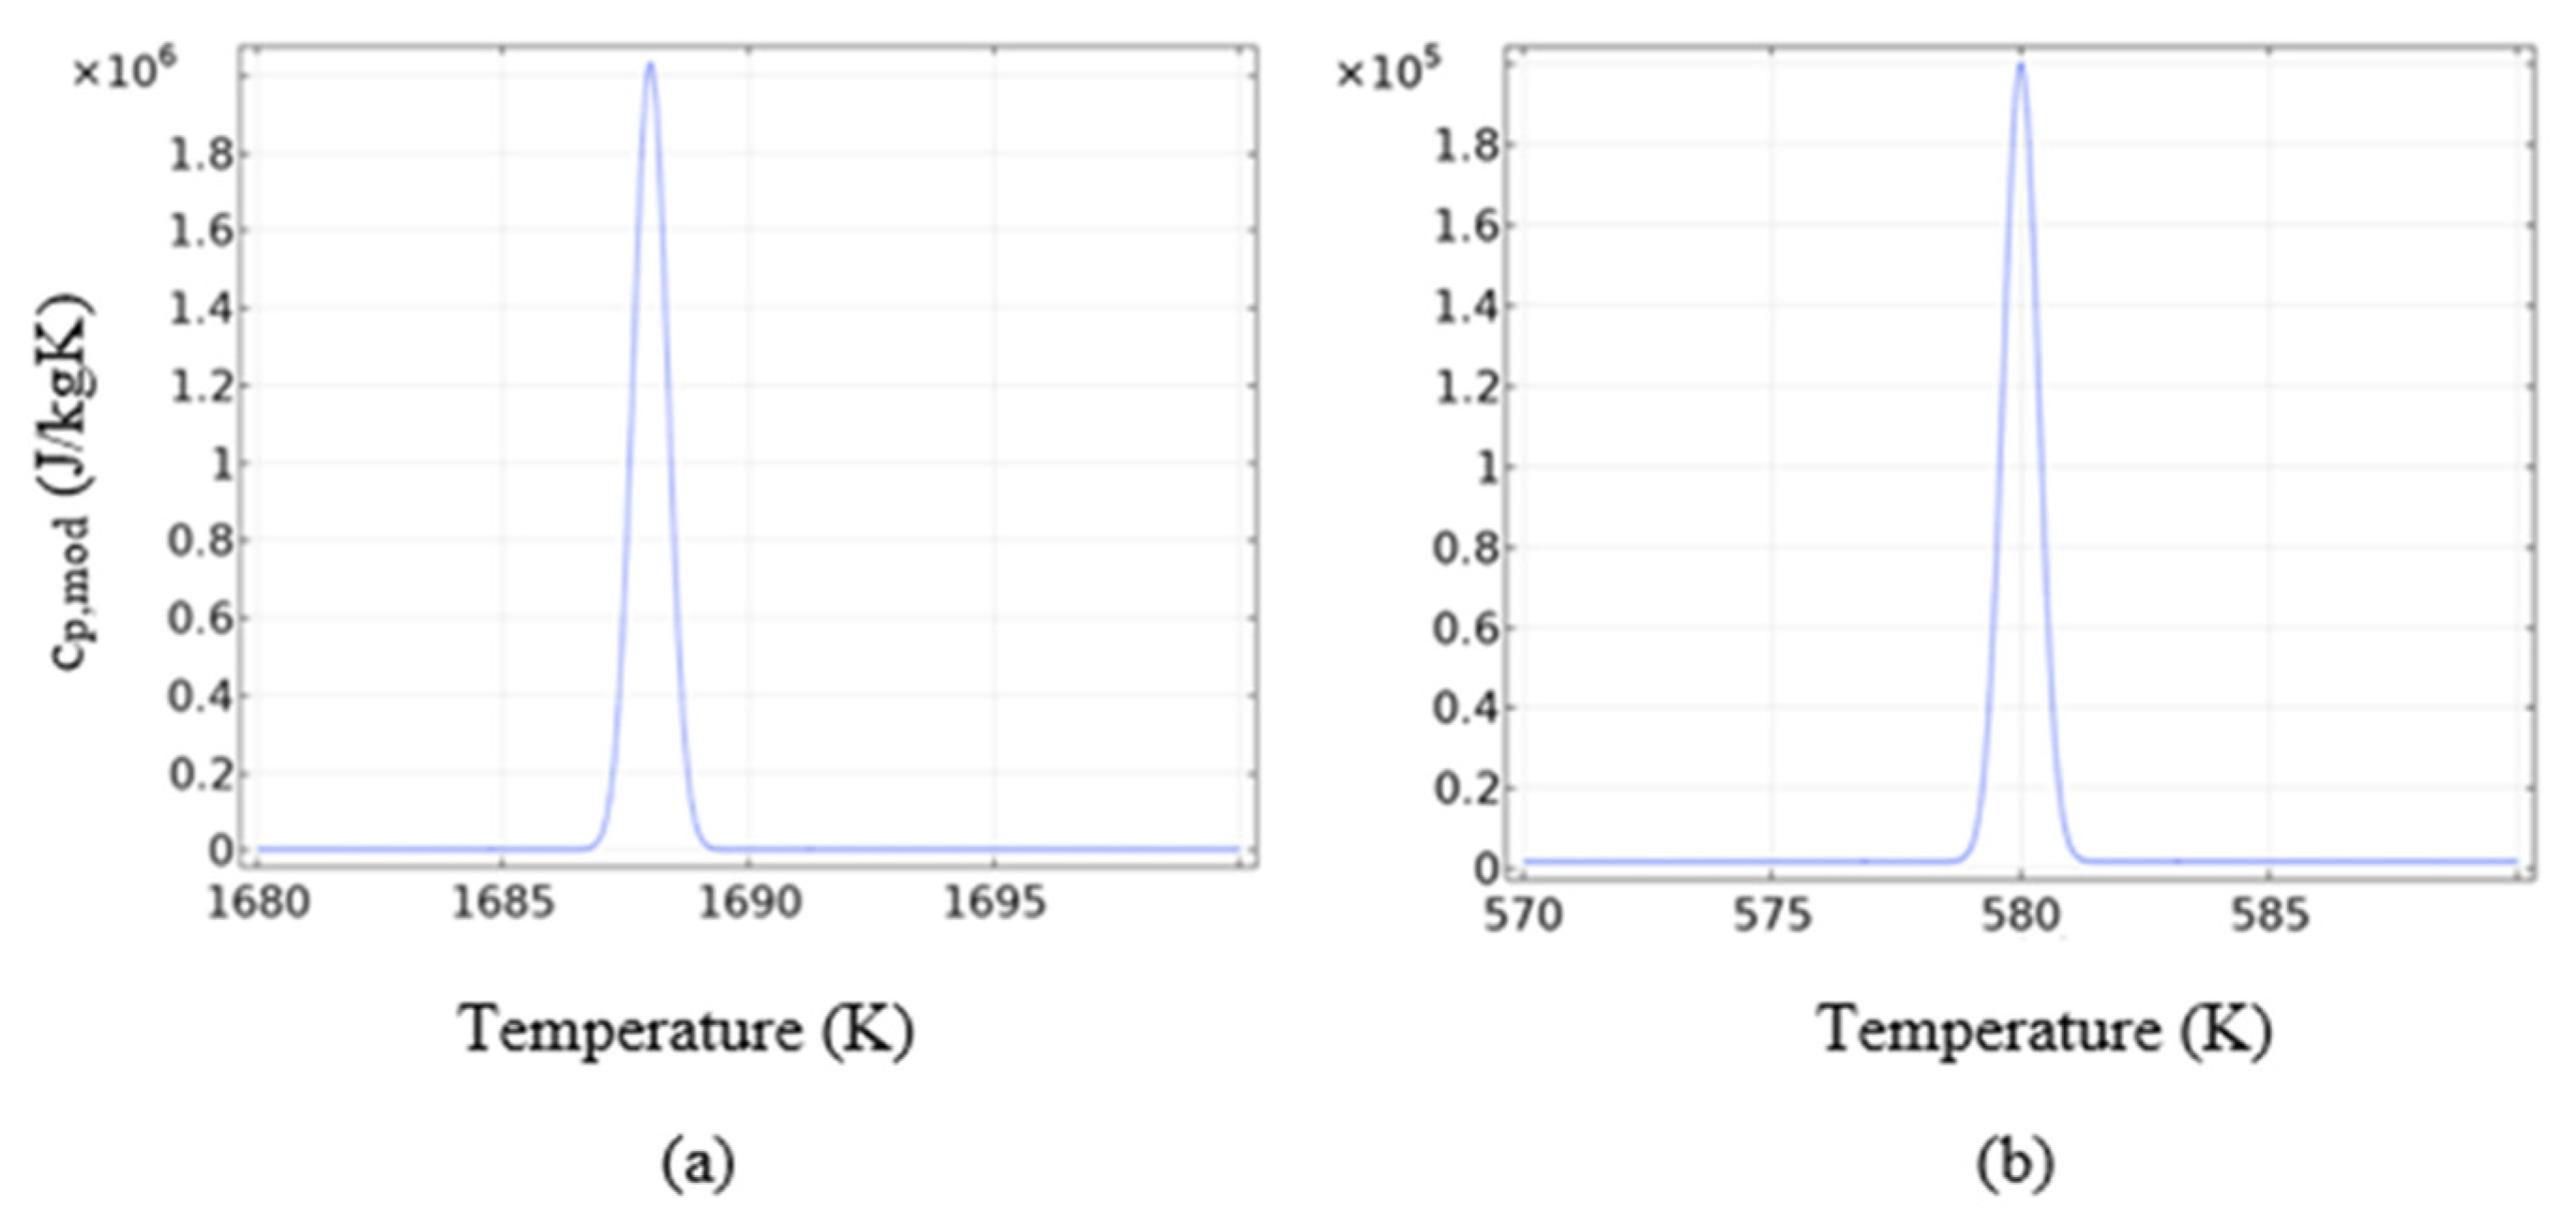
3. Numerical Methodology

The coupled multi-physics, i.e., heat transfer, fluid dynamics, and phase change simultaneously are modeled during the charging/discharging of the domain. The thermo-fluid processes during melting/solidification involve conduction in solid PCM, fluid dynamics in molten PCM, natural convection in molten PCM, and phase change. A fixed domain effective heat capacity formulation is employed because of the following benefits:
(i).
The energy equations for both solid and liquid phases are a single set of equation;
(ii).
Stefan’s boundary condition need not be explicitly fulfilled at the interface;
(iii).
The method considers the phase change to take place in a temperature interval which creates a mushy zone;
(iv).
The explicit reference to the moving interface is eliminated.
Effective heat capacity, a modification of the enthalpy-porosity technique, is first implemented by Ogoh and Groulux [31] in COMSOL Multiphysics without convection. Groulux and Biwole [32] established a set of equations within the COMSOL Multiphysics environment to solve the transient phase change heat transfer with natural convection. This formulation considers the phase transition to take place over the temperature interval Tm-ΔT/2 to Tm + ΔT/2, which creates an artificial mushy region during melting. This region can be treated as a pseudo-porous region where porosity changes from zero (pure solid) to one (pure liquid). Hence, the velocity of the molten PCM in the mushy region also changes from zero (solid phase) to the velocity generated due to natural convection in liquid phase. A momentum source term using the Carman-Koseny correlation is included in the momentum conservation equation to simulate the influence of damping inside the mushy zone.
The effective heat capacity formulation modifies the overall specific heat (cp, mod) of the PCM to consider the heat of fusion/solidification needed for a phase change in the PCM. The modified specific heat for NaNO3 and silicon are represented in Figure 2, which indicates a sudden change during the phase change transition interval. Similarly, other thermo-physical properties such as kmod, dynamic viscosity, and ρmod are introduced as a function of temperature. The modified properties are eventually introduced into the energy conservation equation.

4. Governing Equations and Assumptions

The conservation equations for mass, momentum, and energy for phase change problems are solved with the help of COMSOL Multiphysics based on finite element formulation (FEM) [33]. The governing equations can be mathematically expressed as follows:
Continuity u x + v y = 0
X   momentum ρ D u t = p x + 2 x μ u x + y [ μ ( u y + v x ]   S ( T ) · u
Y   momentum ρ D v t = p y + 2 y μ v y + x [ μ ( u y + v x ] + F B S ( T ) · v
The gravitational acceleration (g) acts vertically downwards at the center of mass of the geometry. Buoyancy-driven natural convection in the liquid PCM can be modeled through the Boussinessq estimation:
F B = ρ o k T g T T 0
where kT = Coefficient of thermal expansion;
ρ o   a n d   T o = Operating density and temperature;
ρ o = ρ l and To = Tm are considered in the numerical model.
The nonstatic fluid in the mushy zone is modeled using an additional source (S(T).u) in the Navier–Stokes equation in the form of the Carman–Kosney source term. The source term correlation employed to express the porosity function S(T) can be expressed as:
S ( T ) = A mush   1 β T 2 β T 3 + ε
This is the damping term to invoke the fluid dynamics inside mushy zone. S(T) has very large values corresponding to solid phase and zero corresponding to liquid phase inside mushy zone. The source term predominates in the Navier–Stokes equations and forces the predicted velocities to near zero at the beginning of melting of PCM. As charging progresses in the domain and melting portion increases, the source term reduces to zero.
Where   β T   = liquid   fraction = 0             T < T m Δ T 2         0 1           T m Δ T 2 T T m + Δ T 2 1                         T T m + Δ T 2
ΔT = Transition interval during melting of silicon (K);
Tm = Phase change temperature of PCM (K);
Amush = Damping constant in mushy zone (kg/m3s) = 105 for the current study;
ε = A small constant (10−3).
The energy equation with all the modified properties can be illustrated as:
ρ m o d c p , m o d T D T D t = · ( k m o d T T ) + E dis  
where
ρ m o d = θ   ρ sol   + ( 1 θ )   ρ liq
k m o d = θ   k sol   + ( 1   θ )   k liq
c p , mod = 1 ρ m o d   ( ρ sol θ   c p , sol + ( 1 θ )   c p , liq   ρ liq ) + h sl   β T
where
θ = 1   β                         α = 1 2 1 θ ρ l i q θ ρ s o l θ ρ s o l + 1 θ ρ l i q
The solution of the numerical model is derived considering the following assumptions:
  • Thermo-physical properties are treated as uniform and isotropic in both phases of PCM;
  • Motion in molten PCM is treated as incompressible and laminar;
  • Volume change of PCM is ignored during melting and solidification;
  • Energy dissipation due to viscosity is neglected;
  • The Boussinessq assumption is invoked to model the density variation;
  • It is perfectly insulated with no-slip and no-penetration boundary.
The melting and solidification process are modeled by combining conjugate heat transfer module with non-isothermal Multiphysics in COMSOL Multiphysics. The “heat transfer in fluids” and “fluid flow” physics are employed to model the energy and momentum conservation equations, respectively. The temperature field in both phases and velocity field in molten PCM are captured using a fully coupled solver. This is preferred over a segregated solver due to both ways coupling in natural convection. The fully coupled approach forms a single large system of equations that solve for all of the unknowns (the fields) and includes all of the couplings between the unknowns (the Multiphysics effects) at once, within a single iteration. Since the fully coupled approach includes all coupling terms between the unknowns, it often converges more robustly and in fewer iterations. The time-stepping for the transient problem is performed using the Backward Differentiation Formula (BDF). The Backward Differentiation Formula (BDF) solver is an implicit solver that uses backward differentiation formulas with an order of accuracy varying from one (also known as the backward Euler method) to five. Constant Newton method is applied in the fully coupled solver to solve the non-linear governing equations. The simulations are performed using COMSOL Multiphysics 5.4 in a system having Intel i5 Quad-Core processor (2.4 GHz) with 8 GB of RAM.

5. Results and Discussion

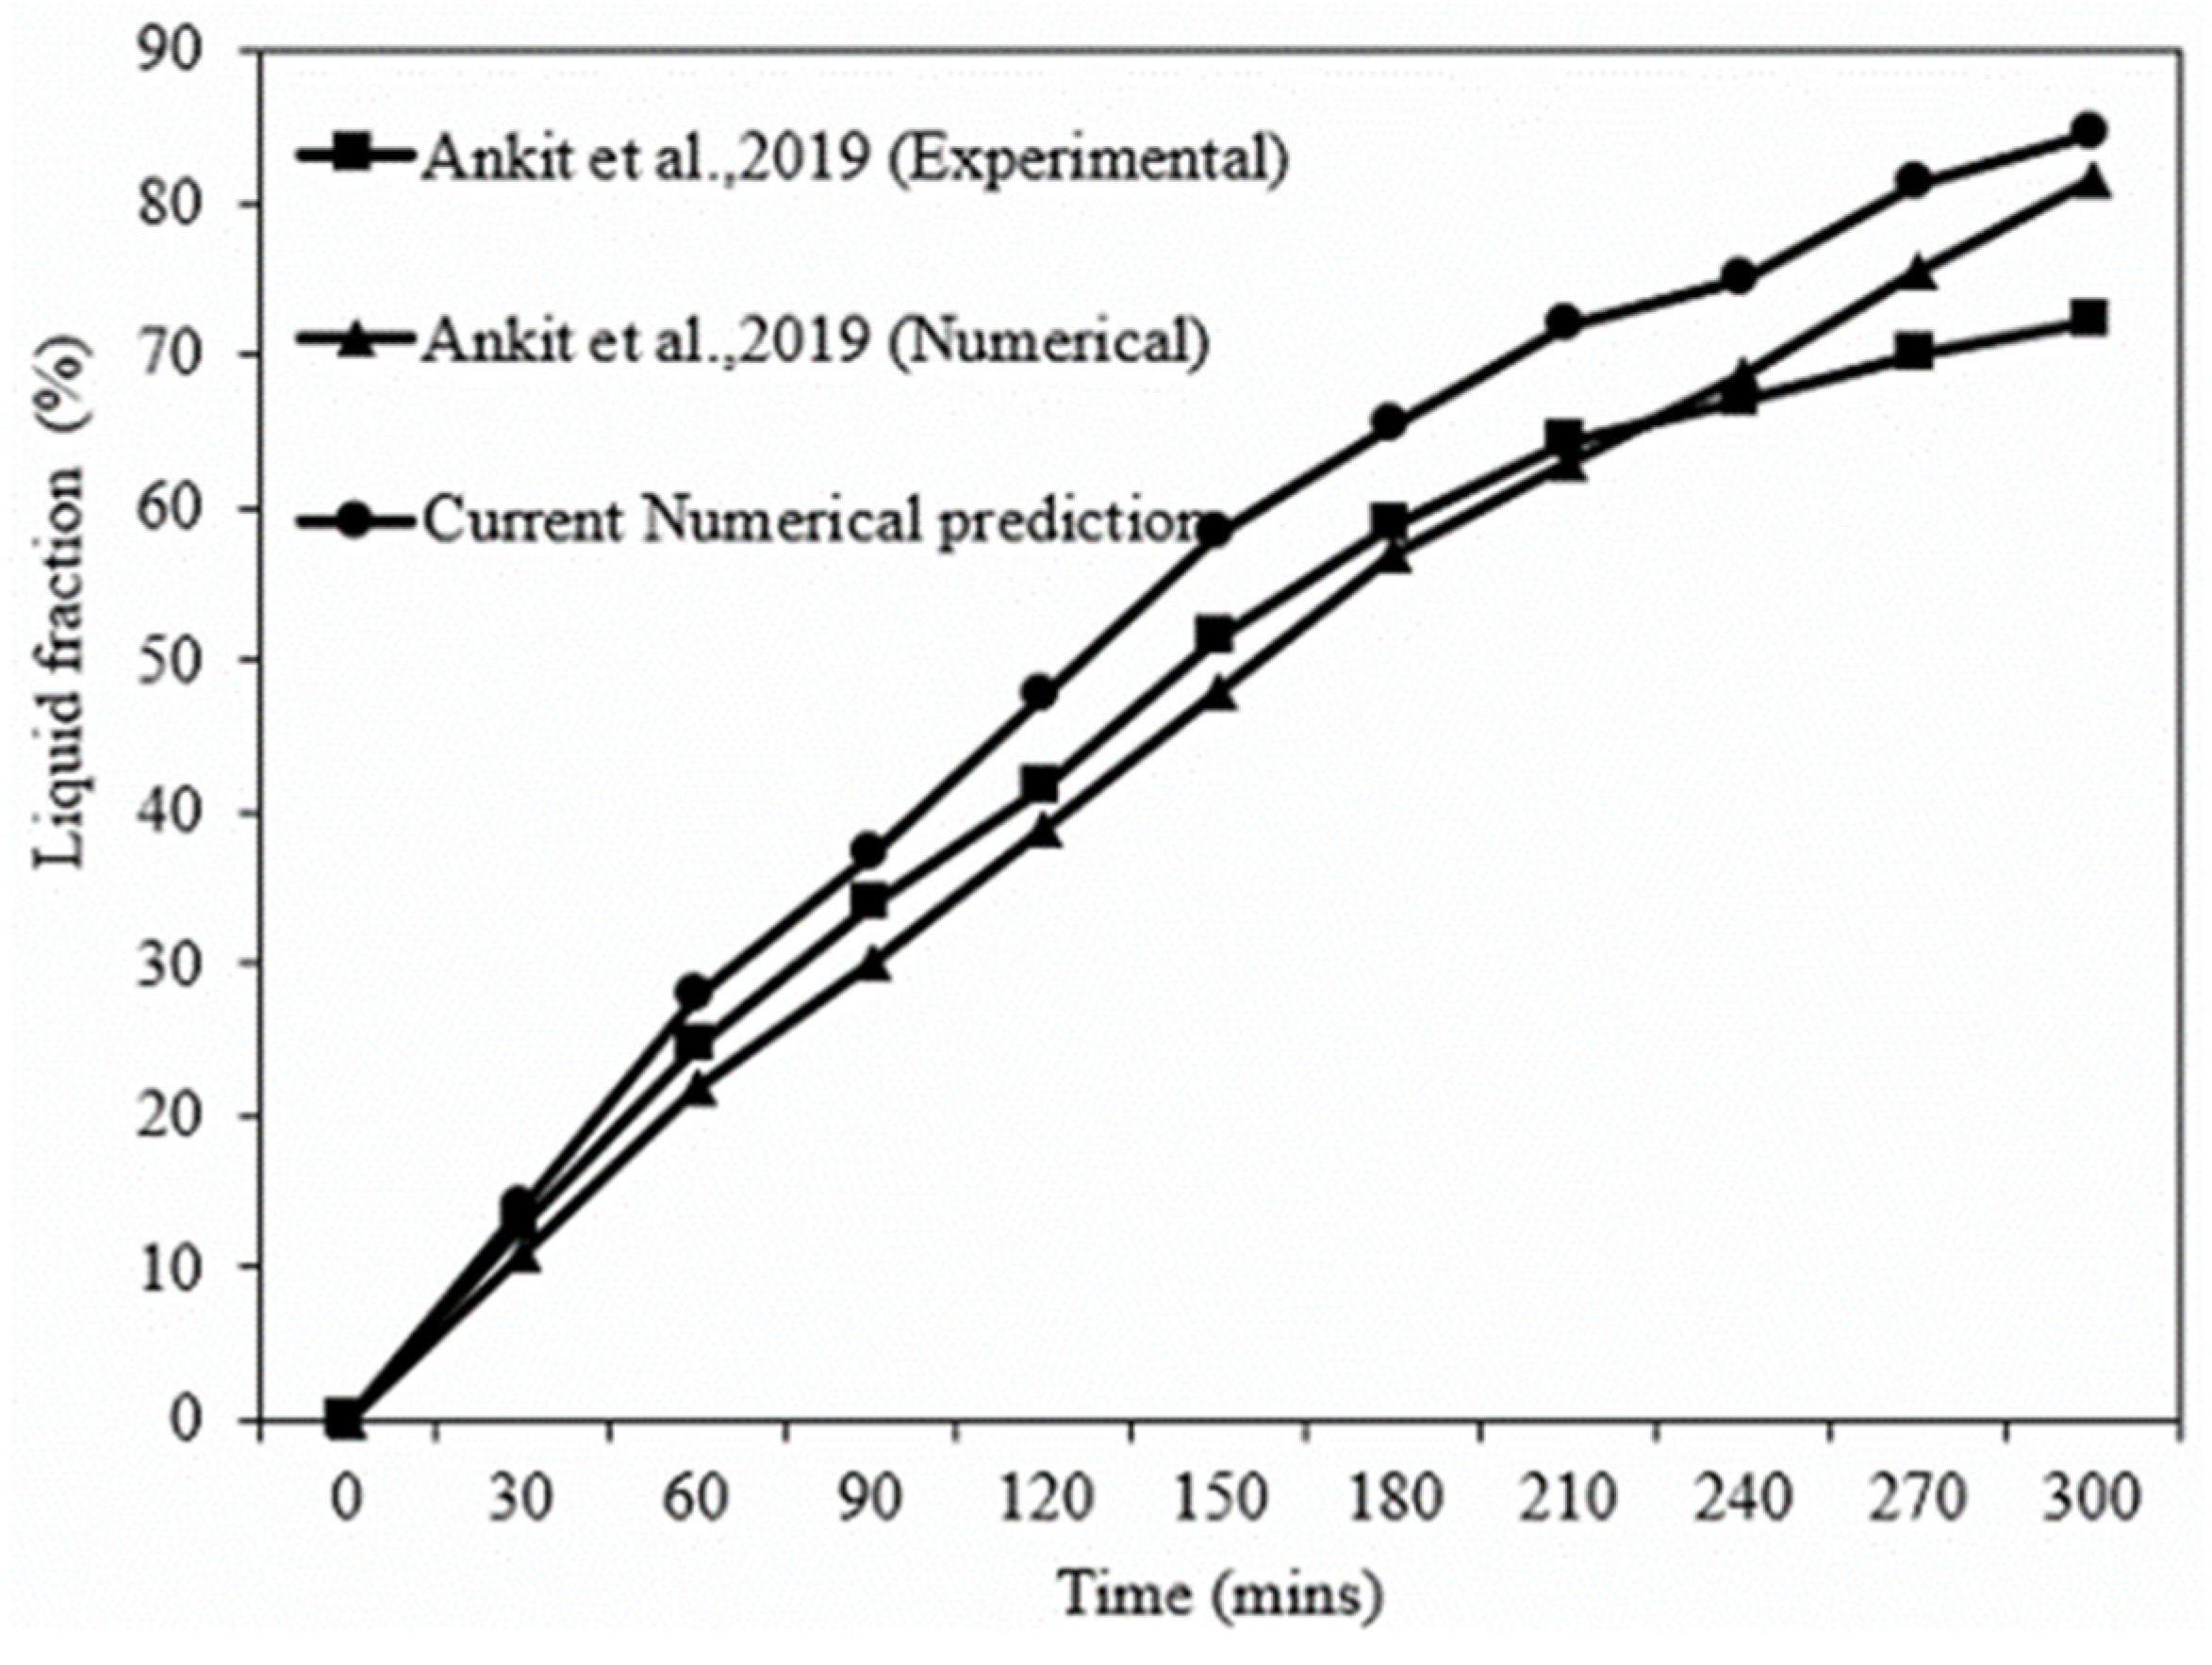
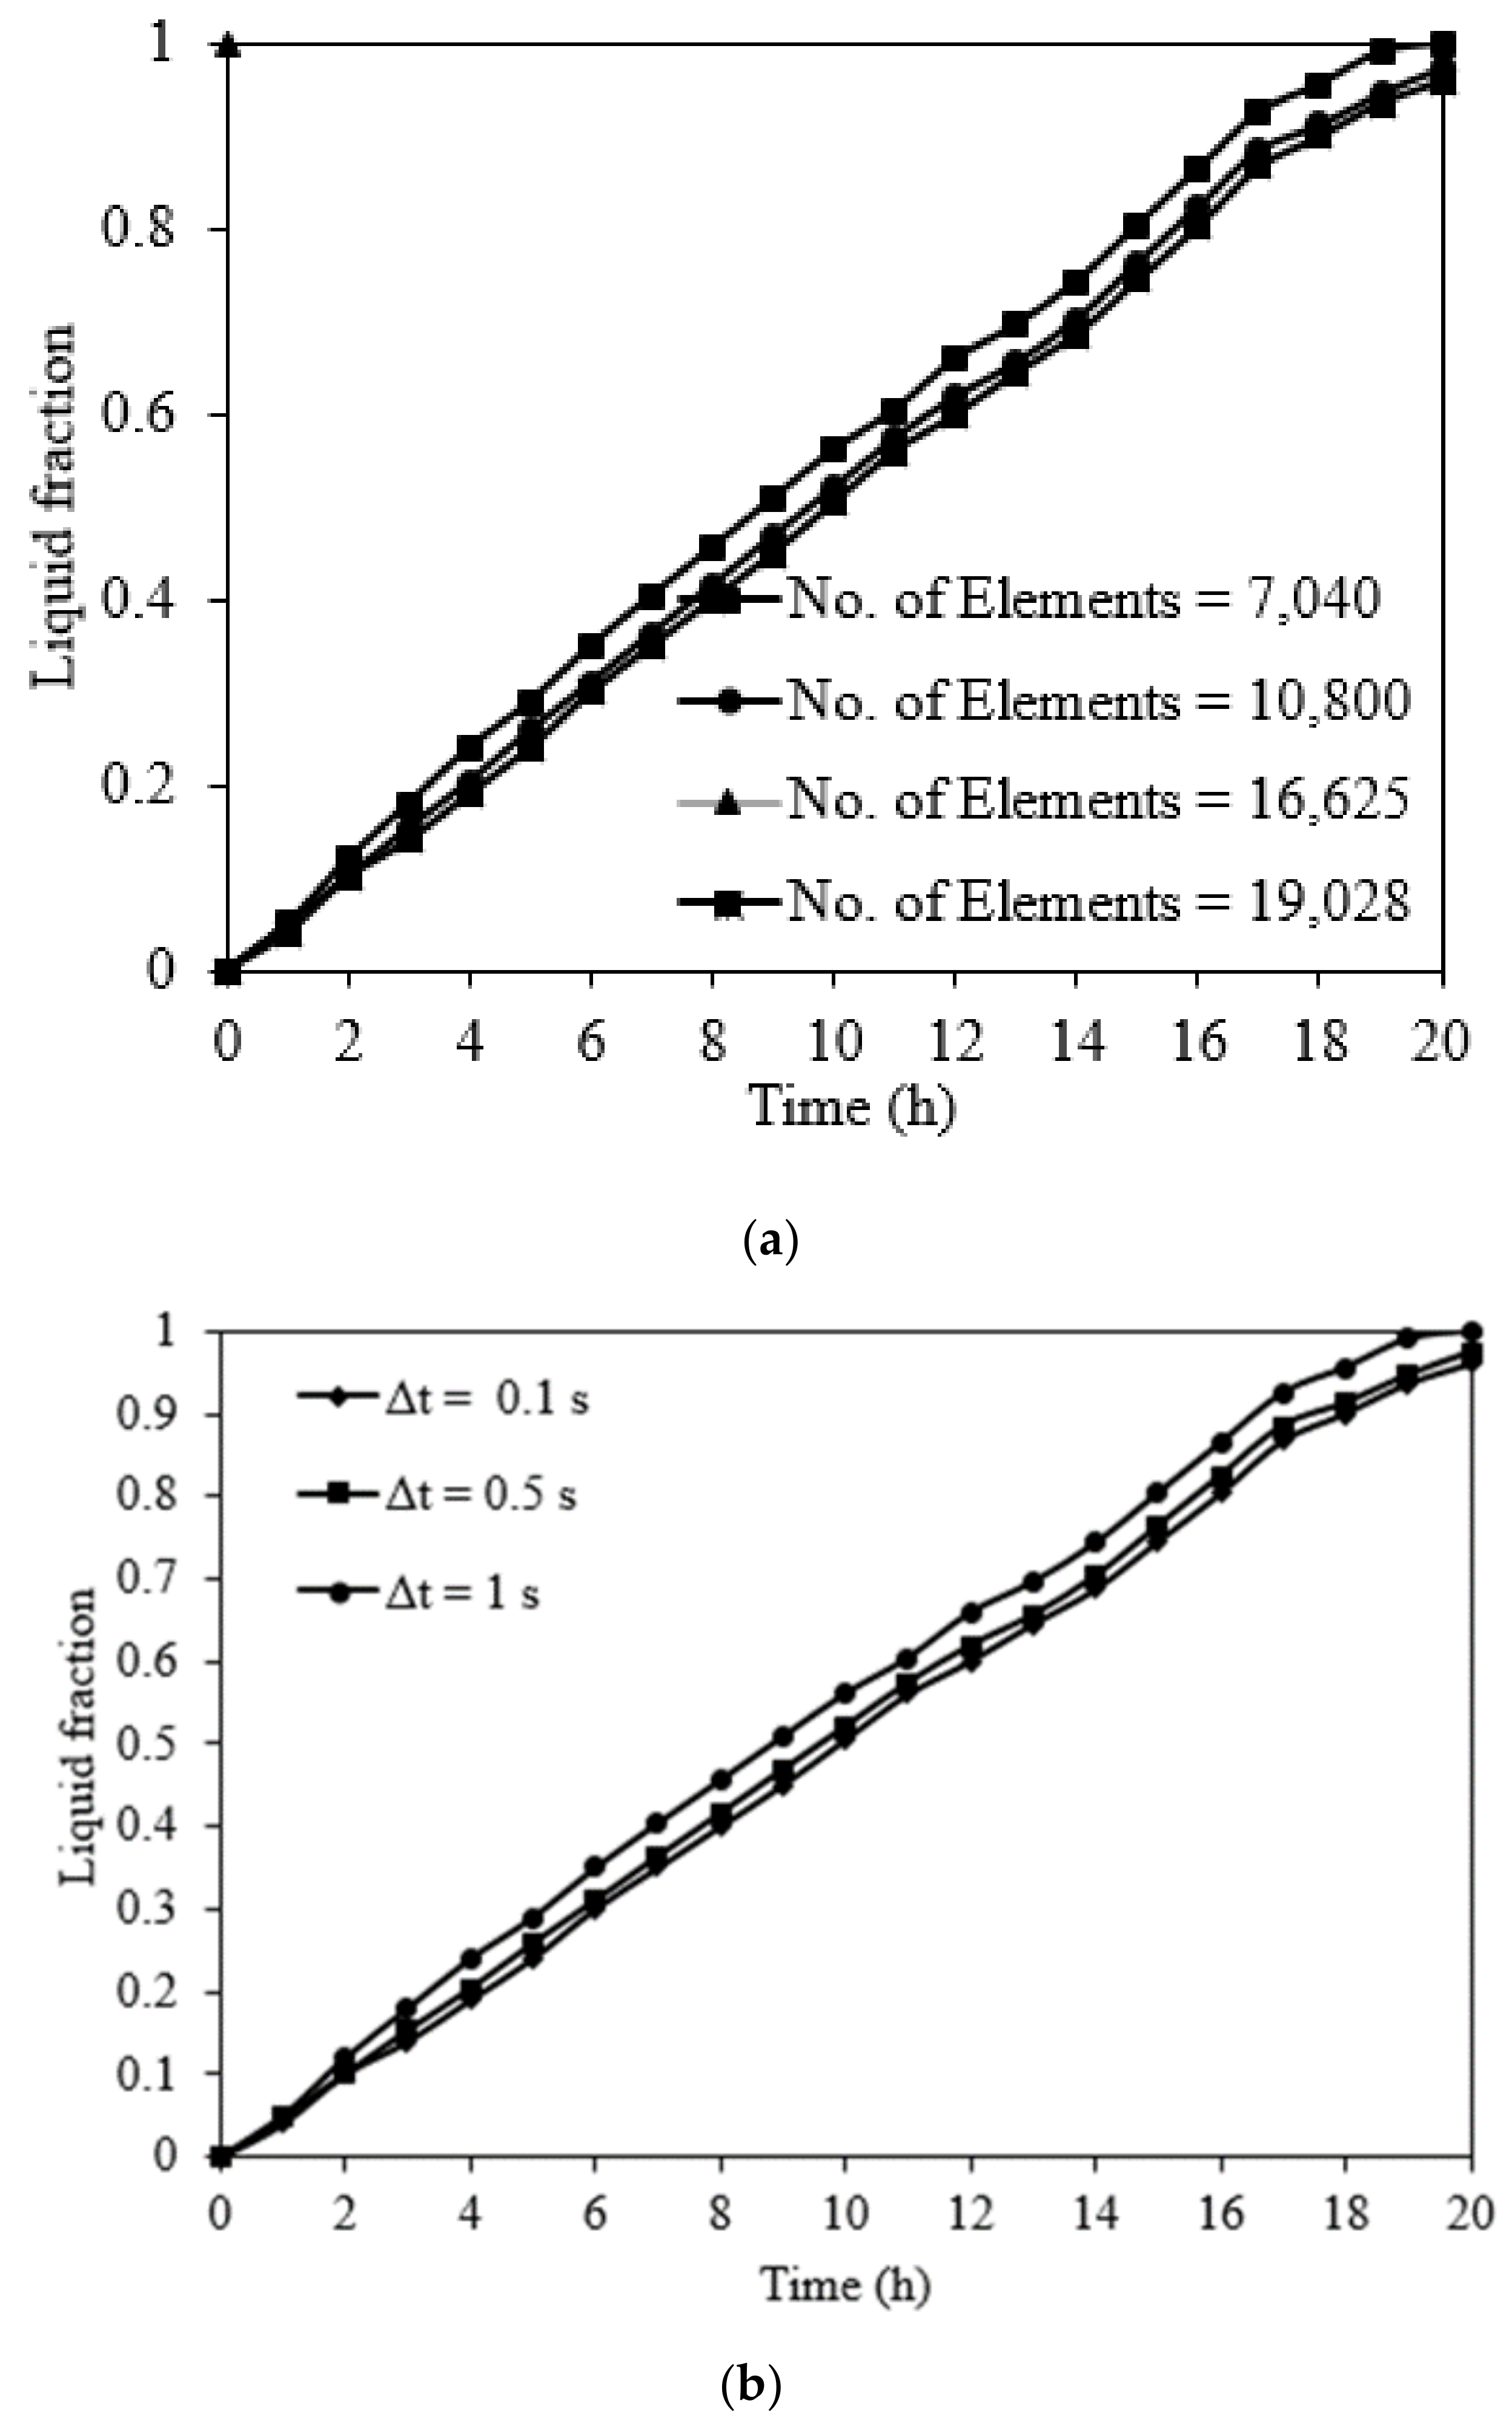
5.1. Model Verification and Validation

The current numerical formulation is validated against melting of low-temperature paraffin wax performed by Yadav and Sameer, 2019 [24] as illustrated in Figure 3 due to the absence of suitable experimental or numerical investigation for melting/solidification of silicon. This comparison considers the instance of left wall subjected to heat flux = 1930 W/m2 in a 150 mm×100 mm rectangular domain.
The deviation from experiments can be attributed to the perfect insulation assumption considered in the numerical model, because perfect insulation around the PCM is experimentally impossible causing heat losses. The maximum error from experimental results is 17%, which can be considered as reasonably good agreement.
The model is verified to check the grid and time dependency of the solution before the simulation. Four different grid sizes (7040, 10,800, 16,625 and 19,028) and three different time steps: 0.1 s, 0.5 s and 1 s are examined as shown in Figure 4a,b. The model with 16,625 elements with time step sizes of 0.5 s and 1 s produced a very similar variation in liquid fraction. The results do not show significant variation as the number of elements increases to 19,028. Though there is small deviation for time step of 0.1 s, time step size has marginal effect on the results. Hence, 16,625 elements with time step 1 s have been selected for rest of the analysis.

5.2. Thermal Performance of Silicon-Based LHS System

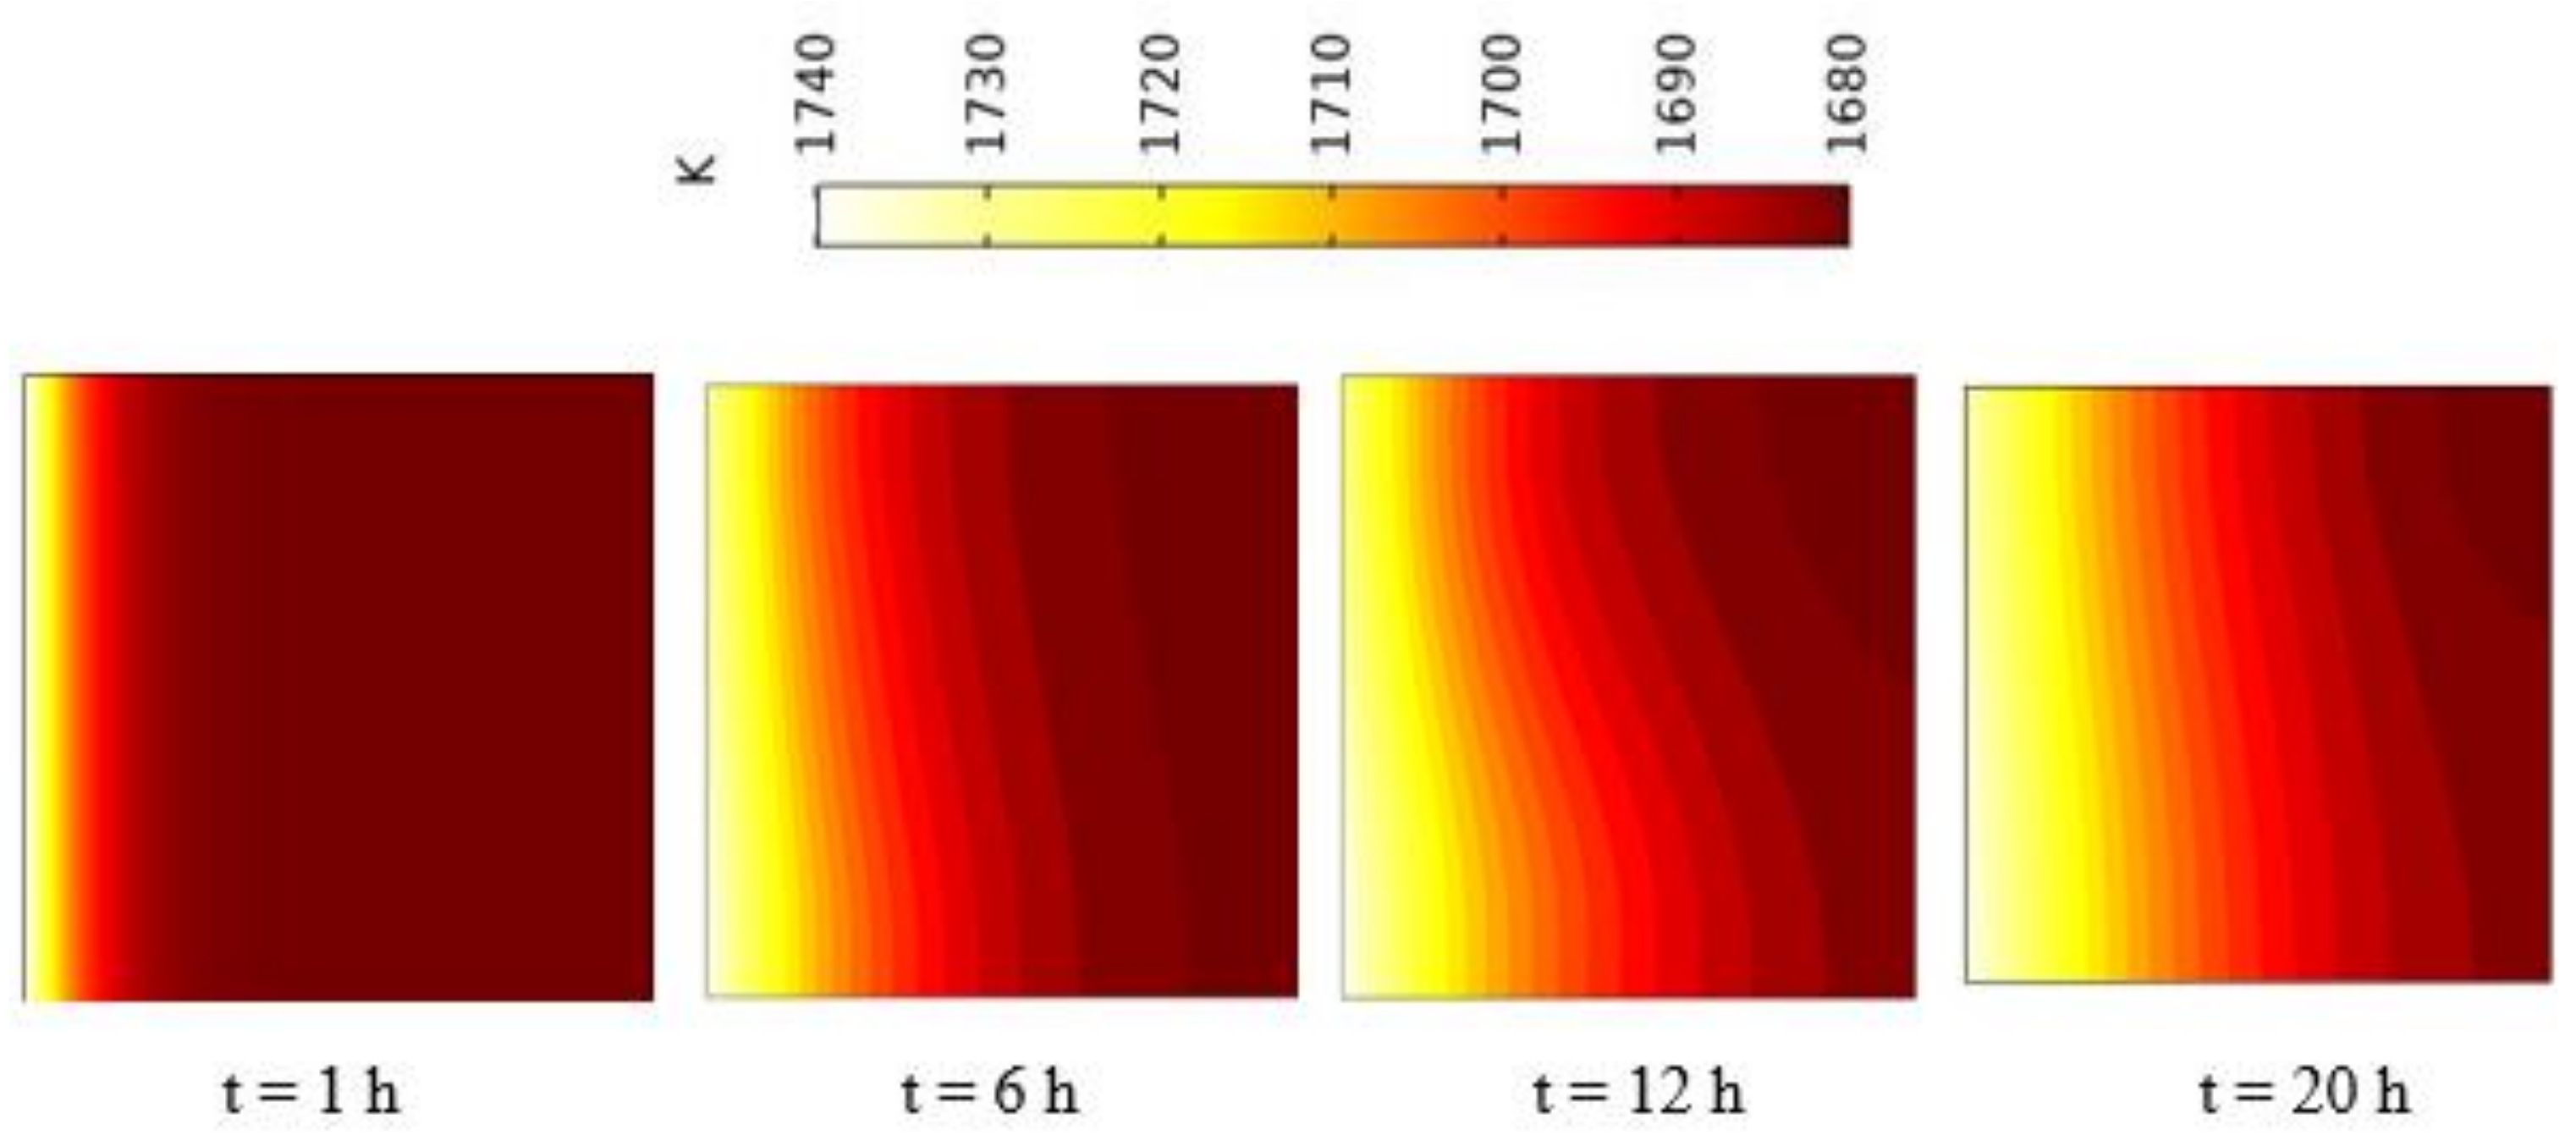
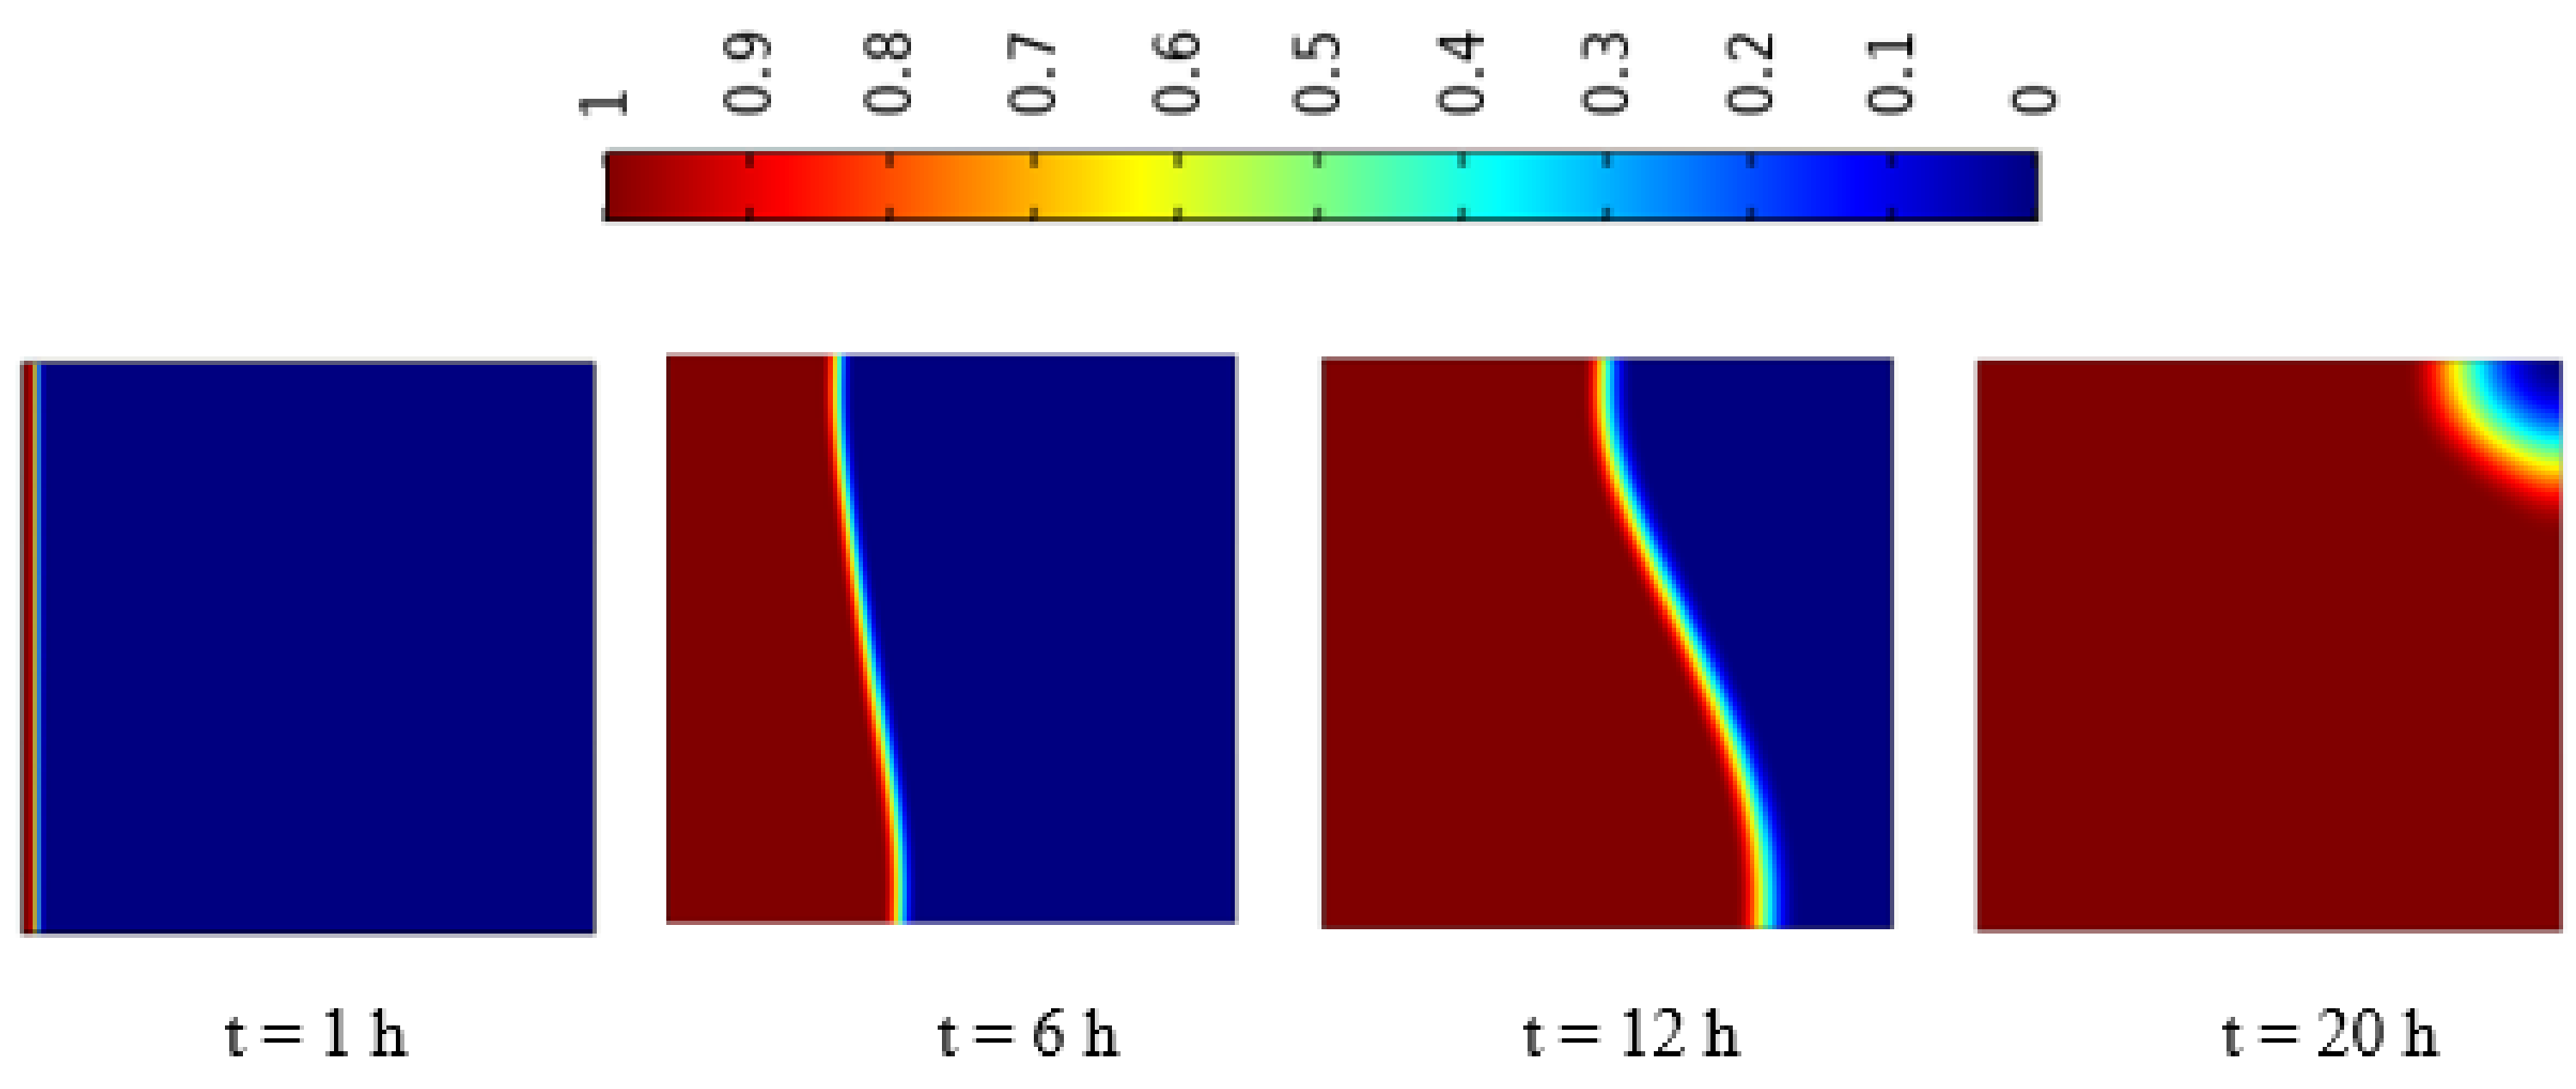
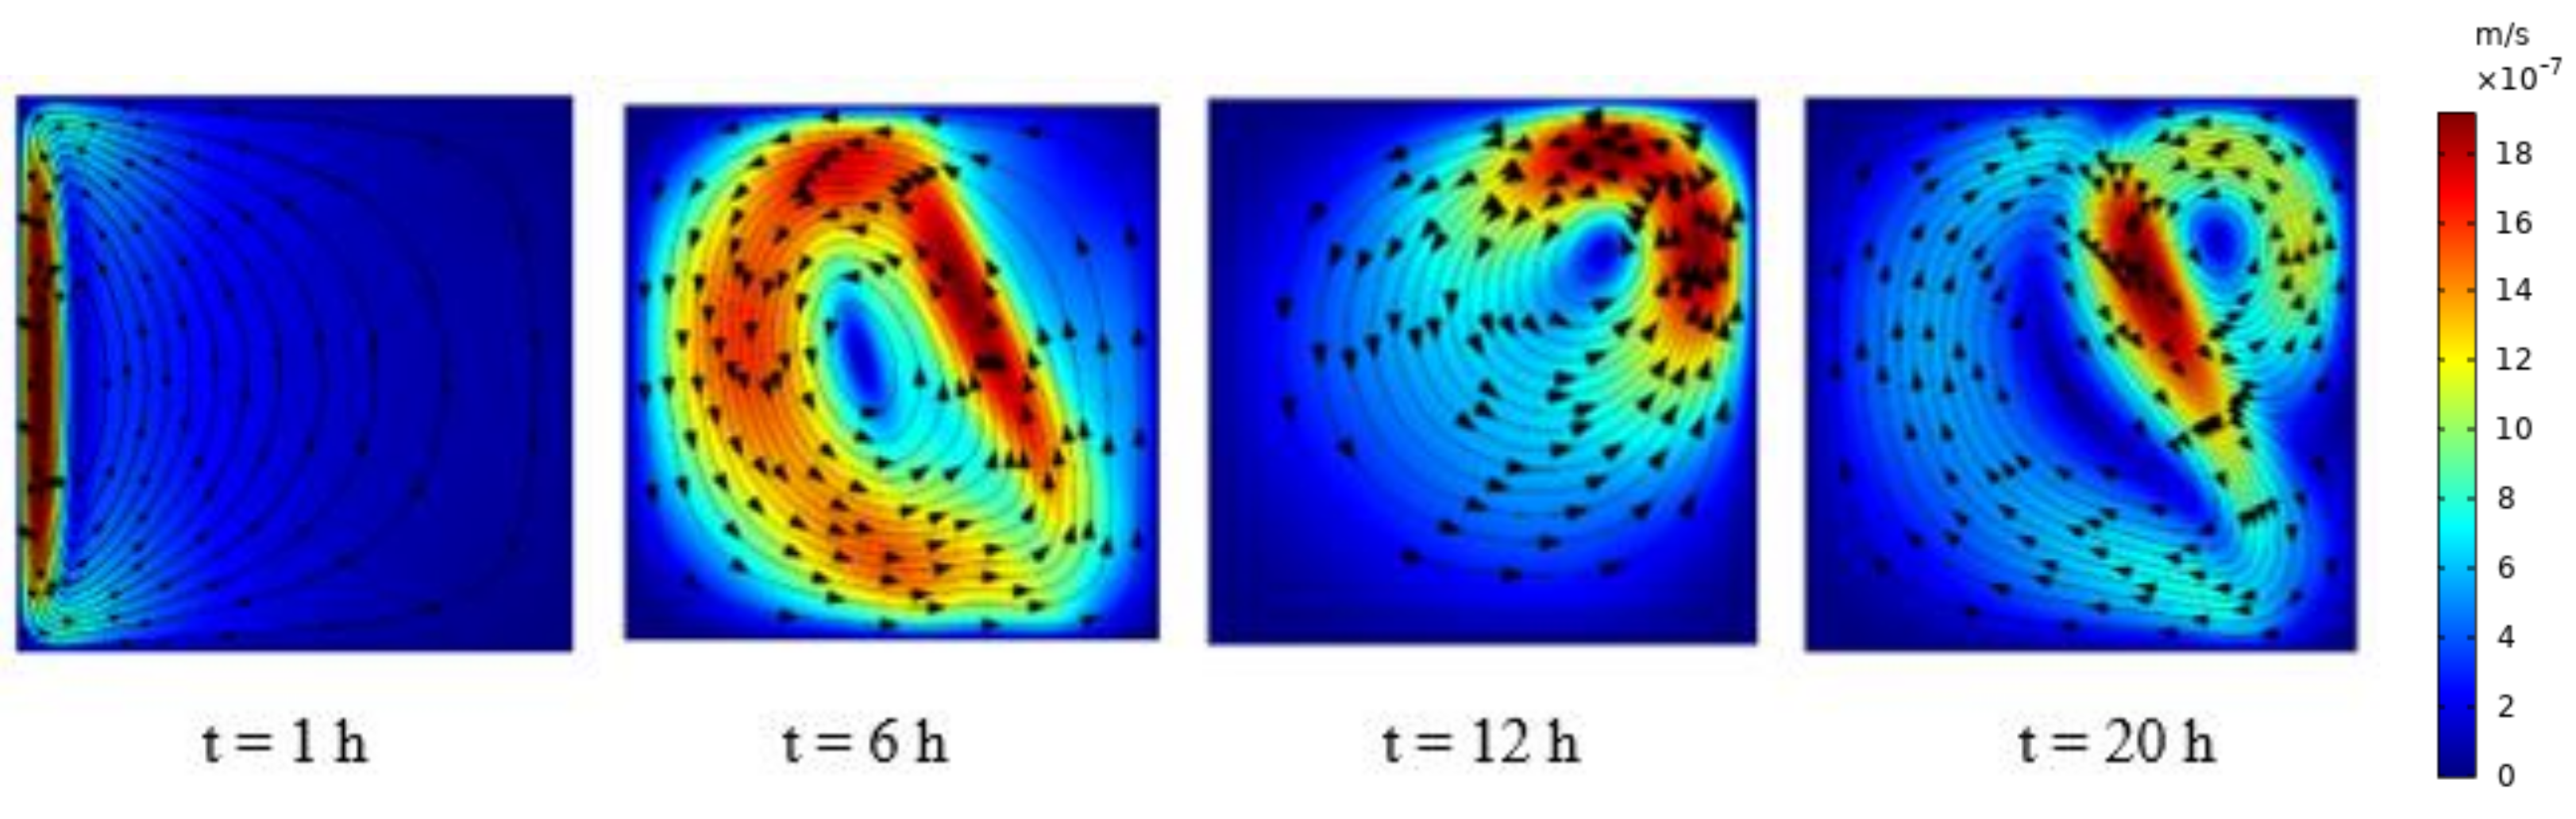
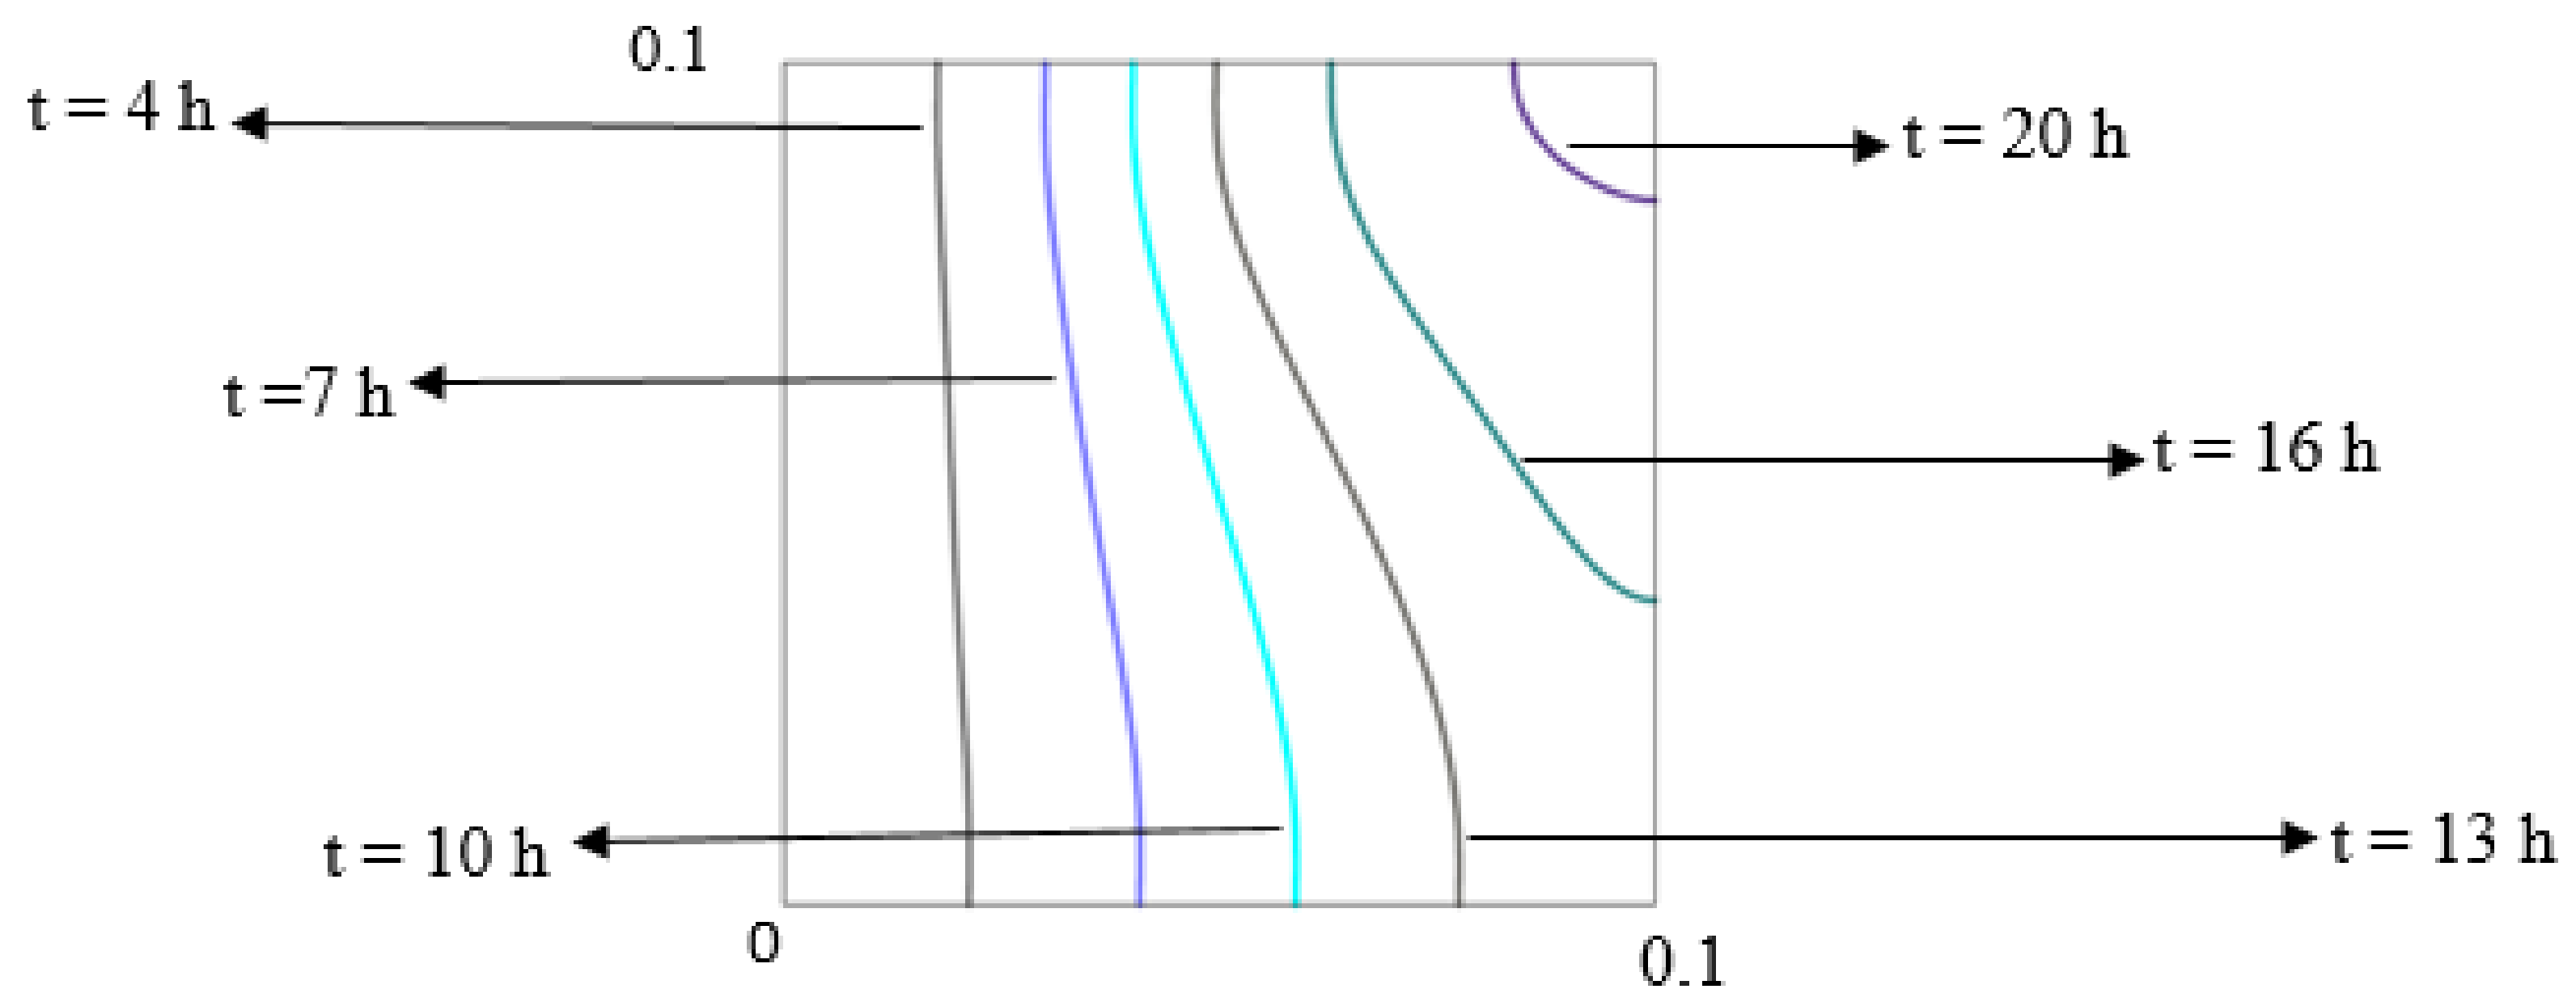
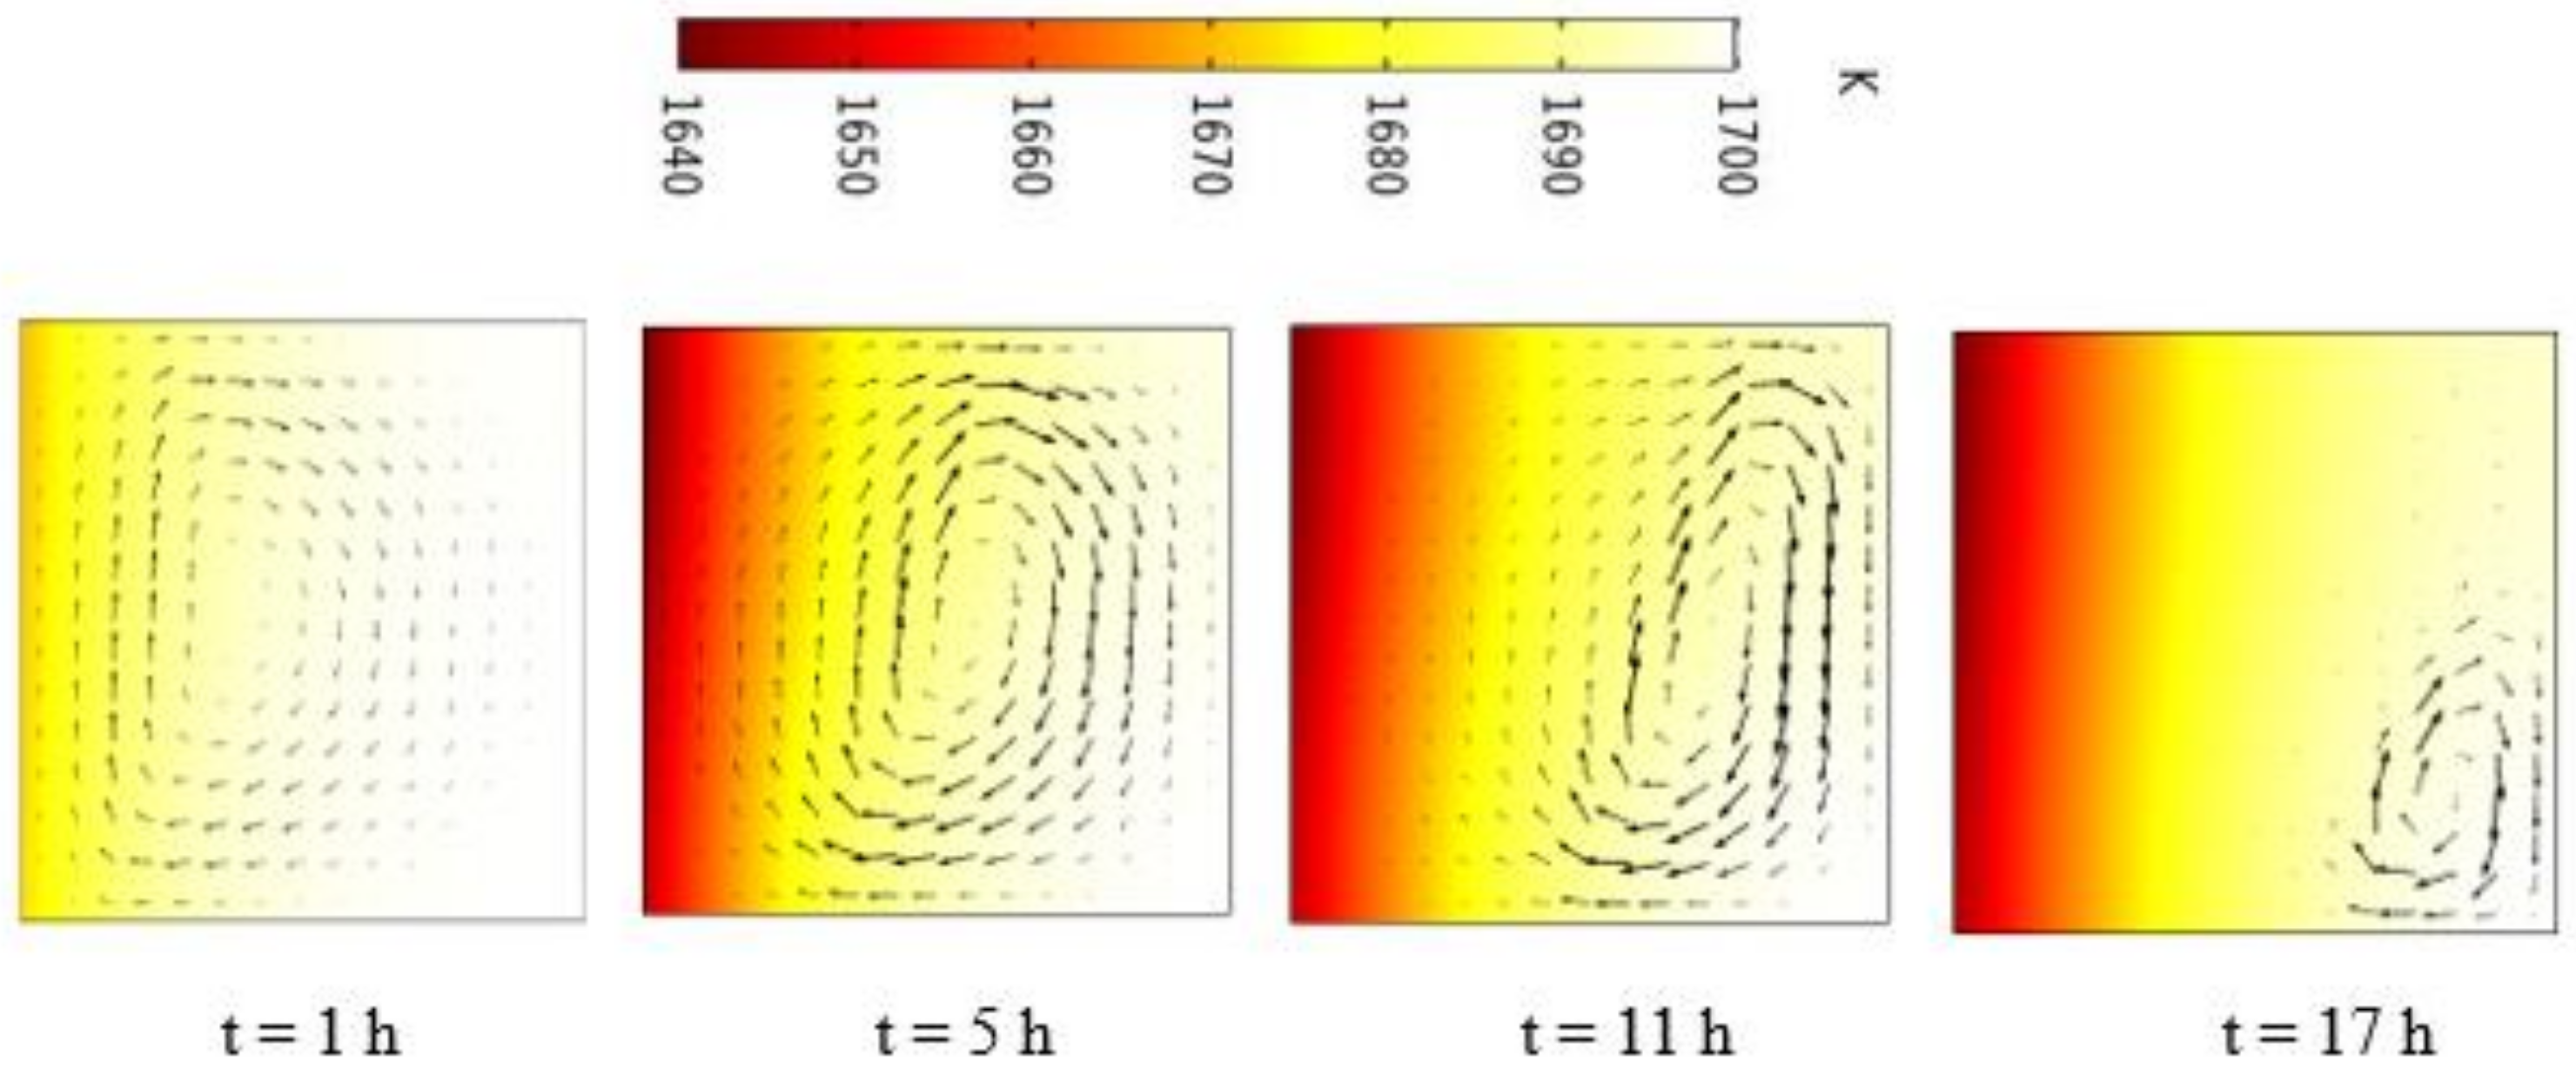
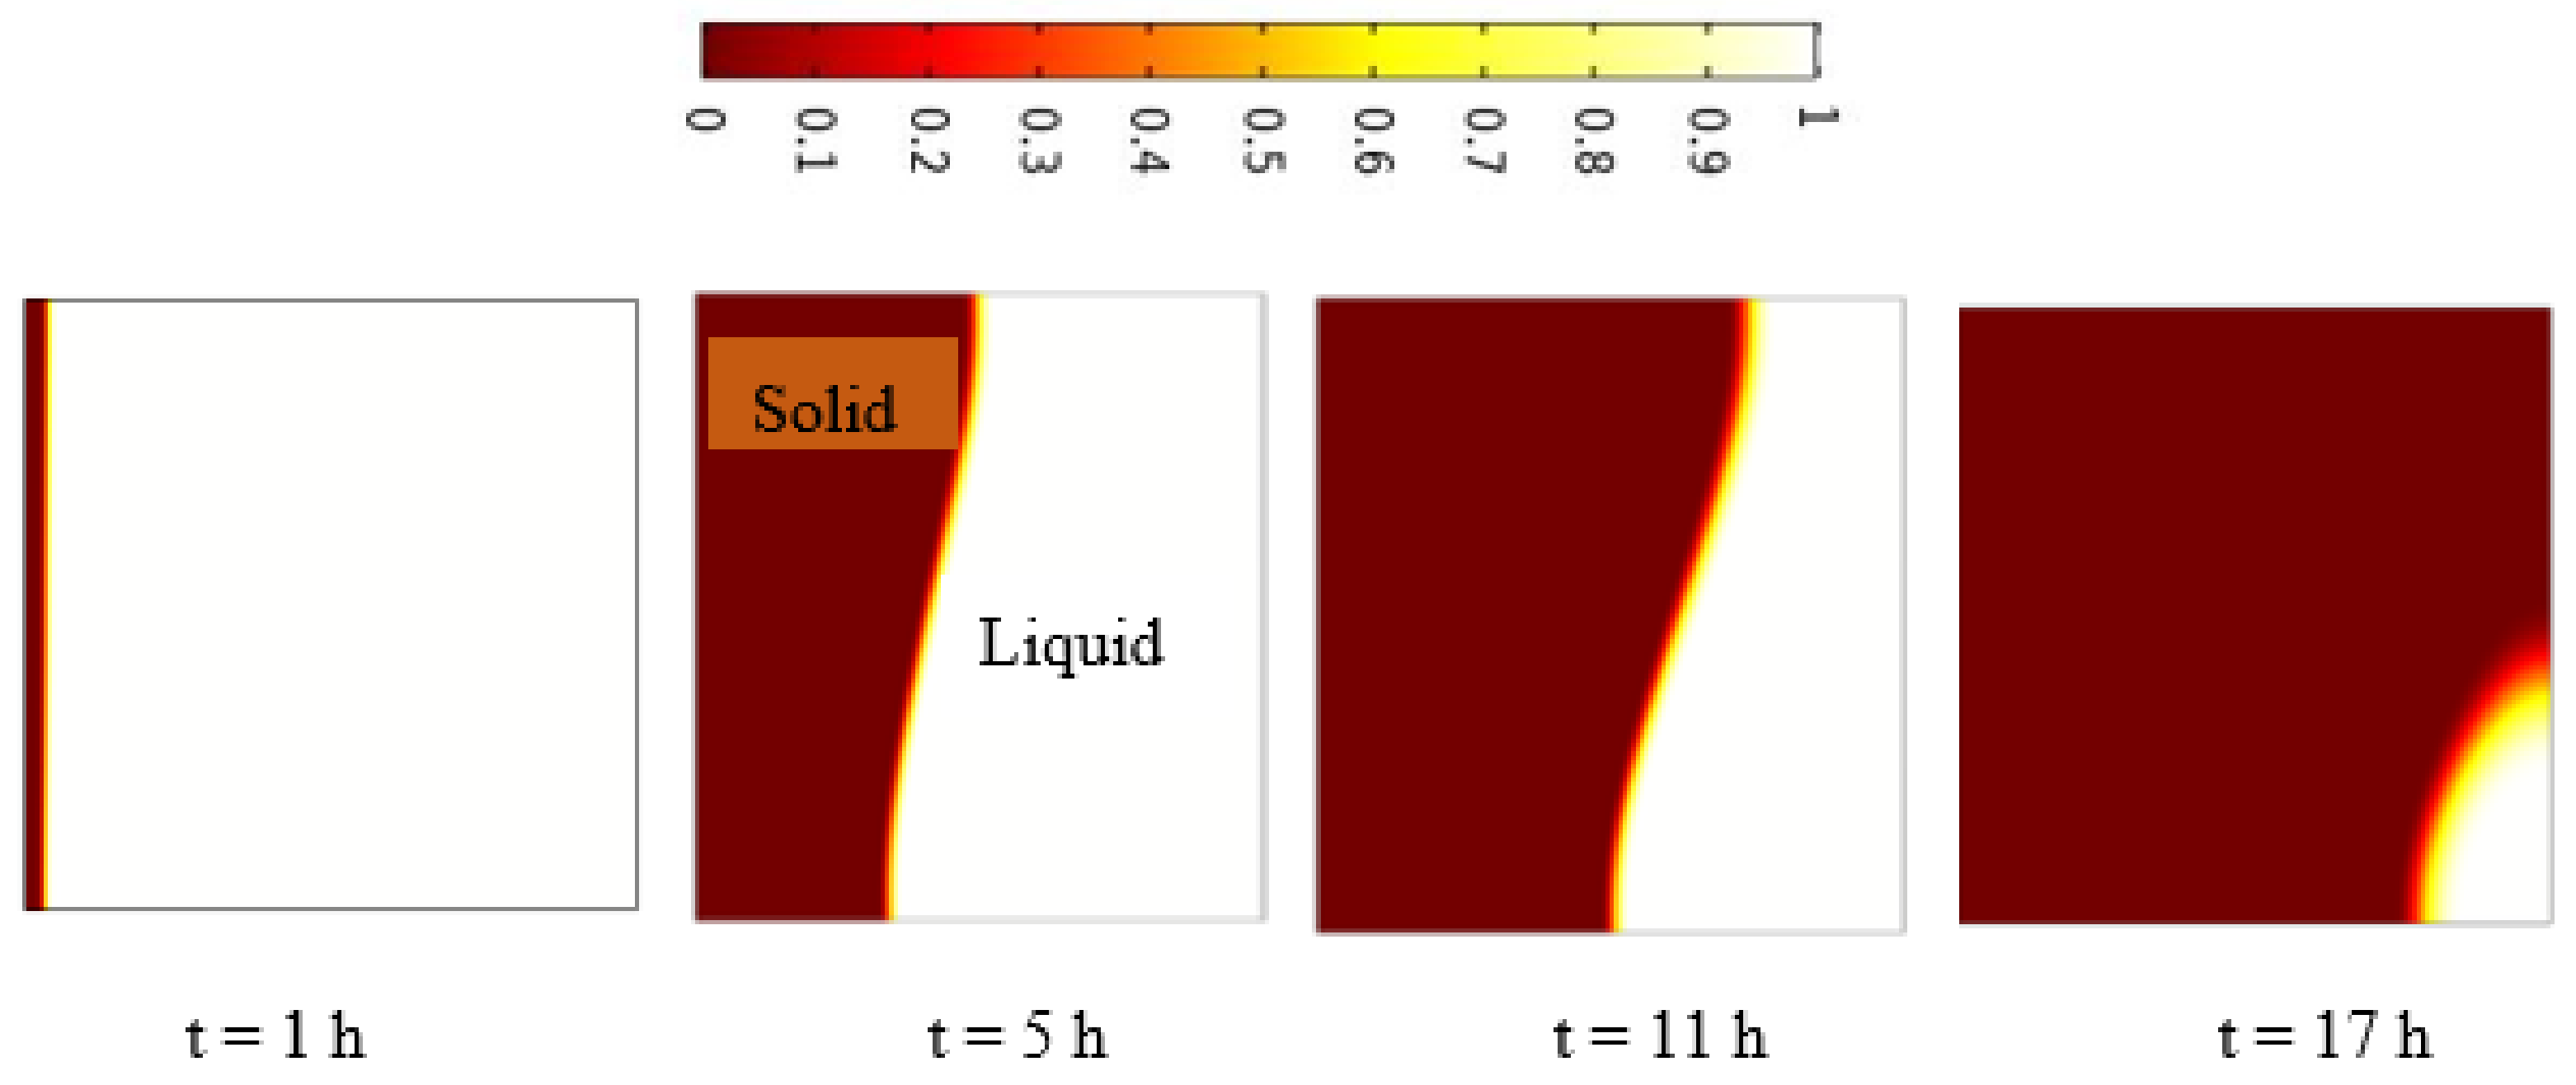
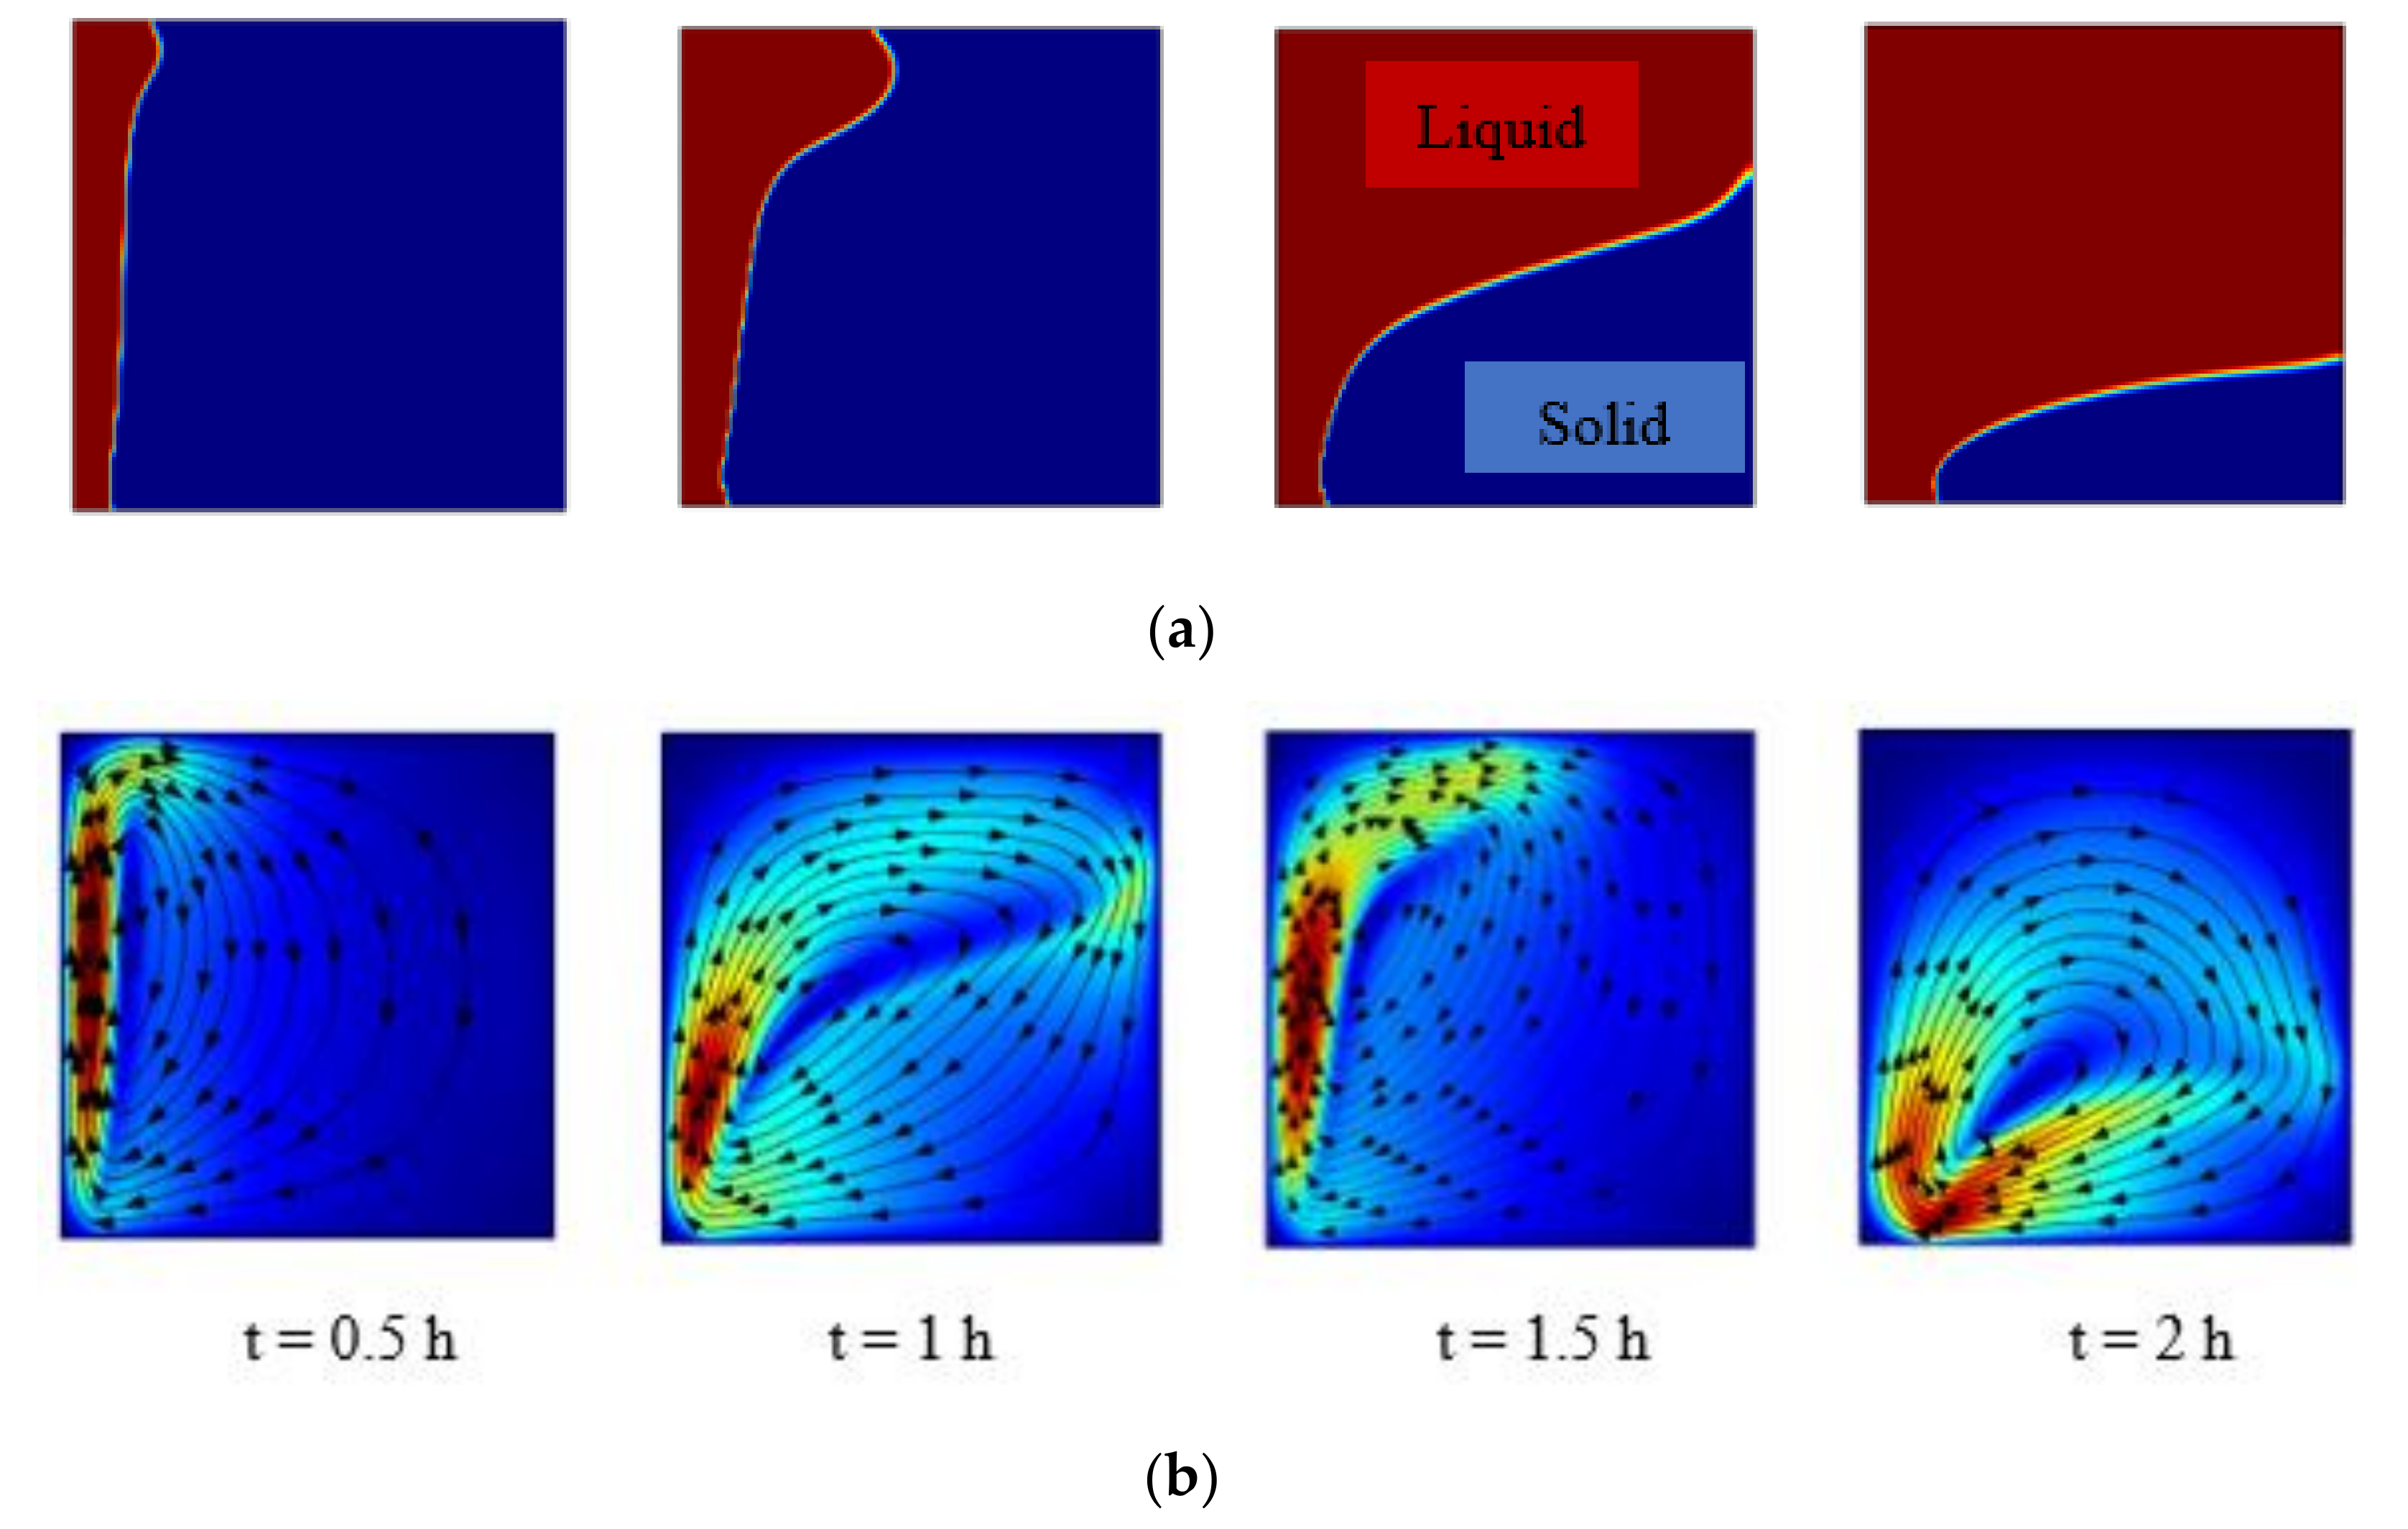
5.2.1. Charging of Silicon Domain

Figure 5 and Figure 6 represent the contours of temperature distribution and liquid fraction, respectively, inside the PCM domain during the charging process for AR = 1. The left wall of the domain is subjected to uniform heat flux of 7500 W/m2 normal to the boundary. The subcooling for both PCMs has been kept equal to 8 K.
In the beginning, the heat transfer to solid PCM adjacent to the left wall is through pure conduction due to absence of any motion. The temperature of the PCM is monitored by the energy absorbed from outside the heat source (uniform heat flux) and subsequent transfer of heat to the adjacent layer of cold PCM. Eventually, adjacent solid PCM temperature increases above the melting point and melting take place at constant temperature. The temperature increases linearly in the PCM domain and the interface moves parallel to the left wall until conduction dominates. Gradually, natural convection is created, as a thin liquid zone between the left wall and the solid PCM. As the liquid region becomes thicker, the convection current becomes more powerful and the melting front moves faster. The flow of heat in the PCM domain is a two-stage process: (a) Convection heat transfer in the molten PCM, and the interface between the molten PCM and left wall and the interface between the molten PCM and the solid PCM, and (b) conduction heat transfer in the solid PCM.
The influence of buoyancy-driven natural convection on the melting process can be visualized from Figure 7, which represents the velocity vector field with streamlines. There is a downward movement of the molten silicon due to it having a higher density than solid silicon. Hence, a counterclockwise circular motion can be observed in molten silicon. Moreover, the inertia of molten PCM forces the solid PCM to melt not only from the heated wall but also from bottom and top surface for silicon. Flow separation can be observed in molten silicon near to complete charging of the domain and only sensible heating takes place through the silicon domain. Additionally, this liquid motion provokes distortion of the flat melting front to a conical shape that results in movement of the interface in both the x and y directions. The precise 2D unsteady evolution of the mushy zone can be better manifested considering iso-fraction lines of porosity 0.5, as captured in Figure 8. The lines in the mushy zone that have porosity 0.5 are captured for the 0.1 × 0.1 m2 domain with q″ = 7500 W/m2 for a duration of 20 h. The black arrow in Figure 8 indicates the resultant direction of bulk motion of molten silicon.
The effect of the magnitude of heat fluxes on charging performance is observed by performing a parametric operation with four different uniform heat fluxes as shown in Figure 9. The four given uniform heat fluxes are considered to induce laminar flow during natural convection in molten silicon. The Rayleigh number varies from 2.34 × 10 6 to 4.68 × 10 6 , which satisfies the criteria of laminar flow in natural convection. With increase in flux magnitude by 300% from 2500 W/m2, the melting duration for complete charging of domain decreases by 72%. Although the melting rate increases with flux, the variation is not exactly proportional. Instead, the increase in melting rate decreases with higher heat flux on a small scale. This behavior can be explained quantitatively using the charging efficiency of the domain as shown in Figure 10. The charging efficiency of the domain can be expressed as:
η charging = Maximum   energy   stored   after   complete   charging Total   energy   entered   into   the   system   during   charging   = Q stored Q inlet  

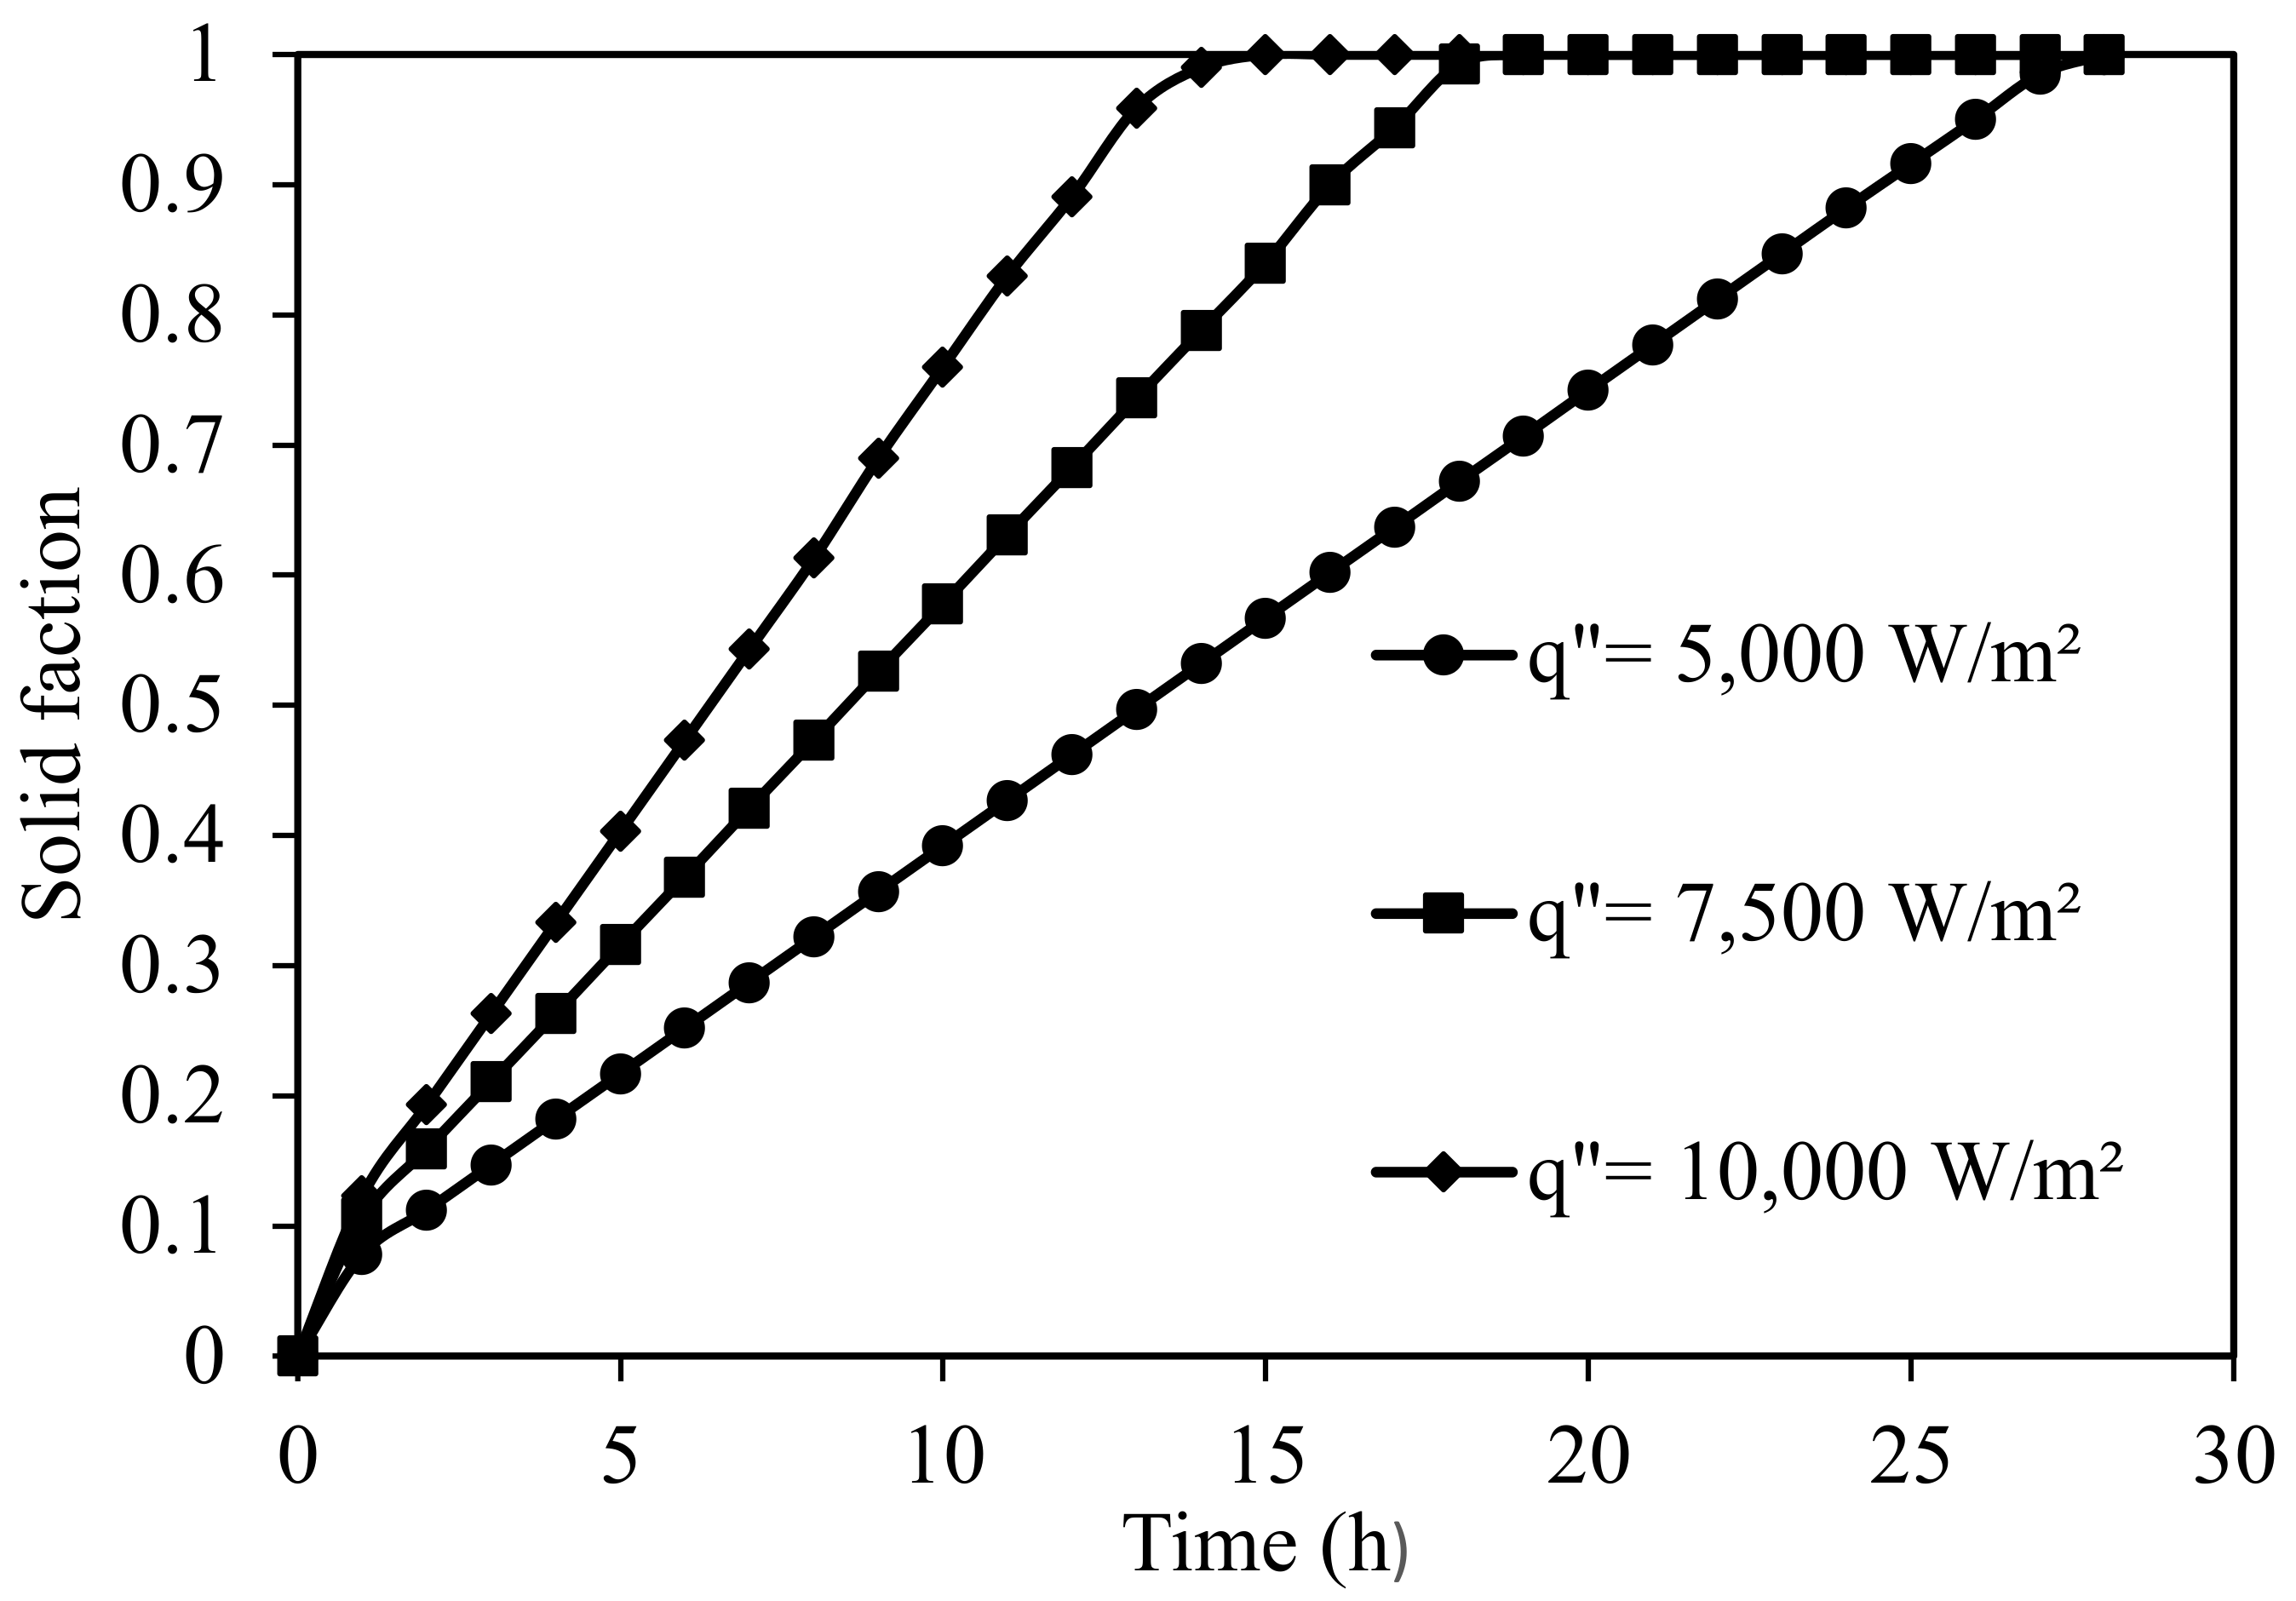
5.2.2. Discharge of Silicon Domain

Solidification performance is evaluated during discharging process of silicon domain for the given geometry. Thermal energy is removed as uniform heat flux moving in the outward direction perpendicular to the left wall of the domain. Figure 11 and Figure 12 show the temperature distribution and solid fraction distribution inside PCM during the discharging process, respectively. The arrows inside the temperature distribution show the direction of velocity of silicon molecules in the remaining molten PCM.
At the beginning of the discharging process, the molten silicon adjacent to the left wall cools due to direct contact with the left wall. This mechanism can be depicted as conduction heat transfer from solid PCM. This is due to the static molten PCM at the beginning, which acts as a solid domain. Eventually, a layer of solid silicon forms near the wall when temperature drops below the solidification temperature. Due to conduction dominance, the solidification front advances axially parallel to the active wall for initial duration. However, the heat transfer from molten PCM to left surface through solid PCM creates a perturbation in the molten PCM. Hence, once a layer of solid PCM forms near the left wall, the remaining molten PCM also exhibits a natural current. This leads to change in shape of solidification front from vertically straight to conical shape. The temperature of the solid layer subsequently decreases, which allows the heat transfer from molten silicon to solid silicon. As the solid region becomes thicker, the convection current reduces and conduction dominates. The flow of heat in the PCM domain is a three-stage process: (a) Conduction between the left wall and molten silicon; (b) convection at the interface between the molten silicon and the solid silicon; and (c) conduction heat transfer in the solid silicon. The effect of heat flux on discharge performance of the domain can similarly explained as shown in Figure 13. The solidification rate increases almost linearly with increase in flux. The discharge rate with q″ = 10,000 W/m2 is nearly two times the discharge rate at q″ = 5000 W/m2, i.e., the ratio of complete discharge time is 0.5.

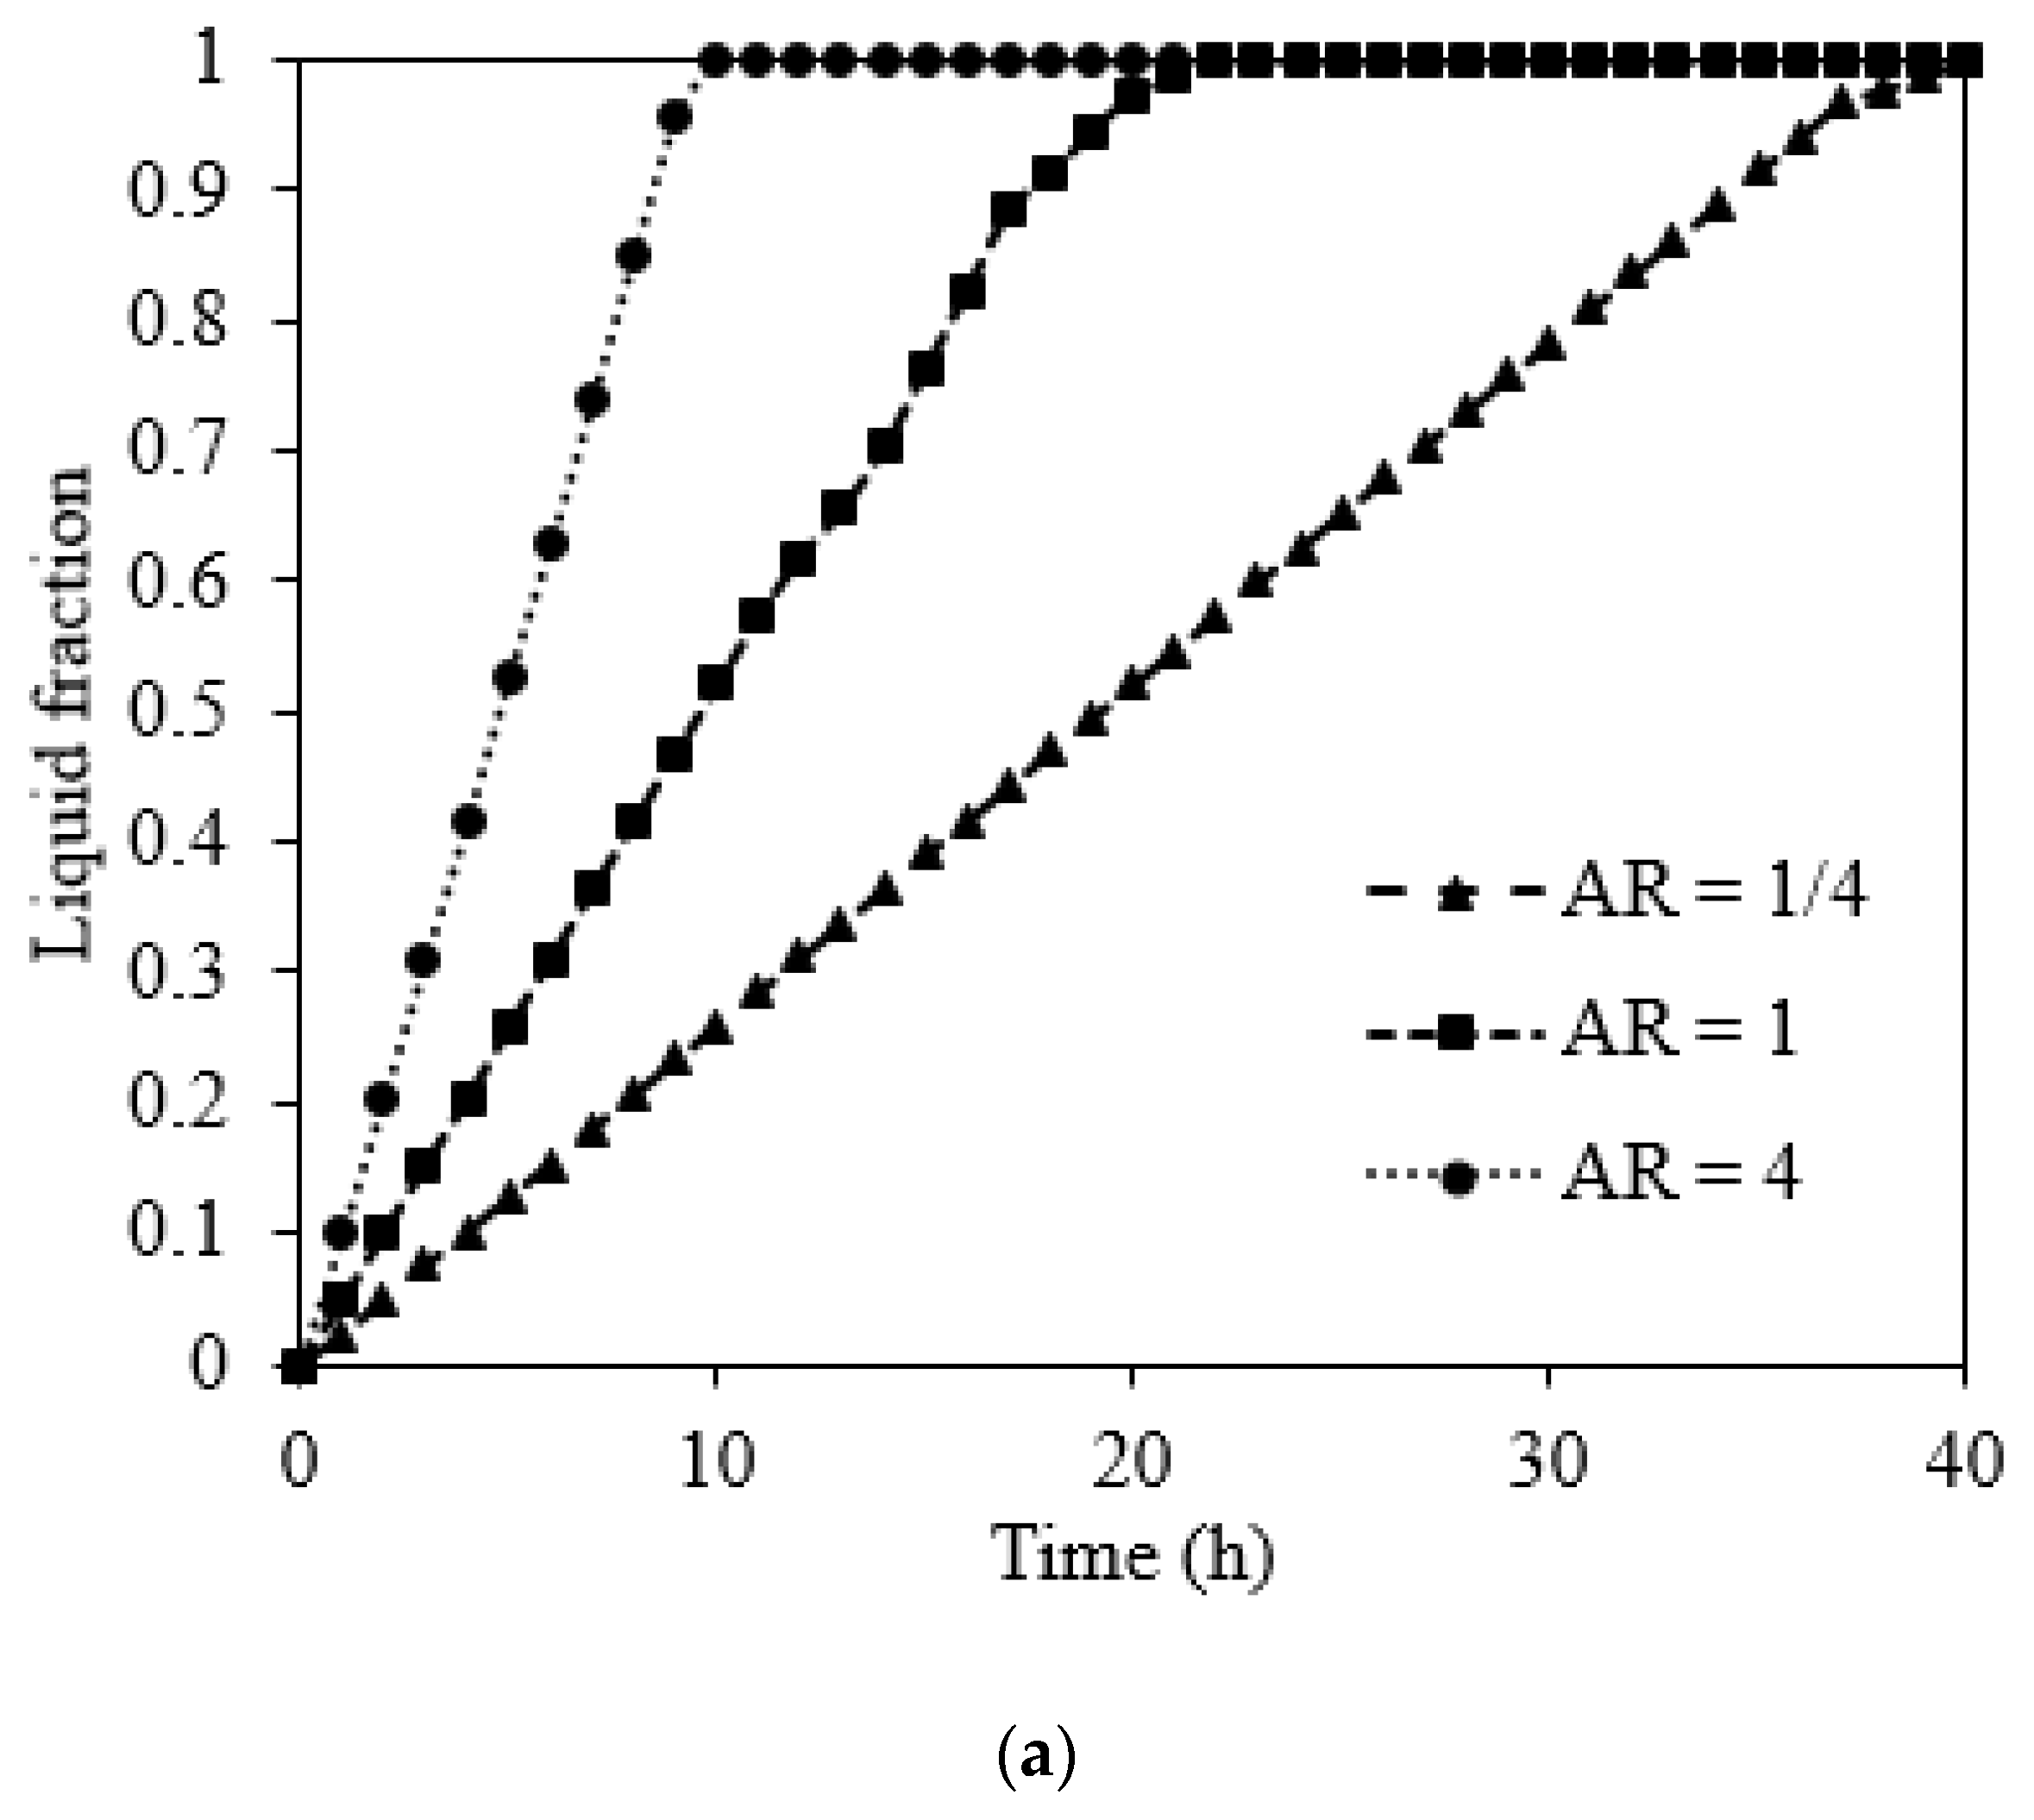
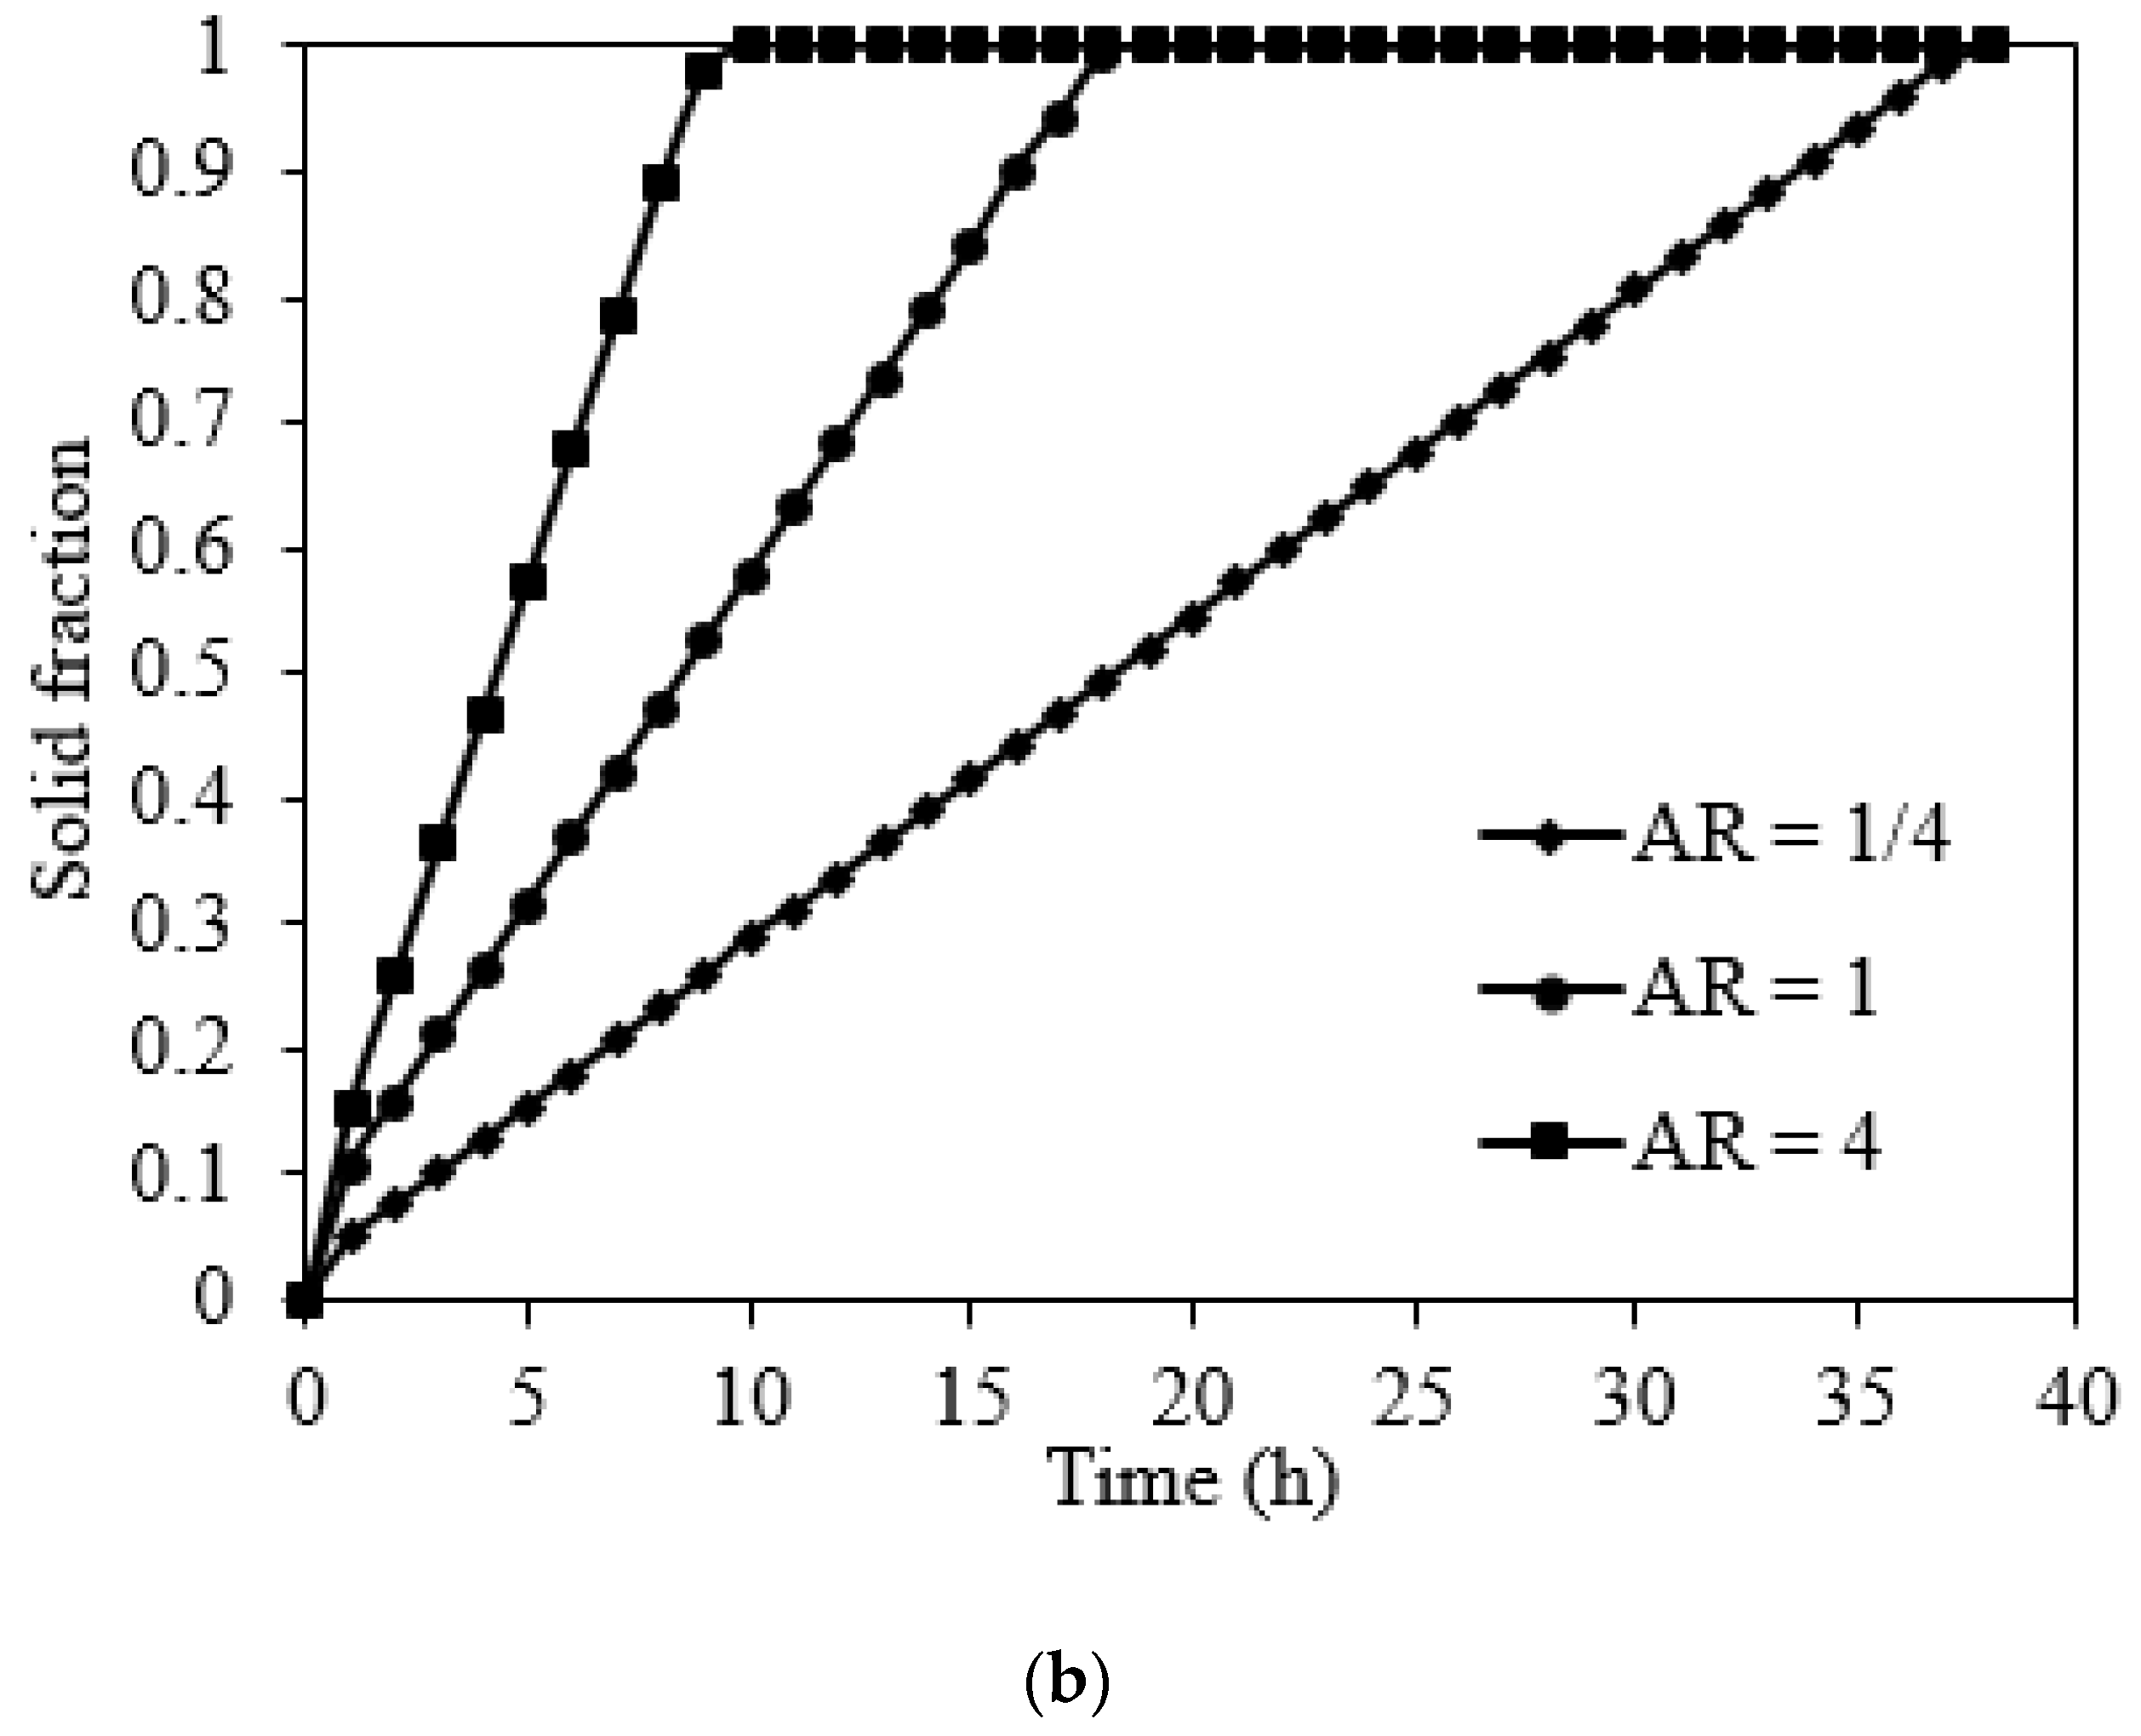
5.2.3. Effect of the Orientation of Domain on Charging and Discharge Performance

The influence of the orientation of the domain on charging/discharge performance has been evaluated by considering three different aspect ratios (AR), i.e., ¼, 1 and 4 with the same surface area. All three orientations display same qualitative behavior during phase change. However, quantitatively, the thermal performance of the square geometry is found to be superior to horizontal orientation (AR = 1/4) and inferior to vertical orientation (AR = 4). In another way, the melting rate is highest for vertical orientation and smallest for horizontal orientation. This behavior can be explained using the effective heat available on the active (left) wall of all three domains. For horizontal and vertical orientation, it is 2 times less and more than square geometry as the length of domain changes for same surface area. The phase change progresses in the horizontal direction during both the charging and discharge processes. This translates into the delay in melting and solidification for horizontal orientation compared to other two, as shown in Figure 14a b.

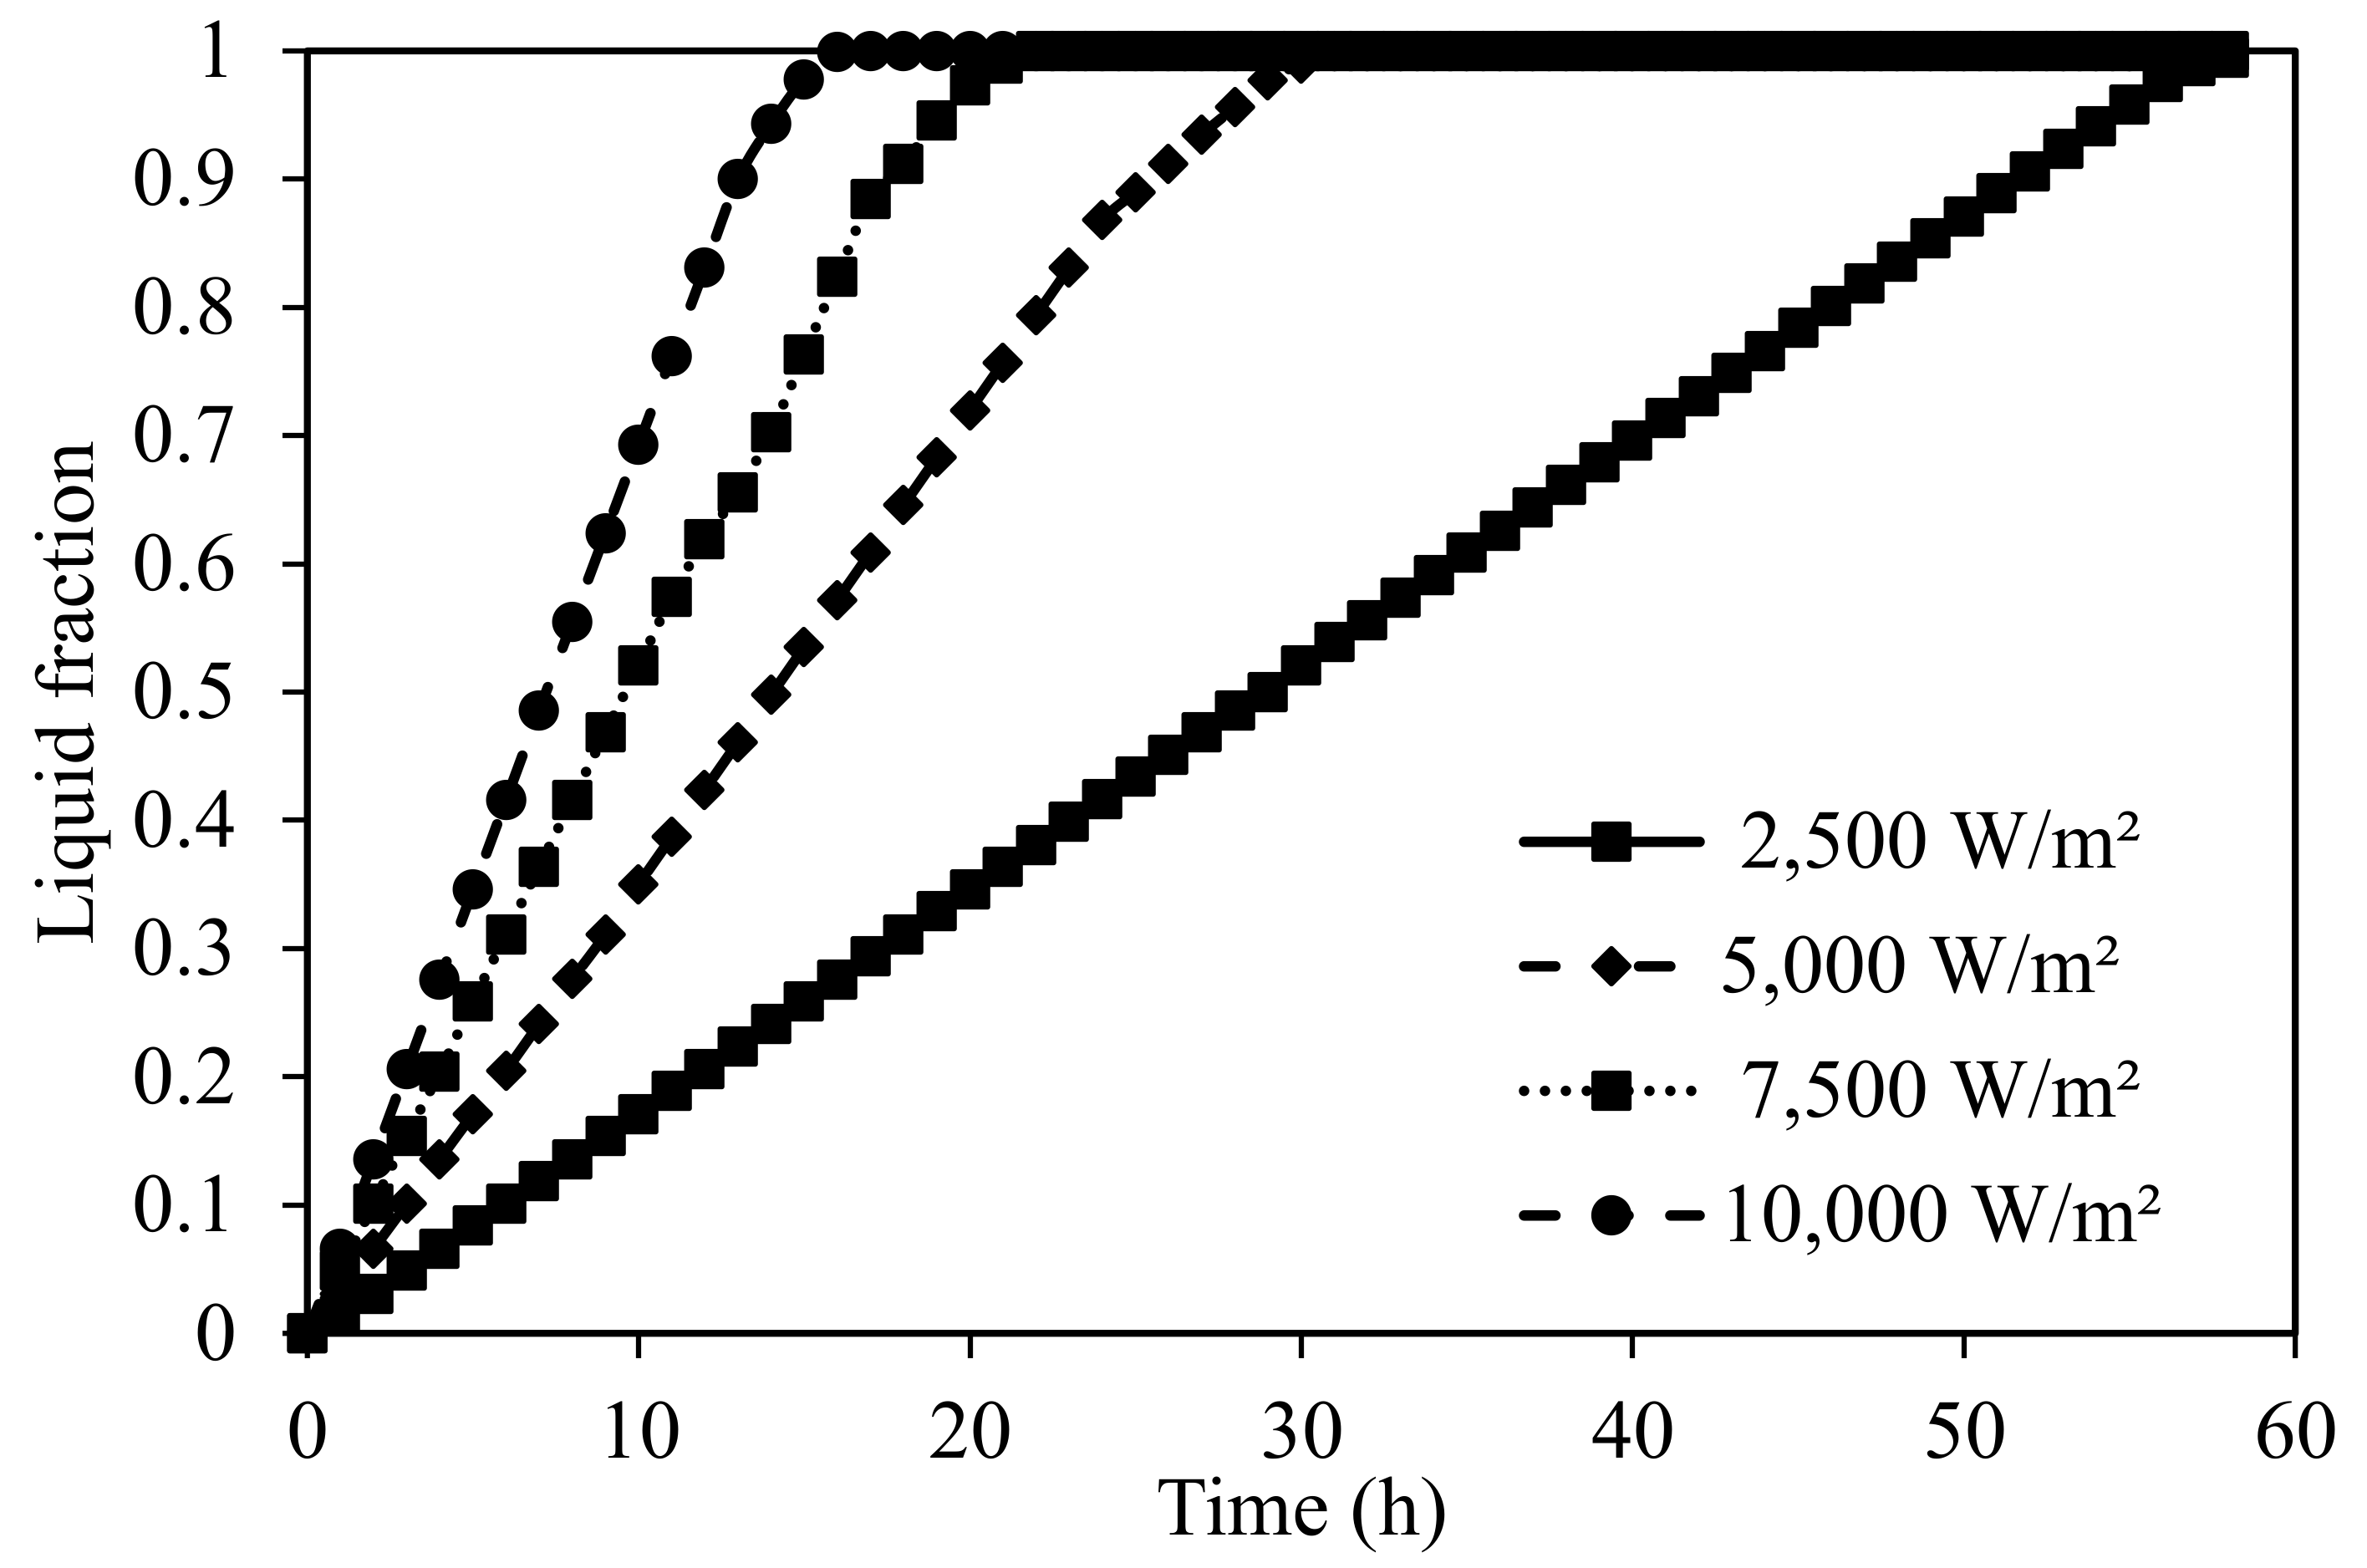
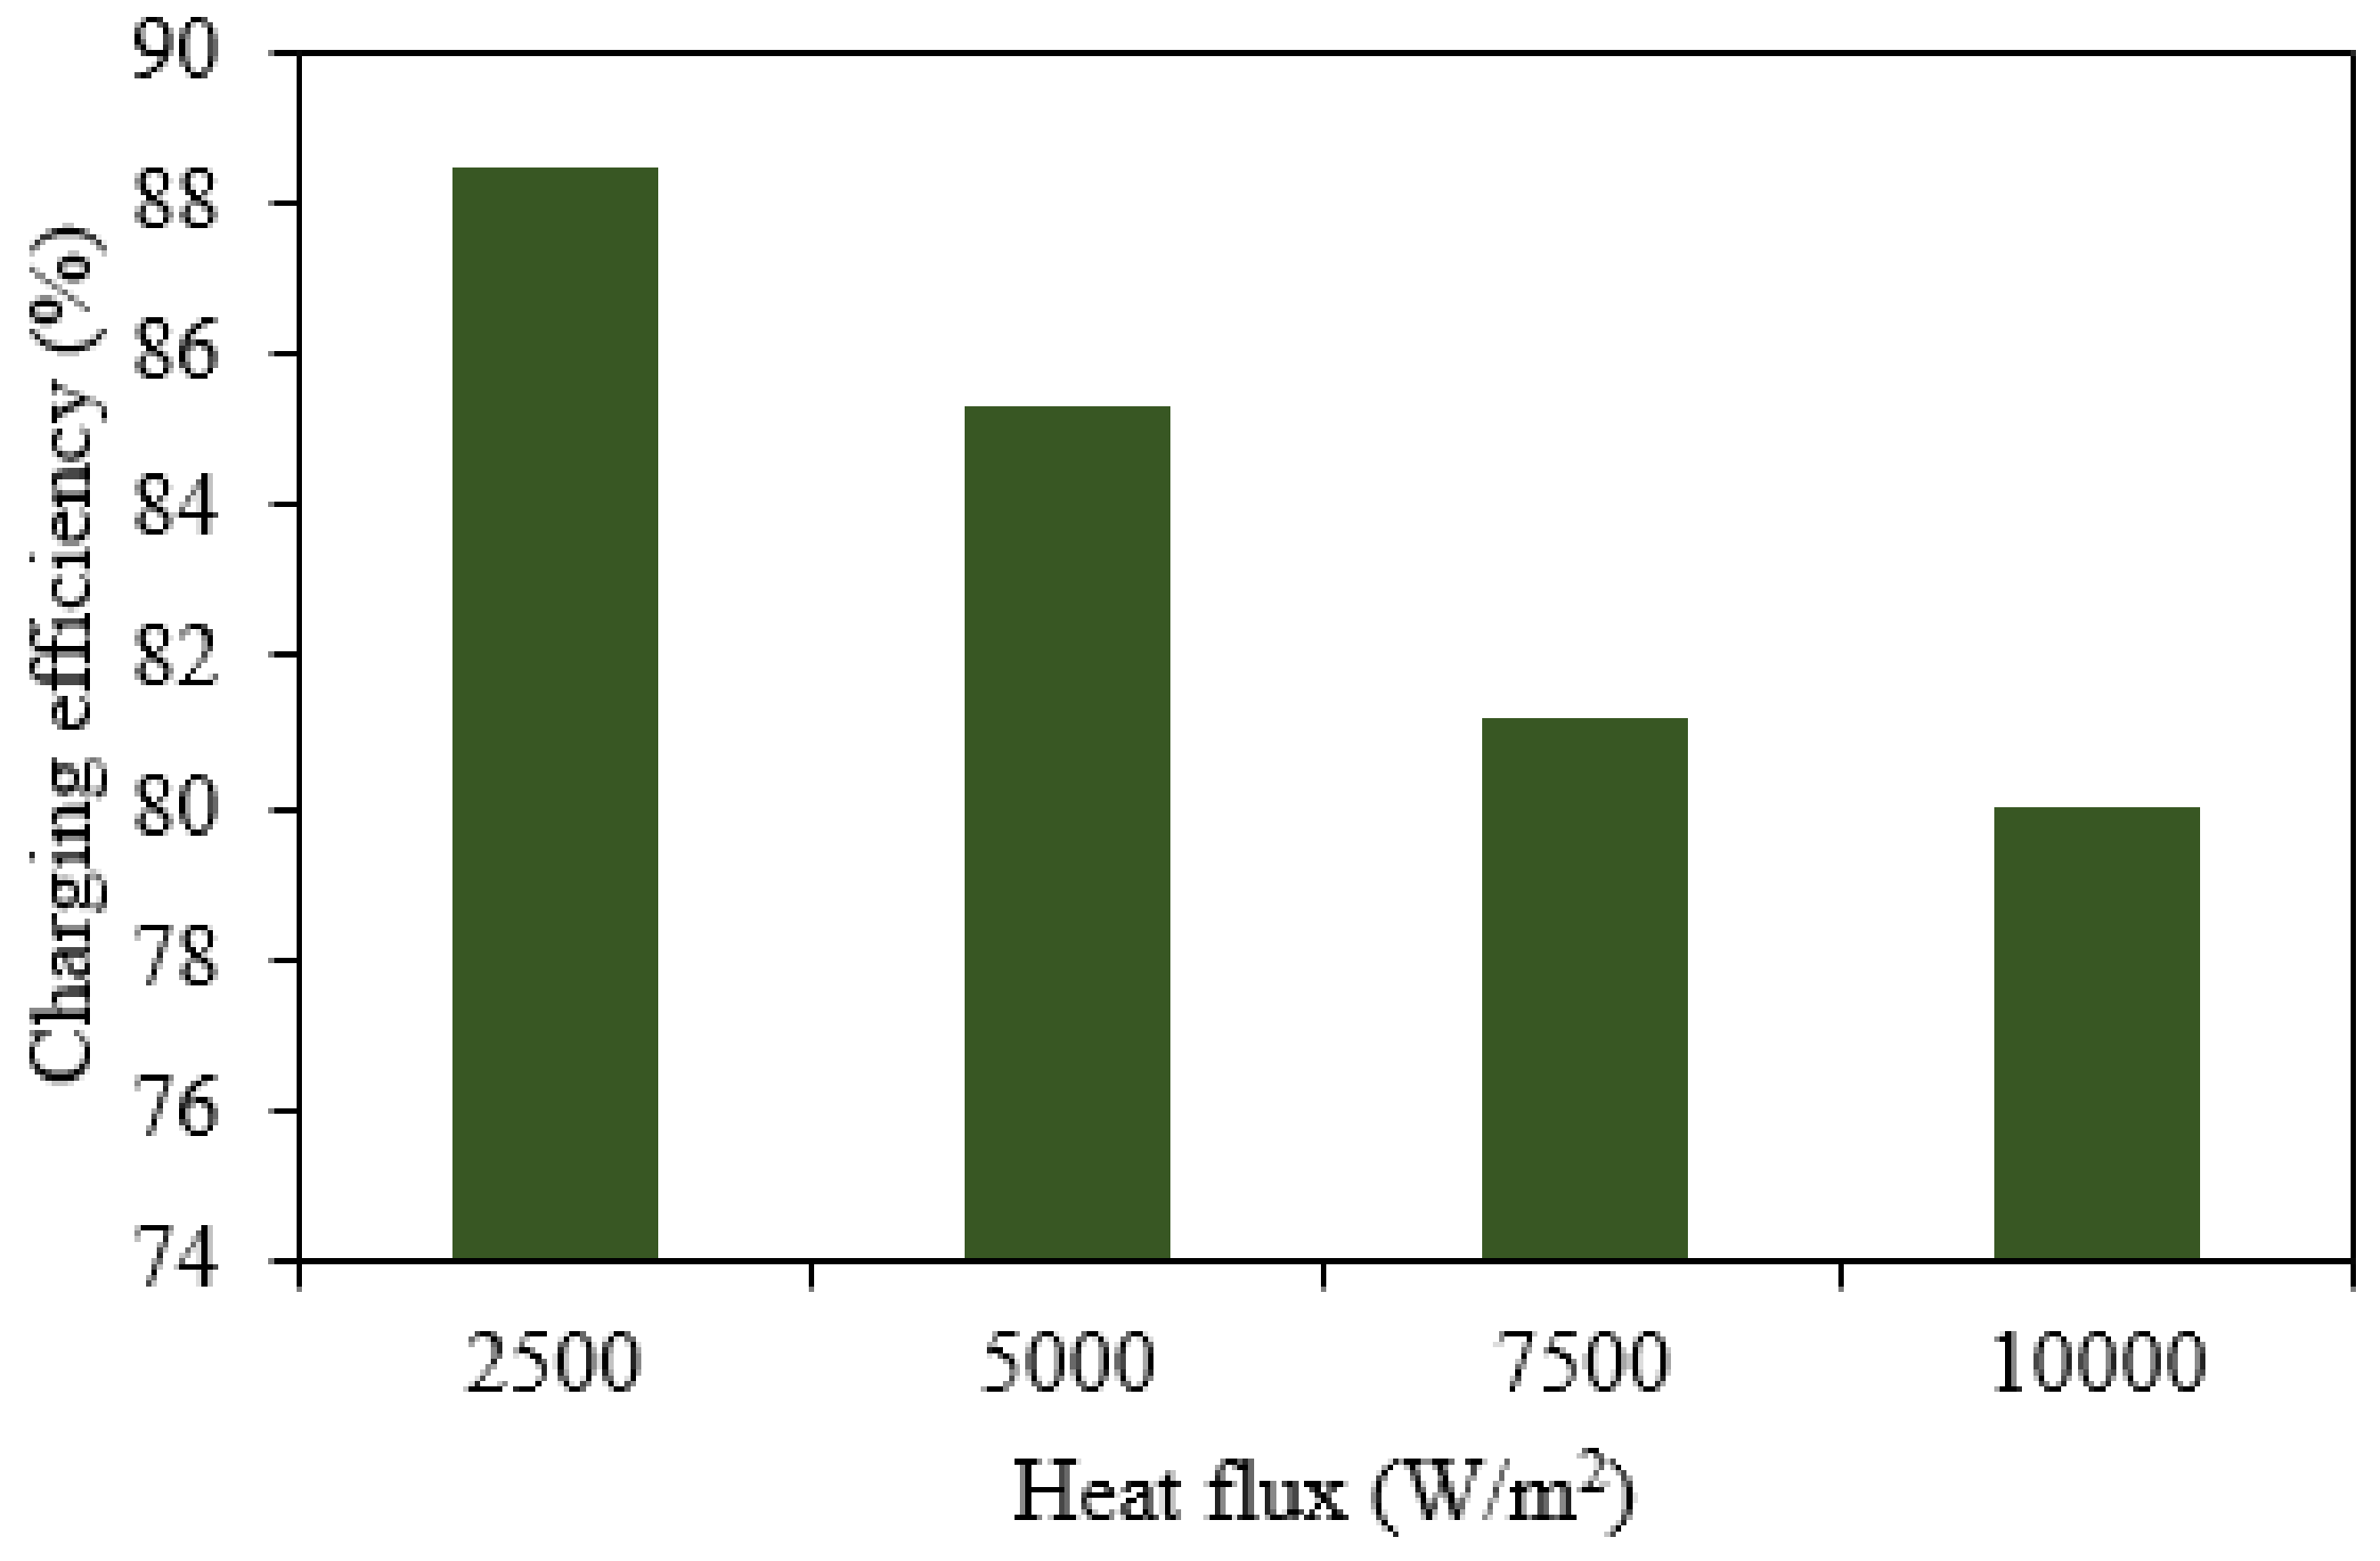
5.3. Charging Performance of NaNO3 Domain

The melting front progresses from the active left wall towards the right side of the domain for both systems. However, the shape of the melting front is different for NaNO3 compared to Silicon due to the direction of natural convection current generated inside molten PCM. For NaNO3, the gradient of temperature between the hot left wall and the solid phase translates into variation densities in the fluid phase. This variation generates buoyancy effects in the presence of gravity, which leads to natural convection. In the beginning, the solid NaNO3 adjacent to the hot left wall becomes heated, and melting takes place when it reaches the melting temperature. The molten NaNO3, being lighter than the solid NaNO3, moves upwards in domain and cold solid PCM settles down near to the wall. Then, the hot liquid on top moves right due to the inertia and lack of penetration into the top and left wall. The hot liquid loses its inertia due to the transfer of heat to its neighboring PCM, and gravity attracts it downwards. To satisfy the continuity of flow, this forms a circulation motion that is clockwise in nature. Since the hot liquid is on the upper part of domain, there is more heat transferred, which leads to faster melting in the upper portion.
From the preceding hypothesis, the inference is the circulation pattern in molten PCM depends on the density gradient between solid and molten phases. This results counterclockwise motion of molten PCM in the silicon domain and clockwise motion in NaNO3 domain. Hence, the upper part melts faster in NaNO3 in contrast to the lower part in the silicon domain. The melting fraction distribution and circulation pattern in molten NaNO3 are captured as shown in Figure 15a,b, respectively.
At the beginning of the melting process, heat transfer to solid PCM is predominantly by conduction. Hence, the liquid–solid interface mimics the active wall’s profile, i.e., moves parallel to the vertical left wall. Conduction heat transfer dominates till the viscous force opposes the fluid motion. Eventually, convection has more power than conduction as the molten PCM grows. High melting occurs near the top compared to bottom portion due to natural convection pattern in molten PCM as discussed before. The clockwise circulation pattern in PCM deforms the shape of the melting interface into a curved shape which can be interpreted as a push in the bottom portion of the melting interface to the left, and a pull in the top portion to the right. Hence, the melting of NaNO3 quickly reaches the right wall of the domain from the top surface. The temporal evolution of the melting interface during charging is shown in Figure 16.

5.4. Comparison of Charging and Discharge Performance between the Silicon and NaNO3 Domains

The charging and discharge performance of high-temperature LHS of AR = 1 containing Silicon and NaNO3 are compared concerning the melting/solidification duration and the energy storage/release rate. The energy storage/release rate and melting/solidification rate are the critical performance parameters, in addition to the thermal stability, for designing high-temperature LHS. As the selection of both PCMs is based on thermal stability criteria, the comparison has been performed for other performance parameters for uniform heat flux of 7500 W/m2 as shown in Figure 17a,b.
The melting rate of NaNO3 is observed to be higher than that of the silicon domain, even though silicon has very high thermal conductivity compared to NaNO3. This is due to the higher gravimetric energy density of silicon, which is nearly 10 times that of NaNO3. However, the energy storage density (J/kg) and energy storage rate (W/kg) are higher for silicon than for NaNO3. Figure 16 compares the above performance parameters to the complete charging of the NaNO3 domain. The energy storage density and rate are calculated as expressed below:
Energy storage density = Sensible storage density + latent storage density
c p T m T i + T T m + β h s l
Energy   storage   rate   =   Energy   storage   density Corresponding   charging   duration
The energy storage density for both domains increases linearly with time. However, quantitatively, the energy storage density of the silicon domain is greater than that of the NaNO3 domain at each instant. Near to the complete charging of NaNO3 domain (3.5 h), the ratio of energy storage density between silicon and NaNO3 domain is 1.83.
The energy storage rate profile during charging of both the domains follows the same pattern as is visible from Figure 18. In the beginning, the melting rate increases rapidly due to the high-temperature gradient between the active left wall and adjacent solid PCM. However, the silicon domain has a substantially higher energy storage rate compared to NaNO3 domain. This can be attributed to the influence of higher thermal diffusivity of silicon (1.87 e–5 m2/s) compared to NaNO3(3.144 e–8 m2/s). Figure 18 compares energy storage rate and density up to 3.5 h as the complete charging of the NaNO3 domain takes place in that duration. However, the trend would remain the same throughout the charging process of the silicon domain.
The energy storage rate of the silicon domain is nearly twice that of the NaNO3 domain after the complete charging of both domains. Hence, it can be inferred from this study that the effective thermal performance of the silicon domain is superior to that of the NaNO3 domain despite silicon having a lower melting rate.

6. Conclusions

The present study evaluated the charging and discharge performance of a high-temperature silicon-based LHS system using the effective heat capacity technique. The charging efficiency was observed to decrease with the increase in heat flux. The charging and discharge rate of vertical domain (AR = 4) was observed to be higher than the horizontal (AR = 1/4) and square domain (AR = 1). The charging performance of high-temperature LHS with silicon was compared with the NaNO3 domain. The rate of charging of the NaNO3 domain was found to be lower than the silicon domain for different heat fluxes, despite it having lower thermal diffusivity than silicon. This behavior can be attributed to the large storage capacity of the silicon domain. However, the other critical performance parameters, such as energy storage density and energy storage rate were found to be greater for the silicon domain. An unconventional counterclockwise circulation current was observed in molten silicon compared to clockwise pattern in molten NaNO3. This phenomenon can be attributed to the density difference between solid and liquid PCM. As energy storage rate and energy density are critical parameters to design a cost-effective LHS for central receiver-based CSP, silicon can act as a suitable high-temperature PCM. However, the corrosion property of silicon at high temperatures and its compatibility with structural materials need to be evaluated before it can be implemented commercially.

Author Contributions

A.K.R., D.R., K.R.K. and H.G. have participated in (a) conception and design, or analysis and interpretation of the data; (b) drafting the article or revising it critically for important intellectual content, and (c) approval of the final version. All authors have read and agreed to the published version of the manuscript.

Funding

The authors would like to thank UQIDAR for funding this collaborative research.

Institutional Review Board Statement

Not applicable.

Informed Consent Statement

Not applicable.

Data Availability Statement

Not applicable.

Conflicts of Interest

The authors declare no conflict of interest.

Nomenclature

ARAspect ratio
CSPConcentrated solar power
FEMFinite element method
GenGeneration
LCoELevelized cost of energy
TCHSThermochemical heat storage
LHSLatent heat storage
LFLiquid fraction
PCM Phase change medium
SFSolid fraction
SHSSensible heat storage
Greek Symbols:
βLiquid fraction
εConstant in karman-Cosney equation
μ Dynamic viscosity (Pa·s)
ρ Density (kg/m3)
Symbols:
AmushMushy zone constant
CP Specific heat capacity (J/kgK)
Fb Bouyancy force (N)
S(T)Porosity function
hsl Latent heat (J/kg)
kT Volumetric expansion coefficient (1/K)
EdisDissipative energy (J/m3)
LHeight of domain (m)
q″Heat flux (W/m2)
T Temperature (K)
u,v Velocity components (m/s)
W Width of domain (m)
Subscripts:
Sol (s)Solid
Liq (l)Liquid
ModModified
oReference

References

  1. Steiger, J. II—Renewable Energy Resources. In Renewable Energy Resources in ASEAN; ISEAS Publishing: Heng Mui Keng Terrace, Singapore, 2018. [Google Scholar] [CrossRef]
  2. Zablocki, A. Energy Storage: Fact. Sheet (2019); EESI: Washington, DC, USA, 2019; Volume 2040, pp. 1–8. [Google Scholar]
  3. Sarbu, I.; Sebarchievici, C. A comprehensive review of thermal energy storage. Sustainability 2018, 10, 191. [Google Scholar] [CrossRef] [Green Version]
  4. Alva, G.; Lin, Y.; Liu, L.; Fang, G. Synthesis, characterization and applications of microencapsulated phase change materials in thermal energy storage: A review. Energy Build. 2017, 144, 276–294. [Google Scholar] [CrossRef]
  5. Pelay, U.; Luo, L.; Fan, Y.; Stitou, D.; Rood, M. Technical data for concentrated solar power plants in operation, under construction and in project. Data Br. 2017, 13, 597–599. [Google Scholar] [CrossRef] [PubMed]
  6. Dincer, I.; Rosen, M.A. Thermal Energy Storage Systems and Applications, 2nd ed.; Wiley: Chichester, UK, 2011. [Google Scholar]
  7. Mehos, M.; Turchi, C.; Vidal, J.; Wagner, M.; Ma, Z.; Ho, C.; Kolb, W.; Andraka, C.; Kruzienga, A. Concentrating Solar Power Gen3 Demonstration Roadmap; Technical Report; National Renewable Energy Lab (NREL): Golden, CO, USA, 2017. [Google Scholar] [CrossRef] [Green Version]
  8. Luft, W. High-temperature solar thermal energy storage. Int. J. Sol. Energy 1985, 3, 25–40. [Google Scholar] [CrossRef]
  9. Zhang, H.; Baeyens, J.; Cáceres, G.; Degrève, J.; Lv, Y. Thermal energy storage: Recent developments and practical aspects. Prog. Energy Combust. Sci. 2016, 53, 1–40. [Google Scholar] [CrossRef]
  10. Nazir, H.; Batool, M.; Bolivar Osorio, F.J.; Isaza-Ruiz, M.; Xu, X.; Vignarooban, K.; Phelan, P.; Inamuddin; Kanna, A.M. Recent developments in phase change materials for energy storage applications: A review. Int. J. Heat Mass Transf. 2019, 129, 491–523. [Google Scholar] [CrossRef]
  11. De Gracia, A.; Cabeza, L.F. Phase change materials and thermal energy storage for buildings. Energy Build. 2015, 103, 414–419. [Google Scholar] [CrossRef] [Green Version]
  12. Jegadheeswaran, S.; Pohekar, S.D. Performance enhancement in latent heat thermal storage system: A review. Renew. Sustain. Energy Rev. 2009, 13, 2225–2244. [Google Scholar] [CrossRef]
  13. Lin, Y.; Jia, Y.; Alva, G.; Fang, G. Review on thermal conductivity enhancement, thermal properties and applications of phase change materials in thermal energy storage. Renew. Sustain. Energy Rev. 2018, 82, 2730–2742. [Google Scholar] [CrossRef]
  14. Bauer, T.; Steinmann, W.-D.; Laing, D.; Tamme, R. Thermal Energy Storage Materials and Systems. Annu. Rev. Heat Transf. 2012, 15, 131–177. [Google Scholar] [CrossRef]
  15. Kotzé, J.P. Thermal Energy Storage in Metallic Phase Change Materials. Ph.D. Thesis, Stellenbosh University, Stellenbosh, South Africa, 2014. [Google Scholar]
  16. Birchenall, C.E.; Telkes, M. Thermal storage in metals. In Sharing the Sun: Solar Technology in the Seventies, Proceedings of the Joint Conference, Winnipeg, MB, Canada, 15–20 August 1976; International Solar Energy Society: Freiburg im Breisgau, Germany, 1976; pp. 138–154. [Google Scholar]
  17. He, Q.; Zhang, W. A study on latent heat storange exchangers with the high-temperature phase-change material. Int. J. Energy Res. 2001, 25, 331–341. [Google Scholar] [CrossRef]
  18. Kotzé, J.P.; Von Backström, T.W.; Erens, P.J. Simulation and testing of a latent heat thermal energy storage unit with metallic phase change material. Energy Procedia 2014, 49, 860–869. [Google Scholar] [CrossRef] [Green Version]
  19. Wang, Z.; Wang, H.; Li, X.; Wang, D.; Zhang, Q.; Chen, G.; Zhifeng, R. Aluminum and silicon-based phase change materials for high capacity thermal energy storage. Appl. Therm. Eng. 2015, 89, 204–208. [Google Scholar] [CrossRef]
  20. Robinson, A. Ultra-high temperature thermal energy storage. Part 1: Concepts. J. Energy Storage 2017, 13, 277–286. [Google Scholar] [CrossRef] [Green Version]
  21. Choi, K.J.; Hong, J.S. Experimental studies of melting phenomena from a constant heat flux vertical plate. Exp. Heat Transf. 1990, 3, 49–63. [Google Scholar] [CrossRef]
  22. Marušić, A.; Lončar, D. Experimental validation of high-temperature latent heat storage model using melting front propagation data. Appl. Therm. Eng. 2020, 164, 114520. [Google Scholar] [CrossRef]
  23. Khare, S.; Dell’Amicom, M.; Knight, C.; McGarry, S. Selection of materials for high temperature latent heat energy storage. Sol. Energy Mater. Sol. Cells 2012, 107, 20–27. [Google Scholar] [CrossRef]
  24. Yadav, A.; Samir, S. Experimental and numerical investigation of spatiotemporal characteristics of thermal energy storage system in a rectangular enclosure. J. Energy Storage 2019, 21, 405–417. [Google Scholar] [CrossRef]
  25. Kheirabadi, A.C.; Groulx, D. The Effect of the Mushy-Zone Constant on Simulated Phase Change Heat Transfer. In Proceedings of the CHT-15, 6th International Symposium on Advances in Computational Heat Transfer, New Brunswick, NJ, USA, 25–29 May 2015; Begel House Inc.: Danbury, CT, USA, 2015; Volume 22, pp. 528–549. [Google Scholar] [CrossRef] [Green Version]
  26. Assis, E.; Katsman, L.; Ziskind, G.; Letan, R. Numerical and experimental study of melting in a spherical shell. Int. J. Heat Mass Transf. 2007, 50, 1790–1804. [Google Scholar] [CrossRef]
  27. Srinivasan, M.; Nagarajan, S.G.; Ramasamy, P. Computational Study of Heat Transfer on Molten Silicon during Directional Solidification for Solar Cell Applications. Procedia Eng. 2015, 127, 1250–1255. [Google Scholar] [CrossRef] [Green Version]
  28. Veeraragavan, A.; Montgomery, L.; Datas, A. Night time performance of a storage integrated solar thermophotovoltaic (SISTPV) system. Sol. Energy 2014, 108, 377–389. [Google Scholar] [CrossRef] [Green Version]
  29. Zeneli, M.; Malgarinos, I.; Nikolopoulos, A.; Nikolopoulos, N.; Grammelis, P.; Karellas, S.; Kakaras, E. Numerical simulation of a silicon-based latent heat thermal energy storage system operating at ultra-high temperatures. Appl. Energy 2019, 242, 837–853. [Google Scholar] [CrossRef]
  30. Ray, A.K.; Rakshit, D.; Ravi Kumar, K.; Gurgenci, H. Silicon as high-temperature phase change medium for latent heat storage: A thermo-hydraulic study. Sustain. Energy Technol. Assess. 2021, 46, 101249. [Google Scholar] [CrossRef]
  31. Ogoh, W.; Groulx, D. Effects of the heat transfer fluid velocity on the storage characteristics of a cylindrical latent heat energy storage system: A numerical study. Heat Mass Transf. 2012, 48, 439–449. [Google Scholar] [CrossRef]
  32. Groulx, D.; Biwole, P.H. Solar PV Passive Temperature Control Using Phase Change Materials. In Proceedings of the International Heat Transfer Conference 15, Kyoto, Japan, 10–14 August 2014. [Google Scholar] [CrossRef]
  33. COMSOL Multiphysics Reference Manual; Version 5.4; COMSOL: Burlington, MA, USA, 2018.
Figure 1. Numerical model (a) Computational geometry and (b) Discretized geometry.
Energies 14 06886 g001
Figure 2. Modified specific heat. (a) Silicon and (b) NaNO3. (Source: Yadav and Samir, 2019 [24]).
Energies 14 06886 g002
Figure 3. Average liquid fraction during melting of PCM.
Energies 14 06886 g003
Figure 4. Accuracy of the model. (a) Grid independence test, and (b) time independence test.
Energies 14 06886 g004
Figure 5. Temporal distribution of temperature during charging.
Energies 14 06886 g005
Figure 6. Temporal distribution of liquid fraction during charging.
Energies 14 06886 g006
Figure 7. Streamlines in the velocity field of molten silicon.
Energies 14 06886 g007
Figure 8. Temporal evolution of melting interface during the charging of the silicon domain.
Energies 14 06886 g008
Figure 9. Effect of heat flux on charging of domain.
Energies 14 06886 g009
Figure 10. Effect of heat flux on charging efficiency.
Energies 14 06886 g010
Figure 11. Temporal distribution of temperature during the discharging of the silicon domain.
Energies 14 06886 g011
Figure 12. Temporal distribution of solid fraction during the discharging of the silicon domain.
Energies 14 06886 g012
Figure 13. Influence of heat flux on discharge performance.
Energies 14 06886 g013
Figure 14. Influence of orientation of domain on charging and discharge performance. (a) Charging ; (b) Discharging.
Energies 14 06886 g014aEnergies 14 06886 g014b
Figure 15. Temporal distribution of liquid fraction and streamlines during charging of NaNO3 domain for q″ = 7500 W/m2. (a) Liquid fraction and (b) streamlines in the velocity field.
Energies 14 06886 g015
Figure 16. Temporal evolution of melting front during charging of NaNO3.
Energies 14 06886 g016
Figure 17. Comparison of thermal performance during charging and discharging. (a) Silicon domain and (b) NaNO3 domain.
Energies 14 06886 g017
Figure 18. Comparison of energy storage rate and density during charging.
Energies 14 06886 g018
Table 1. Thermo-physical properties of silicon and NaNO3.
Thermo-Physical
Properties
Melting Temperature
(K)
Latent Heat of Fusion (J/kg)Density
(kg/m3)
Specific Heat (J/kg K)Thermal Conductivity
(W/m K)
Dynamic
Viscosity
(Pa·s)
NaNO3 Tsol = 578
Tliq = 580
176,000ρsol = 2180
ρliq = 1908
cp,sol = 1600
cp,liq = 1655
ksol = 0.8
kliq = 0.6
µ = 0.00269
SiliconTsol = 1686
Tliq = 1688
1,800,000ρsol = 2330
ρliq = 2570
cp,sol = cp,liq = 1040ksol = 25
kliq = 50
µ = 0.0008
Table 2. Fixed parameters for both domains.
ChargingDischarging
ParametersSiliconNaNO3ParametersSiliconNaNO3
Subcooling8 KSupercooling8 K
Aspect ratio1 (0.1 m × 0.1 m)Aspect ratio1 (0.1 m × 0.1 m)
Heat flux (x = 0, y)2500,5000,7500 (W/m2)Heat flux (x = 0, y)−7500 W/m2
Velocityu,v (x = 0,L and y = 0,H) = 0Velocityu,v (x = 0,L and y = 0,H) = 0
Publisher’s Note: MDPI stays neutral with regard to jurisdictional claims in published maps and institutional affiliations.

