
Quality and Delivery Costs of Wood Chips by Railway vs. Road Transport

 ,
,  and
and 
Abstract
1. Introduction
2. Materials and Methods
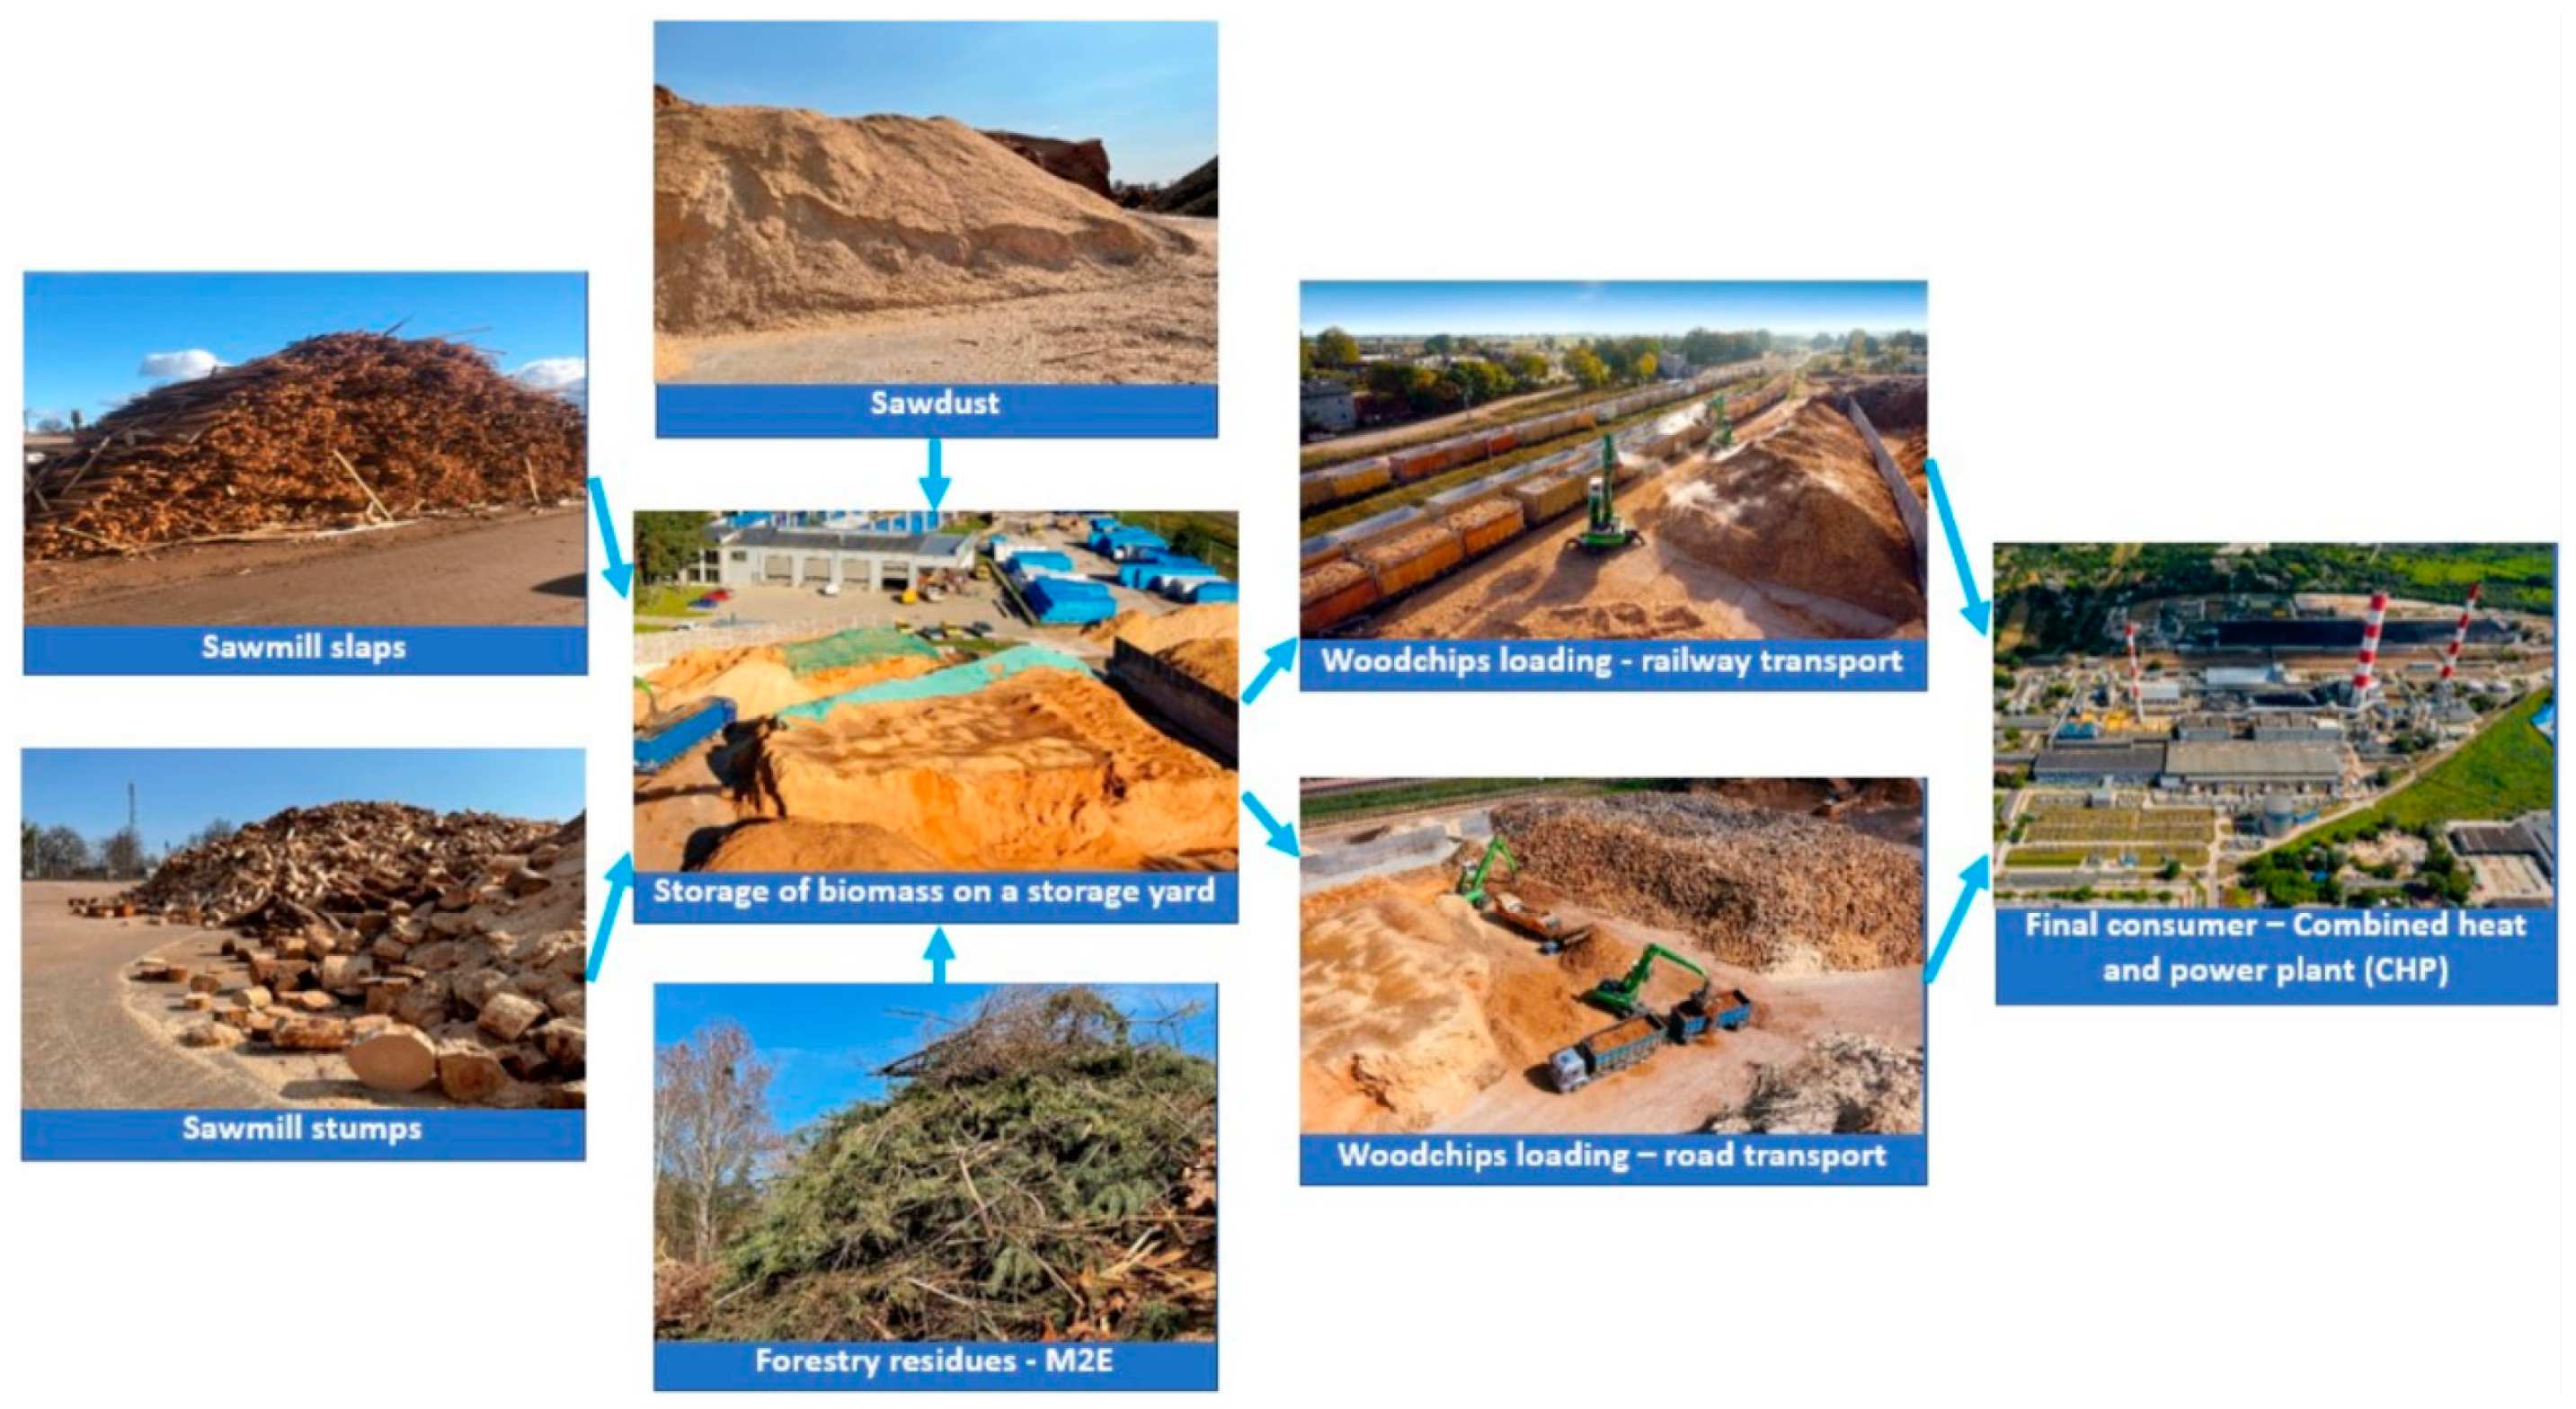
2.1. Characteristics of the Analysed Logistical Chains
2.2. Thermophysical Properties of Wood Chips
2.3. Cost of Wood Chip Delivery by Railway and Road Transport
2.4. Statistical Analysis
3. Results and Discussion
3.1. Thermophysical Properties of Biomass
3.2. Cost of Wood Chip Delivery to the End Consumer
4. Practical Implication of the Study
5. Conclusions
Supplementary Materials
Author Contributions
Funding
Institutional Review Board Statement
Informed Consent Statement
Acknowledgments
Conflicts of Interest
References
- Eurostat Energy. Complete Energy Balances (NRG_BAL_C). 2021. Available online: https://ec.europa.eu/eurostat/databrowser/bookmark/3cb337e2-0e3b-465c-bc35-62707dc56fa9?lang=en (accessed on 16 April 2021).
- Central Statistical Office. Energy from Renewable Sources in 2019; Central Statistical Office: Warsaw, Poland, 2020; p. 92. Available online: https://stat.gov.pl/obszary-tematyczne/srodowisko-energia/energia/energia-ze-zrodel-odnawialnych-w-2019-roku,3,14.html (accessed on 16 April 2021).
- Anerud, E.; Jirjis, R.; Larsson, G.; Eliasson, L. Fuel quality of stored wood chips—Influence of semi-permeable covering material. Appl. Energy 2018, 231, 628–634. [Google Scholar] [CrossRef]
- Durocher, C.; Thiffault, E.; Achim, A.; Auty, D.; Barrette, J. Untapped volume of surplus forest growth as feedstock for bioenergy. Biomass Bioenergy 2019, 120, 376–386. [Google Scholar] [CrossRef]
- Manzone, M.; Bergante, S.; Facciotto, G. Energy and economic sustainability of wood chip production by black locust (Robinia pseudoacacia L.) plantations in Italy. Fuel 2015, 140, 555–560. [Google Scholar] [CrossRef]
- Amaducci, S.; Facciotto, G.; Bergante, S.; Perego, A.; Serra, P.; Ferrarini, A.; Chimento, C. Biomass production and energy balance of herbaceous and woody crops on marginal soils in the Po Valley. GCB Bioenergy 2017, 9, 31–45. [Google Scholar] [CrossRef]
- Stolarski, M.J.; Śnieg, M.; Krzyżaniak, M.; Tworkowski, J.; Szczukowski, S.; Graban, Ł.; Lajszner, W. Short rotation coppices, grasses and other herbaceous crops: Biomass properties versus 26 genotypes and harvest time. Ind. Crop. Prod. 2018, 119, 22–32. [Google Scholar] [CrossRef]
- Nurmatov, N.; Gomez, D.L.; Hensgen, F.; Bühle, L.; Wachendorf, M. High-quality solid fuel production from leaf litter of urban street trees. Sustainability 2016, 8, 1249. [Google Scholar] [CrossRef]
- Stolarski, M.J.; Rybczyńska, B.; Krzyżaniak, M.; Lajszner, W.; Graban, Ł.; Peni, D.; Bordiean, A. Thermophysical properties and elemental composition of agricultural and forest solid biofuels versus fossil fuels. J. Elem. 2019, 24, 1215–1228. [Google Scholar] [CrossRef]
- Stolarski, M.J.; Warmiński, K.; Krzyżaniak, M.; Olba–Zięty, E.; Akincza, M. Bioenergy technologies and biomass potential vary in northern European countries. Renew. Sustain. Energy Rev. 2020, 133, 110238. [Google Scholar] [CrossRef]
- Gadd, H.; Werner, S. Daily heat load variations in Swedish district heating systems. Appl. Energy 2013, 106, 47–55. [Google Scholar] [CrossRef]
- Jirjis, R. Storage and drying of wood fuel. Biomass Bioenergy 1995, 9, 181–190. [Google Scholar] [CrossRef]
- Flisberg, P.; Frisk, M.; Ronnqvist, M. FuelOpt: A decision support system for forest fuel logistics. J. Oper. Res. Soc. 2012, 63, 1600–1612. [Google Scholar] [CrossRef]
- Windisch, J.; Väätäinen, K.; Anttila, P.; Nivala, M.; Laitila, J.; Asikainen, A.; Sikanen, L. Discrete-event simulation of an information-based raw material allocation process for increasing the efficiency of an energy wood supply chain. Appl. Energy 2015, 149, 315–325. [Google Scholar] [CrossRef]
- Eriksson, A.; Eliasson, L.; Sikanen, L.; Hansson, P.-A.; Jirjis, R. Evaluation of delivery strategies for forest fuels applying a model for Weather-driven Analysis of Forest Fuel Systems (WAFFS). Appl. Energy 2017, 188, 420–430. [Google Scholar] [CrossRef]
- Mahmudi, H.; Flynn, P. Rail vs Truck Transport of Biomass. Appl. Biochem. Biotechnol. 2006, 129–132, 88–103. [Google Scholar] [CrossRef]
- Nosek, R.; Holubcik, M.; Jandacka, J. The impact of bark content of wood biomass on biofuel properties. BioResources 2016, 11, 44–53. [Google Scholar] [CrossRef]
- Dibdiakova, J.; Wang, L.; Li, H. Characterization of ashes from Pinus Sylvestris forest biomass. Energy Procedia 2015, 75, 186–191. [Google Scholar] [CrossRef][Green Version]
- Cempírek, V.; Široký, J.; Nachtigall, P.; Hlavsová, P. Use of Innofreight Containers for Thermal Coal Transportation. MATEC Web Conf. 2017, 134, 00005. [Google Scholar] [CrossRef][Green Version]
- The State Forests National Forest Holding, Technical Conditions—Wood Residues, Annex 12 to Regulation No. 51 of DGLP of 30/09/2019. Available online: http://drewno.zilp.lasy.gov.pl/drewno/Normy/12._pozostaosci_drzewne.pdf (accessed on 16 April 2021).
- PN-EN ISO 16559–Solid Biofuels–Terminology, Definitions and Descriptions; Polish Standardization Committee: Warsaw, Poland, 2014.
- PN-EN ISO 17225-1–Solid Biofuels–Fuel Specifications and Classes: Part 1: General Requirements; Polish Standardization Committee: Warsaw, Poland, 2014.
- PN-EN ISO 18134-2–Solid Biofuels–Determination of Moisture Content–Dryer Method–Part 2: Total Moisture–Simplified Method; Polish Standardization Committee: Warsaw, Poland, 2014.
- PN-EN ISO 18122–Solid Biofuels–Determination of Ash Content; Polish Standardization Committee: Warsaw, Poland, 2015.
- PN-EN ISO 18125–Solid Biofuels–Determination of Calorific Value; Polish Standardization Committee: Warsaw, Poland, 2017.
- Kurvits, V.; Ots, K.; Kangur, A.; Korjus, H.; Muiste, P. Assessment of load and quality of logging residues from clear-felling areas in Järvselja: A case study from Southeast Estonia. Cent. Eur. For. J. 2020, 66, 3–11. [Google Scholar] [CrossRef]
- Palacka, M.; Vician, P.; Holubčík, M.; Jandačka, J. The energy characteristics of different parts of the tree. Procedia Eng. 2017, 192, 654–658. [Google Scholar] [CrossRef]
- Neiva, D.M.; Araújo, S.; Gominho, J.; de Carneiro, A.C.C.; Pereira, H. An integrated characterization of Picea abies industrial bark regarding chemical composition, thermal properties and polar extracts activity. PLoS ONE 2018, 13, e0208270. [Google Scholar] [CrossRef]
- Ninikas, K.; Ntalos, G.; Mitani, A.; Koutsianitis, D. Calorific values from Greek spruce residues and bioenergy potentials via pellet production. Pro Ligno 2019, 4, 300–305. [Google Scholar]
- Laitila, J.; Asikainen, A.; Ranta, T. Cost analysis of transporting forest chips and forest industry by products with large truck-trailers in Finland. Biomass Bioenergy 2016, 90, 252–261. [Google Scholar] [CrossRef]
- Ruiz, J.A.; Juarez, M.C.; Morales, M.P.; Munoz, P.; Mendivil, M.A. Biomass logistics: Financial & environmental costs. Case study: 2 MW electrical power plants. Biomass Bioenergy 2013, 56, 260–267. [Google Scholar]
- Manzone, M.; Balsari, P. The energy consumption and economic costs of different vehicles used in transporting woodchips. Fuel 2015, 139, 511–515. [Google Scholar] [CrossRef]
- Schnorf, V.; Trutnevyte, E.; Bowman, G.; Burg, V. Biomass transport for energy: Cost, energy and CO2 performance of forest wood and manure transport chains in Switzerland. J. Clean. Prod. 2021, 293, 125971. [Google Scholar] [CrossRef]
- Islam, D.M.Z.; Zunder, T.H. Experiences of rail intermodal freight transport for low-density high value (LDHV) goods in Europe. Eur. Transp. Res. Rev. 2018, 10, 24. [Google Scholar] [CrossRef]


| Attribute | Unit | Mean | Lower Quartile | Upper Quartile | Standard Deviation |
|---|---|---|---|---|---|
| Moisture content | % | 10.46 | 9.40 | 11.61 | 1.45 |
| Lower heating value | GJ Mg−1 | 38.28 | 32.65 | 43.15 | 7.11 |
| Ash content | % DM | 3.42 | 2.40 | 4.35 | 1.35 |
| Bulk density | kg LCM−1 | 305.97 | 285.96 | 324.08 | 27.99 |
| Cost | € Mg−1 FM | 11.37 | 10.72 | 11.79 | 1.15 |
| Cost | € Mg−1 DM | 18.55 | 17.15 | 19.79 | 1.83 |
| Cost | € GJ−1 | 1.10 | 1.01 | 1.19 | 0.13 |
| Source of Variation | Moisture Content | Lower Heating Value | Ash Content | Bulk Density | Cost (€ Mg−1 FM) | Cost (€ Mg−1 DM) | Cost (€ GJ−1) |
|---|---|---|---|---|---|---|---|
| Year (Y) | 0.000 * | 0.000 * | 0.046 * | 0.129 | 0.904 | 0.000 * | 0.000 * |
| Quarter (Q) | 0.000 * | 0.000 * | 0.010 * | 0.000 * | 0.000 * | 0.000 * | 0.000 * |
| Type of transport (T) | 0.000 * | 0.000 * | 0.000 * | 0.000 * | 0.000 * | 0.000 * | 0.000 * |
| Y × Q | 0.124 | 0.080 | 0.039 * | 0.395 | 0.639 | 0.978 | 0.864 |
| Y × T | 0.886 | 0.078 | 0.000 * | 0.001 * | 0.357 | 0.944 | 0.151 |
| Q × T | 0.000 * | 0.000 * | 0.221 | 0.000 * | 0.000 * | 0.000 * | 0.000 * |
| Y × Q × T | 0.000 * | 0.000 * | 0.893 | 0.027 * | 0.006 * | 0.000 * | 0.000 * |
| Source of Variation | Item | Moisture Content (%) | Lower Heating Value (GJ Mg−1) |
|---|---|---|---|
| Year (Y) | 2019 | 39.96 a (17.4) | 10.22 b (14.0) |
| 2020 | 36.59 b (19.0) | 10.69 a (13.5) | |
| Quarter (Q) | Q1 | 45.55 a (10.2) | 8.90 d (10.0) |
| Q2 | 37.80 c (10.7) | 10.62 b (7.7) | |
| Q3 | 28.93 d (9.2) | 12.35 a (4.4) | |
| Q4 | 40.84 b (7.9) | 9.95 c (6.2) | |
| Type of transport (T) | Railway transport | 39.70 a (19.6) | 10.25 b (15.4) |
| Road transport | 36.86 b (16.7) | 10.67 a (12.1) | |
| Y × Q | 2019_ Q1 | 46.82 (12.4) | 8.80 (14.0) |
| 2019_ Q2 | 40.36 (8.9) | 10.21 (8.0) | |
| 2019_ Q3 | 30.78 (6.9) | 12.03 (3.9) | |
| 2019_ Q4 | 41.89 (6.4) | 9.86 (6.9) | |
| 2020_ Q1 | 44.28 (6.3) | 9.00 (3.5) | |
| 2020_ Q2 | 35.24 (7.4) | 11.03 (5.4) | |
| 2020_ Q3 | 27.08 (6.0) | 12.68 (3.2) | |
| 2020_ Q4 | 39.78 (8.9) | 10.05 (5.6) | |
| Y × T | 2019_ Railway | 41.42 (18.0) | 9.92 (15.4) |
| 2019_ Road | 38.51 (16.1) | 10.52 (12.3) | |
| 2020_ Railway | 37.98 (20.7) | 10.57 (15.1) | |
| 2020_ Road | 35.21 (16.3) | 10.81 (12.0) | |
| Q × T | Q1_ Railway | 49.04 a (6.7) | 8.34 d (8.0) |
| Q1_ Road | 42.05 b (6.6) | 9.46 c (7.7) | |
| Q2_ Railway | 39.08 c (10.3) | 10.32 b (8.4) | |
| Q2_ Road | 36.52 c (10.3) | 10.93 b (6.0) | |
| Q3_ Railway | 29.34 d (11.8) | 12.33 a (5.5) | |
| Q3_ Road | 28.52 d (5.5) | 12.37 a (3.2) | |
| Q4_ Railway | 41.33 b (4.4) | 10.01 b (5.2) | |
| Q4_ Road | 40.35 b (10.6) | 9.90 b (7.4) | |
| Mean | 38.28 (18.6) | 10.46 (13.9) |
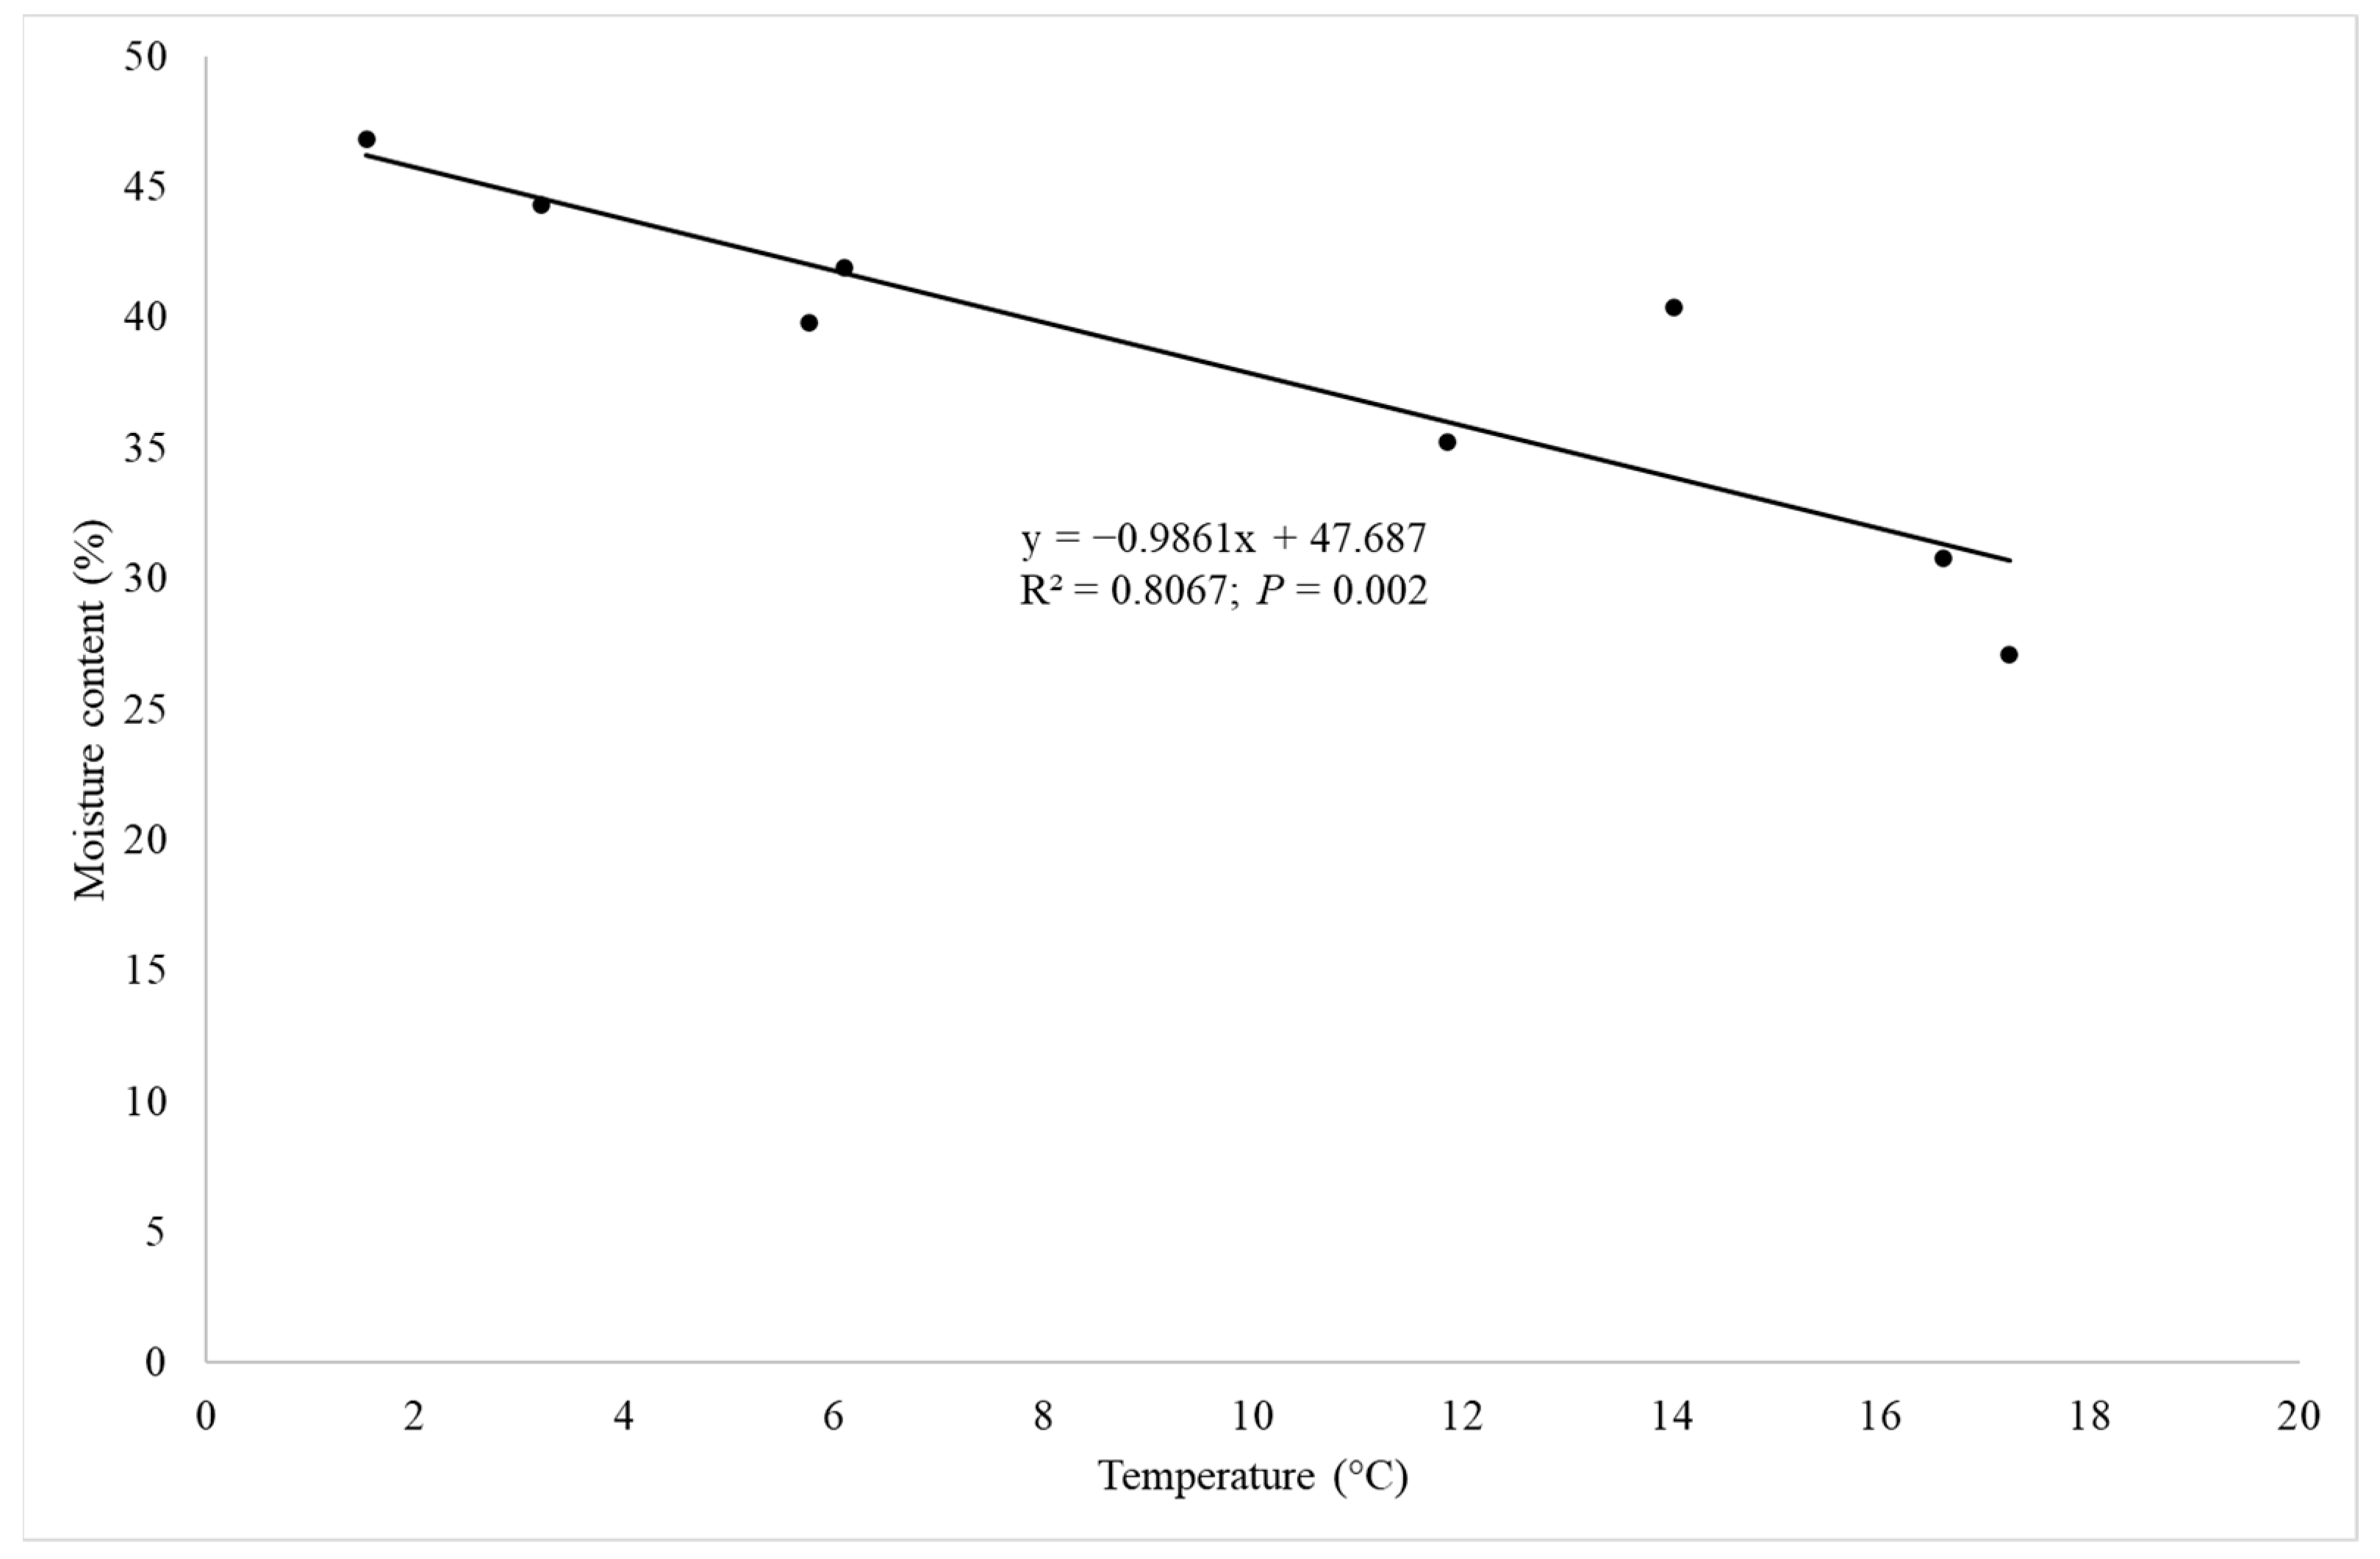
| Item | Average Temperature (°C) | Total Precipitation (mm) | Number of Days with Snow Cover | Number of Days with Precipitation |
|---|---|---|---|---|
| 2019 | 9.6 | 672.2 | 44 | 202 |
| 2020 | 9.5 | 667.4 | 10 | 194 |
| Q1 | 2.4 | 144.5 | 24 | 67 |
| Q2 | 13.0 | 219.5 | 1 | 38 |
| Q3 | 16.9 | 185.9 | 0 | 41 |
| Q4 | 5.9 | 120.0 | 3 | 53 |
| 2019_ Q1 | 1.5 | 139.6 | 43 | 70 |
| 2019_ Q2 | 14.0 | 227.8 | 0 | 31 |
| 2019_ Q3 | 16.6 | 204.3 | 0 | 45 |
| 2019_ Q4 | 6.1 | 100.5 | 1 | 56 |
| 2020_ Q1 | 3.2 | 149.3 | 5 | 64 |
| 2020_ Q2 | 11.9 | 211.1 | 1 | 44 |
| 2020_ Q3 | 17.2 | 167.5 | 0 | 37 |
| 2020_ Q4 | 5.8 | 139.5 | 4 | 49 |
| Item | Lower Heating Value | Moisture Content | Ash Content | Bulk Density | Cost (€ Mg−1 FM) | Cost (€ Mg−1 DM) |
|---|---|---|---|---|---|---|
| Moisture content | −0.98 * | |||||
| Ash content | 0.22 * | −0.35 * | ||||
| Bulk density | −0.68 * | 0.73 * | −0.35 * | |||
| Cost (€ Mg−1 FM) | 0.57 * | −0.57 * | −0.02 | −0.73 * | ||
| Cost (€ Mg−1 DM) | −0.57 * | 0.60 * | −0.41 * | 0.12 | 0.31 * | |
| Cost (€ GJ−1) | −0.72 * | 0.69 * | −0.26 * | 0.20 | 0.14 | 0.95 * |
| Source of Variation | Item | Ash Content (% DM) | Bulk Density (kg LCM−1) |
|---|---|---|---|
| Year (Y) | 2019 | 3.19 b (36.7) | 308.56 (9.2) |
| 2020 | 3.64 a (40.9) | 303.39 (9.2) | |
| Quarter (Q) | Q1 | 3.13 b (41.8) | 323.69 a (10.2) |
| Q2 | 3.13 b (32.7) | 302.28 b (6.7) | |
| Q3 | 4.06 a (30.0) | 281.31 c (4.6) | |
| Q4 | 3.35 b (49.1) | 316.60 a (7.0) | |
| Type of transport (T) | Railway transport | 2.91 b (28.7) | 313.14 a (10.3) |
| Road transport | 3.93 a (40.1) | 298.81 b (7.0) | |
| Y × Q | 2019_ Q1 | 2.34 c (29.5) | 329.07 (10.1) |
| 2019_ Q2 | 3.14 b (25.2) | 307.84 (8.4) | |
| 2019_ Q3 | 4.01 a (25.9) | 281.78 (5.0) | |
| 2019_ Q4 | 3.28 b (44.9) | 315.55 (4.0) | |
| 2020_ Q1 | 3.92 a (33.7) | 318.31 (10.4) | |
| 2020_ Q2 | 3.11 b (40.1) | 296.73 (3.8) | |
| 2020_ Q3 | 4.12 a (34.6) | 280.84 (4.3) | |
| 2020_ Q4 | 3.42 b (54.5) | 317.66 (9.3) | |
| Y × T | 2019_ Railway | 3.13 b (25.4) | 309.61 a (10.1) |
| 2019_ Road | 3.25 b (45.3) | 307.51 a (8.3) | |
| 2020_ Railway | 2.68 b (30.7) | 316.67 a (10.5) | |
| 2020_ Road | 4.60 a (30.2) | 290.10 b (3.5) | |
| Q × T | Q1_ Railway | 2.86 (26.2) | 348.91 a (5.3) |
| Q1_ Road | 3.4 (49.7) | 298.48 c (7.7) | |
| Q2_ Railway | 2.76 (29.7) | 303.05 c (4.3) | |
| Q2_ Road | 3.49 (31.6) | 301.52 c (8.7) | |
| Q3_ Railway | 3.55 (26.4) | 273.13 d (4.7) | |
| Q3_ Road | 4.58 (28.2) | 289.49 c (1.9) | |
| Q4_ Railway | 2.46 (16.3) | 327.47 b (5.0) | |
| Q4_ Road | 4.23 (45.8) | 305.74 c (7.3) | |
| Mean | 3.42 (39.6) | 305.97 (9.1) |
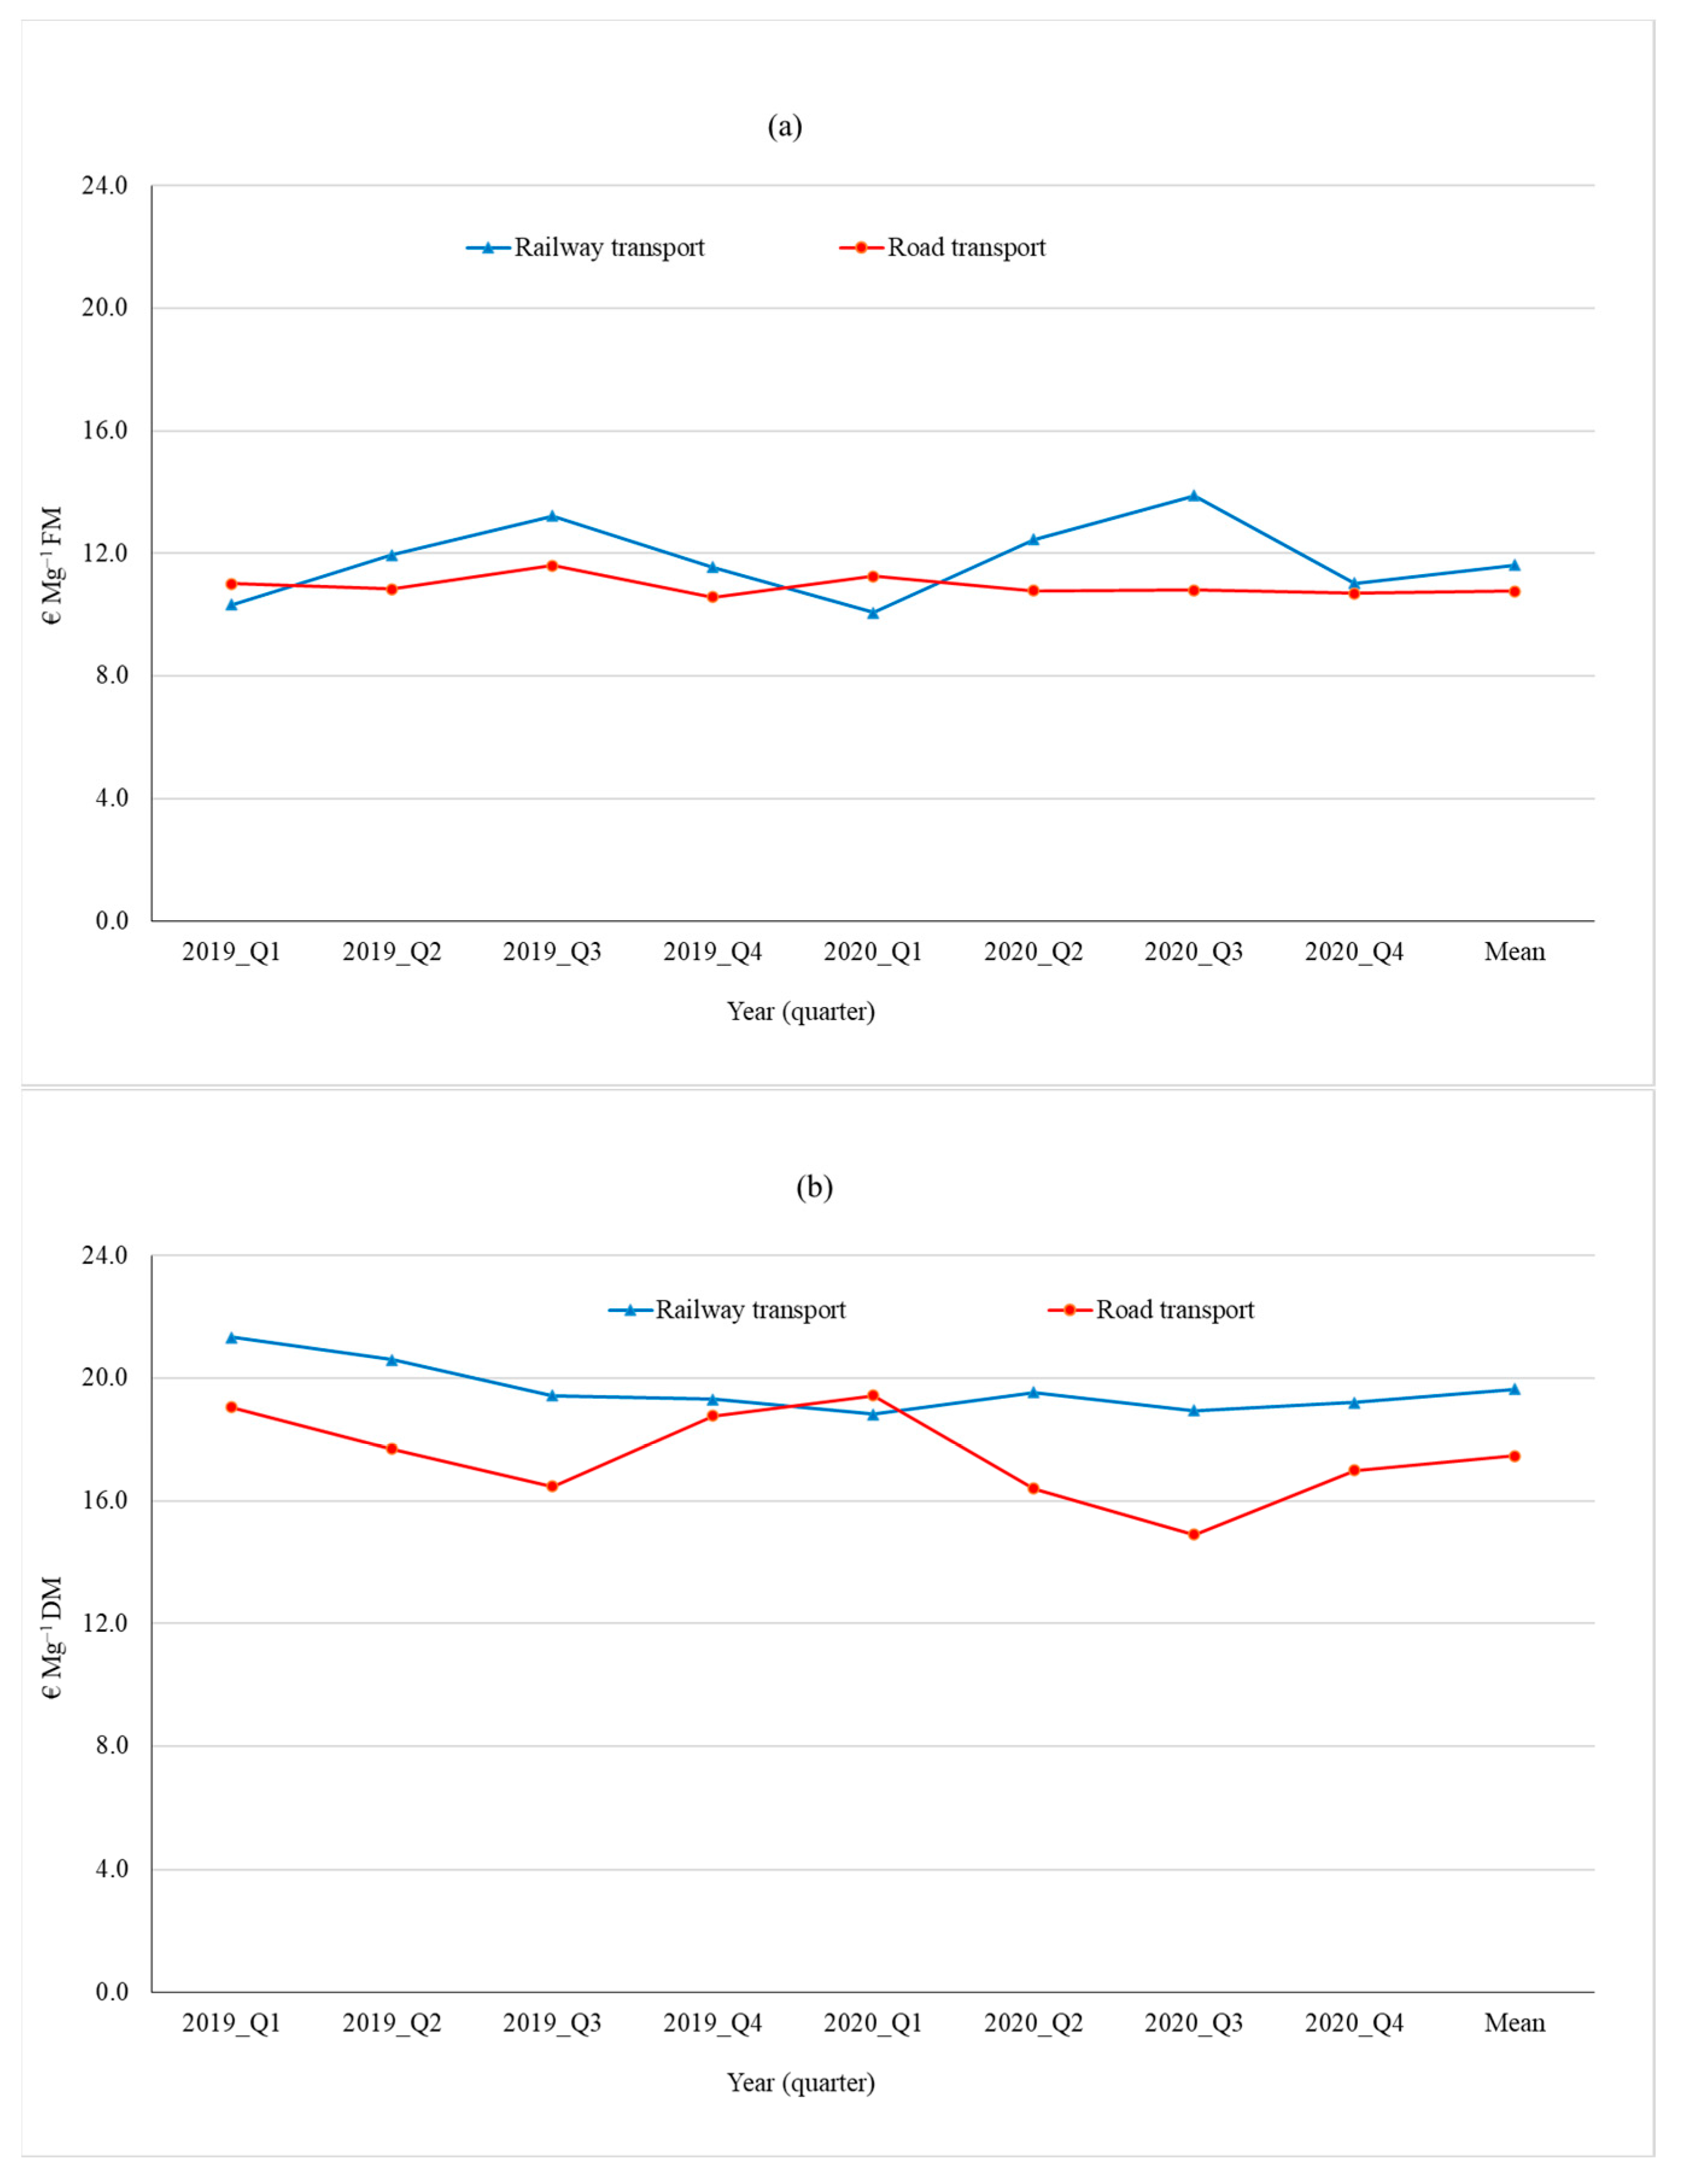
| Source of Variation | Item | Cost (€ Mg−1 FM) | Cost (€ Mg−1 DM) | Cost (€ GJ−1) |
|---|---|---|---|---|
| Year (Y) | 2019 | 11.38 (9.6) | 19.08 a (9.2) | 1.13 a (11.5) |
| 2020 | 11.37 (10.7) | 18.02 b (9.8) | 1.07 b (11.3) | |
| Quarter (Q) | Q1 | 10.66 c (7.4) | 19.66 a (8.2) | 1.21 a (9.6) |
| Q2 | 11.50 b (8.4) | 18.55 b (10.0) | 1.09 b (11.2) | |
| Q3 | 12.37 a (10.9) | 17.43 c (11.5) | 1.00 c (11.3) | |
| Q4 | 10.96 c (5.2) | 18.56 b (6.0) | 1.10 b (6.3) | |
| Type of transport (T) | Railway transport | 11.81 a (11.5) | 19.64 a (5.7) | 1.16 a (7.9) |
| Road transport | 10.94 b (6.0) | 17.46 b (10.1) | 1.04 b (12.5) | |
| Y × Q | 2019_ Q1 | 10.66 (8.2) | 20.19 (9.4) | 1.23 (11.5) |
| 2019_ Q2 | 11.39 (9.0) | 19.14 (10.0) | 1.12 (11.9) | |
| 2019_ Q3 | 12.41 (8.1) | 17.95 (9.4) | 1.03 (10.1) | |
| 2019_ Q4 | 11.06 (6.0) | 19.03 (3.7) | 1.12 (5.1) | |
| 2020_ Q1 | 10.65 (6.8) | 19.13 (5.7) | 1.18 (7.3) | |
| 2020_ Q2 | 11.61 (8.1) | 17.96 (9.4) | 1.06 (9.9) | |
| 2020_ Q3 | 12.34 (13.5) | 16.91 (13.1) | 0.97 (12.1) | |
| 2020_ Q4 | 10.86 (4.3) | 18.09 (7.0) | 1.08 (7.1) | |
| Y × T | 2019_ Railway | 11.76 (10.2) | 20.16 (5.5) | 1.20 (8.6) |
| 2019_ Road | 11.00 (7.6) | 18.00 (9.1) | 1.06 (10.9) | |
| 2020_ Railway | 11.85 (13.0) | 19.12 (4.6) | 1.13 (5.6) | |
| 2020_ Road | 10.88 (3.7) | 16.93 (10.4) | 1.02 (14.1) | |
| Q × T | Q1_ Railway | 10.19 d (5.6) | 20.07 a (8.4) | 1.23 a (10.0) |
| Q1_ Road | 11.13 c (6.3) | 19.24 a (7.7) | 1.18 a (9.2) | |
| Q2_ Railway | 12.20 b (4.8) | 20.06 a (3.8) | 1.19 a (5.4) | |
| Q2_ Road | 10.80 c (6.7) | 17.04 b (7.7) | 0.99 c (7.5) | |
| Q3_ Railway | 13.55 a (5.5) | 19.19 a (4.7) | 1.10 b (5.5) | |
| Q3_ Road | 11.20 c (4.2) | 15.68 c (5.7) | 0.91 d (5.6) | |
| Q4_ Railway | 11.29 c (2.7) | 19.25 a (2.7) | 1.13 b (4.1) | |
| Q4_ Road | 10.63 c (5.6) | 17.88 b (6.4) | 1.08 b (7.5) | |
| Mean | 11.37 (10.1) | 18.55 (9.9) | 1.10 (11.6) |
Publisher’s Note: MDPI stays neutral with regard to jurisdictional claims in published maps and institutional affiliations. |
© 2021 by the authors. Licensee MDPI, Basel, Switzerland. This article is an open access article distributed under the terms and conditions of the Creative Commons Attribution (CC BY) license (https://creativecommons.org/licenses/by/4.0/).
Share and Cite
Stolarski, M.J.; Stachowicz, P.; Sieniawski, W.; Krzyżaniak, M.; Olba-Zięty, E. Quality and Delivery Costs of Wood Chips by Railway vs. Road Transport. Energies 2021, 14, 6877. https://doi.org/10.3390/en14216877
Stolarski MJ, Stachowicz P, Sieniawski W, Krzyżaniak M, Olba-Zięty E. Quality and Delivery Costs of Wood Chips by Railway vs. Road Transport. Energies. 2021; 14(21):6877. https://doi.org/10.3390/en14216877
Chicago/Turabian StyleStolarski, Mariusz Jerzy, Paweł Stachowicz, Waldemar Sieniawski, Michał Krzyżaniak, and Ewelina Olba-Zięty. 2021. "Quality and Delivery Costs of Wood Chips by Railway vs. Road Transport" Energies 14, no. 21: 6877. https://doi.org/10.3390/en14216877
APA StyleStolarski, M. J., Stachowicz, P., Sieniawski, W., Krzyżaniak, M., & Olba-Zięty, E. (2021). Quality and Delivery Costs of Wood Chips by Railway vs. Road Transport. Energies, 14(21), 6877. https://doi.org/10.3390/en14216877