Article

Clarifying the Effect of Clay Minerals on Methane Adsorption Capacity of Marine Shales in Sichuan Basin, China

1
PetroChina Research Institute of Petroleum Exploration & Development, Beijing 100083, China
2
National Energy Shale Gas R&D (Experiment) Center, Langfang 065007, China
3
Key Lab of Unconventional Oil & Gas, CNPC, Langfang 065007, China
4
PetroChina Zhejiang Oilfield Company, Hangzhou 311100, China
5
School of Geosciences and Key Laboratory of Deep Oil and Gas, China University of Petroleum (East China), Qingdao 266580, China
*
Author to whom correspondence should be addressed.
Energies 2021, 14(20), 6836; https://doi.org/10.3390/en14206836
Submission received: 29 September 2021 / Revised: 15 October 2021 / Accepted: 17 October 2021 / Published: 19 October 2021

Abstract

:
The effect of clay minerals on the methane adsorption capacity of shales is a basic issue that needs to be clarified and is of great significance for understanding the adsorption characteristics and mechanisms of shale gas. In this study, a variety of experimental methods, including XRD, LTNA, HPMA experiments, were conducted on 82 marine shale samples from the Wufeng–Longmaxi Formation of 10 evaluation wells in the southern Sichuan Basin of China. The controlling factors of adsorption capacities were determined through a correlation analysis with pore characteristics and mineral composition. In terms of mineral composition, organic matter (OM) is the most key methane adsorbent in marine shale, and clay minerals have little effect on methane adsorption. The ultra-low adsorption capacity of illite and chlorite and the hydrophilicity and water absorption ability of clay minerals are the main reasons for their limited effect on gas adsorption in marine shales. From the perspective of the pore structure, the micropore and mesopore specific surface areas (SSAs) control the methane adsorption capacity of marine shales, which are mainly provided by OM. Clay minerals have no relationship with SSAs, regardless of mesopores or micropores. In the competitive adsorption process of OM and clay minerals, OM has an absolute advantage. Clay minerals become carriers for water absorption, due to their interlayer polarity and water wettability. Based on the analysis of a large number of experimental datasets, this study clarified the key problem of whether clay minerals in marine shales control methane adsorption.

1. Introduction

In recent years, China’s marine shale gas development has achieved great success [1,2,3]. The total shale gas production of China in 2020 has reached 200 × 108 m3, with proved geological reserves of more than 20,000 × 108 m3 [4]. The shale of the Lower Silurian Longmaxi Formation in the Sichuan Basin is an important target of shale gas development [5,6,7]. Gas content is a key indicator for the evaluation of shale gas reservoirs and the calculation of its reserves [8,9,10]. Because shale gas is composed of free gas and adsorbed gas, the determination of the adsorbed-gas content has become a key task in shale gas reservoir evaluation [11,12,13,14,15].
Since methane is the main component of shale gas, the adsorbed-gas capacity in shales is always determined through methane adsorption experiments [16,17,18]. The obtained isotherms are always fitted by adsorption models to predict the adsorbed-gas volume of shales under formation temperature and pressure [19,20,21]. In order to evaluate the gas bearing capacity of different types of shale reservoirs, many scholars have studied the adsorption capacity of shale and its controlling factors [22,23,24,25,26]. Recently, Zhang [27] studied the influence of the organic matter (OM) content and its maturity on the adsorption capacity of shale and found that OM is the main controlling factor on gas adsorption in shales, and OM maturity mainly affects the methane adsorption capacity of organic-rich shales at low pressure. Ross [28] pointed out that the shale adsorption capacity is linearly correlated with the TOC, and high vitrinite content accounts for a strong gas adsorption. In addition, Zhu [26] stated that clay minerals and OM provide the most adsorption sites for adsorption, due to their large specific surface area (SSA). Liu [25] indicated that clay minerals and OM are two main controlling factors of natural gas adsorption in shales. The composition and microporous structure of clay minerals also affect the gas adsorption, owing to their large SSAs, which provide abundant sites for gas adsorption [29]. Lu [30] claimed that the presence of illite is responsible for gas adsorption and storage, especially for samples with low OM content. In addition, Ross [28] studied the effects of illite and montmorillonite on the adsorption capacity of shales. He concluded that gas adsorption depends on the type of clay mineral and the microporous structure of clay platelets. Overall, many studies have shown that both the TOC and clay mineral content have a significant impact on the methane adsorption capacity of shales.
However, some studies have indicated that clays have a limited effect on the gas adsorption capacity of shales [31,32,33,34]. Sun [32] reported that clay content shows no obvious relationship with the adsorption volume of shale samples with TOC ranging from 1.97% to 3.49%. Luo [34] studied the effects of pore structure and water wettability on the adsorption amount of shales and concluded that the adsorption capacity of OM for methane is much stronger than that of clay. They speculated that hydrophobic OM pores and hydrophilic clay pores lead to a more preferential adsorption of methane on OM than clays. Ji [35] systematically studied the methane adsorption characteristics of clay-dominated rocks and stated that methane molecules occupy the surface position of OM preferentially because methane has a much stronger affinity for organic-rich shale than most common clay minerals. Moreover, Ortiz Cancino [36] observed no correlation between the TOC-normalized adsorption amount and clay mineral content in the case of their shale samples, showing that clay minerals do not contribute significantly to methane adsorption. This phenomenon was also observed by Gasparik and Shabani [17,37].
Therefore, we need to analyze an important question: does the clay mineral content affect the adsorption capacity of shales? Clay minerals are an important part of shales, and their proportion can reach up to 60% in marine Longmaxi Formation shales [21]. The studies on pure clays, such as montmorillonite and illite, have proven that they have large surface areas and strong adsorption capacity for methane [35,38,39]. However, after diagenesis and thermal evolution, the clay mineral compositions of shales from different lithofacies become quite different [40]. With regard to marine shales in China, the question of whether the clay minerals control the methane adsorption capacity is still controversial.
In the present study, we aim to reassess and clarify the effect of clay minerals on the adsorption capacity of marine shales in Southern China. The correlation analysis is based on the large adsorption dataset and mineral composition dataset of shale samples, which are quite different from those of the previous analysis based on a small number of experimental data.

2. Samples and Experiments

2.1. Samples

We have collected 82 fresh samples from the upper Ordovician Wufeng Lower Silurian Longmaxi Formation in the southern Sichuan Basin. This shale formation is famous for its large reserves and commercial development of shale gas in southern China [40,41]. The shale samples were selected from 10 wells in the Zhaotong shale gas demonstration zone shown in Figure 1, covering different sublayers of the Longmaxi Formation, their depth ranging from 1014.50 m to 3039.78 m [7]. The lower part of the Longmaxi Formation is dominated by black siliceous shale and carbonaceous shale, which is a high-quality shale gas reservoir with a thickness of more than 40 m [41]. The middle and upper parts of the Longmaxi Formation comprise mainly gray silty shale with a total thickness of more than 100 m [41]. All these Longmaxi shales are overmatured, with Ro ranging from 2.45% to 2.86%. Moreover, the kerogen type of the Longmaxi Formation shale is always classified as Type I–II1. Detailed basic information about these samples, including the depth distribution, TOC content and mineral content, is shown in Table 1.

2.2. Mineral Analysis

All the samples were cut into several parts, dried and crushed for various analyses. The mineral components of the shale samples were analyzed, using a Rigaku RINT-TTR III X-ray diffractometer (XRD) [42]. The content of the mineral can be determined by testing the intensity of the characteristic peak, as its intensity is positively related to its content in the sample. All the samples were crushed and sieved into 20–40 meshes and fewer than 200 mesh particles for the non-clay mineral and clay mineral analyses, respectively. The accelerating voltage was 40 kV, and the current was about 30 mA. Moreover, the scanning speed was 2°/min with 0.02° increments. Then, the content of non-clay minerals was determined by the K-value method, and the relative content of the clay minerals was determined through the subtraction method of the diffraction peak area of the N/E/T glass slides, as shown in Figure 2.

2.3. TOC Experiments

OM is an important adsorbent in shales. To compare the adsorption capacity of clay minerals and OM, a TOC test needs to be performed. The LECO CS200 carbon sulfur analyzer was used to determine the TOC content, and the accuracy was within 0.3% [43]. In order to effectively remove inorganic carbon from all carbonate minerals, shale samples were crushed with a pulverizer, and then 200 mesh powder particles were selected and soaked in hydrochloric acid with a concentration of 5% for two days to remove inorganic carbon. The remaining powder particles were then placed in a drying oven at 65 °C for two days to remove moisture. After weighing an appropriate amount of the powder sample, the concentration of CO2 and CO was obtained by the combustion method in the carbon–sulfur analyzer, and then calibrated to the organic carbon content.

2.4. Low-Temperature N2 Adsorption Experiments

The SSA is also one of the important parameters to characterize the methane adsorption capacity of shale. Generally, the isothermal adsorption curve of shale is obtained by the low-temperature N2 adsorption (LTNA) experiment. Brunauer–Emmett–Teller (BET), Barrett–Joyner–Halenda (BJH), and t-plot models were applied to the LTNA isotherms to obtain the pore volume (PV) and SSA of mesopores (2–200 nm) and micropores (0–2 nm) [43,44,45,46]. The experiment was carried out in an ASAP 2420 specific surface instrument at 77 K. Shale samples need to be pretreated to improve the experimental accuracy, such as drying at 110 °C and degassing in high vacuum (< 10 mmHg) at 110 °C for 12 h to remove moisture and volatiles.

2.5. Methane Adsorption Experiments

The high-pressure methane adsorption (HPMA) experiments were conducted by the gravimetrical method, the core component of which is a magnetic suspension balance (MSB) with an accuracy of 10 μg. The maximum test temperature and pressure is 150 °C and 35 MPa, respectively [43]. The samples were first crushed into 40–80 mesh particles and then dried at 105 °C for 24 h. Before the test, the sample was degassed in a vacuum at 150 °C for 4 h to remove any moisture and impurities. After the blank test and buoyancy test, the methane adsorption test was conducted on the shale samples at 60 °C, and the maximum test pressure was set as 30 MPa. The excess adsorption capacity (mex) and the density of methane gas (ρg) can be directly measured at each equilibrium pressure point when considering the adsorbed-phase volume. If either the adsorbed methane density (ρa) or volume (Va) is known, then the excess adsorption capacity (mex) can be transformed into the absolute adsorption capacity (mabs) by the following equation [43]:
m a b s = m e x / 1 ρ g / ρ a

3. Results

3.1. TOC and Clay Mineral Composition

The TOC of all the samples ranges from 0.46% to 7.40%, and the average value reaches 2.58%. The TOC values of all the 10 wells show the same changing law. As the depth increases, the TOC increases, reaching the maximum at the bottom of the Longmaxi Formation and then slightly decreasing at the Wufeng Formation. The TOC is one of the most important parameters to evaluate shale gas reservoirs, which are closely related to the development of nanopores and gas adsorption capacity of shales. The bottom of the Longmaxi Formation has the highest TOC, so this sublayer is selected for the shale gas development in China [41].
The shale samples are mainly composed of quartz and clay minerals, accounting for more than 60% of the minerals in the 10 wells, on average. Among them, the content of quartz is 7.0–55.5%, with an average of 32.6%, while the content of clay minerals is 7.8–64.3%, with an average of 29.4%. The type and content of the clay minerals are determined after treatment of the sample glass slides. The XRD spectra indicate that the clay minerals in the shale samples only consist of illite, chlorite, and illite–smectite (I–S) mixed layers, and their average contents are 13.5%, 5.3%, and 10.6%, respectively. All the 10 wells show that the mineral content varies greatly with the increase in depth in Figure 3. The quartz content at the bottom of Longmaxi Formation is the highest, and the clay mineral content is the lowest. Therefore, in this sublayer, the shale has high brittleness and fracturability. This is also an important reason for selecting this layer for fracturing [7].

3.2. SSA and PV Characteristics

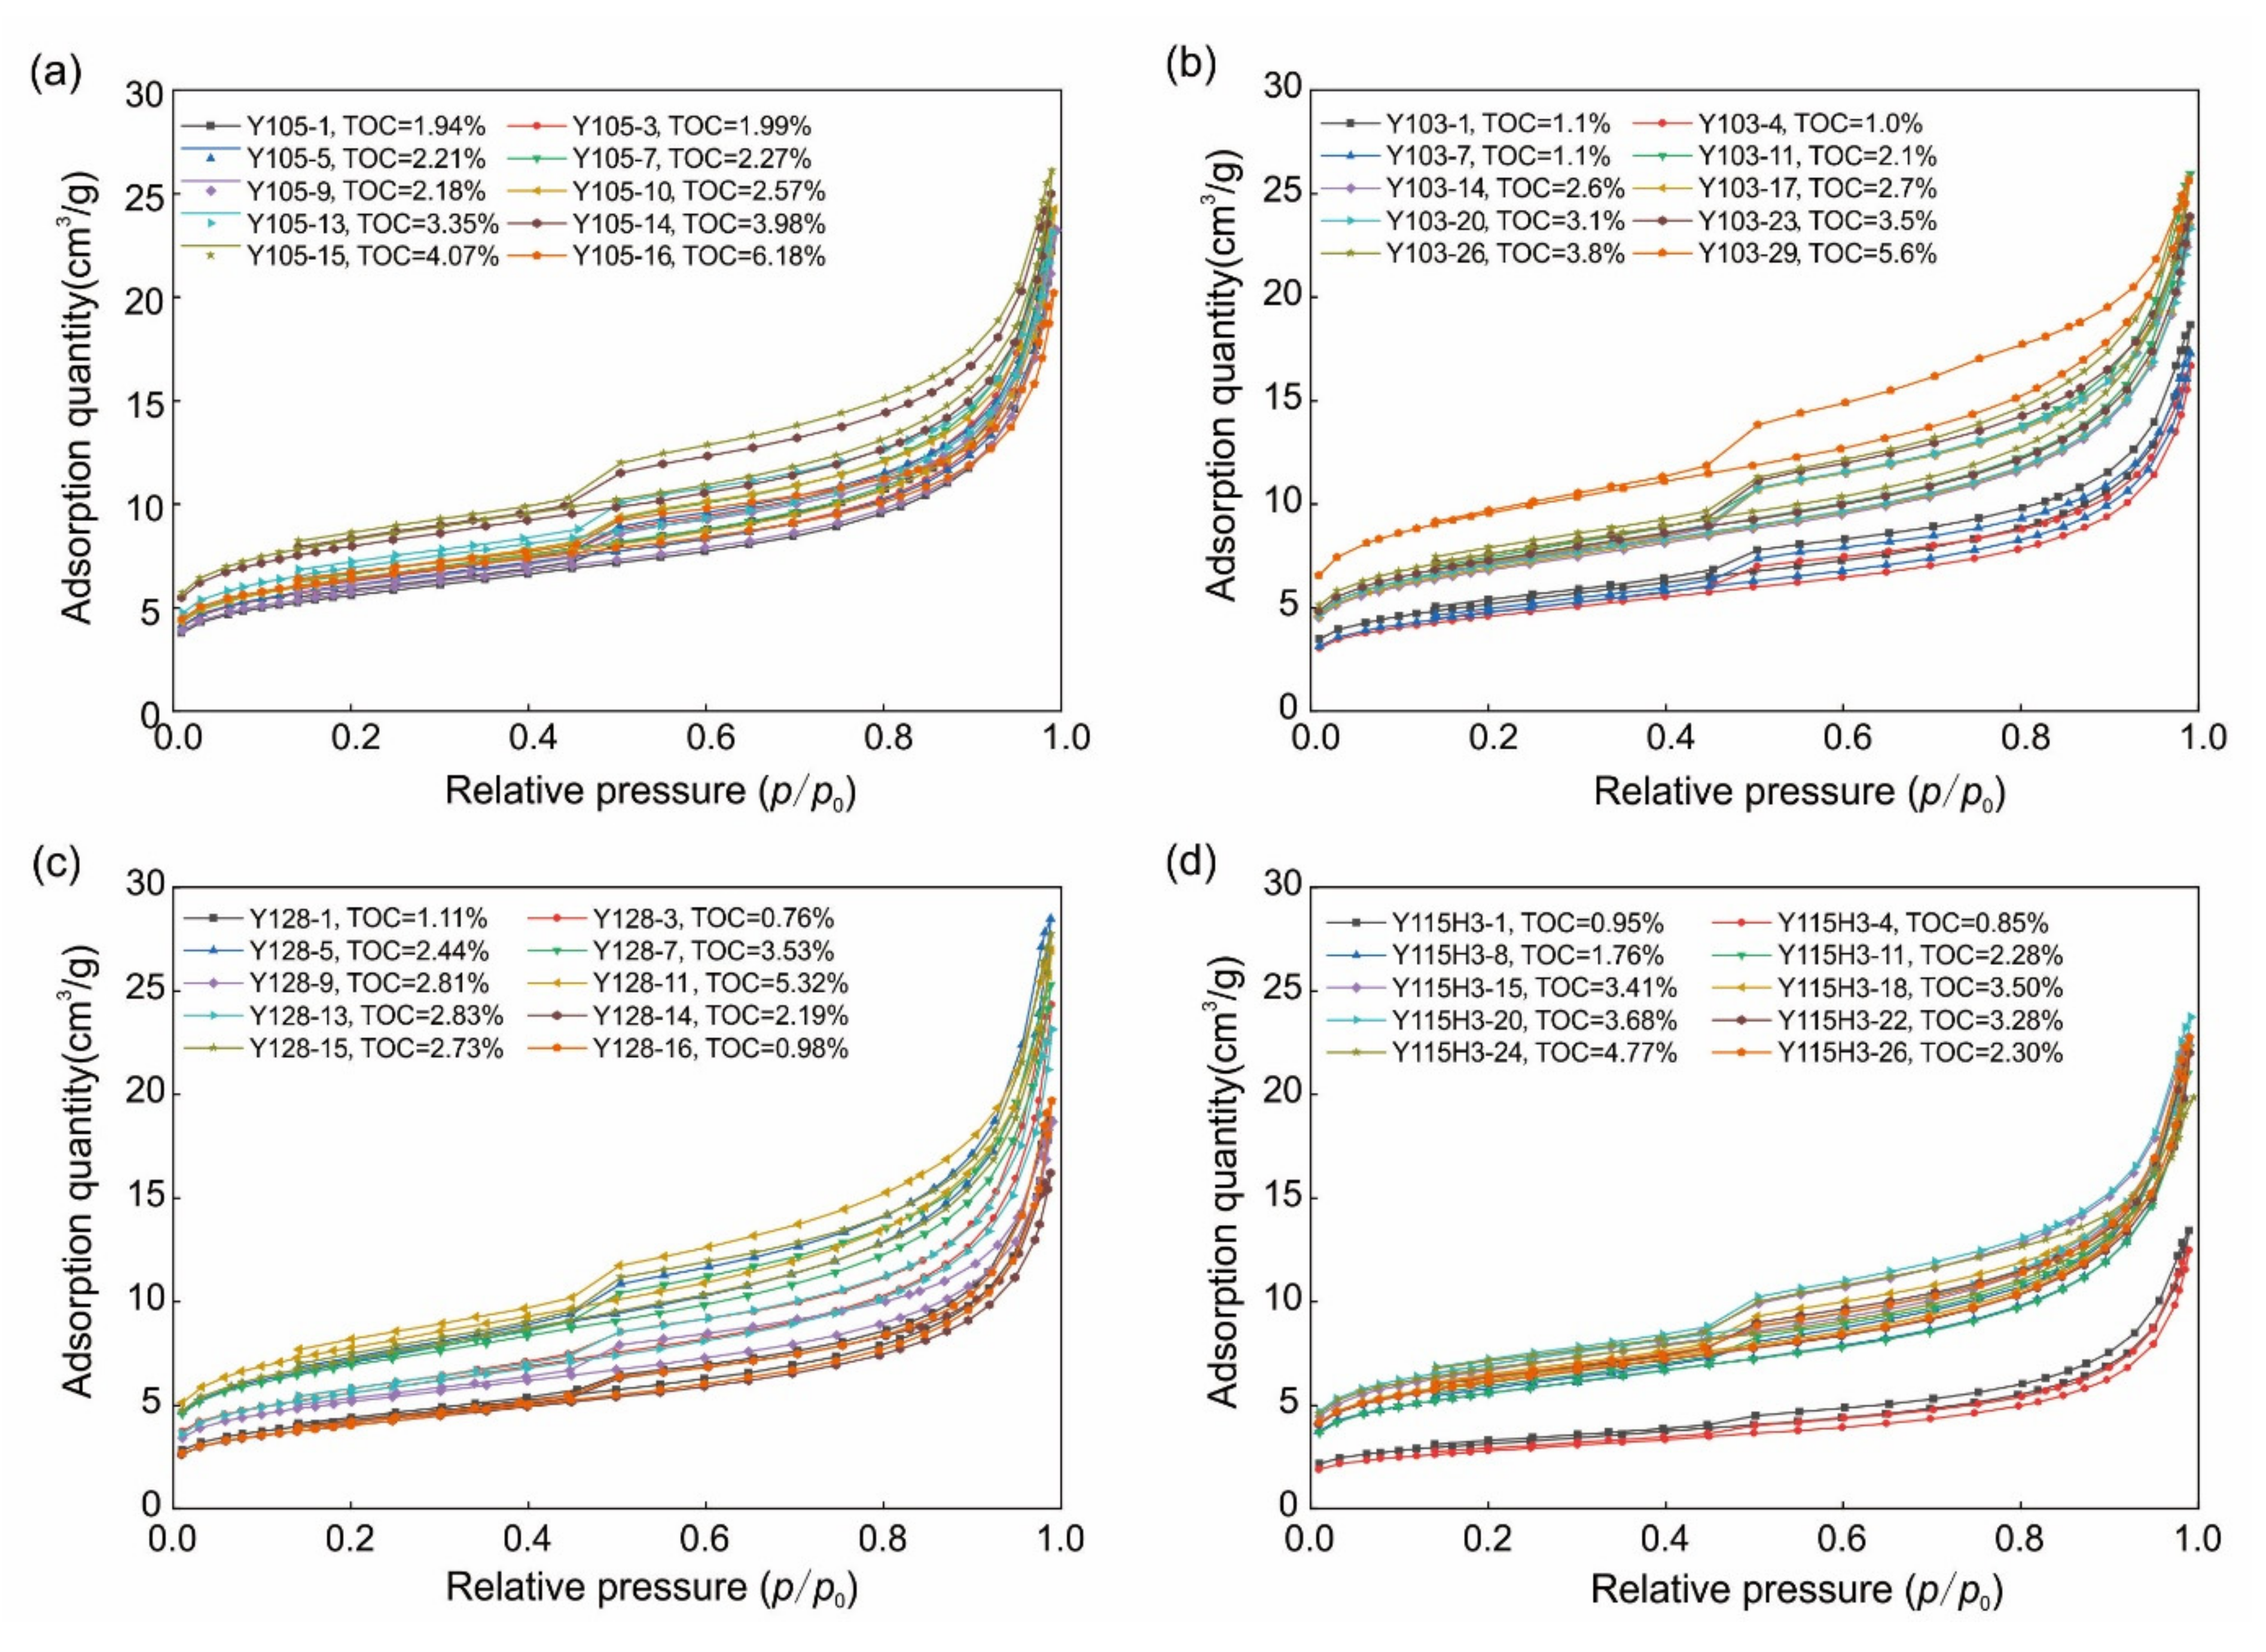
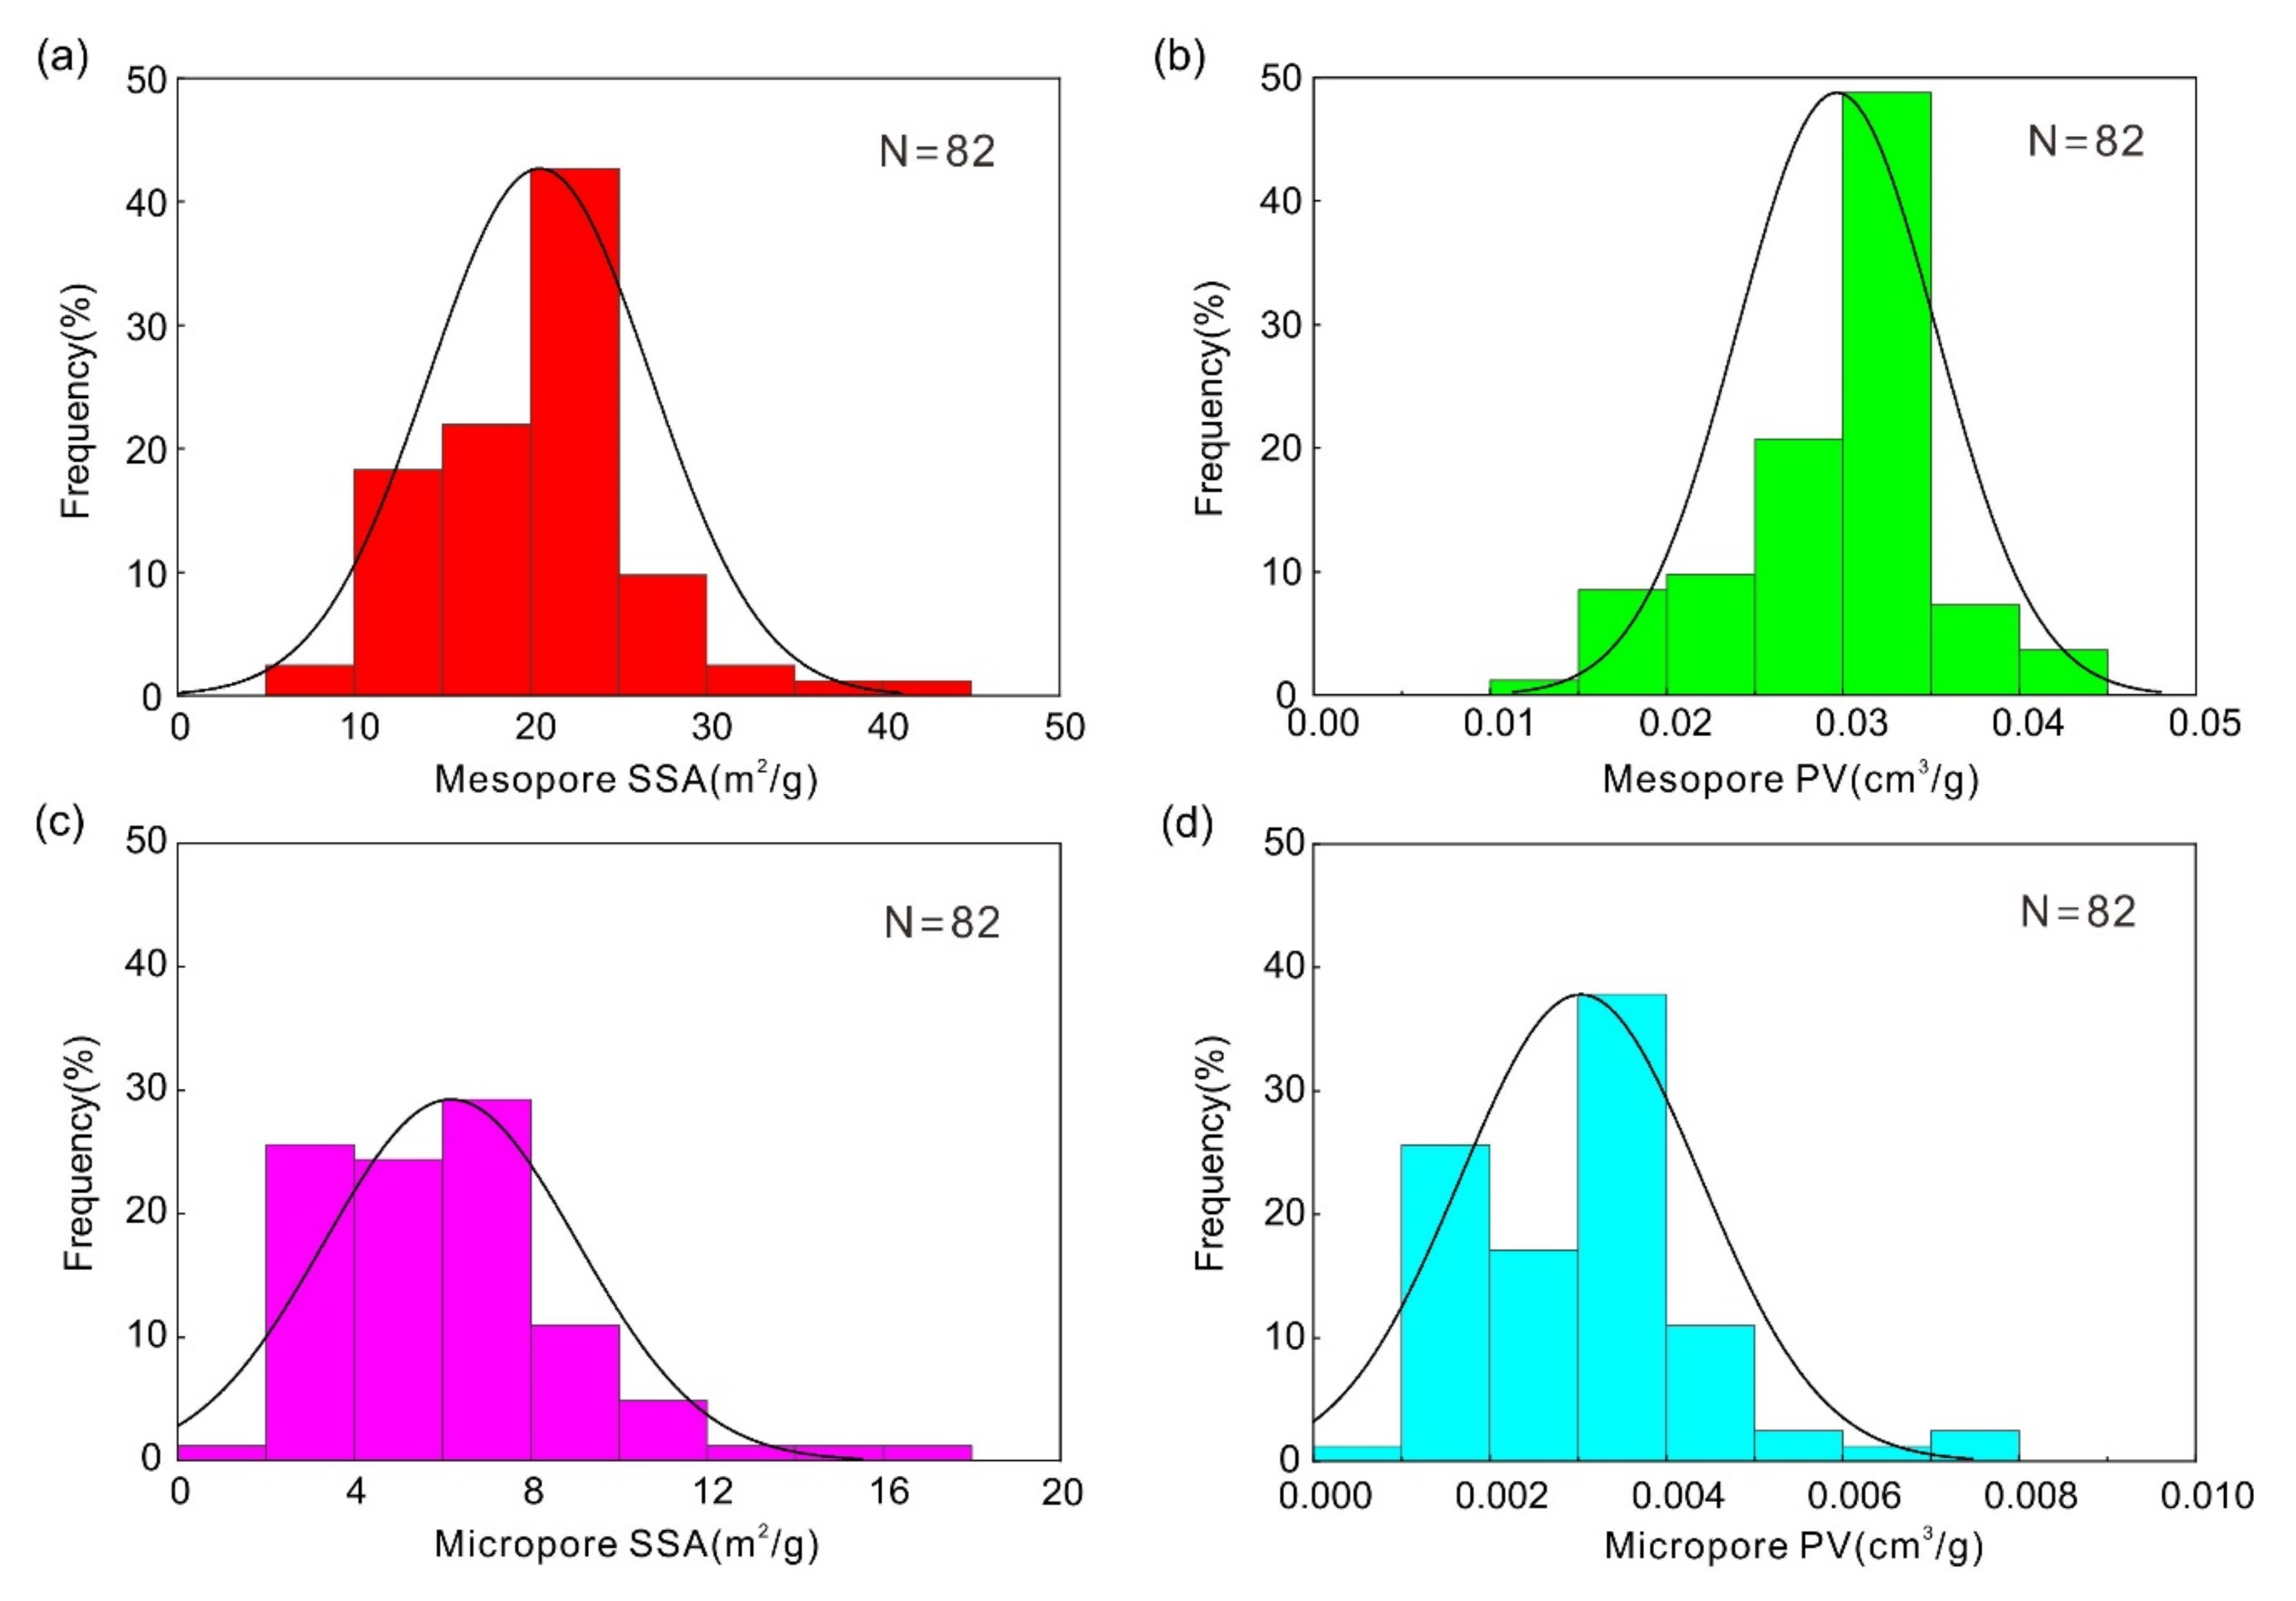
The LTNA curves of the representative shale samples are shown in Figure 4, which belong to Type II adsorption isotherms [47,48]. The hysteresis loop between the adsorption and desorption isotherms is similar to a Type H3, which reflects the open parallel-plate pores with good connectivity, and this type of pore structure is favorable for gas migration [49]. The calculated mesopore SSAs by the BET model of all the samples range from 5.40 m2/g to 40.62 m2/g, with an average value of 20.53 m2/g. The micropore SSAs calculated by the t-plot model of all the samples range from 1.06 m2/g to 16.24 m2/g, with an average value of 6.19 m2/g. According to the statistical results shown in Figure 5, the mesopore SSA is mainly distributed in 20–25 m2/g, and the micropore SSA is mainly distributed in 2–8 m2/g. The distribution of mesopore SSAs is more consistent with a normal distribution, indicating that the SSA distribution of a large number of samples is around the average value.
The BJH and t-plot equations were used to calculate the mesopore and micropore volumes, respectively. The average mesopore volume is 0.029 cm3/g (0.014–0.042 cm3/g), whereas the average micropore volume is 0.0031 cm3/g (0.00048–0.0078 cm3/g). The statistical results (Figure 5) also show that the mesopore PV is mainly distributed in 0.025–0.035 cm3/g, and the micropore PV is mainly distributed in 0.001–0.004 cm3/g. The distributions of micropore SSA and PV are not in accordance with the normal distribution, indicating the complexity and heterogeneity of the micropores. Moreover, the SSA and PV of the mesopores are much larger than those of the micropores. The mesopore SSA accounts for 77.8% of the total SSA, whereas the mesopore PV accounts for 91.1% of the total PV, indicating that mesopores are dominantly developed in the Wufeng–Longmaxi shale samples. Thus, the well development of mesopores is favorable for shale gas exploration. With the increase in pore size, the proportion of adsorbed gas decreases and the proportion of free gas increases, leading to the increased initial production of shale gas well [50,51,52].

3.3. Methane Adsorption Capacity

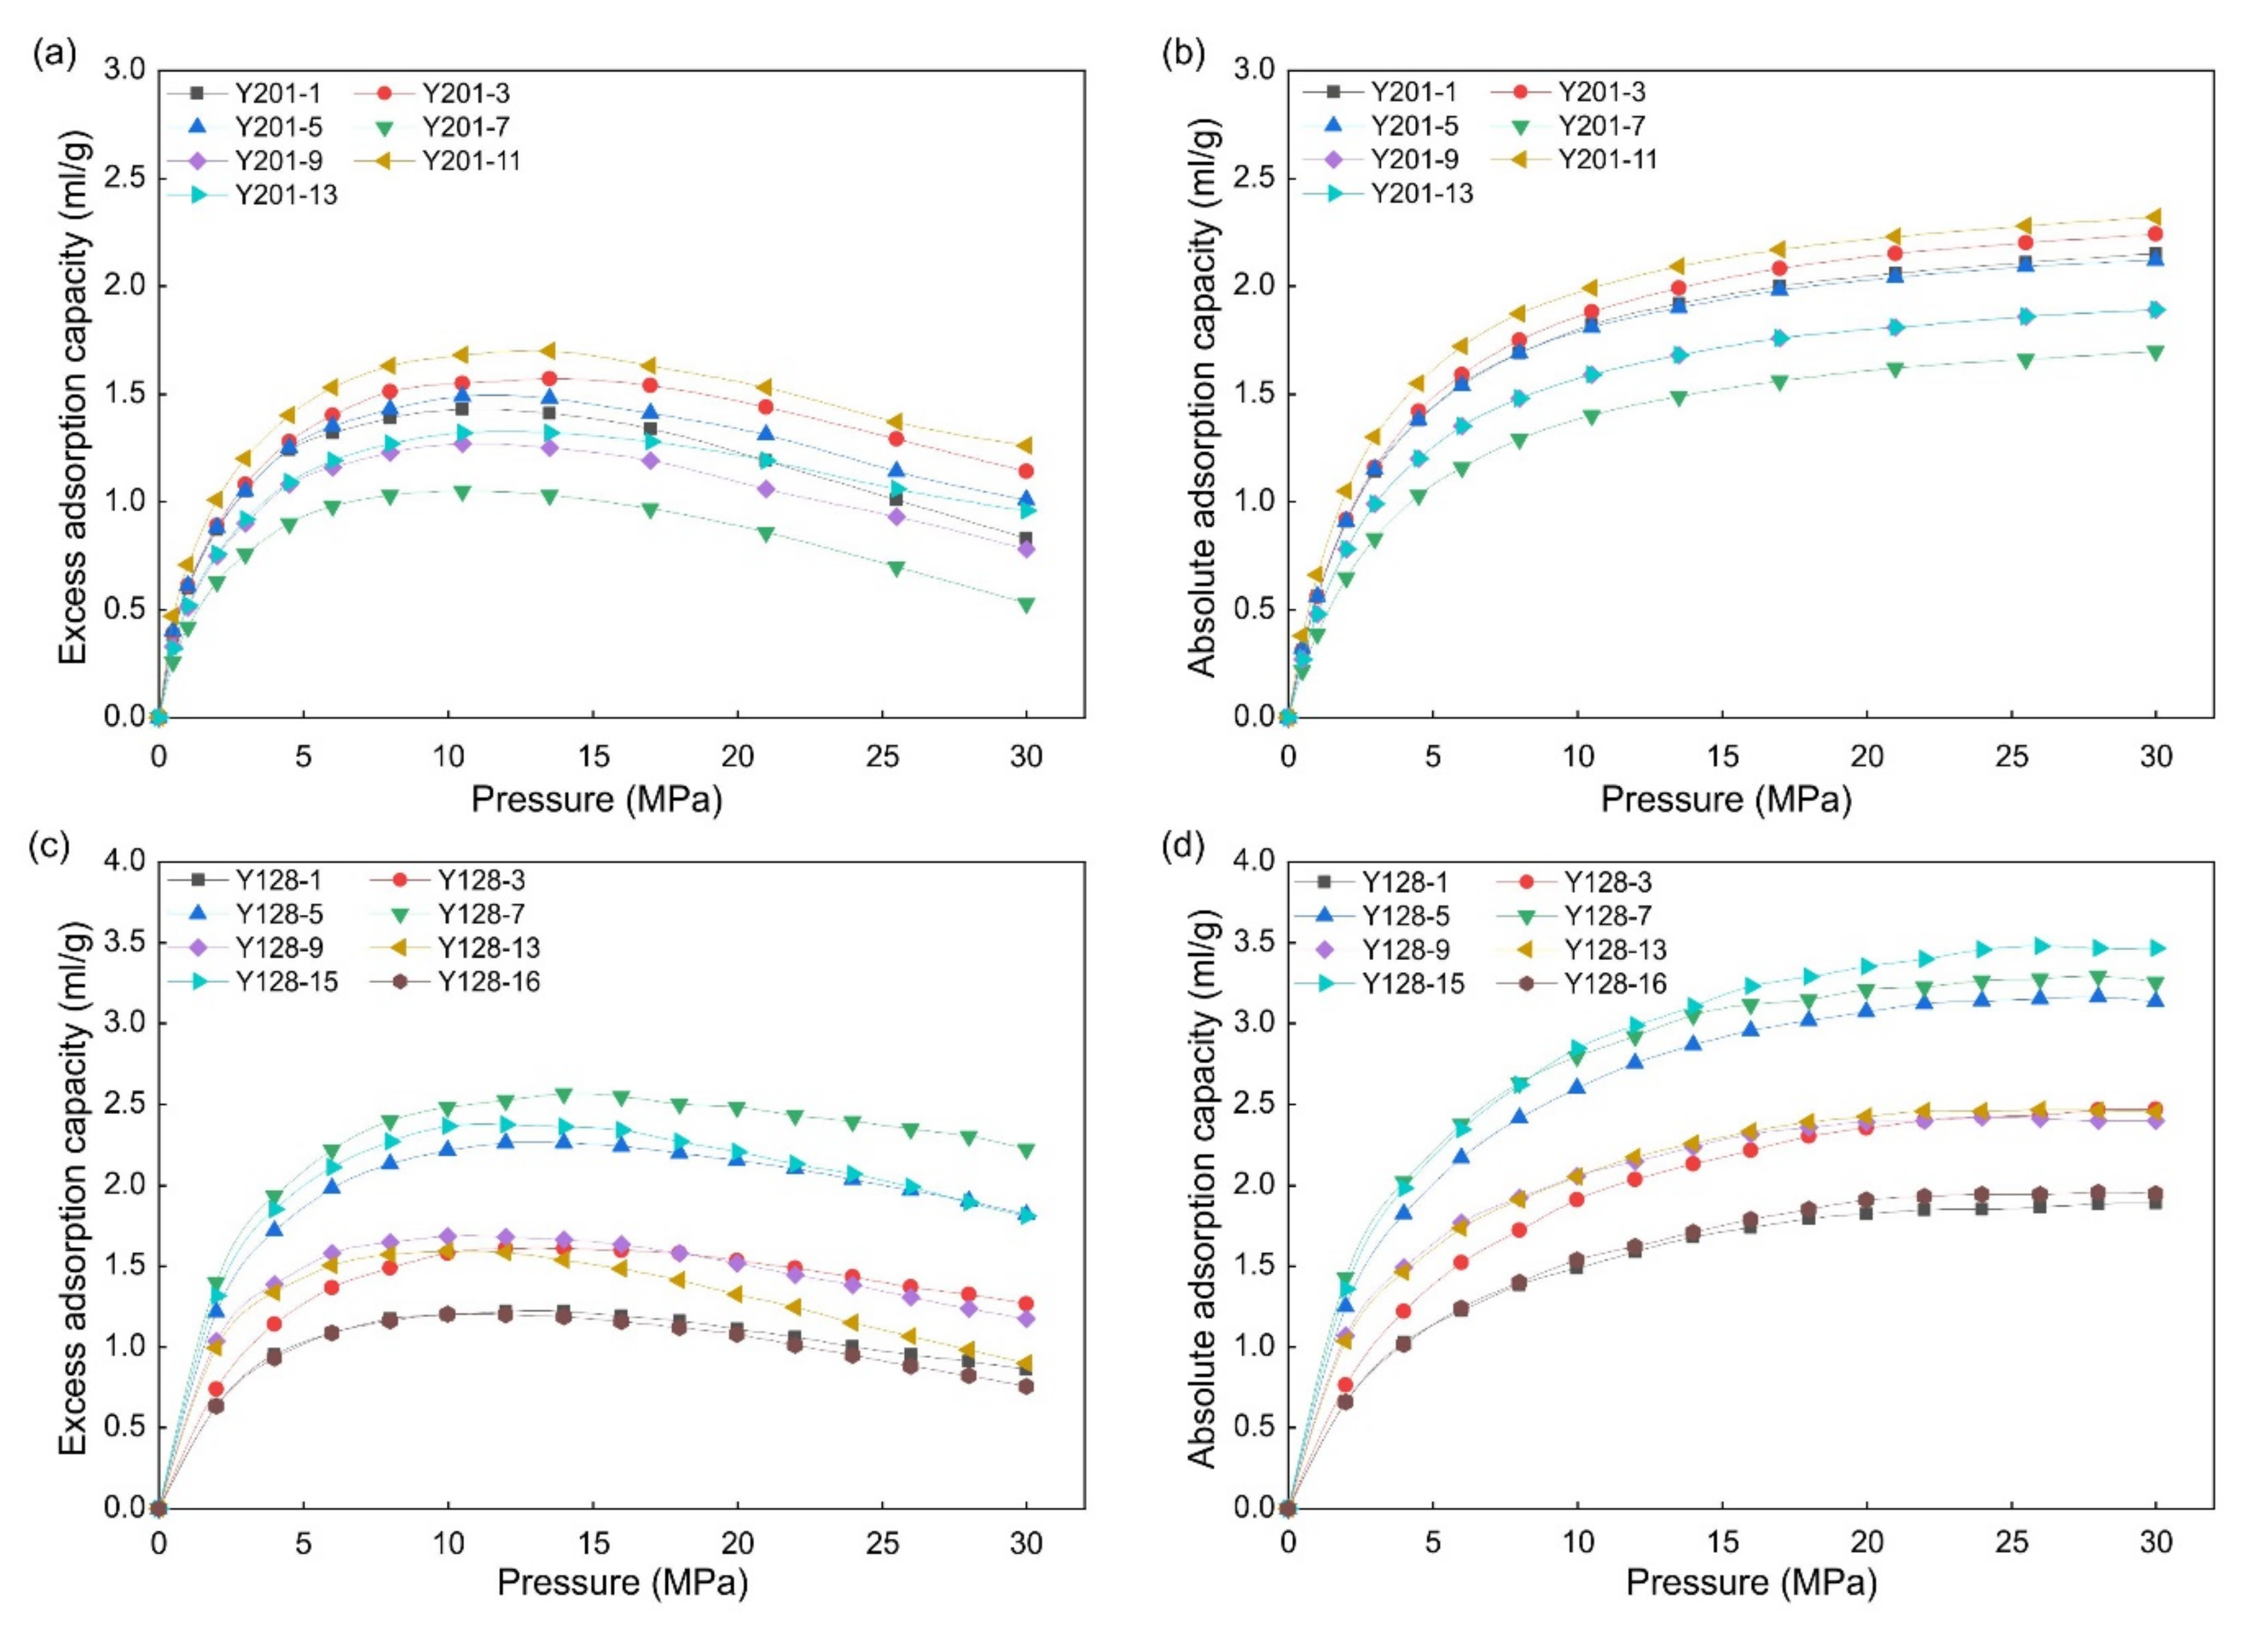
The excess adsorption isotherms measured for representative samples are shown in Figure 6a,c, in which the excess adsorption amount increases with the increase in pressure until it reaches the maximum at about 10 MPa, and then decreases with the increase in pressure. The observed isotherms of all the samples showed the same change rule, which is caused by considering the existence of the adsorbed phase [43]. The excess adsorption isotherm cannot represent the actual adsorption capacity of the adsorbents. Therefore, we should convert the observed adsorption amount into the absolute adsorption amount, using Equation (1) by determining the adsorbed-phase density (ρa). Many adsorption models can be used to determine ρa, such as the Langmuir, Dubinin–Radushkevich, and Dubinin–Astakhov models. The Langmuir method is not only simple and widely applicable, but also can well characterize the methane adsorption characteristics of the Wufeng–Longmaxi Formation marine shale dominated by mesopores [19,20,49]. Therefore, in the present study, we used the Langmuir-based excess adsorption model to fit the experimental isotherms and then transform them to absolute adsorption isotherms (Figure 6b,d). The fitted results show that the Langmuir volume (VL) ranges from 0.43 m3/t to 5.66 m3/t, with an average value of 3.07 m3/t. The Langmuir pressure (PL) is 1.67–8.19 MPa, and its average value is 3.68 MPa. The ρa ranges from 0.279 g/cm3 to 0.434 g/cm3, which is closely related to the decreasing speed of the descending section of the curves (P > 10 MPa) [20]. The faster the decreasing rate, the smaller the adsorbed-phase density. From the adsorption theories, VL reflects the limit value of the amount of methane adsorbed in shales, which is used to represent the adsorption capacity of shales for the following correlation analysis.

4. Discussion

4.1. Effect of TOC on Adsorption Capacity

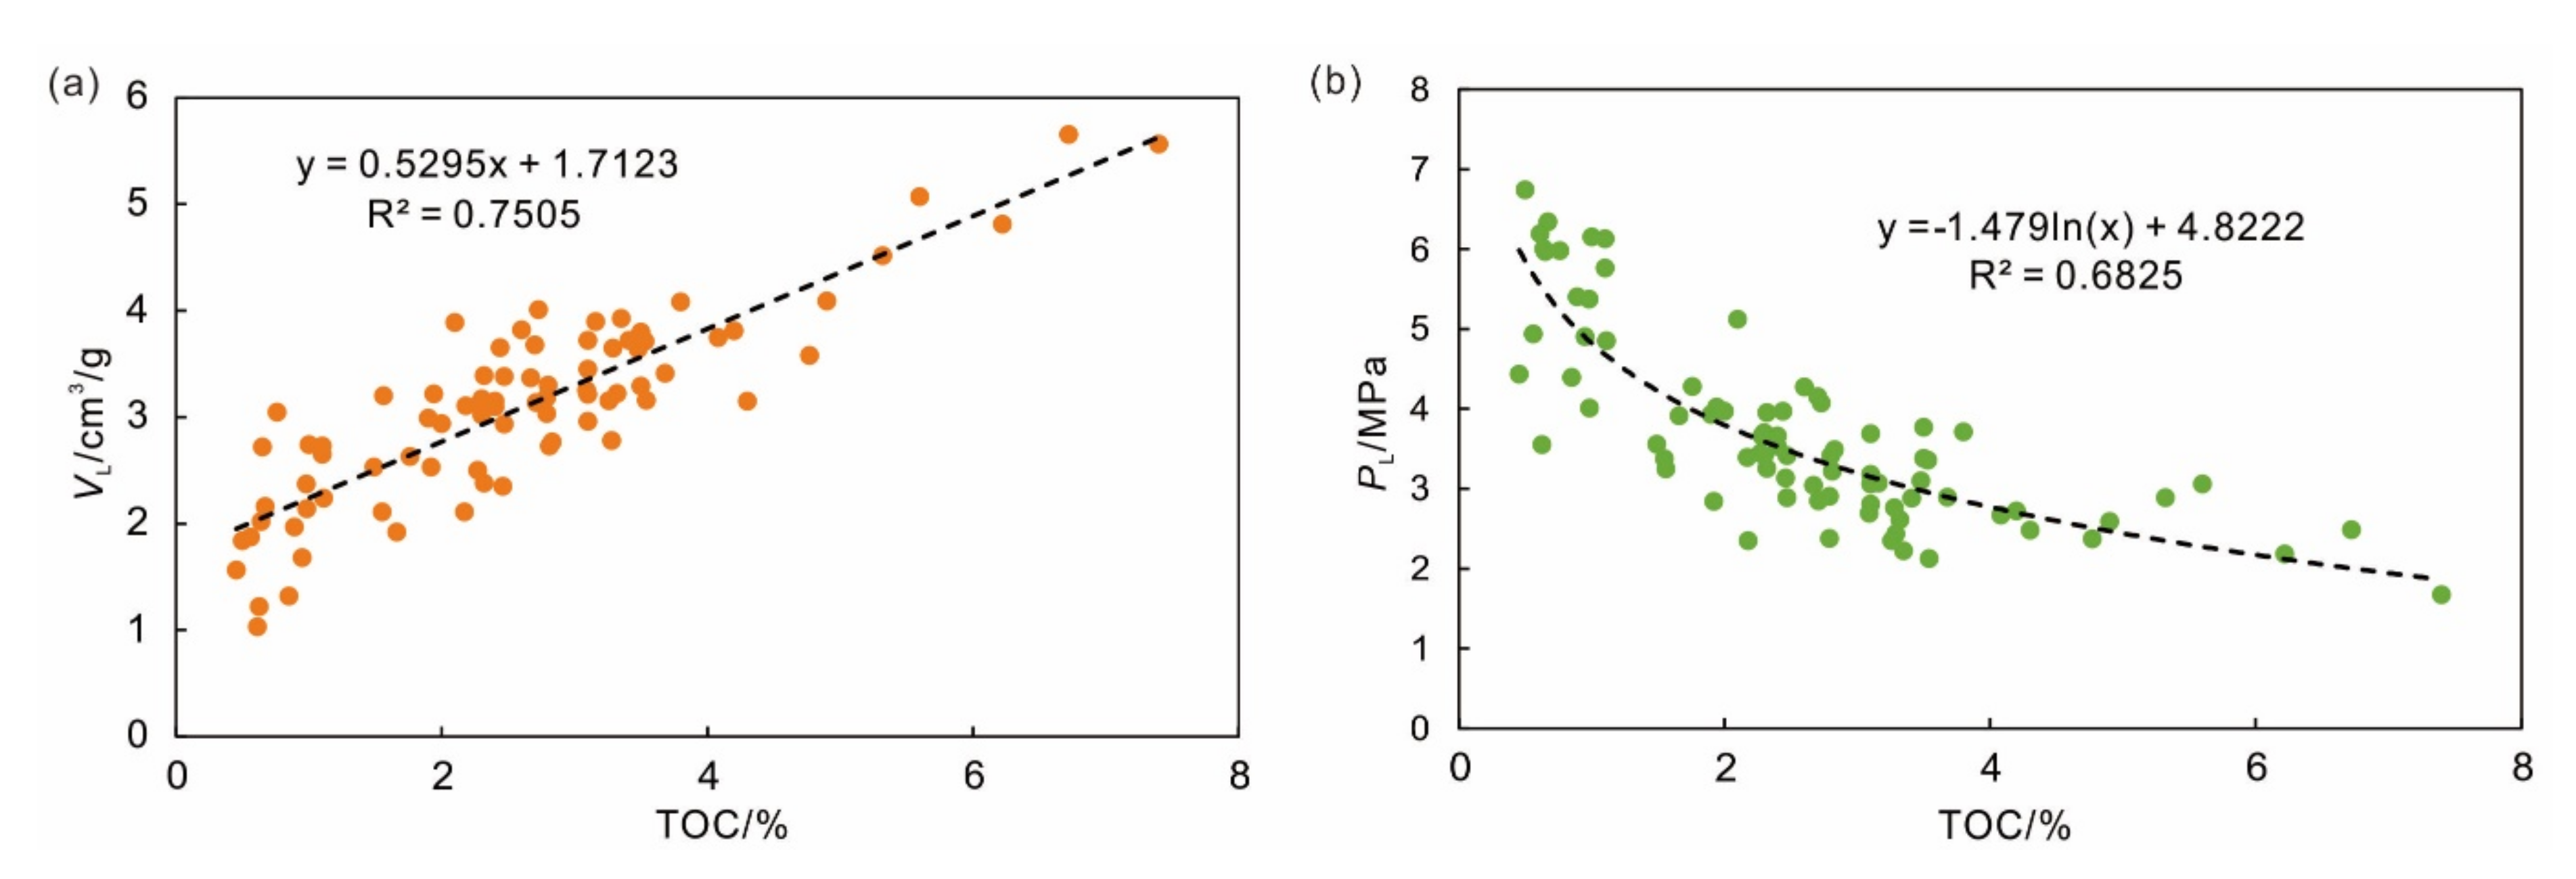
The relationship between TOC values and VL is presented in Figure 7a, showing an evident positive correlation between the two key parameters, which is consistent with previous studies based on limited data [24,27,53]. The findings indicated that a positive correlation still exists, even when the data become larger. Shale is a source rock, and OM is an important part of it. The TOC is the most critical parameter for the shale gas reservoir evaluation. The abundance, type, and thermal maturity of OM are key factors affecting shale gas generation and enrichment [27]. The TOC not only affects the absorbed gas content of shales, but also affects the free gas content because a large number of pores are developed in OM in marine shales, which are well preserved during the process of gas generation, becoming the main storage space of shale gas [40].
In addition, a negative correlation exists between the TOC values and Langmuir pressure (PL), as shown in Figure 7b. This finding indicates that the larger the TOC, the lower the PL, the faster the gas adsorption rate, and the easier it is to reach saturation. By contrast, in the process of depressurization and desorption, the higher the PL, the easier it is to desorb the gas. Therefore, the parameter PL can be used to determine the critical desorption pressure and evaluate the production mechanism of shale gas wells. Moreover, the relationship between the TOC and adsorption parameters based on the large data shown in Figure 7 can be used for logging the curve calibration and reservoir evaluation.

4.2. Effect of Pore Characteristics on Adsorption Capacity

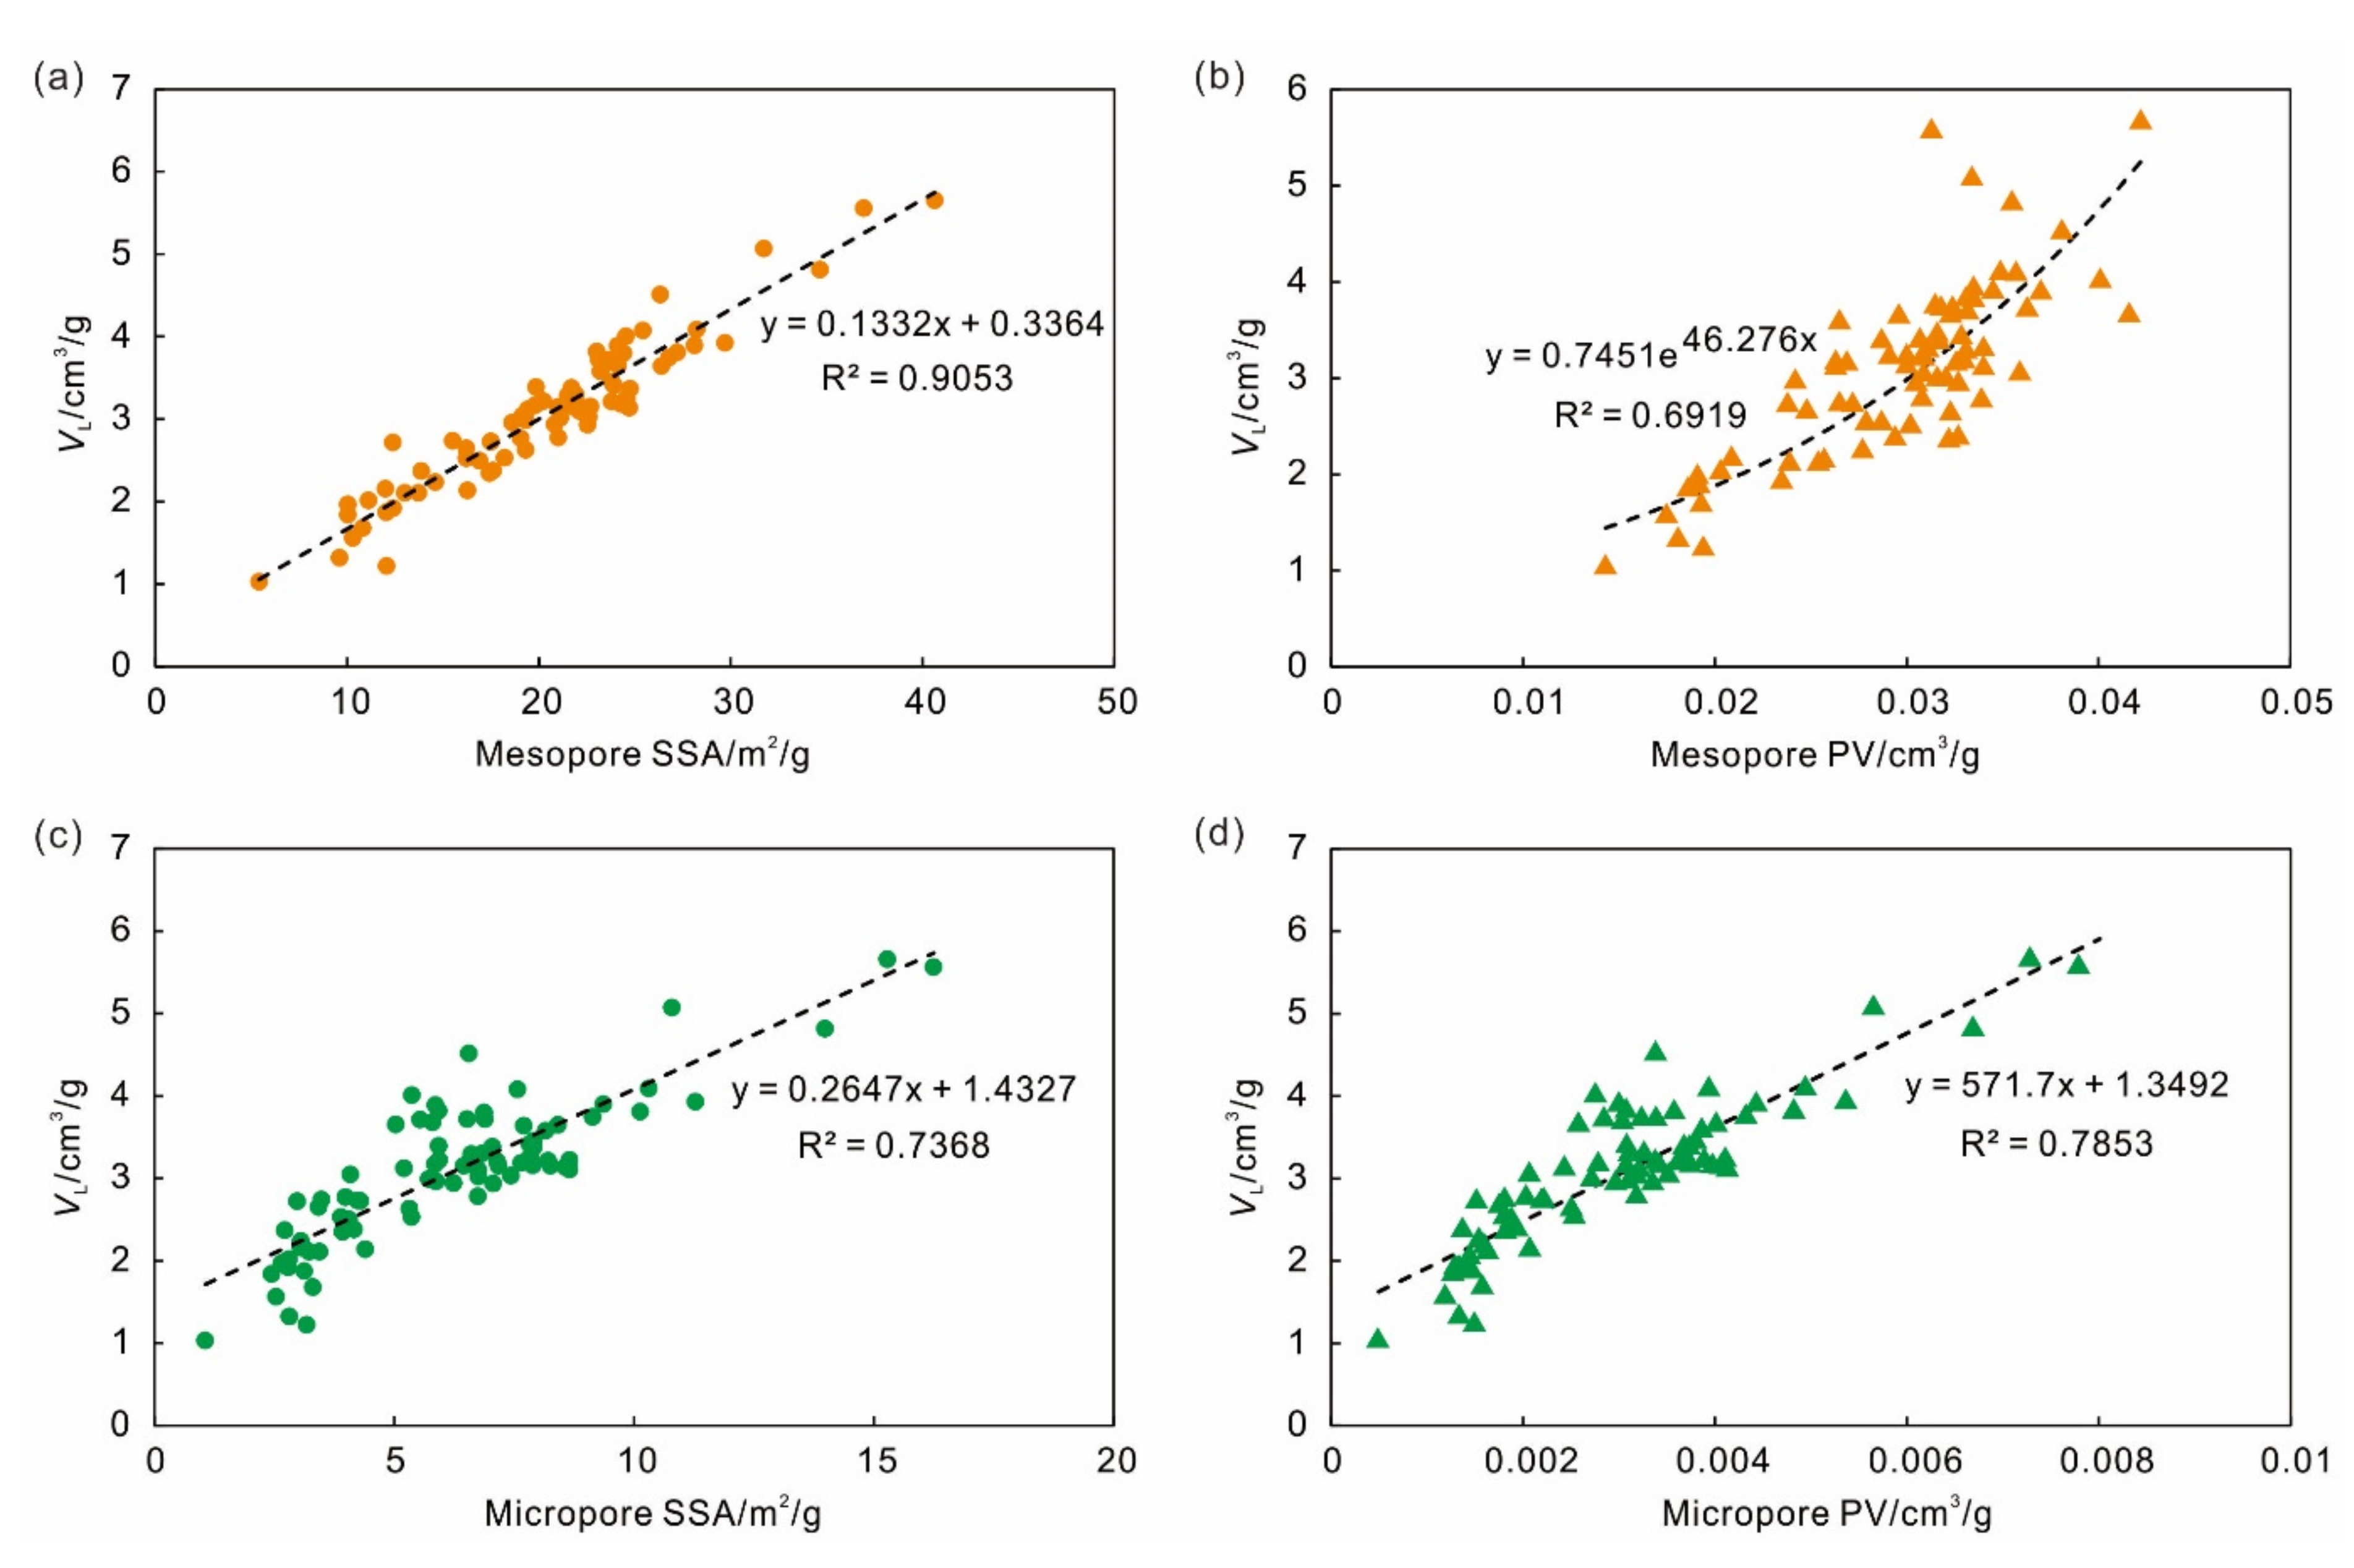
Figure 8 shows the relationship between the pore structure parameters and adsorption capacity, indicating a positive correlation in both of the mesopores and micropores. The mesopore SSA obtained by the BET equation has the best correlation with the adsorption capacity obtained by the Langmuir equation. The micropore SSA also controls the adsorption capacity, as shown in Figure 8c. Compared with the mesopores, the micropore wall has a stronger adsorption affinity for gas molecules, due to its molecule-scale size [43]. However, the micropores are less developed in marine Longmaxi shales, leading to the mesopores (2–200 nm) providing most of the adsorption sites methane adsorption and becoming the main storage space for the adsorbed gas. Moreover, the correlation of SSA and adsorption capacity is slightly better than the PV and adsorption capacity because the adsorption capacity of a porous media is mainly controlled by its SSA [42,54,55]. When the SSA of any adsorbate is high, its adsorption capacity is much stronger. The differences in the SSAs of coals and shales also proved this point. Zhou [49] compared the nanopore structure of coal and shales and found that the total SSA is linearly correlated with the adsorption capacity. Suárez-Ruiz [56] studied the influence of pore size on methane adsorption capacity and indicated that methane is mainly adsorbed in the narrow microporosity of the solid bitumen. Li [57] proposed a multi-site adsorption model and stressed that the percentage of adsorbed gas in 1 nm pores may be as high as 90%. In general, the pores in shales are places where gas molecules are adsorbed, and the pore development characteristics and distributions are the key factors affecting the occurrence mode of natural gas.

4.3. Effect of Mineral Composition on Adsorption Capacity

The organic-rich marine shales are mainly composed of brittle and clay minerals. The relationship between the mineral content and adsorption capacity is shown in Figure 9, where all the mineral contents are found to have no correlation with the adsorption capacity. This finding implies that the mineral composition of marine shales is not the controlling factor of gas adsorption. Clay minerals are commonly considered the main adsorbates in shales because of the big SSAs of pure clays [25,26,29]. However, the analysis results in this study prove that the clay minerals in overmatured Longmaxi shales almost have no effect on the adsorbed gas quantity. This phenomenon may come from the following three reasons.
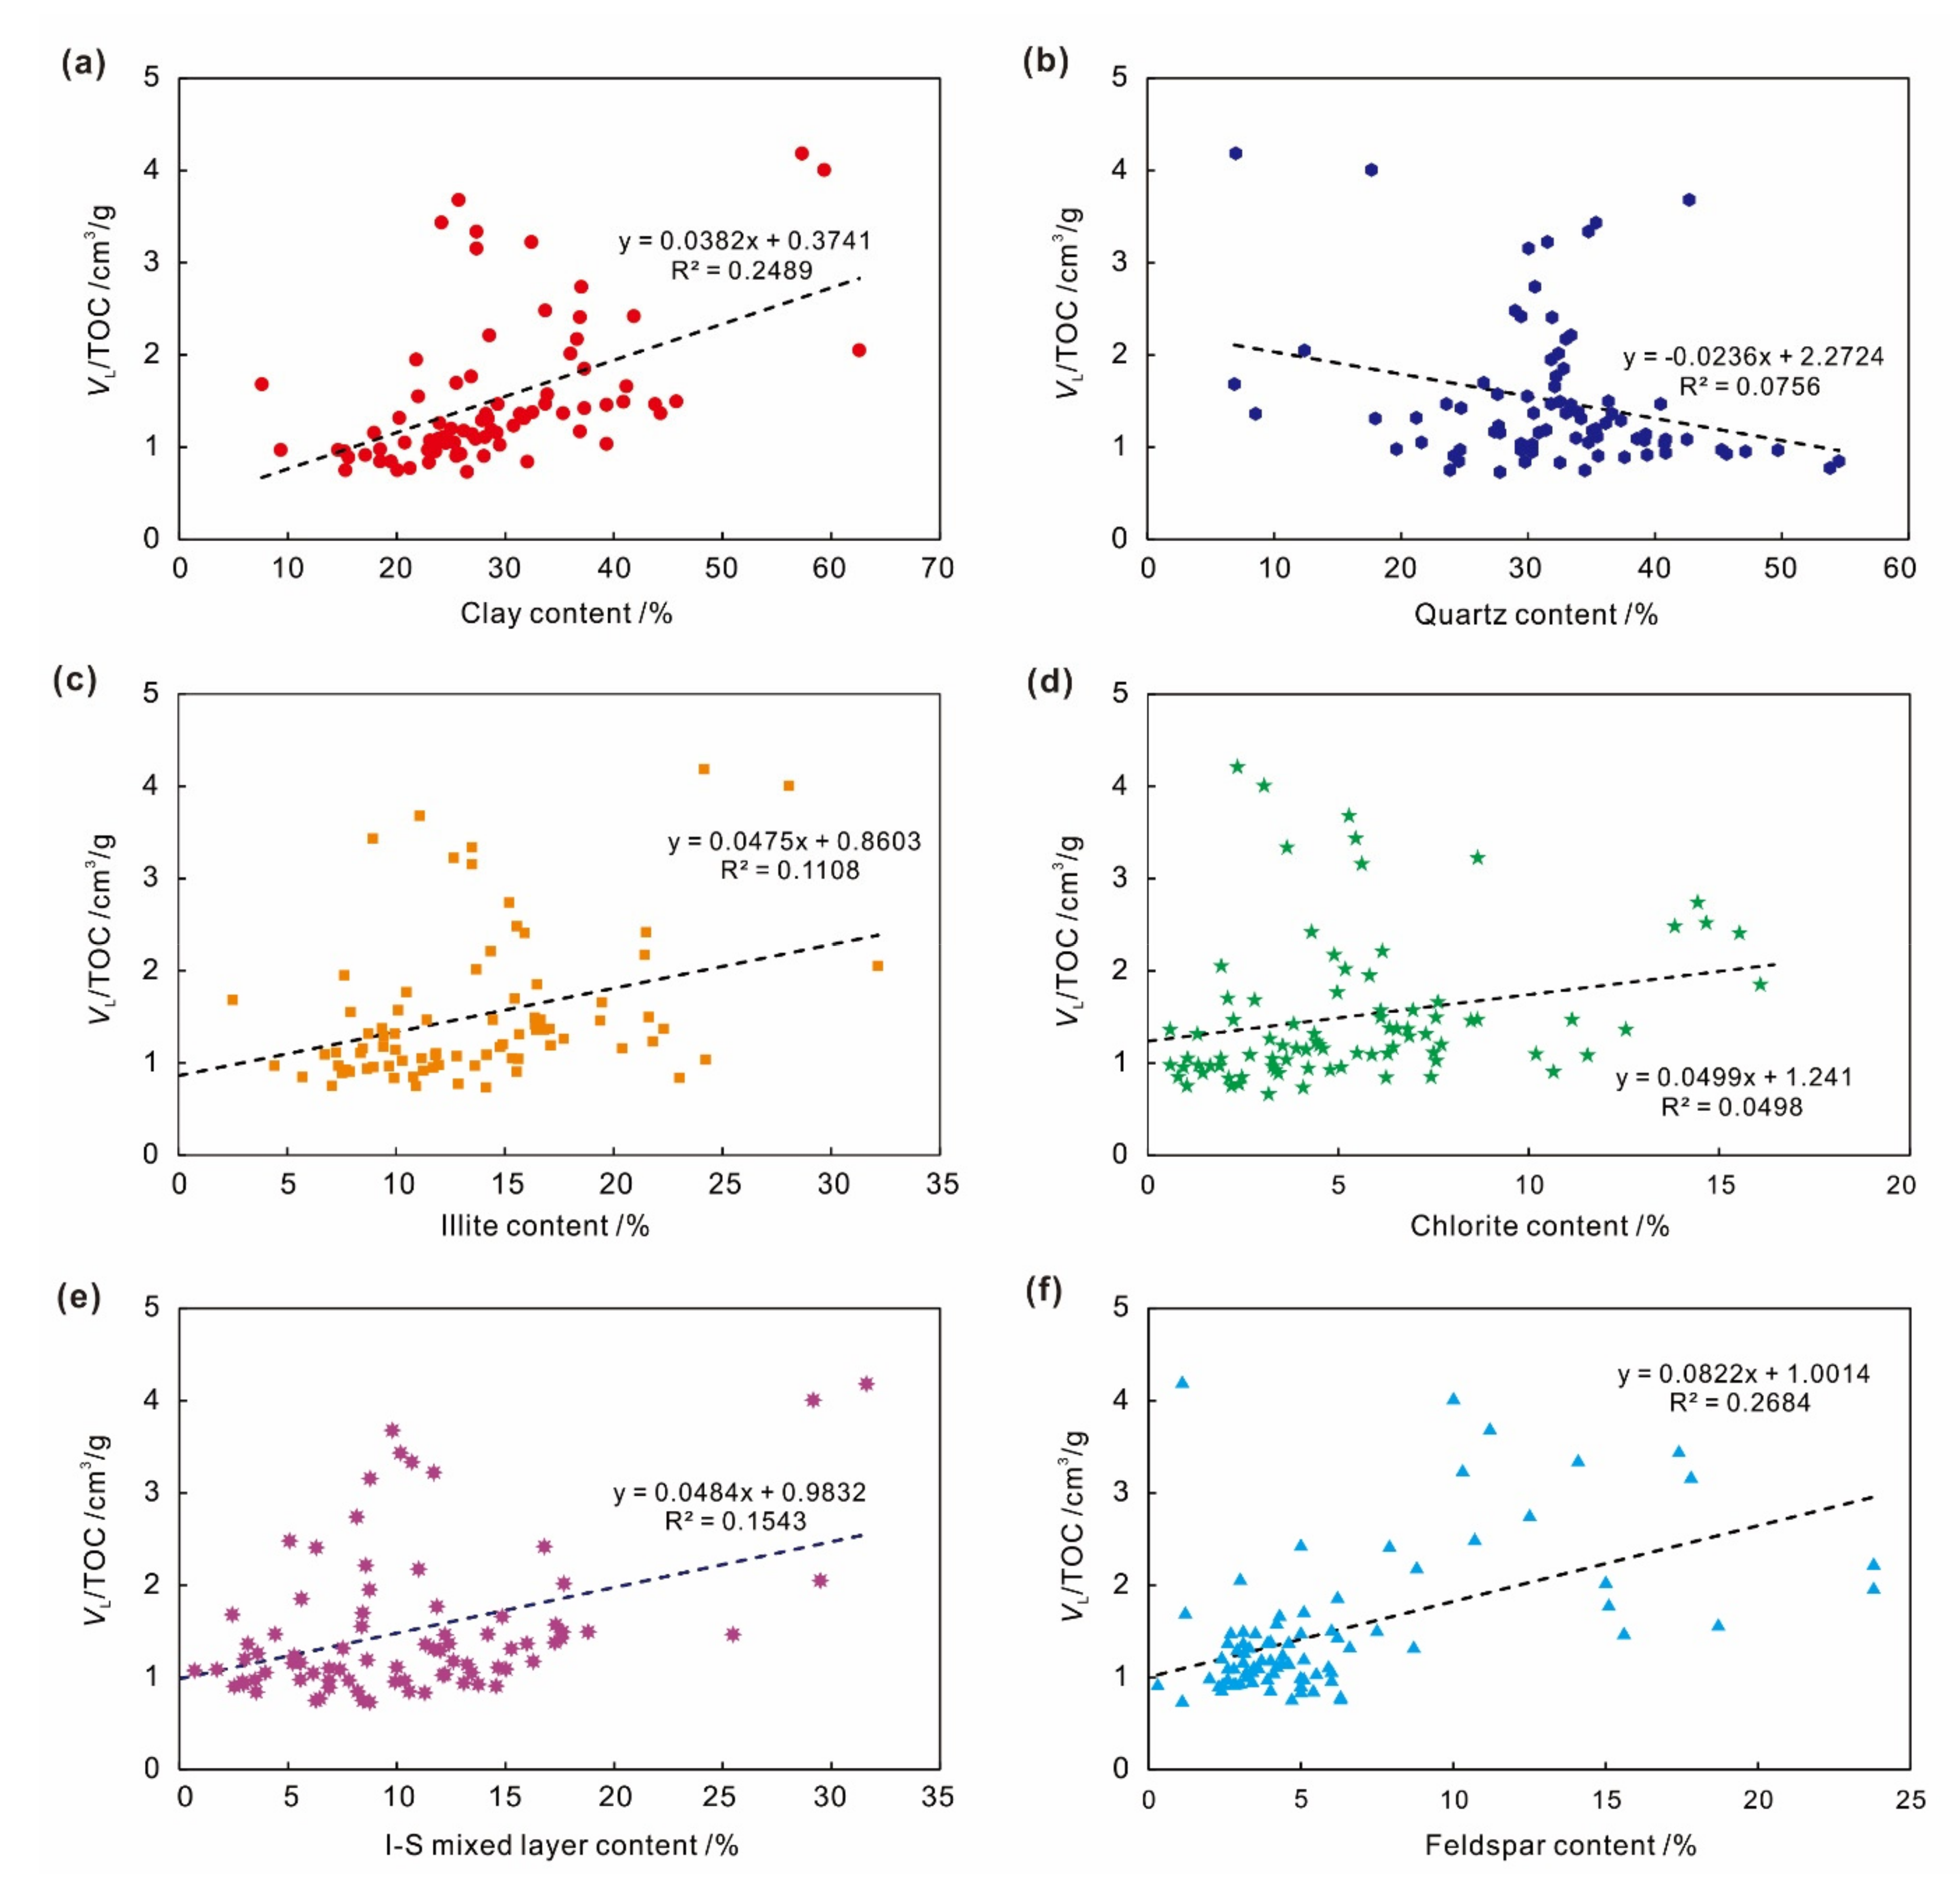
The mineral composition of marine shales may be one reason. Previous studies on the pure clays have presented the sequence of methane adsorption capacity with clay mineral types, i.e., montmorillonite > I–S mixed layer > kaolinite > chlorite > illite [35,58]. Montmorillonite has the best adsorption capacity due to its largest SSA. For the studied lower Silurian shales in China, their kerogen type is type I and their thermal maturity is high (2.5–3.5%), reaching the late diagenetic and dry gas stage. Thus, the montmorillonite and kaolinite were completely transformed, making illite and chlorite the main types of clay minerals in marine shales. However, illite and chlorite have lower adsorption capacity, which may be one reason for the phenomenon. Although it contains a certain amount of the I–S mixed layer, its adsorption may be masked by the ultra-low adsorption capacity of illite and chlorite. Furthermore, according to the correlation between the adsorption capacity per unit TOC and clay mineral content, the correlation shown in Figure 10 is enhanced compared with that in Figure 9, but the correlation is still poor. Therefore, in general, TOC is the most important material control factor, and high TOC masks the actual adsorption capacity of clay.
Moreover, the hydrophilicity of clay minerals may cause this phenomenon. The wettability analysis of clay minerals and OM indicated that the clays are always hydrophilic, and OM is hydrophobic [34]. Moreover, the nonpolar functional groups in OM, such as methyl and methylene, are similar to the molecular structure of methane, whereas the molecular structure of the Si–O and Al–O bonds in clays greatly differs from that of methane molecules. Therefore, methane molecules are easier to adsorb on the pores of OM due to their favorable wettability and molecule polarity [59].
In addition, the water absorption of clay minerals may be one of the reasons. Although the adsorption experiments in this study were conducted under a drying condition, part of the water bound in the clay minerals still exists [60,61]. Moisture can directly reduce the adsorption capacity of clay pores because water molecules can reduce the number of potential adsorption sites by blocking micropores or directly occupying polar adsorption sites [62]. However, due to its hydrophobic surface characteristics, OM has no substantial contribution to the water absorption of shale. Therefore, the clays in marine shales have no controlling effect on methane adsorption, due to their composition, wettability, and water absorption ability.

4.4. Competitive Adsorption between OM and Clay Minerals

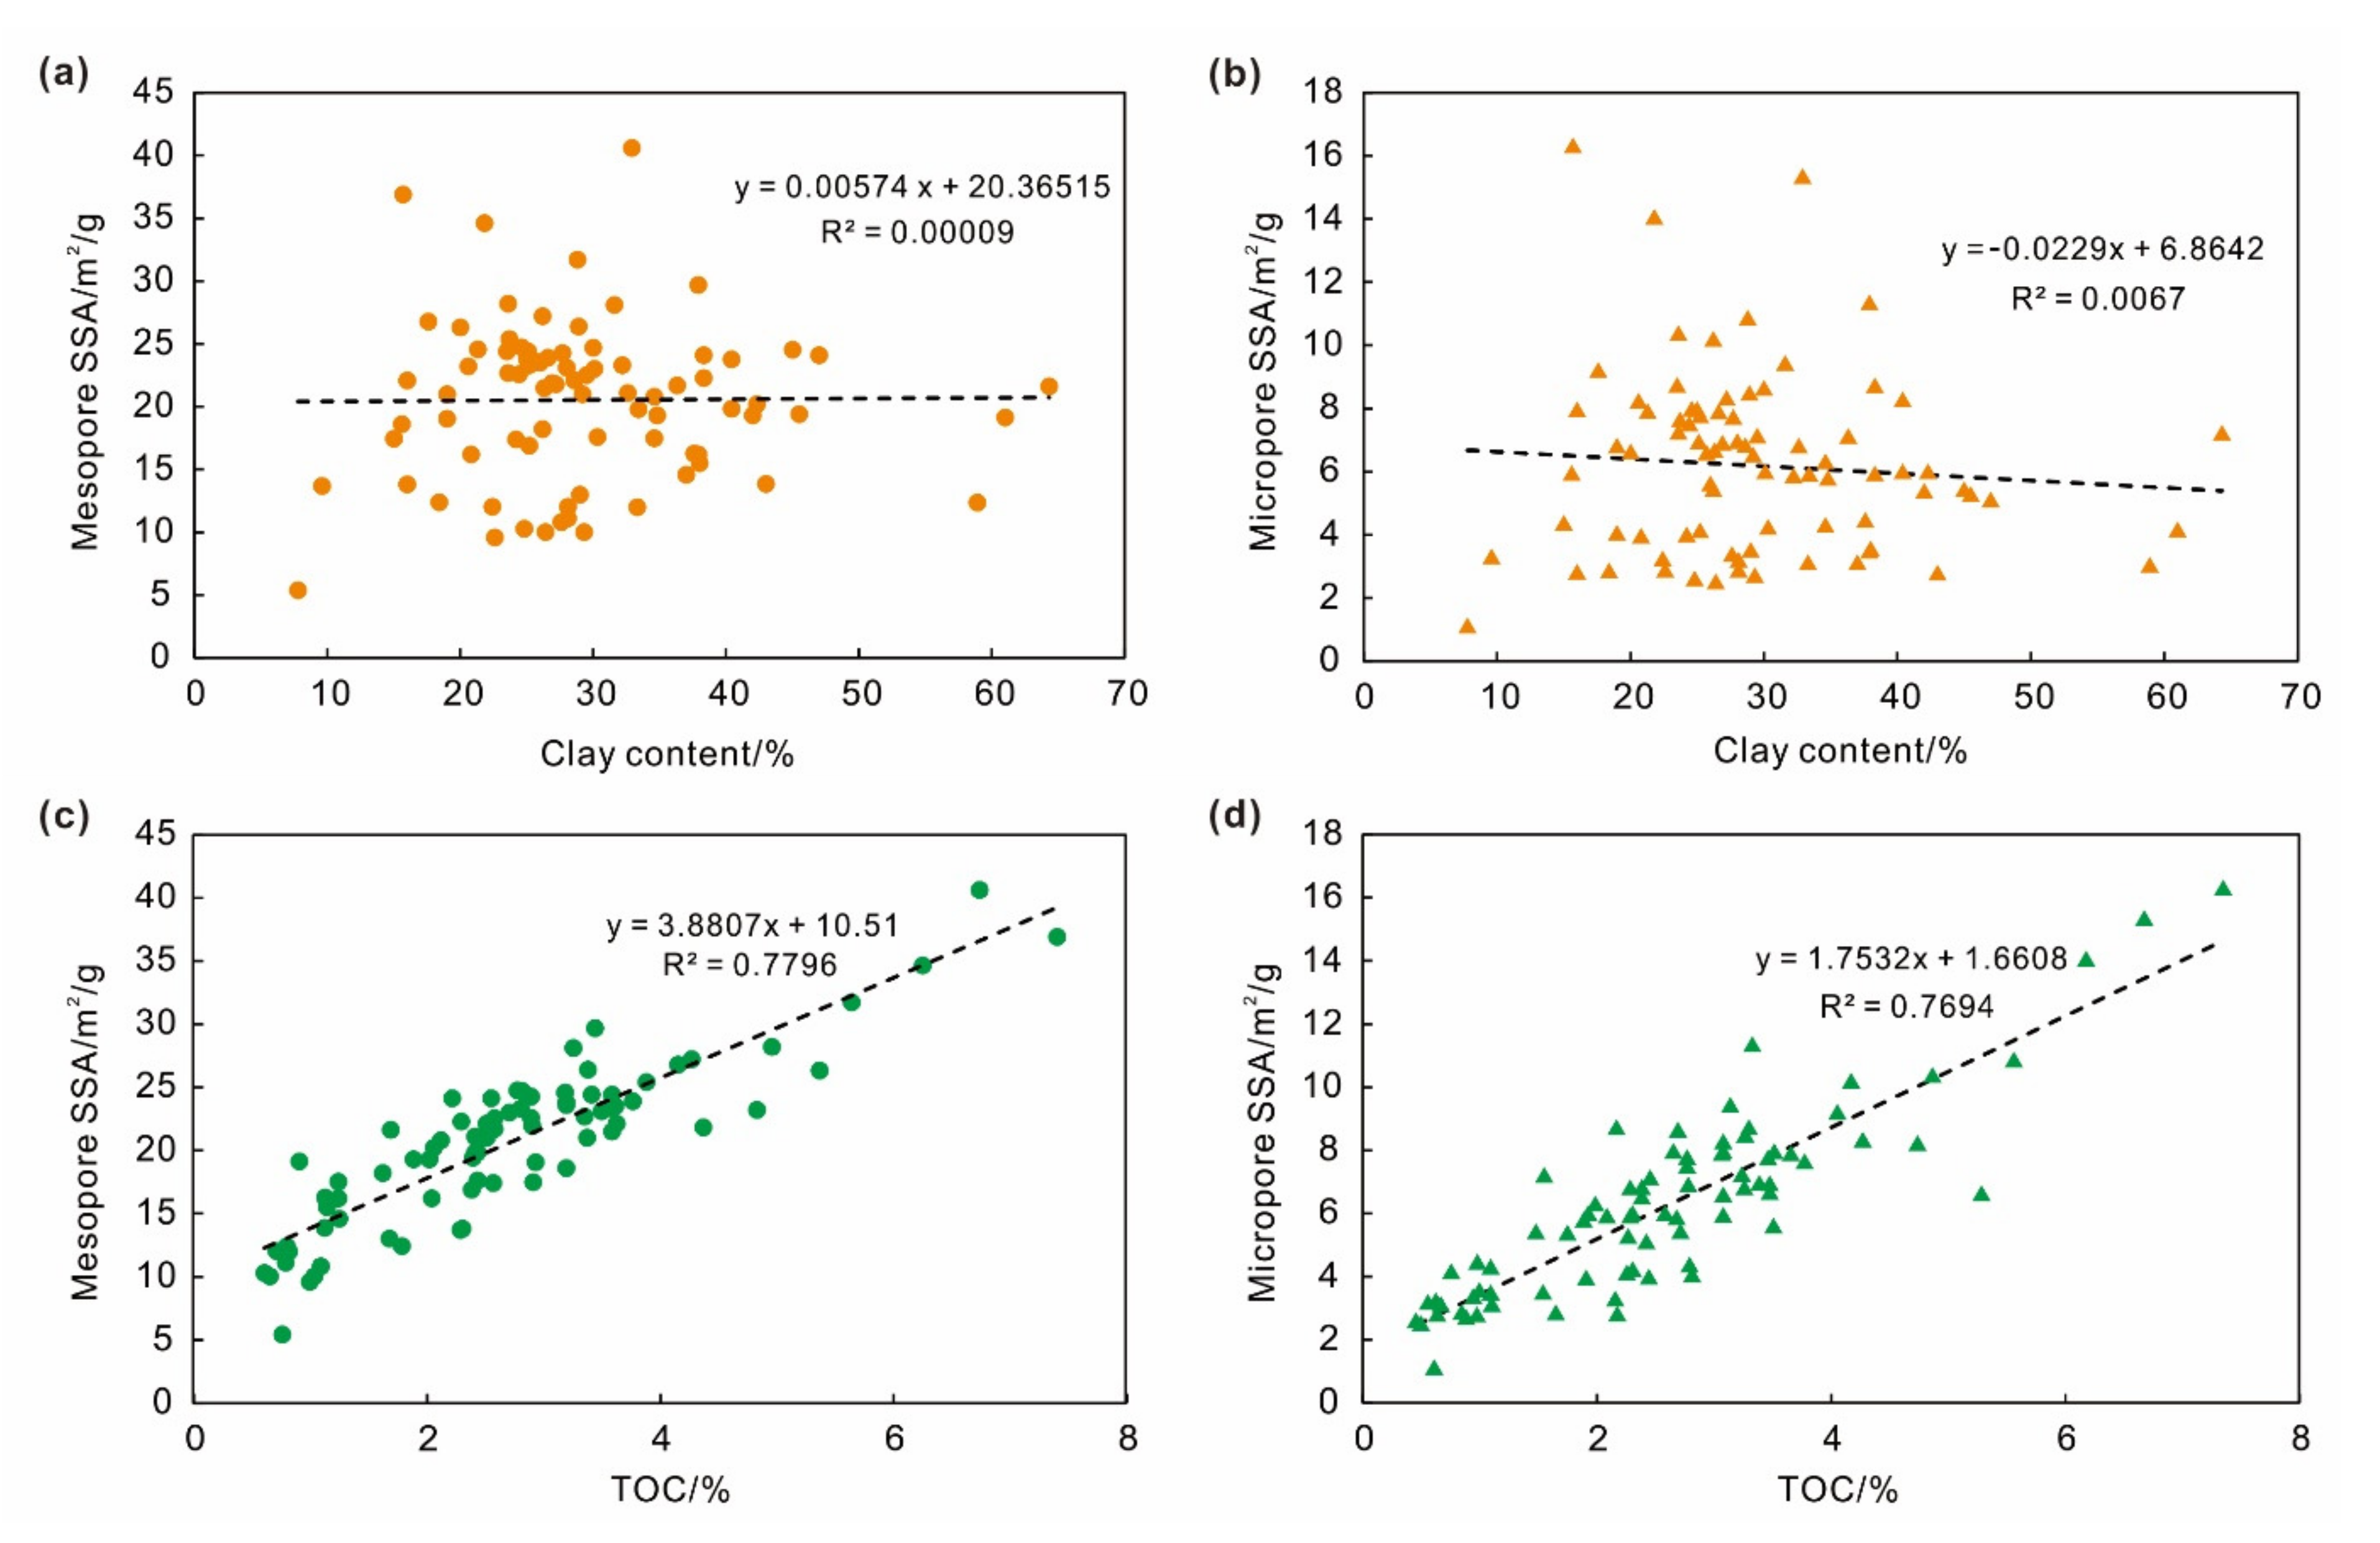
From the petrophysical model of shale, it is composed of quartz, clay, feldspar, pyrite, carbonate, OM, and pore fractures. Among these components, OM and clay minerals are natural adsorbents. In the process of shale gas accumulation, due to the existence of pores in shales, the gas can be stored. When the gas enters the pores, part of the gas is adsorbed, due to the attraction of the pore wall to the gas molecules. In this process, the competitive adsorption of OM and clay minerals will occur. In the above analysis, it is found that the clay minerals in marine shale hardly adsorb methane, which can be proven from another aspect, as shown in Figure 11. The data analysis shows that the pore SSA has a good positive correlation with the TOC and has little effect on clay minerals, regardless of mesopores or micropores. This finding indicates that most of the pores in shales are provided by OM, and clay minerals have much fewer pores. It is precisely because the pores are not developed and there is no support for methane adsorption that it is difficult for clay minerals to cause adsorption. Therefore, in the competitive adsorption process of OM and clay minerals, OM has an absolute advantage. Clay minerals become a carrier for water absorption, due to their interlayer polarity and water wettability, and they have no effect on methane adsorption.
Particularly, the aforementioned conclusions can only be applied to the overmatured marine shales in South China. Shales in other layers have different rock composition and pore development characteristics, and their adsorbed gas controlling factors may be different. In future works, it is necessary to compare the adsorption characteristics and controlling factors of transitional, continental, and marine shales, which is significant for clarifying the gas occurrence characteristics and guiding the shale gas exploration in different regions.

5. Conclusions

To reassess and clarify the effect of clay minerals on the methane adsorption capacity of Longmaxi shales in China, TOC, XRD, LTNA, and HPMA experiments were conducted on 82 shale samples from 10 evaluation wells. The pores, minerals, and adsorption characteristics were analyzed, and the controlling factor was determined through a correlation analysis. The main conclusions are as follows:
(1) From the perspective of mineral composition, OM is the only adsorbent for methane adsorption in marine shales, and clay minerals almost have no effect on methane adsorption. The ultra-low adsorption capacity of illite and chlorite and the hydrophilicity and water absorption ability of clay minerals are the main reasons for the limited effect of clay on gas adsorption in marine shales.
(2) From the perspective of pore structure, both of the micropore and mesopore SSAs control the methane adsorption capacity of marine shales, which are mainly provided by OM. Clay minerals have no relationship with SSAs, regardless of mesopores or micropores.
(3) In the competitive methane adsorption process of OM and clay minerals, OM has an absolute advantage. Clay minerals become carriers for water absorption, due to their interlayer polarity and water wettability.
Through the analysis of a large number of experimental data, this study proved for the first time that clay minerals have no control effect on shale gas adsorption, which is of great significance for clarifying the occurrence characteristics and accumulation mechanisms of shale gas reservoirs.

Author Contributions

H.W.: methodology, validation, writing—original draft. S.Z.: conceptualization, methodology, project administration. J.Z.: writing—original draft, project administration. Z.F.: writing—review and editing. P.J.: methodology. L.Z.: writing—original draft. Q.Z.: methodology. All authors have read and agreed to the published version of the manuscript.

Funding

This research was funded by the National Science and Technology Major Project, grant number 2017ZX05035002-002.

Institutional Review Board Statement

Not applicable.

Informed Consent Statement

Not applicable.

Data Availability Statement

All relevant data have been presented in this paper.

Acknowledgments

We thank all the editors and reviewers for their helpful comments and suggestions.

Conflicts of Interest

The authors declare that they have no known competing financial interests or personal relationships that could have appeared to influence the work reported in this paper.

References

  1. Ma, X.; Xie, J. The progress and prospects of shale gas exploration and development in southern Sichuan Basin, SW China. Pet. Explor. Dev. 2018, 45, 172–182. [Google Scholar] [CrossRef]
  2. Ma, Y.; Cai, X.; Zhao, P. China’s shale gas exploration and development: Understanding and practice. Pet. Explor. Dev. 2018, 45, 589–603. [Google Scholar] [CrossRef]
  3. Zou, C.; Zhu, R.; Chen, Z.-Q.; Ogg, J.G.; Wu, S.; Dong, D.; Qiu, Z.; Wang, Y.; Wang, L.; Lin, S.; et al. Organic-matter-rich shales of China. Earth-Sci. Rev. 2019, 189, 51–78. [Google Scholar] [CrossRef]
  4. Zou, C.; Zhao, Q.; Cong, L.; Wang, H.; Shi, Z.; Wu, J.; Pan, S. Development progress, potential and prospect of shale gas in China. Nat. Gas Ind. 2021, 41, 1–14. [Google Scholar] [CrossRef]
  5. Feng, Z.; Hao, F.; Zhou, S.; Wu, W.; Tian, J.; Xie, C.; Cai, Y. Pore Characteristics and Methane Adsorption Capacity of Different Lithofacies of the Wufeng Formation–Longmaxi Formation Shales, Southern Sichuan Basin. Energy Fuels 2020, 34, 8046–8062. [Google Scholar] [CrossRef]
  6. Wang, H.; Zhou, S.; Liu, D.; Jiao, P.; Liu, H. Progress and prospect of key experimental technologies for shale gas geological evaluation. Nat. Gas. Ind. 2020, 40, 1–17. [Google Scholar] [CrossRef]
  7. Ma, X.; Wang, H.; Zhou, S.; Feng, Z.; Liu, H.; Guo, W. Insights into NMR response characteristics of shales and its application in shale gas reservoir evaluation. J. Nat. Gas Sci. Eng. 2020, 84, 103674. [Google Scholar] [CrossRef]
  8. Ross, D.J.; Bustin, R.M. Characterizing the shale gas resource potential of Devonian–Mississippian strata in the Western Canada sedimentary basin: Application of an integrated formation evaluation. AAPG Bull. 2008, 92, 87–125. [Google Scholar] [CrossRef]
  9. Ambrose, R.J.; Hartman, R.C.; Campos, M.D.; Akkutlu, I.Y.; Sondergeld, C.H. Shale Gas-in-Place Calculations Part I: New Pore-Scale Considerations. SPE J. 2012, 17, 219–229. [Google Scholar] [CrossRef]
  10. Curtis, J.B. Fractured shale-gas systems. AAPG Bull. 2002, 86, 1921–1938. [Google Scholar] [CrossRef]
  11. Gasparik, M.; Bertier, P.; Gensterblum, Y.; Ghanizadeh, A.; Krooss, B.; Littke, R. Geological controls on the methane storage capacity in organic-rich shales. Int. J. Coal Geol. 2014, 123, 34–51. [Google Scholar] [CrossRef]
  12. Tang, X.; Ripepi, N.; Luxbacher, K.; Pitcher, E. Adsorption Models for Methane in Shales: Review, Comparison, and Application. Energy Fuels 2017, 31, 10787–10801. [Google Scholar] [CrossRef]
  13. Li, J.; Chen, Z.; Wu, K.; Wang, K.; Luo, J.; Feng, D.; Qu, S.; Li, X. A multi-site model to determine supercritical methane adsorption in energetically heterogeneous shales. Chem. Eng. J. 2018, 349, 438–455. [Google Scholar] [CrossRef]
  14. Davarpanah, A.; Mirshekari, B. Experimental Investigation and Mathematical Modeling of Gas Diffusivity by Carbon Dioxide and Methane Kinetic Adsorption. Ind. Eng. Chem. 2019, 58, 12392–12400. [Google Scholar] [CrossRef]
  15. Pang, Y.; Tian, Y.; Soliman, M.Y.; Shen, Y. Experimental measurement and analytical estimation of methane absorption in shale kerogen. Fuel 2019, 240, 192–205. [Google Scholar] [CrossRef]
  16. Belmabkhout, Y.; Frère, M.; De Weireld, G. High-pressure adsorption measurements. A comparative study of the volumetric and gravimetric methods. Meas. Sci. Technol. 2004, 15, 848–858. [Google Scholar] [CrossRef]
  17. Gasparik, M.; Ghanizadeh, A.; Bertier, P.; Gensterblum, Y.; Bouw, S.; Krooss, B.M. High-Pressure Methane Sorption Isotherms of Black Shales from The Netherlands. Energy Fuels 2012, 26, 4995–5004. [Google Scholar] [CrossRef]
  18. Chareonsuppanimit, P.; Mohammad, S.; Robinson, R.L.; Gasem, K.A. High-pressure adsorption of gases on shales: Measurements and modeling. Int. J. Coal Geol. 2012, 95, 34–46. [Google Scholar] [CrossRef]
  19. Sakurovs, R.; Day, S.; Weir, S.; Duffy, G. Application of a Modified Dubinin−Radushkevich Equation to Adsorption of Gases by Coals under Supercritical Conditions. Energy Fuels 2007, 21, 992–997. [Google Scholar] [CrossRef]
  20. Tang, X.; Ripepi, N.; Stadie, N.; Yu, L.; Hall, M. A dual-site Langmuir equation for accurate estimation of high pressure deep shale gas resources. Fuel 2016, 185, 10–17. [Google Scholar] [CrossRef] [Green Version]
  21. Li, J. Development of adsorption ratio equation and state equation of liquid and their geological significance. Capillarity 2021, 4, 63–65. [Google Scholar] [CrossRef]
  22. Ross, D.J.; Bustin, R.M. Impact of mass balance calculations on adsorption capacities in microporous shale gas reservoirs. Fuel 2007, 86, 2696–2706. [Google Scholar] [CrossRef]
  23. Zhang, T.; Ellis, G.; Ruppel, S.C.; Milliken, K.; Yang, R. Effect of organic-matter type and thermal maturity on methane adsorption in shale-gas systems. Org. Geochem. 2012, 47, 120–131. [Google Scholar] [CrossRef]
  24. Tian, H.; Li, T.; Zhang, T.; Xiao, X. Characterization of methane adsorption on overmature Lower Silurian–Upper Ordovician shales in Sichuan Basin, southwest China: Experimental results and geological implications. Int. J. Coal Geol. 2016, 156, 36–49. [Google Scholar] [CrossRef]
  25. Liu, Y.; Hou, J. Selective adsorption of CO2/CH4 mixture on clay-rich shale using molecular simulations. J. CO2 Util. 2020, 39, 101143. [Google Scholar] [CrossRef]
  26. Zhu, H.; Ju, Y.; Huang, C.; Chen, F.; Chen, B.; Yu, K. Microcosmic gas adsorption mechanism on clay-organic nanocomposites in a marine shale. Energy 2020, 197, 117256. [Google Scholar] [CrossRef]
  27. Li, A.; Han, W.; Fang, Q.; Memon, A.; Ma, M. Experimental investigation of methane adsorption and desorption in water-bearing shale. Capillarity 2020, 3, 45–55. [Google Scholar] [CrossRef]
  28. Ross, D.J.; Bustin, R.M. The importance of shale composition and pore structure upon gas storage potential of shale gas reservoirs. Mar. Pet. Geol. 2009, 26, 916–927. [Google Scholar] [CrossRef]
  29. Cheng, A.-L.; Huang, W.-L. Selective adsorption of hydrocarbon gases on clays and organic matter. Org. Geochem. 2004, 35, 413–423. [Google Scholar] [CrossRef]
  30. Lu, X.; Li, F.; Watson, A.T. Adsorption measurements in Devonian shales. Fuel 1995, 74, 599–603. [Google Scholar] [CrossRef]
  31. Li, J.; Yan, X.; Wang, W.; Zhang, Y.; Yin, J.; Lu, S.; Chen, F.; Meng, Y.; Zhang, X.; Chen, X.; et al. Key factors controlling the gas adsorption capacity of shale: A study based on parallel experiments. Appl. Geochem. 2015, 58, 88–96. [Google Scholar] [CrossRef]
  32. Sun, Y.; Ding, W.; Lu, L.; Li, M.; Chen, P.; Ji, X. Analysis of influence factors of methane adsorption capacity of the Lower Silurian shale. Pet. Sci. Technol. 2018, 36, 2112–2118. [Google Scholar] [CrossRef]
  33. Feng, Q.; Xu, S.; Xing, X.; Zhang, W.; Wang, S. Advances and challenges in shale oil development: A critical review. Adv. Geo-Energy Res. 2020, 4, 406–418. [Google Scholar] [CrossRef]
  34. Luo, P.; Zhong, N.; Khan, I.; Wang, X.; Wang, H.; Luo, Q.; Guo, Z. Effects of pore structure and wettability on methane adsorption capacity of mud rock: Insights from mixture of organic matter and clay minerals. Fuel 2019, 251, 551–561. [Google Scholar] [CrossRef]
  35. Ji, L.; Zhang, T.; Milliken, K.L.; Qu, J.; Zhang, X. Experimental investigation of main controls to methane adsorption in clay-rich rocks. Appl. Geochem. 2012, 27, 2533–2545. [Google Scholar] [CrossRef]
  36. Cancino, O.P.O.; Peredo-Mancilla, D.; Pozo, M.; Pérez, E.; Bessieres, D. Effect of Organic Matter and Thermal Maturity on Methane Adsorption Capacity on Shales from the Middle Magdalena Valley Basin in Colombia. Energy Fuels 2017, 31, 11698–11709. [Google Scholar] [CrossRef]
  37. Shabani, M.; Moallemi, S.A.; Krooss, B.M.; Amann-Hildenbrand, A.; Zamani-Pozveh, Z.; Ghalavand, H.; Littke, R. Methane sorption and storage characteristics of organic-rich carbonaceous rocks, Lurestan province, southwest Iran. Int. J. Coal Geol. 2018, 186, 51–64. [Google Scholar] [CrossRef]
  38. Jeon, P.R.; Choi, J.; Yun, T.S.; Lee, C.-H. Sorption equilibrium and kinetics of CO2 on clay minerals from subcritical to supercritical conditions: CO2 sequestration at nanoscale interfaces. Chem. Eng. J. 2014, 255, 705–715. [Google Scholar] [CrossRef]
  39. Li, J.; Li, X.; Wang, X.; Li, Y.; Wu, K.; Shi, J.; Yang, L.; Feng, D.; Zhang, T.; Yu, P. Effect of water distribution on methane adsorption capacity in shale clay. Int. J. Coal Geol. 2016, 159, 135–154. [Google Scholar] [CrossRef]
  40. Shen, W.; Li, X.; Ma, T.; Cai, J.; Lu, X.; Zhou, S. High-pressure methane adsorption behavior on deep shales: Experiments and modeling. Phys. Fluids 2021, 33, 063103. [Google Scholar] [CrossRef]
  41. Zhang, Q.; Feng, L.; Pang, Z.; Liang, P.; Guo, W.; Zhou, S.; Lu, B. Reservoir heterogeneity of the Longmaxi Formation and its significance for shale gas enrichment. Energy Sci. Eng. 2020, 8, 4229–4249. [Google Scholar] [CrossRef]
  42. Chen, L.; Jiang, Z.; Liu, K.; Tan, J.; Gao, F.; Wang, P. Pore structure characterization for organic-rich Lower Silurian shale in the Upper Yangtze Platform, South China: A possible mechanism for pore development. J. Nat. Gas Sci. Eng. 2017, 46, 1–15. [Google Scholar] [CrossRef]
  43. Zhou, S.; Xue, H.; Ning, Y.; Guo, W.; Zhang, Q. Experimental study of supercritical methane adsorption in Longmaxi shale: Insights into the density of adsorbed methane. Fuel 2018, 211, 140–148. [Google Scholar] [CrossRef]
  44. Brunauer, S.; Emmett, P.H.; Teller, E. Adsorption of Gases in Multimolecular Layers. J. Am. Chem. Soc. 1938, 60, 309–319. [Google Scholar] [CrossRef]
  45. Mikhail, R.; Brunauer, S.; Bodor, E. Investigations of a complete pore structure analysis-I: Analysis of micropores. J. Colloid Interface Sci. 1968, 26, 45–53. [Google Scholar] [CrossRef]
  46. Sing, K.S.W. Reporting physisorption data for gas/solid systems with special reference to the determination of surface area and porosity (Recommendations 1984). Pure Appl. Chem. 1985, 57, 603–619. [Google Scholar] [CrossRef]
  47. Barrett, E.P.; Joyner, L.G.; Halenda, P.P. The Determination of Pore Volume and Area Distributions in Porous Substances. I. Computations from Nitrogen Isotherms. J. Am. Chem. Soc. 1951, 73, 373–380. [Google Scholar] [CrossRef]
  48. Zhou, S.; Liu, H.; Chen, H.; Wang, H.; Guo, W.; Liu, D.; Zhang, Q.; Wu, J.; Shen, W. A comparative study of the nanopore structure characteristics of coals and Longmaxi shales in China. Energy Sci. Eng. 2019, 7, 2768–2781. [Google Scholar] [CrossRef]
  49. Zhou, S.; Zhang, D.; Wang, H.; Li, X. A modified BET equation to investigate supercritical methane adsorption mechanisms in shale. Mar. Pet. Geol. 2019, 105, 284–292. [Google Scholar] [CrossRef]
  50. Chai, D.; Yang, G.; Fan, Z.; Li, X. Gas transport in shale matrix coupling multilayer adsorption and pore confinement effect. Chem. Eng. J. 2019, 370, 1534–1549. [Google Scholar] [CrossRef]
  51. Yuan, W.; Pan, Z.; Li, X.; Yang, Y.; Zhao, C.; Connell, L.D.; Li, S.; He, J. Experimental study and modelling of methane adsorption and diffusion in shale. Fuel 2014, 117, 509–519. [Google Scholar] [CrossRef]
  52. Wood, D.A. Techniques used to calculate shale fractal dimensions involve uncertainties and imprecisions that require more careful consideration. Adv. Geo-Energy Res. 2021, 5, 153–165. [Google Scholar] [CrossRef]
  53. Gai, H.; Li, T.; Wang, X.; Tian, H.; Xiao, X.; Zhou, Q. Methane adsorption characteristics of overmature Lower Cambrian shales of deepwater shelf facies in Southwest China. Mar. Pet. Geol. 2020, 120, 104565. [Google Scholar] [CrossRef]
  54. Nie, B.; Liu, X.; Yang, L.; Meng, J.; Li, X. Pore structure characterization of different rank coals using gas adsorption and scanning electron microscopy. Fuel 2015, 158, 908–917. [Google Scholar] [CrossRef]
  55. Chen, S.; Tao, S.; Tang, D.; Xu, H.; Li, S.; Zhao, J.; Jiang, Q.; Yang, H. Pore Structure Characterization of Different Rank Coals Using N2 and CO2 Adsorption and Its Effect on CH4 Adsorption Capacity: A Case in Panguan Syncline, Western Guizhou, China. Energy Fuels 2017, 31, 6034–6044. [Google Scholar] [CrossRef]
  56. Suárez-Ruiz, I.; Juliao, T.; Suárez-García, F.; Marquez, R.; Ruiz, B. Porosity development and the influence of pore size on the CH4 adsorption capacity of a shale oil reservoir (Upper Cretaceous) from Colombia. Role of solid bitumen. Int. J. Coal Geol. 2016, 159, 1–17. [Google Scholar] [CrossRef]
  57. Li, J.; Wu, K.; Chen, Z.; Wang, W.; Yang, B.; Wang, K.; Luo, J.; Yu, R. Effects of energetic heterogeneity on gas adsorption and gas storage in geologic shale systems. Appl. Energy 2019, 251, 113368. [Google Scholar] [CrossRef]
  58. Gao, Z.; Xiong, S. Methane Adsorption Capacity Reduction Process of Water-Bearing Shale Samples and Its Influencing Factors: One Example of Silurian Longmaxi Formation Shale from the Southern Sichuan Basin in China. J. Earth Sci. 2021, 32, 946–959. [Google Scholar] [CrossRef]
  59. Li, B.; Mehmani, A.; Chen, J.; Georgi, D.T.; Jin, G. The Condition of Capillary Condensation and Its Effects on Adsorption Isotherms of Unconventional Gas Condensate Reservoirs. proceedings of the SPE Annual Technical Conference and Exhibition, New Orleans, LA, USA, 30 September 2013. [Google Scholar] [CrossRef]
  60. Li, J.; Li, B.; Ren, C.; Zhang, Y.; Wang, B. An adsorption model for evaluating methane adsorption capacity in shale under various pressures and moisture. J. Nat. Gas Sci. Eng. 2020, 81, 103426. [Google Scholar] [CrossRef]
  61. Li, J.; Li, B.; Gao, Z.; Zhang, Y.; Wang, B. Adsorption behavior, including the thermodynamic characteristics of wet shales under different temperatures and pressures. Chem. Eng. Sci. 2021, 230, 116228. [Google Scholar] [CrossRef]
  62. Zou, J.; Rezaee, R.; Xie, Q.; You, L.; Liu, K.; Saeedi, A. Investigation of moisture effect on methane adsorption capacity of shale samples. Fuel 2018, 232, 323–332. [Google Scholar] [CrossRef]
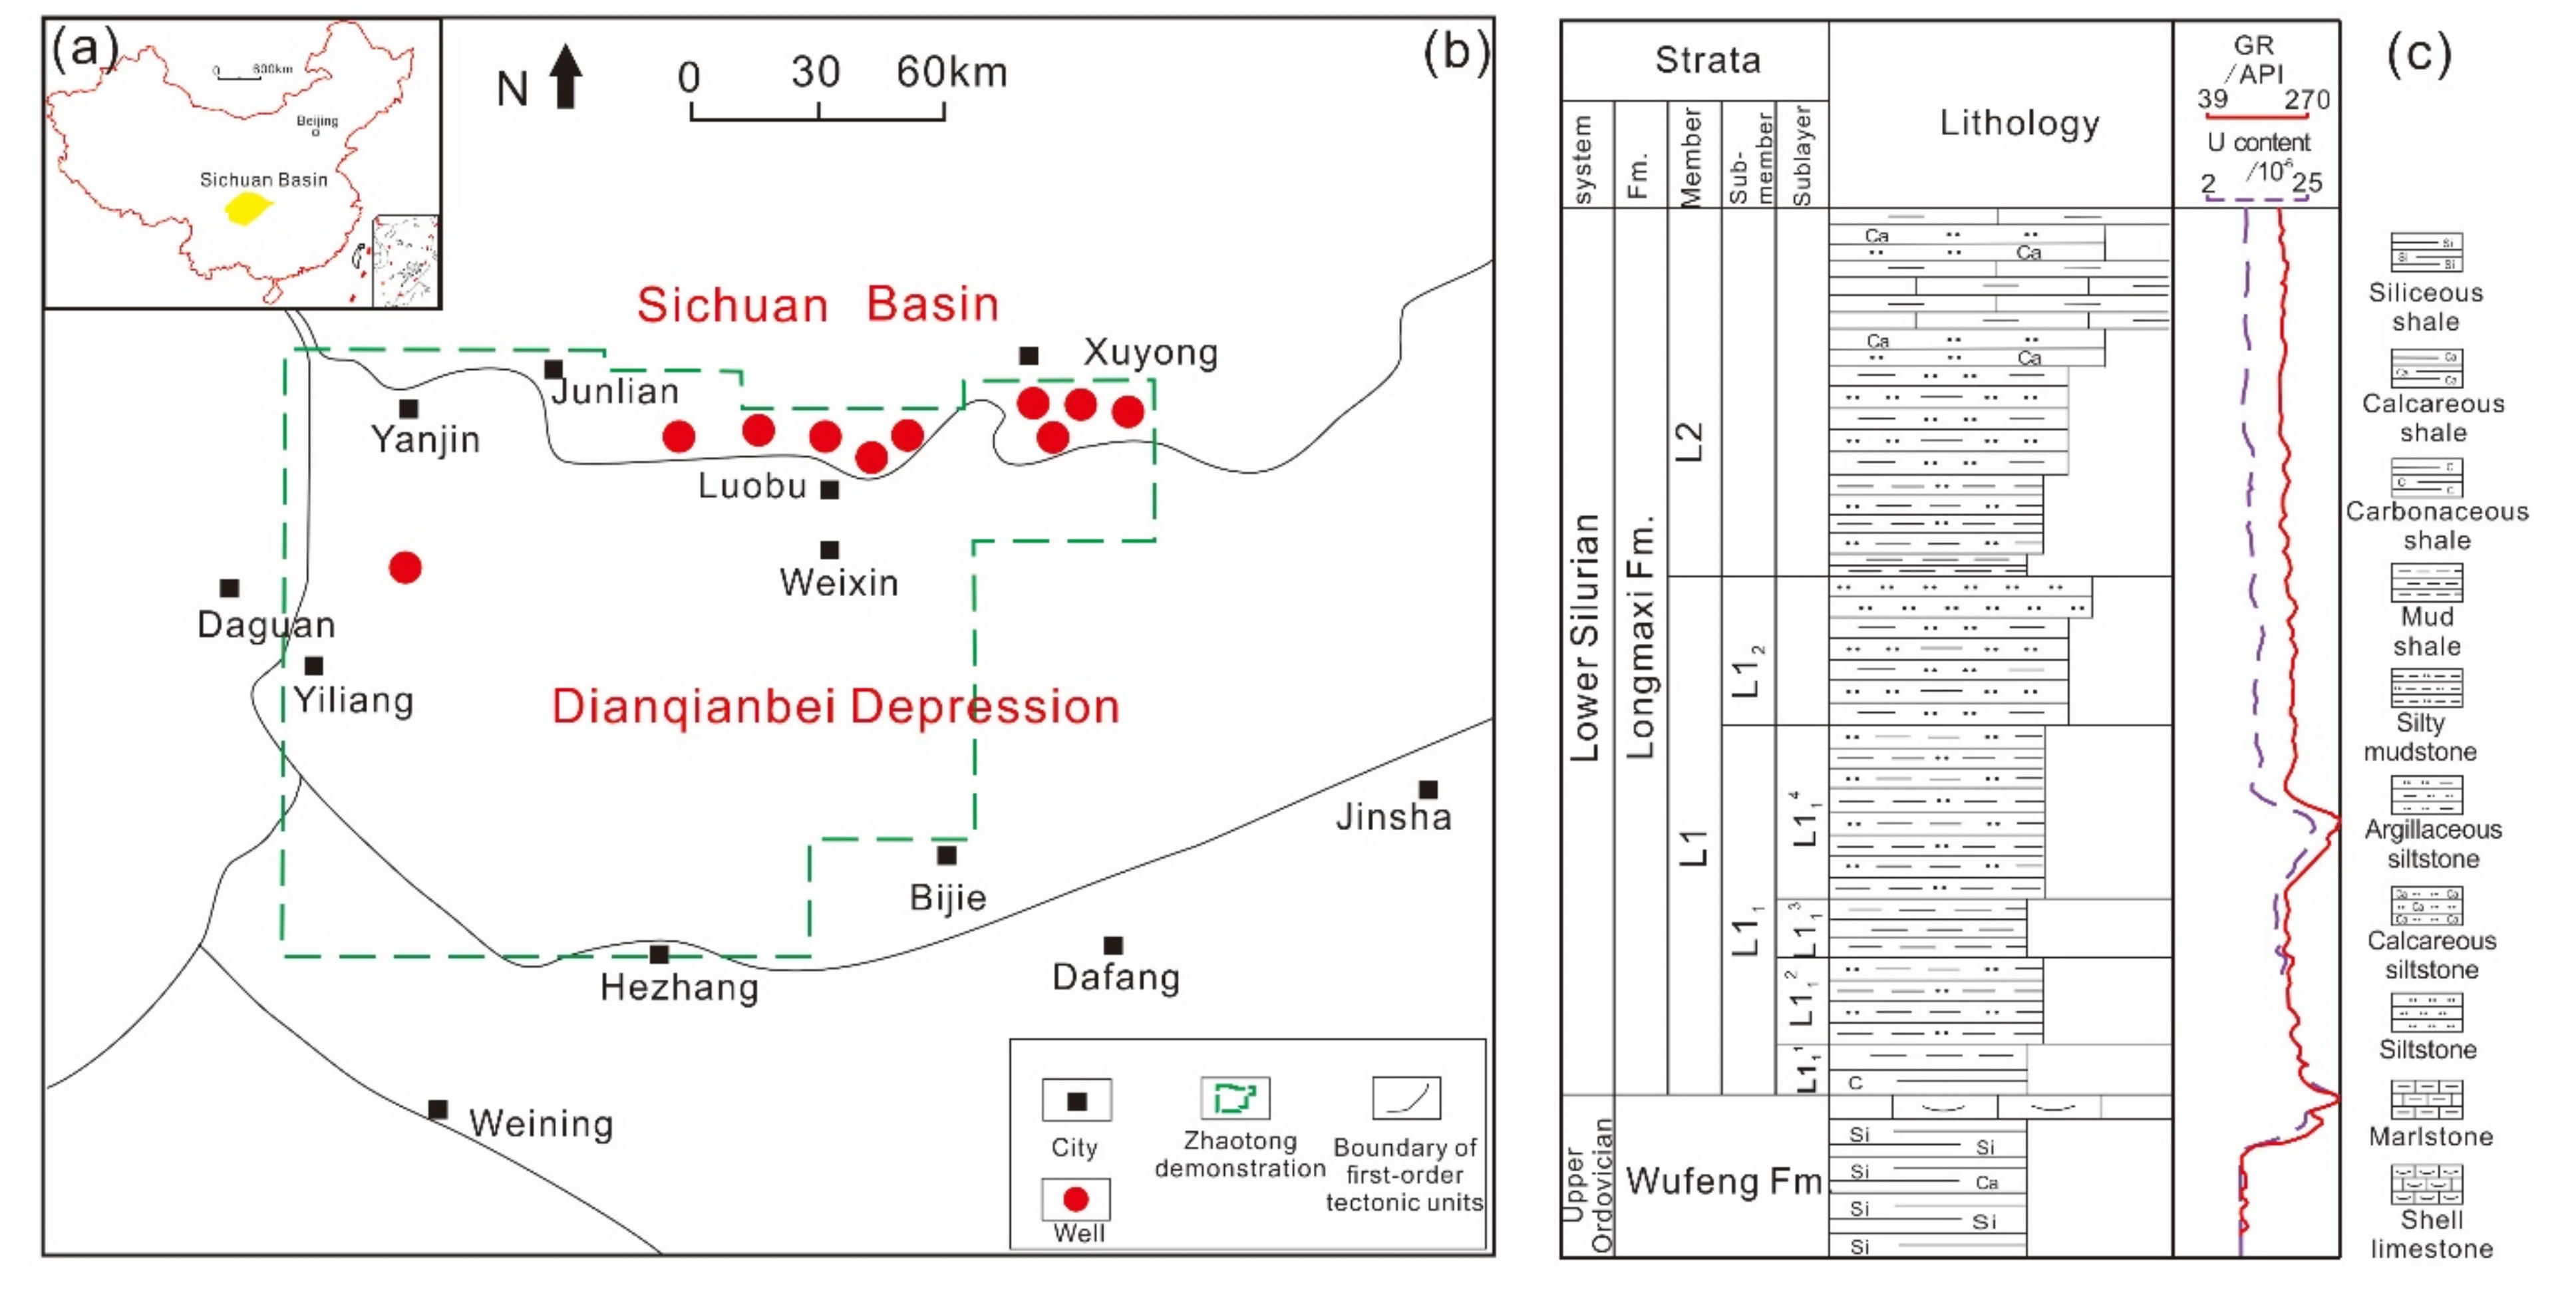
Figure 1. Location of the study area and stratigraphic column of Longmaxi Formation. (a) Location of Sichuan Basin in China; (b) Zhaotong shale gas demonstration (green dotted line) and the 10 studied well locations (red circles); (c) stratigraphic and sublayers division of the Wufeng–Longmaxi Formation shale proposed by PetroChina company.
Energies 14 06836 g001
Figure 2. Clay mineral analysis of the shale samples based on XRD spectra analysis of N/E/T glass slides. Slide N is the natural sample without any treatment of the extracted clays, slide E is the sample after saturating slide N with ethylene glycol, and slide T is the sample after heating slide E under 450 °C.
Energies 14 06836 g002
Figure 3. Variation of the TOC and clay content with the depth of the 10 wells. A total of 82 data points is shown in this figure.
Energies 14 06836 g003
Figure 4. Low-temperature N2 adsorption (LTNA) experimental results of the samples from four representative wells, including adsorption and desorption curves ((a): Well Y105, (b): Well Y103, (c): Well Y128, (d): Well Y115H3).
Energies 14 06836 g004
Figure 5. Distribution characteristics of mesopore SSA (a), mesopore PV (b), micropore SSA (c) and micropore PV (d) of all shale samples.
Energies 14 06836 g005
Figure 6. Excess and absolute adsorption isotherms of two representative wells ((a,b): Well Y201; (c,d): Well Y128).
Energies 14 06836 g006
Figure 7. Relationships among the adsorption capacity (VL) (a), Langmuir pressure (PL) (b), and TOC of all the shale samples.
Energies 14 06836 g007
Figure 8. The relationship between the adsorption capacity (VL) and mesopore SSA (a), mesopore PV (b), micropore SSA (c) and micropore PV (d) of the 82 shale samples.
Energies 14 06836 g008
Figure 9. Relationships between the adsorption capacity (VL) and mineral content ((a) clay, (b) quartz, (c) illite, (d) chlorite, (e) I–S mixed layer, and (f) feldspar) of all the shale samples.
Energies 14 06836 g009
Figure 10. Relationships between the adsorption capacity per unit TOC (VL/TOC) and mineral content ((a) clay, (b) quartz, (c) illite, (d) chlorite, (e) I–S mixed layer, and (f) feldspar) of all the shale samples.
Energies 14 06836 g010
Figure 11. Relationships between clay content and mesopore SSA (a), clay content and micropore SSA (b), TOC content and mesopore SSA (c), TOC content and micropore SSA (d) of all the shale samples.
Energies 14 06836 g011
Table 1. The basic information and petrophysical properties of the marine shale samples.
No.WellNumber of SamplesDepth (m)TOC (%)Quartz Content (%)Clay Content (%)
1Y105101654.40–1691.991.90–4.90 (3.03)28.1–38.0 (33.7)23.6–34.8 (29.0)
2Y103101027.00–1086.961.00–5.60 (2.66)24.6–41.6 (34.7)23.7–38.3 (31.4)
3Y20182734.55–2776.330.61–2.46 (1.87)7.0–34.4 (23.4)7.8–30.3 (20.7)
4Y128102235.66–2267.030.76–5.32 (2.47)18.0–37.0 26.8)15.0–61.0 (32.9)
5Y115H3102989.42–3039.780.85–4.77 (2.68)18.3–55.5 (36.4)19.0–45.5 (30.9)
6Y112H12102125.71–2186.670.50–3.48 (1.67)7.1–48.0 (33.7)15.6–58.9 (33.6)
7Y15191704.16–1761.950.56–6.22 (2.63)27.0–54.8 (37.1)21.8–40.4 (29.1)
8Y10751233.43–1255.511.56–3.54 (2.89)12.6–50.6 (36.2)16.0–64.3 (32.1)
9Y13751014.50–1035.662.67–6.72 (3.94)28.2–40.1 (34.2)17.6–32.9 (25.6)
10Y13851937.57–1987.980.46–7.40 (2.80)24.3–36.0 (29.2)15.7–38.3 (27.8)
Publisher’s Note: MDPI stays neutral with regard to jurisdictional claims in published maps and institutional affiliations.