Article

Optimal Modulation of Regenerative Braking in Through-The-Road Hybridized Vehicles

by
Gianfranco Rizzo
1,*,
Francesco Antonio Tiano
1,
Valerio Mariani
2 and
Matteo Marino
3
1
Department of Industrial Engineering, University of Salerno, 84084 Fisciano, Italy
2
Department of Engineering, University of Sannio, 82100 Benevento, Italy
3
eProInn, 84084 Fisciano, Italy
*
Author to whom correspondence should be addressed.
Energies 2021, 14(20), 6835; https://doi.org/10.3390/en14206835
Submission received: 31 August 2021 / Revised: 9 October 2021 / Accepted: 14 October 2021 / Published: 19 October 2021
(This article belongs to the Special Issue Modeling and Control of Hybrid Vehicles)

Abstract

:
Regenerative braking can significantly improve the energy efficiency of hybrid and electric vehicles, and many studies have been carried out in order to improve and optimize the energy recovery of the braking energy. In the paper, the optimization of regenerative braking by means of braking force modulation is analysed, with specific application to the case of cars converted into Through-the-road (TTR) hybrid vehicles, and an optimal modulation strategy is also proposed. Car hybridization is an emerging topic since it may be a feasible, low-cost, intermediate step toward the green transition of the transport system with a potential positive impact in third-world countries. In this case, the presence of two in-wheel-motors installed on the rear axle and of the original mechanical braking system mounted on the vehicle can result in limited braking energy recovery in the absence of proper braking management strategies. A vehicle longitudinal model has been integrated with an algorithm of non-linear constrained optimization to maximize the energy recovery for various starting speed and stopping time, also considering the efficiency map and power limitations of the electric components. In the best conditions, the recovery can reach about 40% of the vehicle energy, selecting the best deceleration at each speed and proper modulation, and with a realistic estimate of the grip coefficient.

1. Introduction

An increasing substitution of conventional gasoline and diesel cars by electric vehicles (EV) and hybrid electric vehicles (HEV) is expected in the near future, in order to confront the pressing issues of CO2 reduction and global warming [1,2]. Indeed, electrical machines are reversible, which enables the recovery of the kinetic energy during braking manoeuvres, thus significantly contributing to the reduction of energy consumption and emissions and to the extension of the driving range [3,4]. Considerable research effort has been spent by universities and the automotive industry on methodologies and control algorithms to enhance the effectiveness of regenerative braking [5,6,7,8]. The first papers were published in the 1970s [9], but a remarkable increase has been seen in last two decades, in parallel with a notable growth of the role and the diffusion of HEVs and EVs (Figure 1).
Recent review papers provide a comprehensive picture of management and optimization techniques for regenerative braking [10,11]. The papers range over different topics, from cooperative control approaches [12], application of fuzzy logic [13,14], cut-off point detection [15], safety issues [16,17], test bench emulations [18], torque allocation [19], and other aspects.
While many topics associated with regenerative braking have been largely studied, further research is needed to adapt this technique to vehicles with specific architectures, in which the general concepts are not fully applicable. This is the case of the hybridized vehicles, obtained by conversion of traditional cars through the adoption of two-wheel motors in rear wheels that transform the car into a TTR (through-the-road) parallel hybrid vehicle [20]. TTR HEVs represent a particular configuration the parallel hybrids, where the two propulsion systems do not have a mechanical connection within the vehicle but “through the road”. In an HEV with that configuration, one axle of the vehicle axes (usually the front one) is driven by the thermal engine, while the other axle (usually the rear one) is driven by an electric propulsion system. This architecture, currently adopted on various ranges of hybrid vehicles, is widely studied in the technical literature also because it gives the possibility of being used for the conversion of conventional vehicles into hybrid vehicles [21,22]. In fact, this configuration fits well with the transformation of a conventional car into a hybrid one, reducing fuel consumption and emissions and avoiding a premature and massive fleet scrapping. The “reuse” of cars, in a Life Cycle Assessment (LCA) perspective, allows reducing the impact on CO2 and energy consumption due to an unnecessary and premature dismissal of the vehicle [23,24,25].
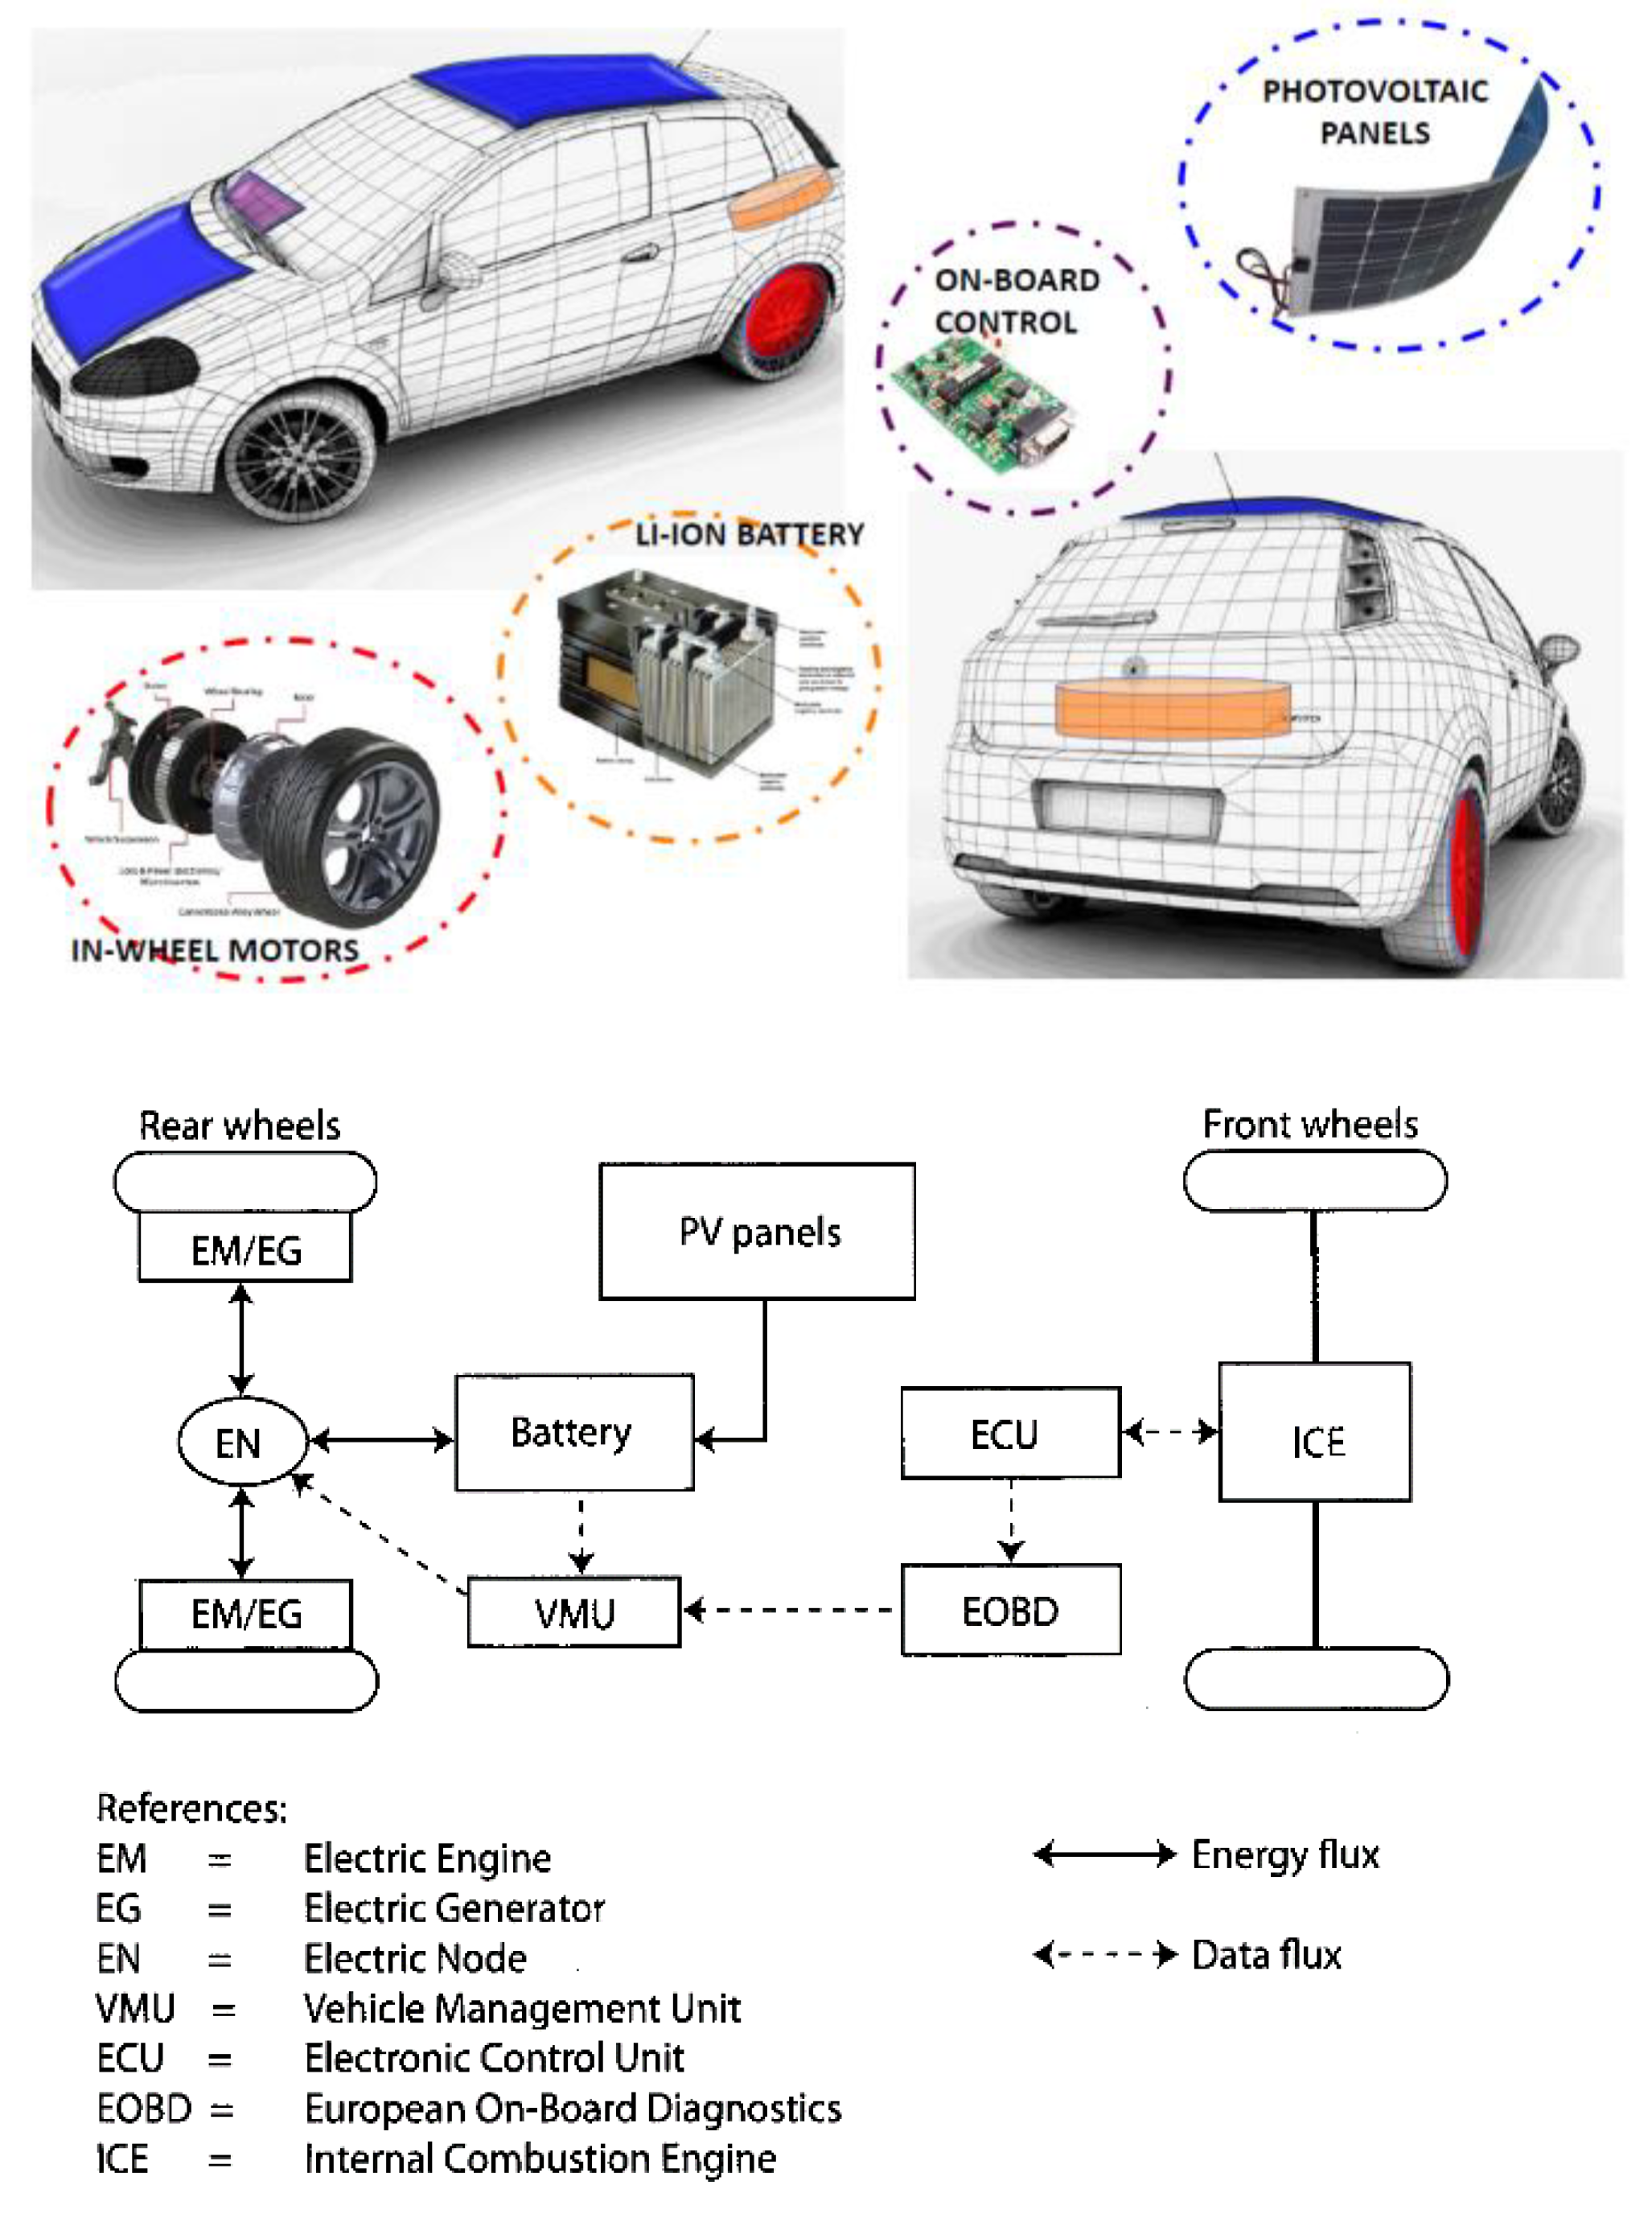
A project for car hybridization with partial solar recharging by PV cells has been proposed and patented at the University of Salerno (Italy) [26,27,28,29,30]. The hybridization kit consists of two in-wheel motors [31,32,33], a lithium-ion battery, photovoltaic panels on the vehicle body and an additional control unit (see Figure 2).
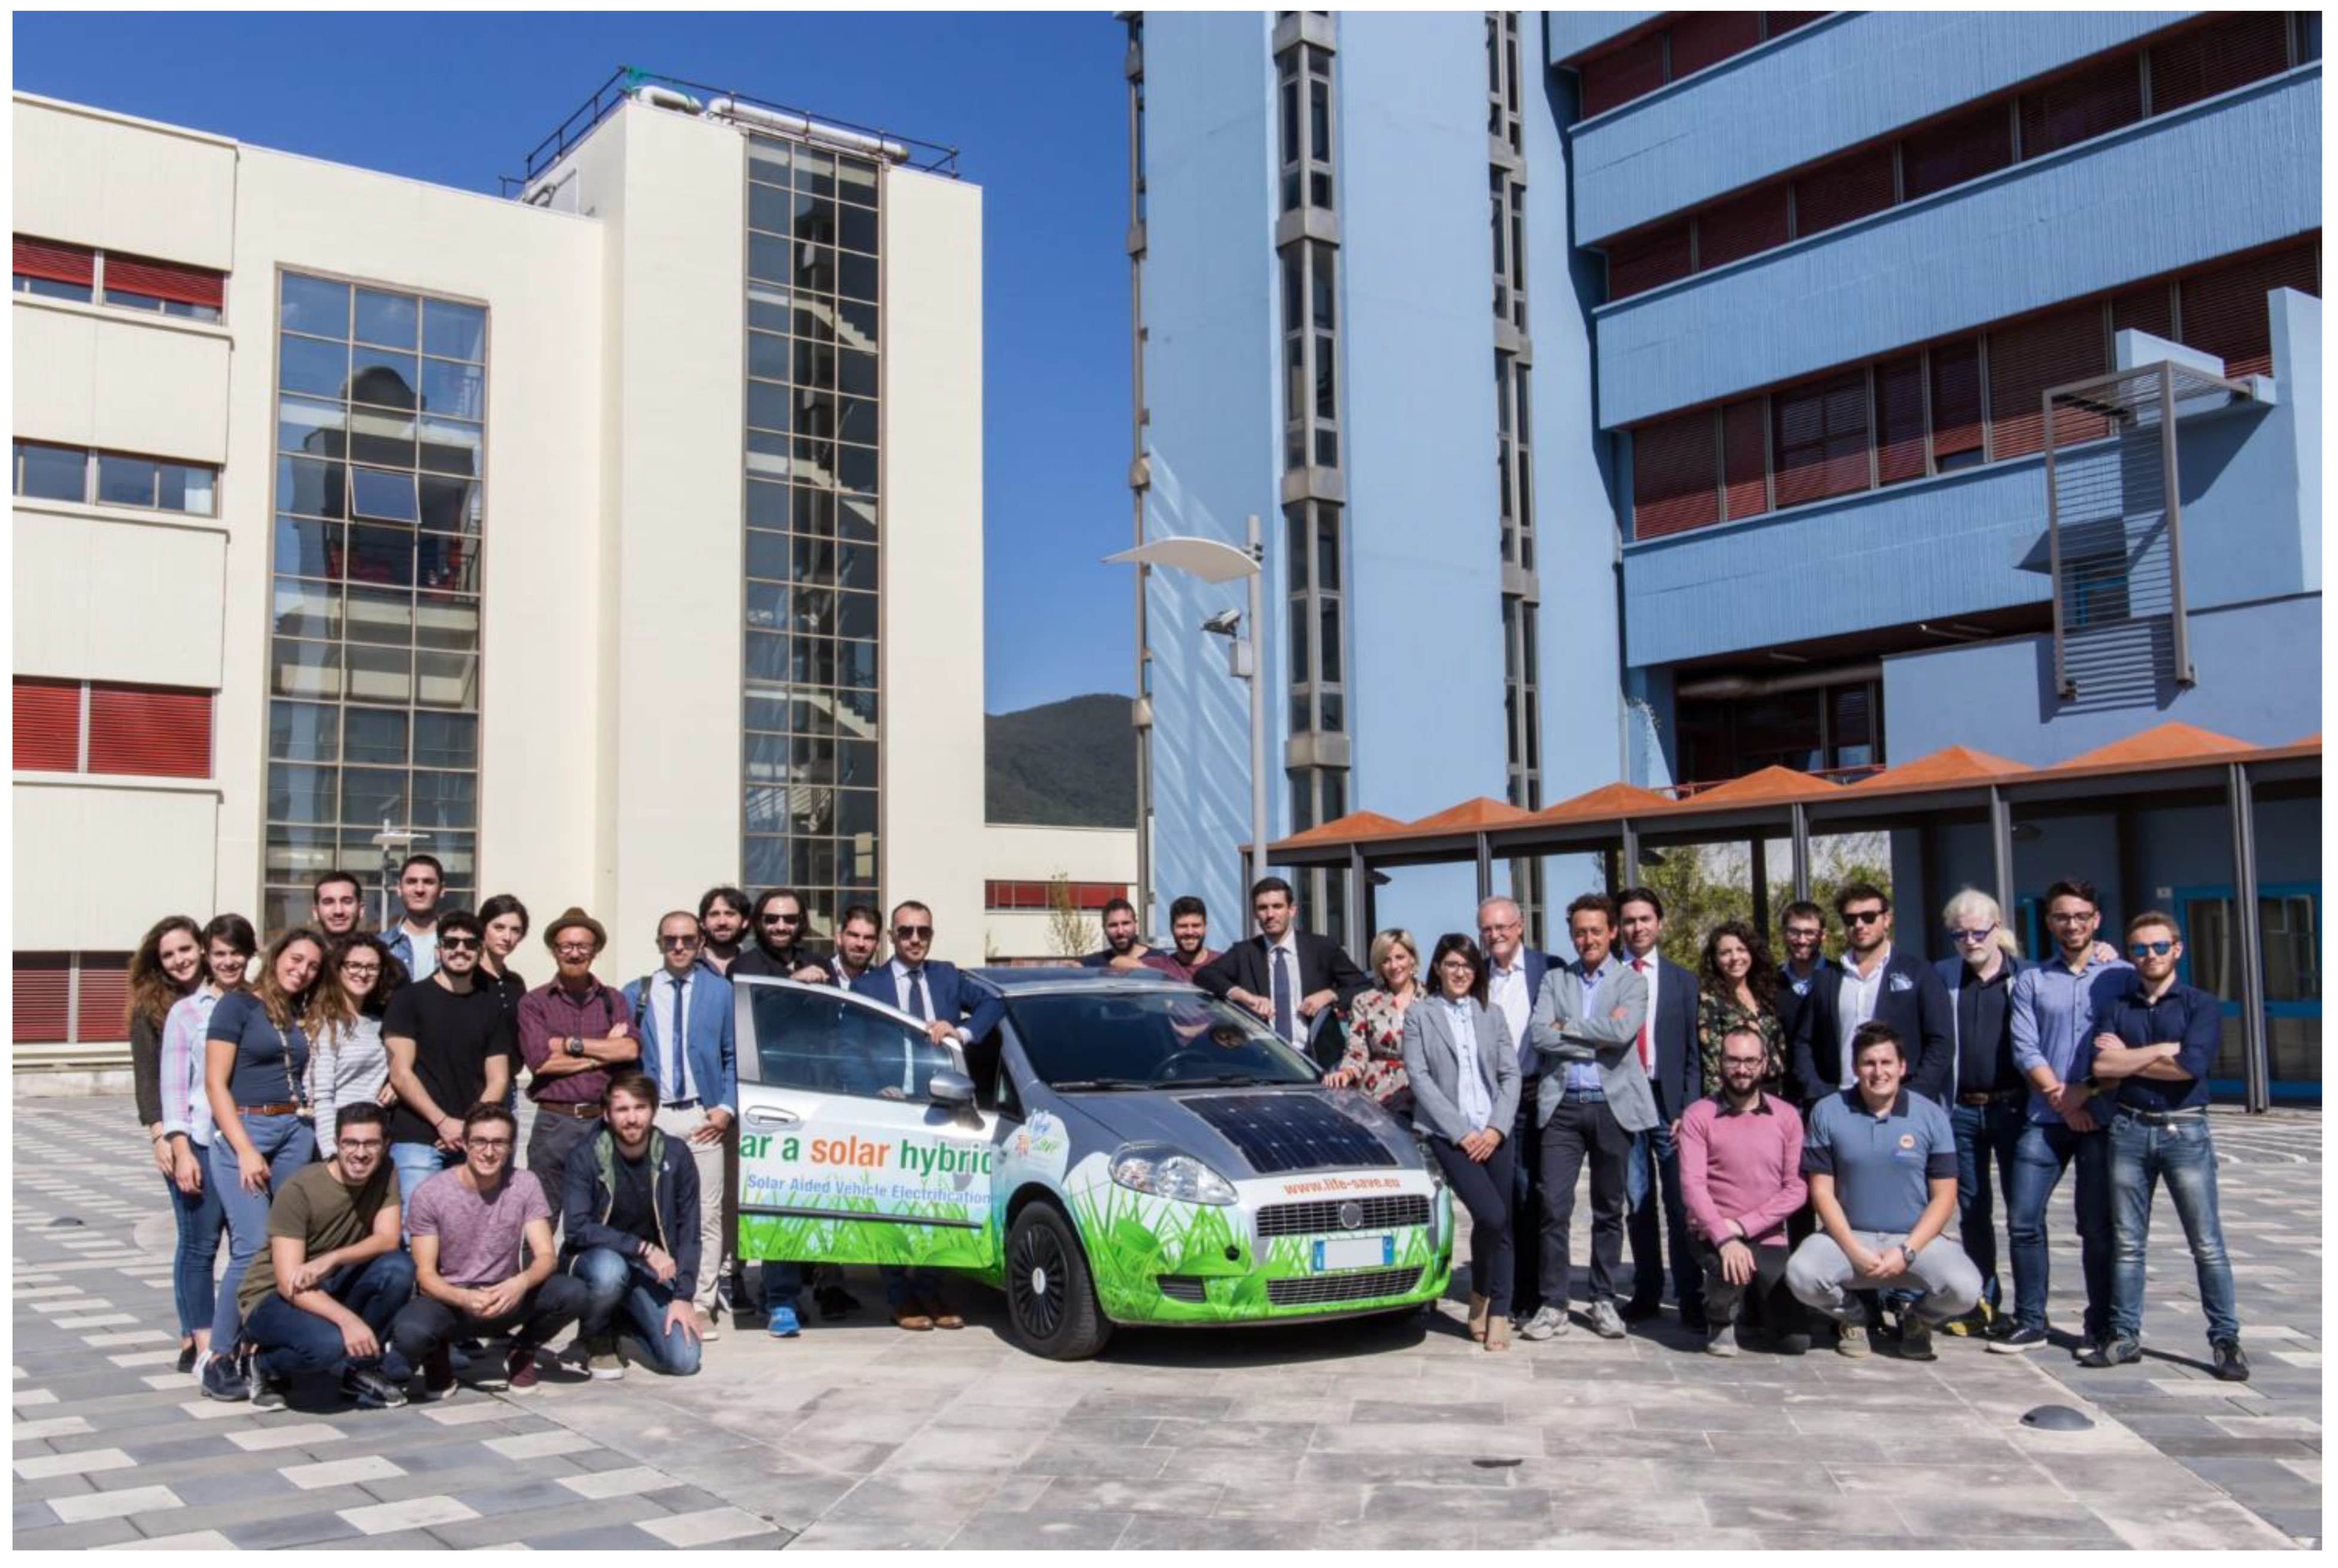
A FIAT Punto converted into a solar hybrid is shown in Figure 3. The project, LIFE-SAVE (Solar Aided Vehicle Electrification), was financed by the EU program LIFE to produce prototypes ready for industrialization. Details at the website www.life-save.eu (accessed on 1 October 2021).
Hybridized vehicles are conventional vehicles with the electric powertrain (e.g., in-wheel motors and battery) being added as an aftermarket product. One of the main concerns when implementing control strategies in hybridized vehicles is that they must not conflict with the existing vehicle control strategy, which does not consider the presence of the new vehicle components. In particular, electric braking on rear wheels will occur with the simultaneous activation of the mechanical braking on front and rear wheels, reducing the recovery capability of the electric brakes [30]. In this paper, the potentialities of energy recovery enhancement in hybridized vehicles due to the adoption of optimal braking modulation are investigated. The results, obtained by means of integration of a vehicle dynamics longitudinal model with an algorithm of non-linear constrained optimization, are presented, and the perspectives of practical implementation are shown and discussed.

2. Regenerative Braking Strategy

2.1. Safety Braking Region Definition

In order to estimate the energy recoverable via regenerative braking, a simplified model of the vehicle during braking is considered [30,31]:
According to the scheme of Figure 4, the following parameters are defined to this aim:
  • X 1 and X 2 are the longitudinal forces on front and rear axles;
  • Z 1 and Z 2 are the vertical forces on front and rear axles;
  • u is the vehicle speed;
  • l is the distance between front and rear wheels;
  • a and b are the distances between vehicle centre of gravity and the front and rear axles;
  • h is the height of the vehicle center of gravity;
  • W is the vehicle weight;
  • G is the position of the vehicle center of gravity;
  • X 0 Z 0 is the street reference system;
  • X Z is the vehicle reference system.
This model is based on the simplifying assumptions of constant deceleration, flat road, absence of lateral forces and equal adhesion conditions for the wheels on the same axle.
It is therefore possible to write the following dynamic equations:
m u ˙ = ( X 1 + X 2 ) 0 = Z 1 + Z 2 m g 0 = ( X 1 + X 2 ) h Z 1 a + Z 2 b
At constant vehicle speedy, the static loads W 1 and W 2 can be defined as:
W 1 = m g b l W 2 = m g a l
During a deceleration, the load on the front axle became greater than the loads on the rear one according to:
Z 1 = W 1 + Δ Z = W 1 m h l u ˙ Z 2 = W 2 Δ Z = W 2 + m h l u ˙
The maximum possible deceleration, considering road grip μ , is achieved when both axles are at grip limit:
X 1 = μ Z 1 X 2 = μ Z 2
It also holds:
| u ˙ | m a x = μ g
Combining the above equations, the maximum braking force applied on both axles in absence of slip are:
X 1 p = μ   ( W 1 + m h l μ g ) X 2 p = μ   ( W 2 m h l μ g )
In case the braking force is applied only on one axle, it follows:
X 10 = μ W 1 1 μ h l X 20 = μ W 2 1 + μ h l
It is therefore possible to identify the feasible braking region on the plane X 2 X 1 , once defined the grip coefficient and car specification (Figure 5):
The feasible braking region identifies a dominion in which the vehicle can brake without losing grip. On the right side of this zone, the rear wheels would slip, while above the front wheels would lose grip.

2.2. Estimation of Energy Recoverable via Regenerative Braking

Once the feasible braking region is identified, suitable strategies that avoid grip loss and maximize regeneration can be studied and implemented. In the special case of a TTR hybrid vehicle derived from the hybridization of a conventional vehicle, the following conditions hold:
  • the electric brakes are located on rear wheels; their rotating speed is directly linked to the vehicle speed, without mechanical gear;
  • the braking force on the rear wheels is the sum of the mechanical and the electrical contribution, where only this latter can contribute to regeneration;
  • the mechanical braking is distributed between front axle (about 70%) and rear axle (about 30%);
  • the power that can be recovered to the battery depends on the most restrictive conditions deriving from: maximum braking force compatible with grip limits; maximum power deliverable by electric brakes for the given vehicle speed; maximum power accepted by the battery.
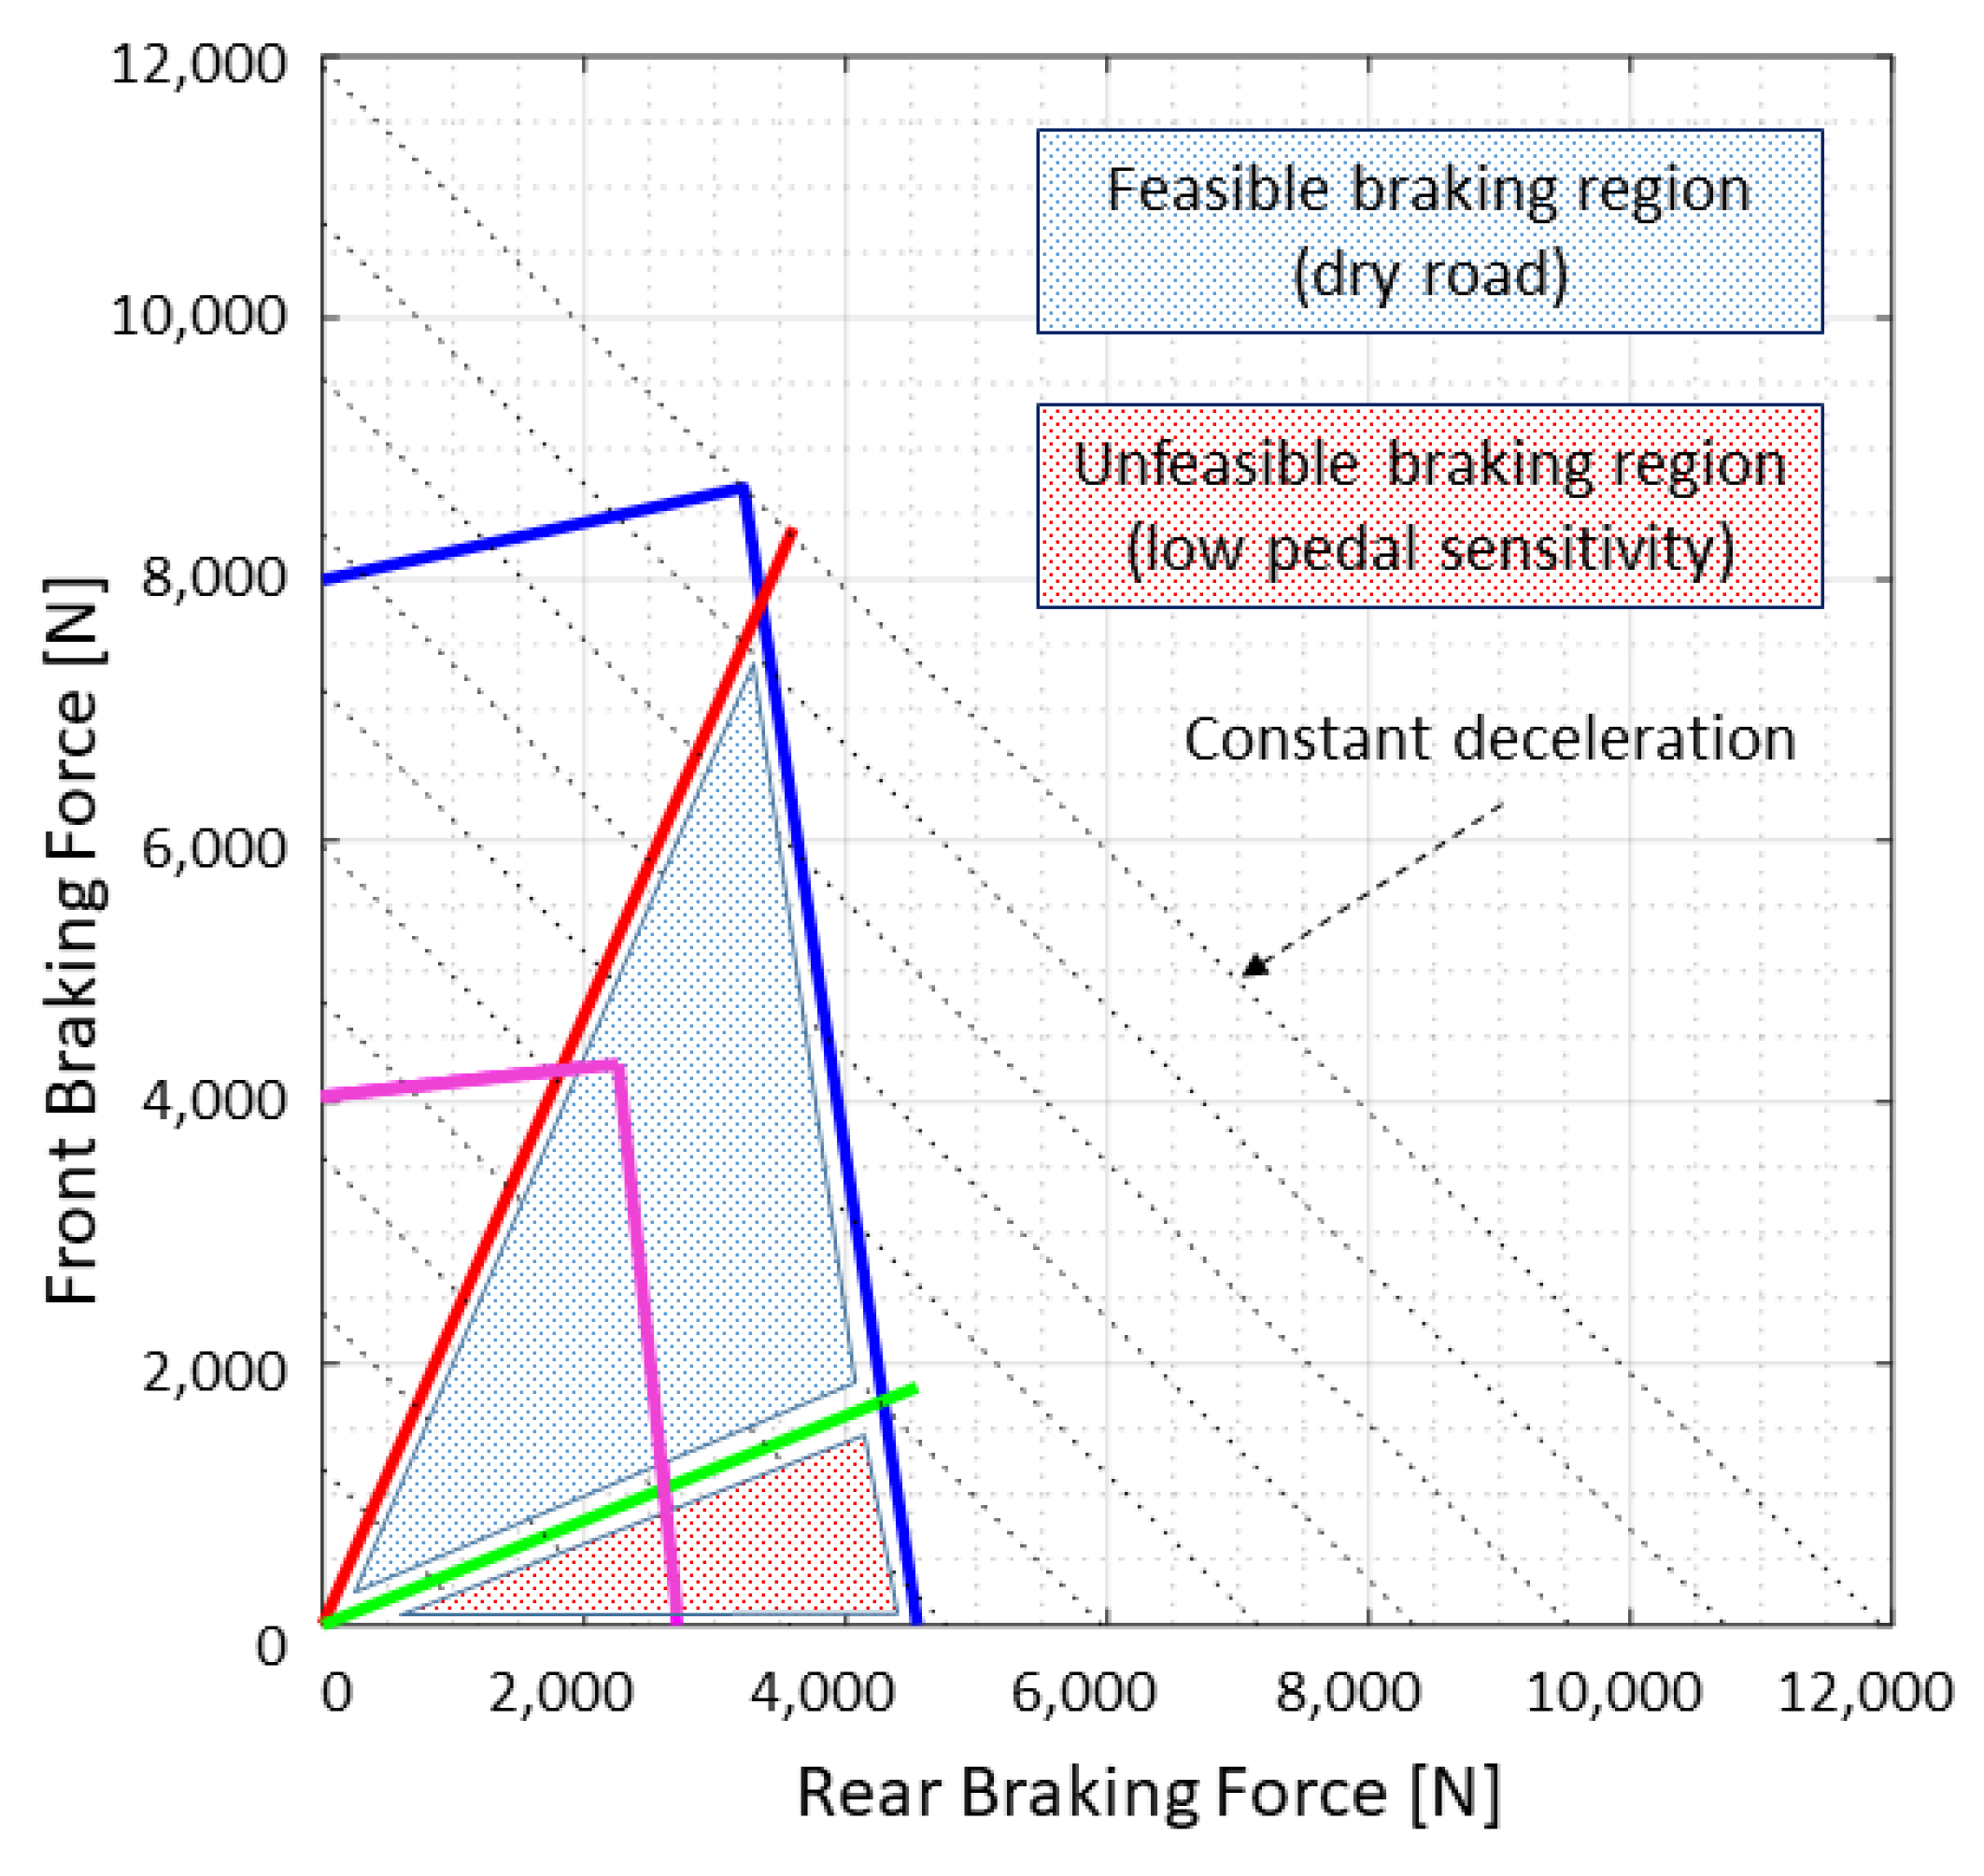
The braking region is presented in Figure 6. Blue lines and purple lines respectively represent the grip limits with dry and wet road. Red lines represent the mechanical braking forces on the front and the rear wheels. Dotted black lines represent the points where the sum of the rear and front braking forces is constant, and also at constant car deceleration (within the region where there is no grip loss). The blue dotted area indicates the region where braking occurs without grip loss. Of course, the maximum energy recovery is achieved when the rear braking force keeps close to the blue line, and the distance between the red and the blue lines is maximum.
It is important to remark that, in case of hybridization of a conventional car, the driver braking command directly acts on the mechanical braking. As a consequence, the electric braking cannot be activated alone, while it adds to mechanical braking, increasing the total braking force and enabling the recovery of only part of the vehicle’s kinetic energy. Therefore, the feasible braking region (dotted blue area) is limited by the green line, which slope is such that a sufficient pedal sensitivity to the driver is kept. This aspect is peculiar for hybridized vehicles, and requires the development of specific techniques to maximize the energy recovery.

3. Optimal Braking Modulation

A numerical study has been carried out in order to check the possible benefits in terms of energy recovery achievable by a proper modulation of the braking force. The simulation of a braking manoeuvre performed via a longitudinal dynamic model has been coupled with a nonlinear constrained optimization tool. A classical second order mathematical algorithm implemented by means of fmincon of Matlab has been used. The problem is formulated in the following way:
min x f ( x )
Subject to the equality constraint:
T ( x ) = t *
where the objective function f(x) is the opposite of the energy recovered to the battery during a braking manoeuvre, x is the vector of the braking forces for a vehicle with initial speed V0 > 0 and final null speed, i.e., until its complete stop (V = 0) and T(x) is the time needed to stop the vehicle, i.e., the duration of the manoeuvre, that is constrained to be equal to an assigned duration t*.
The braking force acting on the vehicle (the sum of braking forces applied to front and rear wheels, including those implemented by the electrical brakes) is associated with the n components of the vector x according to:
F b ( t ) = F b , m a x · x i
where Fb,max represents the maximum applicable braking force for this vehicle and the index i is determined as a function of time t as:
i = f l o o r ( t t * n ) + 1
where n represents the number of steps in which the time interval is divided (8 in the final results, variable from 1 to 10 in others). This equation expresses the relationship between time t during the braking manoeuvre and the index i, varying linearly from 1 to n as t goes from 0 to stopping time t*. In other words, it determines how the n values of vector x (fraction of maximum braking force) are distributed along the time t.
The recovered energy during the manoeuvre is computed by integrating the energy generated by the electric brake Feb, considering the efficiency ηgen of the electric motor during regeneration, i.e., when it is inversely operated. However, we also consider that the recovered energy is saturated to a maximum electric power Peb,max given by the limitations of the electric wheels and by the maximum power flow the batteries can withstand:
f ( x ) = E b a t t = 0 t s t o p min ( F e b ( t ) · r w · ω ( t ) · η g e n ; P e b , m a x ) · d t
Please note that the objective function is defined as the opposite value of the energy recovered. In this way, the minimization of the objective function would correspond to the maximization of the recovered energy.
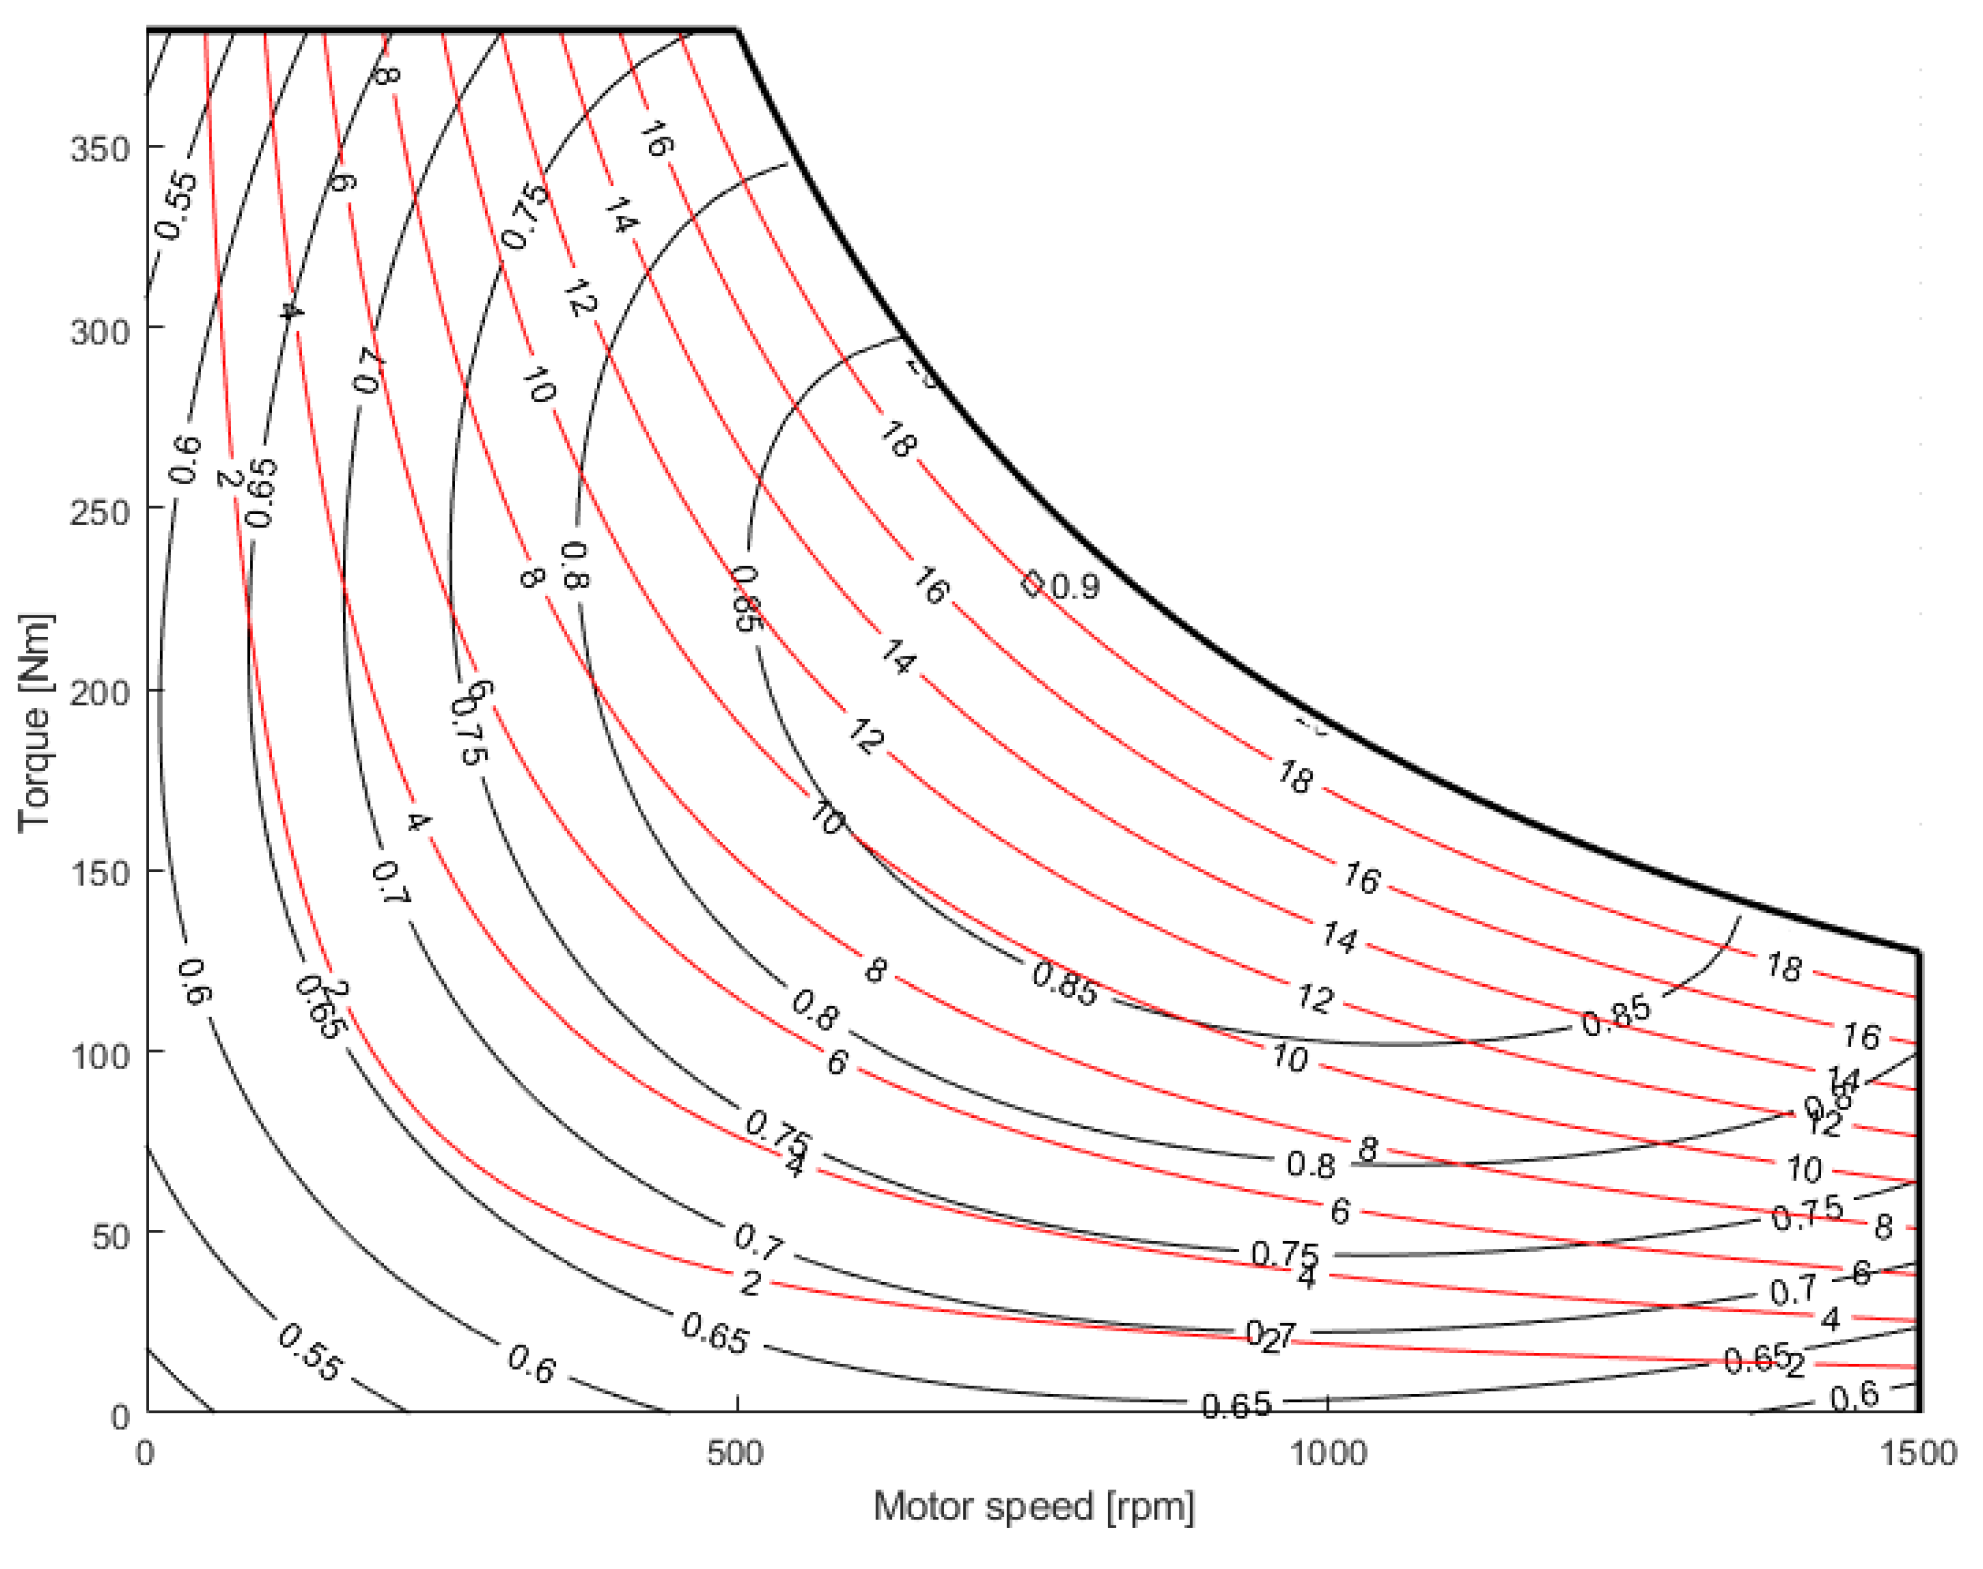
The efficiency ηgen of the electric generator has been modelled as shown in the map reported in Figure 7.
The red line represents the isolevel curves of mechanical power in kW. Please note that torque and power are referred to the sum of the values provided by the two-wheel motors.
The angular wheel speed ω is determined by solving the equation of the longitudinal motion of the vehicle [34] with initial speed V0 > 0 until it stops, subject to aerodynamic resistive effects, rolling resistance, road grade and braking forces:
d V d t = ( 1 2 c x A ρ V 2 + f 0 M v g c o s ( α ) + M v g s i n ( α ) + F b ) M e q
The electric braking force Feb is a fraction β of the total braking force Fb, determined as a function of total braking force Fb and of the coefficient of friction μ * , according to the feasible braking region (Figure 6):
β = f ( F b ,   μ * )

4. Results

Numerical results have been obtained for the vehicle whose features are presented in Table 1.
A first set of results shows the benefits in terms of recovered fraction of the vehicle kinetic energy achieved by modulating the braking force, with 1 to 10 steps.
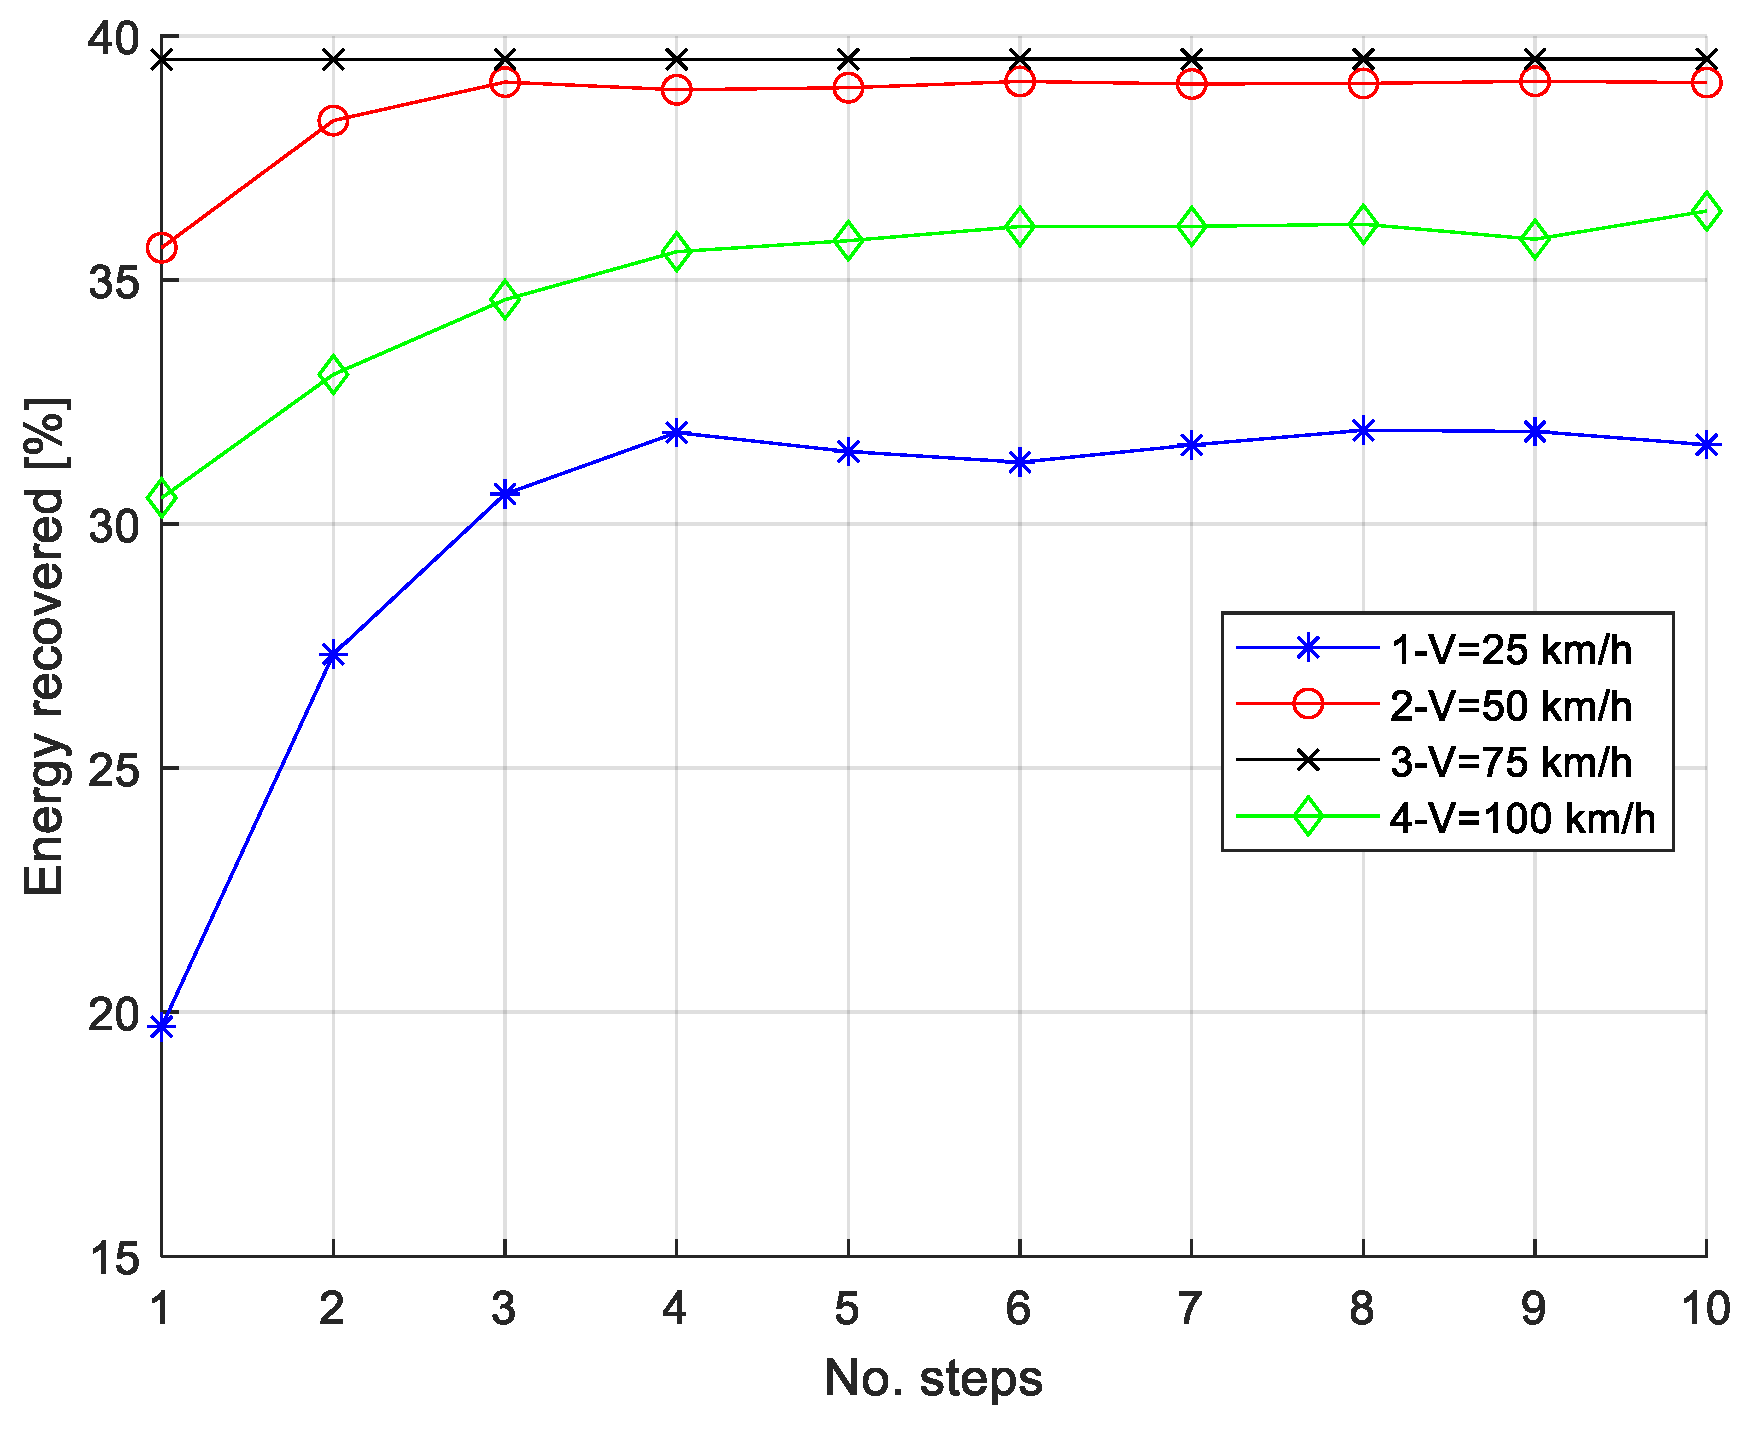
Figure 8 reports the results obtained with a stopping time of 20 s, for increasing initial vehicle’s speeds, from 25 km/h to 100 km/h. It can be observed that when the initial speed is 25 km/h, and the vehicle’s kinetic energy is the lowest among the other cases, increasing the number of steps is beneficial since the recovered energy increases correspondingly from the 20% achieved with just one step to roughly the 32% with a number of steps equal to or greater than 4. Instead, the best case in terms of recovered energy is at an initial speed of 75 km/h, with a recovered energy close to the 40% of the total available kinetic energy, irrespective of the number of steps. That is, in this case, there is no benefit in modulating the braking force. However, the simulations also show that in general 4 or 5 steps are necessary in order to obtain the maximum possible regeneration, while any further increase does not provide significant improvements. Few oscillations of the results are due to numerical approximations of the optimization process.
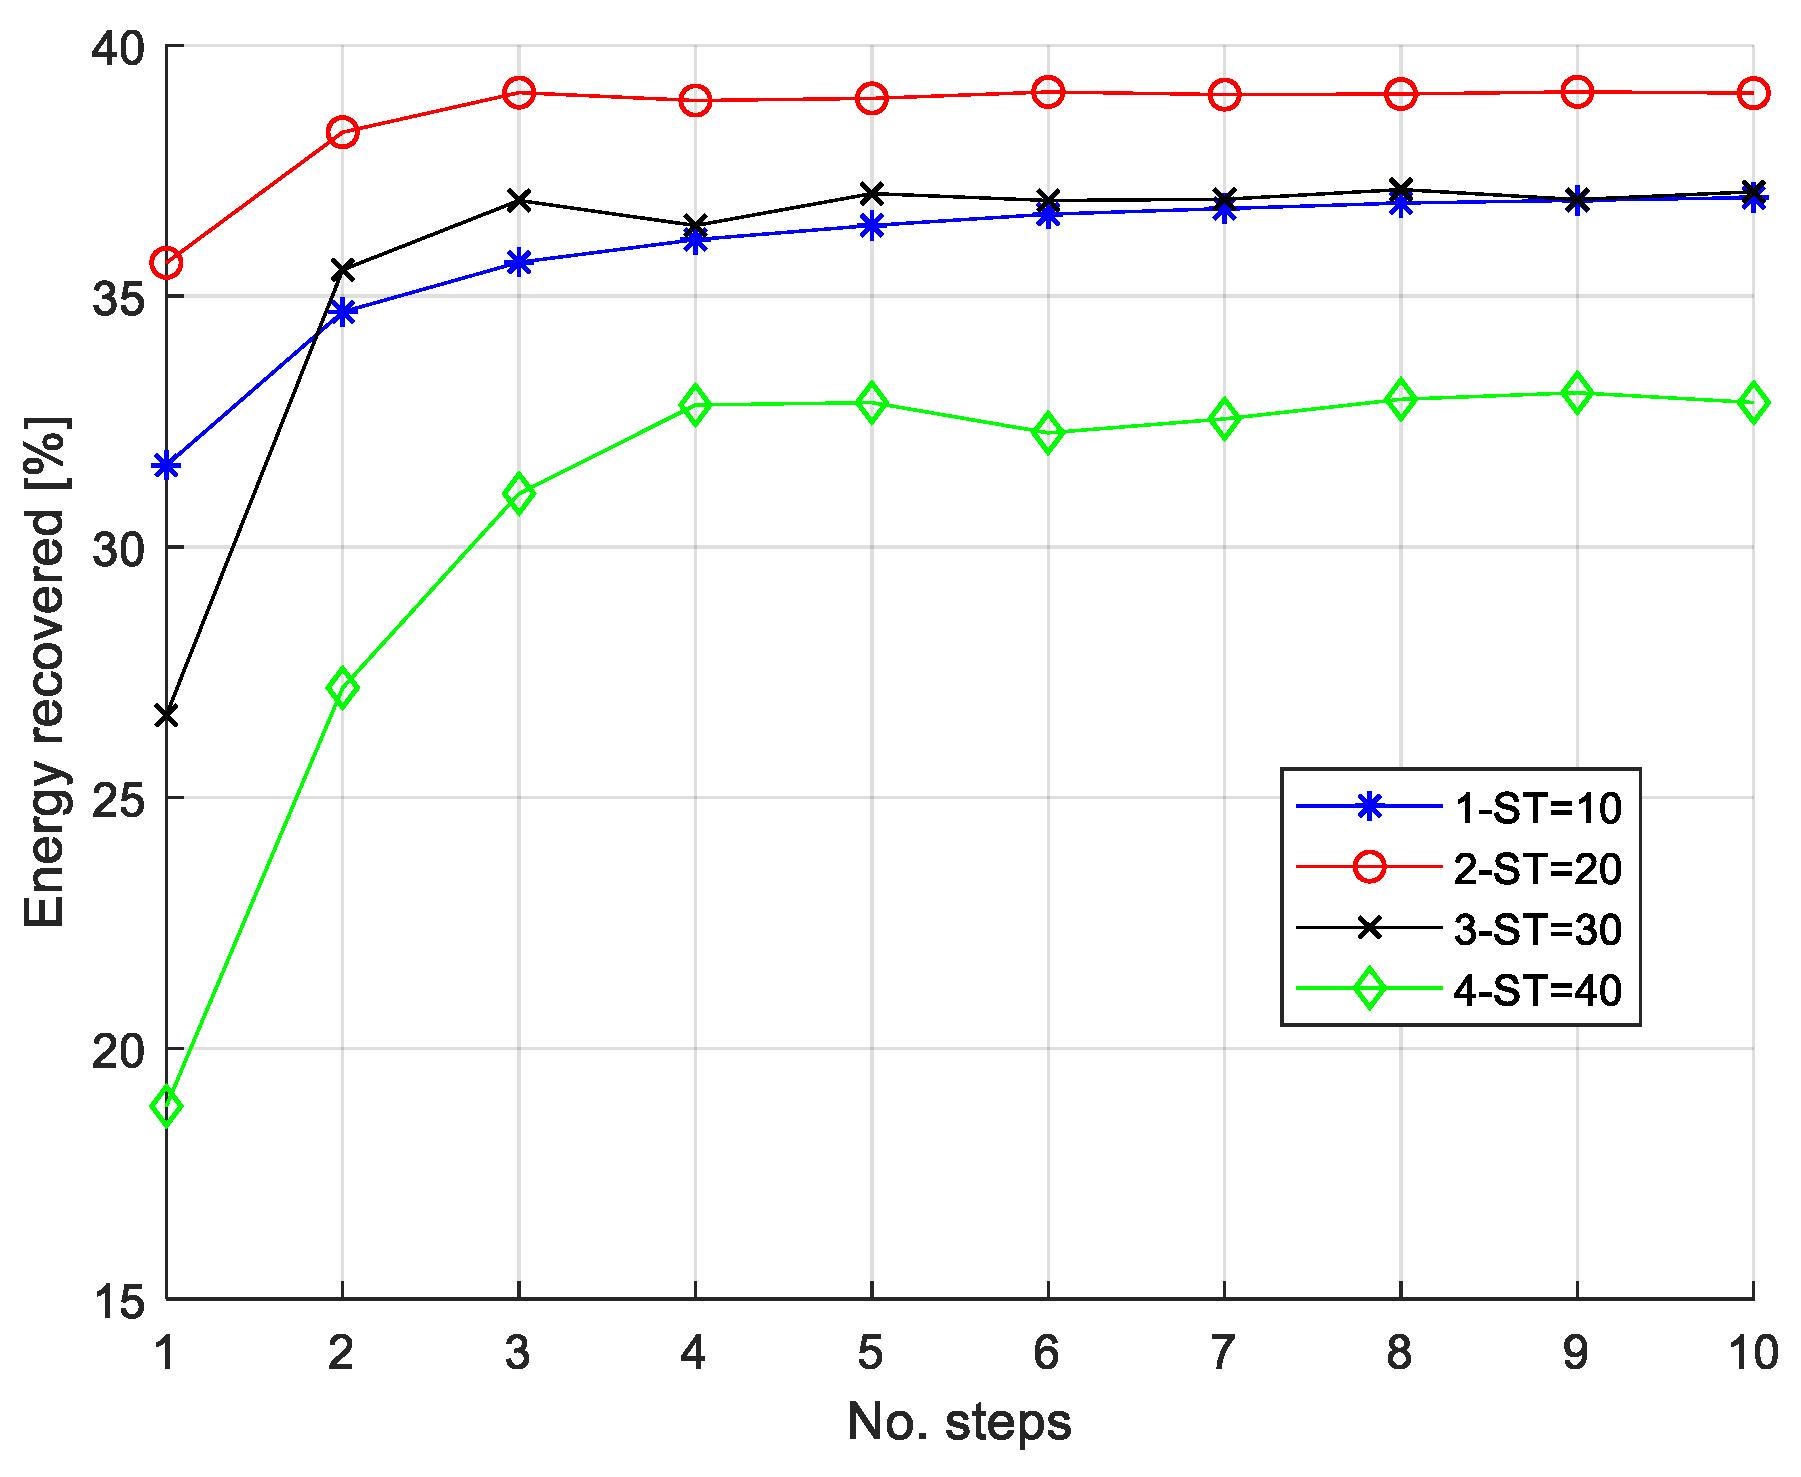
Figure 9 and Figure 10 report the simulation outcomes, respectively, for 50 km/h and 75 km/h, initial speeds and stopping times from 10 to 40 s. The results show that, in both cases, the recovered energy depends upon the stopping time and that the benefits of the braking modulation can have a strong impact, particularly for non-optimal stopping times, i.e., for those which imply a non-maximum energy recovery.
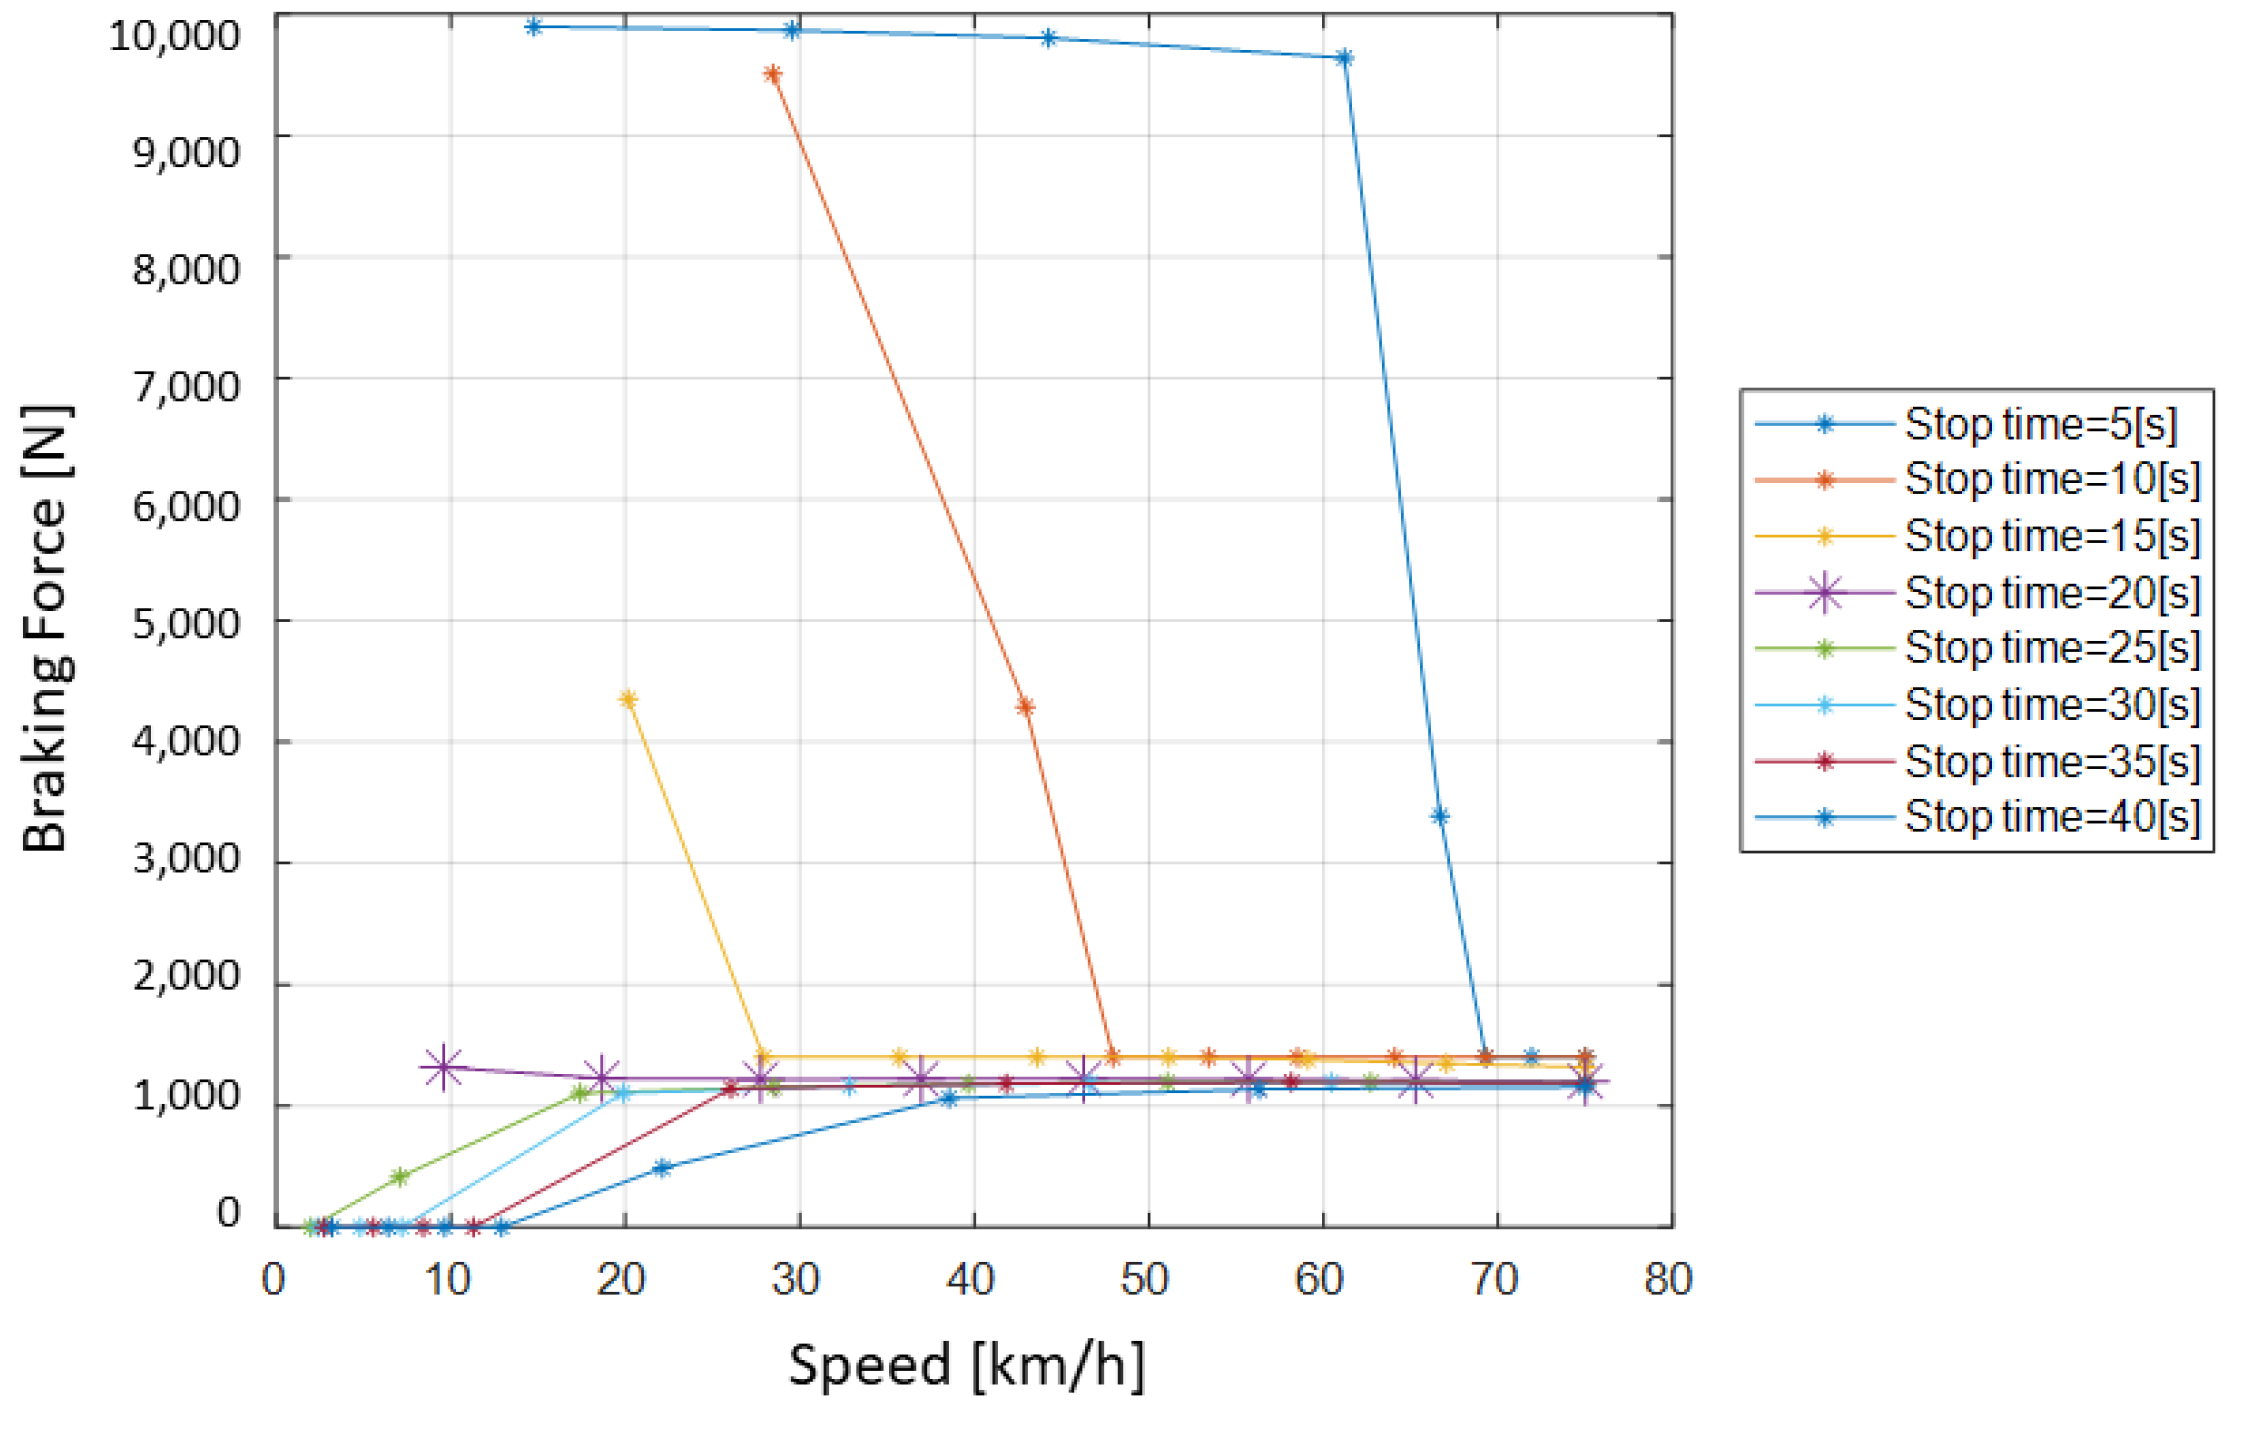
Figure 11 shows the simulations when the braking force is modulated in 8 steps and reports the braking forces vs the vehicle’s speed for different stopping times and 75 km/h initial speed. It can be observed that when the stopping time is set to 20 s, the braking force remains constant roughly at 1200 N along the entire speed range (large purple star). When a more severe braking is required by setting stopping times lower than 20 s, the braking force is increased as long as the speed decreases, while for moderate to mild braking manoeuvres, it decreases toward zero since the deceleration is due to aerodynamic and rolling passive forces.
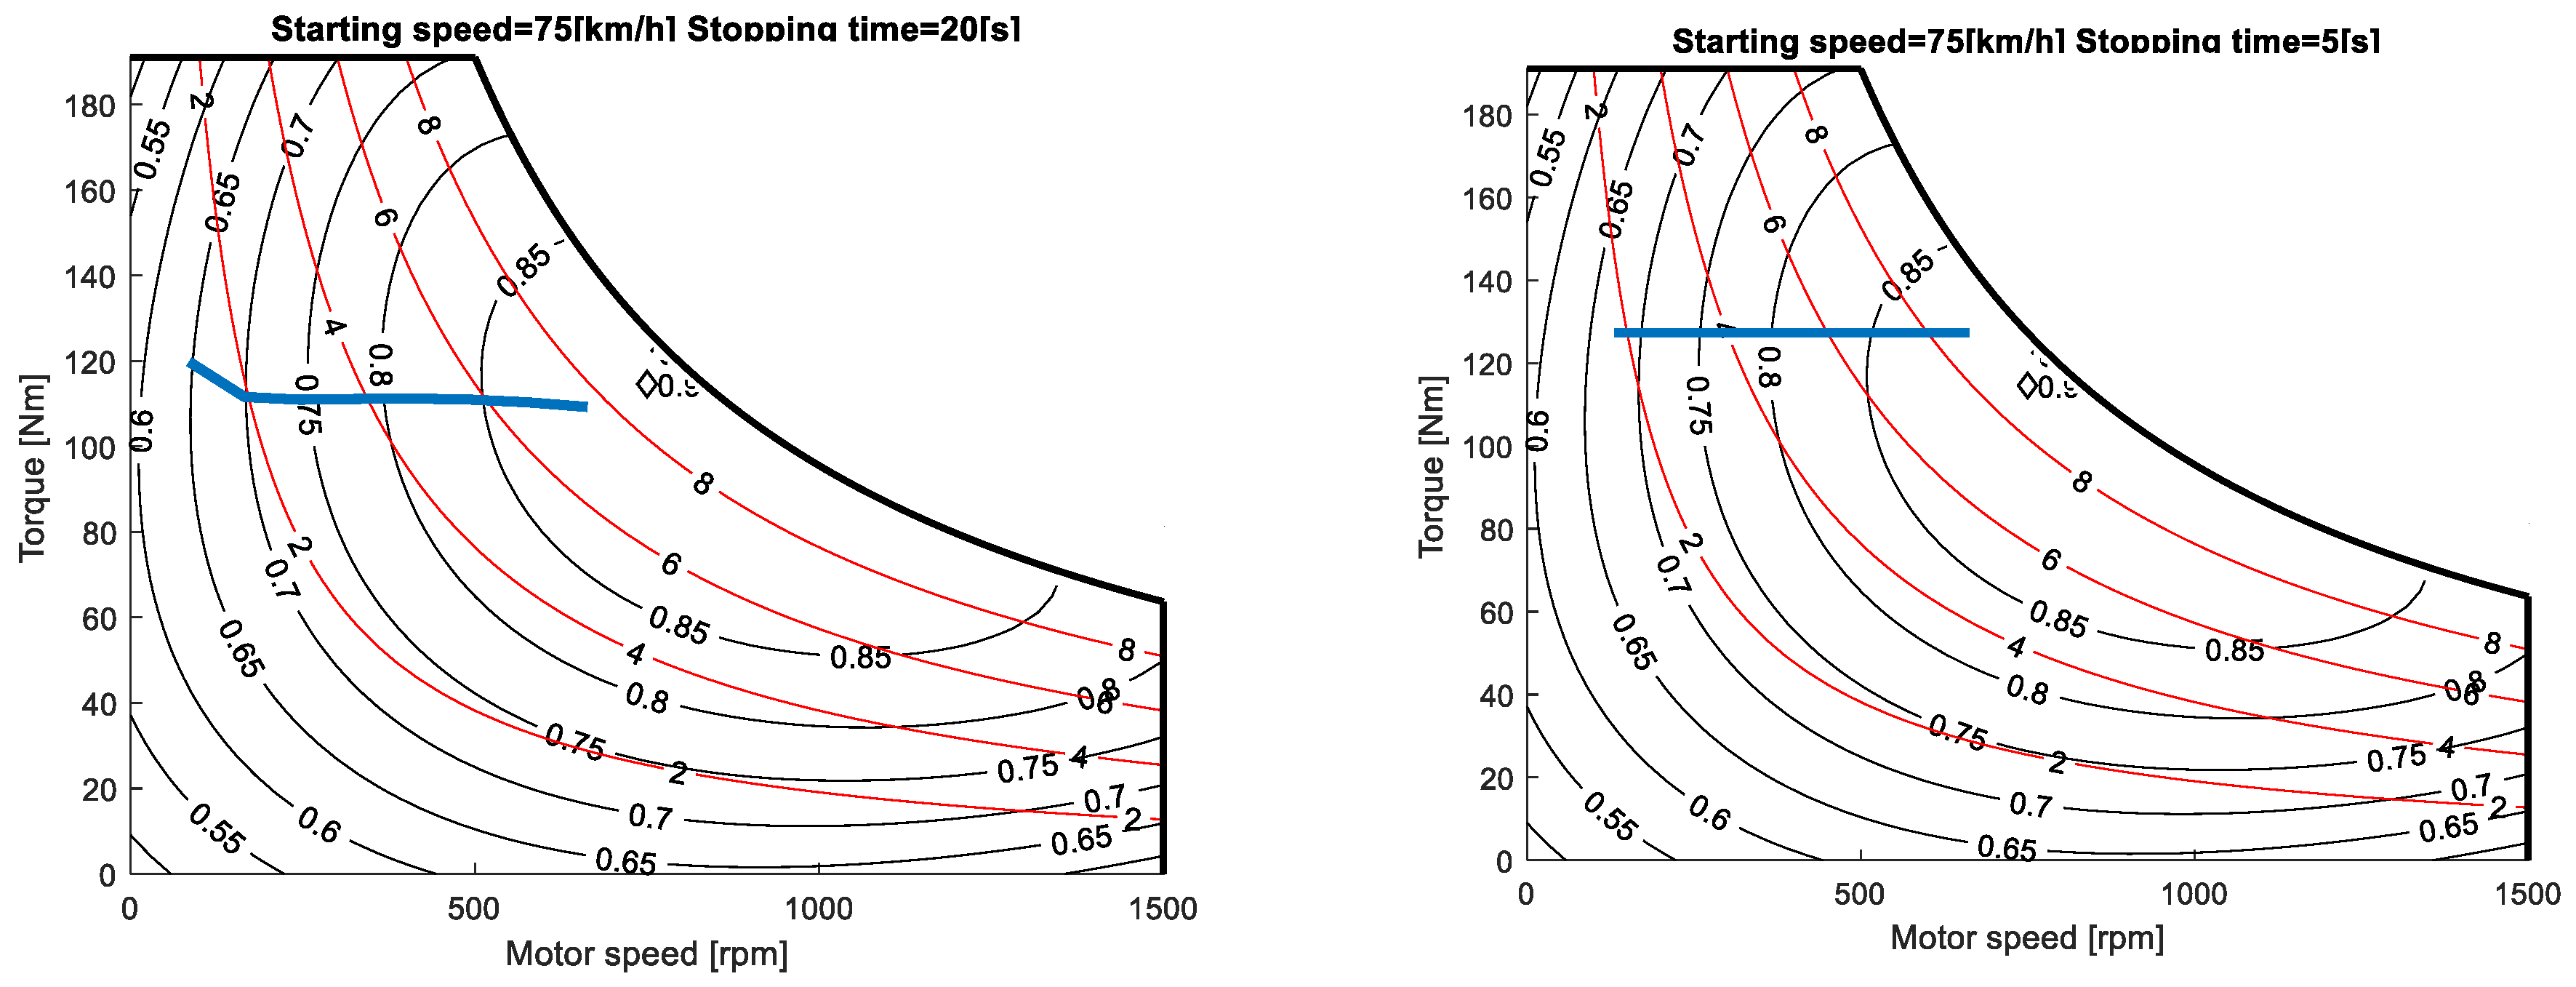
Two conditions, referring to the optimal and to the most severe braking manoeuvre are shown in Figure 12, where the braking forces are reported for two different scenarios, along with the feasible braking regions for two different grip coefficients, dry (bright solid blue lines) and wet (bright solid magenta lines). Further, in both plots, the mechanical braking loci are identified by the red solid line, while the limit hybrid braking loci are identified by the green solid line, and red stars indicate the hybrid braking initial values. Comparing the two cases shown in Figure 12, it can be observed that braking force remains constant when the stopping time is 20 s (Left), while it increases parallel to the red line, keeping the electric braking constant when severe braking is needed. The two conditions are also reported on the electric generator efficiency maps (Figure 13), where it can be noticed that the electrical efficiency decreases during the braking manoeuvre as vehicle speed and motor speed decrease.
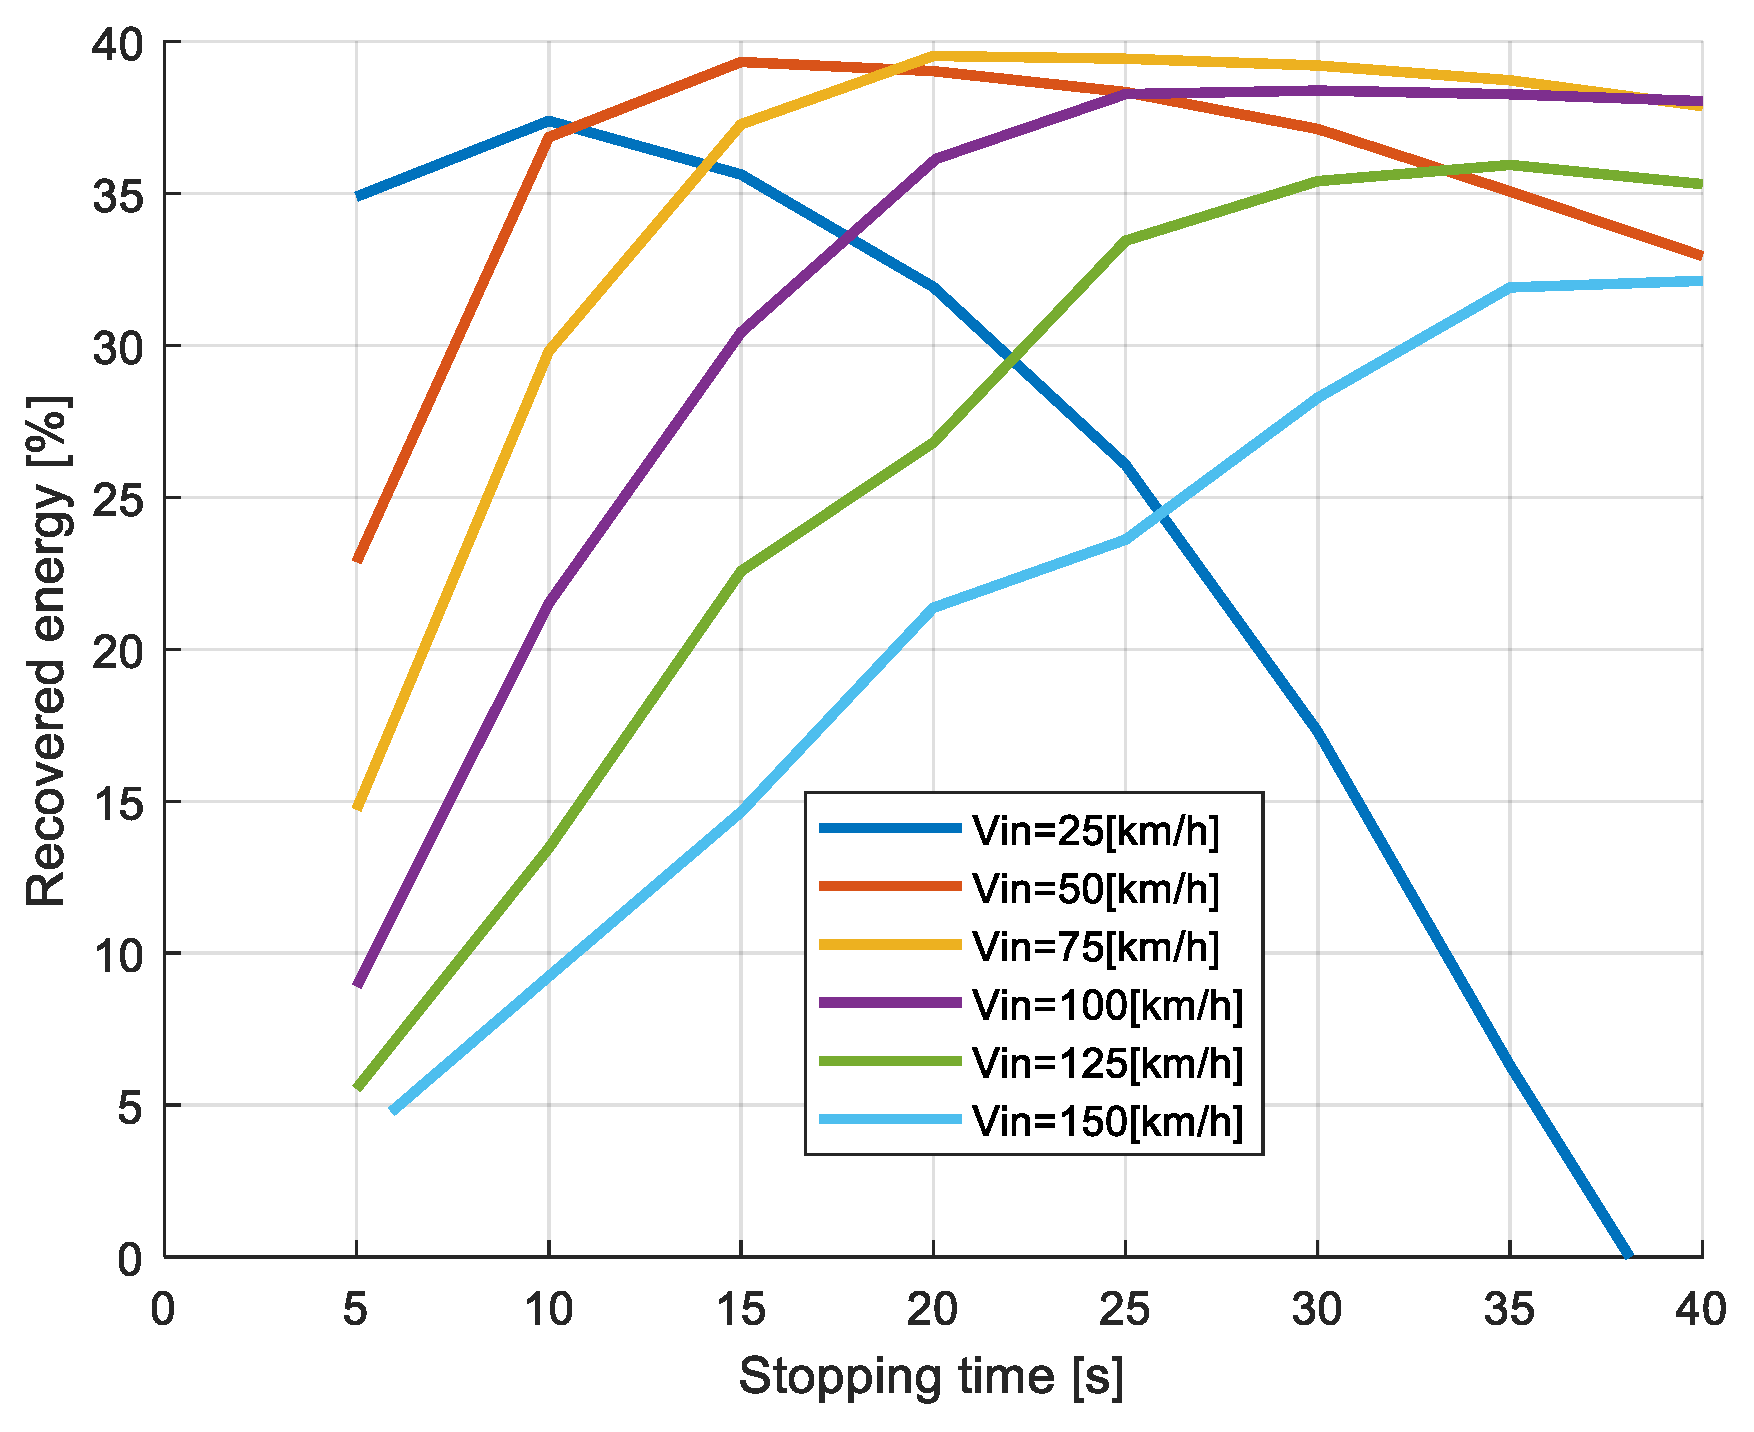
The next graphs present the whole set of results at various starting speeds and stopping times. Figure 14 shows the fraction of recovered energy, in percent with respect to the vehicle kinetic energy. It can be observed that best energy recovery is achieved as a compromise between two conditions: when braking is too intense, the contribution of electric brakes is low because braking occurs in the upper part of the braking region (Figure 6). Conversely, when braking action is too low, most of the vehicle energy is dissipated by passive forces: this result is evident at starting speed of 25 km/h, where energy recovery reaches its maximum value at stopping time of 10 s and falls to zero when stopping time is increased to about 38 s. The same trend can also be observed at other speeds. The maximum recovery (about 40%) can be reached at intermediate starting speeds, from about 50 km/h to 100 km/h, while at higher speeds, the increasing aerodynamic losses tend to reduce the recovered energy. The second graph (Figure 15) reports the braking distance for the cases analysed, evidencing the conditions of best energy recovery for each starting speed. The black points show that the best recovery is achieved at intermediate braking distances for each starting speed. Optimal braking distances range from a few meters, at 25 km/h, to about 1 km, at 150 km/h.
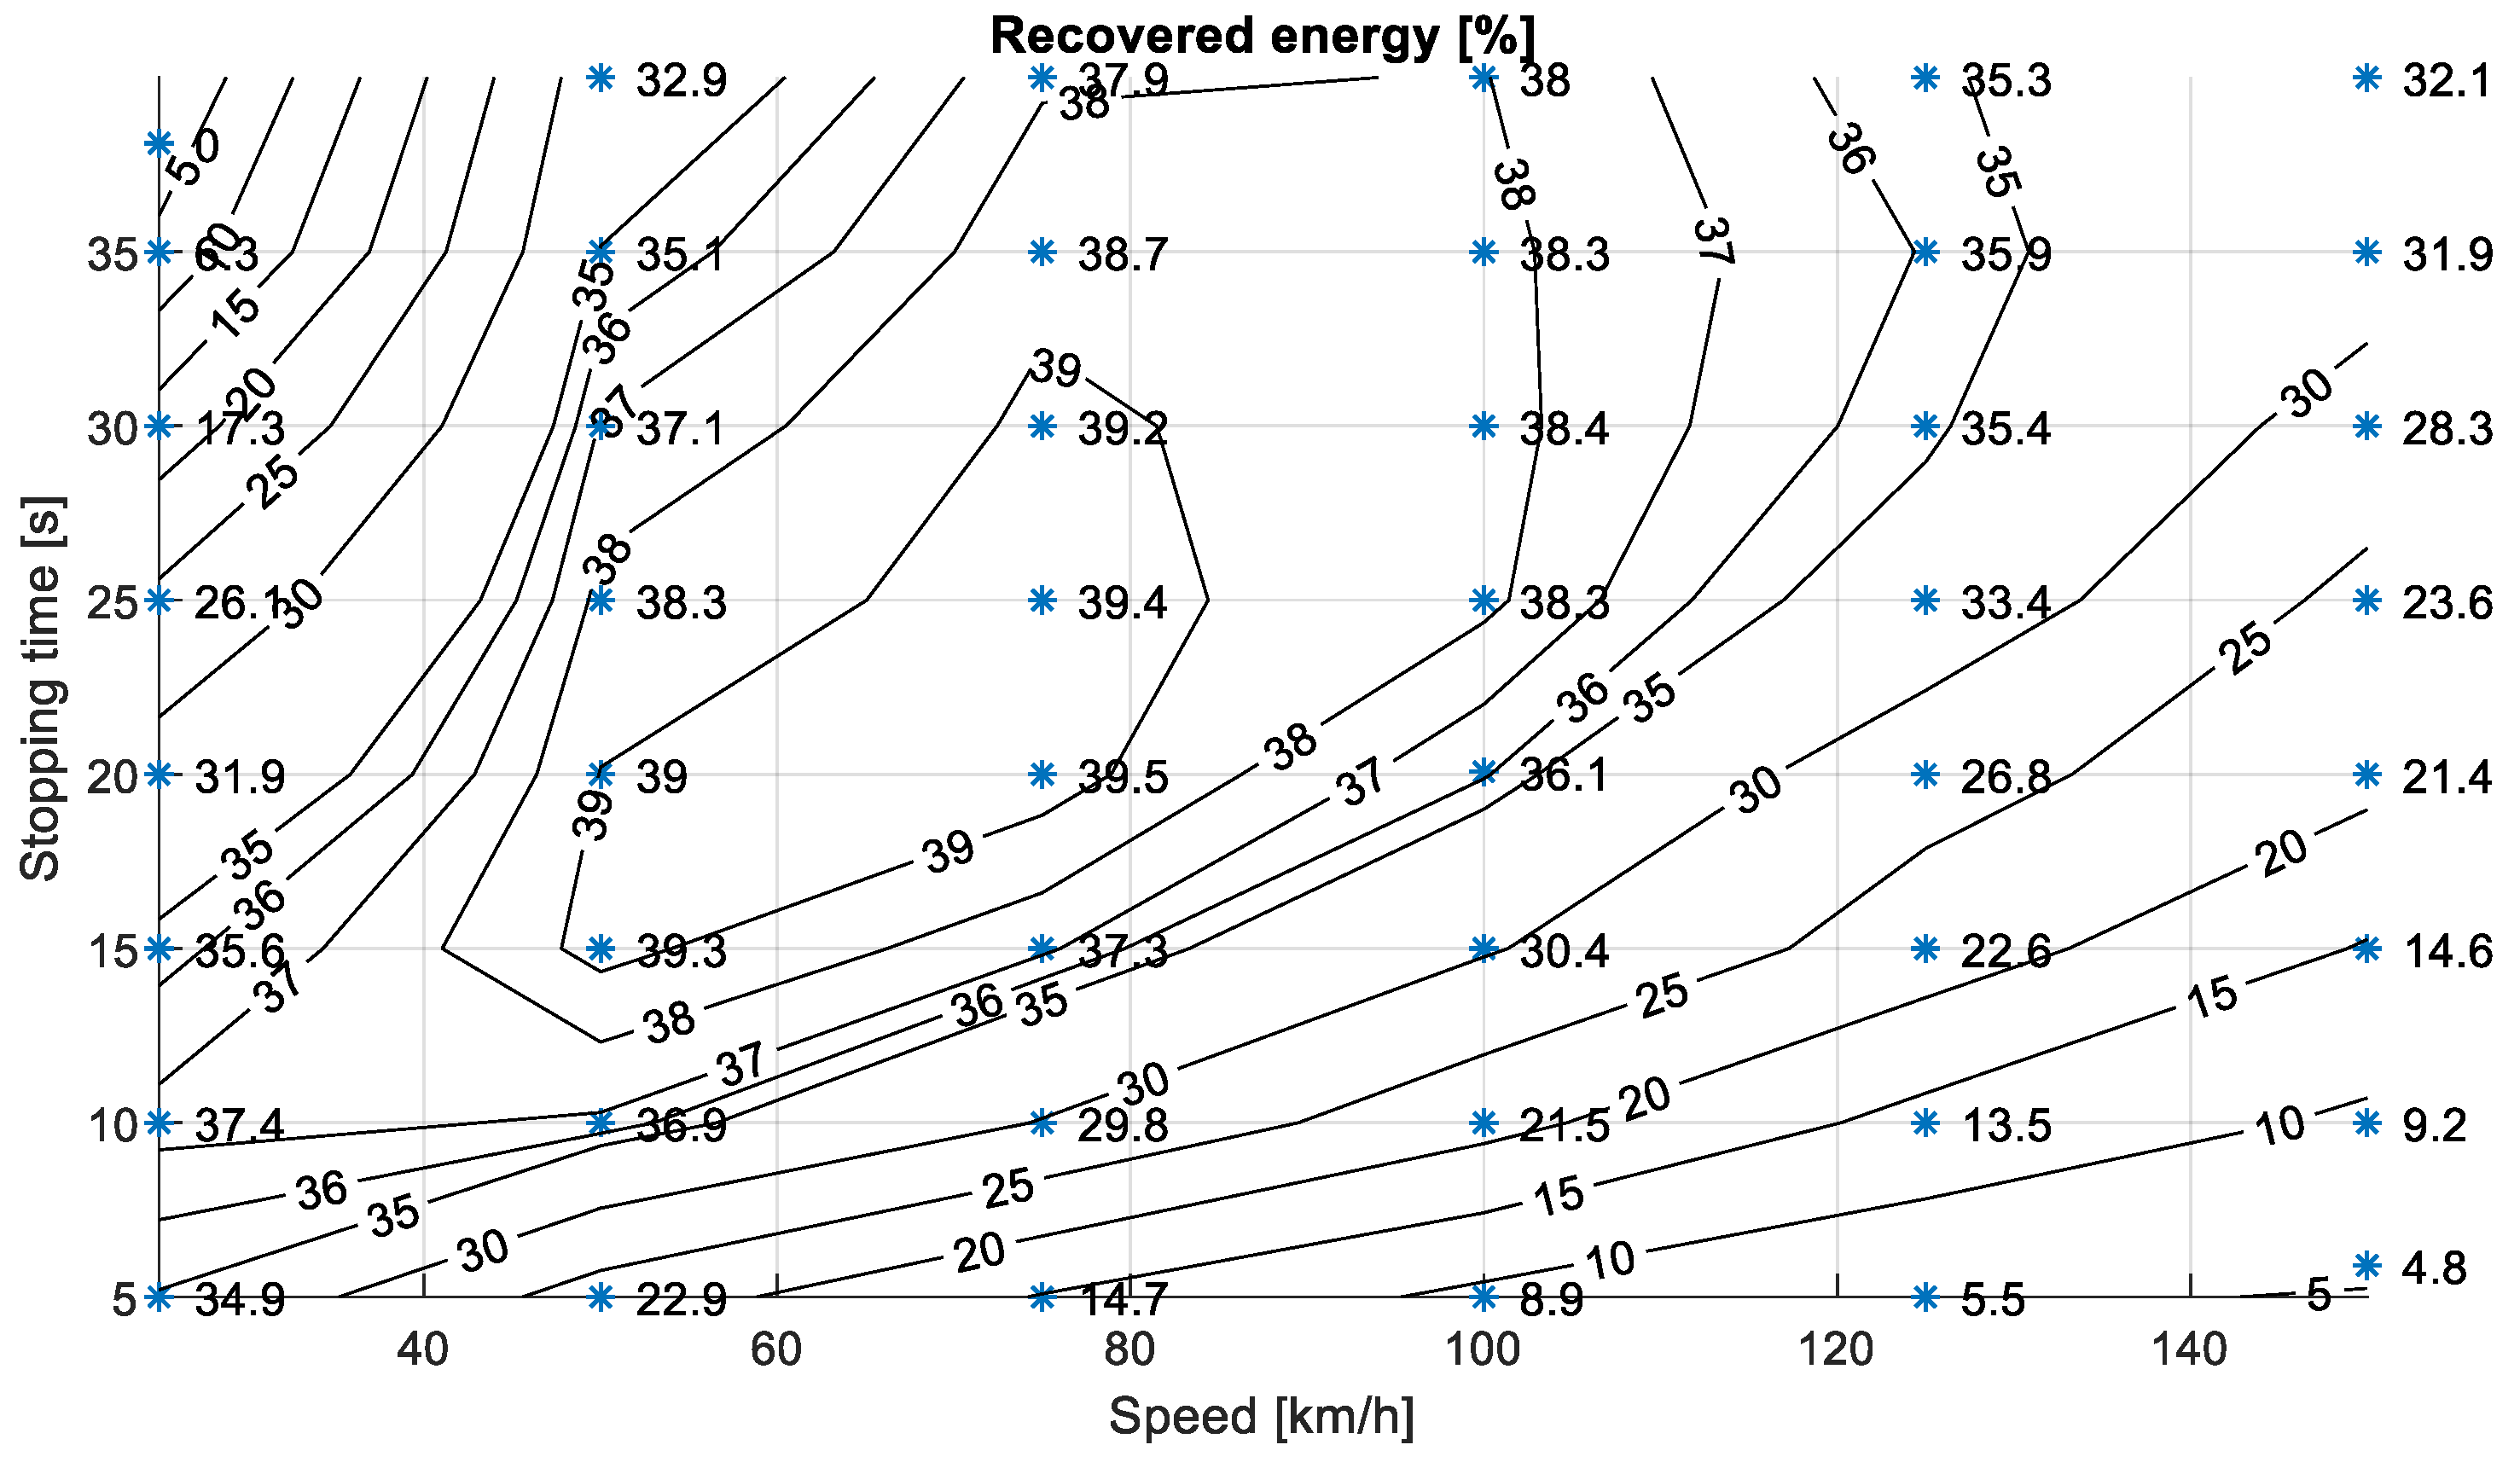
In Figure 16 an overall view of all the results, in terms of percent of vehicle kinetic energy recovered, is presented, as a function of the starting speed and the stopping time. The iso-level curves for the recovered energy are also plotted. This graph has been obtained by modulating the braking manoeuvre in 8 steps. The set of results refers to vehicles whose features are summarized in Table 1, considering a maximum recoverable power equal to 20 kW. In this case, the maximum percent of the vehicle kinetic energy that can be recovered to the battery is about 40%.
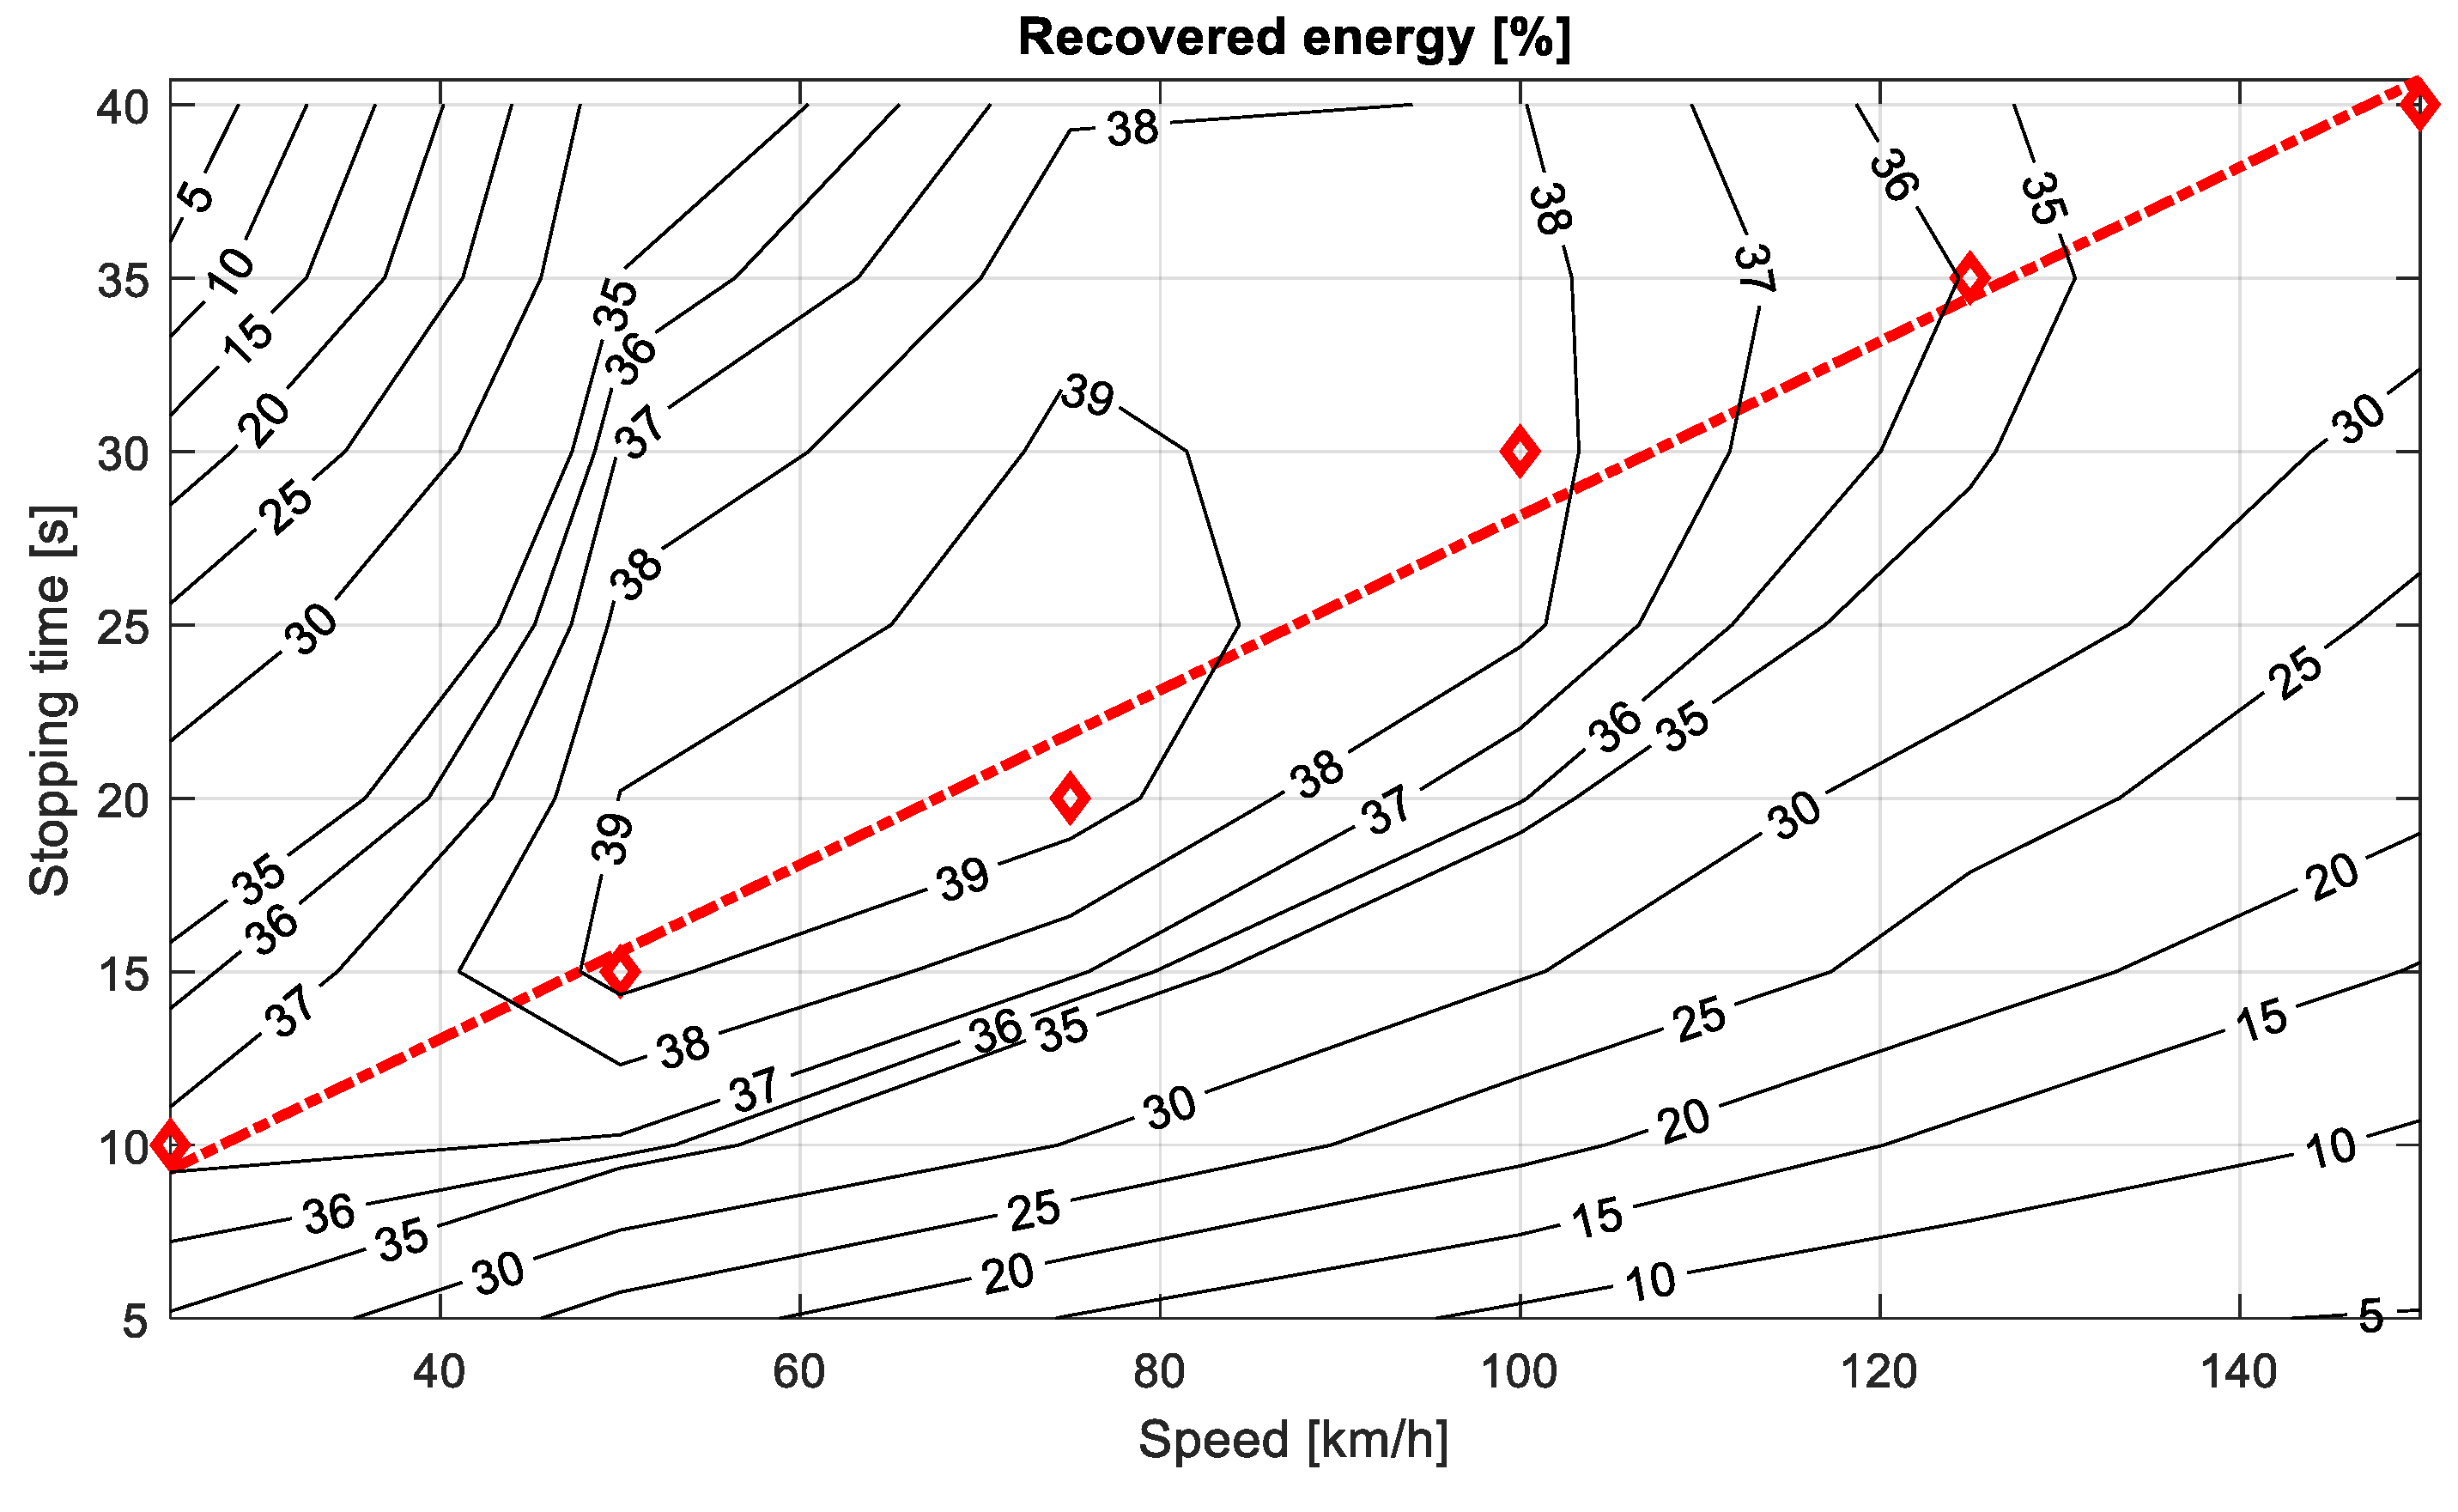
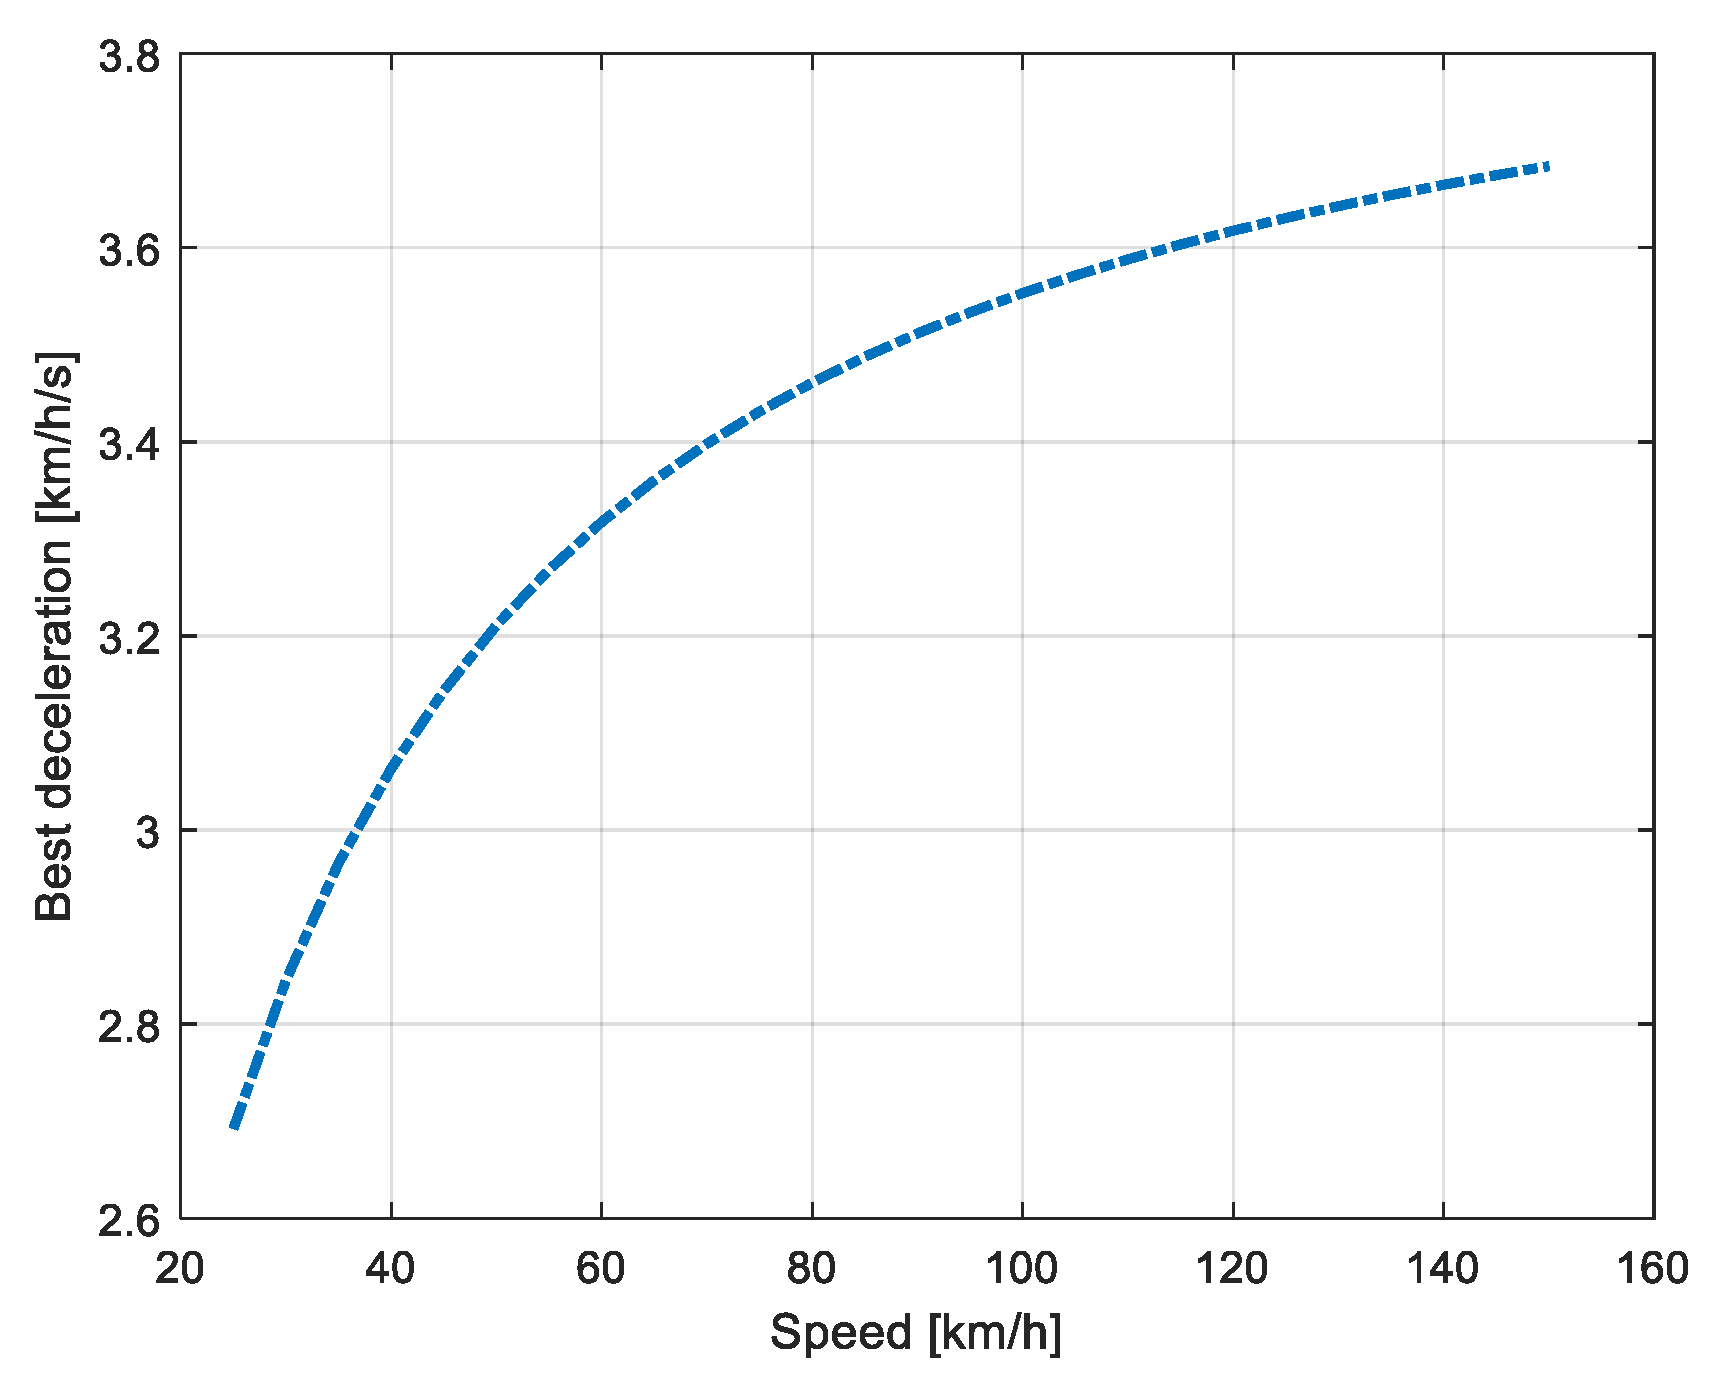
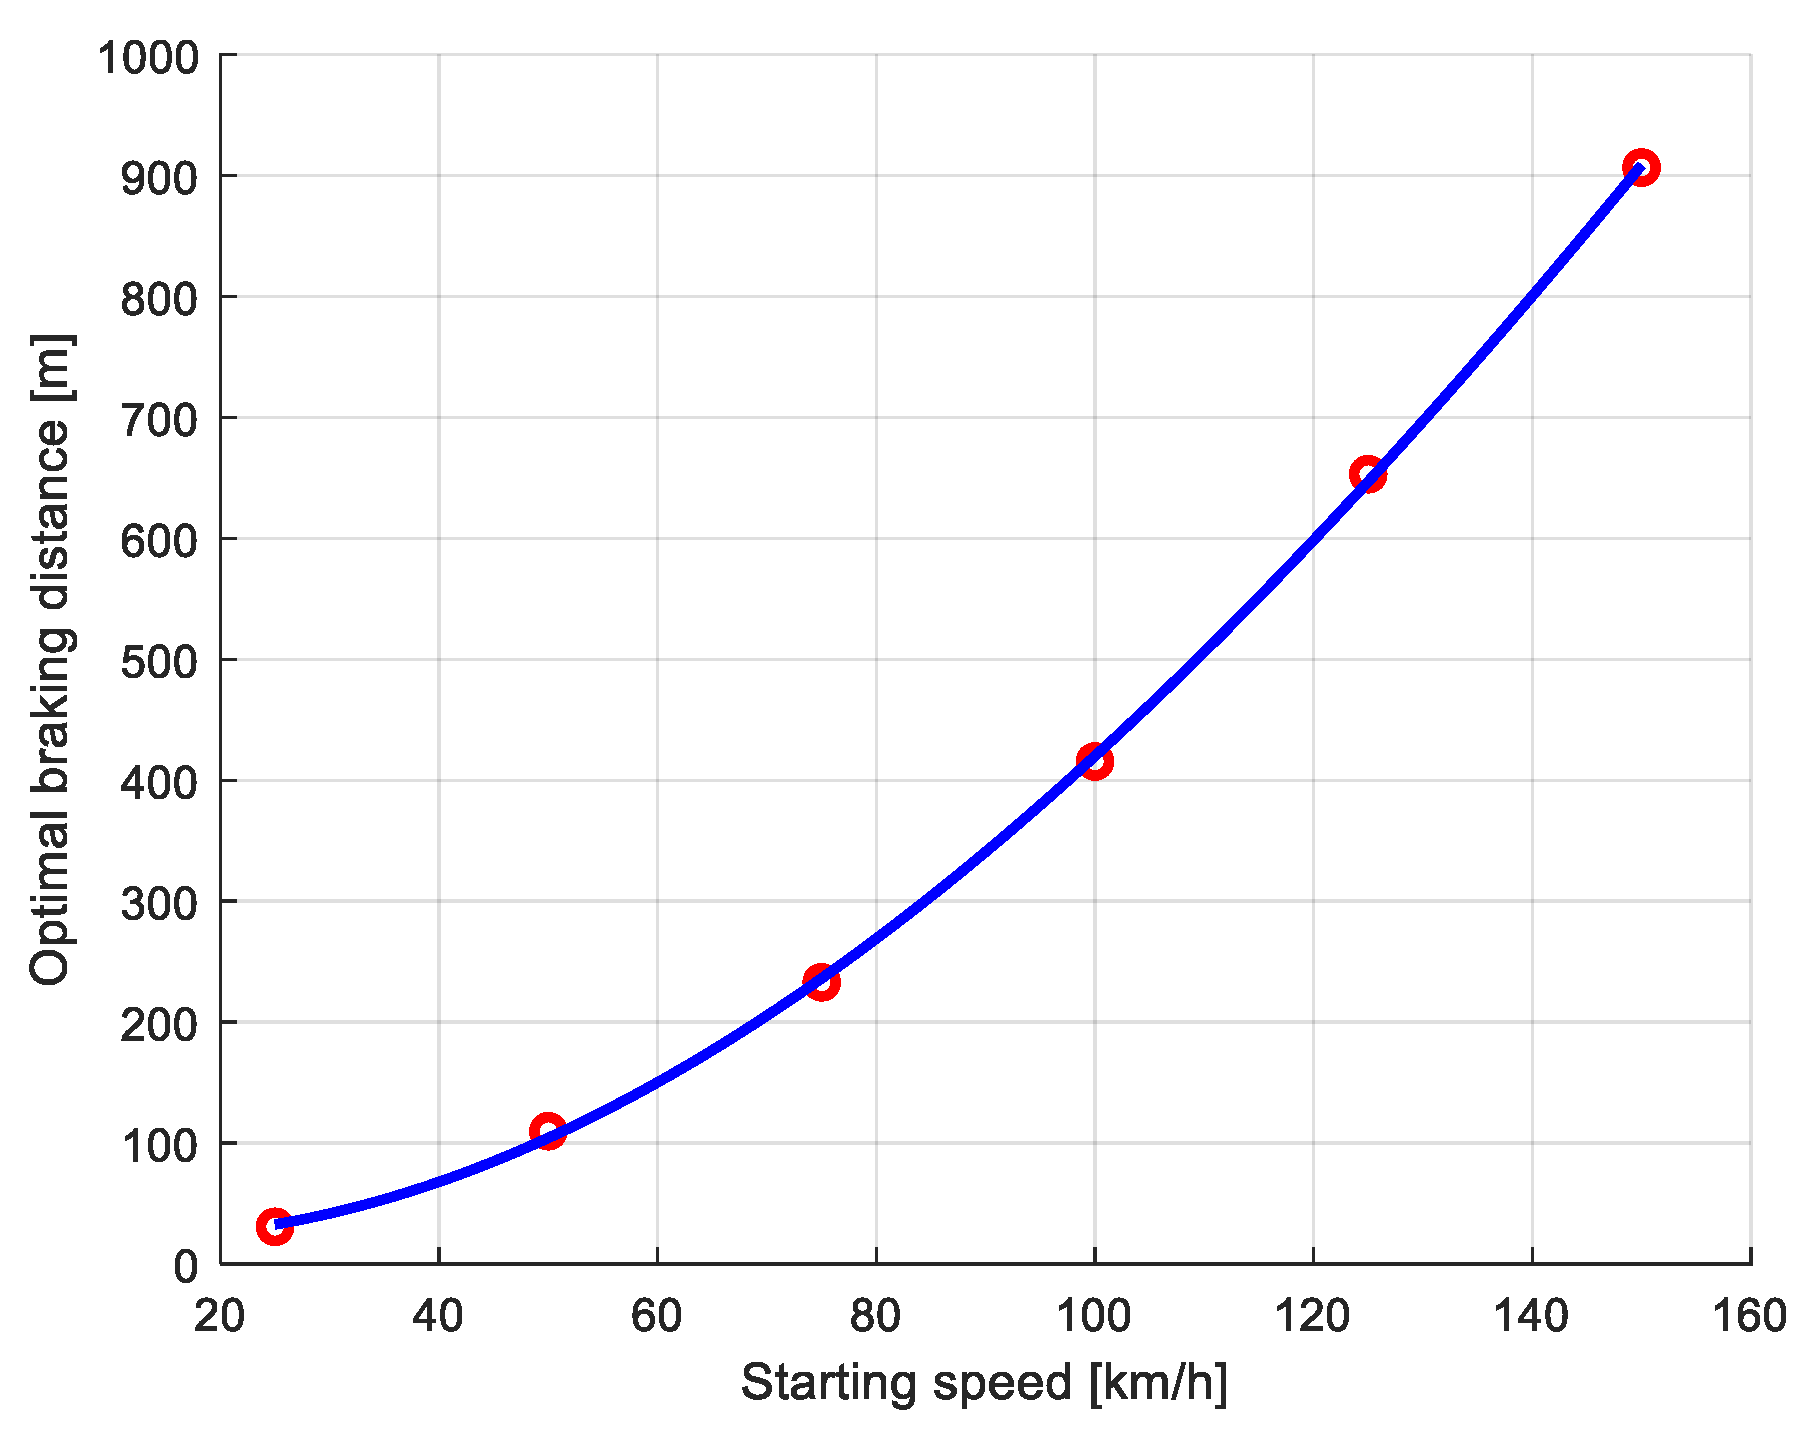
The red dotted line approximates the best conditions for each speed (Figure 17). It can be observed that there is an almost linear relationship between the best stopping time and the starting speed. The best conditions correspond to a deceleration ranging from 2.7 to 3.7 km/h per second, as shown in Figure 18, while in Figure 19, the optimal braking distance for each starting speed is presented. This is useful for possible application in a real-time control framework in determining the best braking intensity for a given starting speed to achieve the maximum energy recovery.
Finally, it has to be remarked that the knowledge of the grip coefficient is a prerequisite of the presented model. There are a number of papers presenting methods to estimate the grip coefficient on vehicles, also in real-time [35,36,37]. Moreover, an indirect detection of grip limit can be achieved by monitoring the operation of the ABS, and/or by processing the high-frequency data on wheel angular speed to verify the occurrence of skidding conditions. This information, available on the prototype of the hybridized car and on most of cars, can be used as a feedback variable by the control algorithm to assess the estimation of the grip limit.

5. Conclusions

Energy recovery during braking in hybridized vehicles with TTR architecture could be hindered by several factors related to the simultaneous occurrence of the mechanical braking, to the prevailing braking on front axle, where electrical brakes are absent, and to limitations due to maximum electric power and current incoming in the battery pack.
The results presented in the paper show that a quite remarkable fraction of the vehicle kinetic energy can be recovered with proper optimal management and modulation of the braking force, even considering the constraints posed by the vehicle architecture. In the best conditions, the recovery can reach about 40% of the vehicle energy, selecting the best deceleration at each speed and proper modulation, and with a realistic estimate of the grip coefficient.
Further studies are needed to develop MPC (Model Predictive Control) schemes for the implementation onto a prototype hybridized vehicle to validate the proposed technique on road tests.

Author Contributions

Conceptualization, G.R.; Data curation, M.M.; Formal analysis, F.A.T. and Valerio Mariani; Funding acquisition, G.R. and M.M; Methodology, G.R. and V.M.; Project administration, M.M; Software, G.R. and F.A.T.; Writing—original draft, G.R., F.A.T., Valerio Mariani and M.M. All authors have read and agreed to the published version of the manuscript.

Funding

This study is supported by a grant from the European Union (LIFE-SAVE, Solar Aided Vehicle Electrification, LIFE16 ENV/IT/000442), www.life-save.eu, accessed on 1 October 2021.

Institutional Review Board Statement

Not applicable.

Informed Consent Statement

Not applicable.

Data Availability Statement

Not applicable.

Conflicts of Interest

The authors declare no conflict of interest.

References

  1. Masson-Delmotte, V.; Zhai, P.; Pörtner, H.-O.; Roberts, D.; Skea, J.; Shukla, P.R.; Pirani, A.; Moufouma-Okia, W.; Péan, C.; Pidcock, R.; et al. Global Warming of 1.5 °C. In An IPCC Special Report on the Impacts of Global Warming of 1.5 °C above Pre-Industrial Levels and Related Global Greenhouse Gas Emission Pathways, in the Context of Strengthening the Global Response to the Threat of Climate Change, Sustainable Development, and Efforts to Eradicate Poverty; IPCC: Geneva, Switzerland, 2018. [Google Scholar]
  2. European Environment Agency. Electric Vehicles from Life-cycle and Circular Economy Perspectives. EEA Rep. 2018, 2, 25. [Google Scholar]
  3. Guzzella, L.; Sciarretta, A. Vehicle Propulsion Systems—Introduction to Modeling and Optimization; Springer: Berlin/Heidelberg, Germany, 2013. [Google Scholar]
  4. Suntharalingam, P. Kinetic Energy Recovery and Power Management for Hybrid Electric Vehicles. Ph.D. Thesis, Cranfield University, Bedford, UK, 2011. [Google Scholar]
  5. Li, W.; Du, H.; Li, W. Driver Intention Based Coordinate Control of Regenerative and Plugging Braking for Electric Vehicles with In-wheel PMSMS. IET Intell. Transp. Syst. 2018, 12, 1300–1311. [Google Scholar] [CrossRef] [Green Version]
  6. Ko, J.; Ko, S.; Son, H.; Yoo, B.; Cheon, J.; Kim, H. Development of Brake System and Regenerative Braking Cooperative Control Algorithm for Automatic-Transmission-Based Hybrid Electric Vehicles. IEEE Trans. Veh. Technol. 2014, 64, 431–440. [Google Scholar] [CrossRef]
  7. Nian, X.; Peng, F.; Zhang, H. Regenerative Braking System of Electric Vehicle Driven by Brushless DC Motor. IEEE Trans. Ind. Electron. 2014, 61, 5798–5808. [Google Scholar] [CrossRef]
  8. Mutoh, N.; Hayano, Y.; Yahagi, H.; Takita, K. Electric Braking Control Methods for Electric Vehicles With Independently Driven Front and Rear Wheels. IEEE Trans. Ind. Electron. 2007, 54, 1168–1176. [Google Scholar] [CrossRef]
  9. Wyczalek, F.A.; Wang, T.C. Regenerative Braking Concepts for Electric vehicles—A Primer in SAE Technical Paper, Society of Automotive Engineers; SAE International: Detroit, MI, USA, 1992. [Google Scholar]
  10. Vodovozov, V.; Raud, Z.; Petlenkov, E. Review on Braking Energy Management in Electric Vehicles. Energies 2021, 14, 4477. [Google Scholar] [CrossRef]
  11. Jamadar, N.M.; Jadhav, H.T. A review on braking control and optimization techniques for electric vehicle. Proc. Inst. Mech. Eng. Part D J. Automob. Eng. 2021, 235, 2371–2382. [Google Scholar] [CrossRef]
  12. Kumar, N.; Subramanian, S. Cooperative control of regenerative braking and friction braking for a hybrid electric vehicle. Proc. Inst. Mech. Eng. Part D J. Automob. Eng. 2016, 230, 103–116. [Google Scholar] [CrossRef]
  13. Maia, R.; Silva, M.; Araùjo, R.; Nunes, U. Electrical vehicle modeling: A Fuzzy logic model for regenerative braking. Expert Syst. Appl. 2015, 42, 22. [Google Scholar] [CrossRef]
  14. Kamal, E.; Adouane, L. Intelligent Energy Management Strategy Based on Artificial Neural Fuzzy for Hybrid Vehicle. IEEE Trans. Intell. Veh. 2017, 3, 112–125. [Google Scholar] [CrossRef]
  15. Heydari, S.; Fajri, P.; Rasheduzzaman, M.; Sabzehgar, R. Maximizing Regenerative Braking Energy Recovery of Electric Vehicles Through Dynamic Low-Speed Cutoff Point Detection. IEEE Trans. Transp. Electrification 2019, 5, 262–270. [Google Scholar] [CrossRef]
  16. Xu, G.; Xu, K.; Zheng, C.; Zhang, X.; Zahid, T. Fully Electrified Regenerative Braking Control for Deep Energy Recovery and Maintaining Safety of Electric Vehicles. IEEE Trans. Veh. Technol. 2015, 65, 1186–1198. [Google Scholar] [CrossRef]
  17. Yang, Y.; Tang, Q.; Bolin, L.; Fu, C. Dynamic Coordinated Control for Regenerative Braking System and Anti-Lock Braking System for Electrified Vehicles Under Emergency Braking Conditions. IEEE Access 2020, 8, 172664–172677. [Google Scholar] [CrossRef]
  18. Fajri, P.; Lee, S.; Prabhala, V.A.K.; Ferdowsi, M. Modeling and Integration of Electric Vehicle Regenerative and Friction Braking for Motor/Dynamometer Test Bench Emulation. IEEE Trans. Veh. Technol. 2015, 65, 4264–4273. [Google Scholar] [CrossRef]
  19. Zhang, X.; Göhlich, D.; Li, J. Energy-efficient Torque Allocation Design of Traction and Regenerative Braking for Distributed Drive Electric Vehicles. IEEE Trans. Veh. Technol. 2018, 67, 285–295. [Google Scholar] [CrossRef]
  20. Galvagno, E.; Morina, D.; Sorniotti, A.; Velardocchia, M. Drivability analysis of through-the-road-parallel hybrid vehicles. Meccanica 2012, 48, 351–366. [Google Scholar] [CrossRef] [Green Version]
  21. Rizzo, G.; Naghinajad, S.; Tiano, F.A.; Marino, M. A Survey on Through-the-Road Hybrid Electric Vehicles. Electronics 2020, 9, 879. [Google Scholar] [CrossRef]
  22. Hall, J.; Bassett, M.; Borman, S.; Lucas, T.; Whitehead, A. Through-the-Road Parallel Hybrid with In-Wheel Motors; SAE International: Detroit, MI, USA, 2016. [Google Scholar] [CrossRef]
  23. Tiano, F.A. Energy and Environmental Analysis for a Through-The-Road Solar Hybrid Electric Vehicle Including Control Strategies and Life Cycle Assessment. Ph.D. Dissertation, University of Salerno, Salerno, Italy, 2020. [Google Scholar]
  24. Tiano, F.A.; Rizzo, G.; De Feo, G.; Landolfi, S. Converting a Conventional Car into a Hybrid Solar Vehicle: A LCA Approach. IFAC-PapersOnLine 2018, 51, 188–194. [Google Scholar] [CrossRef]
  25. Rizzo, G.; Tiano, F.A. Life Cycle Assessment (LCA) study for different options of sustainable mobility, including vehicle conversion. Int. J. Powertrain 2020, 12, 521–538. [Google Scholar]
  26. Arsie, I.; D’Agostino, M.; Naddeo, M.; Rizzo, G.; Sorrentino, M. Toward the Development of a Through-The-Road Solar Hybridized Vehicle. IFAC Proc. Vol. 2013, 46, 806–811. [Google Scholar] [CrossRef]
  27. Marano, V.; Medina, H.; Sorrentino, M.; Rizzo, G. A Model to Assess the Benefits of an After-Market Hybridization Kit based on Realistic Driving Habits and Charging Infrastructure. SAE Int. J. Altern. Powertrains 2013, 2, 471–481. [Google Scholar] [CrossRef]
  28. D’Agostino, M.; Naddeo, M.; Rizzo, G. Development and validation of a model to detect active gear via OBD data for a Through-The-Road Hybrid Electric Vehicle. IFAC Proc. Vol. 2014, 47, 6618–6623. [Google Scholar] [CrossRef] [Green Version]
  29. Pisanti, C.; Rizzo, G.; Marano, V. Energy Management of Through-The-Road Parallel Hybrid Vehicles. In Proceedings of the 19th IFAC World Congress, Cape Town, South Africa, 24–29 August 2013; Volume 19, pp. 2118–2124. [Google Scholar]
  30. Grandone, M.; Naddeo, M.; Marra, D.; Rizzo, G. Development of a regenerative braking control strategy for hybridized solar vehicle. IFAC-PapersOnLine 2016, 49, 497–504. [Google Scholar] [CrossRef]
  31. Guiggiani, M. The Science of Vehicle Dynamics: Handling, Braking, and Ride of Road and Race Cars; Springer: Dordrecht, The Netherlands, 2014. [Google Scholar]
  32. Anderson, M.; Harty, D. Unsprung mass with in-wheel motors-myths and realities. In Proceedings of the 10th International Symposium on Advanced Vehicle Control, Loughborough, UK, 22–26 August 2010. [Google Scholar]
  33. Christensen, L. Designing In-Hub Brushless Motors. Mach. Des. 2014, 86, 42–45. Available online: https://www.machinedesign.com/motors-drives/article/21833665/designing-inhub-brushless-motors (accessed on 1 October 2021).
  34. Rajamani, R. Vehicle Dynamics and Control; Springer Science & Business Media: Cham, Switzerland, 2011. [Google Scholar]
  35. Luque, P.; Mántaras, D.A.; Fidalgo, E.; Álvarez, J.; Riva, P.; Girón, P.; Compadre, D.; Ferran, J. Tyre–road grip coefficient assessment—Part II: Online estimation using instrumented vehicle, extended Kalman filter, and neural network. Veh. Syst. Dyn. 2013, 51, 1872–1893. [Google Scholar] [CrossRef]
  36. Yunta, J.; Garcia-Pozuelo, D.; Diaz, V.; Olatunbosun, O. A Strain-Based Method to Detect Tires’ Loss of Grip and Estimate Lateral Friction Coefficient from Experimental Data by Fuzzy Logic for Intelligent Tire Development. Sensors 2018, 18, 490. [Google Scholar] [CrossRef] [PubMed] [Green Version]
  37. Bári, G. Modelling the situation of driving on the grip limit with DDPG algorithm. IOP Conf. Ser. Mater. Sci. Eng. 2018, 393, 012031. [Google Scholar] [CrossRef]
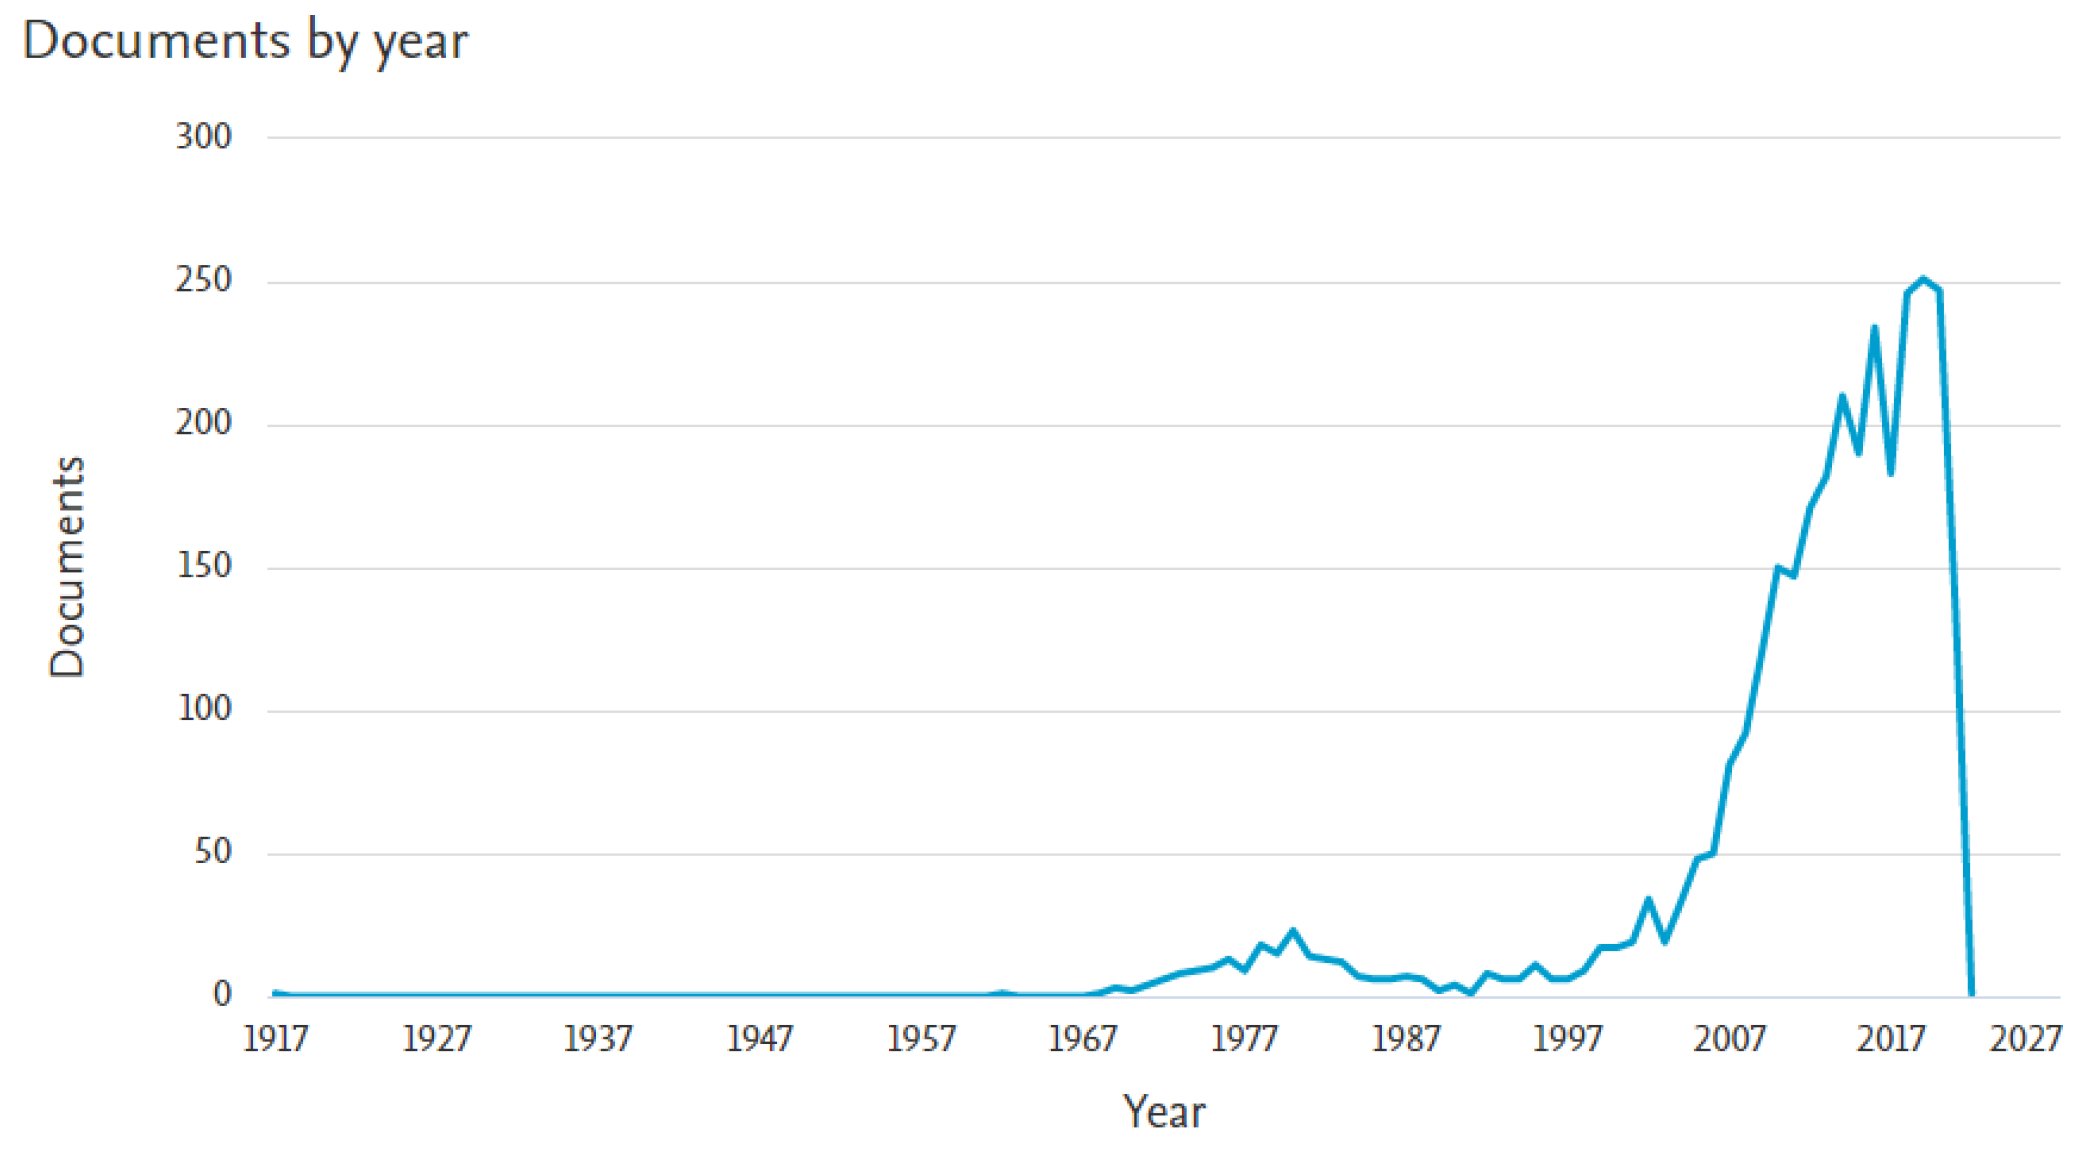
Figure 1. Number of papers on regenerative braking on the Scopus database (data after 2020 incomplete).
Energies 14 06835 g001
Figure 2. Schematic depiction of the solar hybridization kit. (Source [21]).
Energies 14 06835 g002
Figure 3. Hybrid solar vehicle prototype realized by the University of Salerno on a FIAT Grande Punto (https://www.life-save.eu/en/prototypes-team/, accessed on 1 October 2021).
Energies 14 06835 g003
Figure 4. Forces acting on the vehicle during braking [30].
Energies 14 06835 g004
Figure 5. Feasible braking region [30].
Energies 14 06835 g005
Figure 6. Feasible and unfeasible braking region for a hybridized vehicle.
Energies 14 06835 g006
Figure 7. Efficiency map for the electric generator. The thick black line represents the maximum torque curve, black curves represent the iso-efficiency curves and red curves represent the iso-power curves expressed in kW.
Energies 14 06835 g007
Figure 8. Fraction of energy recovered with a stopping time of 20 s, starting from 25 km/h to 100 km/h.
Energies 14 06835 g008
Figure 9. Fraction of energy recovered, starting at 50 km/h for stopping times from 10 to 40 s.
Energies 14 06835 g009
Figure 10. Fraction of energy recovered, starting at 75 km/h for stopping times from 10 to 40 s.
Energies 14 06835 g010
Figure 11. Braking forces vs speed at various stopping times, starting at 75 km/h. The highest energy recovery is obtained by stopping the car in 20 s (large purple star).
Energies 14 06835 g011
Figure 12. (Left) Braking forces (red star) at the best conditions and (Right) at the lowest stopping time (starting at red star and then on blue line), both starting at 75 km/h.
Energies 14 06835 g012
Figure 13. Speed/torque trajectory on the electric generator map during braking forces at the best conditions (Left) and at the lowest stopping time (Right), starting at 75 km/h.
Energies 14 06835 g013
Figure 14. Recovered energy fraction versus stopping time at various starting speeds.
Energies 14 06835 g014
Figure 15. Braking distance versus stopping time, at various starting speeds. Black points indicate the conditions of best energy recovery.
Energies 14 06835 g015
Figure 16. Percent of recovered energy at various starting speeds and stopping times, with contour plots. Results obtained with 8 steps in braking manoeuvre.
Energies 14 06835 g016
Figure 17. Contour plots of the recovered energy. Red dotted line represents the best fit of optimal conditions for each speed.
Energies 14 06835 g017
Figure 18. Optimal deceleration as a function of the starting speed.
Energies 14 06835 g018
Figure 19. Optimal braking distance as a function of the starting speed.
Energies 14 06835 g019
Table 1. Vehicle and hybrid powertrain data.
VariableSymbolValue
Frontal areaA2.05 m2
Wheels radiusrw0.295 m
Base vehicle massMv1105 kg
Equivalent vehicle massMe1270 kg
Center of gravity (CG) heighth0.5 m
Front axle distance from CGa1.13 m
Rear axle distance from CGb1.38 m
Rated max efficiencyηmax IWM0.9
Rated max speedRPMmax1500 rpm
Rated max torqueTmax381.97 Nm
Rated max power per wheelPmax10 kW
Rated speed at max efficiencyRPMmax me750 rpm
Rated torque at max efficiencyT max me230 Nm
Rated power at max efficiencyP max me9 kW
Rated speed related loss coef.k10.5
Rated torque related loss coef.k20.5
Rated power related loss coef.k30.2
Rolling resistance coefficientf00.02
Coefficient of dragcx0.325
Grip coefficient (dry road)μ0.7
Air densityρ1.2 kg/m3
Publisher’s Note: MDPI stays neutral with regard to jurisdictional claims in published maps and institutional affiliations.