
Distribution Network Reconfiguration Applied to Multiple Faulty Branches Based on Spanning Tree and Genetic Algorithms


Abstract
:1. Introduction
2. Electrical Networks and Conceptualization
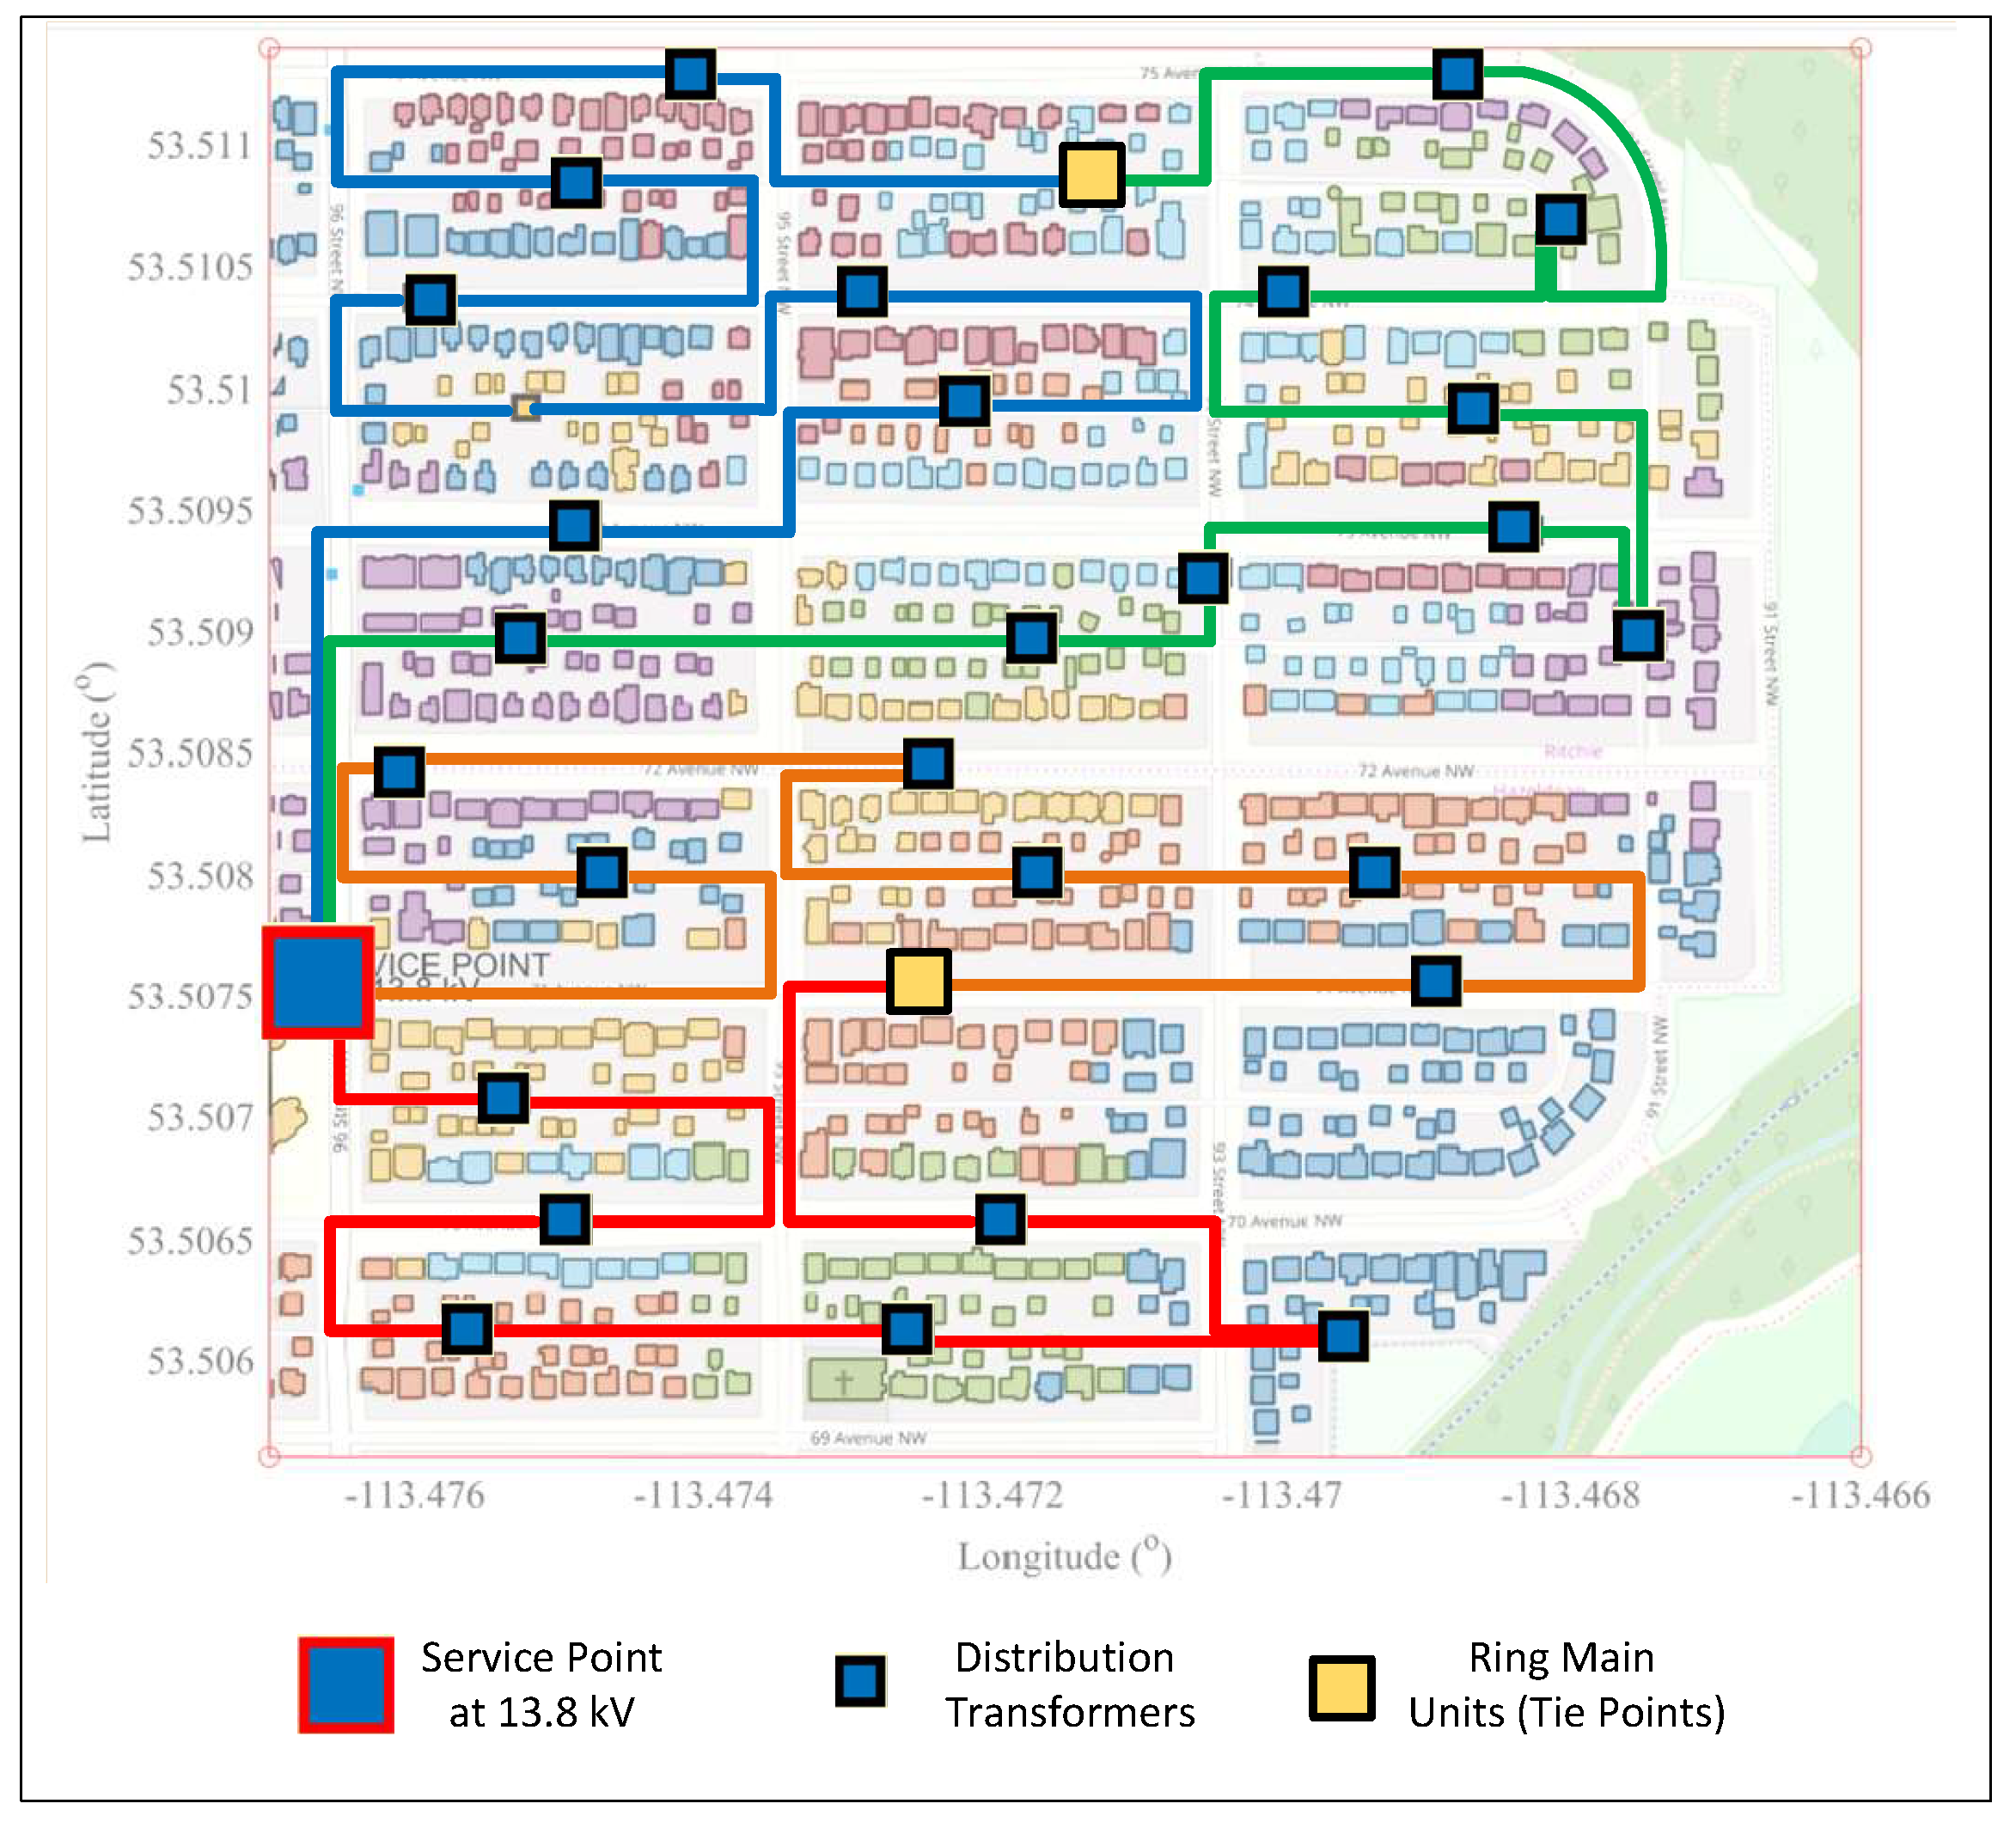
2.1. Electrical Distribution Network
2.2. Graph Theory
- (i)
- Vertices connected to tie lines and lines in which faults are forbidden to reduce;
- (ii)
- Vertices grade three or higher are maintained on the simplified graph;
- (iii)
- Vertices grade one that are connected to the feeder or loads are retained for the new graph;
- (iv)
- Vertices grade two and one are simplified.
2.3. Genetic Algorithms
2.4. Problem Formulation
3. Distribution Network Reconfiguration Process
- (1)
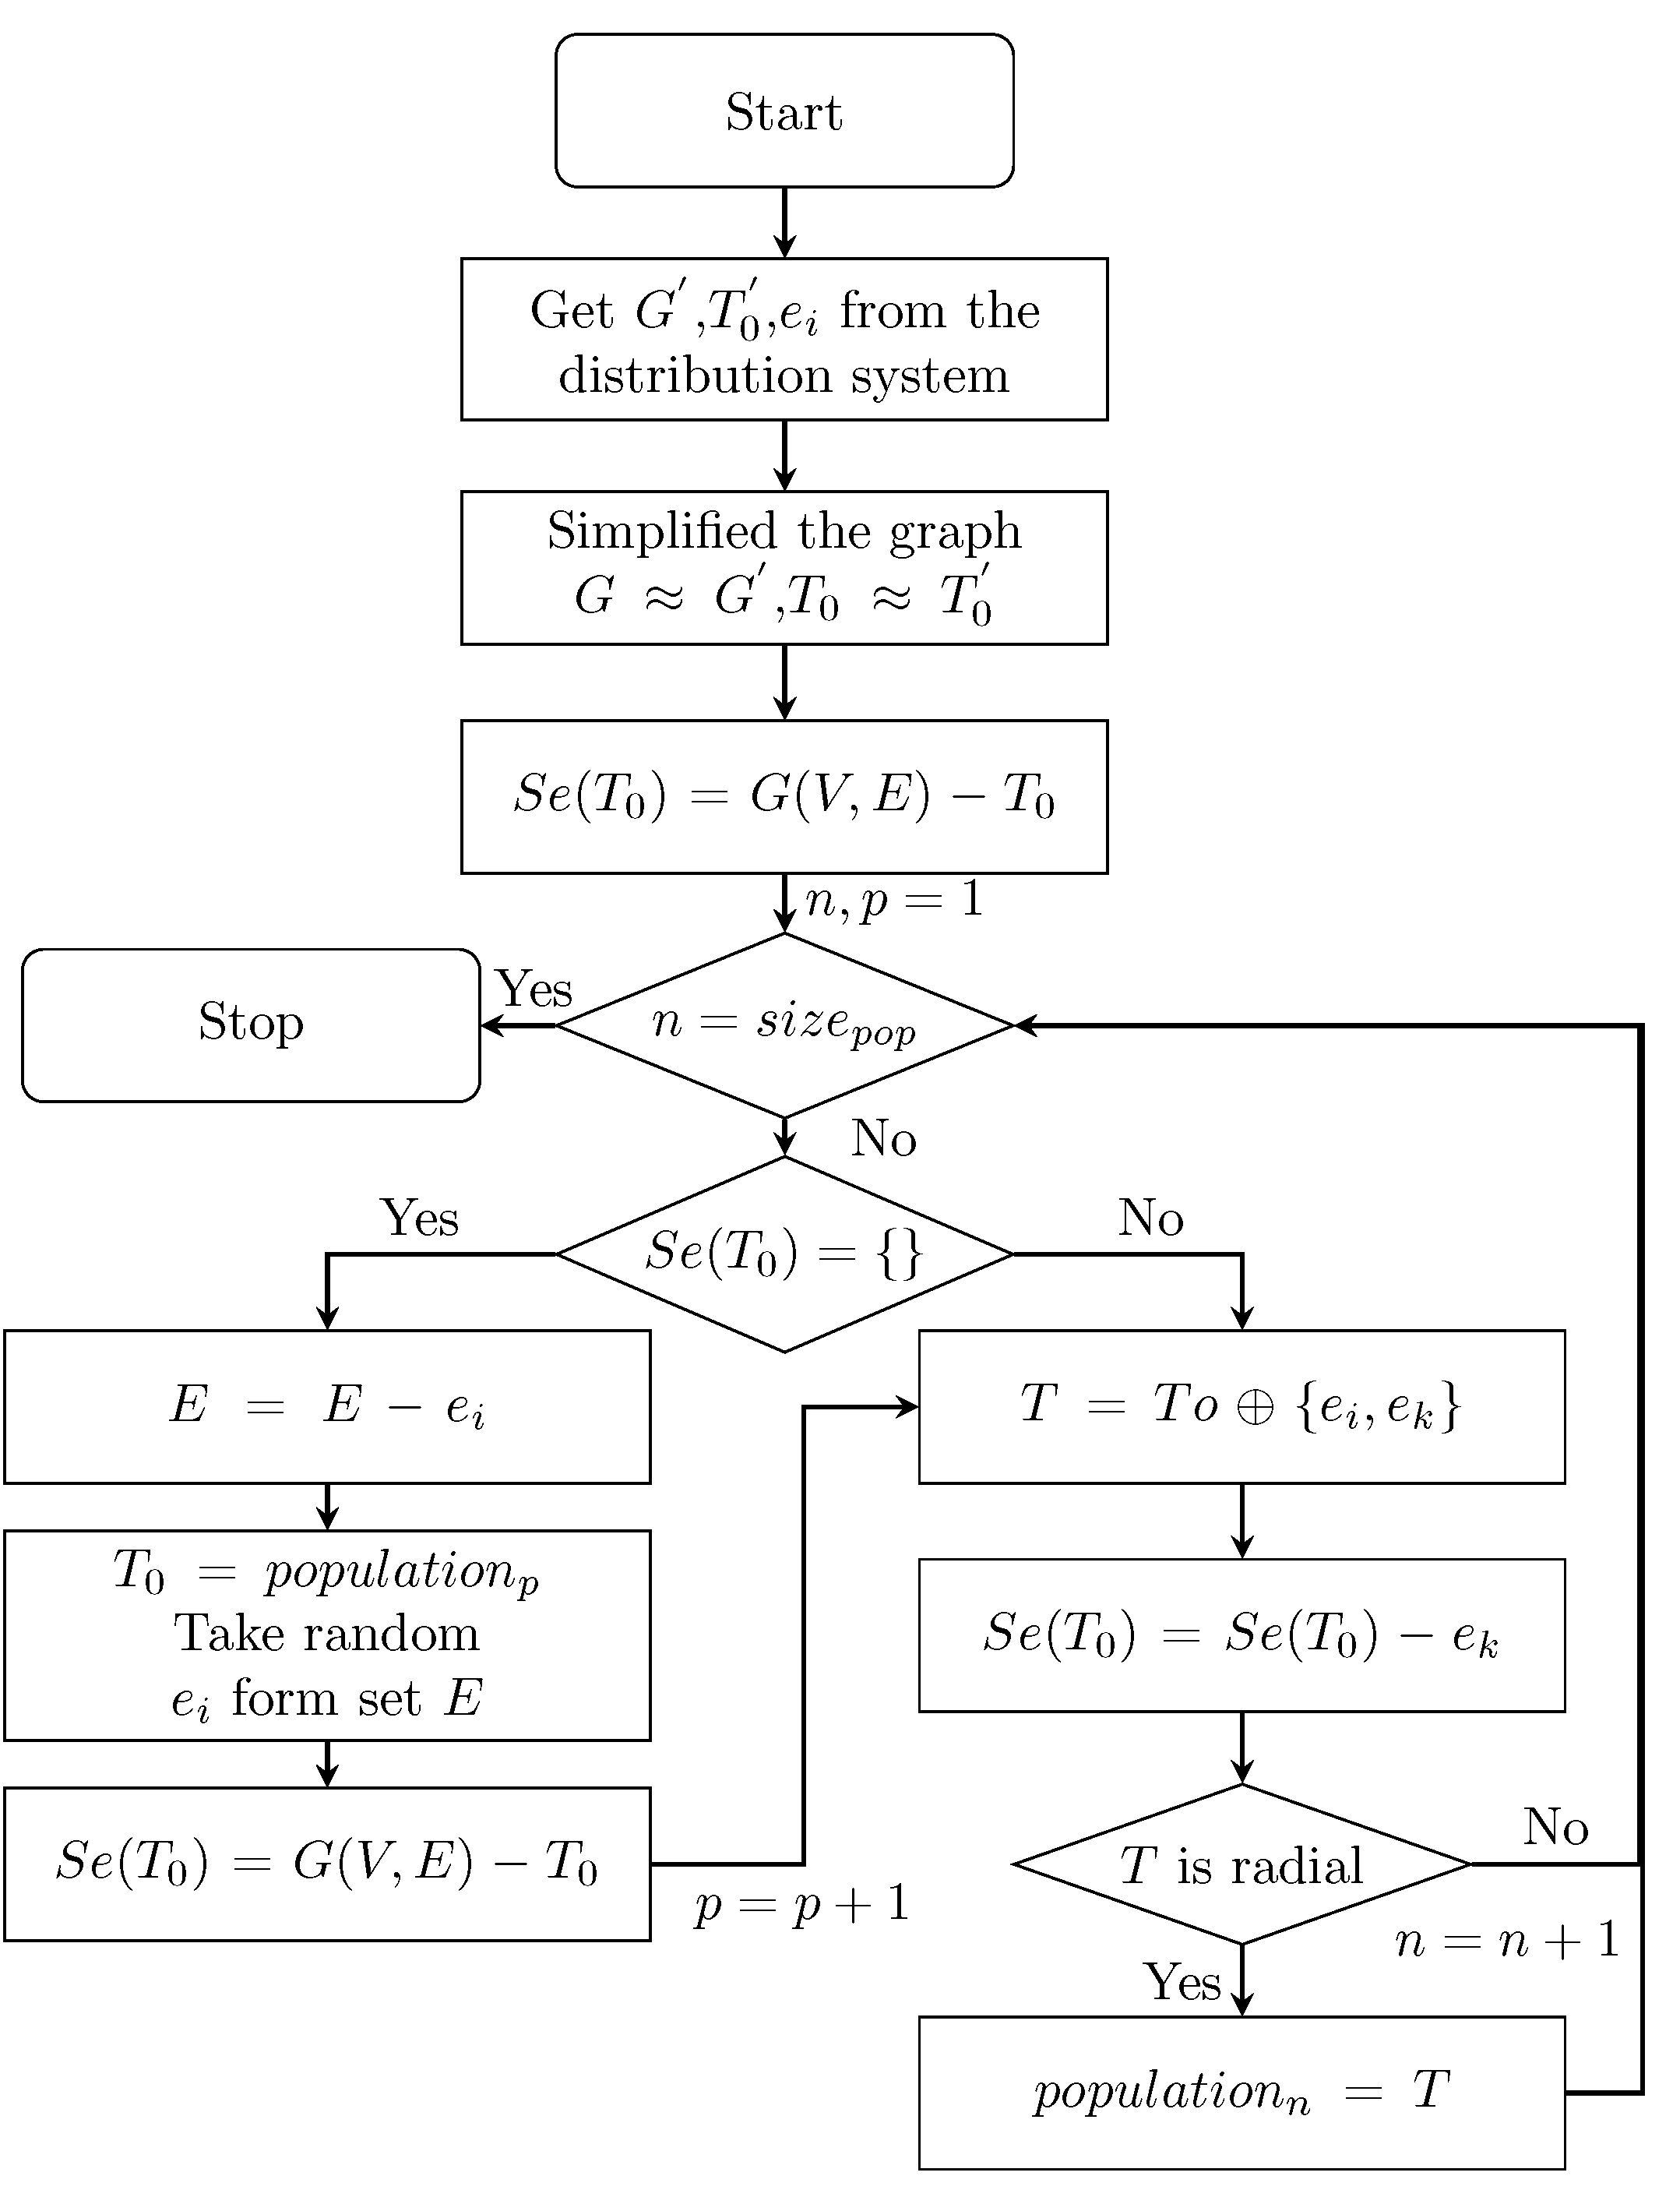
- Transform the distribution system to and ;
- (2)
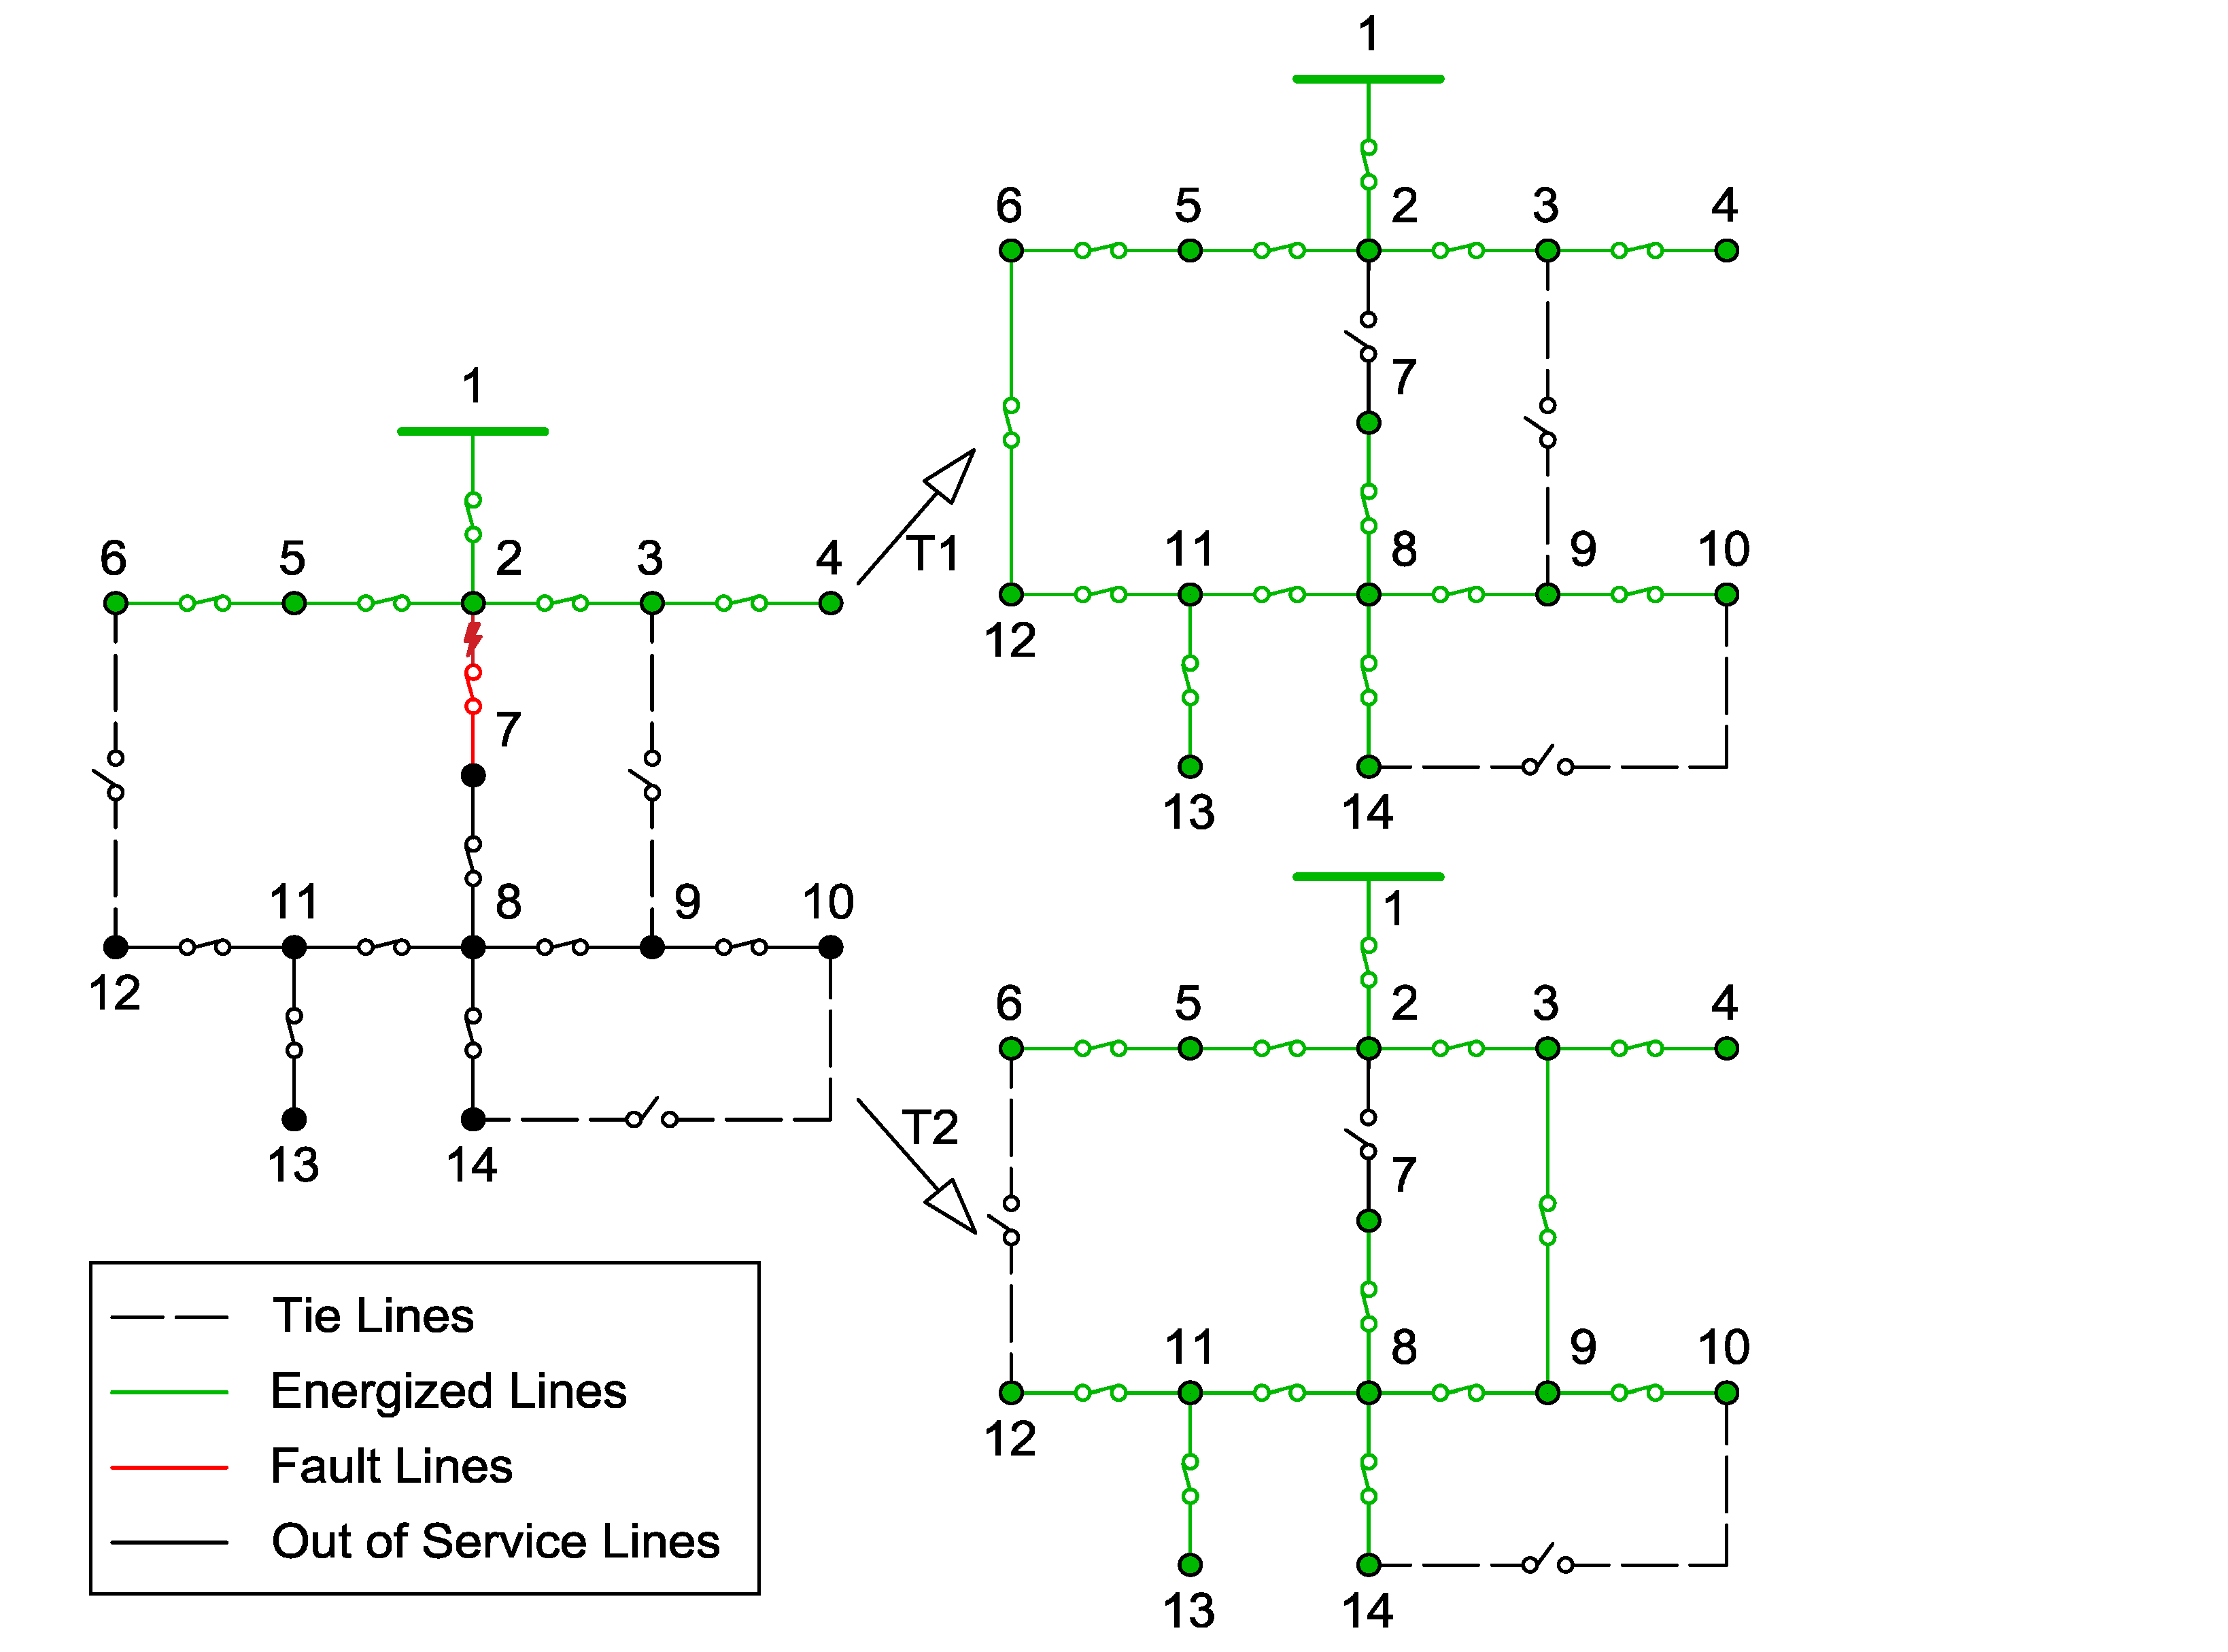
- Reduce the graph to its simplified form G and and identified the fault edge ;
- (3)
- Determine the fundamental cutset ;
- (4)
- Obtain the spanning tree by replacing with one edge and eliminating from set ;
- (5)
- Save the topology on the population database if none have loops;
- (6)
- Proceed to step 4 and repeat the process until is empty or the population database is complete;
- (7)
- Eliminate from the edge set E and take one topology from database;
- (8)
- Take one edge from the set E and proceed to step 3.
- (1)
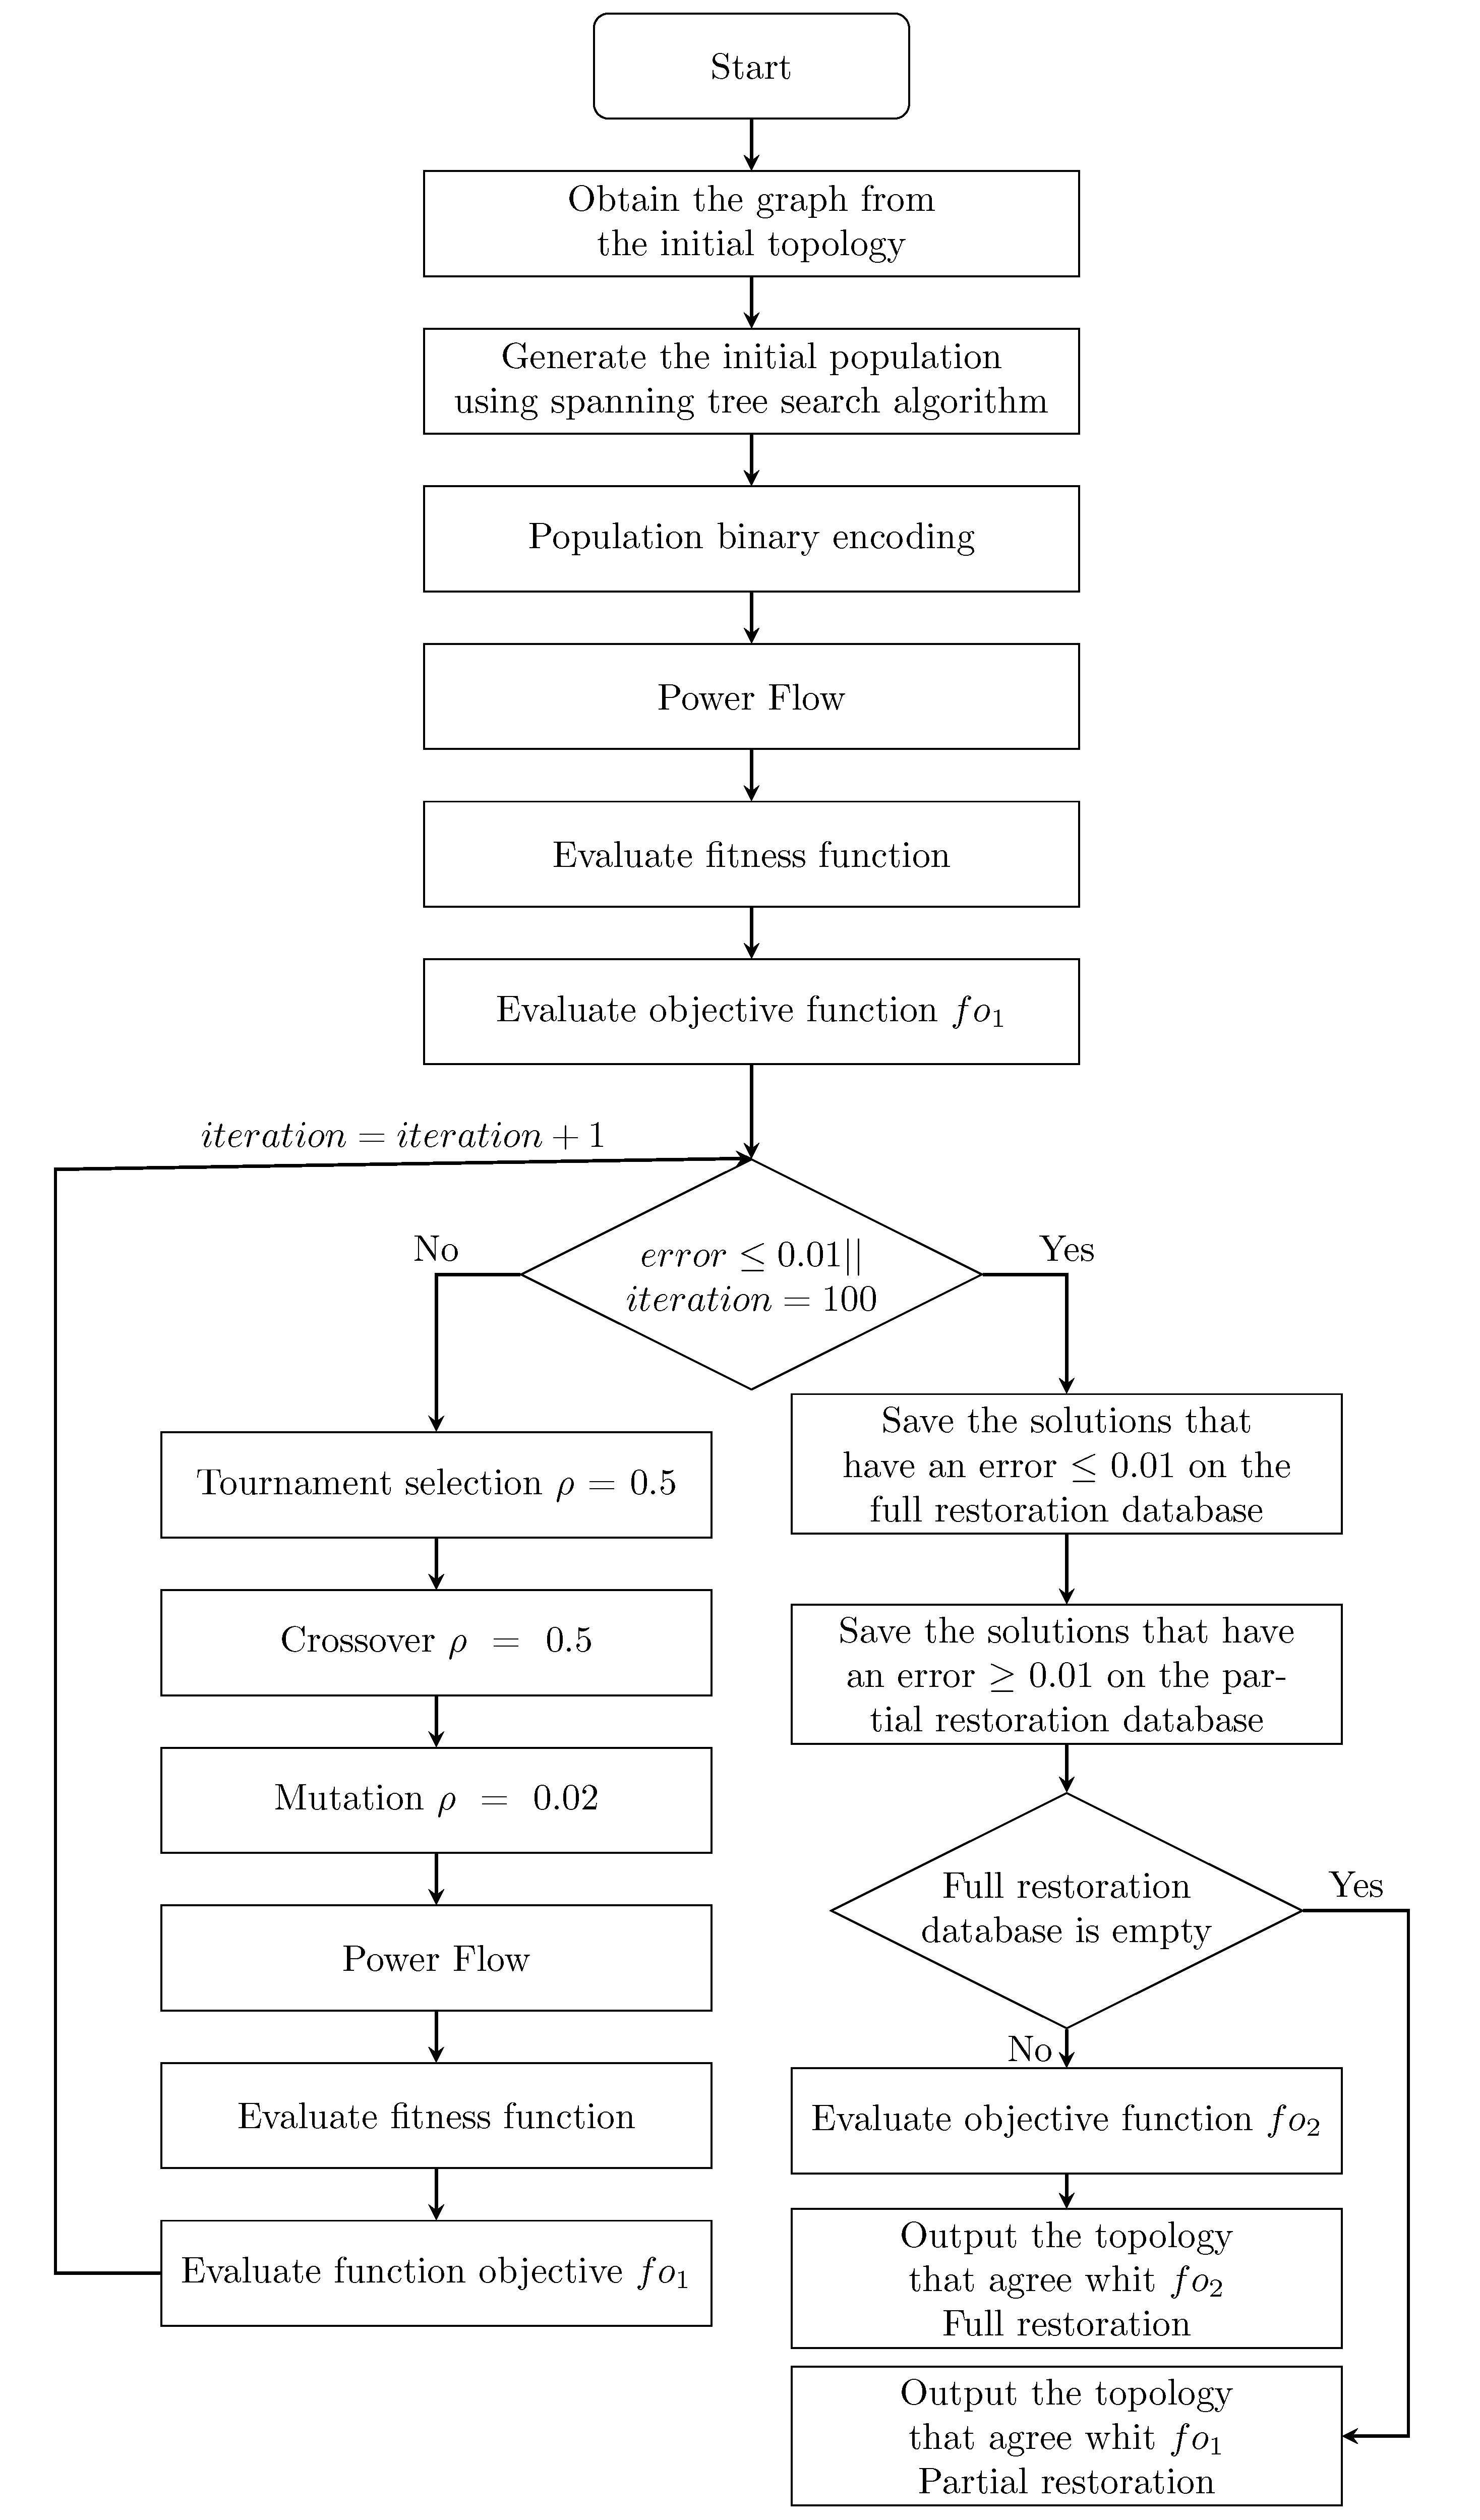
- Obtain the graph from the distribution system, then use the spanning tree algorithm described in Figure 5 to generate the initial population of size [29]. Through binary encoding, all individuals of the population are characterized with a chromosome as binary strings. Every gene is a bit that represents the state of the lines in which zero represents out of service and one represents operative line.
- (2)
- Obtain the power flow of each topology on the population. With these results, the fitness function assigns a value to each string. If the topology satisfied all the constraints, the value is equal to the sum of the apparent power of the system loads. On the contrary, if the topology does not satisfy the constraints, the value is zero.
- (3)
- Evaluate the fitness value of the strings based on the criteria of that maximizes the load restored such that the individuals are ordered from the highest to lowest value of power.
- (4)
- Calculate the error between the reference and measured apparent power for the entire population. If any topology has an error , proceed to step 5. On the other hand, skip to step 9.
- (5)
- By using tournament selection with , this operator randomly takes two individuals. It selects the individual with the highest or lowest fitness value based on its probability index .
- (6)
- Generate a new population of descendants from the group of parents through crossover with . In this case, a fix length string of genes is combined between the parents to produce new topologies. The new and old populations are joined temporary.
- (7)
- Based on mutation with , change the state of one random gene of the topologies on the temporary population. The gene that represents the fault line has a restriction to change its state [29].
- (8)
- Order the temporary population through steps 2 and 3. The individuals with the highest fitness values are retained until the original n population size is complete. The others are discarded and then skip to step 4.
- (9)
- If full restoration database has more than one string. The number of switch operations of the topologies on the database has to be determined. Then, based on the criterion, the strings are ordered with the lowest to highest number of switch operations. The topology with the lowest value is the result for full restoration process.
- (10)
- If full restoration database is empty. Use the criterion to take the string with the highest value of apparent power. The result of this topology represents partial restoration.
4. Simulation and Results
5. Conclusions
Author Contributions
Funding
Institutional Review Board Statement
Informed Consent Statement
Data Availability Statement
Conflicts of Interest
References
- Ding, T.; Lin, Y.; Bie, Z.; Chen, C. A resilient microgrid formation strategy for load restoration considering master-slave distributed generators and topology reconfiguration. Appl. Energy 2017, 199, 205–216. [Google Scholar] [CrossRef]
- Valenzuela, A.; Inga, E.; Simani, S. Planning of a Resilient Underground Distribution Network Using Georeferenced Data. Energies 2019, 12, 644. [Google Scholar] [CrossRef] [Green Version]
- Watson, E.B.; Etemadi, A.H. Modeling Electrical Grid Resilience under Hurricane Wind Conditions with Increased Solar and Wind Power Generation. IEEE Trans. Power Syst. 2020, 35, 929–937. [Google Scholar] [CrossRef]
- Kovački, N.V.; Vidović, P.M.; Sarić, A.T. Scalable algorithm for the dynamic reconfiguration of the distribution network using the Lagrange relaxation approach. Int. J. Electr. Power Energy Syst. 2018, 94, 188–202. [Google Scholar] [CrossRef]
- Thakar, S.; Vijay, A.S.; Doolla, S. System reconfiguration in microgrids. Sustain. Energy Grids Netw. 2019, 17, 100191. [Google Scholar] [CrossRef]
- Abu-Elanien, A.E.; Salama, M.M.; Shaban, K.B. Modern network reconfiguration techniques for service restoration in distribution systems: A step to a smarter grid. Alex. Eng. J. 2018, 57, 3959–3967. [Google Scholar] [CrossRef]
- Lin, Y.; Bie, Z. Tri-level optimal hardening plan for a resilient distribution system considering reconfiguration and DG islanding. Appl. Energy 2018, 210, 1266–1279. [Google Scholar] [CrossRef]
- Zhai, H.F.; Yang, M.; Chen, B.; Kang, N. Dynamic reconfiguration of three-phase unbalanced distribution networks. Int. J. Electr. Power Energy Syst. 2018, 99, 1–10. [Google Scholar] [CrossRef]
- Rider, M.J.; López, J.C.; Lavorato, M.; Franco, J.F. Robust optimisation applied to the reconfiguration of distribution systems with reliability constraints. IET Gener. Transm. Distrib. 2016, 10, 917–927. [Google Scholar]
- Poudel, S.; Dubey, A. A Graph-theoretic Framework for Electric Power Distribution System Service Restoration. In Proceedings of the IEEE Power and Energy Society General Meeting, Portland, OR, USA, 5–10 August 2018; pp. 1–5. [Google Scholar] [CrossRef]
- Li, J.; Ma, X.Y.; Liu, C.C.; Schneider, K.P. Distribution System Restoration With Microgrids Using Spanning Tree Search. IEEE Trans. Power Syst. 2014, 29, 3021–3029. [Google Scholar] [CrossRef]
- Tan, Z.; Fan, R.; Liu, Y.; Sun, L. Microgrid black-start after natural disaster with load restoration using spanning tree search. In Proceedings of the 2016 IEEE Power and Energy Society General Meeting (PESGM), Boston, MA, USA, 17–21 July 2016. [Google Scholar]
- Dimitrijevic, S.; Rajakovic, N. Service Restoration of Distribution Networks Considering Switching Operation Costs and Actual Status of the Switching Equipment. IEEE Trans. Smart Grid 2015, 6, 1227–1232. [Google Scholar] [CrossRef]
- Abdelaziz, M. Distribution network reconfiguration using a genetic algorithm with varying population size. Electr. Power Syst. Res. 2017, 142, 9–11. [Google Scholar] [CrossRef]
- Duan, D.L.; Ling, X.D.; Wu, X.Y.; Zhong, B. Reconfiguration of distribution network for loss reduction and reliability improvement based on an enhanced genetic algorithm. Int. J. Electr. Power Energy Syst. 2015, 64, 88–95. [Google Scholar] [CrossRef]
- Ameli, A.; Ahmadifar, A.; Shariatkhah, M.H.; Vakilian, M.; Haghifam, M.R. A dynamic method for feeder reconfiguration and capacitor switching in smart distribution systems. Int. J. Electr. Power Energy Syst. 2017, 85, 200–211. [Google Scholar] [CrossRef]
- Kaur, M.; Ghosh, S. Network reconfiguration of unbalanced distribution networks using fuzzy-firefly algorithm. Appl. Soft Comput. J. 2016, 49, 868–886. [Google Scholar] [CrossRef]
- Willis, H.L. Power Distribution Planning Reference Book, 2nd ed.; Marcel Dekker: New York, NY, USA, 2004; p. 1212. [Google Scholar]
- Chen, L.H. Overcurrent protection for distribution feeders with renewable generation. Int. J. Electr. Power Energy Syst. 2017, 84, 202–213. [Google Scholar] [CrossRef]
- Vai, V.; Suk, S.; Lorm, R.; Chhlonh, C.; Eng, S.; Bun, L. Optimal reconfiguration in distribution systems with distributed generations based on modified sequential switch opening and exchange. Appl. Sci. 2021, 11, 2146. [Google Scholar] [CrossRef]
- Valenzuela, A.; Montalvo, I.; Inga, E. A Decision-Making Tool for Electric Distribution Network Planning Based on Heuristics and Georeferenced Data. Energies 2019, 12, 4065. [Google Scholar] [CrossRef] [Green Version]
- Khushalani, S.; Solanki, J.M.; Schulz, N.N. Optimized restoration of unbalanced distribution systems. IEEE Trans. Power Syst. 2007, 22, 624–630. [Google Scholar] [CrossRef]
- Khederzadeh, M.; Member, S.; Zandi, S. Enhancement of Distribution System Restoration Capability in Single/Multiple Faults by Using Microgrids as a Resiliency Resource. IEEE Syst. J. 2019, 13, 1796–1803. [Google Scholar] [CrossRef]
- Li, X.; Zhang, J.; Yin, M. Animal migration optimization: An optimization algorithm inspired by animal migration behavior. Neural Comput. Appl. 2014, 24, 1867–1877. [Google Scholar] [CrossRef]
- Barbosa, M.A.S.; Gouvêa, M.M. Access point design with a genetic algorithm. In Proceedings of the 2012 Sixth International Conference on Genetic and Evolutionary Computing, Kitakyushu, Japan, 25–28 August 2012; pp. 119–123. [Google Scholar] [CrossRef]
- Liu, S.; Li, Z. A modified genetic algorithm for community detection in complex networks. In Proceedings of the 2017 International Conference on Algorithms, Methodology, Models and Applications in Emerging Technologies, ICAMMAET 2017, Chennai, India, 16–18 February 2017; pp. 1–3. [Google Scholar] [CrossRef]
- Meng, X.; Wu, H. Genetic algorithm optimized BP-network model and its application in fault detection of complicate equipments. In Proceedings of the 2010 International Conference on Intelligent Computation Technology and Automation, Changsha, China, 11–12 May 2010; Volume 2, pp. 387–390. [Google Scholar] [CrossRef]
- Keskes, S.; Bouchiba, N.; Sallem, S.; Chrifi-Alaoui, L.; Kammoun, M.B. Optimal tuning of power system stabilizer using genetic algorithm to improve power system stability. In Proceedings of the 2017 International Conference on Green Energy Conversion Systems (GECS), Hammamet, Tunisia, 23–25 March 2017. [Google Scholar] [CrossRef]
- Kwang, Y.; El-Sharkawi, M.A. Modern Heuristic Optimization Techniques Theory and Applications to Power Systems; Wiley-Interscience: Hoboken, NJ, USA, 2008. [Google Scholar]
- Babu, P.R.; Pasunuru, S.; Vaishnavi, G. Genetic algorithm and reconfiguration for loss minimization in radial distribution system. In Proceedings of the 2017 International Conference on Smart Grids, Power and Advanced Control Engineering, ICSPACE 2017, Bangalore, India, 17–19 August 2017; pp. 294–297. [Google Scholar]
- Valenzuela, A.; Simani, S.; Inga, E. Automatic Overcurrent Protection Coordination after Distribution Network Reconfiguration Based on Peer-To-Peer Communication. Energies 2021, 14, 3253. [Google Scholar] [CrossRef]
- Badran, O.; Mekhilef, S.; Mokhlis, H.; Dahalan, W. Optimal reconfiguration of distribution system connected with distributed generations: A review of different methodologies. Renew. Sustain. Energy Rev. 2017, 73, 854–867. [Google Scholar] [CrossRef]
- Lee, C.; Liu, C.; Mehrotra, S.; Bie, Z. Robust distribution network reconfiguration. IEEE Trans. Smart Grid 2015, 6, 836–842. [Google Scholar] [CrossRef]
- Darvishi, H.; Ciuonzo, D.; Eide, E.R.; Rossi, P.S. Sensor-Fault Detection, Isolation and Accommodation for Digital Twins via Modular Data-Driven Architecture. IEEE Sens. J. 2021, 21, 4827–4838. [Google Scholar] [CrossRef]


| Reference | Objective Function | Optimization Method | Constraints |
|---|---|---|---|
| [4] | Minimization of power | Mixed Integer Non-Linear Programming | Operational limits |
| losses | (MINLP) with Lagrange Approach | ||
| [8] | Minimization of power | Mixed Integer Linear Programming | Operational limits |
| losses | (MILP) with Linearization techniques | Time varying | |
| load demand | |||
| [9] | Minimization of active | Mixed Integer Second Order Cone | Operational limits |
| power losses | Programming (MISOCP) | Reliability index: | |
| SAIDI, SAIFI | |||
| [10] | Maximization of load | Mixed Integer Linear Programming | Operational limits |
| restored | (MILP) | ||
| [11] | Maximization of load | Minimum Spanning Tree (MST) | Operational limits |
| restored | |||
| [12] | Maximization of load | Graph Theory | Operational limits |
| restored | Black-start capacity | ||
| [13] | Minimization of the | Minimum Spanning Tree (MST) | Operational limits |
| the undelivered load | |||
| [15] | Maximization of system | Genetic Algorithms (GA) | ANAIS, ENSS |
| reliability | SAIDI, SAIFI | ||
| [16] | Minimization of the | Harmony Search Algorithm | Operational limits |
| total cost of the grid | |||
| [17] | Minimization of power | Fuzzy Firefly Algorithm | Operational limits |
| losses | Balancing index |
| IEEE 37-Node Modified Test Feeder | 94-Bus Distribution System | |||||||||
|---|---|---|---|---|---|---|---|---|---|---|
| Case | Fault Lines | Time (s) | Switched Lines | nSW | Load % | Fault Lines | Time (s) | Switched Lines | nSW | Load % |
| 1 | 4–5 | 5.15 | 4–8 on | 1 | 100 | 5–6 | 24.87 | 8–60 on | 1 | 100 |
| 2 | 28–29 | 5.05 | 21–32 on | 1 | 100 | 19–20 | 26.23 | 6–55 on | 2 | 100 |
| 50–51 | 21–83 on | |||||||||
| 3 | 26–28 | 4.83 | 21–23 on | 2 | 100 | 23–24 | 27.28 | 32–28 on | 3 | 100 |
| 35–37 | 25–37 on | 44–45 | 13–76 on | |||||||
| 73–74 | 34–46 on | |||||||||
| 4 | 3–14 | 5.24 | 11–25 on | 3 | 100 | 7–8 | 28.23 | 40–12 on | 4 | 100 |
| 23–25 | 21–32 on | 41–42 | 6–55 on | |||||||
| 30–32 | 15–19 on | 79–80 | 8–60 on | |||||||
| 50–51 | 21–82 on | |||||||||
| 5 | 6–7 | 272.25 | 13–26 on | 5 | 87.65 | 11–12 | 310.68 | 8–60 on | 4 | 97.22 |
| 6–10 | 4–8 on | 16–17 | 13–76 on | |||||||
| 3–17 | 25–37 on | 25–26 | 21–83 on | |||||||
| 26–28 | 15–19 on | 58–59 | 16–26 on | |||||||
| 22–23 off | ||||||||||
| Proposed MST+GA | MILP [10] | MINLP [22] | MST [11] | |||||||
|---|---|---|---|---|---|---|---|---|---|---|
| Case | Fault Lines | Load% | Optimal Solution | nSW | Optimal Solution | nSW | Optimal Solution | nSW | Optimal Solution | nSW |
| 1 | 4–5 | 100 | 4–8 on | 1 | 4–8 on | 1 | 4–8 on | 1 | 4–8 on | 1 |
| 2 | 28–29 | 100 | 25–37 on | 1 | 25–37 on | 1 | 35–37 off | 3 | 25–37 on | 1 |
| 25–37 on | ||||||||||
| 21–32 on | ||||||||||
| 3 | 26–28 | 100 | 21–32 on | 2 | 33–34 off | 3 | – | – | – | – |
| 35–37 | 25–37 on | 25–37 on | ||||||||
| 21–32 on | ||||||||||
Publisher’s Note: MDPI stays neutral with regard to jurisdictional claims in published maps and institutional affiliations. |
© 2021 by the authors. Licensee MDPI, Basel, Switzerland. This article is an open access article distributed under the terms and conditions of the Creative Commons Attribution (CC BY) license (https://creativecommons.org/licenses/by/4.0/).
Share and Cite
Guamán, A.; Valenzuela, A. Distribution Network Reconfiguration Applied to Multiple Faulty Branches Based on Spanning Tree and Genetic Algorithms. Energies 2021, 14, 6699. https://doi.org/10.3390/en14206699
Guamán A, Valenzuela A. Distribution Network Reconfiguration Applied to Multiple Faulty Branches Based on Spanning Tree and Genetic Algorithms. Energies. 2021; 14(20):6699. https://doi.org/10.3390/en14206699
Chicago/Turabian StyleGuamán, Alex, and Alex Valenzuela. 2021. "Distribution Network Reconfiguration Applied to Multiple Faulty Branches Based on Spanning Tree and Genetic Algorithms" Energies 14, no. 20: 6699. https://doi.org/10.3390/en14206699
APA StyleGuamán, A., & Valenzuela, A. (2021). Distribution Network Reconfiguration Applied to Multiple Faulty Branches Based on Spanning Tree and Genetic Algorithms. Energies, 14(20), 6699. https://doi.org/10.3390/en14206699