Article

Analysis of the Efficiency of Provincial Electricity Substitution in China Based on a Three-Stage DEA Model

1
School of Economics and Management, North China Electric Power University, Beijing 102206, China
2
Beijing Key Laboratory of New Energy and Low-Carbon Development, North China Electric Power University, Beijing 102206, China
*
Authors to whom correspondence should be addressed.
Energies 2021, 14(20), 6650; https://doi.org/10.3390/en14206650
Submission received: 14 September 2021 / Revised: 2 October 2021 / Accepted: 8 October 2021 / Published: 14 October 2021

Abstract

:
An electricity substitution strategy that replaces fossil fuels such as coal and oil with electricity in end-use energy consumption, can effectively contribute to an energy transition and the early achievement of carbon peaking and carbon neutrality targets. As the benefits of electricity substitution are not synchronized across China’s regions, this paper uses a three-stage data envelopment analysis (DEA) model to measure the efficiency of electric energy substitution in 30 provinces of China in 2017. The results show that both environmental factors and random errors have significant effects on energy efficiency. After eliminating these influences, the efficiency of electrical energy substitution among regions presented the following pattern: “high in the east and low in the west”. According to the evaluation results, this paper proposes corresponding suggestions for the development of electrical energy substitution.

1. Introduction

Energy is widely acknowledged to be the cornerstone of social development, which is why it is indispensable for the sustainable development of all aspects of society. At the same time, energy is leading the way for technological progress and economic prosperity [1]. At present, China’s terminal energy consumption relies excessively on the production of fossil energy, resulting in a range of environmental concerns, for example, the incompatibility and insecurity of energy and the environment and the serious problem of air pollution [2,3]. The realization of electrical energy substitution, and the promotion of an energy consumption revolution can resolve the resource dilemma and mitigate further environmental problems, thereby helping to achieve carbon neutrality targets and sustainable energy development [4,5]. Based on this, China proposed an electricity substitution strategy in 2013 to make use of different types of electricity production methods that are safe and convenient as well as clean and efficient [6,7]. Electric power substitution underway throughout the country, evidenced in electric heating [8], electric vehicles [9], port shore power [10], etc. After years of development, China has made some palpable achievements. In 2017, the country promoted and implemented nearly 100,000 electric energy substitution projects, completed 115 billion kilowatt-hours of electricity substitution, reduced loose coal by 64.4 million tons, and reduced carbon dioxide emissions by 110 million tons [11]. On a regional scale, Shandong Province, Jiangsu Province and Henan Province have improved their situations, with higher levels of electricity replacement, as opposed to the Mongolian East and Tibetan regions which have not, proving regional factors to be highly relevant to the conditions of improving on electrical energy replacement. It is clear that levels of electrical energy substitution vary greatly from province to province in China, which greatly affects the overall achievement of China’s energy transition and carbon neutrality goals. Consequently, it is essential to analyze and evaluate the level of efficiency of electricity substitution in each province and municipality.
The current research on electricity substitution in China is conducted from two perspectives: through a comprehensive evaluation of benefits and through a forecast of electricity substitution power. At the early stage of the development of electricity substitution, some scholars, from the specific path of electricity substitution, proposed a multi-dimensional index system for a comprehensive evaluation of benefits [12]. Liu et al., (2020) analyzed the comprehensive benefits of the specific substitution measures and compared each substitution route horizontally using Grey Relation Analysis (GRA) [13]. Based on the combination of improved analytic network process (ANP) and fuzzy comprehensive evaluation, Chong et al., (2017) evaluated the environmental benefits of electricity substitution [14]. In view of the practical characteristics of electrical energy substitution technology, Miao et al., (2018) used an Analytic Hierarchy Process (AHP) and grey correlation analysis to evaluate the effectiveness of electrical energy substitution technologies [15]. In addition, in order to forecast the potential for electricity substitution, some studies have used intelligent models to analyze and forecast future levels of electrical energy substitution in China [16]. Liu et al., (2019) utilized logistic curve fitting to understand influencing factors; they built an improved BP neural network to predict the potential for electricity substitution in China over the next 10 years [17]. Sun et al., (2017) quantified key factors, such as technological development, which affects electrical energy substitution, and proposed a cumulative electrical energy substitution prediction model based on the Particle Swarm Optimization-Support Vector Machine (PSO-SVM) [18]. Wang et al., (2020) predicted the future potential of electricity substitution in the Beijing-Tianjin-Hebei region through a combination of Salp Swarm Algorithm (SSA) and Least Squares Support Vector Machine (LSSVM), with results showing that electricity substitution in the region will still develop rapidly in the future [19].
As of today, the electrical energy substitution strategy in China has yielded good results [20], however, due to various reasons such as policies and resources, regional differences are still relatively pronounced. As a result, some scholars have begun to research from the perspective of evaluating the potential for multi-regional electrical energy substitution, to explore regional differences and their influencing factors [21]. Xia et al., (2018) used a principal component analysis (PCA) to rank the electricity substitution potential in municipalities under the jurisdiction of provinces, theoretically guiding the decision of implementing electricity substitution in the regions [22]. To evaluate the potential of regional electricity substitution, Li and Chen (2018) established an index system and determined the weights. Following this, they used the Technique for Order Preference using the Similarity to Ideal Solution (TOPSIS) method of linkage optimization to evaluate 25 regions under the jurisdiction of the national grid [23]. However, the above studies on electricity substitution are based on its benefits and cannot guide the specific input of each region to undertake the required work, and the approach is rather homogeneous.
Through an analysis of domestic and international literature, it can be found that few studies have been conducted to assess the efficiency of electricity substitution on a region to region basis, and that regional researchers only focus on the electricity substitution potential. The application of the TOPSIS method cannot rigorously analyze the input and output situation of regional electricity substitution work, and the application of comprehensive evaluation methods such as a grey correlation analysis can be influenced by human subjective factors, meaning the efficiency among provinces and municipalities cannot be obtained. The DEA model is the most direct and effective model for evaluating performance and efficiency. It is suitable for evaluating and comparing the relative efficiency of multi-input and multi-output decision-making units, and does not require pre-set index weights, meaning that the results obtained are more objective and accurate. Therefore, in order to address the lacuna in the field of electricity substitution efficiency, this paper applies a Data Envelopment Analysis (DEA) model.
Traditional DEA models do not discount the influence of external environmental factors on performance evaluation, and the accuracy of the resultant evaluation results prove to be poor. At present, scholars both in China and elsewhere have made extensive use of the three-stage DEA model to evaluate energy use efficiency, in which the second stage is the most distinctive, as it uses the stochastic frontier surface approach (SFA), which can improve the accuracy of performance evaluation by eliminating the influence of external environmental factors, placing the energy use of each region into a unified measurement and an analysis starting point. Therefore, drawing on the above-mentioned research results and starting with the inputs and outputs of each region’s electricity substitution efforts, this paper adopts a three-stage DEA model to calculate the electricity substitution efficiency of 30 provinces and cities in China in 2017, and analyzes their regional differences, which can provide suggestions for provinces and municipalities in order to enhance the efficiency of electricity substitution, as well as to achieve sustainable energy development.
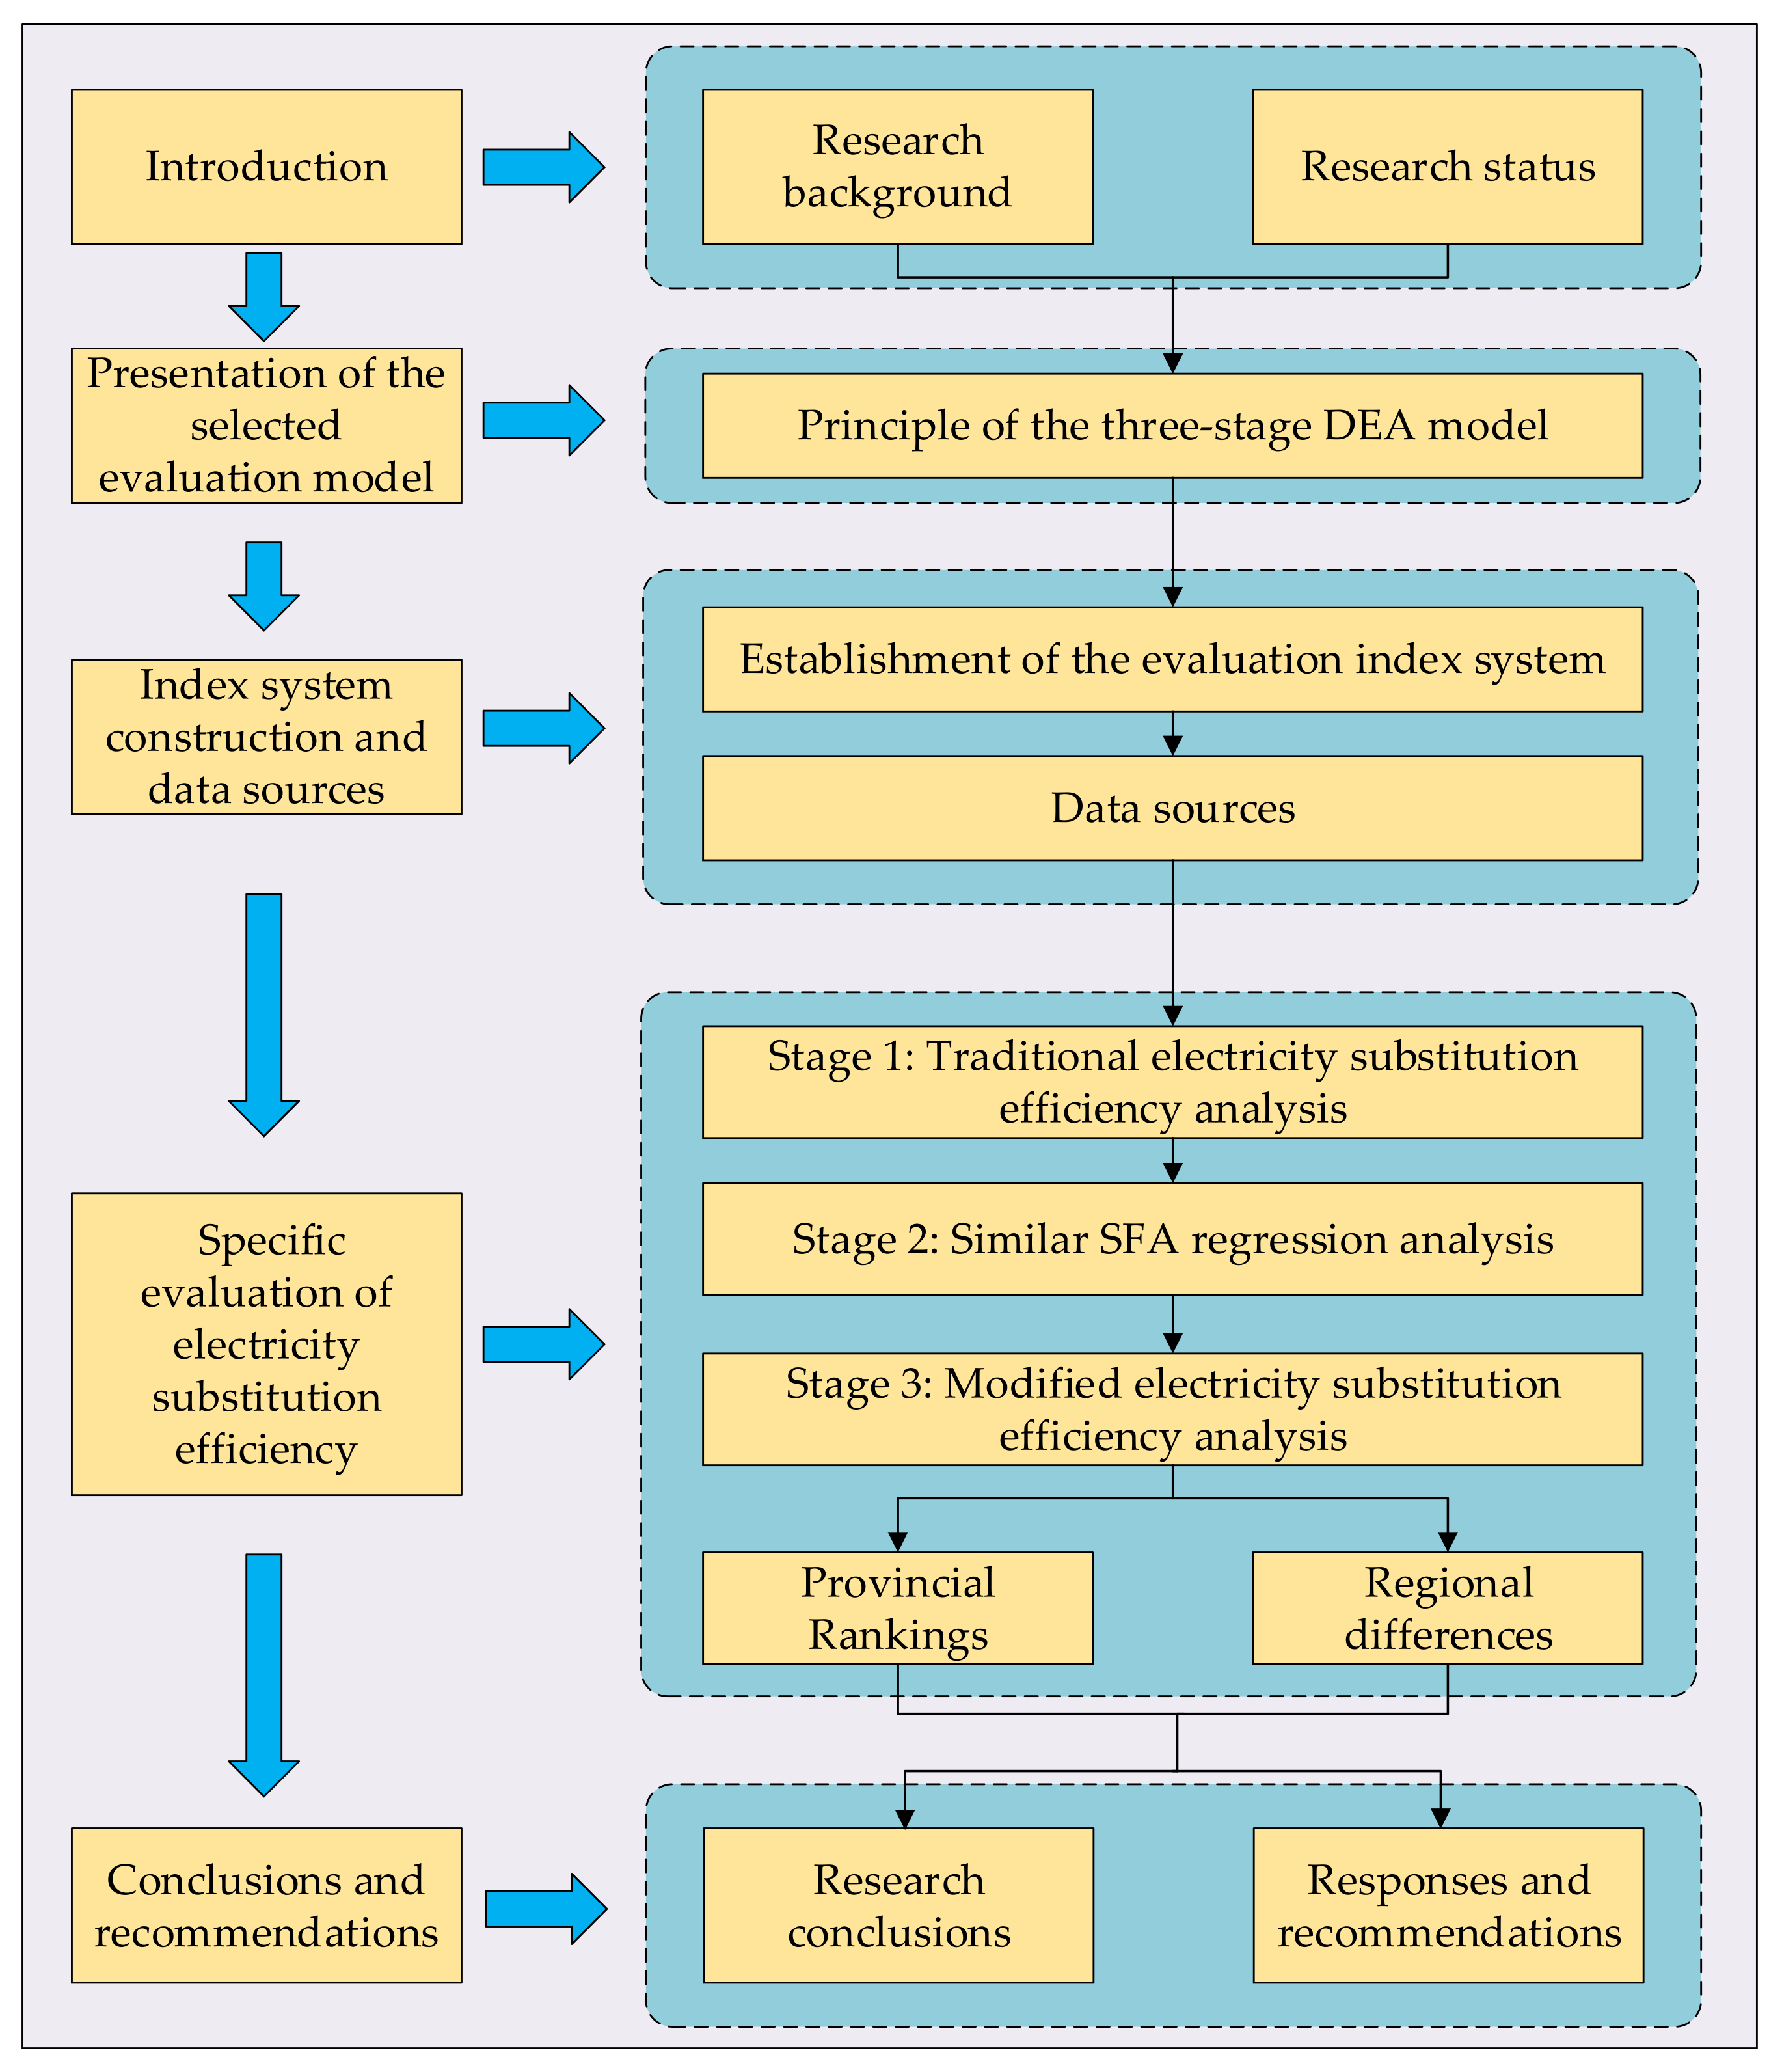
The following structure is adopted in this paper: in Section 2, this paper presents the principles of the three-stage DEA; in Section 3, this study establish a system of indexes covering the inputs and outputs of electricity substitution efforts, with the following indexes: output indexes, input indexes and environmental variables; in Section 4, on the basis of the model above, this paper calculates the efficiency values of electrical energy substitution for each province and municipality, and analyzes the differences between the three regions. Finally, in Section 5, the paper makes some suggestions to address the uneven development of electrical energy substitution between regions. The main flow chart of this paper is shown in Figure 1.

2. Principle of the Three-Stage DEA Model

As is well known, DEA models are used as efficiency evaluation methods that have been developed in recent years. They are always applied to systematically assess the relative efficiency of multiple similar decision units, because of their characteristics, that are particularly applicable to assess the efficiency of complex systems which cover diverse input and output indexes [24,25,26,27]. Fidanoski et al., (2021) investigated energy efficiency, which they examined using DEA as it accounts for influencing factors such as the environment and technology and concluded that relying on renewable energy would slightly decrease efficiency [28]. Cai et al., (2017) applied the three-stage DEA model for measuring the energy efficiency in 30 regions of China, with the result showing that when excluding the effects of environmental variables, the efficiency values measured by the model prove to be more accurate than without doing so [29]. Presumably, it is scientifically valid to apply the three-stage DEA model to assess regional electrical energy substitution efficiency.
Fried (2002) innovatively proposed the three-stage DEA, which has the advantage of stripping out environmental factors using stochastic frontier analysis (SFA) to obtain a technical efficiency independent of random factors [30]. This is a parametric approach to the frontier efficiency analysis, which allows for an adjustment of the influence of environmental variables and random disturbances, “filtering” exogenous factors from the efficiency assessment, and thus obtaining a more realistic evaluation result [31,32].
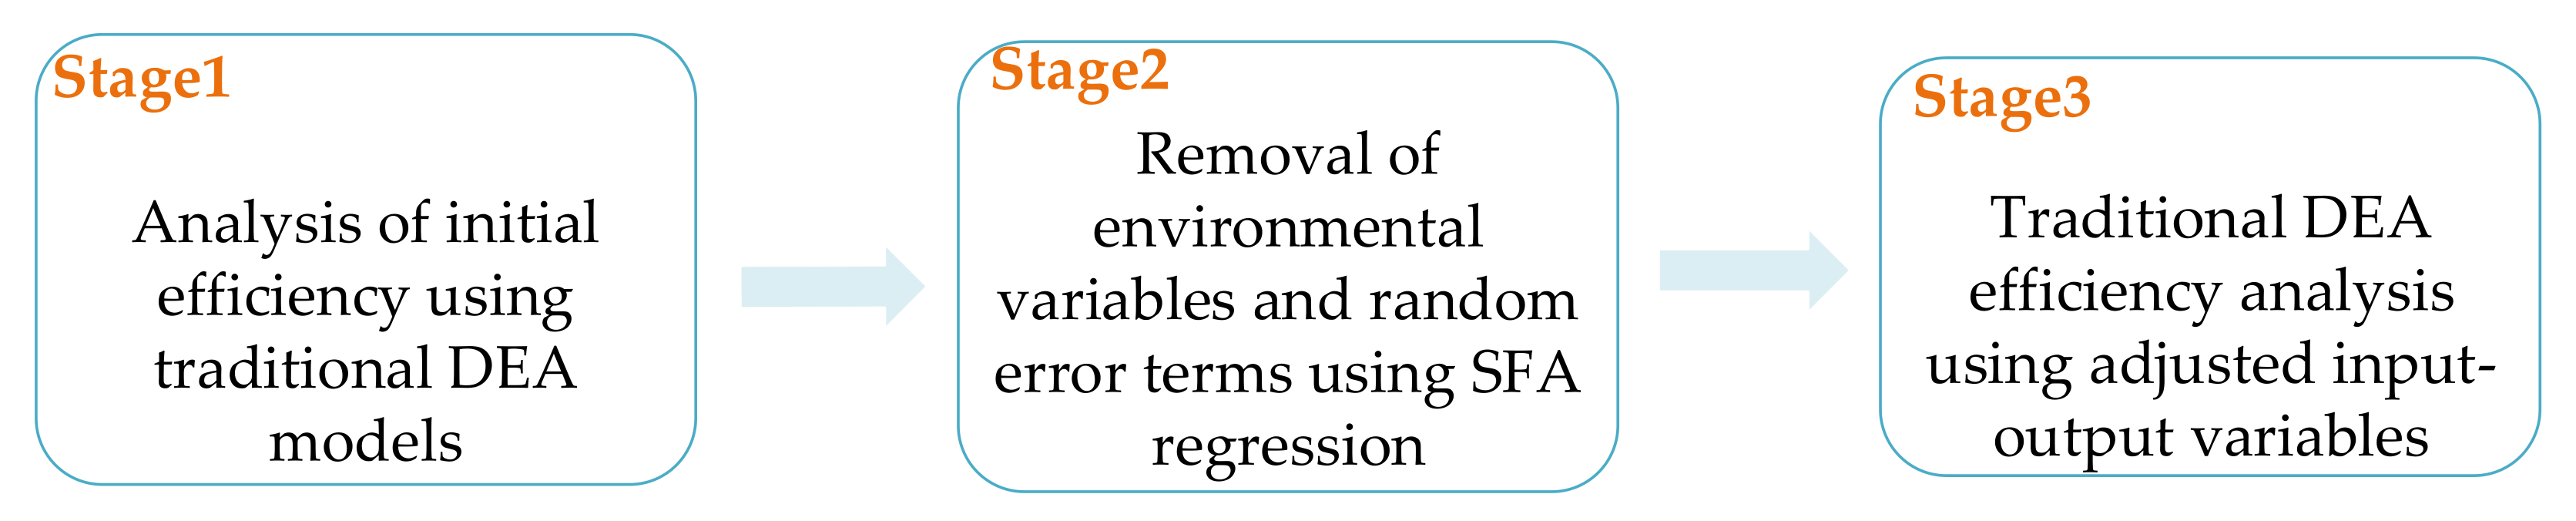
Figure 2 below shows the specific process of the three-stage DEA.
Stage 1: Conduct the initial efficiency evaluation using the raw input and output data. The input-oriented and output-oriented models are two different DEA models, and different orientations can be chosen depending on the specific purpose of the analysis. The DEA model can analyze the efficiency of electricity substitution under conditions of constant and variable returns to scale, known as CCR and BCC analysis respectively. However, in practice, economic and social conditions are not constant, i.e., efficiency changes with the scale of inputs. Therefore, this paper chooses the input-oriented BCC model.
     min θ ε e ^ T S + e T S + s . t . j = 1 n X j λ j + S = θ X 0 j = 1 n Y j λ j S + = Y 0 λ j 0 , S , S + 0
In the above formula, j = 1 , 2 , , n and j denotes a decision-making unit, X denotes input variables, while Y denotes output variables. As can be seen from Equation (1), the model is no different from the linear programming problem.
The technical efficiency (TE), which is calculated using the BCC model, is obtained by multiplying the scale efficiency (SE) and the pure technical efficiency (PTE), TE = SE * PTE. Environmental factors will affect the initial efficiency, resulting in a failure to reflect the true state. The next step is to remove the influencing factors.
Stage 2: An adjustment of the initial input index values by removing influencing factors using the Stochastic Frontier Analysis (SFA) model. This process requires the calculation of input redundancy values with the following formula:
S i j = x i j X i λ
In the Formula (2), i = 1 , 2 , , m and j = 1 , 2 , , n . S i j denotes the slack variable for the i th input of the j th decision unit, x i j is the actual value of the i th input of the j th decision unit, X i λ is the optimal input of the corresponding output on the efficient set.
To build the second stage SFA regression model:
S i j = f Z j ; β i + v i j + u i j
For the Formula (3), i = 1 , 2 , , m and j = 1 , 2 , , n . S i j has the same meaning as above, Z j is an environment variable, β i is the coefficient of the environment variable, v i j + u i j is a mixed error term, v i j indicates random interference and u i j indicates management inefficiency.
Once the parameters β n , σ v 2 , σ u 2 are calculated, the management inefficiencies and any random errors can be further separated.
Let e i j = v i j + u i j , and obtain the management inefficiency as:
E μ e = σ * ϕ ( λ e σ ) Φ ( λ e σ ) + λ e σ
where σ * = σ μ σ ν σ , σ = σ μ 2 + σ ν 2 , λ = σ μ / σ ν .
The random errors are:
E ( v e ) = S i j f Z j ; β i E ( u e )
The effects of random errors and environmental variables are then obtained, and the original data can be adjusted to obtain new values that remove the effects of environmental factors and random errors using the following formula:
X i j A = X i j + [ max ( f ( Z j ; β i ) ) f ( Z j ; β i ) ] + [ max ( ν i j ) ν i j ]
where X i j A is an adjusted input, X i j is the original input, [ max ( f ( Z j ; β i ) ) f ( Z j ; β i ) ] is an adjustment to external environmental variables, max ( ν i j ) ν i j is to bring all decision units to the same level.
Stage 3: The DEA is conducted by adjusting inputs and original outputs. At this point, the efficiency is relatively realistic and accurate, given the removal of the influence of environmental and stochastic factors.

3. Selection of Indicators and Environmental Variables

3.1. Selection of Input and Output Indicators

Electricity substitution is a dynamic and complex system that uses different kinds of input and output factors. The inputs include human, material and financial resources, while the outputs include electricity substitution and other outputs. By considering the specific input and output of the electricity substitution work and the availability of index data, this paper uses the investment in electricity assets and the number of electricity substitution projects as input indexes and uses the levels of electric energy substitution electricity and annual coal saving as output indexes. Based on these indexes, the evaluation index system is shown in Table 1.
Given that in the application of DEA models, there is a requirement for homogeneity between the input and output indexes, a Pearson correlation test is necessary for the indexes, and Table 2 presents these test results.
The correlation coefficient between the indexes of each province and municipality is positive and can pass the two-tailed test at the 0.01 level of significance, indicating that a highly positive correlation exists in both input and output indexes. The indexes are also consistent with the principle of homogeneity, and the selection of the indexes is scientific and reasonable.

3.2. Selection of Environment Variables

The efficiency of electricity substitution is affected by many factors, for example, economic development, population size, industrial structure, energy prices, energy consumption structure, urbanization level, etc. [33]. However, owing to objective constraints, it is impossible to take all the relevant factors into account. The following rules need to be followed for selecting environment variables: these variables do influence the efficiency of electricity substitution but are not within the scope of subjective control. Based on references to relevant literature [34,35,36] and through a consideration of data availability, the main selected environmental variables are levels of government support (measured by the state-owned economy’s investment in fixed assets in electricity), the structure of energy consumption (measured by a share of coal consumption) and GDP per capita. The following explanations are provided for our selection of environmental variables:
(1)
Levels of government support (100 million yuan). The implementation of scientific and reasonable policies is conducive to the stable development of electricity substitution. Some policies have now been enacted by the government to support electricity substitution, providing policy foundations for the realization of electrical energy substitution. The government’s efforts to promote electricity substitution are more evident in the strengthening of electricity construction, thus increasing the competitiveness of electricity and promoting the realization of electricity substitution. For these reasons, this paper chooses levels of government support as an environmental variable for electricity substitution efficiency.
(2)
The energy consumption structure (%). Electricity substitution mainly concerns the replacement of coal by electricity and of oil by electricity. Therefore, the larger the share of coal and oil used in energy consumption, the greater the possibility for electrical energy replacing fossil energy in that region. The adjustment of energy consumption structure in each region will increase the potential of electrical energy substitution, leading to an energy revolution and low-carbon social development. Therefore, this paper selects the energy consumption structure as an environmental variable for electricity substitution efficiency.
(3)
GDP per capita ($) is often taken as a measure of the level of economic and social development in various studies, and development level is an important factor in influencing the potential of electricity substitution and provides the cornerstone for the substitution work. On the one hand, the more economically developed a region is, the larger the scale of industry and the more complex the industrial structure tends to be, whether they classify as traditional or new industries, the development for which requires abundant energy consumption. Social development also affects the structure of end-use energy consumption. Therefore, this paper selects GDP per capita as an environmental variable for electricity substitution efficiency.
The disparity between the values of the environmental variables may lead to greater differences in their coefficients in the second stage. To have more accurate efficiency results, the two variables of levels of government support and GDP per capita are normalized on the basis of not affecting the model’s final results. The normalized formula is as follows:
Z = Z Z min Z max Z min
where Z is the original value and Z is the normalized value, max and min respectively represent the maximum and minimum values of the variable.

3.3. Data Sources

This paper is based on 30 provinces, autonomous regions and municipalities of China, using 2017 as the sample period for the study. Tibet is not listed as it has higher levels of missing data. Hong Kong and Macau are similarly not listed because of differences in their economic systems. The data source for the article is the “China Statistical Yearbook 2018, the 2018 provincial and municipal statistical yearbooks and the China Energy Statistical Yearbook 2018”, which provides accurate and reliable data information and a strong representation.

4. Empirical Analysis

4.1. Electricity Substitution Evaluation

4.1.1. Results of Traditional Electricity Substitution Efficiency Analysis

By using Deap2.1 software, the PTE, SE and TE of the first stage as well as return to scale of electricity substitution in 30 regions of China are analyzed through the BCC model, and Table 3 demonstrates this result.
From Table 3, the average value of TE of electricity substitution in 2017 is 0.745, the average value of PTE is 0.792 and the average value of SE is 0.942. From the empirical results of the first stage, due to the existence of external environmental influences, it seems that the SE in China as a whole is greater than the PTE, indicating that the scale factor plays a dominant role in electricity substitution efficiency in each province and municipality, while the technical factor is in a secondary position.
The only four provincial and municipal regions with an electricity substitution efficiency of 1, in 2017, are Beijing, Tianjin, Shanghai and Jiangsu, indicating that the efficiency of electricity substitution in Beijing, Tianjin, Shanghai and Jiangsu is relatively effective and the return to scale remains unchanged, indicating that these four provinces and municipalities have a higher degree of electricity substitution and have more reasonable inputs and outputs. The regions with a PTE of 1 and a SE of less than 1 are Guangdong and Hainan, which indicates that the low SE is the factor that causes low TE in these two regions. The PTE and SE of the other regions are less than 1, meaning that the resource allocation ability in the other regions is low. The difference between the highest and lowest efficiency of electrical energy substitution between regions is 0.52, which indicates that it is difficult to improve the efficiency of electrical energy substitution in China and that challenges must be overcome before its realization of electricity substitution.
However, the first stage includes environmental factors, and the efficiency values obtained in this stage do not accurately represent the actual level of electricity substitution efficiency in each province and municipality, so the second stage of calculation is needed to adjust the input terms in order to obtain a more realistic level of efficiency.

4.1.2. Results of Similar SFA Regression Analysis

At the second stage, two input indexes values—investment in electricity assets and the number of electricity substitution projects—are treated as the explained variables of the function, and levels of government support, the energy consumption structure and GDP per capita are selected as explanatory variables to examine the influences of the three environmental variables on the two inputs. If the regression coefficient is positive, it indicates that increasing the input of this index will result in redundancy and waste; conversely if it is negative, it indicates that increasing the input of this index will help to reduce input slack and reduce the generation of waste, thus increasing efficiency. Frontier 4.1 software is used to calculate the analysis results which are shown in Table 4.
As shown in Table 4, the LR statistic of the 2 SFA models, which is an LR test of the one-sided error, passes the 5% significance level test (critical value of 7.045 at this level), proving that the application of SFA is justified; the regression coefficients of environmental variables on inputs all pass the significance level of 10%, which shows that environmental variables have a significant effect on input slack. The following three environment variables are analyzed in detail, separately:
(1)
Levels of government support. According to the calculated results, the regression coefficients of this environment variable and the inputs of investment in electricity assets and the number of electrical energy substitution projects are all positive, indicating that government support leads to a significant effect on these two input redundancies, which also indicates that as the levels of government support increases, it will lead to input redundancies in investment in electricity assets and the number of electricity substitution projects. This is reflected in the fact that in some areas of the country, the investment in electricity substitution is considerable but not rationally allocated, resulting in low efficiency of electricity substitution.
(2)
The energy consumption structure. As shown in the calculated results, the regression coefficients of this environmental variable and the inputs of the investment in electricity assets and the number of electrical energy substitution projects are positive, indicating that higher coal consumption leads to a wasteful investment in electricity assets and in implemented electricity substitution projects, which does not contribute to improving the efficiency of electricity substitution.
(3)
GDP per capita. From the calculation results, the regression coefficients of the environment variable and the inputs of the investment in electricity assets and the number of electrical energy substitution projects are all negative, indicating that the more economically and socially developed a region is, the fewer energy inputs it will waste, thereby proving it to be a dominant environmental factor.
To summarize the above, environmental factors have different degrees of influence on the input slack variables in electricity substitution in each region. Regions in different environments are likely to show higher deviations because of the existence of environmental factors, which do not reflect the true level of electricity substitution efficiency. Therefore, the elimination the effects of environmental and stochastic factors is essential to obtain accurate efficiency values. This is why the SFA method is applied for the adjustment of the input factors for 30 regions in China in 2017, so that the efficiency of electricity substitution under the same environmental factors and opportunity conditions can be analyzed.

4.1.3. Results of Modified Electricity Substitution Efficiency Analysis

In the third stage, by applying Deap2.1 software, the PTE, SE and TE as well as the return to scale are recalculated for the 30 provincial and municipal areas in China using output values that are consistent with the original output values, and input values which have been adjusted in the previous stage. Table 5 illustrates the analysis results of this stage.
In the third stage, after adjusting for environmental variables and random errors in the second stage, the TE of electricity substitution experienced a change from 0.745 in Stage 1 to 0.746 in Stage 3, a PTE of electricity substitution from 0.792 to 0.914 and an SE from 0.942 to 0.815 in 30 Chinese provinces and municipalities. This shows that the PTE of electricity substitution, in the first stage, is underestimated and the SE is overestimated due to environmental factors.
After eliminating environmental factors and random disturbances, the regions at the frontier of three efficiencies are Jiangsu and Guangdong, which shows that the resource allocation in these regions is comparatively rational, the various inputs work better, the level of technology is at the extreme level, and the electrical energy substitution is relatively high.

4.2. Analysis of Results

4.2.1. Ranking of Electricity Substitution Efficiency by Province

By comparing the first and third stage efficiency values, the comparative results are obtained which are shown in Figure 3 and Figure 4.
To further illustrate the comparison, Table 6 below shows the ranking of electrical energy substitution efficiency values by province.
Table 6 reveals that the results of the ranking of the electricity substitution efficiency values in the first and third stages have changed significantly, and more specifically the ranking of the electricity substitution efficiency in Beijing, Tianjin and Shanxi before and after the adjustment changed significantly, which reveals that environmental factors and stochastic disturbances have an effect on the electricity substitution efficiency of each province and municipality. Therefore, it is necessary to place all of the provinces and municipalities at the same level when evaluating the efficiency, in order to obtain an objective reflection of the efficiency values of each region. This also shows that the application of the three-stage DEA model is scientific and reasonable.
As can be observed in the comparison of the first and the third stage by removing influencing factors such as environmental variables and stochastic error terms, the external conditions of each province and municipality can be placed at the same condition. Two provinces and municipalities have an electricity substitution efficiency value of 1, reducing two effective areas of electricity substitution efficiency compared to the first stage. The comparison shows that the Jiangsu Province is on the frontier of TE before and after the adjustment of the input variables, and the Jiangsu Province’s electricity substitution work is better completed, and that its development level is higher, with more reasonable inputs and outputs, and is less influenced by environmental factors. The structure of the three industries in Jiangsu Province presents a “three, two, one” trend, with a significant increase in the coordination of the three industries. The Jiangsu Province, as a strong industrial province in China, is at the forefront of the country, especially in the fields of machinery, iron and steel, chemicals and pharmaceuticals, with a reasonable and comprehensive configuration of light and heavy industries. Industrial energy consumption is high, thus the potential for electrical energy substitution is great. The Jiangsu Province vigorously promotes deep electricity substitution in emerging areas, adopts new innovative technologies such as thermal storage electric boilers, and achieves full coverage of shore power in major ports along the Yangtze River in Jiangsu, therefore, it leads the country in electricity substitution efficiency.
The technical efficiency rankings of regions such as Shanxi, Sichuan and Henan improved considerably in the third stage, suggesting that in the first stage their electricity substitution efficiency was influenced by external environmental factors. Among these provinces, the Shanxi Province is a major coal province in China, with developed heavy industry, so the proportion of coal in energy consumption is much higher than in other provinces. The Shanxi Province is not as economically developed, resulting in a low efficiency of the first stage of electrical energy substitution. After eliminating factors, the efficiency of the third phase is most significantly increased for the Shanxi Province. It can be seen that the implementation of electrical energy substitution in the Shanxi Province in the first phase was mainly restricted by the coal-leaning energy consumption structure, while the current input and output of electrical energy substitution work is more reasonable.
However, Beijing, Tianjin, Shanghai and Jilin experienced a large drop in their technical efficiency rankings after removing environmental factors and random errors, suggesting that their previous high efficiency was caused by external factors and circumstance and did not truly reflect their technical management levels. Beijing, Tianjin and Shanghai are in similar situations. They are all more economically developed cities and have essentially achieved an advanced industrial structure. Moreover, the proportion of tertiary industry is high, close to or at the same level as developed countries. Therefore, the electrification level for these regions is higher and it proves to be more difficult to implement electricity substitution. When the studied factors are removed, the efficiency of electricity substitution for these cities decreases significantly. As for the Jilin Province, the inputs and outputs of electricity substitution are too small for its upper-middle class economic conditions, leading to a further decline in the already modest efficiency of electricity substitution.
In terms of changes in returns to scale in electricity substitution efficiency, there is a considerable distinction between the two stages. When observing the first stage, 12 regions are increasing, 13 regions are decreasing and 5 regions are constant for returns to scale. In contrast, for the returns to scale of electricity substation, after the removal of the effects of external environmental factors, 26 regions are increasing, 4 regions are constant, and no regions prove to be decreasing. The comparison between the two stages shows that the existence of environmental variables has increased the returns to scale of electricity substitution, but due to the influence of environmental variables, the returns to scale results do not reflect the current development level well and cannot guide the provinces and municipalities in the next step of electricity substitution work. For the third stage of the returns to scale results, it is clear that the returns to scale of electricity substitution in most provinces and municipalities have not yet reached their optimum state, and it is possible to increase the input or adjust the factor allocation to improve the efficiency of electricity substitution.

4.2.2. Regional Comparison of the Efficiency of Electrical Energy Substitution

From Figure 4, it is clear that the efficiency values of electricity substitution in 30 provinces are regional in nature. Therefore, this paper groups the 30 provinces and municipalities into three major regions, namely the eastern, central and western regions, in accordance with the traditional regional division, thus analyzing the regional variations in the electricity substitution efficiency. The three regions show significant regional variations due to their geographical location, stages of economic development and the energy consumption structure. Table 7 and Figure 5 show the efficiency values for each region.
For the average value of electricity substitution efficiency of each region, the eastern is the highest, next is the central, while the western region is the lowest, showing the pattern of “east > central > west”, which is consistent with the traditional economic pattern. Most of the eastern regions are coastal, with convenient water, land and air transportation, creating sound geographical conditions for economic development, while the warm and humid climate attracts a greater level of talent. Therefore, the eastern region is a region with a developed economy, rich industries and talent, which can continuously provide new power growth points in the promotion of electricity substitution, resulting in a high efficiency of electricity substitution in the eastern region. The central region has a relatively large plain area, rich in mineral resources, and heavy industry has become the backbone of many of its provinces, such as Jilin and Heilongjiang, which consume high levels of energy and coal and have a high potential for electricity substitution. For these reasons the efficiency of electricity substitution in the central region is in the middle of the range. However, in the western region, the terrain is complex, with many mountainous plateaus and sparsely populated areas. Such geographical conditions lead to a lower proportion of electricity consumption in secondary industries than in the central region, and economic development remains significantly behind that of the central and eastern regions, resulting in the western region presenting the lowest efficiency of electrical energy substitution.
For the pure technical efficiency of electricity substitution, the eastern region is the highest, and the central and western regions are not very different. The reasons for this phenomenon are: the eastern region develops more economically, possesses a more advanced concept for and higher levels of government support for electricity substitution, which provides greater support for improving the pure technical efficiency of electricity substitution. However, the central and western regions have a lower technical level of electricity substitution and a less developed concept for electricity substitution, making them less efficient than the eastern region.
The scale efficiency of electricity substitution shows a pattern of “East > Central > West”. there is a minor difference in scale efficiency between the eastern and central regions, and the western region has the lowest efficiency. Overall, the scale efficiency level is low, indicating that before continuing to promote the work of electrical energy substitution, the input factors should be reasonably allocated, on their existing basis, so that the scale of the input factors can play a prominent role, rather than expanding the factor inputs to improve efficiency.

5. Conclusions and Recommendations

In 2020, at the United Nations General Assembly, China proposed a double carbon target, namely, to achieve carbon peaking by 2030 and carbon neutrality by 2060. This major announcement acts as China’s solemn commitment to the world, and it also demonstrates China’s responsibility and commitment to actively address global climate change. The fundamental solutions to achieve this goal are to transform the energy development mode and accelerate clean substitution in energy production as well as to provide electric energy substitution with regard to energy consumption. Electricity substitution is an important method for achieving carbon neutrality and is significant in advancing the energy consumption revolution and promoting clean energy development. So, it is urgent for provinces and municipalities to vigorously promote electricity substitution.
In response to the current scarcity of research on the efficiency of electricity substitution inputs and outputs in provincial areas in China, this paper applies a three-stage DEA model to calculate the efficiency of electricity substitution in 30 Chinese provinces and cities in 2017, and analyses the potential external environmental influences. The main conclusions are as follows.
(1)
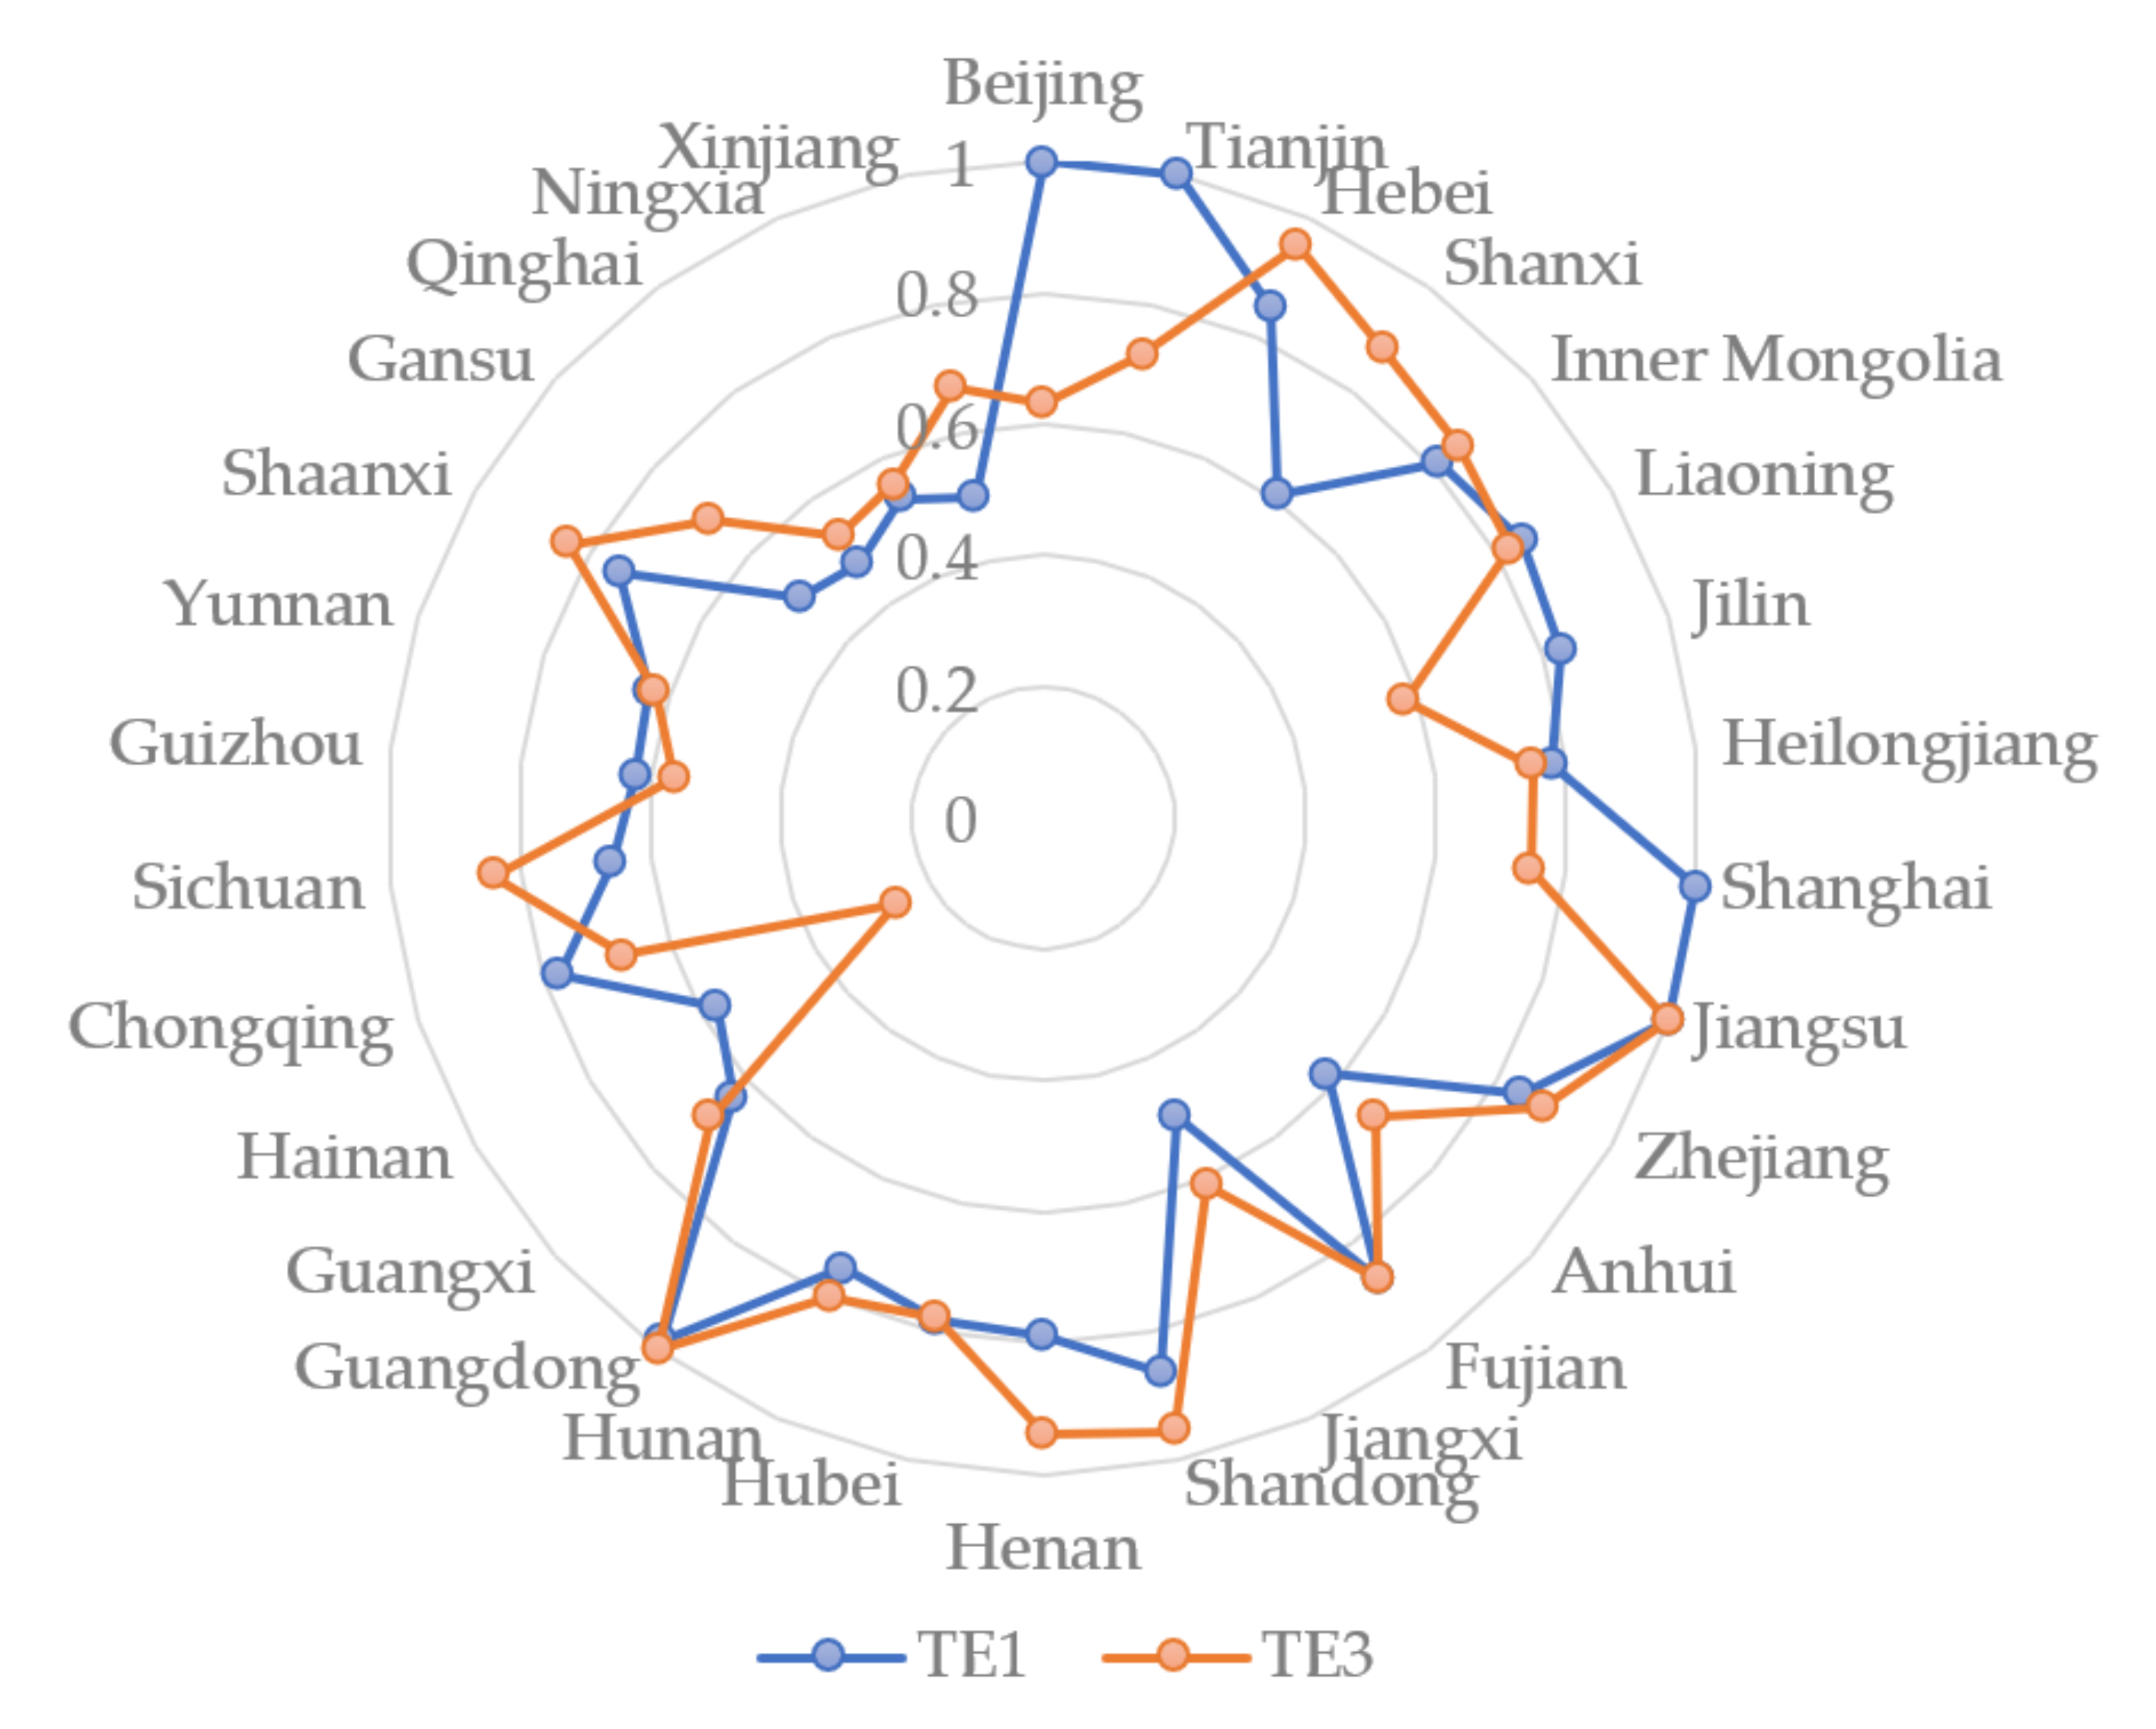
By comparing the first stage to the third stage, it can be found that there is indeed a significant variation between the electricity substitution efficiency in 30 provinces and municipalities in China, and this difference indicates that the electricity substitution efficiency in China is influenced by the external objective environment and random errors. Further analysis, after removing the effects of environmental variables and stochastic factors, reveals that our electricity substitution efficiency values have decreased compared to the values in the first phase.
(2)
All Chinese provinces and municipalities are in the incremental scale stage, indicating that economies of scale have not yet been realized, and therefore production should be expanded to further improve the efficiency of electricity substitution [37].
(3)
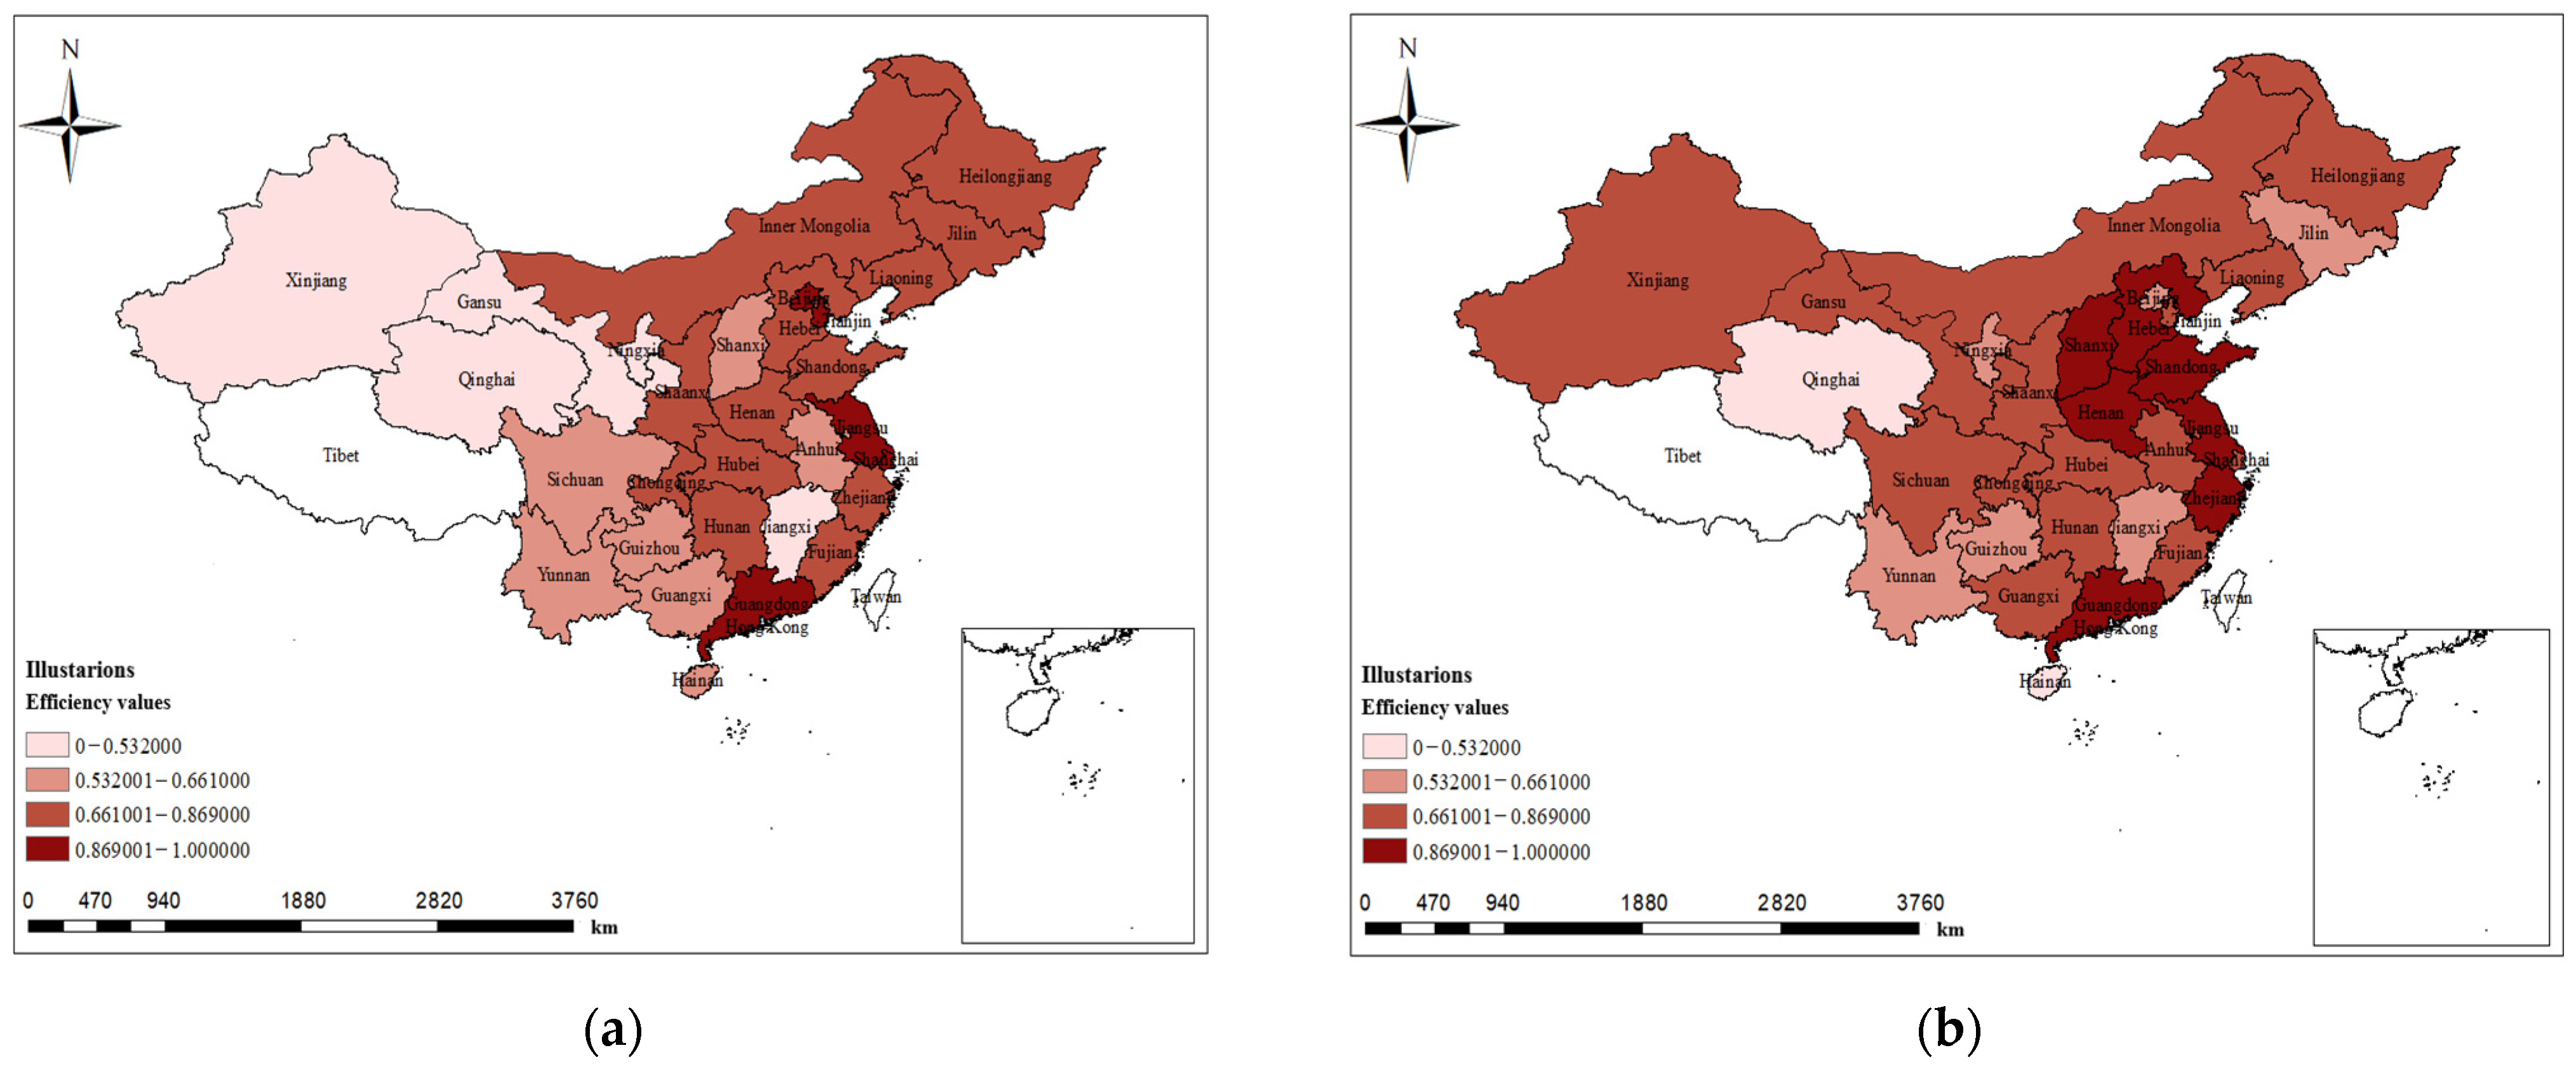
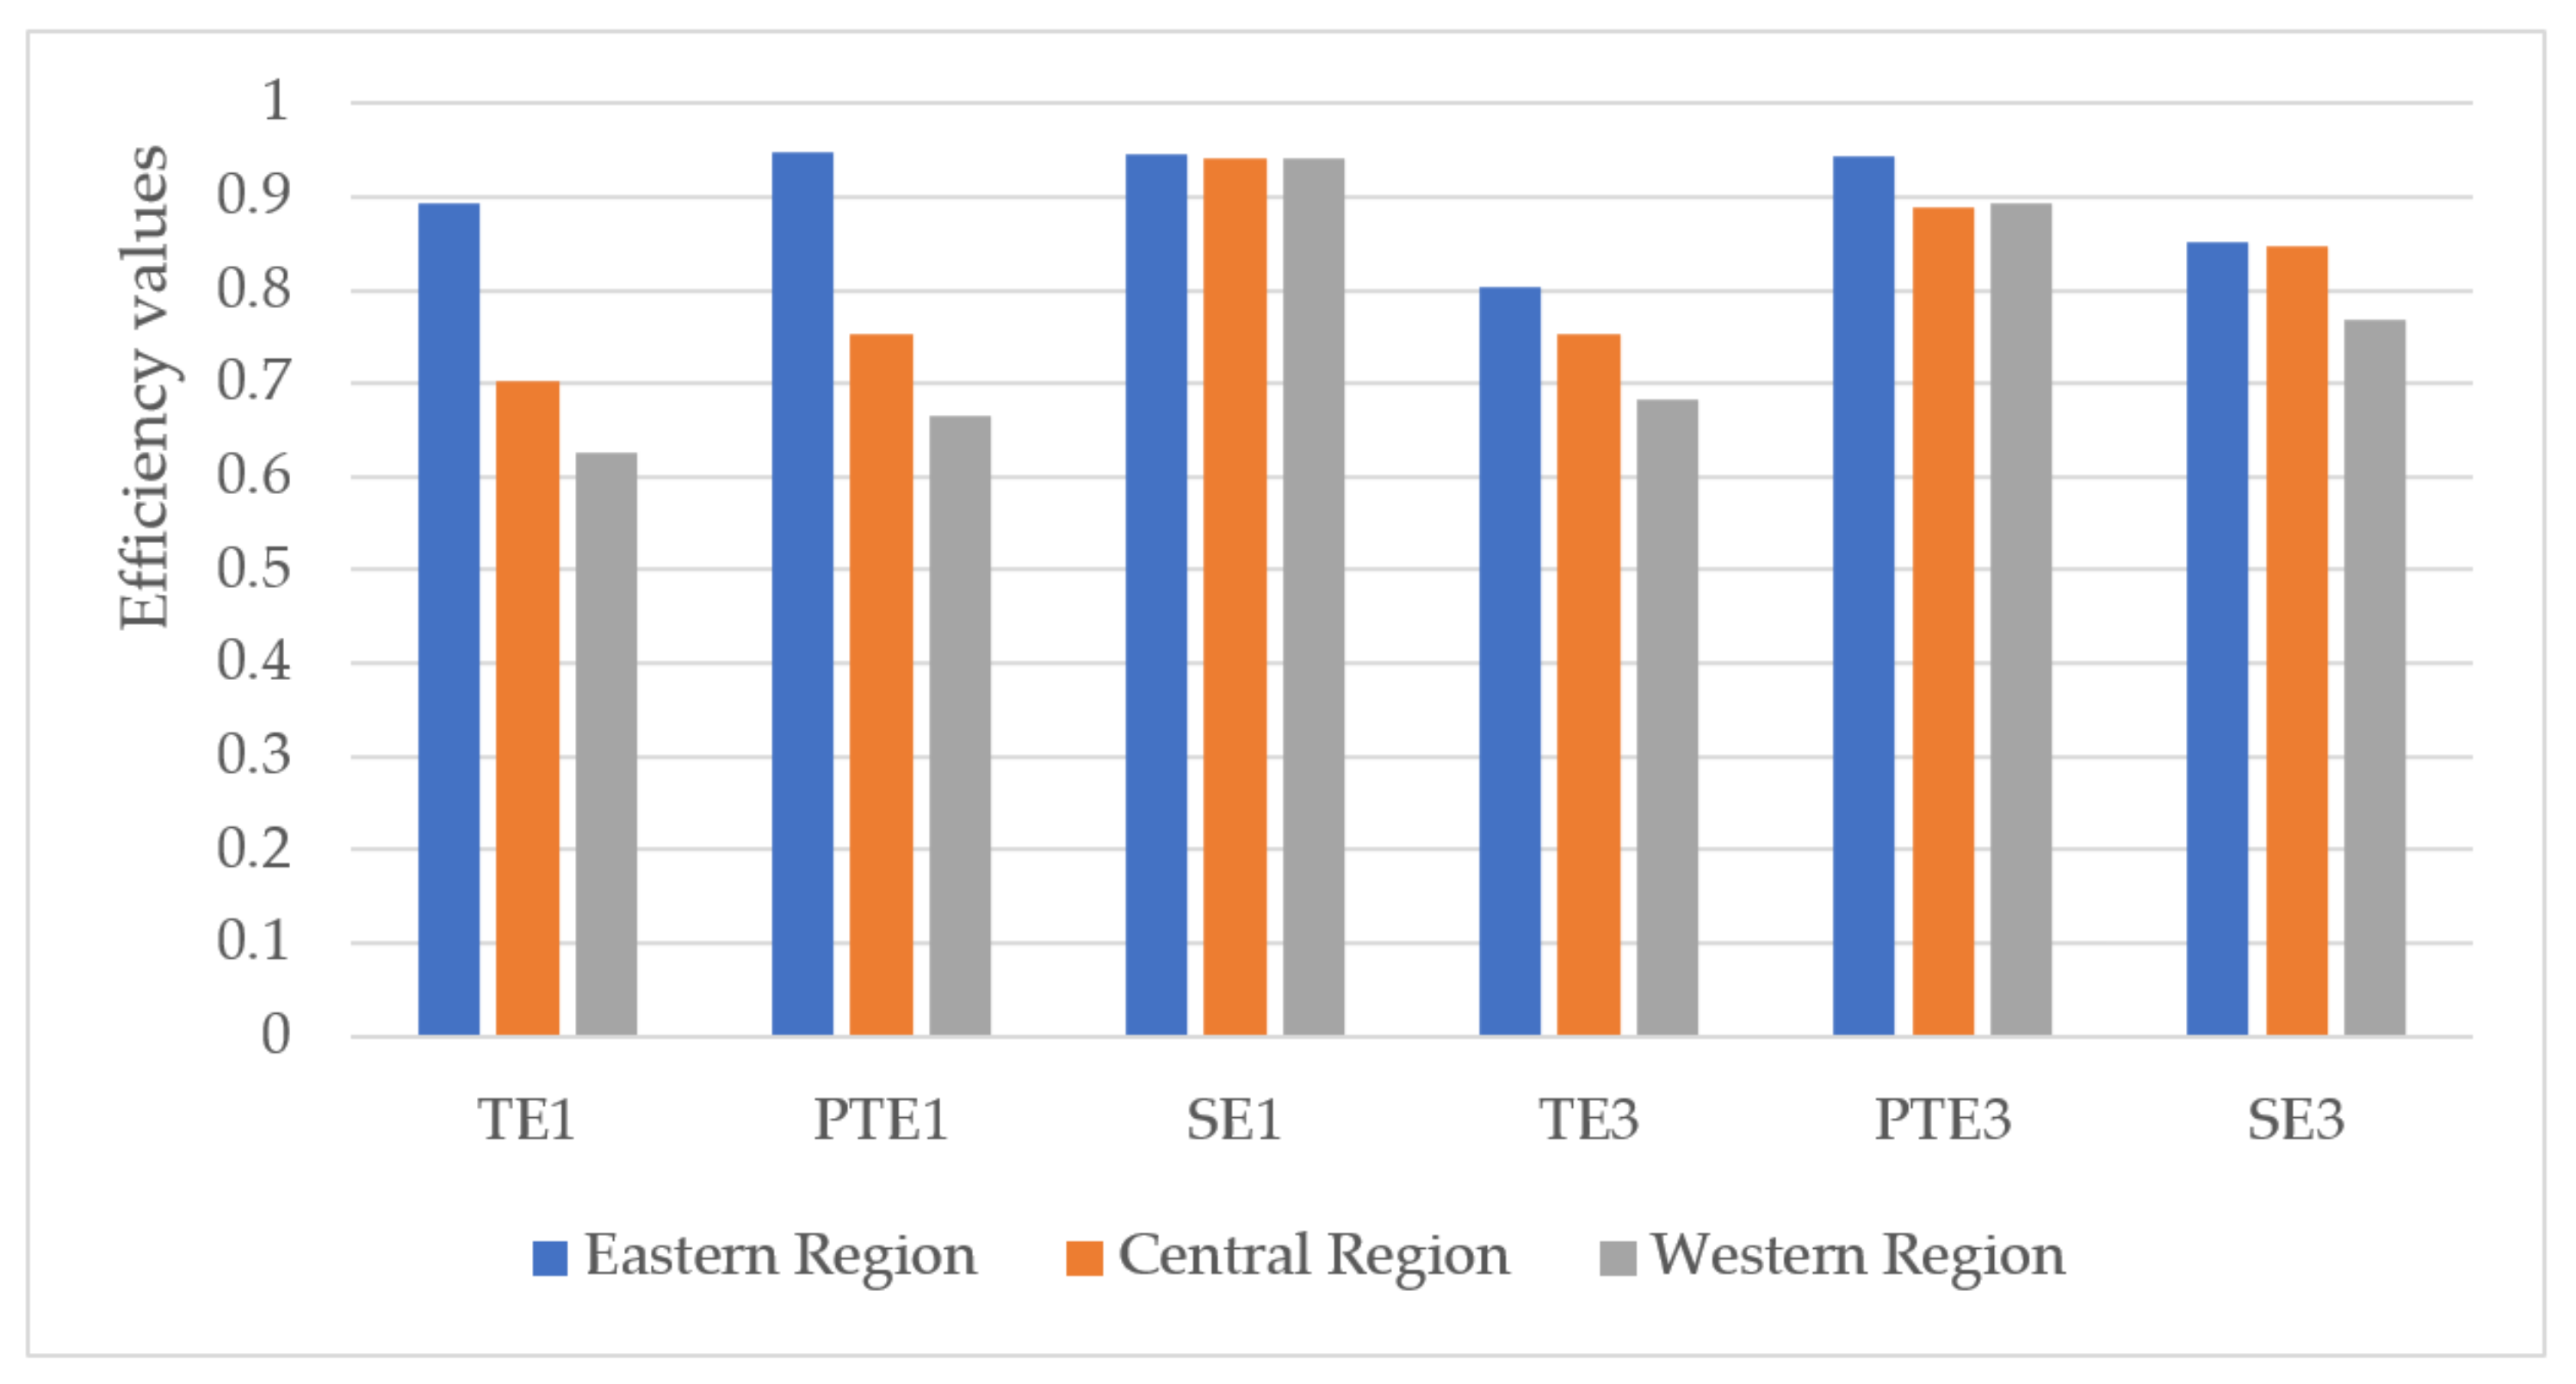
The efficiency of electricity substation varies regionally (East-Central-West). By comparing the electricity substitution efficiency values of the three regions of East, West and Central, we can find that the highest electricity substitution efficiency is in the East, while lower electricity substitution efficiency exists in the Central and Western regions, and there is a great potential for electricity substitution [38].
In response to the above conclusions, we make the following recommendations, theoretically guiding the provinces and municipalities in carrying out electrical energy substitution work:
(1)
Provinces and municipalities should adjust the allocation of factors and increase the scale of production. The empirical results show that China is at the stage of increasing scale, and to enhance the efficiency of electricity substitution, it is necessary to optimize the allocation of factors, and to avoid wasting factors, while increasing factor inputs, with the aim of maximizing the efficiency of factor use.
(2)
It is also important to strengthen the exchange of technologies between regions and to implement differentiated electricity substitution strategies. From the empirical results, it can be seen that the efficiency of electricity substitution has regional variations. To better implement the task of electricity substitution and to narrow the gap in the efficiency of electricity substitution between regions, we should strengthen the exchange of talents and technology between regions, draw on the successful experience of the eastern region, implement electricity substitution strategies according to local conditions, and undertake electricity substitution work in a focused manner. For the western region, where the efficiency of electricity substitution is low, the state should also increase financial investment and provide further technical and policy related support to comprehensively promote electricity substitution and improve the overall level of electricity substitution, so as to achieve sustainable energy development as soon as practicably possible.

Author Contributions

Writing—original draft preparation, T.G. and Z.J.; conceptualization, Y.L. and G.W.; writing—review and editing, D.N. All authors have read and agreed to the published version of the manuscript.

Funding

The work described in this paper is supported by the National Key Research and Development Program of China (Grant No. 2020YFB1707801).

Institutional Review Board Statement

Not applicable.

Informed Consent Statement

Not applicable.

Data Availability Statement

Publicly available datasets were analyzed in this study. This data can be found here: http://www.stats.gov.cn/tjsj/ndsj/2018/indexch.htm; https://data.cnki.net/area/Yearbook/Single/N2019080025?z=D20 (accessed on 15 March 2021).

Conflicts of Interest

The authors declare no conflict of interest.

Nomenclature

GRAGrey Relation Analysis
ANPAnalytic Network Process
AHPAnalytic Hierarchy Process
PSO-SVMParticle Swarm Optimization-Support Vector Machine
SSASalp Swarm Algorithm
LSSVMLeast Squares Support Vector Machine
PCAPrincipal Component Analysis
TOPSISTechnique for Order Preference by Similarity to Ideal Solution
DEAData Envelopment analysis
SFAStochastic Frontier Analysis
BCCvariable returns to scale
TETechnical Efficiency
SEScale Efficiency
PTEPure Technical Efficiency

References

  1. Ang, B.W.; Goh, T. Carbon intensity of electricity in ASEAN: Drivers, performance and outlook. Energy Policy 2016, 98, 170–179. [Google Scholar] [CrossRef]
  2. Chang, C.L.; Mai, T.K.; McAleer, M. Establishing national carbon emission prices for China. Renew. Sustain. Energy Rev. 2019, 106, 1–16. [Google Scholar] [CrossRef] [Green Version]
  3. Fernandez-Fuentes, M.H.; Eras-Almeida, A.A.; Egido-Aguilera, M.A. Characterization of Technological Innovations in Photovoltaic Rural Electrification, Based on the Experiences of Bolivia, Peru, and Argentina: Third Generation Solar Home Systems. Sustainability 2021, 13, 3032. [Google Scholar] [CrossRef]
  4. Xie, L.; Liang, S.M. Electricity substitution and eco-efficiency: Empirical evidence from the provincial level in China. J. Cent. South Univ. Soc. Sci. 2017, 23, 91–100. (In Chinese) [Google Scholar]
  5. Chen, H.; He, L.; Chen, J.; Yuan, B.; Huang, T.; Cui, Q. Impacts of Clean Energy Substitution for Polluting Fossil-Fuels in Terminal Energy Consumption on the Economy and Environment in China. Sustainability 2019, 11, 6419. [Google Scholar] [CrossRef] [Green Version]
  6. China Electricity Council. State Grid Corporation of China Starts Power Substitution Work. Available online: http://www.cec.org.cn/yaowenkuaidi/2013-08-20/107672.html (accessed on 15 August 2013).
  7. Li, S.Q.; Yang, J. Study on Development Trend of Electric Power Replacement Technology Based on Analysis on Current Situation. Smart Power 2017, 45, 70–74. (In Chinese) [Google Scholar]
  8. Schill, W.P.; Zerrahn, A. Flexible electricity use for heating in markets with renewable energy. Appl. Energy 2020, 266, 114571. [Google Scholar] [CrossRef]
  9. Zhang, Q.; Zhu, Y.; Wang, Z.; Su, Y.J.; Li, C.Y. Reliability Assessment of Distribution Network and Electric Vehicle Considering Quasi-Dynamic Traffic Flow and Vehicle-to-Grid. IEEE Access 2019, 7, 131201–131213. [Google Scholar] [CrossRef]
  10. Cannon, C.; Gao, Y.; Wunder, L. Port of Los Angeles—Shanghai Municipal Transportation Commission EcoPartnership on shore power. J. Renew. Sustain. Energy 2015, 7, 041507. [Google Scholar] [CrossRef]
  11. He, Y.X.; Guang, F.T.; Wang, M.Y. The efficiency of electricity-use of China and its influencing factors. Energy 2018, 163, 258–269. [Google Scholar] [CrossRef]
  12. Dong, J.; Li, R.; Huo, H.J. Economical-environment impact of electricity substitution of fossil energies in China. J. Renew. Sustain. Energy 2017, 9, 065909. [Google Scholar] [CrossRef]
  13. Liu, K.Z.; Xu, Y.; Liu, D.X.; Liu, T.; Ruan, J.X. A Comprehensive Benefit Analysis Model of Electric Energy Substitution for User Side. J. Kunming Univ. Sci. Technol. Nat. Sci. 2020, 45, 81–91. (In Chinese) [Google Scholar]
  14. Chong, Q.Q.; Cheng, L.; Zhong, M.; Feng, W.; Wang, S.C.; Yang, D.S. Fuzzy comprehensive evaluation of environmental benefits of electric energy substitute technology based on improved ANP. Electr. Meas. Instrum. 2017, 54, 103–109. (In Chinese) [Google Scholar]
  15. Miao, C.H.; Liang, J.L.; Guo, Y.F.; Luo, Y.H.; Cheng, L. Efficiency evaluation of alternative energy based on AHP and grey relation analysis. Control Eng. China 2018, 25, 903–909. (In Chinese) [Google Scholar]
  16. Wu, J.; Tan, Z.F.; De, G.; Pu, L.; Wang, K.K.; Tan, Q.K.; Ju, L.W. Multiple Scenarios Forecast of Electric Power Substitution Potential in China: From Perspective of Green and Sustainable Development. Processes 2019, 7, 584. [Google Scholar] [CrossRef] [Green Version]
  17. Liu, Y.J.; Cheng, H.; Yi, H. Electric Energy Substitution Potential Prediction Based on Logistic Curve Fitting and Improved BP Neural Network Algorithm. Elektron. Ir Elektrotechnika 2019, 25, 18–24. [Google Scholar] [CrossRef]
  18. Sun, Y.; Shi, M.; Shan, B.G.; Cao, F. Electric Energy Substitution Potential Analysis Method Based on Particle Swarm Optimization Support Vector Machine. Power Syst. Technol. 2017, 41, 1767–1771. (In Chinese) [Google Scholar]
  19. Wang, Y.L.; Wang, S.; Song, F.H.; Yang, J.; Zhang, F. Study on the forecast model of electricity substitution potential in Beijing-Tianjin-Hebei region considering the impact of electricity substitution policies. Energy Policy 2020, 144, 111686. [Google Scholar] [CrossRef]
  20. Liu, K.Z.; Wang, Q.; Luo, Z.; Zhao, X.P.; Su, S.; Zhang, X.D. Planning mechanism design and benefit analysis of electric energy substitution: A case study of tobacco industry in Yunnan province, China. IEEE Access 2020, 8, 12867–12883. [Google Scholar] [CrossRef]
  21. Chen, H.; Chen, W.Y. Potential impact of shifting coal to gas and electricity for building sectors in 28 major northern cities of China. Appl. Energy 2019, 36, 1049–1061. [Google Scholar] [CrossRef]
  22. Xia, H.J.; Lin, H.Y.; Zhang, W.; Yang, S.; Guo, W.; Miao, B.; Chen, Q.C. Research on Development Potential of Regional Electric Energy Substitution Based on Multi Model. Sci. Technol. Manag. Res. 2018, 38, 241–246. (In Chinese) [Google Scholar]
  23. Li, Y.M.; Chen, Z. Evaluation Index System and Evaluation Method of China’s Regional Potential for Electrical Energy Substitution. Math. Probl. Eng. 2018, 2018, 3834921.1–3834921.16. [Google Scholar] [CrossRef]
  24. Du, Y.; Ma, J.J.; Xiang, K.L. Research on the Energy Emission Efficiency and Influencing Factors of Fujian Province Based on Three-Phase DEA Model. Chuang Xin Ke Ji 2019, 19, 8–19. (In Chinese) [Google Scholar]
  25. Zhao, C.H.; Zhang, H.N.; Zeng, Y.R.; Li, F.Y.; Liu, Y.X.; Qin, C.J.; Yuan, J.H. Total-Factor Energy Efficiency in BRI Countries: An Estimation Based on Three-Stage DEA Model. Sustainability 2018, 10, 278. [Google Scholar] [CrossRef] [Green Version]
  26. Tsai, W.H.; Lee, H.L.; Yang, C.H.; Huang, C.C. Input-Output Analysis for Sustainability by Using DEA Method: A Comparison Study between European and Asian Countries. Sustainability 2016, 8, 1230. [Google Scholar] [CrossRef] [Green Version]
  27. Gorman, M.F.; Ruggiero, J. Evaluating US state police performance using data envelopment analysis. Int. J. Prod. Econ. 2008, 113, 1031–1037. [Google Scholar] [CrossRef]
  28. Fidanoski, F.; Simeonovski, K.; Cvetkoska, V. Energy Efficiency in OECD Countries: A DEA Approach. Energies 2021, 14, 1185. [Google Scholar] [CrossRef]
  29. Yu, C.; Xiong, S.Q.; Ma, X.M. Energy efficiency measures in China: A three-stage DEA analysis. IOP Conf. Ser. Earth Environ. Sci. 2017, 61, 012056. [Google Scholar]
  30. Fried, H.O.; Lovell, C.A.K.; Schmidt, S.S.; Yaisawarng, S. Accounting for environmental effects and statistical noise in data envelopment analysis. J. Prod. Anal. 2002, 17, 157–174. [Google Scholar] [CrossRef]
  31. Ebrahimnejad, A.; Tavana, M.; Lotfi, F.H.; Shahverdi, R.; Yousefpour, M. A three-stage Data Envelopment Analysis model with application to banking industry. Measurement 2014, 49, 308–319. [Google Scholar] [CrossRef]
  32. Yin, Q.; Wang, Y.; Wan, K.; Wang, D. Evaluation of Green Transformation Efficiency in Chinese Mineral Resource-Based Cities Based on a Three-Stage DEA Method. Sustainability 2020, 12, 9455. [Google Scholar] [CrossRef]
  33. Wu, W.L.; Cheng, Y.Y.; Lin, X.Q.; Yao, X. How does the implementation of the Policy of Electricity Substitution influence green economic growth in China? Energy Policy 2019, 131, 251–261. [Google Scholar] [CrossRef]
  34. Dong, F.; Long, R.; Bian, Z.; Xu, X.; Yu, B.; Wang, Y. Applying a Ruggiero three-stage super-efficiency DEA model to gauge regional carbon emission efficiency: Evidence from China. Nat. Hazards 2017, 87, 1453–1468. [Google Scholar] [CrossRef]
  35. Fang, K.; Hong, X.; Li, S.; Song, M.; Zhang, J. Choosing competitive industries in manufacturing of China under low-carbon economy: A three-stage DEA analysis. Int. J. Clim. Chang. Strateg. Manag. 2013, 5, 431–444. [Google Scholar] [CrossRef]
  36. Liu, Y.W.; Hu, Z.Y. A Study of Regional Variability in Carbon Emission Efficiency in China—An Analysis Based on Three-Stage DEA Model and Super-Efficiency DEA Model. J. Shanxi Univ. Financ. Econ. 2015, 37, 23–34. (In Chinese) [Google Scholar]
  37. Li, K.; Lin, B.Q. Impact of energy conservation policies on the green productivity in China’s manufacturing sector: Evidence from a three-stage DEA model. Appl. Energy 2016, 168, 351–363. [Google Scholar] [CrossRef]
  38. Liu, M.F.; Li, S.H. A study on innovation efficiency of high-tech development zones in China based on a three-stage DEA model. Manag. Rev. 2016, 28, 42–52, 155. (In Chinese) [Google Scholar]
Figure 1. Flowchart of the provincial electricity substitution efficiency analysis.
Energies 14 06650 g001
Figure 2. Process diagram of the three-stage DEA model.
Energies 14 06650 g002
Figure 3. Efficiency comparison between the first and third stages.
Energies 14 06650 g003
Figure 4. Regional differences in efficiency between the first and third stages. (a) Regional characteristics of efficiency in the first stage. (b) Regional characteristics of efficiency in the third stage.
Energies 14 06650 g004
Figure 5. Average efficiency for each region.
Energies 14 06650 g005
Table 1. Index system for evaluating the efficiency of electricity substitution.
Index TypeIndexIndex Meaning
Output indexesElectricity substitution powerY1 Electricity produced by electricity substitution projects by province/billion kWh
Annual coal savingsY2 Standard coal saved by electricity substitution/104 tons
Input indexesInvestment in electricity assetsX1 Total investment in electricity construction by province/100 million yuan
Number of electricity substitution projectsX2 Number of electricity substitution projects implemented in each province in 2017/each
Table 2. Pearson correlation coefficients for input and output variables.
Y1Y2X1X2
Y1Pearson Correlation10.976 **0.854 **0.926 **
Sig. (2-tailed) 0.0000.0000.000
N30303030
Y2Pearson Correlation0.976 **10.816 **0.866 **
Sig. (2-tailed)0.000 0.0000.000
N30303030
X1Pearson Correlation0.854 **0.816 **10.795 **
Sig. (2-tailed)0.0000.000 0.000
N30303030
X2Pearson Correlation0.926 **0.866 **0.795 **1
Sig. (2-tailed)0.0000.0000.000
N30303030
** indicates a significant correlation at the 0.01 level (two-tailed).
Table 3. Electricity substitution efficiency values for the first stage.
RegionTE1PTE1SE1Return to ScaleRegionTE1PTE1SE1Return to Scale
Beijing111-Hubei0.7830.7841-
Tianjin111-Hunan0.750.7580.993drs
Hebei0.8510.8920.953drsGuangdong0.98510.985drs
Shanxi0.6090.7370.826drsGuangxi0.6350.6420.99drs
Inner Mongolia0.8110.8150.995irsHainan0.57510.575irs
Liaoning0.8440.8530.989irsChongqing0.7740.8180.946irs
Jilin0.8310.9940.836irsSichuan0.6610.6930.954drs
Heilongjiang0.7780.8190.951irsGuizhou0.6250.7530.83irs
Shanghai111-Yunnan0.6320.6920.914irs
Jiangsu111-Shaanxi0.7470.7610.981drs
Zhejiang0.8410.8710.965drsGansu0.50.5770.865irs
Anhui0.5820.5910.986drsQinghai0.480.5160.931irs
Fujian0.8690.9190.946drsNingxia0.5320.5520.964irs
Jiangxi0.4990.5150.97irsXinjiang0.4980.5060.985drs
Shandong0.8630.8830.977drs
Henan0.7880.8150.967drsAverage value0.7450.7920.942
TE1, PTE1 and SE1 are technical efficiency, pure technical efficiency, scale efficiency of the first stage of electricity substitution; irs, drs and - represent increasing, decreasing and constant returns to scale.
Table 4. The regression results of the 2nd SFA stage.
Investment in Electricity AssetsNumber of Electricity Substitution Projects
Constant term7.83 ***55.09 ***
Levels of government support59.16 **132.82 ***
The energy consumption structure90.31 ***71.09 *
GDP per capita−207.59 ***−449.09 ***
σ 2 33,829.28 ***146,229.54 ***
γ 1.00 ***1.00 ***
Log likelihood function−186.97−201.88
LR test of the one-sided error9.0210.32
***, ** and * represent passing tests at 1%, 5% and 10% significance levels respectively.
Table 5. Electricity substitution efficiency values for the third stage.
RegionTE1PTE1SE1Return to ScaleRegionTE1PTE1SE1Return to Scale
Beijing0.6310.7810.808irsHubei0.7770.8570.906irs
Tianjin0.720.9090.792irsHunan0.8010.9280.863irs
Hebei0.9540.9610.993irsGuangdong111-
Shanxi0.8820.9050.975-Guangxi0.6830.7820.873irs
Inner Mongolia0.8490.9750.871irsHainan0.25910.259irs
Liaoning0.8220.9070.906irsChongqing0.67210.672irs
Jilin0.57910.579irsSichuan0.8420.8840.953irs
Heilongjiang0.7520.9880.761irsGuizhou0.56610.566irs
Shanghai0.7470.950.786irsYunnan0.6220.890.698irs
Jiangsu111-Shaanxi0.8340.9130.913irs
Zhejiang0.880.9310.945irsGansu0.67910.679irs
Anhui0.6820.7510.908irsQinghai0.5320.8410.632irs
Fujian0.8670.9650.899irsNingxia0.5580.8050.693irs
Jiangxi0.6110.7680.796irsXinjiang0.670.7490.894irs
Shandong0.9550.9730.982-
Henan0.9390.9110.998irsAverage value0.7460.9140.815
TE3, PTE3 and SE3 are similar to above, except this is the third stage; irs, drs and - are the same with above.
Table 6. Efficiency comparison between the first and third stages.
RegionEfficiency in the First StageRankingEfficiency in the Third StageRankingRanking Change
Beijing110.63123−22
Tianjin110.7217−16
Hebei0.85180.95444
Shanxi0.609230.882617
Inner Mongolia0.811120.84993
Liaoning0.84490.82212−3
Jilin0.831110.57926−15
Heilongjiang0.778150.752150
Shanghai110.74716−15
Jiangsu11110
Zhejiang0.841100.8873
Anhui0.582240.682195
Fujian0.86960.8678−2
Jiangxi0.499280.611253
Shandong0.86370.95534
Henan0.788130.93958
Hubei0.783140.777140
Hunan0.75170.801134
Guangdong0.9855114
Guangxi0.635200.683182
Hainan0.575250.25930−5
Chongqing0.774160.67221−5
Sichuan0.661190.842109
Guizhou0.625220.56627−5
Yunnan0.632210.62224−3
Shaanxi0.747180.834117
Gansu0.5270.679207
Qinghai0.48300.532291
Ningxia0.532260.55828−2
Xinjiang0.498290.67227
Table 7. The average efficiency of the three regions.
RegionProvincial CompositionStage 1Stage 3
TE1PTE1SE1TE3PTE3SE3
Eastern RegionBeijing, Tianjin, Hebei, Liaoning, Shandong, Shanghai, Jiangsu, Zhejiang, Guangdong, Fujian, Hainan0.8930.9470.9460.8030.9430.852
Central RegionShanxi, Jilin, Heilongjiang, Anhui, Henan, Hubei, Hunan, Jiangxi0.7030.7520.9410.7530.8890.848
Western RegionChongqing, Sichuan, Yunnan, Guangxi, Xinjiang, Inner Mongolia, Gansu, Shaanxi, Ningxia, Qinghai, Guizhou0.6270.6660.9410.6820.8940.768
Publisher’s Note: MDPI stays neutral with regard to jurisdictional claims in published maps and institutional affiliations.

