1. Introduction
Multiple sequences and parallel PV panels construct the PV series. PV panels have an estimated lifespan of 20–30 years. In regions with a severe environment, solar panels are often installed. Therefore, PV arrays can be quickly affected by environmental conditions such as extreme humidity, strong winds, heavy rain, and harvest, that may result in decay or harm to the soil. Long-term exposure to UV light can intensify the aging of PV materials. PV sequence faults include short circuit breakdown, incomplete flashing, aging defect, the lack of an open connection, arc malfunction, trouble spots, etc. The DC side of the PV network is usually connected to conventional shielding devices, such as the Current Protective Equipment (CPD), Generator Functions, interrupters, Arc loss circuit breakers, etc., to avoid faults from impacting the PV network.
Several variables, including weather conditions, partial shadowing, dust/snow buildup on the modules, wire losses, age, or the malfunctioning of any system component, may have an impact on the dependability of a PV system. Occasionally, problems may be unnoticed by the operators for an extended length of time. Furthermore, it can decrease the electricity output by 18.9 percent. Because of this, it is critical to progress. Techniques for detecting and diagnosing the development of faults in photovoltaic (PV) systems. The Direct Current (DC) side of a PV system may have problems, as can the Alternate Current (AC) side. It is possible for solar PV modules, converters, the Maximum Power Point Tracking (MPPT), and storage system on the solar array to be affected on the DC side. PV module failures are very important since they are the generating unit of a PV system. Faults that happen to the output power of this gadget may considerably affect the PV settings. Additionally, it has the potential to be harmful based on its effectiveness and longevity.
However, detecting early stage faults and compensating for a broad range of faults is difficult for current PV array protection systems. In addition, inverter MPPT technology may also influence the efficiency of these safety products. Therefore, the electronic photovoltaic fault management device is one of the most critical problems to fix. To ensure a maximum energy conservation and an efficient electricity output, regulators and the frequent monitoring of grid-connected photovoltaic systems are necessary. Because of the vast number of PV systems today, the production of diagnostic methods for identifying malfunctions in the conduction of PV systems will improve their efficiency. The failures in the PV network primarily involve PV, MPPT modules, DC/ AC, an inventory, and reverse grid generators. In this analysis, the PV series are checked for errors. A modern protection method is implemented to detect faults in photovoltaic devices. The algorithm can be used to classify a defective PV module with a PV array, a defective PV package, a faulty MPPT sequence, and other shading conditions. The proposed algorithm compares two different methods for classifying failure conditions.
Artificial Neural Network: ANN has already been extended to specific areas, including pattern detection, signal processing, etc. ANN is used as a fault analysis method inside the PV array in this paper.
Fuzzy Logic Fault Classification Approach: Fuzzy logical systems (FLSs) are popular for their linguistic capacity and device inconsistencies. Owing to this power, FLSs have been successfully used for identification, model-based regulation, I/O mapping, and feature approximation, to name some, which resulted in their usage in numerous application modeling and control approaches such as medical science, finance and communication, and organizational analysis. In recent years, the usage of FLSs in modern technologies has become increasingly significant. Two forms of fuzzy control systems are involved: Mamdani and Sugeno. Using the type 2 device improvement schemes will improve the process efficiency.
This paper is structured as follows:
Section 1 addresses the PV device failures in the photovoltaic field. The related existing methodologies are depicted in
Section 2. The technique used for the fault identification is defined in
Section 3, while the findings and explanation for the study are in
Section 4.
Section 5, ultimately, summarizes the paper.
2. Related Works
Ahmadi et al. [
1] concluded that a high-frequency portion analysis technique is proposed to identify the serial arc fault incidence of the voltage signals obtained from the Kalman filter. A criterion, for this reason, is described by the energy variations of the harmonics calculated. Akram et al. [
2] proposed a new method to identify defects in EL pictures, which results in a state-of-the-art 93.02 percent of solar cell data collection in EL photos, which the light convolutional neural network architecture implements.
Amaral and Pires [
3] suggested a new detection process. It focuses on the study of pattern detection. In this way, the PV module posing an issue in the tracker can be identified by the many solar panels. After the pre-processing phase is implemented, the orientation of the PV modules is calculated using the centroid of the PV cells. The angle may be determined by mathematical moments or by the pitch of the line linking two central cells from the PV panel. Several research cases are sent to check the approach’s efficacy. Benkercha and Moulahoum [
4] proposed a new method to identify and diagnose faults in the GCPVS and focus on the decision tree algorithm.
Bonsignore et al. [
5] presented the Photovoltaic Systems (PVS) defect detection process. This solution is measured using a neuro-Fuzzy method to measure the parameter sets of a PV module under different operating conditions. Chen et al. [
6] identified disruption events on the micro-distribution network, and suggest using the fractional-order dynamic-error-based fuzzy Petri net (FPN). The conversion of photovoltaic energy relies on solar radiation and temperature, and uses the optimum monitoring power point regulation for reliable power generation and stress at micro-distribution lots. Only a bisection-based technique monitors the PVECS voltage by changing the buck–boost converter job ratios when the required peak voltage is calculated. The maximum power drops are used to identify faults on the DC side relative to smart metering equipment. The RF-based diagnostic models suggested take the fault features of the PV arrays which do not apply to the environment conditions, only the real-time activity voltage and string currents (Chen et al. [
7]). In order to simplify the RF function parameters by the minimizing calculation of out-of-bag errors, a grid-search approach is often used to enhance the process of error diagnosis. Due to the non-linear performance characteristics and various PV arrays, various fault-diagnostic methods centered on machine learning were suggested by Chen et al. [
8]. Nevertheless, several problems remain: the efficiency of fault diagnostics is still restricted because of inadequate information; fault diagnostic models are not successful for training and updating; fault data samples identified by field experiments are difficult to achieve.
Chine et al. [
9] proposed the early fault identification and analysis of PV arrays were investigated using the Random Forest (RF) learning algorithm. The problem of the time-dependent non-linear filter induces a randomly dependent nonlinearity due to the setting and the combination of the Bernoulli white distributed series and the Type 2 T–S (Takagi–Sugeno) fuzzy system, with the solution of a repeated linear pattern equal by eliminating the signal from the sensor and the neighbor. We can see that prior studies have examined a wide range of faults in PV systems, but it seems to be more difficult to find fault diagnostic techniques implemented on integrated circuits. This is because, according to existing research, these methods have high costs and extensive hardware requirements. Dhimish and Badran [
10] submitted the creation of a new circuit for current limiters that can reduce the existing flow of the mismatched PV units, such as partial shade and the phenomena of hot spotting. The base of the suggested circuit consists, mainly, of an input buffer that makes high input impedance pressures and the regulation of the current flow of a built-in metal-oxide-semiconductor field-effect transistor (MOSFET). Therefore, it is possible to monitor the quantity of the current flow through the PV sub-strings and improve the production of output electricity. Comprehensive circuit simulations and numerous experiments demonstrate the efficiency of the circuit. Dhimish et al. [
11] designed a fault detection algorithm for a multi-group array photovoltaic array. Various parameters are calculated using a statistical model, including power, voltage, and current, for different circumstances, such as solar radiation and PV temperature.
Dhimish et al. [
12] showed that the PV Bypass diode should be graded based on Mamdani’s fuses process, which focuses on analyzing the PV board’s Vdrop, Voc, and Isc curves. The fluctuating logic scheme is based on the following three sections: the PVD, the POCV, and the PSCC. The new fuzzy system identifies up to 13 different errors of faulty or non-defeat bypass diodes. Fazai et al. [
13] considered a machine learning combined with the hypothesis of statistical testing for improved photovoltaic (PV) device failure detection results. The tool developed uses the Gaussian Process Regression (GPR) methodology as a simulation paradigm when adding a GLRT map to identify PV device failures. The GPR-dependent generalized likelihood ratio test (GLRT) method developed is evaluated using simulated PV data to measure the main PV (current, voltage, and power) device variables. In order to determine the efficiency of the solution suggested, the estimation period, missing detection rate (MDR), and false warning rate (FAR) are computed.
Fenz et al. [
14] proposed a new way of detecting arches in dc microgrids using a streamlined sensing idea by their High-Frequency (HF) spectral pattern. Hajji et al. [
15] developed an improved PV device’s fault FDD technique. The rising FDD procedure typically requires two essential steps: isolation, detection, and diagnosis of defects. For multivariate statistical systems, tracking the multivariate extraction and collection of features is quite critical. The simulation aspect can be that, and the tracking performance can be increased. Therefore, the key component analysis (PCA) methodology is used with the proposed FDD method to isolate and pick the most important multivariate attributes, and the SML classifiers for error diagnosis are added to the supervised machine learning system.
Janarthanan et al. [
16] proposed a rational framework both for suggesting and for faulty reasoning mechanisms for coping with this issue. Two laws are similar, where the second is created by transposing one or more first rule proposals with a separate sign on the other side of the inference. The ad hoc reasoning algorithm for the chained fluidized method aims to take care of the check’s difficulty and decide the shooting state of chained laws. Finally, the basic form of the thought method is used as a Petri-like net that eliminates the difficulty of rule shooting and order selection for clustered laws. Janarthanan et al. in [
17,
18] proposed the stretched propositional syntaxes and semantics, with fluctuating reasons, to transform/re-structure both of these laws into a fitting shape (by a rejection of and transposition of proposals from antecedent to consequent and vice versa), in order to instantiate (refute) the positive (negative) evidence in the previous proposals in order to render it necessary to make forward (backward) shooting clauses. For forward/backward logic, the subsequent fused compositional law of inference is used. Therefore, if the rules are embedded in a fuzzy network such as a framework of Petri net, the rules appear to fire arbitrarily in the forward or backward direction while holding a topological order.
Jia et al. [
19] investigated the photovoltaic system’s direct current (DC) arc loss identification. The DC arc fault in the photovoltaic device should be observed immediately to prevent the possibility of fire being triggered by the arc breakdown in the solar power supply. The power supply shuts down automatically until an arc loss is found. There are several on-the-ground studies under different conditions to collect arc defect current data from the photovoltaic system. Specific sensors measure the cable frequency, arc distance, and results. The three most critical aspects of this paper are specific circumstances. Kim et al. [
20] presented a recent arc fault model series, for example, in order to ensure accurate photovoltaic simulations. The concept is drawn from the different physical arc environments that contribute to particular air frequency spectrums. The model is based on pink interference used to derive the actual noise level, which is inversely proportional to the square frequency root on various routes in keeping with the physical condition of the arc.
Madeti and Singh [
21] proposed a modern strategy for fault identification that analyzes the abnormalities of terminal functionality and the resulting sequence of defective PV strings. The terminal stress gap between the healthy string module and the unsafe string module is used to diagnose faulty modules. Madeti and Singh [
22] proposed a photovoltaic (PV), k-nearest neighbors’ algorithm (kNN) rule-based fault identification, and a diagnostic technique for the string stage is suggested. It identifies and classifies in real-time open-circuit defects, line–line (L–L) errors, partial shading with diode defects and outputs, and partial shading with inverted bypass diode errors. Chine et al. (2016) developed a modern defect diagnostics technique for photovoltaic systems focused on ANN. Many parameters such as the temperature, voltage, and the sum of current–voltage (I–V) peaks on the PV strings are calculated with a simulation model for a particular solar and photovoltaic (PV) defect.
Mehrizi-Sani and Teymouri [
23] research proposed a strategy for using an approximate malfunction prediction algorithm in real-time for the Cascaded H-bridge (CHB)-based PV converter to robust sensor malfunctions. This method is supported by MATLAB/SIMULINK simulation studies and operating machine experiments. There is proof that a nine-tier PV device based on CHB will work even when there is no sensor calculation. Mekki et al. [
24] in part shadowed environments, implement a fault detection system for the photovoltaic board. This requires using an artificial neural network to predict the photovoltaic strength and voltage production under varying operating conditions. The calculated data were used at the REL Clean Energy Laboratory, University of Jijel, Algeria (solar radiation, cell temperature, photovoltaic current, and voltage).
Yadav and Tummuru [
25] proposed a DC microgrid protection system relying on the DC circuit breaker activity and the failure clearance times, which rely on the circuit breaker’s speed. Yi and Etemadi [
26] present a photovoltaic (PV) array identification scheme for a DC side short circuit error consisting of several PV panels attached to a serial/parallel system.
One similar work (Chine, W.; Mellit, A et al 2016) by Zhao et al [
27] is also inspired with such type of approach. Zhao et al. [
28] proposed that the FCM algorithm effectively defines various forms of fault distribution characteristics, decides how a fugitive Membership algorithm identifies the PV array operating parameters, and the benefit of the proposed approach is that the fault data from ordinary working data may be defined without prior knowledge. Zhu et al. [
29] proposed a fault diagnostic approach: the photovoltaic array output characteristics and electric prophecy distributors are effectively evaluated under normal fault conditions, and (ii) device efficiency and kernel feature in fuzzy implies that the algorithm to boost operation smoothness of the unmonitored panel for various forms.
From the above considerations, it is critical to develop techniques for detecting and diagnosing faults in photovoltaic (PV) systems. For this reason, the authors of this article present a fault detection method that combines artificial neural networks and fuzzy logic to identify short-circuited modules and disconnected strings in a photovoltaic (PV) power plant. It is critical to detect this kind of problem because it has the potential to significantly reduce power production. However, detecting this fault type may be time-consuming, particularly in large-scale power plants.
It is worth noting that the suggested approach is appropriate and trustworthy when pre-existing sensors are used and that the training dataset is acquired via a simulation rather than lengthy data from an actual PV system, which is a significant benefit of this study. Furthermore, since the technique does not need a comparison of simulated outcomes with observed data, it is simpler to understand and use.
However, for the kind of devices we use in the real world and the IoT, it is essential to use hardware for diagnostic methods. IoT-enabled applications are internet-based software that are easy to administer and keep track of. This article’s primary advantage is introducing a simple, easy-to-implement NARX neural network-based method with a non-linear autoregressive exogenous fuzzy inference component. The system’s algorithm attempts to find and isolate any errors that happen in a PV system. A system forecasts a PV system’s maximum output power using the NARX network and fuzzy inference algorithm. This system uses the maximum output power to diagnose and classify problems in the PV system. This method is now known to be usable on an inexpensive microcontroller. The algorithm finds out about errors that may ruin the PV system, such as a poor MPPT, open circuits, and short circuits. Beyond that, patterns with non-linear relations such as radiation and temperature can be estimated.
3. Materials and Methods
The reason for identifying and representing the general fault detection algorithm of the PV data acquisition method was to implement the artificial neural network design and the Fuzzy logic interface method.
Appendix A can be refereed to see designed algorithms.
3.1. PV Data Acquirement
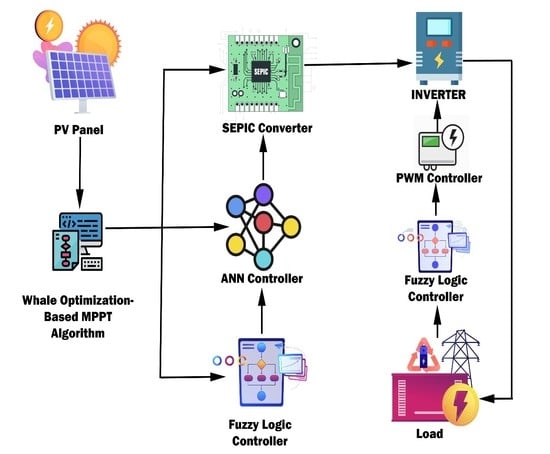
The PV network is a grid-connected PV component consisting of five polycrystalline silicon PV modules, each with a nominal capacity of 220 WP. The PV modules are linked in sequence. The photovoltaic string has the maximum power point tracker (MPPT) capability of no less than 95.0%. Internal sensors for calculating current and voltage used the FLEXmax MPPT sensor. The Vantage Pro tracking kit provided the Global Solar Radiance estimated from the pyrometer’s weather station. An external temperature monitor from Davis and the electric data for each photovoltaic chain were used for smoother temperature acquisition. The way LabVIEW uses dataflow naturally lends itself to parallel computation. If the application wants to perform more than one thing at a time, such as monitoring a temperature limit while collecting pressure information, LabVIEW makes this simple by putting in several parallel loops. Therefore, the proposed system uses the LabVIEW platform. The Lab VIEW program was used for the application of PV device data collection and tracking. The overall design of the photovoltaic network in seen in
Figure 1. The averaged measurements, obtained at 1 Hz over one minute, were measured in real time. Electricity, voltage, and power levels were measured at one-minute intervals.
3.2. Designing a Type 2 Fuzzy Logic Controller System
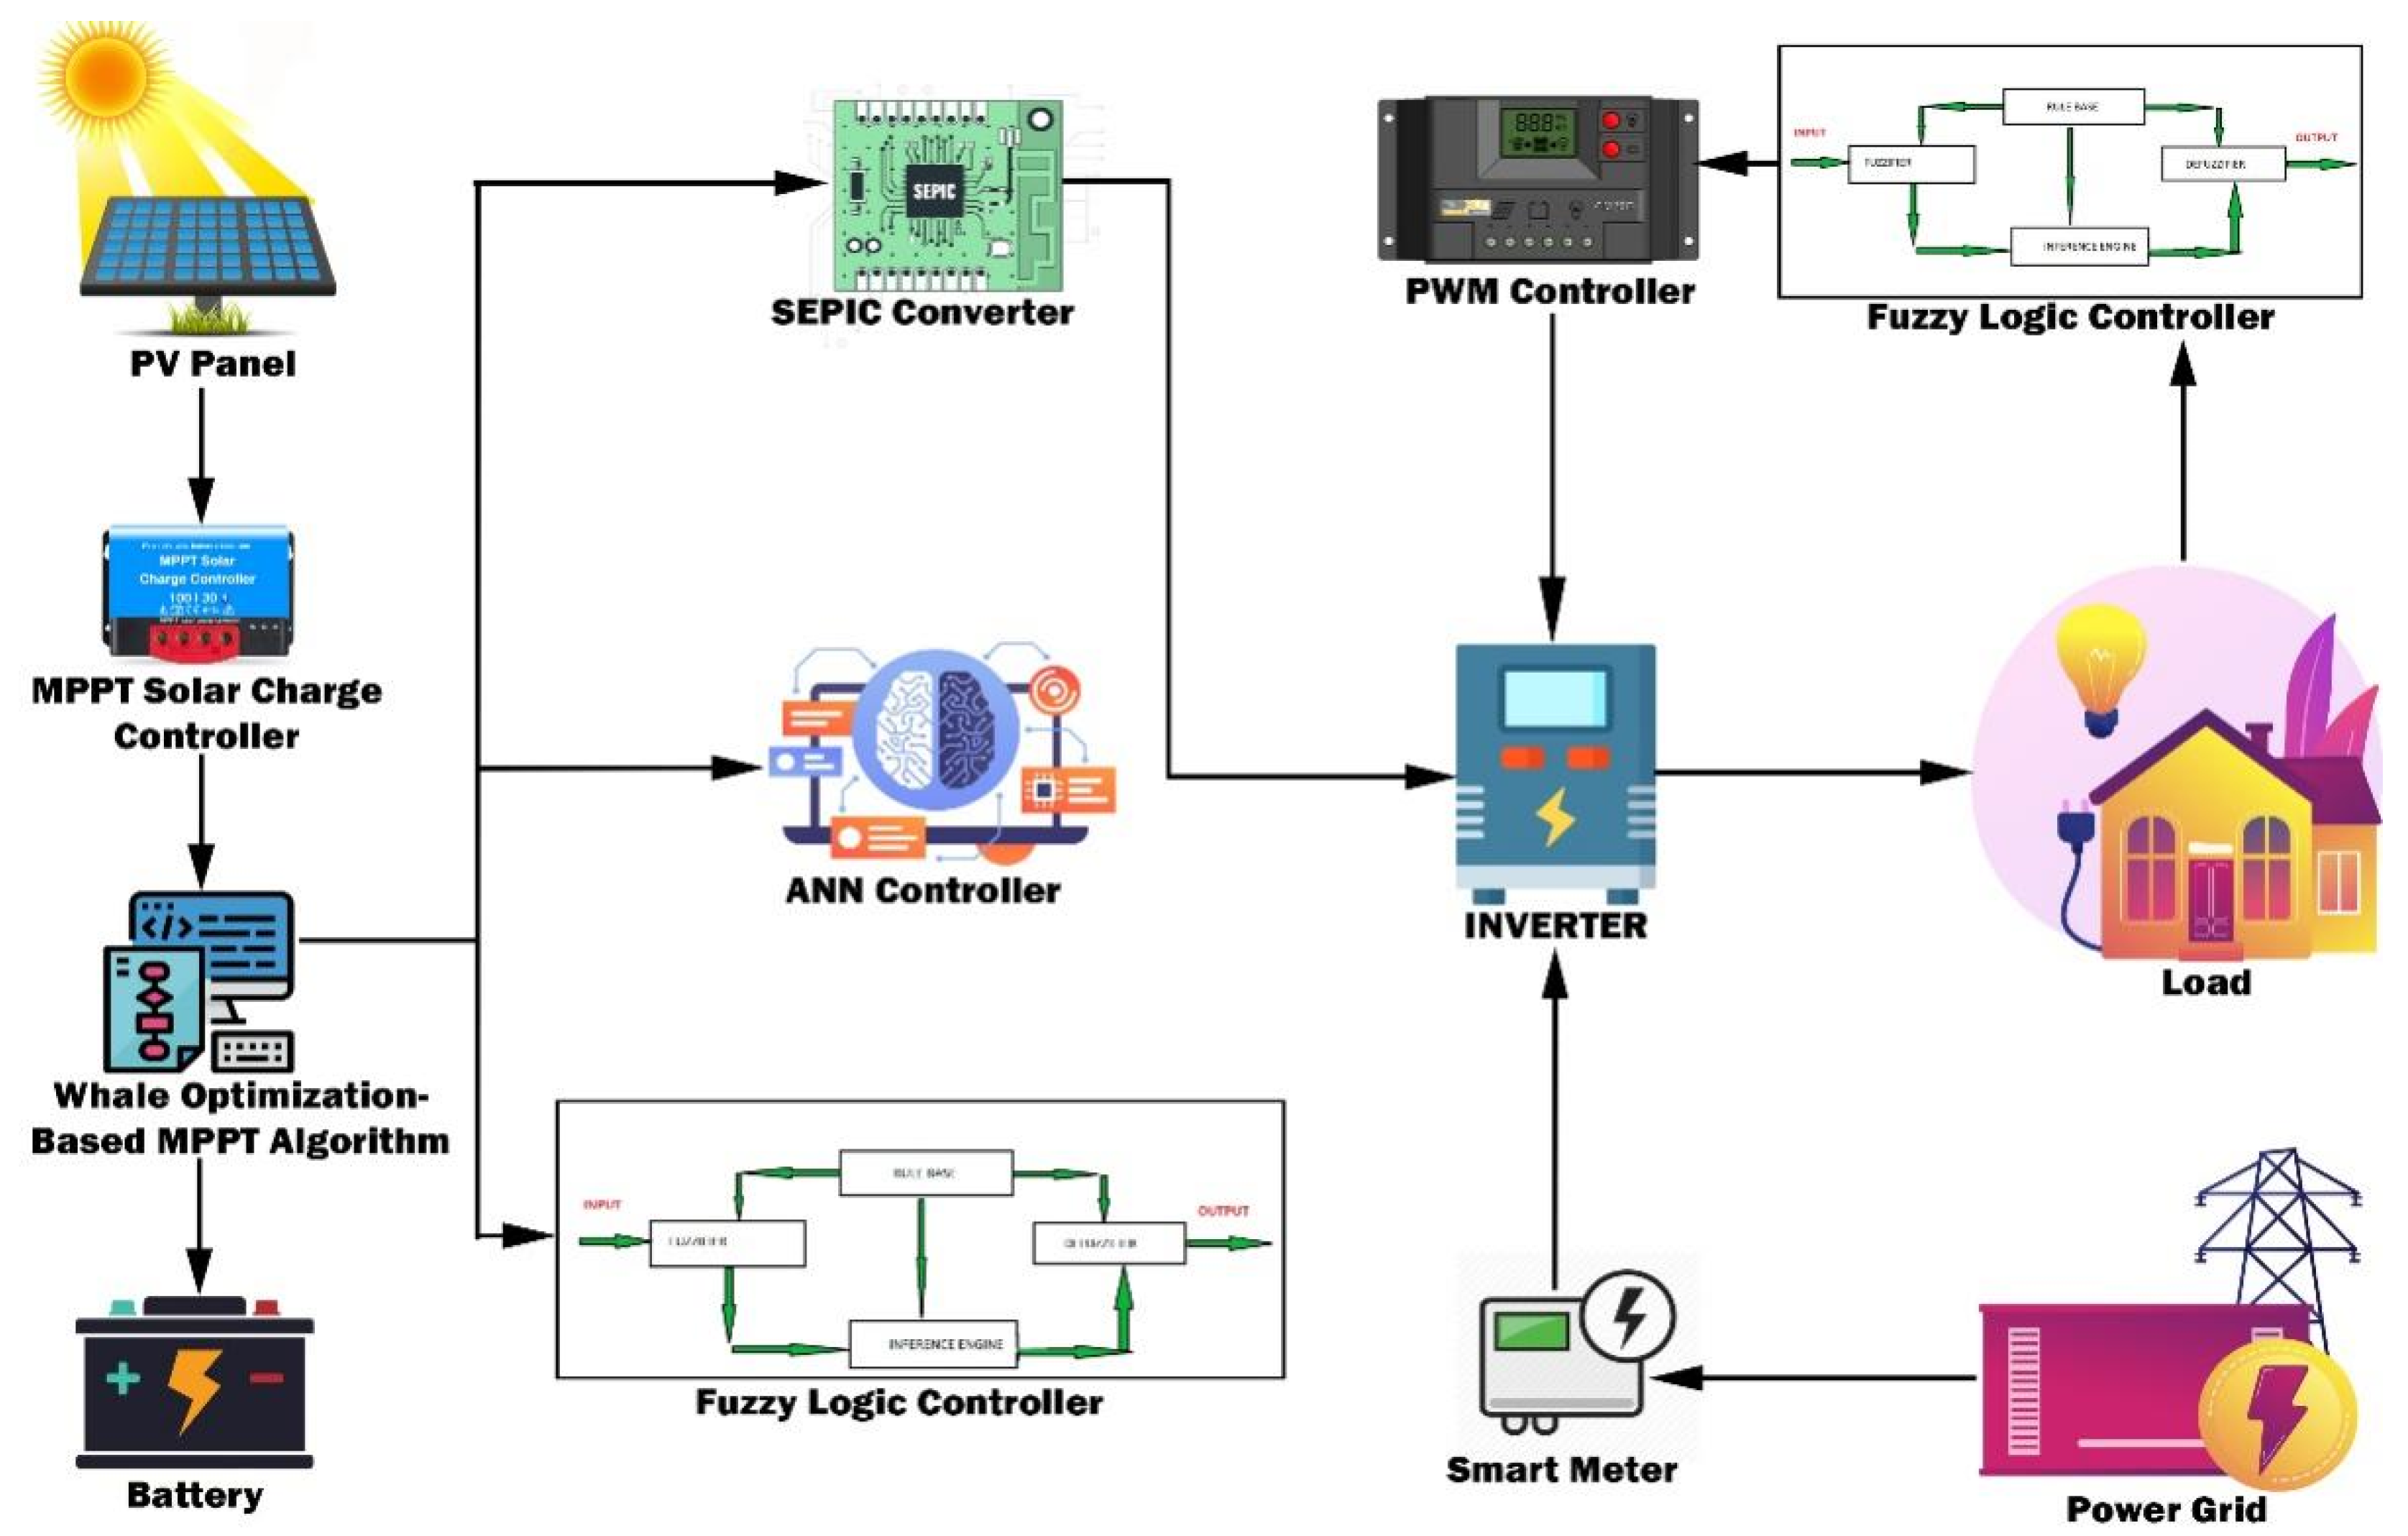
The fuzzy controller was used for producing a good response i.e., fast monitoring of set-point shifts, brief raises, and minor over-shooting. The fuzzy controller output was indifferent to differences in parameters. The error (e) and expected error (Ee) were all input parameters used for this control procedure, and the output feature was the plant order (u). The saturation blocks reduced the dynamic spectrum of these variables. The type 1 fuzzy package was used to improve the current type 1 network as a type 2 fuzzy package version. An FLS type 2, which uses at least one fuzzy type 2, was called by a specified FLS. Type 1 FLSs cannot specifically discuss incoherence of rules since they are other vague type 1 collections. On the other side, type 2 FLSs was useful because it was challenging to calculate exact metric differences. Type 2 fuzzy settings minimized rule-based FLS ambiguity. Type 2 fuzzy sets were sometimes challenging to use and understand and are, thus, not popular. Type 2 FLS was the type 2 fuzzy system in which the rule-based inference system integrates the defuzzer with the output processor. A Form Reducer and type 2 defuzzy were used in the output processor; it provided the type 1 fuzzy set performance (from the type reducer) and a crisp number (from the defuzzifier). The IF-THEN law, again, defined an FLS type 2, but its background was now Type 2. FLSs Type 2 can be used where situations are too unpredictable for precise membership grades to be calculated. We had the same features when implementing Type 2 FLC as that of the Type 1 FLC, so that we now used Type 2 Fuzzy sets as input and output membership settings.
Systematic and Practical Design of the Stable Fuzzy Controller
The deliberate type 2 fuzzy logic system is represented in
Figure 2. For our description, we considered the issue with the identification of a PV failure detection stabilization system. It was necessary to evaluate the state variables and their angular distance. The actual dynamic equation of the device, which we believe to be unknown:
We assumed that the exact equation was unknown to implementing the Fuzzy Lyapunov synthesis method, and only the following limited data on implementation seem to be available. The system may have two degrees of freedom, α and , which are referred to as and .
To facilitate our control design, we supposed no gravity effect in our model:
Our objective was to design the rule base of a fuzzy controller that would detect the PV fault conditions:
By differentiating
we obtained:
We now received appropriate requirements to sustain the state: if x1 and x2 have opposite signs, then x1, x2 < 0 and if 0; if x1 and x2 are both positive, then (5) will hold if < 0 x1; if x1 and x2 are both negative, and equation (5) will hold if < 0 x1.
We could translate these conditions into the following fuzzy rules:
- ⚬
If x1 is positive and x2 is positive, then
must be negative big.
- ⚬
If x1 is negative and x2 is negative, then
must be positive big.
- ⚬
If x1 is positive and x2 is negative, then
must be zero.
- ⚬
If x1 is negative and x2 is positive, then
must be zero.
However, from the information that is proportional to u, we could substitute x = 2 by u for the stabilizing controller to obtain a fuzzy rule base: If x1 is nice and x2 worse, then the negative will be more. If x1 is negative and x2 is negative, u will be major positive. If x1 is positive and x2 is negative, u shall be zero. When x1 is negative and x2 is positive, then u has to be 0. Interestingly, the fuzzy x1 partition x2 and u elegantly obeyed Expression (4). Since and because we needed V to be negative, it is customary to look at the signs of x1 and x2; thus, the obvious fuzzy division was true, negative. When the true, negative, for x1 and x2 in (4), the fuzzy type 2 partition, which seemed to be negative large, zero, true large, was obtained. In order to guarantee that , even though the exact magnitude of x1 is unknown, just to be optimistic (negative), we had to set to negative high. Of course, a pre-defined partition for the variables could also be applied to continue and then apply increasing value to the expression to find the laws. However, whatever occurred first, we found that the Fuzzy Lyapunov Synthesis transformed Lyapunov’s classical synthesis into the system with terminology from the field of precise quantitative quantities. In order to model the linguistic terms in rules and to determine whether to interpret the controller principle, we needed a diminishing membership. Type 1 membership functioned for the type 1 fuzzy logic controller and Type 2 membership functionality described the linguistic terms positive, low, firm, zero, and heavy.
3.3. ANN Controller Implementation
Fuzzy logical controller data processing is a complex task involving high time and power computing. Hence, ANN is also preferred. In order to mimic design and function, ANN offers a theoretical structure for the simulation of human brain cells.
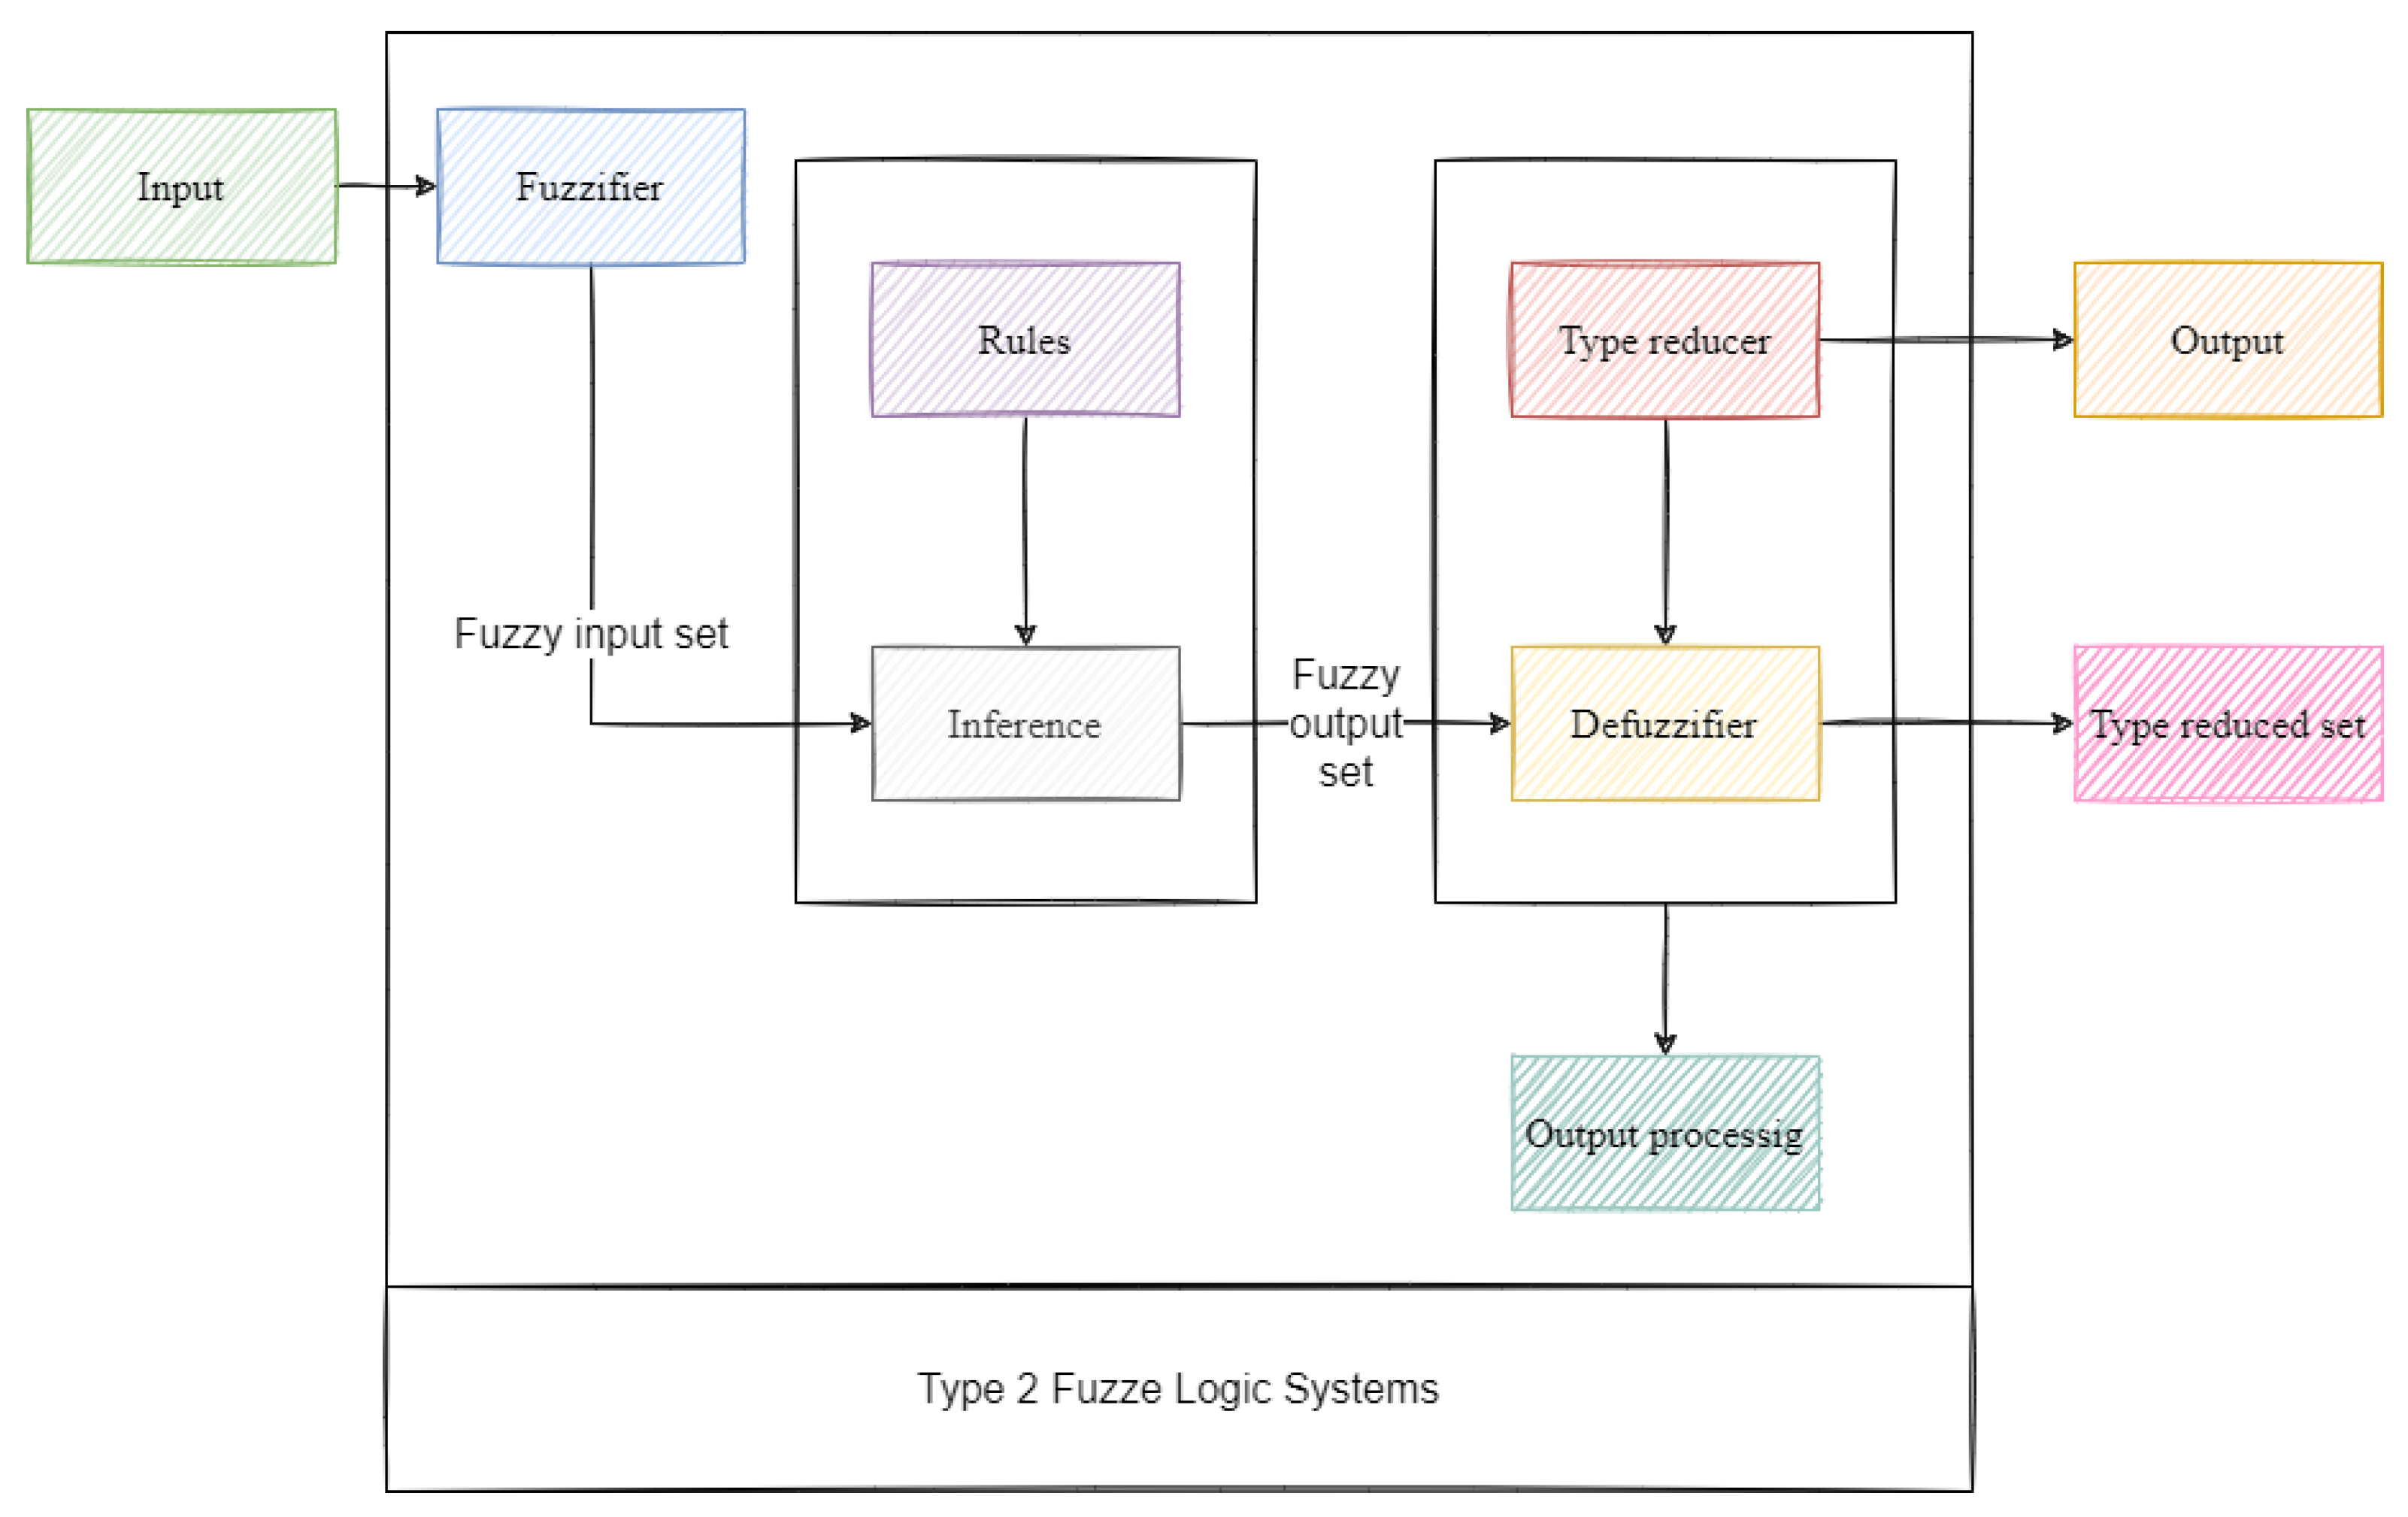
Figure 3 displays the ANN structure. The ANN type is a neural transmission network with three layers. A backpacking algorithm and down gradient approach for weight setting were used to reduce learning errors. ANN seems to be an easy algorithm, with quick calculation speed, and good validation accuracy. ANN has also been used in many areas such as pattern detection, signal processing, etc. There are usually three critical stages to the ANN process. They, respectively, practice data processing, computer testing, and ANN validation. The neural network is a non-linear model that is mathematically developable. There are two levels in the form of the neural network. The first layer consists of two neurons, and the second layer consists of a neuron. The “transigmoid” moves in the first layer, and “pure dimensional” transfer features are in the second. For a compilation of research datasets, sampling points were determined first. The cause mechanism during ANN training is the tangent sigmoid process, the input–output of the nodes. The MPPT optimization algorithm for tuning ANN and the fuse controls were interpreted for each node under radiation.
where
is the input information to node
j at the
k-th sampling. Input
is given by the weighted sum of input nodes as follows:
where
is the performance of
node and
is the connection weight of
. During preparation, the relation weights
were recursively calibrated to ensure the best match for input/output trends, based on the minimum value of the amount of the squared error defined in Equation (8).
where
is the cumulative number of patterns in instruction,
is the real
lth performance, and
is the approximate number. The error feature was assessed, and the linking weights were modified in each ANN training cycle to minimize the error represented in (8).
3.4. Modelling a PV Module
A PV cell generates energy when illuminated by photons. The P–N junction is the core feature for photovoltaic cells and can consume solar radiation. It arises when the photon crosses the gap from the material section. The loads saved travel through the array directly as the load of the solar cell is connected to it before the light stops. The model consists of a current source, diode, and some resistance; Equation (9) reveals that the current provided by the solar cell in the series resistance of
was relatively small and that the shunt one of
was relatively high. These two resistors were not taken into consideration in order to make the simulation simpler.
3.4.1. PV System under Partial Shading Conditions and Tuning
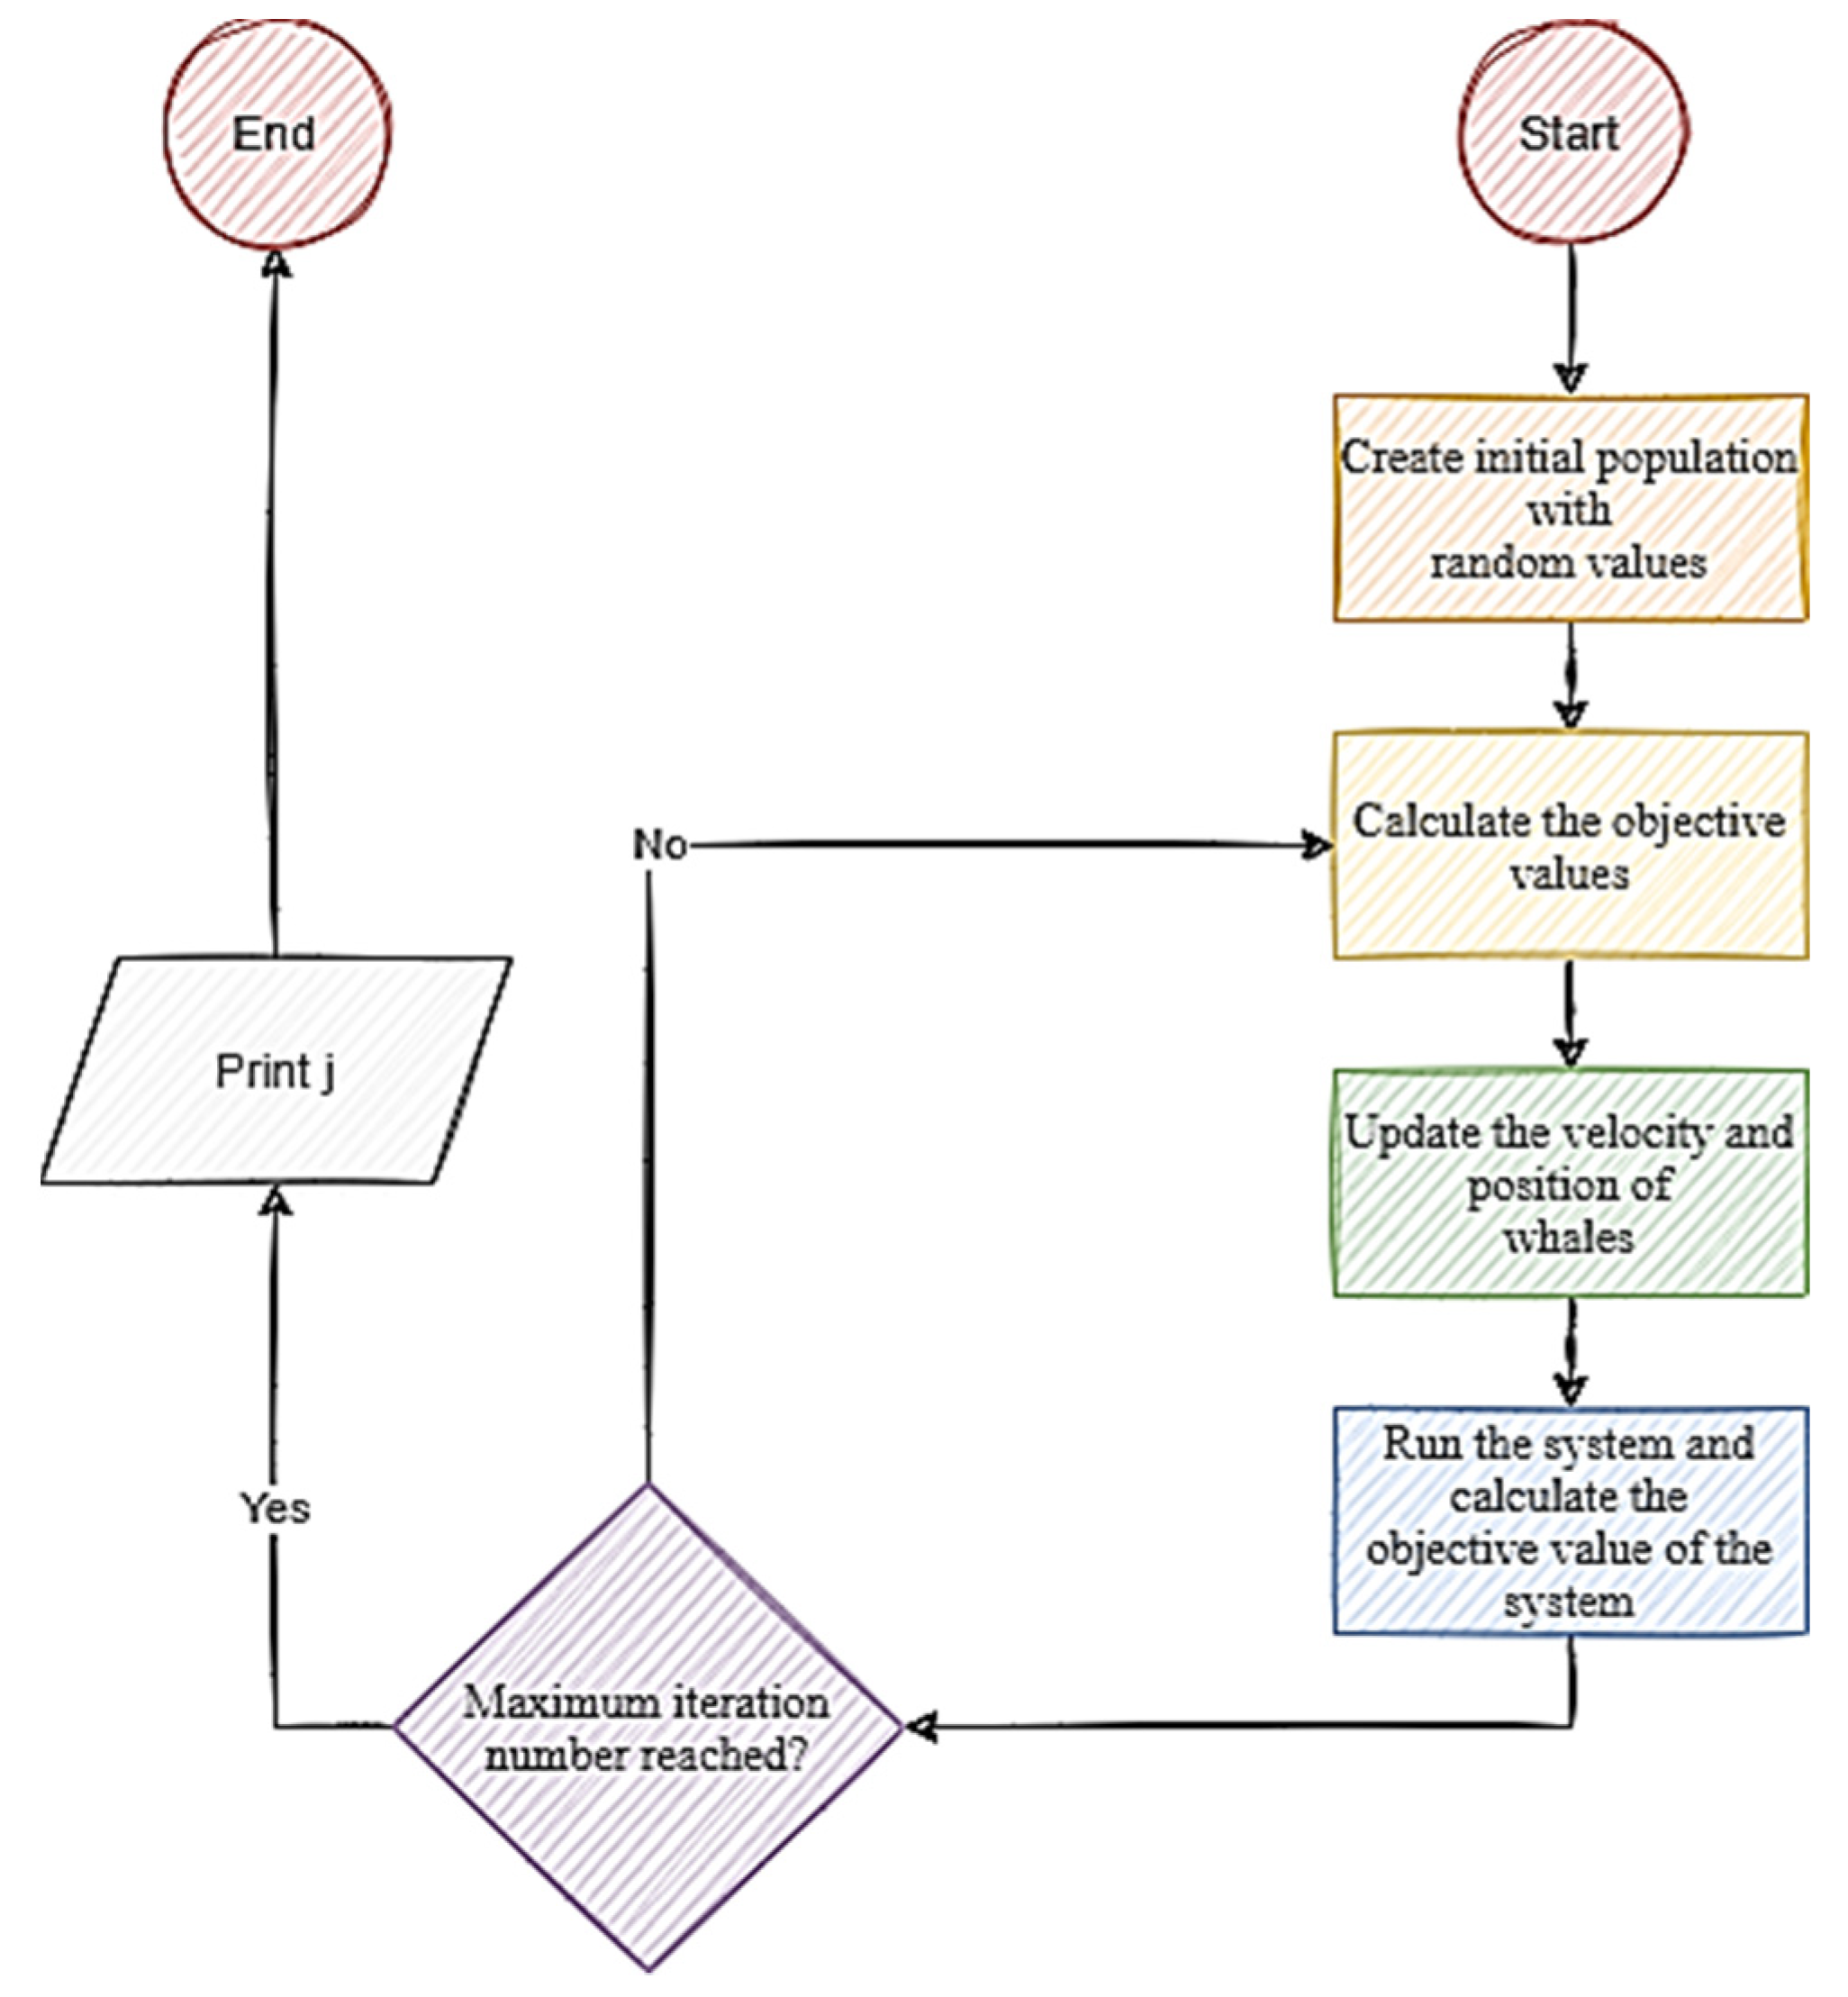
Using the MPPT method, whale optimization could be used to evaluate partial shading conditions in the panel. Whale optimization (WOA) (Mirjalili and Lewis [
30]) is a modern strategy in optimization, since whales have specific cells similar to human brain cells. A whale is one of the conscious species. As in other optimization methods, the approach begins with random solutions for customized parameters (four controller parameters) and deciding the correct objective function. In WOP, the search agents have modified the location for any iteration, and the goal function is defined based on that change. The cycle is replicated until most iterations respond and the best answer is processed. The flow chart of WOA for optimal tuning of control parameters is given in
Figure 4.
WOA believes that target prey are the most effective option at the moment, since humpback whales can detect the prey’s position and encircle it. The best search agent is then identified, and other search agents adjust their locations to come closer to the best search agent throughout an increasing number of iterations from the beginning to a maximum number of iterations. The WOA method began with a collection of randomly generated solutions to the problem. At the end of each iteration, search agents updated their locations about either a randomly selected search agent or the best solution found so far. For exploration and exploitation, the parameter was lowered from 2 to 0 to offer the appropriate level of service. When |A| > 1, a random search agent was picked, and when |A| 1, the best solution was selected for updating the position of the search agents. When |A| 1, the best solution was selected for updating the position of the search agents. WOA can transition between a spiral and a circular movement based on the value of p in the equation. After that, the WOA algorithm ended by satisfying termination criteria that were established.
The WOA method of optimization can be broken into three phases: 1—surrounding beast whales. At first, the bumper whales know the position and then circle the beast. First of all, WOAs estimation assumes the optimal answer as above the highest. When the answer is the strongest, other whales seek to adjust their position in the best way possible. The WOA algorithm was developed upon the methodology of whale hunting. A bubble net feeding technique was named the following method. Humpback whales tend to capture tiny fish below the surface by having a net of bubbles expand around the prey in a circular route. The mathematical presentation of the whales surrounding prey methodology can be defined as:
where
T is an iteration, is the vector,
is the vector optimal solution,
* is the variable,
a position variable and
is the absolute value. Until a better solution is sought, the current solution’s location vector was modified:
where
which absolutely remained in Equations (12) and (13) was diminished in amount from 2 to 0, which became an unspecified variable in the context of (0, 1) throughout the testing which processing processed. This function was modified to preserve the equilibrium between the running and research phases. Whale and prey were balanced here; whales were allegedly fulfilling the position of each other (Mafarja and Mirjalili [
31]).
was used to render the search agent push further from the reference whale with random values greater than 1 or less than −1. The search agent status changed by a randomly chosen search agent at the inquiry level rather than by the most robust search agency open to it. The quest phase was manually based on the vector fluctuation. Based on one another, humpback whales were searching blindly for the best position. For the optimal global position, the mathematical expression can be written as follows:
From that, the optimal solutions were obtained, where
a random whale position vector is selected from the current population. The controller’s transition function is usually written as an Equation (15):
3.4.2. SEPIC Converter
To function in a stable condition, the SEPIC converter was needed. SEPIC was considered working in this work to achieve a stable state. The second balance inductor volt theory was that the net inductor voltage should be negative in a single switching step at a continuous mode of conduction and stable state. For a condenser, the total condenser current in one switching time must be zero, according to the second-ampere balance theory. The SEPIC simulation was implemented in MATLAB SIMULINK applications with the State Space Reportation and is represented by Equation (16):
where
is the state variable. When the phase feedback for SEPIC was added, the response is obtained from SEPIC. A delay period L = 0.005 s and period constants T = 0.051 s were obtained by the phase response from the SEPIC. Drawing a tangent line at the intersection of the phase address and evaluating the intersections of the tangent with the time axis and the line output reaction decided the delay period and period constant. The controller’s input and output were the faults in the output voltage and the service cycle of the power switch S, as depicted in
Table 1.
Throughout this situation, the inverter-based speed regulation of the pulse width variation operated for a series of ‘ON to OFF’ pulses, which changed the operating duration, the percentage of time the output voltage was ‘ON’ relative to ‘OFF’; thus, keeping a steady frequency. Dependent on its input voltage, the PWM sensor in the inverter corrected the pulse width of the switching pulse. It canceled the shifts in the output voltage and allowed the inverter a constant output voltage independent of load properties.
3.5. PV Fault Detection Algorithm
Therefore, a classification system and an ANN methodology were selected to distinguish defects or faults in fault detection. For that, the models were stepped as follows.
- ➢
Collection of input and output variables;
- ➢
Normalization of the dataset;
- ➢
Selection of the network connections structures;
- ➢
Preparation for the network;
- ➢
Network evaluation.
Using the MATLAB simulation tool, a collection of 775 patterns was developed. Furthermore, 80% of the patterns were used for preparation, while 20% were used for layout checking. In order to select the most appropriate architecture for ANN, it was going to be tested first; both the fuzzy and ANN systems are commonly used to identify failures, and had to be contrasted. The PV fault detection was based on the Multilayer Perceptron (MLP) and the Radial Base Function (RBF). The MLP consists of three neurons on the input layer, corresponding to the voltage value calculated, maximum current point (COP), and maximum voltage point ratio. The input layer comprises three neurons. The fault class is equated by one neuron in the output layer. The number of secret layers and the number of neurons in each layer are determined through the training phase; the logarithmic sigmoid method was used for moving this layer.
The Levenberge–Marquardt (LM) algorithm is a training network. Three levels of the RBF design. The input layer has four neurons corresponding to the four-fault groups, the output layer has four neurons, and the hidden layer includes M neurons. Each neuron calculates a kernel function, normally a Gaussian function, defined according to its center and distance. Both parameters were calculated by a K-means clustering algorithm, while a pseudo-inverse process estimated weights between the center layers and the output layer.
The radial basis feature network with fuzzy was built to decide the fault that existed in the plants. Radial-base feature networks (RBANN) represented a three-stage neural feed network type. The weight could be calculated as represented in Equation (17):
They had an input layer, a hidden layer, and an output layer via the transfer.
where ||
||
2 is the function of distance from the specified center. The functions on the radial basis were based on the principle of approximation. The efficiency of such algorithms depended on the parameter choices. For convenience, the default settings were used here. The effects of modeling neural networks explicitly relied heavily on the used algorithm. The transfer function converts a Euclidean summation (
s = 1 to L) for each node to provide an output. This Gaussian function also had a width of
σs (s = 1 to L). The resulting output from the kth node:
The first is a linear ANN solution, while the second relies on the FLS method. Even in fuzzy regression, two groups are separated. The first class minimizes the complete vagueness of the expected performance values. The second section includes FLS methods for the reduction in the cumulative error square of the calculated values. Here, the fuzzy square form, which can be represented as in Equation (20):
Noise rates defined the input variables and perturbances in a PV device were defined (diode small, lower Earth defect, upper Earth defect, partial shades). The resulting variables were described by
, and specific values were assumed in ideal, standard, and faults conditions. The remaining elements were the generic components and were evaluated:
where
represents the output variables,
represents the fault values,
represents the normal values, and
represents the fault condition values. The regular check involved assessing the values of all parameters
Nn in normal condition and
Nf for each form of defect, for each PV temperature, and irradiation value. Thus, two Euclidean real standards could be defined:
where
represents the number value of the standard determined by a distinction between an ideally conditioned Neuro-Fuzzy PV model and a typical Neuro-Fuzzy PV model;
the number value measured by a distinction between an optimal Neuro-Fuzzy PV and a faulty PV variant of the Neuro-Fuzzy PV type. By using
DF, the faulty condition could be calculated.
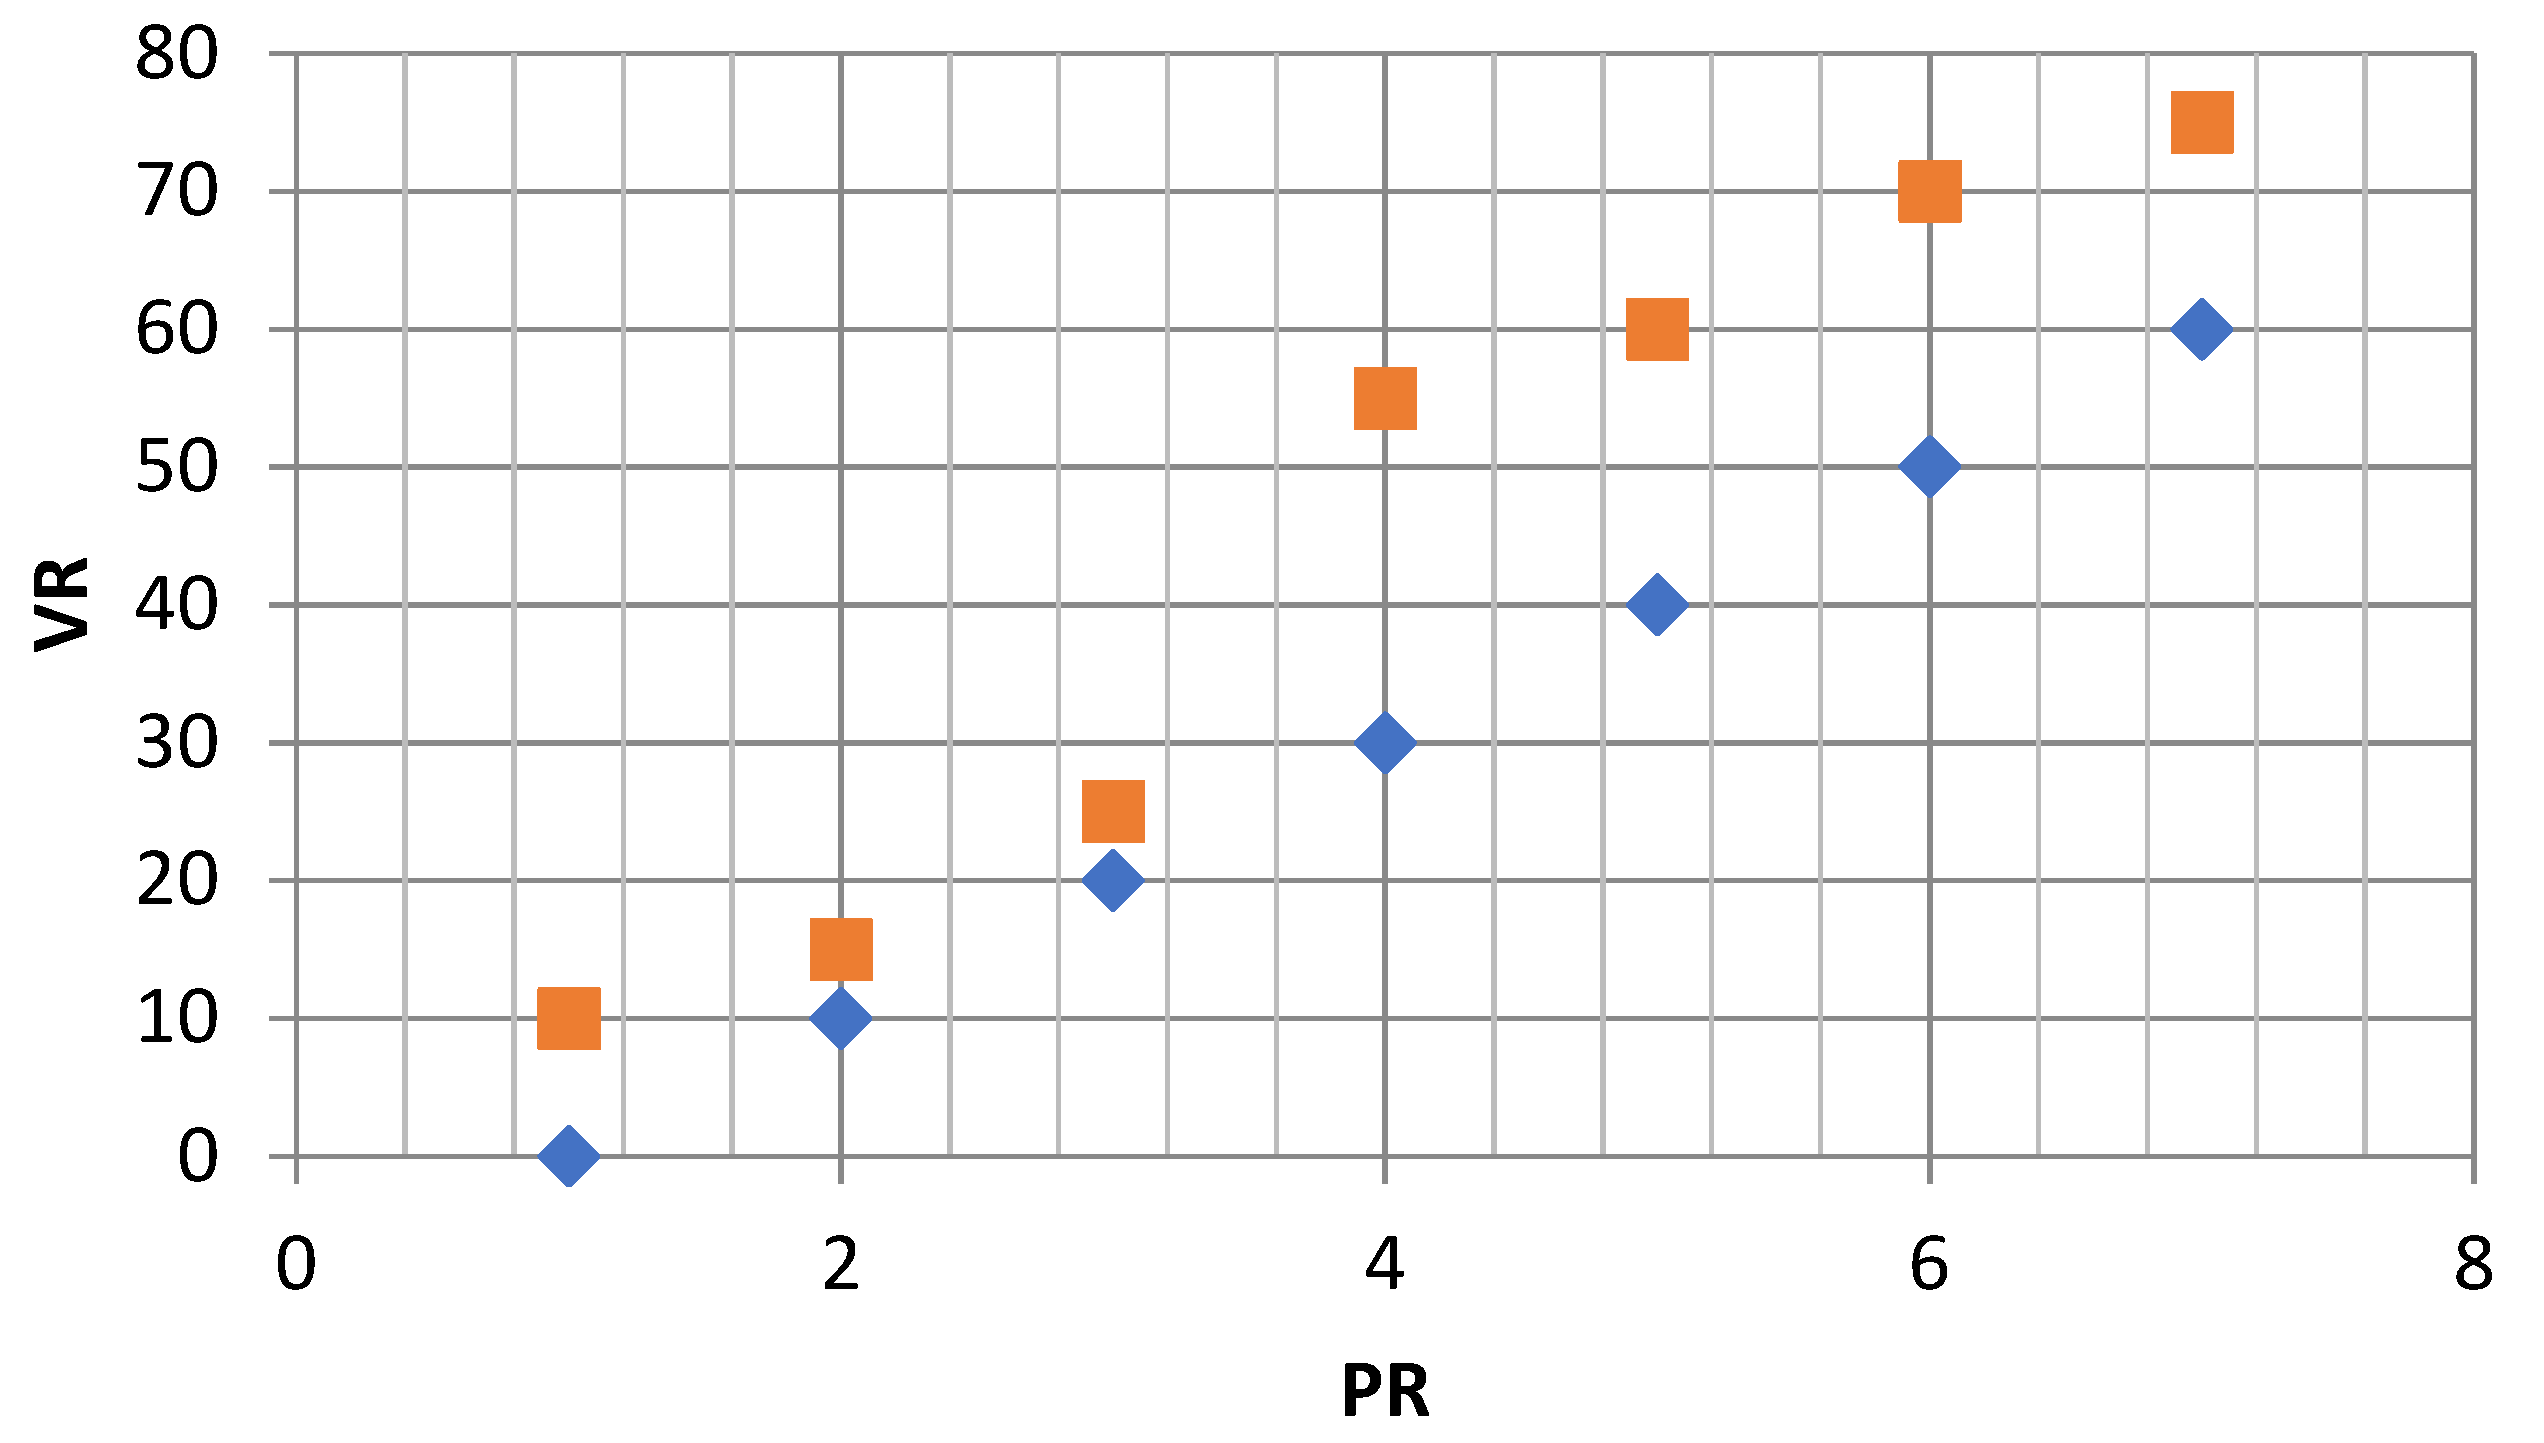
Two ratios were defined by using the two methods. For the categorization of the fault domain. The following two factors were the Power Ratio (PR) and VR: (1) both can be changed if PV fault (2) reaches zero, even if PV modules have accessible voltage, they also have a value. They are the only ones that can be adjusted if PV faults. The power and voltage levels display as follows:
where
is the theory of the PV system output,
pmeasured is the calculated PV chain output strength, the PV theoretical output voltage is the PV system,
is the DC output voltage of the PV chain calculated and
Vmeasured is the calculated output. The controller ratio for the analyzed PV unit was estimated at a theoretical 4% output error tolerance for internal MPPT sensors at a conversion error rate of 97%, giving the maximum theoretical error. The following calculations indicated the resistance of MPPT units and the amount of PV modules in the PV sequence at a maximum and minimum power/voltage ratio.
This was because the fault algorithm decided whether the MPPT device had a flaw or whether the whole PV device was entirely different from the PV array when the PR exceeded 50. To diagnose which form of defect in the PR area had occurred, the voltage ratio value was taken into account. Similarly, the fuzzy logic interface and ANN rules obtained were equivalent to 10, where the fuzzy law incorporated the same concept as the fuzzy reasoning principle of the Mamdani. The machine design of Sugeno used a Max–Min strategy for the deflation phase of the centroid form.
4. Result and Discussion
Findings were documented by using the fault detection algorithm. Furthermore, the controller rules for fuzzy logic and the ANN framework explained in this section the difference between presented machine learning strategies and other ANN systems and fuzzy logic systems by several researchers. The laws of the fused logic system is if and else statement. Using a case scenario shown in
Table 2, the fuzzy logic device code is implemented. However, the performance membership functions were split into five sets: PS (0–0.2), one PV module defective (0.2–0.4), two PV modules defective (0.4–0.6), three PV module defective (0.6–0.8), and four PV modules defective (0.8–1.0).
The PS was used at the same levels as all PV units. During the study, the PS state was supplemented. The majority of calculated data were represented by a third-order polynomial between high and low theoretical detection limits. For this particular analysis, PR and VR ratios were specified. Therefore, all VR and PR ratios rose marginally throughout the test, as the PS state of the device increased. Both ratios may be calculated in addition to ratios. The specificity of detection for the proposed algorithm is shown by (28):
Figure 5 shows the results against theoretical curve limitations. The technically high and low limit polynomial feature of the third order was defined, and the minimum deciding factor (R) seemed to be 99.9 %.
As represented in
Figure 6, there were four faulty PV module conditions. As a result of one of the PV strings being removed from the PV array, the PV system generated an open circuit fault, causing the PV system to fail, which was considered as fault one; fault two was considered as a short circuit faults. Fault three was considered as degradation faults in the PV system. Fault four was represented as a fault-free operation under the PV system.
As can be seen, the calculated data were contrasted with the theoretical curve limits for the specific experiments. The bulk of the calculated data during the study duration fell beyond the theoretical curves’ high and low detection limits. The DA was determined and listed in
Table 3 and
Figure 6. The overall DA was 99.8 percent for Type 2 Fuzzy and ANN, respectively. To check the efficiency of the proposed Fuzzy and ANN, it can be compared with other existing fault detection methodologies. Akram et al. (2019) proposed a novel CNN for fault detection in PV also, and Chen et al. (2018) proposed a random forest algorithm for detecting the faults. Hence, when compared to the other existing methodologies, the implemented algorithms detection accuracy was also high, the implemented methodology outperformed the other detection mechanisms, shown in
Figure 7.
An Artificial Neural Network (ANN) and a fuzzy logic system interface for the detection of defects in photovoltaic (PV) systems were created. It should be noted, however, that both machine learning methods performed poorly on the PV system that was utilized for the performance analysis (1.1 kWp). If we compared the output of the fuzzy logic systems (all examined faults were correctly detected) to ANN, ANN’s maximum detection accuracy of 99.27% was obtained for the fourth ANN structure, which contained two inputs and nine outputs and used two hidden layers, and the output of the fuzzy logic systems was accurate 99.18% (all examined faults were correctly detected). Therefore, it was concluded that the ANN structure was slightly better than the Fuzzy Logic.
The input membership functions of the fuzzy logic system could become much more complex if the investigated PV installation had a large number of PV modules (more than 100 PV modules), since each PV module has the potential to influence the total input membership function. To test the technique, all the faulty simulated faulty scenarios were used, with 2779 experimental samples. The three faulty cases’ accuracy was just 98.27 percent. This experimental circumstance was made evident by the strange weather circumstances, which included episodes of inconsistent irradiance. In the 0, 1, 8, and 9 faulty instances, which delivered 100% accuracy, it was found that a greater precision was present. Of course, we discovered every flaw we studied using the tools’ findings—the short-circuited fault detection accuracy of 99.28% using the suggested technique. We could see that the output power decreased if we isolated one string.
Our tests revealed that the MPP’s power output did not rise proportionally with the irradiance, demonstrating a design defect.
We extracted the data allowed for the verification of the suggested fault detection technique. We also tried using a truncating method in conjunction with ANN for system two. The algorithm was to blame for taking the ANN output and highlighting how many unconnected strings there were on the system. The proposed technique is to be used with any PV plant and does not require the use of large datasets from previously installed systems. The input variables were the amount of irradiance, the temperature of the environment, and the power at the maximum power point. The output of ANN was fed into a Sugeno-type fuzzy logic classifier, which determined, with pinpoint accuracy, how many short-circuited PV modules were present on a particular PV array. System 1 revealed a fantastic accuracy of 99.28 percent, which was a great achievement. In this particular instance, the collected findings demonstrated an accuracy of 99.43 percent. As a result of these results, we were able to infer that the suggested approach, which combined artificial neural networks and fuzzy logic systems, was accurate for identifying short-circuited PV modules and unconnected strings. Furthermore, it is worth noting that the suggested technique did not require the installation of any additional sensors beyond those already in place on a big PV power plant, and that it can be used with any PV system. As a result, it is simpler to put the suggested approach into practice.


 ,
, 


