1. Introduction
The fast development of the exploitation of solar and wind energy on large scales through the use of photovoltaic (PV) panels [
1] has led to the diffusion of multimegawatt plants with very large structures often installed in open fields [
2]. This fact has posed the problem of the correct estimation of wind loads [
3,
4,
5] to optimally develop the structural design. Despite the very simple shape (which can be considered a flat plate), the characterisation of the wind flow on the panel to estimate the fluid–structure interaction can be challenging due to the high number of inflow conditions to investigate and the possible unsteady phenomena. For the above-mentioned reasons, numerical models need to be validated through experimental measurements, which should be performed often on scaled models and can be challenging and expensive. Detailed knowledge of the actual wind field can be very important to optimise the structural design; even small changes in the aerodynamic coefficients can have an important impact on the structure. The aerodynamic interaction should be characterised in steady and unsteady conditions, as small changes in the Strouhal number [
6] can lead to dangerous fluid–structure interaction. Experimental measurements on scaled models or portions of a large structure can therefore be very important also for the validation of numerical models, which can more easily manage complex configurations.
In [
7], an experimental wind tunnel analysis was conducted on a scaled model of PV panel surfaces: the pressure distribution was studied, and it was shown that the pressure magnitudes were higher at larger inclination angles of the module. In [
8], CFD simulations and wind tunnel experiments were performed to characterise the wind flow over PV modules attached to inclined surfaces, with the objective of developing computationally accessible methods for simulating small irregularities in buildings or other PV supporting structures. In [
9], numerical and wind tunnel studies were performed in order to individuate the wind directions and tilt angles at which a ground-mounted PV was affected by the highest wind loading: aerodynamic loads and the surface pressure distribution were analysed. In [
10], wind tunnel measurements and numerical simulations were compared in order to assess the capabilities of RANS models to estimate the wind load over PV arrays, in terms of the mean velocity field, pressure distribution, and turbulent kinetic energy profile. In [
11], experimental wind tunnel tests were conducted on thin flat plates mounted on a sensitive three-component instantaneous force and moment sensor with angles of attack between
and
: time-averaged and instantaneous results were analysed, and it is shown that the latter are affected by remarkable critical points, also in the setup, simplified with respect to real-world PV modules, which were considered. Several angles of tilt and wind incidence were analysed numerically and experimentally also in [
12], and there were angles for which critical loads arose, which were difficult to comprehend using averaged approaches such as RANS. Fluid–structure interaction was the investigation object of [
13], which was a purely numerical study aimed at analysing the regime at which the dynamic fluttering behaviour can grow in amplitude until the PV panel enters an unstable mode, known as torsional galloping.
Based on the above literature review, most studies dealing with wind flow over PV panels focused on average quantities as pressure distributions on the surface. This is comprehensible, because accounting for the real-world fluid–structure interaction of mounted PV panels is a prohibitive numerical and experimental task. The general motivation of the present work was therefore to develop numerical and experimental methods that can improve the state-of-the-art regarding the comprehension of the dynamical behaviour of PV panels: unavoidably, the approach is simplified from a numerical and experimental point of view, and it is reasonable to expect that only some essential aspects can be realistically measured and modelled.
The numerical simulations were based on the unsteady incompressible Reynolds-averaged Navier–Stokes (URANS) equations. It is well known that a complete characterisation of the aeroelastic behaviour of the PV panel is not feasible using URANS simulations. Nevertheless, it is common practice [
14] to employ engineering models that are computationally affordable, and it is therefore meaningful to inquire within what limits they are reliably applicable; a similar approach was adopted, for example, in [
15]. The use of unsteady RANS simulations to analyse the wind structure interaction is growing in many engineering applications [
16,
17,
18,
19]; the majority of these are related to structural studies on fundamental components of rotating machines. In light of this, the present study considered the use of URANS as a useful tool for characterizing, at least, the fundamental frequencies of the main dynamic drivers, which, in this case, are the vortex shedding frequencies.
The experimental analysis was based on tests performed at the “R.Balli” wind tunnel facility in the Department of Engineering of the University of Perugia. The PV module object of investigation was instrumented with 24 3D-printed pressure taps, and the wind field in proximity of the panel was measured through an innovative application of an optical flow algorithm.
Actually, flow velocity measurements are generally performed through particle image velocimetry (PIV) [
20,
21]. PIV is an optical method of flow visualisation [
22,
23], where the fluid is seeded with tracer particles, which, if properly chosen, are assumed to follow the flow dynamics [
20,
24]. The mixture of fluid and particles is illuminated, and a camera is used to track the seeding and finally solve the velocity field (i.e., to determine the speed and the direction of the particles) [
24]. Despite several advantages of using PIV (e.g., nonintrusive technique, subpixel displacement accuracy, high-speed data processing), in general, only small areas of the flow are measurable. Moreover, the accuracy of the results heavily depends on the seeding quality and on the employed instrumentation [
24]. In fact, for PIV systems, often, Class IV lasers and high-speed and high-resolution cameras are used, increasing the costs and the measurement complexity. Based on these considerations, the PIV method was considered out of scope for cost-effective tests on a PV model that maintains a realistic size, as in the present work.
In recent years, several computer-vision algorithms have been developed for flow measurement, such as optical flow (OF) algorithms [
25,
26,
27,
28,
29,
30,
31,
32]. OF is defined as the apparent motion of single pixels on the image, being a good approximation of the true physical motion projected onto the image plane [
25]. Optical flow measurements have been largely employed on solids for displacement detection [
33,
34], as well as on fluids for flow measurements [
35]. Among numerous OF algorithms, the Farnebäck method is one of the most used in computer vision [
36,
37]. It is based on a polynomial expansion, and due to this, it is one of the dense OF approaches (the information is given for each pixel in the field of view of the camera) [
36,
37]. In the last twenty years, several comparisons between PIV and OF were carried out by Corpetti et al. [
35,
38] and Liu et al. [
39], and currently, OF is considered an established approach for velocity flow measurements.
Nevertheless, it should be noted that, despite OF methods being well established, to the best of the authors’ knowledge, their use is quite novel for the type of application proposed in this study, and this therefore represents a qualifying innovative aspect of this work. In general, the perspective of this study was to interface research facilities and approaches with engineering methods, which can be reliably employed in the industry practice.
The paper is therefore organised as follows: in
Section 2, the experimental measurements are introduced; the numerical model is described in
Section 3; in
Section 4, the video postprocessing approach is introduced and discussed; the results are presented in
Section 5; the conclusions are drawn in
Section 6.
2. The Experimental Setup
The experimental tests took place in the “R.Balli” wind tunnel facility in the Engineering Department of University of Perugia (Italy) [
40,
41], which consists of a closed-loop circuit with an open test chamber where the air flow can be accelerated up to a speed of 45 m/s thanks to a
m-diameter fan, driven by a 375 kW electric motor. A detailed visualisation of the wind tunnel is presented in
Figure 1: the wind, before entering the test section through a squared inlet duct with
m sides, crosses a honeycomb panel in order to stabilise the flow, reducing the turbulence index up to
and generating a flat wind profile on the device under test. The air is, in the end, extracted from the test room by an outlet conveyor, re-entering the circuit.
Inside the chamber, a scaled model of PV panel was installed: the dimensions were 40 × 80 cm, selected in order to eventually have a scaling of approximately 1:2, as shown in
Figure 2. The panel was supported by a tubular structure with the possibility of modifying the tilt angle from 0
to 90
. The measurements used in the present work were all performed with an angle of 65
, referring to the horizontal direction. The rationale for this selection was based on the objectives of the present study, in relation to the state-of-the-art in the literature. As discussed in
Section 2, there are a certain number of studies dealing with numerical and experimental characterisations of wind loads over a PV under a variety of inflow conditions, but the studies are typically based on the analysis of the average quantities.
Since the objective of this work was to attempt a limited analysis also of some dynamic aspects, a unique angle and two wind intensities were selected, based on the preliminary numerical analysis reported in
Figure 3. According to
Figure 3, an angle of
was considered interesting for unsteady phenomena associated with the flow–wake transition, which is highly related to the dynamic phenomena inducing aeroelastic excitation: the vorticity maps highlight interesting areas to be investigated through video postprocessing.
Two sessions of testing for the same panel configuration were performed using different instrument setups: the first regarded the measurement of pressure in 12 points on both the upwind and downwind surfaces of the panel, while, in the second case, the velocities were measured with high-speed video acquisitions and image processing.
2.1. Pressure Measurement
The model of the panel was specifically designed to house a total of 24 3D-printed pressure taps connected by rubber tubes to data acquisition (DAQ) hardware. In such a way, at 12 points for the panel pressure and suction sides, it was possible to measure the wind effects in terms of the pressures acting on the surfaces. It has to be noted that, as the panel was positioned perfectly in the centre of the test chamber, the flow affecting the panel could be considered to be symmetric for the left and right halves of the body. For this reason, only one half was instrumented with pressure taps and, therefore, analysed in the present discussion. The system was developed considering the maximum number of available channels in the DAQ module; therefore, the choice of having a denser grid of points on only one half of the panel prevailed to improve the reliability of the measurements.
2.2. Video Acquisitions
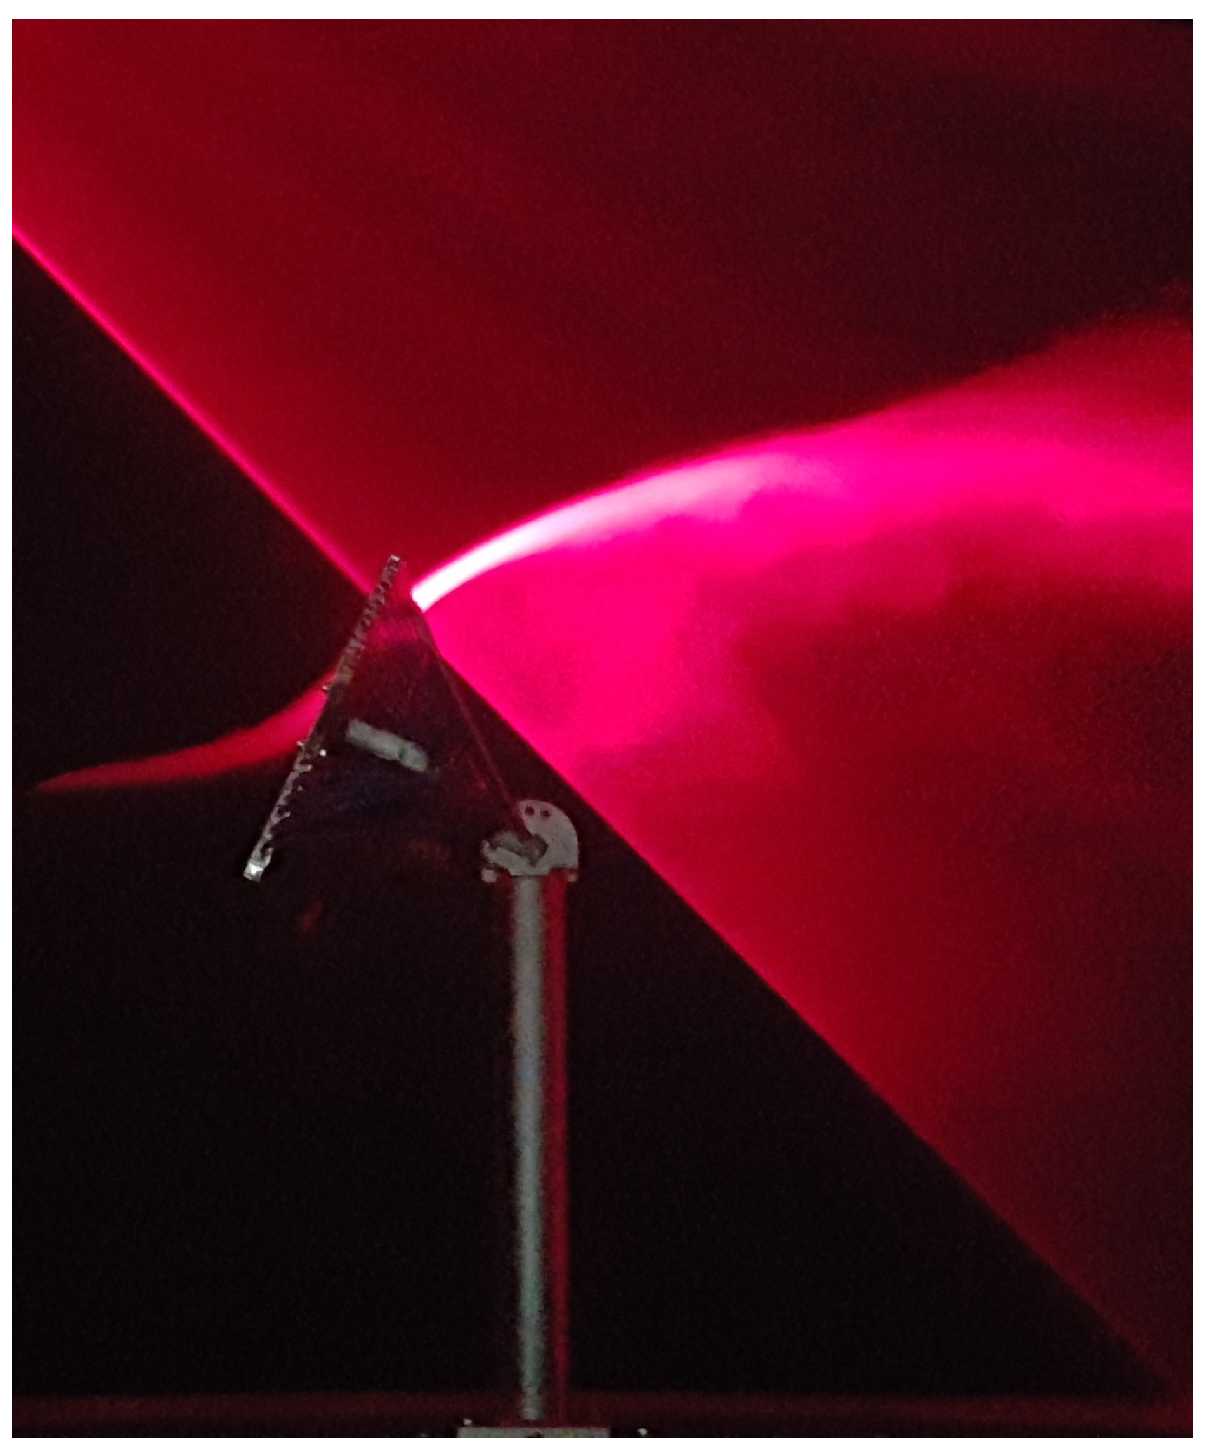
The video acquisitions of the flow around the PV panel were used for a qualitative and quantitative comparison with the numerical model. The experimental setup for this kind of test comprehended a video camera, whose frame rate was precisely controllable through a computer program, which was located in the test section of the wind tunnel, outside the flow, next to the PV panel and facing one of its sides. In addition to this, to make the flow visible, the air was inseminated with glycol-based particles, injected by a specially designed smoke machine able to highlight the streams. The smoke generator was used in combination with a laser blade projector, placed in the centre of the panel, pointing to the trailing edge of the panel, and so lighting up a small slice of the flow behind the panel. The presence of the projector was considered necessary in order to obtain a high contrast image of the smoke trajectory (
Figure 4).
3. The Numerical Model
For this study, the commercial Computational Fluid Dynamics (CFD) package Ansys Fluent 18 was used to study the flow field around the PV panel, as well as the effect of wind loading. The numerical calculations were performed using a three-dimension 3D unsteady incompressible Reynolds-averaged Navier–Stokes (URANS) equations. The semi-implicit method for pressure-linked equation SIMPLE was used to solve the RANS equations combined with the upwind differencing scheme. The SST k-
turbulence model was used to represent the turbulence characteristics. This model has been used by several researchers and has been proven to have superior prediction of the flow field behaviour around PV panels [
15,
42,
43]. Furthermore, Reference [
44] validated different turbulence models using 2D inclined flat plate calculation, and the mean pressure coefficient on the plate was compared with the experimental measurements presented by [
45]. It was concluded that the SST k-
model performed better than the realizable k-
turbulence model. Therefore, this model was selected for the present study.
The computational domain and mesh considered in this study were created according to the guideline for CFD simulation of flows in the urban environment provided by [
46]. Reference [
43] studied the effect of the full three-dimensional model and the reduced model on the pressure distribution over the PV surfaces at tilt angles of ±25 and ±60. The results indicated that, at a low tilt angle, the same distribution of pressure was obtained for both models, while for a high tilt angle, there was some difference between the pressure distribution for the full and reduced models. Therefore, the full scale computational domain was used in the present calculations.
The computational domain size was 6 H in the spanwise direction, 9 H in the lateral direction, and 20 H in the streamwise direction. The PV panel was located 5 H downstream of the inlet boundary; the distance from the PV panel to the outlet boundary was 15 H; the top of the computational domain was 5 H above the PV panel and 4.5 H for the sides. In the present computational study, the height of the PV panel above the ground was similar to the experimental values.
Figure 5 represents the flow field computational domain and the associated boundary conditions.
At the inlet of the computational domain, a uniform wind velocity of 5 m/s and 10 m/s was applied with a turbulence intensity of 0.5% and an air density of 1.18 , similar to the measured value during the experimental tests. The air viscosity and turbulent viscosity ratio was set as a default of / and 10, respectively. A zero static pressure condition was imposed at the outlet domain. The nonslip boundary condition was considered at the domain bottom and PV panel walls. The sides and top of the computational domain were far enough from the PV panel and were assigned as the symmetry boundary condition.
The preprocessor Gambit 2.4.6 was used to generate the computational domain and set the mesh for the photovoltaic panel. The PV panel was only the simulated part in the present study, as illustrated in
Figure 5. A hybrid mesh was used in this study in order to reduce the total number of grids. The computation domain was divided into two zones during the mesh generation. The grid in an inner zone containing the PV panel was generated using a structured mesh, while the unstructured grid was employed in the outer zone. Near the PV surfaces, 10 inflation layers with a growth factor of 1.25 were used, and the first layer spacing was 0.05 mm. This led to a maximum y+ below 2 over all the PV surfaces as shown in
Figure 6.
The main grid shapes of the computational domain and around the PV panel are shown in
Figure 7.
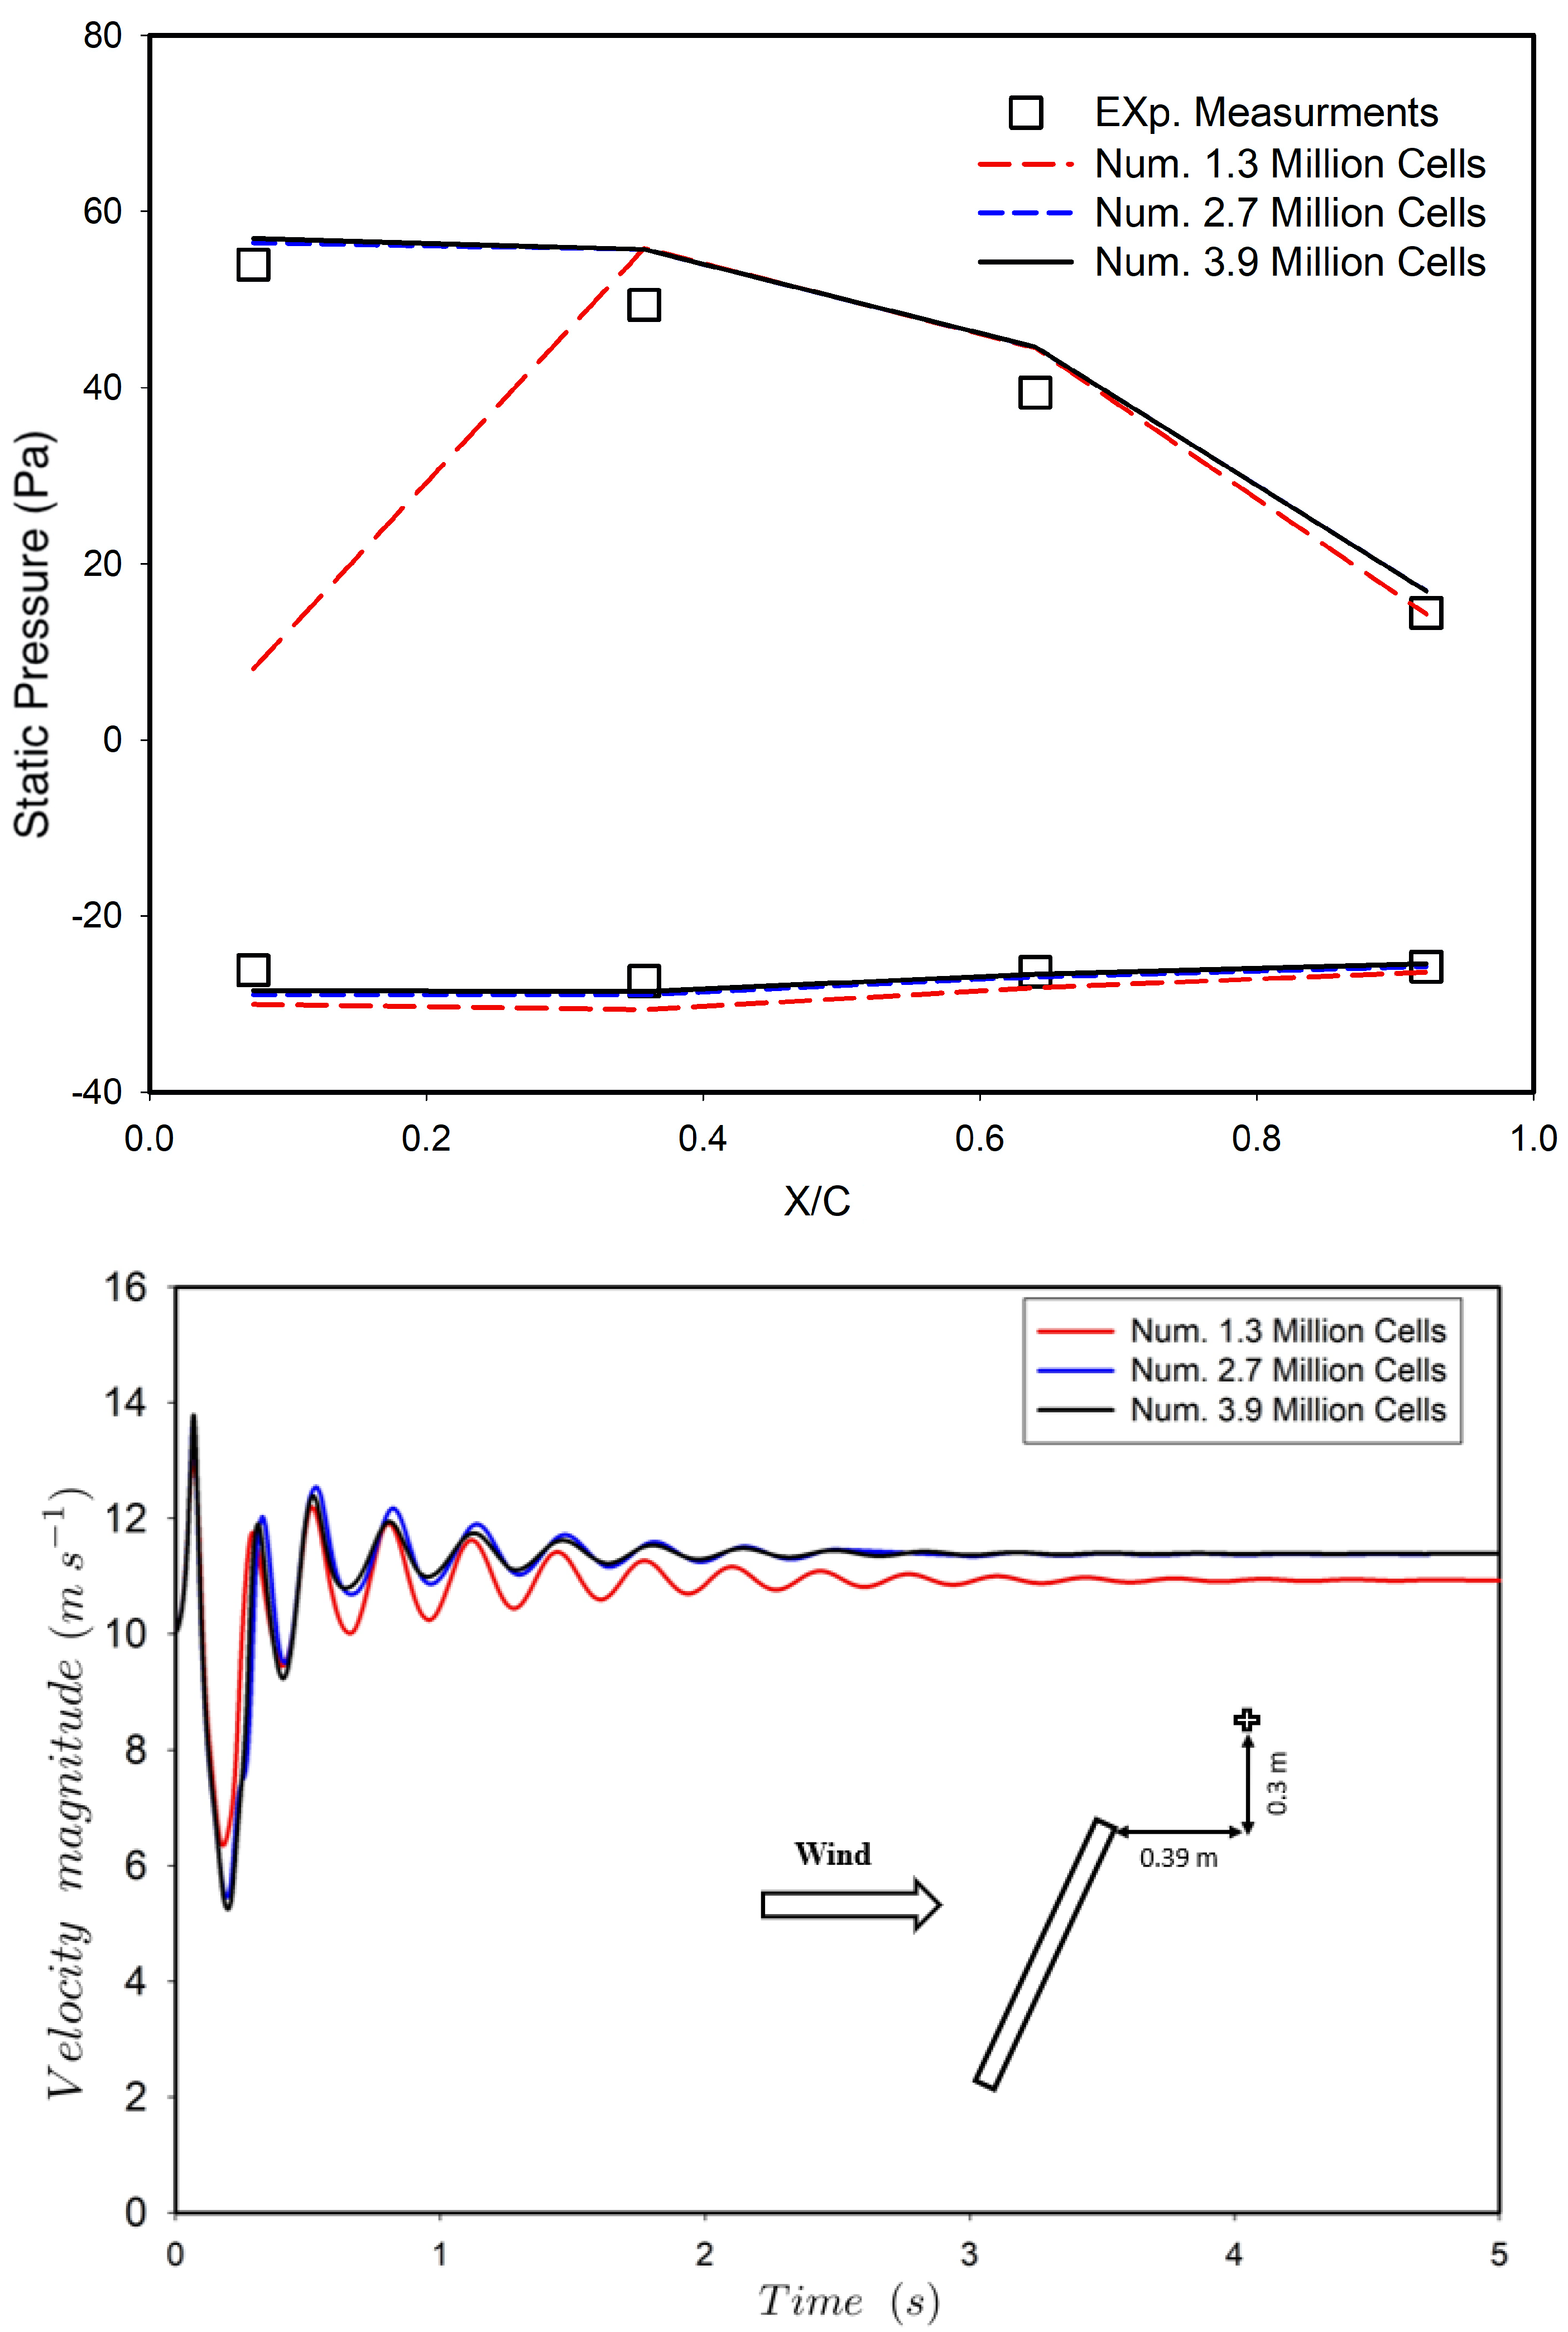
A grid independence study was performed using three different grid sizes of about 1.3, 2.7, and 3.9 million cells. The effect of the grid size on the mean static pressure along the quarter line of the PV panel on the front and rear surface were examined and compared with the current experimental measurements at an inlet velocity of 10 m/s and a PV tilt angle of
. In addition, the grids were examined by comparing the velocity magnitude at a point located behind the PV panel, and the coordinates of the point are shown in (
Figure 8b).
The effect of the grid size on the static pressure over the quarter line of the PV panel is shown in
Figure 9. From the figure, the grid dependence on the front and rear surface of the PV panel can be appreciated and, as regards the velocity, the magnitude on the point behind the PV for a mesh size of about 1.3 million cells.
The figure also indicates that there was a reasonably small change in the calculated static pressure within 1.2% when the grid number increased from 2.7 million to 3.9 million cells. As visible from the figure, a reasonable agreement was obtained between the calculated static pressure and the measured one on the rear surface of the PV panel. The maximum difference between the calculated static pressure and the experimental value was within 5% on the front surface midline.
Therefore, an acceptable grid-independent solution was selected with about 2.7 million cells, which were used in the present computations. Reference [
47] studied the effect of a Courant number of 0.11, 1, and 10 on the numerical stability and accuracy. It was indicated that stable and accurate numerical results were obtained at higher Courant numbers. While low values of Courant numbers, which were attributed to a higher grid spacing and, hence, a lower resolution, may not lead to accurate results. Therefore, an acceptable value of the time step was used, which led to a maximum Courant number of 4.9 and 9.8 for the 5 m/s and 10 m/s cases. The time step was set to 0.001, and the number of iterations per time step was 20. The computations were performed till the residuals of all variables were mainly below
, except the continuity equation in the order
. All simulations were performed on an HP (Palo Alto, CA, USA) Z800 (Intel Xeon CPUX5650, 2.66 GHz, 2 processors) workstation with 24 cores available for parallel calculations and 32 GB RAM.
4. The Video Postprocessing
The computation of the captured videos included a preprocessing phase. Each frame was filtered through a Gaussian filter [
48] with a 3 × 3 kernel in order to reduce noise and an adaptive histogram equalization (CLAHE) [
49,
50,
51] filter in order to improve the image contrast so as to highlight the smoke flow compared (foreground) to the background. A comparison of the original frame, the application of Gaussian filter, and the application of Gaussian filter and CLAHE are shown in
Figure 10.
At this point, each consecutive pair of frames was processed using the Farnebäck algorithm [
37] for the dense optical flow computation. The map of the velocity, expressed in pixels/frame, of each pixel between the reference frame and the arrival frame was calculated. This method for two-frame motion estimation was based on polynomial expansion in an image.
As per this method, the neighbourhood of each pixel can be approximated by a quadratic polynomial, given in Equation (
1):
where
is a symmetric matrix,
is a vector, and
is a scalar. This gives a local signal model, expressed in a local coordinate system. The coefficients may be estimated by applying the weighted least squares approach by matching with the neighbourhood signal values. After a global displacement
d, the new signal obtained is given in Equation (
2):
can be written in a form compatible with Equation (
1) as in Equation (
3):
To find the value of
d, the coefficients of the quadratic polynomials in Equations (
2) and (
3) shall be equated as in Equations (
4)–(
6):
In the multiscale approach, the Farnebäck algorithm generates an image pyramid, where each level has a lower resolution compared to the previous level. When you select a pyramid level greater than 1, the algorithm can track the points at multiple levels of resolution, starting at the lowest level. Increasing the number of pyramid levels enables the algorithm to handle larger displacements of points between frames. However, the number of computations also increases.
In this research, both iterative and multiscale approaches were implemented. In particular, 3 converging iterations and 5 scale levels were found as a proper compromise between computational efficiency and result accuracy.
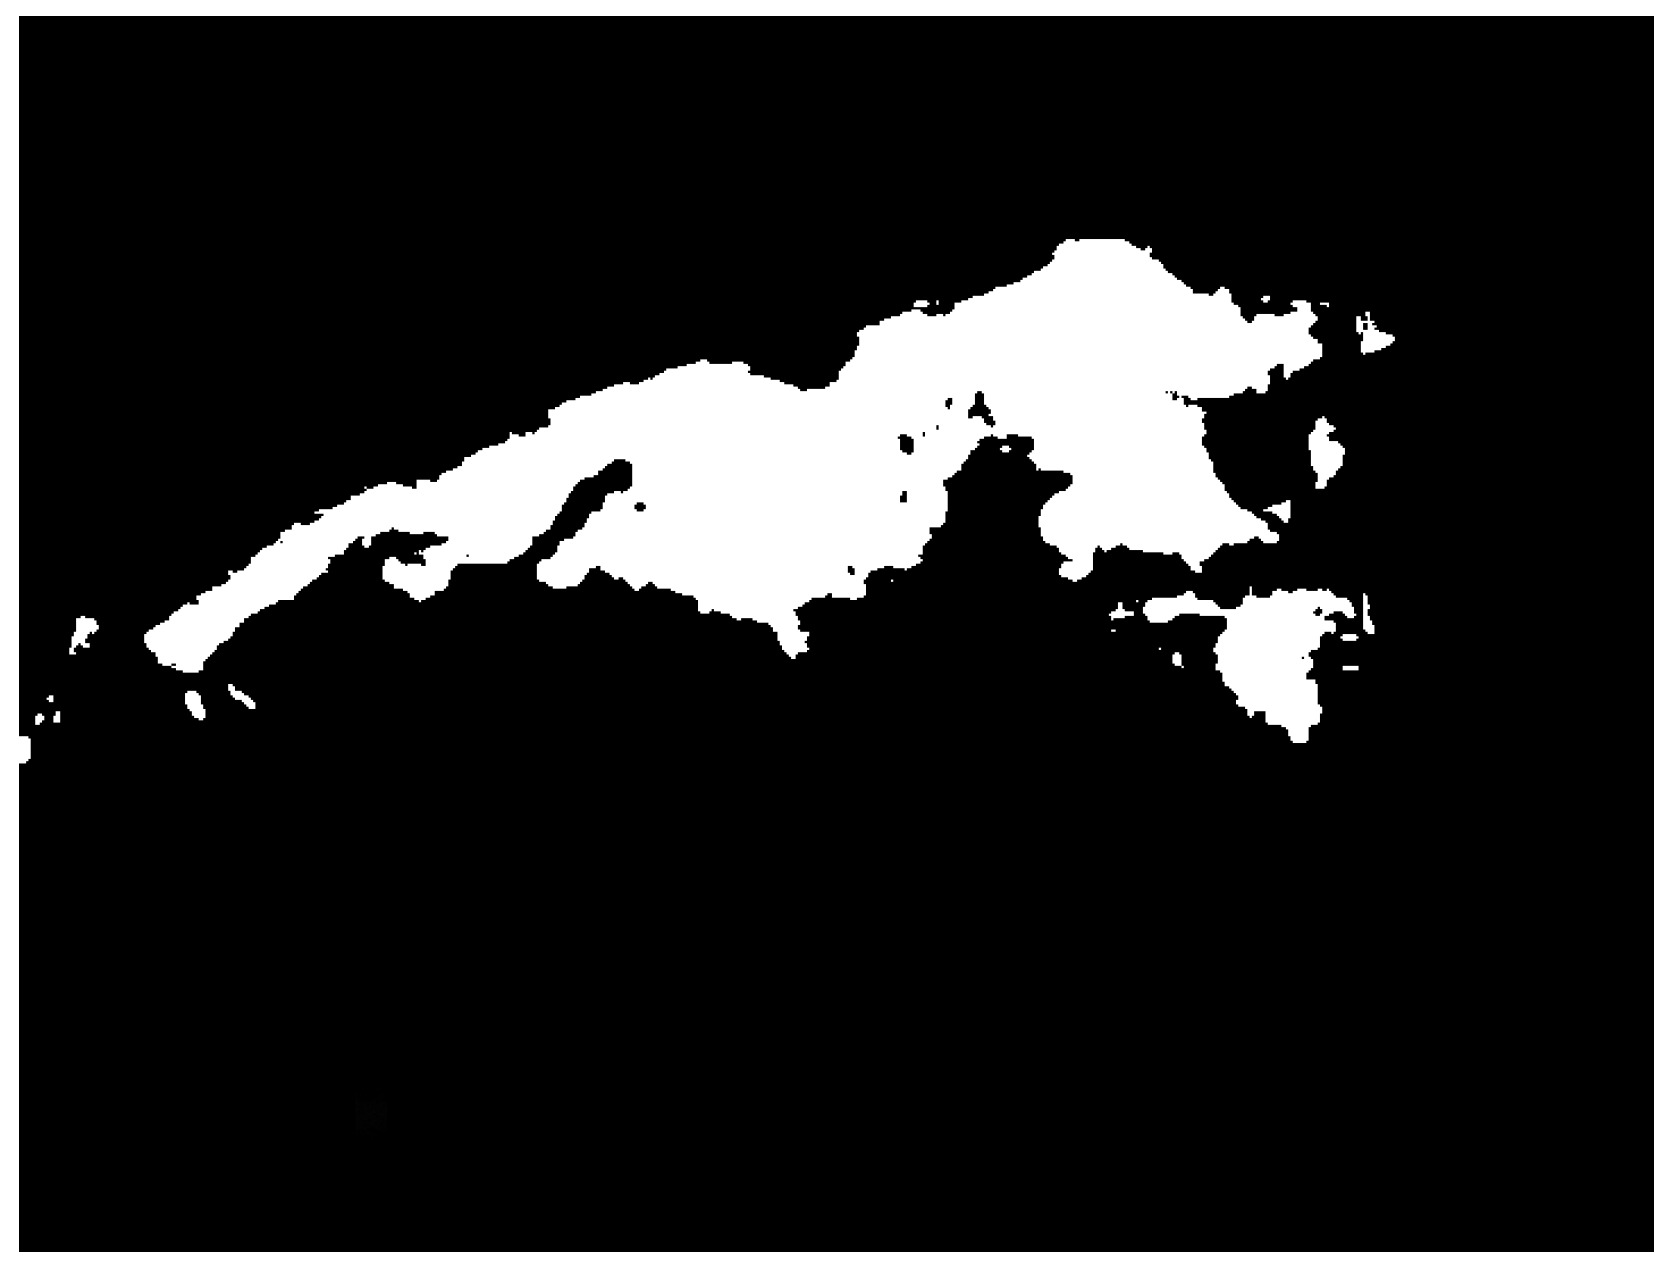
In order to smooth the flow field calculated by the optical flow, a multiplication between the velocity field and a mask (
Figure 11) obtained through image binarization [
50] was used. The mask, in the pixels where smoke was detected, had a value of 1, while in the pixels where smoke was not present, it had a value of 0. Therefore, the multiplication of the flow with the mask eliminated any possible velocity variations where smoke was not present, therefore produced by noise.
It was now necessary to calibrate the image spatially and temporally, in order to change from a velocity vector expressed in pixels/frame to m/s.
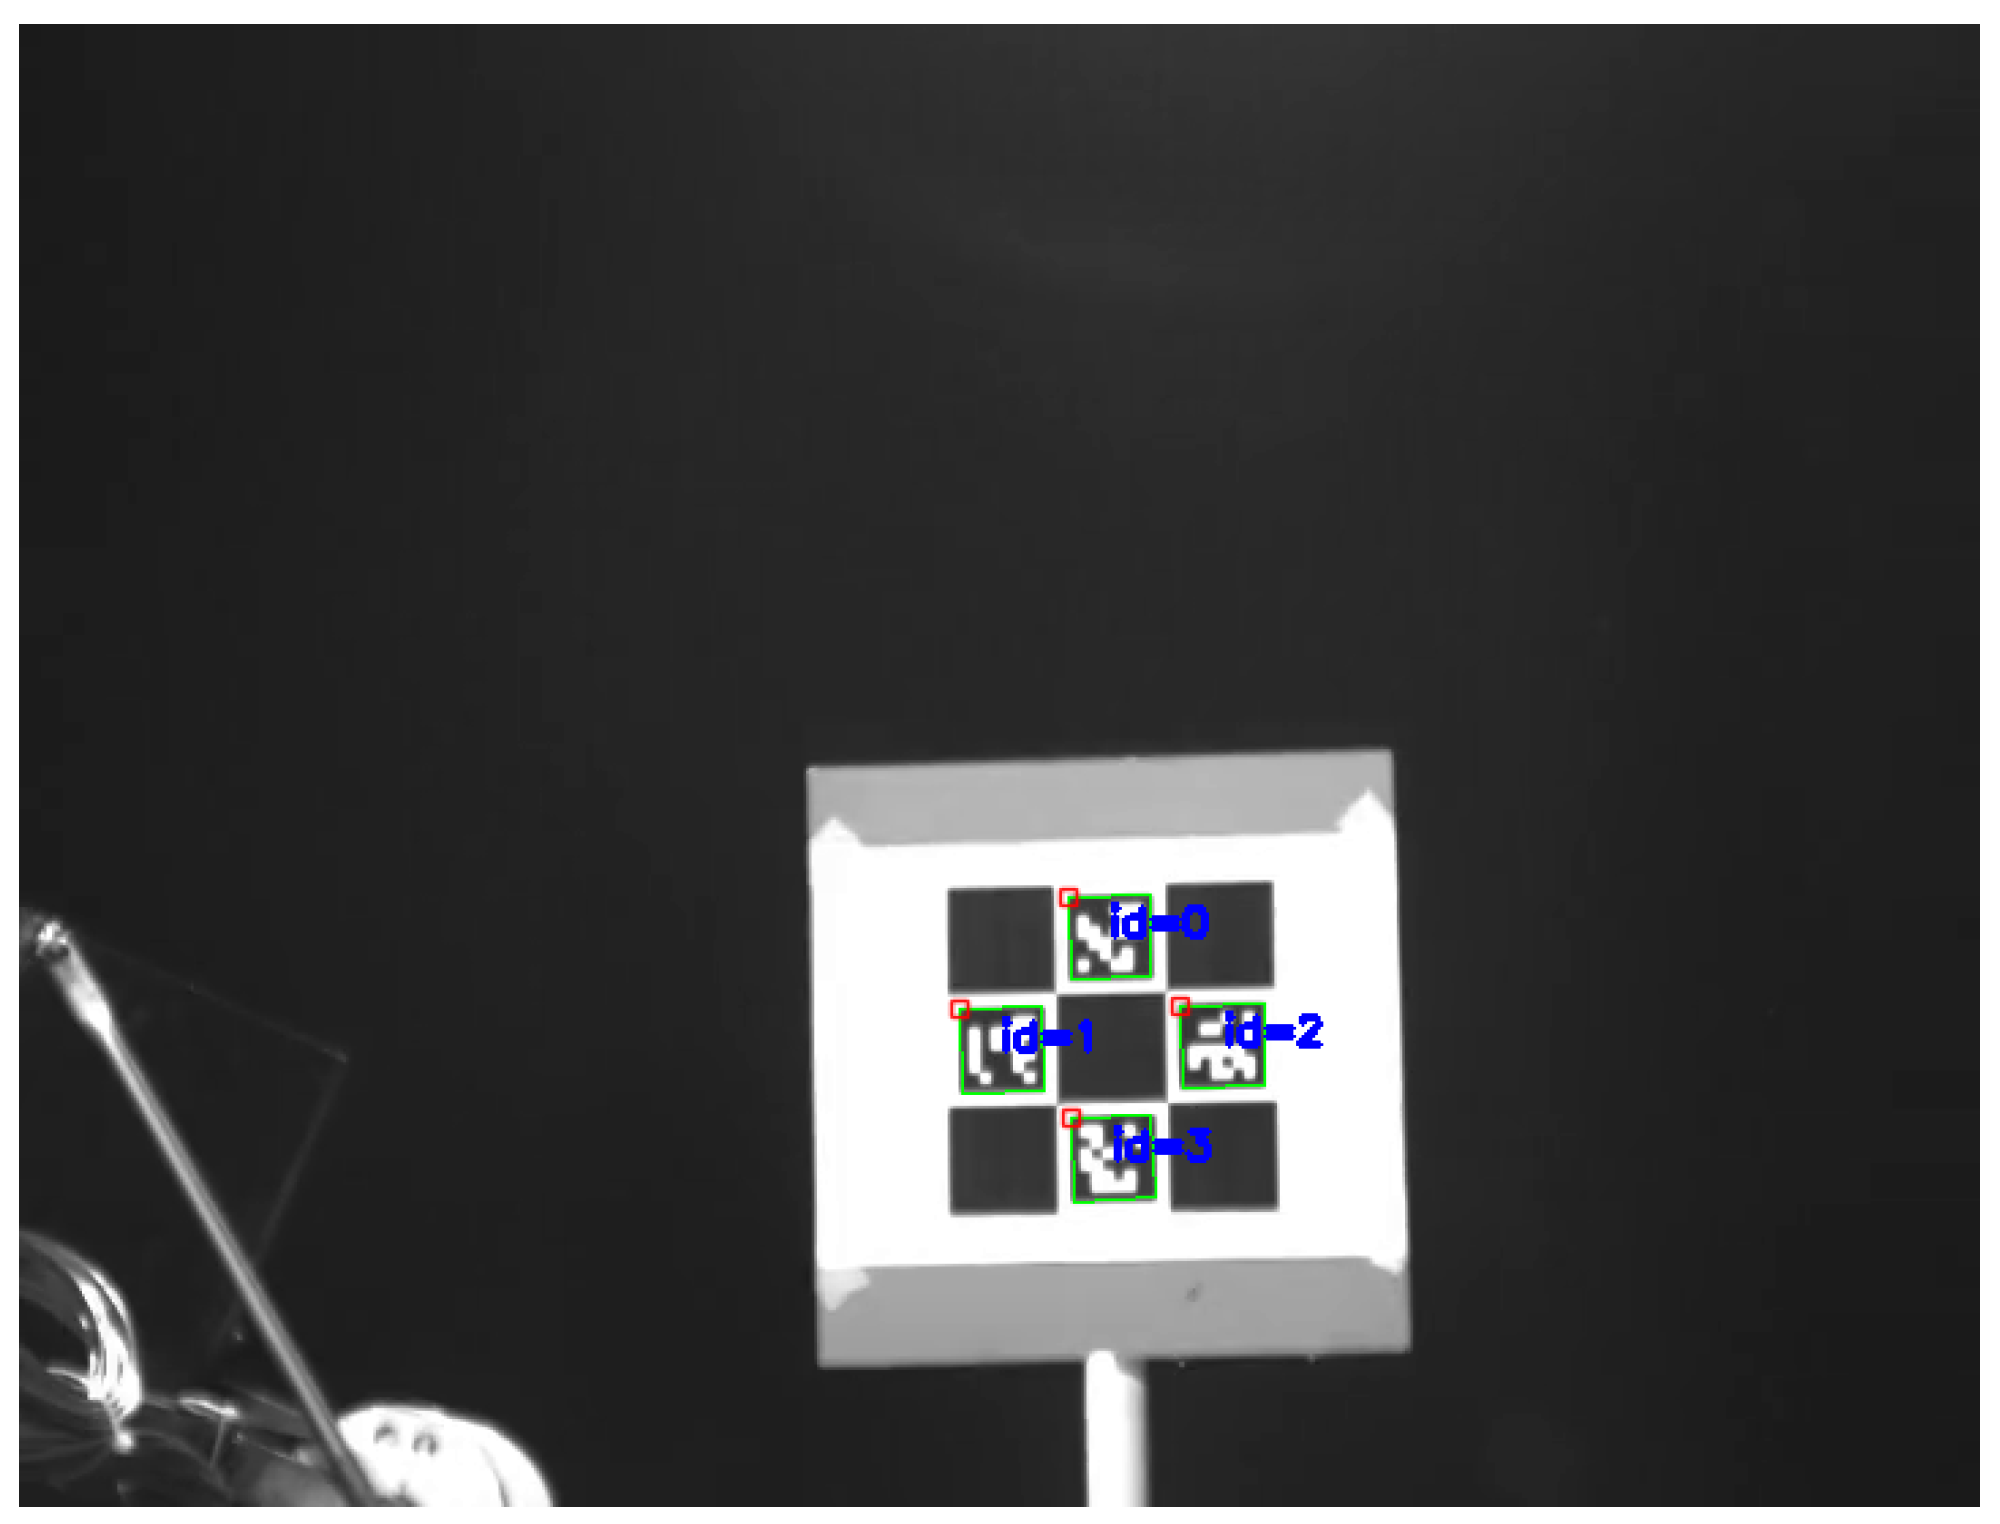
Spatial calibration was performed by placing a reference Charuco chessboard [
52,
53] in the plane of the laser sheet, as shown in
Figure 12. A reference image was taken, which was computed knowing the size in millimetres of the chessboard. The dimensions in pixels were determined and correlated with those in millimetres to obtain the mm/pixel spatial calibration factor
. The calculated spatial calibration factor was 0.407 mm/pixel. For the purpose of the temporal calibration, knowing the frame rate of the camera, it was easy to calculate the time step
from each couple of frames through Equation (
7):
where
is the acquisition frame rate.
In this case, the frame rate was 180 frames/s and the time step
was around 0.0056 s. Then, it was possible to convert the velocity from pixels/frame to m/s by scaling the velocity through a calibration factor
k, as shown in Equations (
8) and (
9):
In order to compare with the numerical model, a region of interest (ROI) was highlighted within the image. The ROI consisted of 9 adjacent pixels (
Figure 8a) with known centre coordinates (
Figure 8b). The effect of noise was reduced by calculating the speed as an average of 9 adjacent pixels. The average velocity between the pixels within the ROI was calculated for each frame of the video. The Savitzky–Golay filter [
48] was implemented in order to smooth the data and produce a velocity vector over time. The Savitzky–Golay filter is a digital filter usually applied to a set of digital data points for data smoothing. In this research, the filter was applied as a low-pass filter in order to delete velocity peaks due to tracking errors of the optical flow algorithm, without modifying the statistical and dynamic characteristics of the signal [
48]. The influence of the employed filter was preliminarily evaluated using a frequency-based approach. The frequency content of the signal related to the physical phenomenon was not affected by the filtering process.
An analysis was carried out in order to assess the measurement uncertainty. The uncertainty of the mean value of the fluctuation and the amplitude was assessed. For each velocity profile, the average velocity and amplitude of the fluctuation were determined by calculating the standard deviation; the results are shown in
Table 1 and
Table 2. The study was carried out on repeated videos at nominal speeds of 10 m/s (
Table 1) and 5 m/s (
Table 2). For each experimental setup, 3 different videos were evaluated. Uncertainty was evaluated according to ISO/IEC 98-3:2008 [
54] with a confidence interval of the 67%.
5. Results and Discussion
The detailed information on the effect of the wind loading on the PV panels, as well as the flow as the field characteristics can be illustrated through an analysis of the static pressure distribution on the PV surfaces.
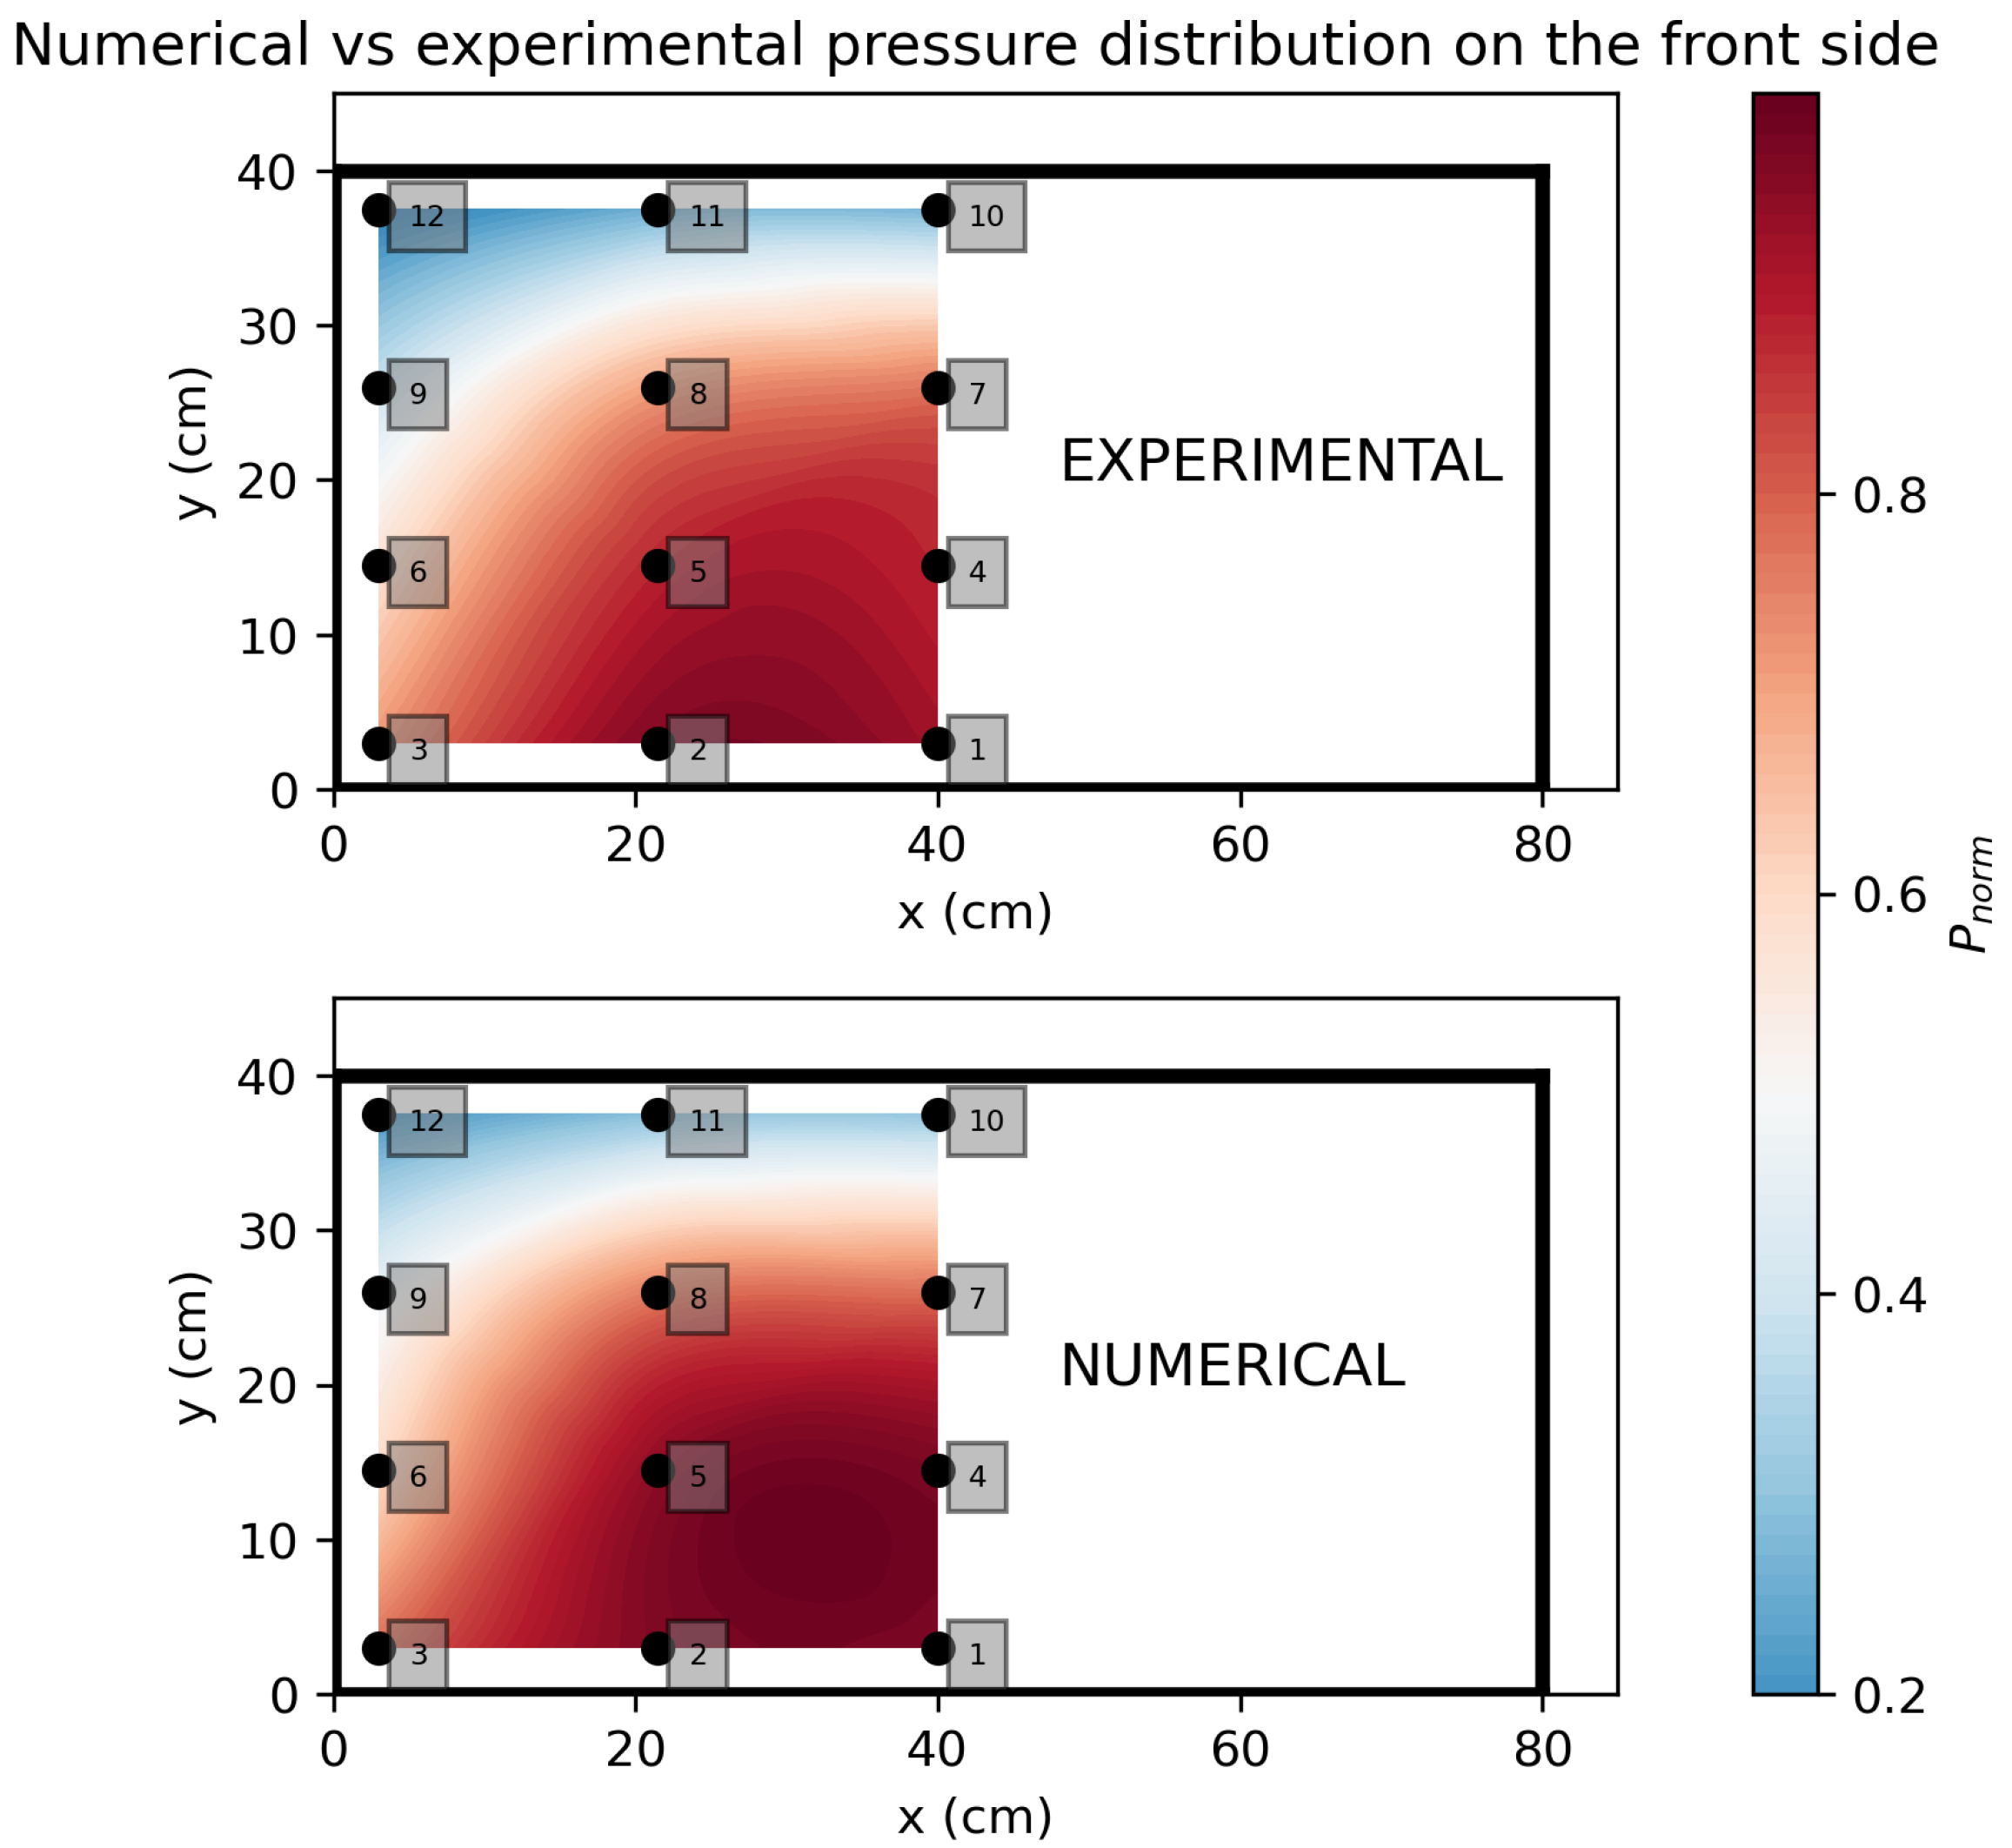
Figure 13 shows the measured and calculated mean static pressure contour on the front surface of the PV panel at an inlet velocity of 10 m/s, as well as the locations of the measured points. The static pressure was measured only on one half of the PV surfaces. The mean static pressure was calculated by normalizing the static pressure at each point with respect to the dynamic pressure at the inlet, which was 59 Pa and 56 Pa for the numerical calculation and experimental measurements, respectively. As expected, the highest pressure was reported near the centre of the PV panel, close to the lower edge at Points 1, 2, 4, and 5, which correspond to the leading edge of the PV panel. Then, the mean static pressure decreased towards the higher edge of the PV panel at Points 10 to 12; this can be attributed to the three-dimensional flow characteristics [
43]. The figures show a good agreement between the experimental measurements and the numerical calculations. The measured mean static pressure on the rear surface of the PV panel (
Figure 14) was almost the same on the entire rear surface, except at the middle of the PV panel near the higher edge at Point 22, where the pressure was higher. The size of this higher pressure region was overestimated by the numerical simulations: this mismatch might be attributed to the effect of the tower supporting the PV panel during the experimental measurements. However, a reasonable agreement was obtained with a maximum error of 0.06 in the mean pressure over the front and rear surfaces of the PV panel.
Pressure measurements were only available for the 10 m/s case, but the pressure for the 5 m/s case was investigated using the numerical model (see
Figure 15). As expected, the trend of the pressure distribution over the PV surfaces was similar, and the values of the pressure increased with increasing wind speed.
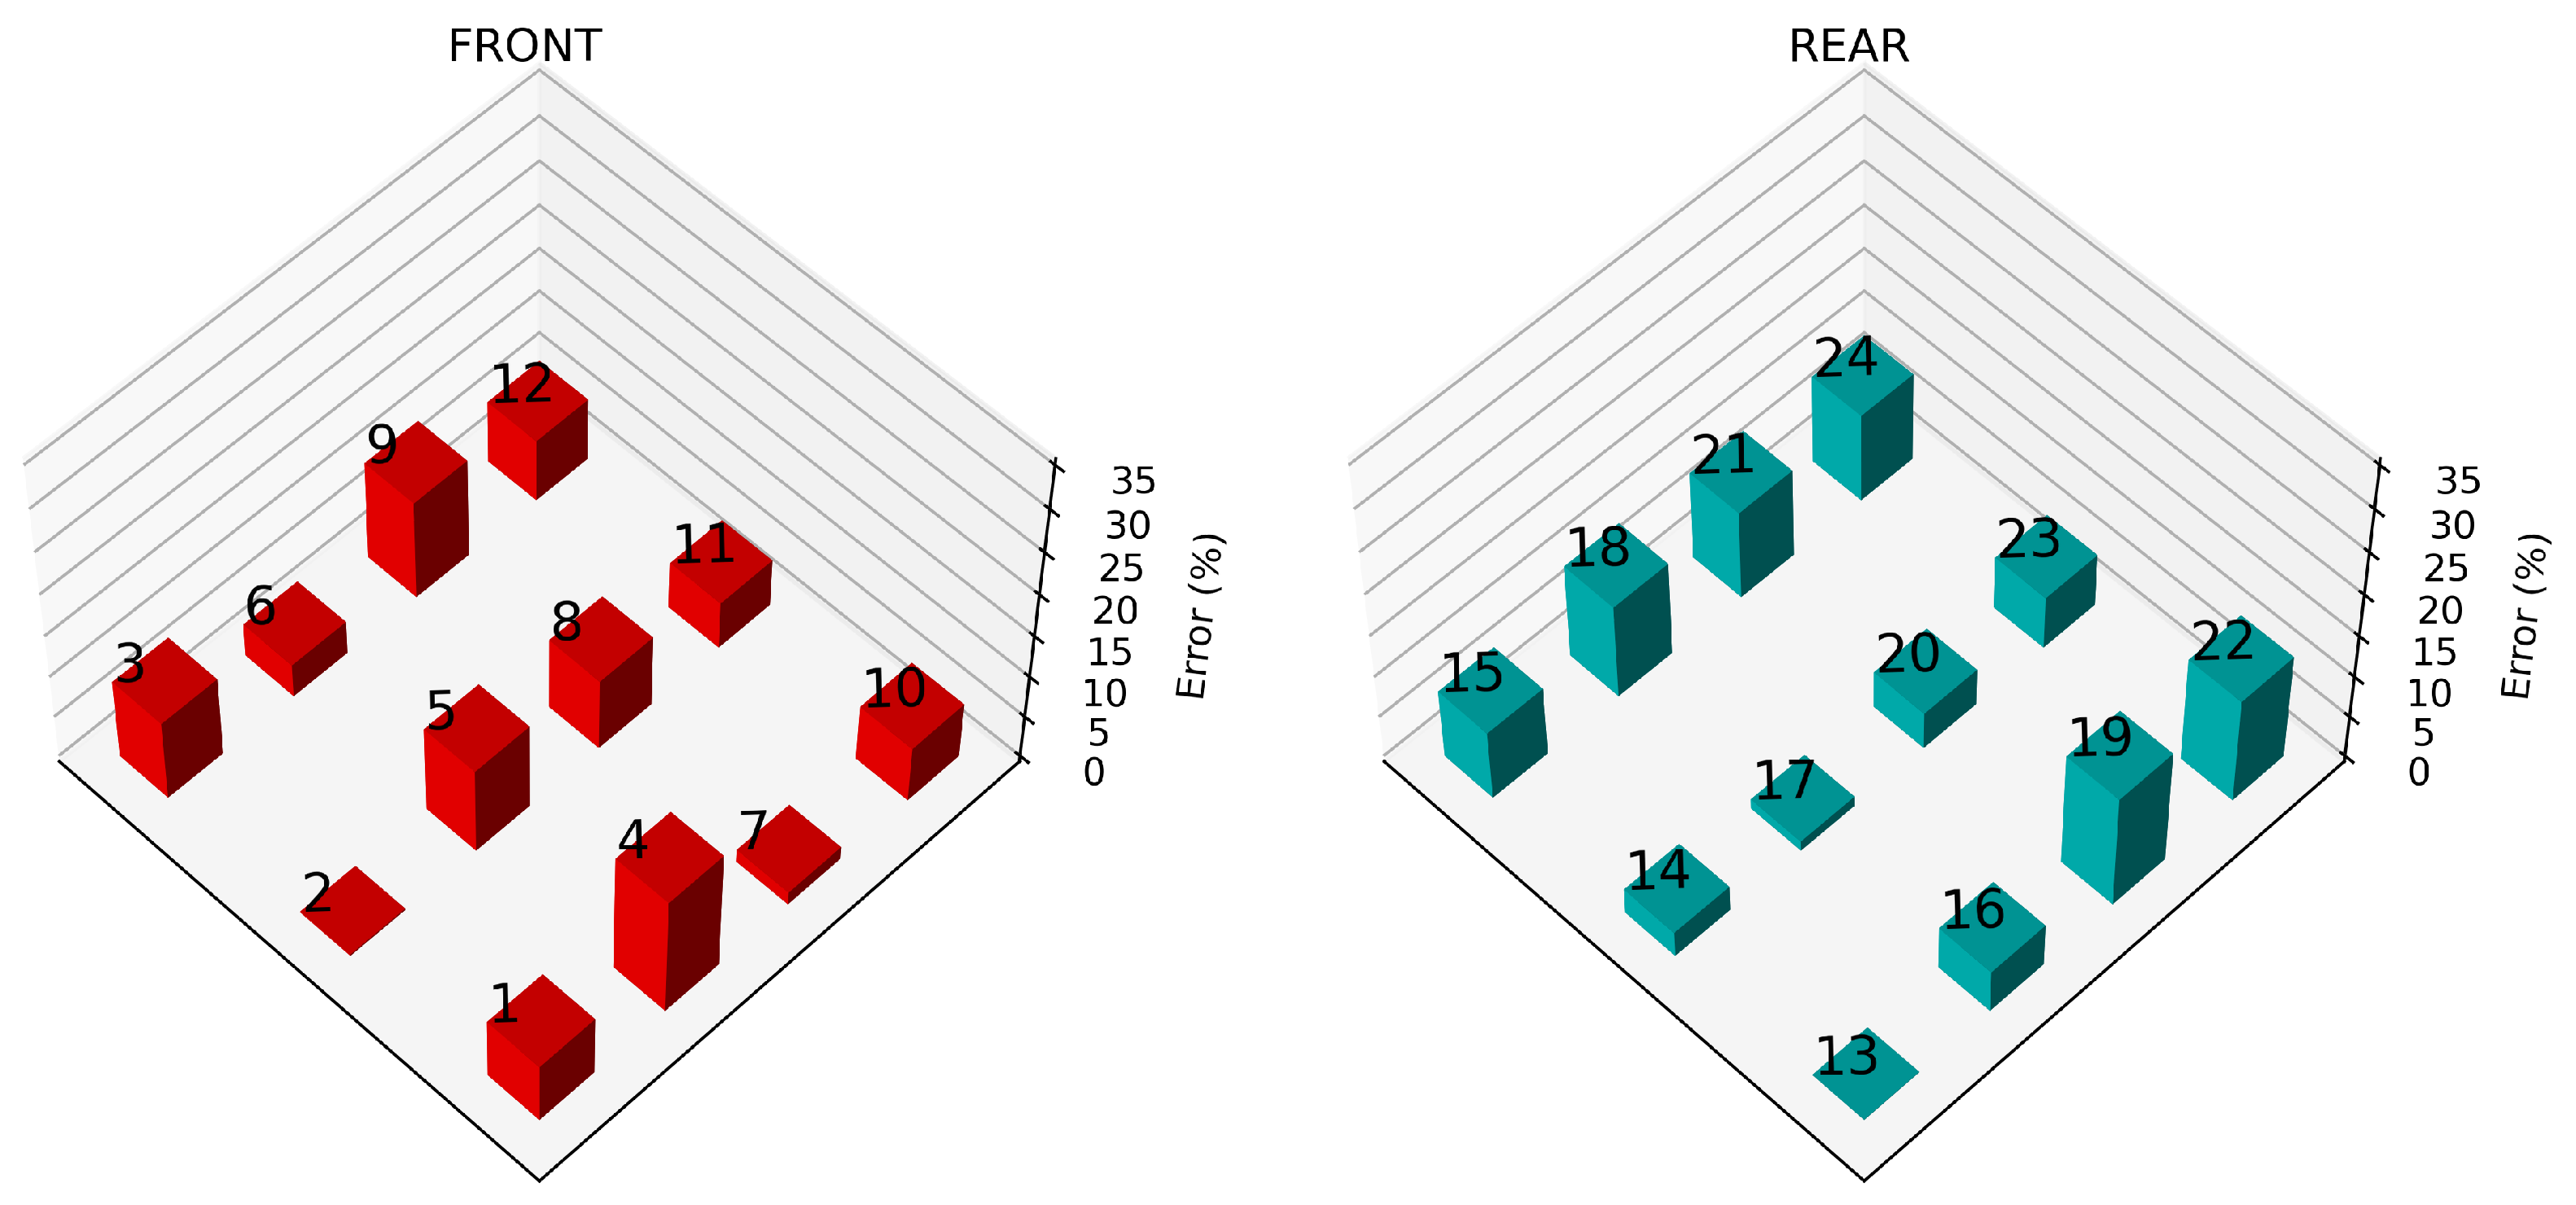
In order to report a quantitative estimate of the goodness of the results, the pressure absolute percentage error (
,
and
being respectively the measured and simulated pressure) was computed for each instrumented point of the front and rear surfaces. These results are reported in
Figure 16, representing the panel plane with the same point numbering as in
Figure 13 and
Figure 14: it is possible to observe that generally larger errors were located near the borders and the corners. An overall estimate can be obtained by simply averaging the absolute percentage error on the points of each surface, and it was slightly higher than
, both for the front and the rear side.
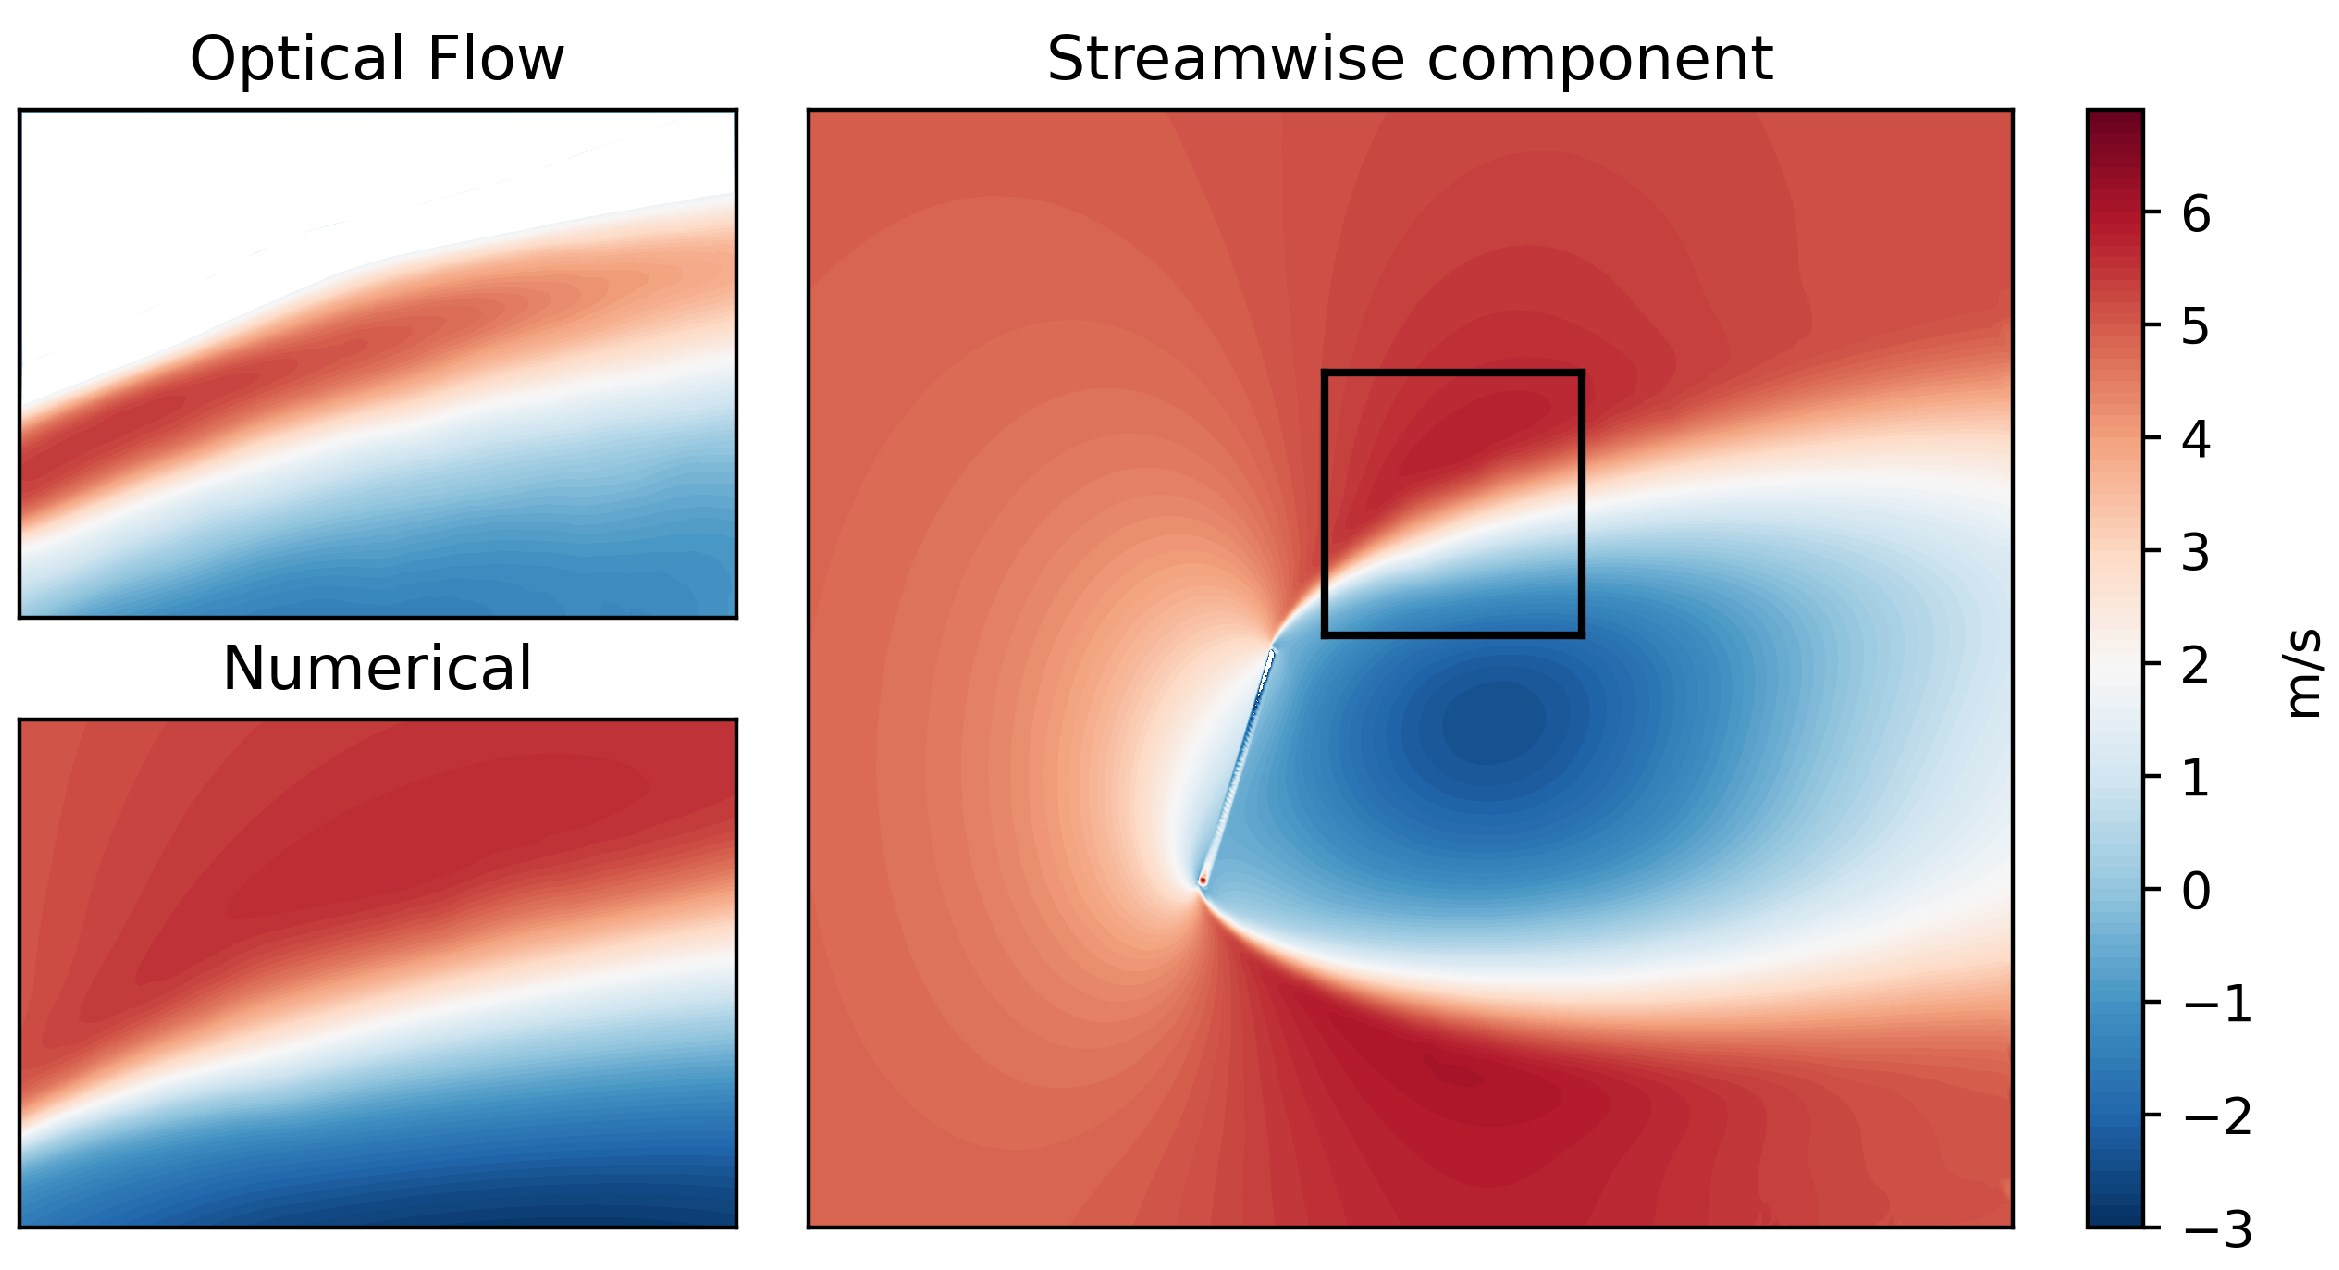
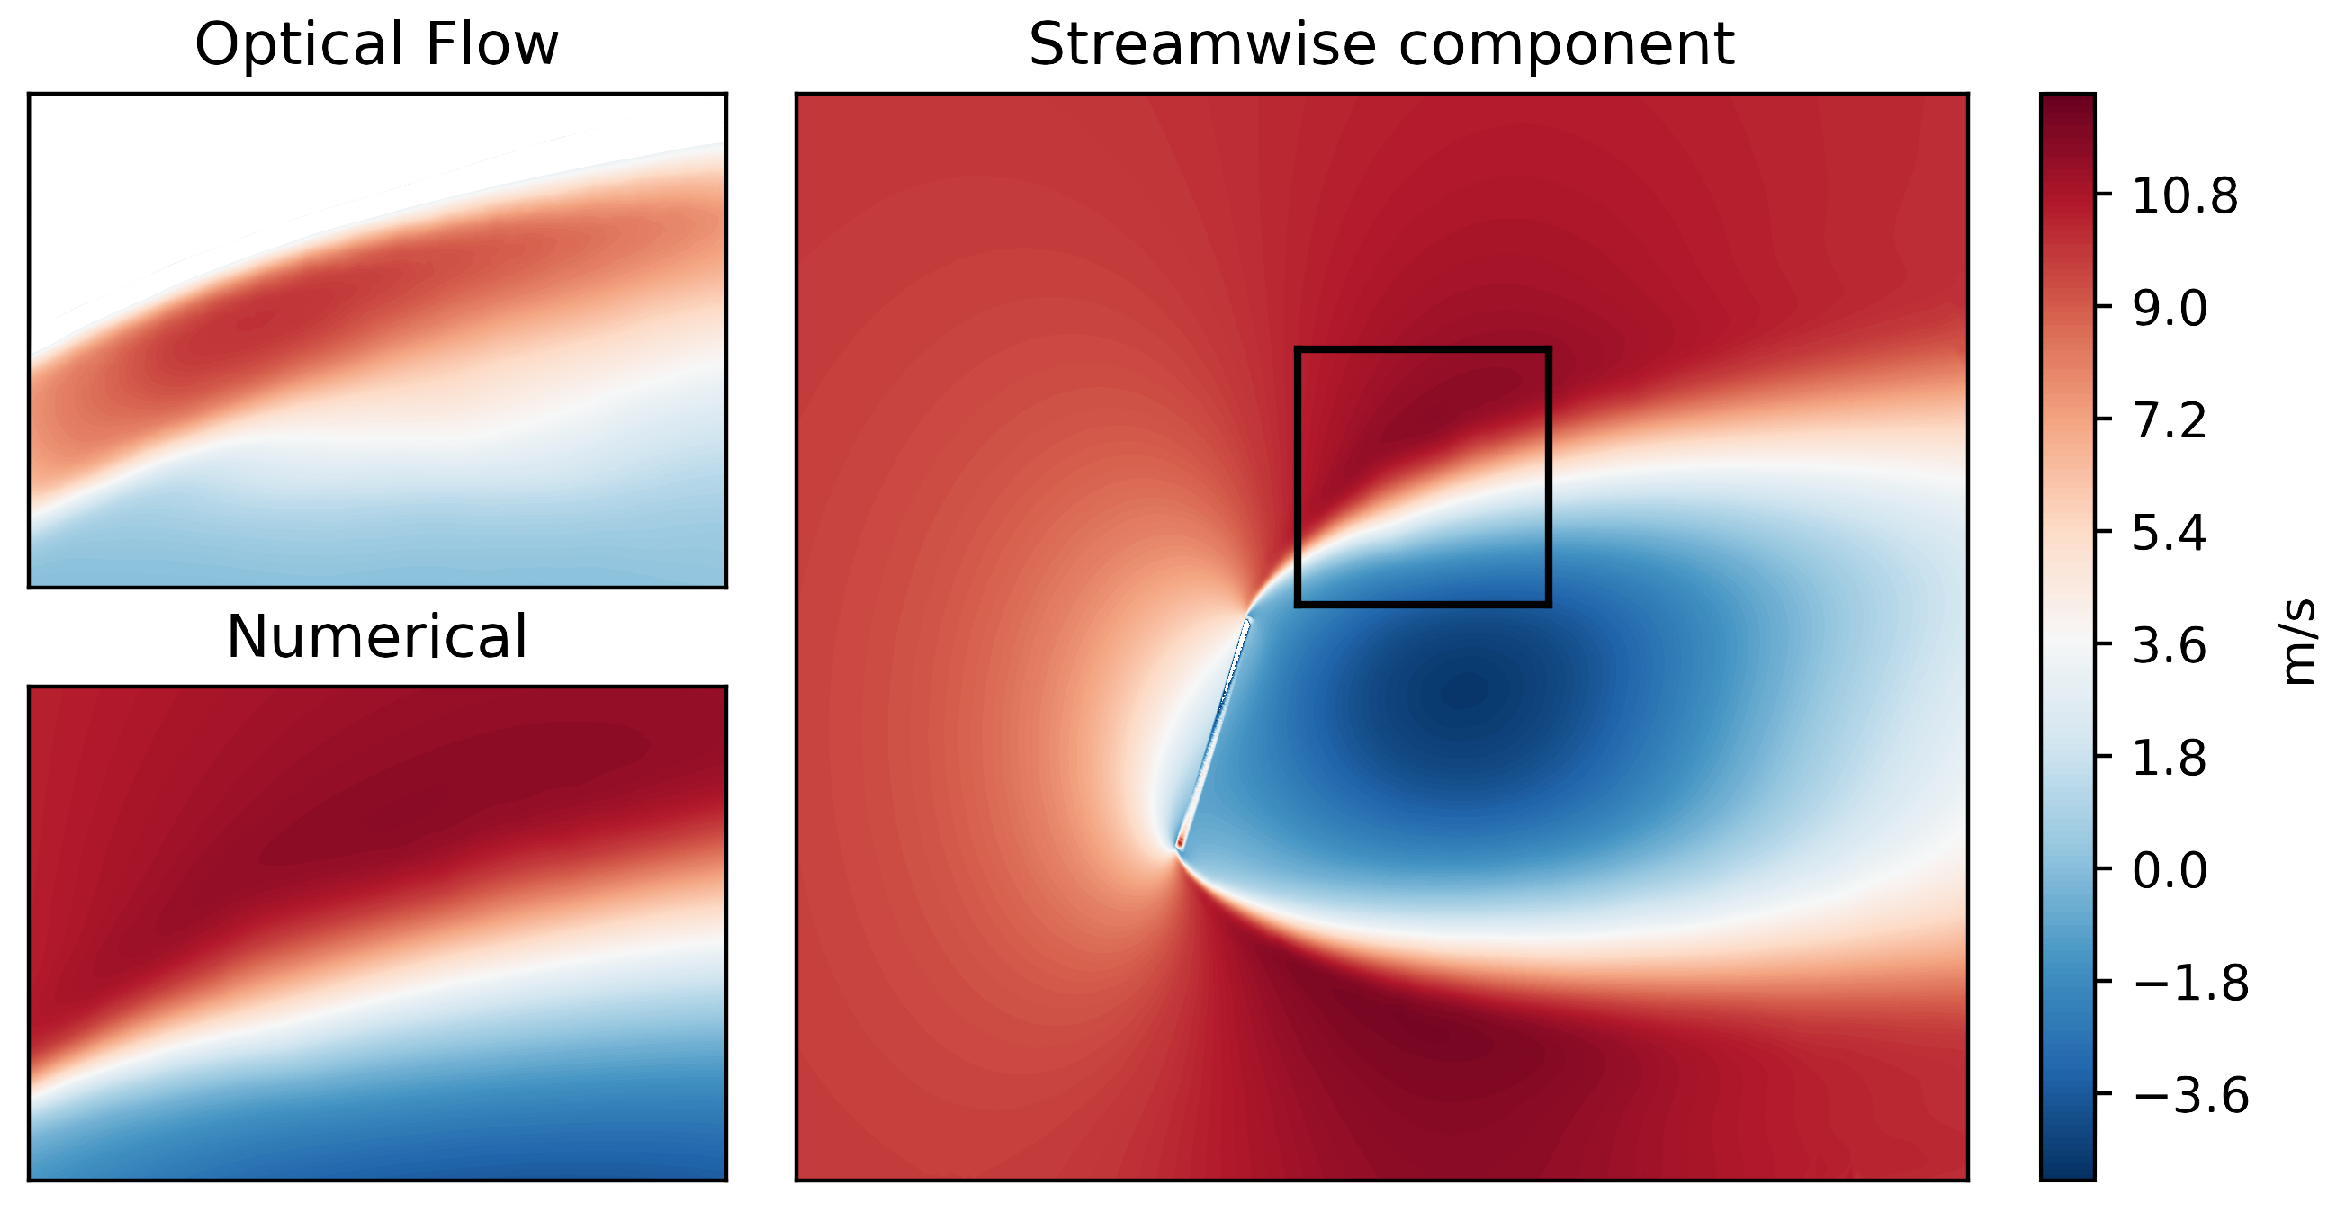
In
Figure 17 and
Figure 18, the distributions of the wind speed streamwise magnitude on a plane parallel to the flow are represented for the 5 m/s and 10 m/s cases. In this case, the results from the numerical calculations and from the video postprocessing (through the optical flow) can be compared only on a small portion of the field. Despite reliable results from the video postprocessing being available only where there was enough seeding, the comparison appeared quite fair, especially for observing the limit of the wake generated by the panel.
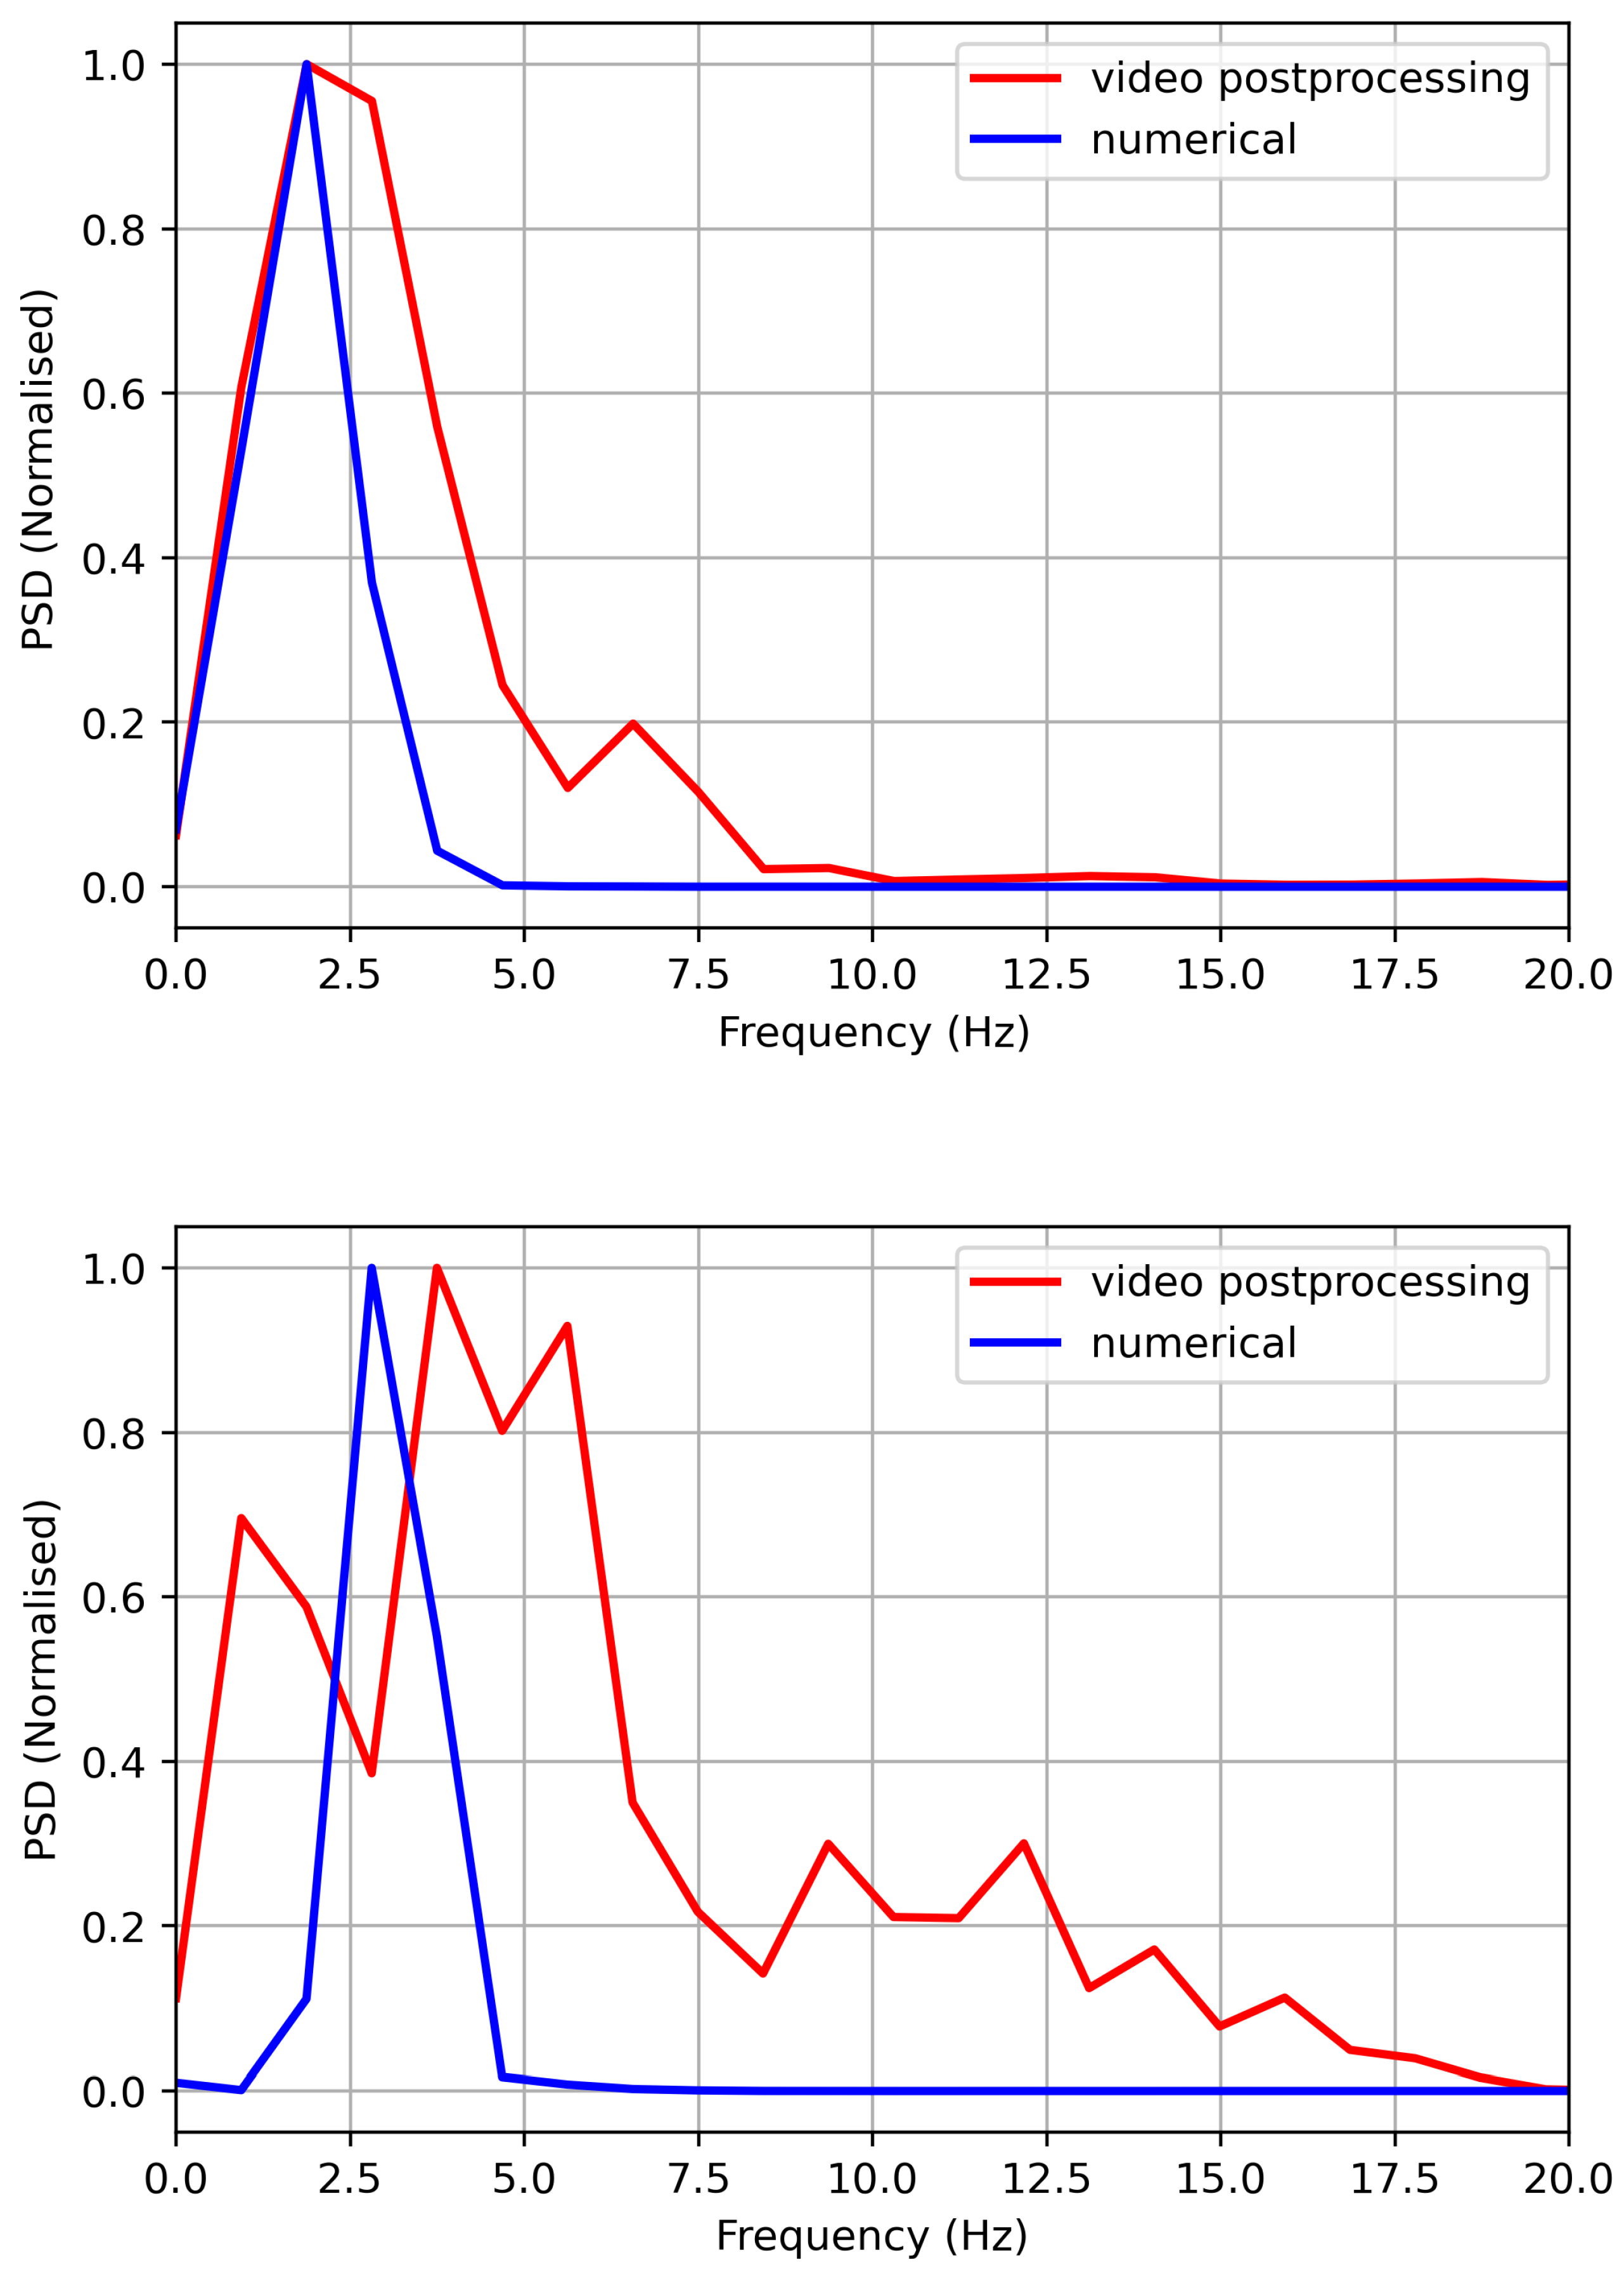
The use of unsteady RANS allowed also developing a simplified dynamic analysis and validating it using the experimental observations. The flow parameters during the numerical simulation started with extremely oscillating values (due to the initial conditions) and then tended asymptotically to the final value with more gentle oscillations. After the first time steps, it was therefore possible to observe the main vortex shedding oscillations and to compare them against the analysis of the experimental time histories. As the video postprocessing was available for a period of about 5 s, the processing was developed comparing a time history of 4 s sampled from the numerical model with the same sampling rate of the video acquisition. In such a way, it was possible to exclude the first half second of unstable calculations and to arrange a comparison of the time histories and the power spectral density (PSD) spectrum.
The rationale for these analyses was not the expectation (which would be incorrect) that the output of the URANS simulations and of the experimental measurements could be matched instantaneously. By reporting
Figure 19, with the simulated and measured time series, the objective was (similarly as done in [
15]) appreciating qualitatively to what extent the URANS simulations can reproduce the frequency content of the experimental measurements. Sideways, this explains why the numerical and experimental PSD spectra in
Figure 20 were normalized to the corresponding peak and only the location of the peak was discussed. In this sense, the present analysis is far from being a complete aeroelastic characterisation of the PV panel, but it provides meaningful information. From
Figure 19, increasing the inlet velocity to 10 m/s, the Reynolds number increased, and this led to high-frequency turbulent fluctuations in the experimental measurements:
Figure 19 indicates that, after about 2 s of the flow, the solution became steady.
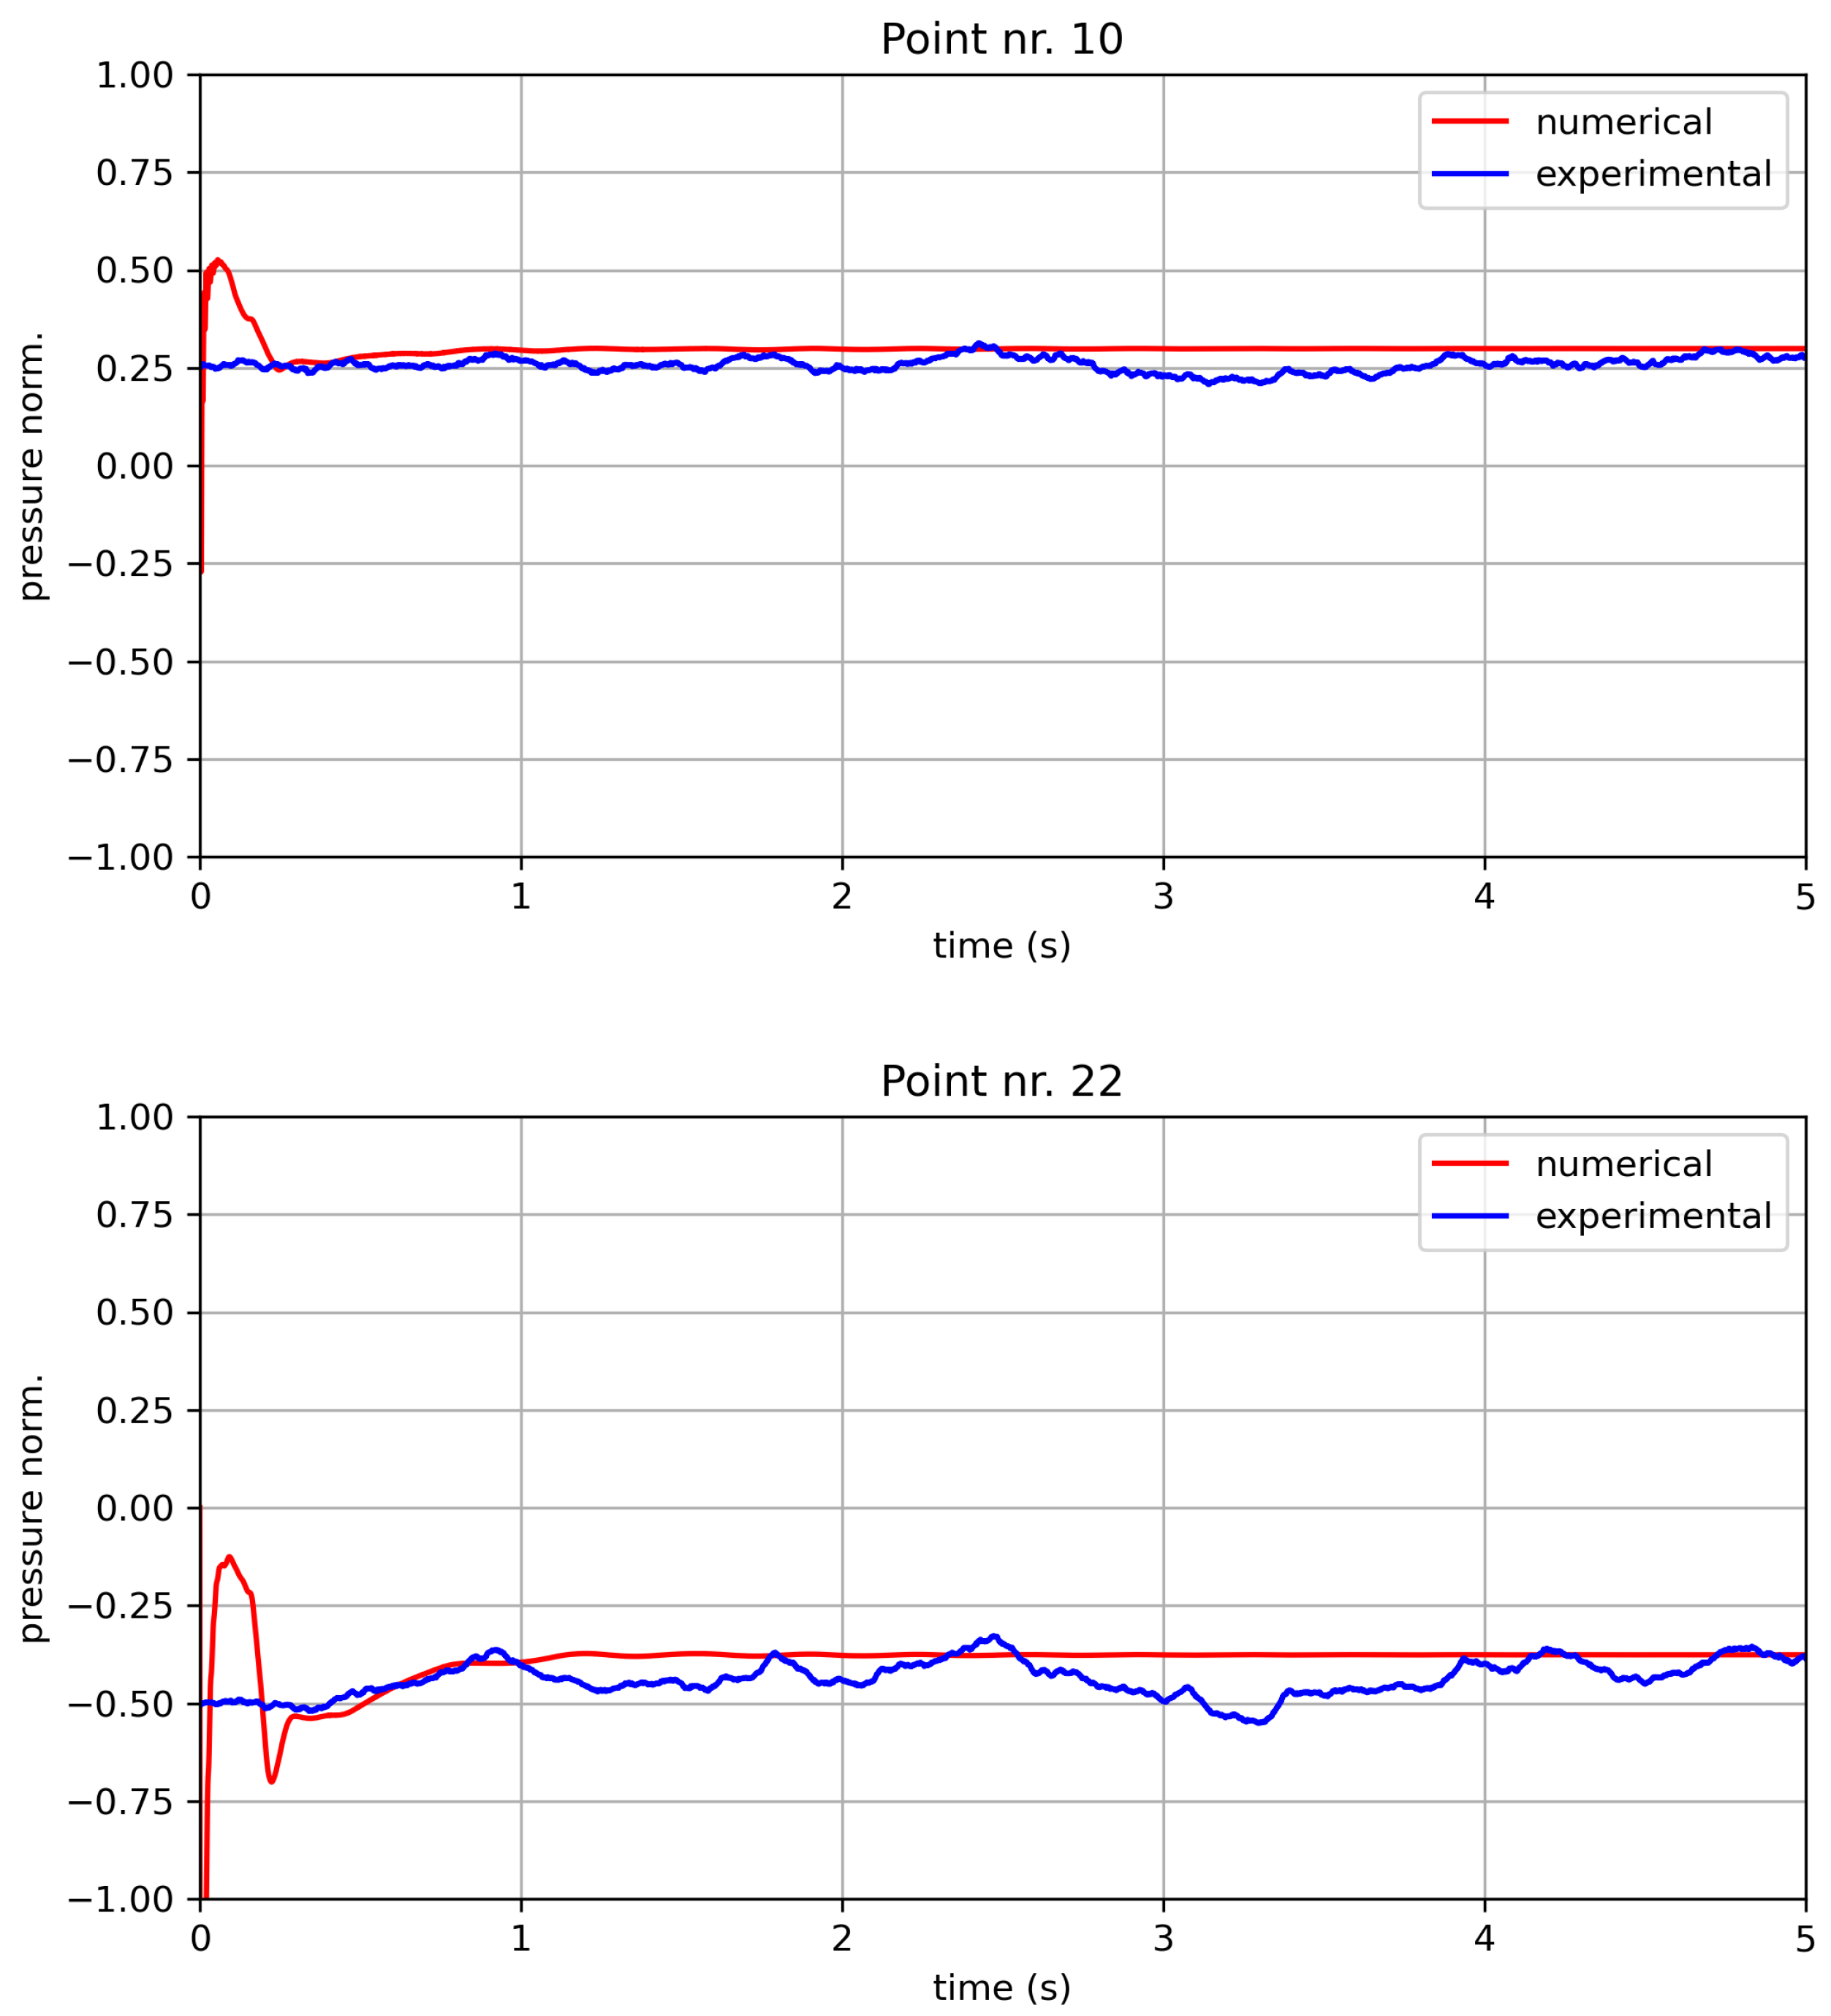
Figure 21 presents the numerical and experimental time histories for the pressure over the PV surfaces at 10 m/s. Two points were selected: one on the front surface (Point 10) and the other on the rear surface (Point 22). The flow on the front (respectively, rear) surface took about 0.3 s (respectively, 1 s) to become steady: this can be attributed to the incoming flow attached on the front surface, while it separates on the rear surface due the presence of the generated vortex behind the PV panel.
The flow characteristics around a photovoltaic module played a major role in the oscillations of the PV panel, which might cause a structural failure. In [
55,
56], it was shown that the RANS simulations were not appropriate to model the unsteady vortex shedding. The velocity time history at a reference point downstream the PV (
Figure 8b) was monitored to investigate the shedding frequency of the generated vortexes.
Figure 20 shows the variation of the normalized PSD with the frequency of vortex shedding at inlet velocities of 5 m/s and 10 m/s. In general, there was a good agreement between the measured and calculated power spectral density at 5 m/s: the frequency at which the peak of the PSD occurred was practically identical for the experimental measurement and numerical calculations and was at about 2 Hz. However, increasing the inlet velocity to 10 m/s, the peak of the PSD moved to 2.8 and 3.75 Hz for the calculation and measurement, respectively, and the percentage error was therefore in the order of 25%. This can be explained in light of the differences between the 5 m/s and the 10 m/s cases, arising from
Figure 19.
6. Conclusions
In the present study, the wind flow over a PV panel was studied numerically and experimentally. The general motivation for this analysis was that a PV panel operating in field can be subjected to a complex scenario of wind loads, and its structural design should be conceived of consequent to this.
In this study, scaled wind tunnel tests were performed: the analysis was devoted in particular to a tilt angle configuration (), which, based on preliminary numerical studies, was considered interesting for the characterisation of the flow–wake transition associated with the fluid–structure excitation. Based on the results collected in this work, we support this kind of application of the experimental optical flow measurement technique. On the one hand, this method guarantees a fair reliability, and on the other hand, it can be applied to investigation objects whose size would be prohibitive for PIV applications.
The numerical simulations were based on the URANS equations: the rationale for this selection was to inquire to what extent this kind of model, which is computationally affordable also in the industry practice, can capture the essential features of the behaviour of the selected configuration.
The results support that:
The proposed experimental technique can be a very important tool for an in-depth characterisation of the flow over PV modules, without requiring excessive scaling. A critical point of this kind of method is that results are reliable only in portions where there is enough seeding: by this point of view, therefore, the comparison against the URANS simulations can indicate to what extent the optical flow measurements are reliable. The area where experimental results can be considered reliable is sufficient for observing the limit of the wake generated by the flow around the panel;
The agreement between the experimental measurements and the simulations was good as regards the average pressures on the front and rear of the panel: the average error was in the order of 7%;
There are well-known critical points regarding the capability of the URANS simulations to reproduce the instantaneous quantities, and as expected, these exacerbate for growing wind intensity. Nevertheless, the estimated power spectral density of the wind speed time history reproduces quite reliably the position of the peak: this information can be extremely useful for the structural design of PV panel, and therefore, this kind of result supports that URANS simulations represent a useful surrogate of more complex and time-consuming experimental (wind tunnel tests) or numerical (large eddy simulations) methods.
There are several interesting further directions of this study. Substantially, the literature on wind flow over PV panels is comprehensibly focused on average quantities (as, for example, pressures). The present study aimed at characterising through affordable methods the most essential features of high unsteadiness. In this sense, it is hoped that further studies will improve the first developments achieved in the present work. Large eddy simulations would be fundamental for a deeper critical discussion of the experimental methods, for example through the analysis of the high-frequency tail of the PSD, which was neglected in the scope of the present study.


