Abstract
The nature of carbonate deposition as well as diagenetic processes can cause the development of unique geological features such as cavities, vugs and fractures. These are called karsts. Encountering karsts while drilling can lead to serious consequences such as severe mud losses, drops of bottom hole assembly and gas kicks. To improve drilling safety in intervals of karstification, it is important to detect karsts as early as possible, preferably in advance. In this paper, we review methods and technologies that can be used for the prediction and early detection of karsts. In particular, we consider acoustic, resistivity, seismic and drilling-data methods. In addition to the inventions and technologies developed and published over the past 40 years, this paper identifies the advantages, limitations and gaps of these existing technologies and discusses the most promising methods for karst detection and prediction.
1. Introduction
Drilling often follows complex well trajectories to reach a reservoir target or to geosteer away from geological objects that are dangerous for drilling [1]. Examples of such dangerous objects, which often occur when drilling in carbonates, are caves or systems of cavities formed due to complex karstification processes. We refer to the common definition of karst [2] that describes the landscape which contains caves, underground channels, and other associated soluble rock features.
Encountering karsts while drilling can cause critical safety incidents. Depending on the size of the encountered karst, losses of drilling fluid can be uncontrollable, resulting in rapid gas migration to the surface and causing a loss of well control [3]. In the case of well-communicated fractures and caverns, which are common in some regions, losses can be treated without success for several weeks with the subsequent plugging and abandoning of the wells [4].
Such negative impacts of karsts on drilling operations have been reported worldwide. Based on more than eleven years of drilling experience in carbonate structures offshore Sarawak, Malaysia, total losses were encountered in more than 30% of the wells drilled [5]. In Culberson County, Texas, USA, in each case of drilling in the intervals of cave systems, losses progressed into total losses following well control incidents [6]. Drilling in naturally karstified carbonates of the Continental Shelf in Barents Sea, Norway, resulted in total losses causing weeks of non-productive time, shoot off and lost in the bottom hole assembly. In the western offshore fields of India, drilling and completion problems due to mud loss have been reported for a number of wells [7]. In the North Senoro Gas Field of the Philippines, well control issues in carbonates and total mud losses have been followed by gas kicks [3]. In Eastern Siberia, Russia, catastrophic mud losses reaching several thousand cubic meters have occurred while drilling in carbonates and resulting in gas kicks [8].
Overall, the problem of drilling in carbonates is serious and costs the industry more than USD 800 million per year [9,10].
There are different methods to mitigate the risks of drilling in karstified regions. As shown in Figure 1, we define three main groups depending on when risk minimization occurs. The first group aims to minimize drilling risks at the pre-drill stage by identifying potentially dangerous intervals that need to be considered before drilling begins. One of the ways to reveal dangerous karst objects before drilling and estimate the risks of drilling is based on geological analysis. In many cases, there are different surface and subsurface signs of karstification that can be detected in the pre-drill stage. These signs can be employed to identify such regions and intervals to optimize well placement and well path.
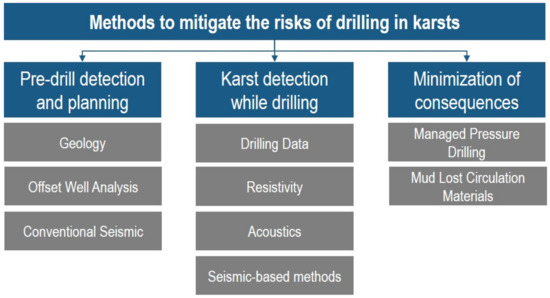
Figure 1.
Methods to mitigate the risks of drilling in carbonates.
Another method, which provides insight into potentially dangerous intervals for drilling, is that of offset well analysis. Intervals with karstification signs that are dangerous for drilling can be defined based on well-site reports, drilling history and the incident analysis of the offset wells. These intervals, in accordance with different approaches to discrete properties distribution [11], can be propagated into inter-well space and projected on the planned well path. In case the planned well path crosses the projected high-risk interval, its drilling trajectory and/or drilling program can be revised for drilling risk minimization.
Seismic imaging is the last method in this group which is the standard technique for mapping reservoirs, faults and structural surfaces. The seismic detection of karst structures can be very efficient for early drilling risk minimization by providing the most complete picture of the main subsurface objects [12].
The second group represents methods of karst detection performed while drilling. In some cases, it is challenging to minimize drilling risks at the pre-drill stage. As is the case in exploration drilling, uncertainties might exist due to the limitations of pre-drill karst detection methods. Thus, to increase the accuracy of karst feature detection, real-time measurements should be used.
There are four main real-time approaches that can be utilized for early karst detection. The first deals with the study of drilling data such as drilling mechanics and mudflow data. This approach aims to identify unique patterns of drilling measurements before and within karst intervals. The second approach covers resistivity methods of karst detection based on ultra-deep look-around and ahead-of-the-bit measurements. The third approach unites a number of measurements which utilize the principle of reflected acoustic signal detection from interfaces. Unlike in conventional seismic imaging, these methods use different wavelengths which helps detect small karst features. The fourth approach investigates seismic-based methods. This set of methods is separate from the conventional seismic methods group as these measure seismic reflections while drilling. These methods are based on the principle of the downhole generation of seismic waves, which gives a number of advantages over conventional seismic methods.
The last group addresses methods to minimize the consequences of drilling into karsts. One of the main challenges of drilling in carbonates is potential mud losses of varying severity. This often occurs when a well path crosses highly permeable channels, faults, or caves. Depending on the volume of mud losses and the geometrical sizes of the channels, some can be successfully plugged by lost circulation material (LCM) [13,14]. However, severe mud losses are frequently encountered in large fluvial channels or caves which cannot be plugged with LCM and may lead to well control incidents [5]. The solution widely used by the industry is managed pressure drilling (MPD) and its modifications. In this case, the well is converted for pressurized mud cap drilling (PMCD) and drilling can be continued with the controllable pumping of sacrificial fluid and drilling cuttings into caves, fractures and other highly permeable zones. The efficiency of this approach was demonstrated by a number of wells drilled in carbonates [15,16,17,18]. However, MPD-based solutions for drilling risk minimization have limitations. First, additional equipment should be mounted on the rig such as a rotational control device and modified riser joints. Second, in some regions, it is impossible to supply the required significant volume of sacrificial fluid to pump into well. Third, there are might be government restrictions on well conversion into PMCD. These factors might impose limitations on the use of PMCD. The methods described in this group are beyond the scope of this paper.
The scope of this study is to analyze different geophysical methods and evaluate their ability to detect karsts either before drilling begins or during drilling—but before the drill bit hits a karst. Therefore, we follow the first and second groups of methods from Figure 1. This analysis may contribute to the better utilization of existing technologies and enhance understanding of possible technologies for future development. Thus, we evaluate the effectiveness of various methods for early karst detection. By systematically analyzing various types of available measurements based on different principles, we effectively constrain the range of concepts and summarize their areas of applicability. This can provide a starting point for identifying relevant measurements for each specific case to minimize the risks of sudden karst encounters. We examined the role of the existing state of the art and highlighted examples in which conventional geophysical methods can provide a valuable outcome for decision making. The physical principles of measurements discussed in this paper are an important aspect of the proper evaluation of geophysical methods for detecting signs of karstification.
One of the contributions of this work is the identification of the most representative types of geophysical, geological and seismic studies that enable us to identify intervals and zones with the highest probability of karst detection before drilling into them. The presented contribution can be used to narrow available pre-drill and real-time data and focus on the most representative methods capable of giving the most accurate early detection of karsts.
This paper is structured as follows. In Section 2, we present an overview of the geological signs of karstification. This gives an overall picture of karstification objects which are important for the further localization of potentially karstified areas. In Section 3, we review pre-drill detection methods. This section covers the analysis of geological signs of karstification, offset well analysis and seismic methods. Section 4 covers methods of karst detection and predictions based on real-time measurements. It discusses resistivity-based measurements (including the newest ultra-deep resistivity technologies), acoustic-based approaches (conventional and advanced deep reflected-based sonic measurements, borehole acoustic reflected survey (BARS) and seismic-based methods (including seismic imaging while drilling and state-of-the-art seismic-guided drilling (SGD)). The overall summary of the discussed methods is presented in Section 5. Conclusions and future work are given in Section 6.
2. Geological Signs of Karstification
Many processes can contribute to karst development. The dissolution of soluble rocks by meteoric waters is the main mechanism of karstification [19]. In addition to chemical weathering processes, significant contributory factors for karst development are rock lithology, chemical composition, the redistribution of thermal stresses, and pressures. In karstology, terrestrial and underground karstification objects are usually distinguished as shown in Figure 2. Green labels in the figure indicate the surface traces of karstification. For example, surface micro-forms can be presented by joints, which divide limestone into blocks with vertical cracks, called grikes [2]. These objects are the result of rock dissolution. Larger signs of karstification are typically categorized as macro-forms and can reach up to a kilometer. An example of the largest macro-form is a polje. Polje is a term used to describe a flat depression of karst limestone which can extend up to tens of kilometers [20], typically formed as a result of a karst collapse, as shown in Figure 2.
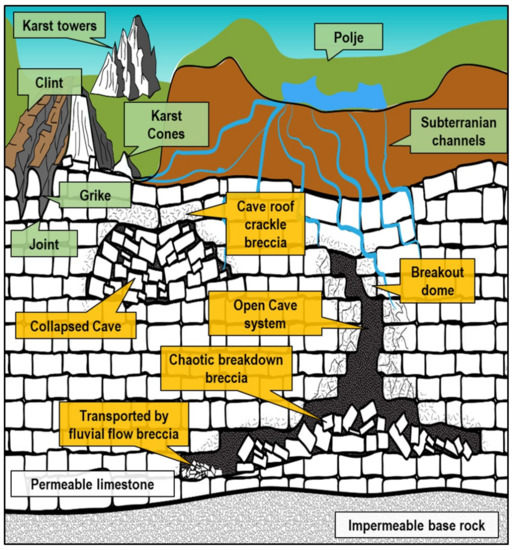
Figure 2.
Karstification features. Surface and subsurface features are indicated by green and yellow labels, respectively. Figure is inspired by [2,19,20,21,22].
Despite the fact that karstification objects are very diverse, karstologists can classify these objects based on their characteristic features and with a high degree of probability to determine whether a given form of the landscape is the result of karstification processes.
The detection of subsurface karst forms is more challenging due to the limitations of subsurface methods for geophysical studies and the numerous processes involved in the development of karst forms. Examples of subsurface karst forms are collapsed and open caves, as shown in Figure 2. Yellow labels in the figure indicate subsurface karst forms. In contrast to terrestrial karst development, which can significantly expand if dissolution conditions are favorable, subsurface karsts tend to collapse [21]. Ultimately, collapsed caves are filled with ceiling and wall rock debris, cemented together by a fine-grained matrix. These clastic sedimentary rocks formed from the fragments of minerals are called breccia. An example of breccia is presented in Figure 3.
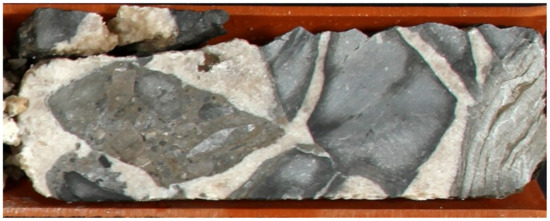
Figure 3.
Core plug sample photo of angular breccia. Interval of cave roof collapse in the Loppa High region.
The mentioned core sample plug is drilled out of an interval of cave roof collapse. Dolostone and angular fragments are filled with a matrix of smaller particles cemented together. These clastic sedimentary rocks can frequently be found in the intervals preceding caves.
The texture types of collapsed breccias such as cave roof crackle or breakout dome can often be distinguished around caves. As shown in Figure 2, depending on the stress distribution around the cave and rock mechanical properties, different fracture patterns around caves can develop. If the fracture pattern is known, the causative failure mechanism can be studied and a potential cave type can be predicted. For instance, breccia pipes and V-structures can have different fracture patterns.
In addition, many caves do not collapse and can exist in equilibrium with the surrounding rocks for a long period of time. These caves pose the greatest risk for drilling in carbonates due to the high probability of total mud losses and BHA drop incidents. Micro-fractures around caves might be conductive for fluid flow and be the cause of small mud loss events before the drill bit reaches the cave and the total mud loss incident occurs.
Fluid flow can also contribute to rock clastic masses transferring to places other than where they were originally formed. This leads to additional challenges in cave mapping based on signs of karstification such as breccias. Furthermore, the shape and geometrical properties of a cave are subjected to many processes involved in the genesis mechanism. There are numerous karst forms of different shapes and geometrical sizes [22], other than the discussed caves, which are given here as examples of subsurface karstification.
For further reading, we refer interested readers to a book on problems in theoretical karst science, where there are in-depth details of the possible factors affecting cave sizes, namely [23].
For a better understanding of karst objects and their effects on drilling, we refer interested readers to the studies in [24,25,26] on drilling in karstified carbonates in the Loppa High region in the Barents Sea which classify karstification objects into dangerous and not dangerous for drilling.
A comprehensive analysis of borehole images and the history of drilling revealed that karsts larger than 0.5 m pose significant risks for drilling since they lead to a partial or total loss of the drilling fluid, thus compromising drilling safety [24,25]. In some cases, BHA components were broken due to excessive shock-loading when the drill bit drops to the bottom of the cave. As an example, let us consider some parameters of a karstification cave that cause drilling problems. The physical principles underlying borehole imaging tools are the propagation of ultrasonic waves or the measuring of the electrical conductivity of the formation.
As reported in [26], the exact geometrical size of the karst is unknown. However, its interpretation from the borehole image defined the geometrical size as more than 50 cm in length with a circumference of 21.6 cm (8.52″ section of the well). Overall, the average size of the caves in the studied region is in the range of 0.5–2 m. These karst forms are challenging to detect with state-of-the-art geophysical methods.
In summary, the process of the karstification of a landscape may result in a variety of developments in large or small features both on the surface and beneath. This has important implications for evaluating the possibilities of dangerous karst from developments in the region of study. Starting from the identification of landscape signs of karstification, geologists and other specialists in geoscience can utilize the geological data, typically available before drilling begins, to determine what type of rock lies under the soil. Then, further analysis moves towards the detection of broken rocks which originate from a cavern, fractured zones and vugs. A joint analysis of the available geological data can be performed to improve the localization of potential karstified areas. An important element in this analysis is the detection of vugs and breccias which might be associated with the development of caves and/or the overall karstification of the interval.
3. Pre-Drill Prediction of Karsts
Risk avoidance and minimization measures in the early stages of well planning are essential components of risk management, which can predefine overall drilling and completion efficiency. Wellbore profile and trajectory optimization to determine the safest trajectory and ensure that a number of potentially dangerous geological features will be avoided can greatly enhance drilling safety. To design the safest well path, it is important to identify the spatial distribution and geometrical properties of drilling hazards based on the available pre-drill data. In this section, we first introduced the geological signs of karstification phenomena and then consider the pre-drill methods of risk minimization such as the projection of dangerous intervals on the new well path and seismic imaging of karsts.
The detection accuracy of karstification objects at regional or local scales is significantly dependent on the quality and coverage of the input geological data. For instance, in the case of limited input data, a study of only the landscape signs of karstification cannot reveal the spatial positions of karsts at significant depths. At the same time, a joint study of the geological section, through the evaluation of regional tectonics and sedimentation processes, can improve the accuracy of karst detection. Consequently, the discussed geological method can serve as the first step to obtain an overall picture of karst distribution in addition to revealing the main areas of karstification.
The main tasks for drilling risk minimization in the pre-drill stage are knowing what the risks will be and where they are likely to occur. Having discussed the objects that might be dangerous for drilling in carbonates, this leads us to question which methods can be used to reduce the existing uncertainties remaining after studying the landscape and subsurface signs of karstification. In the following section, we considered a group of methods that can be used for projecting possible drilling risks onto a new well trajectory based on acquired data and the gained experience from offset wells.
3.1. Projection of Drilling Risks on Planned Well Path
Gaining experience from drilling offset wells and transferring it to a planned well path are the two most critical components in well planning. The detailed analysis of recorded geophysical logs from offset wells can reveal some signs of karstification as mentioned in the previous section. Having found such signs, and thus identified karst intervals, the next step might be to examine whether there is a probability of intersecting with the same intervals during the new well trajectory.
This can be done as follows. In most cases, one cannot deterministically model caves and vugs, as we cannot obtain their geometrical properties with sufficient resolution in three dimensions. Instead, the modeling of such objects can be stochastically done with statistical equivalence to the observed distribution of karsts along the wellbore. Sequential Gaussian simulation [27] is a commonly used geostatistical method which aims to solve similar tasks of property distribution by creating stochastic models of spatial phenomena.
This approach is often applied for discrete fracture network modeling and helps populate individual fracture parameters such as the size, shape, orientation, aperture and coordinates obtained from well fracture characterization data. In addition, the same approach is used for volumetric rock property distribution such as porosity, permeability, density and many other parameters that can be incorporated into a 3D geological model in the interwell space.
A similar approach can also be used for the prediction of karst distribution. The simplest model of karst distribution begins with randomly setting the positions of caves in a pre-defined volume with a known density. Then, based on the calibration data of the exact cave positions obtained from geophysical study and/or offset well analysis, cave geometries and any other desired parameters can be incorporated into the model. The output of this model can be a projection of karsts into a new well trajectory. There are more sophisticated approaches to discrete property distribution, which can be used to model different levels of karst structure complexities. This example demonstrates the possible application of stochastic methods to model the distribution of karsts in carbonates.
Some limitations of this method should be noted. First, the statistics-based prediction of karsts on the planned well path depends on whether or not karsts were identified in the offset wells. Second, due to the possible lack of geophysical studies on offset wells, many karst features might be unforeseen and therefore cannot be included in the stochastic distribution. Third, there are a variety of stochastic methods with different settings that might project dangerous intervals differently. Detailed analysis of these methods is beyond the scope of this study, but these methods should be considered for well planning in carbonates to minimize the possible risks of sudden karst encounters.
3.2. Seismic Methods of Karst Detection
Seismic imaging is the most common technique for mapping reservoirs, faults and structural surfaces. In addition to the standard seismic applications, this is an effective instrument to reveal geological objects and risks of drilling through them. There are many successful examples of detecting karsts based on seismic reflections. Peiling et al. [28] presented the seismic reflection characteristics of a deeply buried karstic carbonate. Their paper explores Ordovician carbonate rock, composed of caves as well as vuggy and fractured-vuggy reservoirs, located in the central basin of the Tazhong area (China). The study concluded that the strong flake-like reflections have a direct relationship with the inter-layered karstification, which includes caves, vuggy and fractured objects.
Jianxun Zhao et al. [29] investigated how carbonate karsts can be mapped based on high-resolution 3D seismic data. In their study, more than 20 different seismic attributes were produced during processing. It was concluded that the amplitude and energy attributes have the highest correlation coefficients with calibration data (well log data). In addition to the successful case studies of mapping the diagenetic networks of karsts based on seismic indicators, there are many challenges associated with pre-stack time and depth migration.
Caves are typically small-volume objects and deviation from original pre-stack time migration imaging points can result in the significant inaccuracy of cave position estimation. Typically for small targets, pre-stack depth migration must be used. There are different methods and algorithms for depth-migration. Extensive work on and analysis of depth migration algorithms for cave detection was conducted by Wang Xiaowei et al. [30]. The results found that there is a significant shift of 30–70 m up-dip between Kirchhoff pre-stack depth migration and reverse time migration algorithms. This strengthens the idea that conventional seismic imaging has significant limitations due to serious uncertainties generated by depth-migration algorithms. The significant influence of the depth-migration algorithm on karst mapping is the main drawback of conventional seismic methods for the detection of karsts.
On the other hand, reflections from cave-like small structures are different from the reflections from extensive interfaces. Small objects typically generate diffractive waves, which propagate with wide scattering and azimuth directions. As these signals are often weak, they can be affected by different types of noise and therefore have a low signal-to-noise ratio. Imaging such small objects requires advanced acquisition and processing approaches. This problem has been investigated by [31,32].
In addition, the fundamental limitation of the seismic detection of karsts is linked to the problem of vertical and horizontal resolutions [33,34]. In the seismic detection of karsts, both vertical and horizontal resolutions are important due to the nature of the problem of unknown scale. Nijian Wang et al. [35] explored the capability of seismic imaging to detect artificial karst caves, gradually increasing in height from 8 to 316 m. With the given model parameters, the velocity of 4000 m/s, and the source dominant frequency of 25 Hz, it has been shown that caves less than (40 m) cannot be separated due to wave interference [35].
As discussed earlier, some karstic features are relatively small (up to a few meters) and fall beyond the resolution of state-of-the-art seismic methods. Such small cave systems or fluvial channels might be dangerous to drill through, as the total permeable volume is typically large enough to totally absorb drilling fluid, as will be demonstrated with an example in Section 4.1. Thus, the main drawback of conventional seismic imaging for karst detection is linked to its inefficiency to detect small objects that must be taken into account to minimize drilling risks. Thus, instead of conventional seismic methods for karst detection, in Section 4.4, we examine seismic-based methods with a better vertical resolution that may be more suitable for karst detection.
4. Real-Time Detection of Karsts
In the previous section, we discussed methods of pre-drill karst detection that can be utilized for drilling risk minimization in the well-planning stage. This section is devoted to methods of real-time karst detection performed while drilling.
To learn more about the real-time detection of karsts, we consider a deeply buried paleokarst terrain in the Alta and Gohta discoveries of the Loppa High region (Figure 4). The seafloor in the studied region consists of complex patterns, formed as a result of considerable uplift and Cenozoic-era erosion. Uplift has brought high-density rocks close to the seafloor. This creates additional difficulties for seismic studies of the region [36]. This tectonic event led to the development of a complex underlying structure with extensive faulting and a significant altitude change of more than 1000 m (Kobbe formation). Deeper layers of naturally fractured carbonates were weathered and buried. This caused the karstification and development of dominant regional karst features with certain properties.
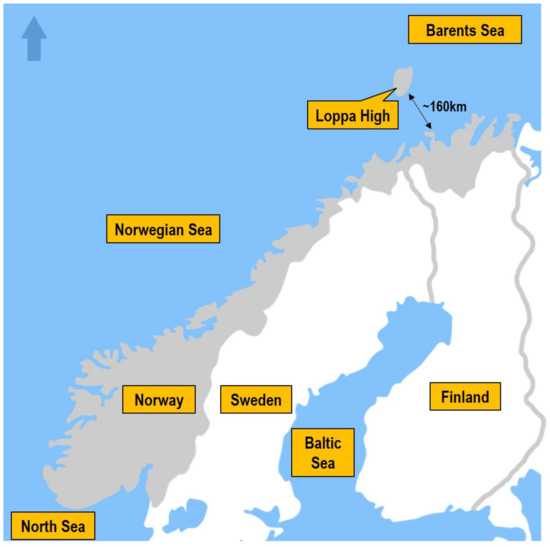
Figure 4.
Barents Sea, Loppa High Region, Alta and Gohta discoveries.
4.1. Drilling Data Method for Karst Detection
The real-time identification of karsts and signs of karstification is possible based on the real-time drilling and mud-losses data. This approach, described in [37], is based on the analysis of patterns of real-time drilling data corresponding to karstification objects. Before describing these patterns, we review the real-time measurements that can be used for karst detection while drilling. These measurements can typically be divided into surface and downhole data (along-the-drillstring measurements are not considered in the proposed method). The surface set of measurements consists of: (1) distance drilled per period of time—rate of penetration (ROP); (2) the weight on the hook (hookload); (3) frictional pressure drop along the drilling components in hydraulic circuit (stand pipe pressure); (4) minimal, maximal and average rotational speed of the BHA as an indicator of stick and slip (SS). More information about these measurements can be found in [38,39,40].
The bottom hole assembly (BHA) typically includes a sensor package located close to the drill bit for measuring different downhole parameters [41,42,43]. The horizontal strain-gauge is used to measure the effective torque acting on the drill bit and the vertical strain-gauge is used for measuring drilling weight-on-bit (WOB) [44].
These downhole measurements are important for early karst detection as they have (1) the smallest bit-sensor offset compared to the other sensors installed in the BHA; and (2) they can reveal specific BHA behavior in the intervals of karstification. Based on the analysis in [37] performed for more than 20 wells in the Barents Sea, it was concluded that the most reliable indicators of karsts are drilling breaks and higher BHA shocks. Along with the drilling dynamic data, mud-flow measurements should be considered to increase the accuracy of karst detection. The list of measurements is given in Table 1.

Table 1.
List of measurements for real-time karst patterns’ detection.
In some cases, though we cannot detect karsts based on the BHA dynamic data, we can still detect them based on the analysis of the mud losses profile. Intervals of vugs are characterized by a moderate mud-losses profile, without significant changes, while in larger caves, we can observe a step change in the delta-flow profile. Thus, the analysis of mud-flow data can complement drillstring measurements. Two examples of the discussed indicators are given below. They are based on the field data from the Loppa High region of the Barents Sea.
An example below demonstrates drilling through large vug facies, dm-scale, conductive, irregular features, formed due to post-depositional carbonate dissolution, see Figure 5. Light areas in the Formation Micro Imager (FMI) represent the resistive facies (the lowest track in the figure). As can be seen, the step increase in the shocks and vibrations can be directly linked to the rock properties, as the drilling regime does not change in this interval. A similar increase in the shocks and vibration levels in the karst intervals were found in other wells within the region of the study. It can be concluded that in some cases, a higher level of shocks and vibrations can be an indicator that the well path is approaching or crossing karsts.
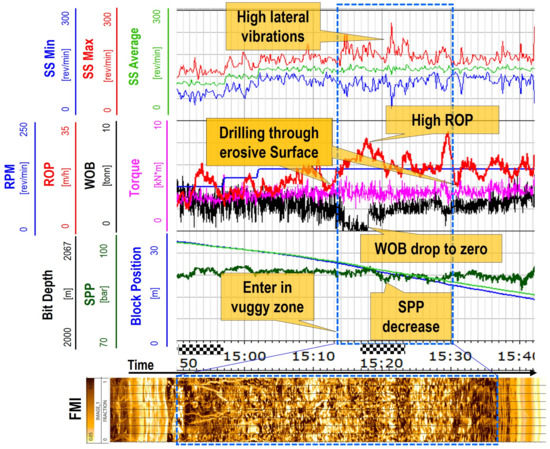
Figure 5.
Drilling mechanics data in the interval of vugs based on the field data from the Loppa High region—courtesy of Lundin Energy. See Table 1 for the description of the logged data.
The next example illustrates drilling through a cave, as shown in Figure 6. The exact depth of the cave is defined by the borehole image plotted in the bottom track. When the bit passes through the zone of the cave, drilling mud invades the space, filled with formation fluid, and due to over-pressure, replaces it. This results in mud losses in this particular interval reaching 2000 L/min (528.3 gals (US)/min). This is similar to the behavior of drilling mechanics, such as spiky changes of the ROP, S&V, WOB, and torque observed in the interval of the cave. It is important to note that mud losses can be seen in the delta-flow channel, the top track in Figure 6, before the drill bit crossed the cave and can therefore help detect caves earlier than the drillstring dynamic measurements. This demonstrates the importance of the joint analysis of mud flow and drilling mechanics’ profiles. Karst cavities filled by formation particles may not be detected by mud flow changes or mud losses, but will be detected by shocks and vibrations.
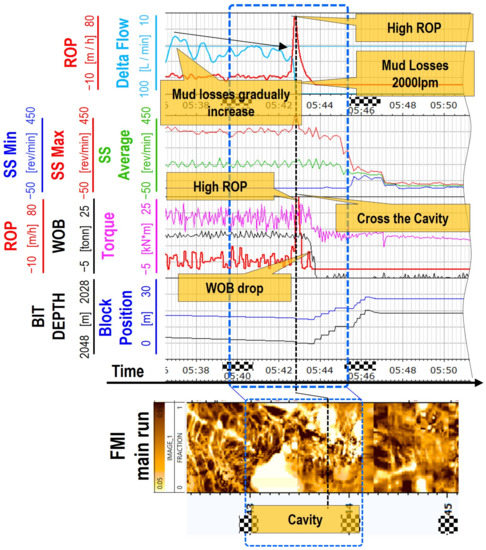
Figure 6.
Drilling mechanics data in the interval of cavity based on the field data from the Loppa High region—courtesy of Lundin Energy. See Table 1 for the description of the logged data.
A comprehensive study of the borehole images, drilling mechanics and mud-flow data was performed for the entire region of study for 23 wells. It was revealed that mud losses and abnormal drillstring behavior such as drilling breaks often precede caves. Moreover, drilling through such intervals was accompanied by small-to-moderate mud-loss events and high shock levels. An example of this analysis is shown in Figure 7, where some of the discovered events are plotted along the well trajectories. Intervals of breccias and caves marked in the figure were defined based on the borehole image analysis. As follows from Figure 7, the detection of intervals of breccias or vugs based on increased shock levels and/or mud loss events can be further studied as an indicator of karsts. It can thus be concluded that encountering karstification objects is not always unpredictable during drilling. Areas with karstification objects can be detected from the detailed analysis of real-time drilling measurements. Such an analysis cannot always be efficiently performed manually. Automatic pattern recognition algorithms of the discussed real-time drilling indicators might be developed in future work on this subject.
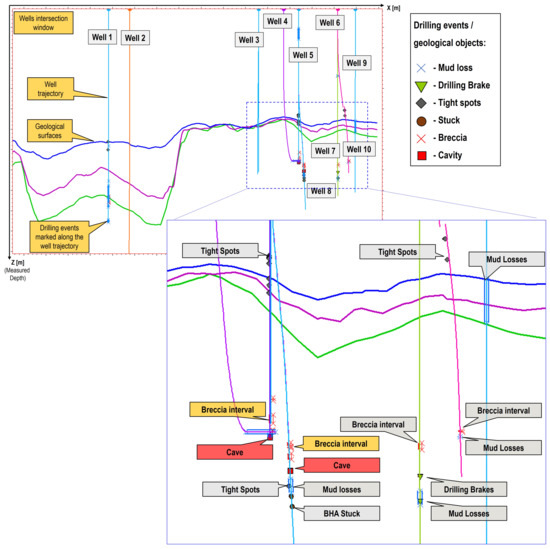
Figure 7.
Signs of karstification in the offset wells based on the analysis of borehole images and drilling data from the Loppa High region—courtesy of Lundin Energy [37].
The main advantage of the discussed method for early karst detection is the utilization of a full set of already available real-time drilling data without the necessity of adding any new sensors or additional components in BHA. On the other hand, the primary disadvantage of the method is its high dependence on a number of parameters such as drilling, mud fluid, rock properties and many other factors which should be taken into account when identifying karstification indicators. In some cases, this is a rather complicated, manual, not automated process. In addition, under certain conditions, such as those of a collapsed cave or low-permeable vugs, karstification zones will be difficult to define.
The limitation of this method is that it has been developed based on data from the field with sufficient measurements available in that study. It is difficult to collect a representative number of examples from other data sets. The percentage of wells drilled through karsts that contain the necessary well log data such as borehole images, real-time drilling measurements and accurate delta-flow measurements is rather small. Additionally, such data are typically confidential and can rarely be found in open access. This makes the examples discussed in this section limited to the Loppa High region. However, it is quite realistic that the methodology of drilling data-based karst detection, presented in [37] and illustrated by these examples, can be applied in other regions.
4.2. Resistivity Measurements
Looking ahead of the bit has been an object of research since the 1990s and is currently ongoing [45]. The unpredictable environment in front of the bit can pose significant risks for drilling. On the one hand, there is a risk of missing geological targets due to an unexpected dip in the geological structures. On the other hand, there is a risk of underestimating or encountering drilling hazards due to the lack of measurements ahead of the bit. Resistivity-based methods can successfully overcome some of these challenges. Generally, geosteering tools are rarely based on direct measurements in front of the bit—even the innovative ultra-deep geosteering resistivity tools measure behind the bit by looking laterally around the wellbore [46]. However, in some applications, resistivity propagation tools can utilize the drill bit as an electrode to focus an electromagnetic radiation patterns in front of the bit. Below, we discuss both types of tools and examine the application of resistivity measurements for karst detection.
4.2.1. Ultra-Deep Resistivity Measurements
Rock property characterization by measuring its electrical resistivity is common in wireline and LWD services. On 5 September 1927, a crew working for Schlumberger recorded the first resistivity log [47]. From that moment, the study of rock resistivity found wide application in the oil and gas industry. Resistivity measurements are taken as follows. The coil-type transmitter emits an electromagnetic field at certain frequencies. Generally, for LWD tools, this is 2 MHz and 400 kHz [48]. Receiver coils are placed in the electromagnetic field and voltage is induced to each of the receivers as the transmitter fires. The tool configuration from [47] is schematically shown in Figure 8. As it is very challenging to directly measure the speed of wave propagation, instead, receivers sample the amplitude and phase shift of the electromagnetic waves emitted by the transmitter at certain frequencies. Once the phase shift and amplitude are registered, two rock properties can be estimated—namely attenuation and phase shift resistivities. To convert raw attenuation and phase shift measurements, the relative dielectric constant is approximated to a constant function of resistivity, obtained from empirical testing of hundreds of core samples [48].
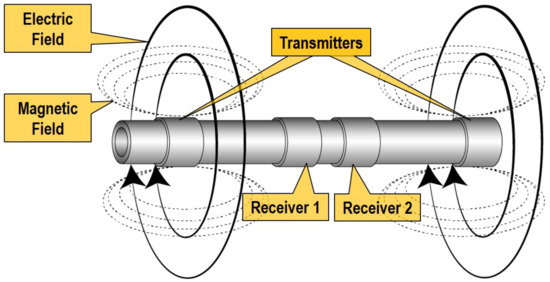
Figure 8.
Schematic diagram of receivers’ and transmitters’ placement in the resistivity tool. Based on the invention described in [47].
For deep boundary detection, conventional LWD-resistivity tools have been significantly modified by increasing transmitter–receiver spacing and by introducing tilted sources of electromagnetic waves. These improvements enable remote boundaries’ detection, including the identification of their spatial positions around the tool.
In practice, remote boundary detection with ultra-deep resistivity tools is challenging. As already indicated, LWD-resistivity tools cannot provide direct measurements. Instead, the inverse problem needs to be solved. The relation between resistivity measurements recorded by the tool and the distance to the boundary has strong non-linearity [49]; therefore, to define the distance to the boundary, the formation model needs to be updated to describe the resistivity measurements obtained by the tool and relate them to the expected geology [50]. This approach is called front modeling and consists of modeling, comparing and updating the formation model. Thus, the described front-modeling approach cannot solve the problem of karst detection ahead of the bit as the expected karst structure should be initially included in the model.
Recent case studies demonstrated that ultra-deep resistivity tools can detect geological structures at significant distances ranging up to 70 m away from the tool [51]. However, such a depth of investigation (DOI) is only achievable under favorable conditions. The depth of investigation (DOI) is used to describe the depth below which geophysical data cannot be used for the interpretation of the physical properties of the earth [52].
The current induced in the formation by the transmitters propagates through the least resistive path. In the case of a low-resistivity medium, the current remains in the region closest to the wellbore, which leads to a shallow depth of investigation. For a high-resistivity medium, the current spreads over larger distances. This effect results in the reduced vertical resolution and better depth of investigation, as the current spreads deeper into the formation. Thus, the depth of investigation for resistivity methods is not a constant parameter and to a large extent depends on the resistivity of the formation and conductivity of the mud.
There are several advantages with the discussed ultra-deep resistivity approach for karst detection: a significant depth of investigation under favorable conditions; the possibility of detecting karsts with high contrast interfaces; and a controllable electromagnetic radiation pattern. In spite of these advantages, there are drawbacks to this method when applied to early karst prediction as this approach is based on look-around measurements and front-modeling algorithms. Thus, it is challenging to predict the presence of certain geological features in front of the bit without any direct measurements ahead of the bit. The significant dependence of the depth of investigation (DOI) on the formations and the electrical properties of the drilling mud reveals the limitations of the method, as the distance of the detection might be considerably reduced.
We can conclude that ultra-deep look-around resistivity measurements should not be neglected for the purpose of karst detection. Due to the significant volume of rock investigated around the tool, there is a probability that some karsts are detected with sufficient electric contrast. Their presence might also be an indicator of possible karstification in the drilling interval and can be used in transferring drilling experience from offset wells as stated in Section 3.1.
4.2.2. Resistivity Measurements Ahead of the Bit
There have been attempts in the industry to measure formation properties in front of the bit. To implement this idea, the drill bit was utilized as an electrode to propagate electric current ahead of the bit. The first near-bit resistivity tool was developed by Brian Clark in 1994 [53]. The tool configuration from [53] is schematically shown in Figure 9.
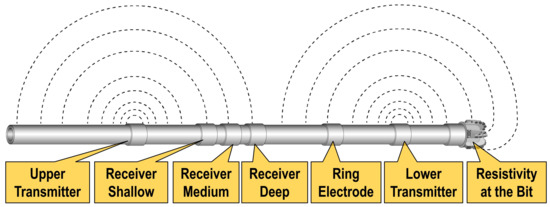
Figure 9.
Resistivity at the bit tool schematic (based on [53]).
As can be seen in the figure, the drill bit cannot be completely isolated from the BHA as there is a contact with the bearing section of the rotary steerable system or with the mud motor [54] depending on the configuration of the BHA. Therefore, with the increased length of the electrode, it becomes challenging to distinguish responses from multiple chaotically distributed points of contact with borehole walls.
However, with today’s sophisticated hardware and the improvements made in data-processing, resistivity at the bit is actively used for high-contrast boundary detection close to the bit in the decimeter range [55]. Often, resistivity at the bit measurements provides core sample point selection or a stop-drilling warning when the well approaches a shale layer [56]. Despite this, the limited depth of investigation and non-azimuthal quantitative measurements make it impossible to apply the resistivity at the bit for karst detection. Excessively shallow measurements in front of the bit leave no room for steering the well path away from a karst in the case of successful detection.
4.2.3. Example of Cave Boundary Detection Based on Resistivity Measurements
This section considers an example of resistivity measurements in caves to demonstrate the limitations of the resistivity approach. As discussed earlier, the depth of investigation for resistivity measurements depends on the resistivity properties of the formation and mud properties. In the case of remote boundary detection, the depth of investigation will also depend on the resistivity contrast between interfaces. Thus, if the cavity is filled with fluid that is equal to the resistivity of the surrounding rocks, then resistivity-based detection might not be effective due to the low-contrast interface.
An example of the resistivity response in an interval of caves is shown in Figure 10. The displayed well logs belong to one of the recent discoveries made in the Loppa High region (Norway, Barents Sea).
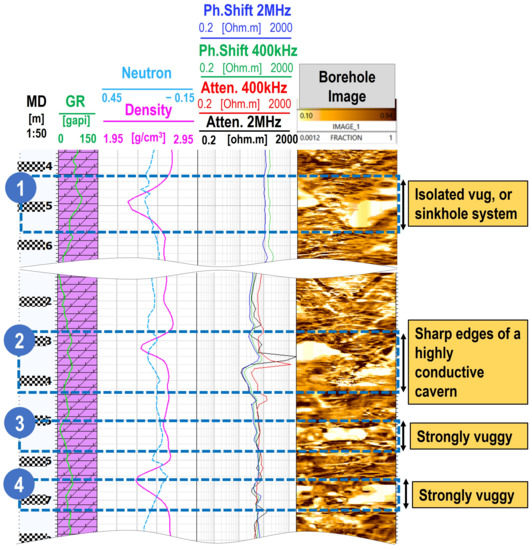
Figure 10.
Example of resistivity measurements in vug and cave intervals. Courtesy of Lundin Energy.
To demonstrate resistivity responses to karstification objects, in the given example, we localize cave depths based on borehole image data. Image tools are very accurate in terms of the detection of many geological features crossed by the well path. Borehole imaging can provide the exact boundaries of vugs, breccias, caves and other karst forms. However, this method cannot be used for early karst detection due to very shallow look-around measurements and significant bit-sensor offset. A common practice is to transform the phase shift from degrees to resistivity since dielectric permittivity is considered to be related to resistivity. Similarly, attenuation is converted from dB/m to Ohm.m, which is more convenient for the analysis of resistivity units.
In this example, logs were recorded by the conventional array resistivity compensated (ARC) tool. As can be seen from Figure 10, in zones 1, 3 and 4, resistivity measurements remain constant and it is challenging to identify whether the well is crossing the caves. These intervals demonstrate the resistivity response in the case of the low-contrast environment when the dielectric properties of the rocks surrounding the cavities and dielectric properties of the fluid saturating the cavities are equal. Additionally, it can be noted that, regardless of the depths of investigation, the deepest resistivity measurements (400 kHz attenuation resistivity) have the same readings as those of shallow measurements. This might be evidence that the resistivity contrast plays a crucial role in cavity detection regardless of the transmitter frequencies.
Unlike previous intervals, in Zone 2 of Figure 10, cave boundaries can be seen by the peak resistivity values in deep and shallow resistivity measurements. This demonstrates the main limitation of the resistivity-based approach—its high dependence on the formation properties around the cavities. This, in turn, might have a negative effect on the overall reliability of advanced cavity detection based on resistivity measurements as some of the caves cannot be detected.
In conclusion, we can say that resistivity methods of karst detection have their advantages, such as minor sensitivity to downhole noise, predictable pattern of electromagnetic radiation around the tool and advanced methods of data interpretation. However, this method has a number of drawbacks that are essential for karst detection, such as high dependence on the resistivity properties of drilling mud, surrounding rocks, and inter-karst space-filling material properties.
4.3. Acoustics Measurements
This section considers the principle of conventional sonic measurements around the tool and also reviews sonic-based measurement applications for remote object detection.
The propagation of acoustic waves in porous media is of considerable interest for different domains in the oil and gas industry. Studies of acoustic wave propagation in porous media were initiated by Biot in 1956 [57]. The first sonic tool was developed in 1958. This was a simple device that consisted of a monopole transmitter that generated a sound wave and two receivers to detect the wave traveling through the formation. The method of the propagation of elastic waves described in [57] is shown in Figure 11.
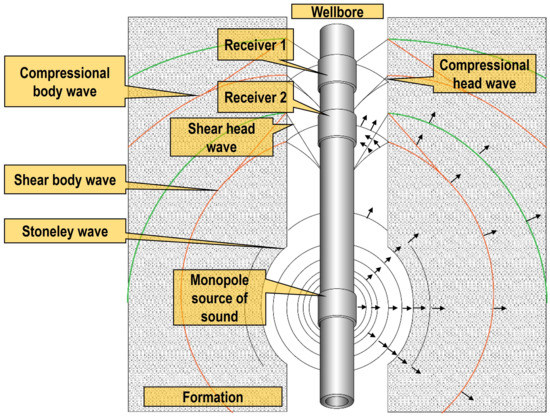
Figure 11.
Waves traveling in the case of a monopole source of sound.
As can be seen, several types of waves can be created in the mud, borehole and formation. Since the pressure pulses reach the borehole wall, pressure waves generate compressional and shear wavefronts (body waves) that further propagate in the formation. The wave propagation in the formation causes pressure disturbances in the drilling fluid. The advancing compressional and shear body-waves create head waves. To generate shear and fluid mode (Stonley) head waves, body waves must propagate faster than the head waves in the fluid. Depending on the wave propagation speed, fast formations (shear velocity faster than mud velocity) and slow formations (shear velocity slower than mud velocity) can be defined.
The arrival time difference, detected by two receivers divided by the known distance, gives an interval transit time or the slowness of the formation around the tool.
Changes in wave slowness and frequency can be used to estimate different formation properties. For example, Stonley wave slowness and frequency change can be used in the estimation of formation permeability [58]. Compressional and shear data are crucial for determining wellbore strength, in situ stress and rock mechanical properties [59].
The depth of investigation of the described tools depends on the formation slowness, the distance between the transmitter and receiver, and the presence or absence of an altered zone in the formation. In general, the depth of investigation for the majority of sonic tools stays within an invaded zone of several centimeters (∼3–6 cm) away from the borehole.
4.3.1. Borehole Acoustic Reflection Survey (BARS)
Returning to the problem of remote object detection, significant changes in the hardware of the discussed sonic tools were made, such as the introduction of array-receivers and new types of transmitters, and acoustic logging progressed towards full sonic waveform analysis [60]. The difference in frequencies between BARS (f 10 kHz) and conventional seismic (f 100 Hz) as well as different signal detection techniques enable the higher resolution of the borehole reflection imaging of the near-wellbore space.
In contrast to seismic studies, where the registration and processing of a signal reflected from geological boundaries are studied, in the sonic seismic survey, there are a number of challenges. First, refracted and reflected waves are weaker compared with the direct arrival waves; thus, wavefield separation becomes a crucial stage in data processing. Second, instead of seismic geophones, more sensitive receivers are used, which are capable of recording a wider range of waves. This requires additional data filtering for BARS signal processing.
The BARS method is based on separating the waves propagated along the wellbore from the waves deeply spread and reflected back from the boundaries of distant geological objects. Initially, standard sonic tools were utilized for deeply reflected signal detection. Such tools were equipped with an array of receivers and a monopole source of sound as described earlier. To map the positions of reflections around the tool, azimuthal measurements were introduced which became an important step in expanding the range of applications of sonic tools. The hardware in the modern sonic tools for reflected signal detection described in [60] typically consists of three monopole transmitters, two dipoles and an array of receivers—as illustrated in Figure 12.
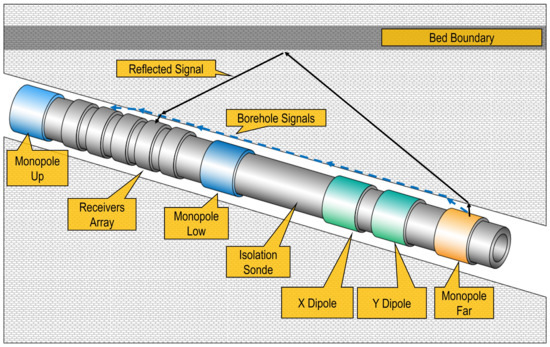
Figure 12.
Tool schematic for the borehole acoustic-reflected survey and bed boundary detection.
Directional acoustic measurements are achieved by cross-directional dipole emitters. The introduction of azimuth measurements facilitates the detection of geological object positions with respect to the high side of the tool. This in turn enables the use of acoustic tools for geosteering, which has several advantages compared to the resistivity-based geosteering methods discussed previously. In the case of a low-contrast resistivity environment, sonic-based geosteering has proved to be a good alternative method for well placement and is suitable for detecting boundaries at a distance of up to 10–20 m away from the borehole [61,62]. Unlike the resistivity methods, the depth of investigation of acoustic measurements is significantly less affected by properties of the surrounding medium such as rock electrical conductivity and others. The main advantage of BARS over resistivity-based methods is the detection of karsts and cavities regardless of the conductivity or other properties of the karst-filling fluid.
Based on the example from the Loppa High region, the discovered average sizes of the caves have dimensions of 0.5–2 m of a TST. Though they are relatively small for seismic methods’ objects, they might be detected by BARS as they fall into the resolution limits of the method (along the well resolution of 0.3 m).
Moreover, the BARS object detection distance of 10–15 m gives a sufficient volume of investigation which can significantly increase the possibility of karstification object detection, around the tool. Discovering such objects might be crucial information for further drilling decisions: the detection of a single karst form might be evidence that other karst forms may also exist within the same region and could be suddenly discovered during drilling. Overall, the discussed method can be considered as a reliable solution for karst detection around the wellbore.
However, despite a number of advantages, there are some limitations. First, drilling must be stopped to provide favorable conditions for BARS acoustic surveying. Second, this technology provides only the look-around and not the look-ahead type of measurements. The main problem of object detection in front of the bit remains unsolved since sonic tools are located at a considerable distance from the bit and the waves do not propagate ahead of the drill bit. Thus, it is still challenging to predict the presence of dangerous drilling objects while drilling.
4.4. Seismic-Based Measurements
To date, we considered acoustic methods of karst detection by tools developed for reflection detection around the well. In this section, we focus on acoustic measurements ahead of the bit.
To the best of the authors’ knowledge, there is currently no ready-to-use solution especially designed or adapted for karst detection in front of the bit. However, in recent decades, extensive work has been performed in this area. The principle of measurements ahead of the drill bit was significantly different from the look around measurements, described in the previous section. This section gives a brief review of prior work that is appropriate for karst detection (patented inventions, academic work and commercially available solutions). The inventions below were conditionally grouped based on the common receiver/detector placement and wavelengths used by the method.
4.4.1. Downhole Excitation of Seismic Waves
From our perspective, this section gives the most significant inventions in the area of downhole excitation of seismic waves with a brief discussion of the basic principles of sound wave generation/detection.
Some of the early inventions focused on the challenging problem of downhole sound source development with certain specifications. The source should be small enough to be lowered downhole and simultaneously have sufficient power to generate high energy seismic waves which can be registered by surface detectors. The reason for the downhole instead of surface positioning of the sound source is because better resolution is achieved vertically. An additional benefit of the downhole excitation of seismic waves is that almost all wave modes can be captured. A number of inventions were dedicated to the downhole excitation of seismic waves in different ways.
One example of the downhole seismic-wave excitation of sound waves is described in the invention by Brett in 1994 [63]. It was suggested that a mass is mounted on a rotating part inside the collar. When this apparatus is lowered downhole, the mass can be rotated to generate the signal, which can propagate around and ahead of the drill bit. Due to centrifugal force, the rotating mass is designed to be in contact with the wellbore—which increases the effectiveness of signal propagation. The reflected signal can then be recorded by geophones placed on the surface.
Another principle of mass excitation was proposed by Paulsson in 1986 [64]. Instead of the rotation of the mass, the excitation of seismic waves is activated by triggering the mechanism that redistributes the pressure inside the air chambers in the apparatus, leading to the striking mass moving downwards. Thus, seismic energy is produced with less destructive stress on the wellbore walls compared to the previous example. A similar approach for generating seismic waves by striking mass was proposed by Pascal Dedole in 1984 [65], in which a device was used for striking mass to hit elements inside the body that had a retractable platform to push the apparatus against the wellbore wall. Striking mass in this invention is excited by an electric motor. Due to the firm coupling with the formation with this apparatus, a powerful seismic pulse can be generated.
A downhole periodic seismic source was proposed by H. Hardy in 1983 [66] and described in the patent [67]. The goal was to develop a downhole, nondestructive and high-resolution seismic tool suitable for studying fluid zones in hydrothermal magma systems encountered in deep holes. A downhole hydraulic seismic generator system was used for transmitting the energy of vibrations into the earth surrounding a borehole. An electric servovalve regulated a high-pressure hydraulic fluid flow traveling between the upper and lower chambers. The valve was controlled and powered from the surface with the standard logging cable, which is an advantage with this approach. This prototype was successfully tested in a shallow zone and showed that this type of oscillator can generate downhole low-frequency seismic waves (10–100 Hz).
To the extent of our knowledge, the devices described in [63,64,65,66,67] were never used for commercial work.
A compressible fluid-driven downhole seismic source was suggested in another invention proposed by H. Hardy in 1989 [68]. The source device was capable of periodically generating horizontally propagated shear waves. The fluid-generated torsional oscillations of the mass inside the device acts on the housing—thereby a seismic source produces waves. The oscillator was driven by a fluid rotary valve mounted in a sleeve which fits inside or in-between an existing bottom hole assembly.
An important result was obtained from the downhole seismic tests by B. Paulsson in 1988 [69]. The casing–cement bond strength was measured after the test of different types of seismic sources. The most significant damage (decrease in cement bond strength of up to 30%) was recorded for the airguns and the least important damage in the cement strength was obtained for the downhole hydraulic vibrators. An important conclusion was made regarding the use of impulsive sources. Very strong tube waves are generated by impulsive sources, which became a new source of body waves with different acoustic impedances at different parts of the well. These body waves hide any arrivals after the direct P-wave arrival. It was shown that the hydraulic vibrator source is most efficient when it generates fewer tube waves.
The experimental comparison of airguns and explosives was performed by S.T. Chen et al. in 1989 [70]. It was confirmed that airguns produce stronger tube waves compared to explosive sources and explosive charges can produce enough downhole energy without significant damage to the borehole.
A comparison of borehole seismic sources under consistent conditions was performed at the Texaco geophysical test facility in 1991 [71]. The goal was to evaluate the relative performance of a wide variety of downhole seismic sources such as small explosive sources, air- and water-guns, hydraulic and pneumatic borehole vibrators. The sources that have been tested operate with various principles and in the past it was difficult to examine their advantages and disadvantages as they were deployed in different fields and their performance differed. The test facility allowed geological and regional differences to be eliminated. The survey depth levels, setup of receivers and test well were the same for all of the sources tested. One of the conclusions that was made is that all of the sources produced identifiable P-waves. S-waves are challenging to detect as reflections are obscured by numerous arrivals of the Mach waves generated by well-tube waves.
Despite the variety of methods of mass excitation, the common principle for this group of inventions is downhole seismic waves generation by the movement of a mass. The potential disadvantage of the methods described in this section is connected to the difficulties of sound radiation pattern control, and therefore focusing the area of investigation ahead of the drill bit. Moreover, a serious impact on the wellbore walls by intensive mass movements can be dangerous since it can lead to wellbore damage. When the wellbore is damaged, pieces of the formation can fall around the drillstring, leading to the packing off of the annulus and/or the jamming of the drillstring (hole bridging).
4.4.2. Directional Sound Waves Generation
This section is devoted to the inventions aimed at propagating directional sound waves in front of the bit with a controllable frequencies range. These inventions use a different principle of sound wave excitation in their detection of reflections Special attention in this section is given to acoustic signal focusing on the front of the bit.
In the invention patented by John B. Farr and Ronald W. Ward in 1973 [72], it was suggested that phase delay during drilling is constantly measured from a mono-frequency source of seismic waves installed next to the drill bit. As the frequency of the source is pre-defined, it is possible to estimate the travel time and the speed of sound between the source and receiver. The reflected signal, in this case, might be registered close to the bit, which can help to detect geological objects ahead of the bit.
A similar apparatus is described in the invention of Alf Klavness in 1975 [73]. A seismic pulse generator was suggested to be placed close to the drill bit. The obtained seismic data may be used to determine drilling conditions in advance. In the invention later proposed by John Beresford in 1995 [74], sound waves are generated by the excitation of the drill bit and detected by an acoustic sensor located inside the bit. To perform an acoustic survey when drilling is stopped, the drill bit with the excitation device is mechanically separated from the rest of the BHA and the bit is pushed against the bottom of the wellbore to ensure that there is sufficient contact between the transmitter and the rock.
The invention proposed by James Legett in 1995 [75] was based on an apparatus and methods for obtaining acoustic measurements by many segmented transmitters and receivers which allow the directional focus of acoustic energy with respect to the axis of borehole. The arrangement of transmitters allows acoustic measurements to be made ahead of the drill bit and provides information concerning formations that have not been drilled by the bit.
A comparable apparatus with some modifications was described in the invention conceived by Holger Mathiszik and Joachim Oppelt in 2003 [76]. The invented apparatus has an array of directional sources of sound waves that could emit acoustic signals in the selected direction and with the defined frequencies. The controllable frequency range enabled the selection of useful spectra of acoustic wave frequencies. This is different from the spectrum of acoustic waves generated by the drill bit. The signal reflected from geological boundaries is then detected by geophones and hydrophones mounted on the apparatus. In some inventions, it is suggested that tilted sound transmitters are used to ensure that acoustic waves will not interfere with the components of the BHA. For example, the patent submitted by Rasheed Wajid in 2011 [77] described an apparatus that can measure the geophysical and petrophysical properties of the rocks based on transmitters and receivers that are inclined with respect to the tool axis. This enables the angular and axial focusing of the signal to study rock properties ahead of the bit.
To the authors’ knowledge, the devices described in [72,73,74,75,76,77] have never been used in commercial work. Due to various difficulties both from the hardware manufacturing and from the subsequent signal processing points of view, these inventions remained theoretical developments. However, they are important since they demonstrate possible directions of the technologies developed for the early detection of reflective interfaces in front of the bit.
4.5. Seismic While Drilling
This section discusses a different means of tackling the same challenge of how to propagate and detect reflected signals ahead of the bit. There have been many attempts to propagate acoustic signals at a considerable distance in front of the bit to detect reflections from remote interfaces. Approaches that were different from those discussed above were presented in the early 1930s [78]. It was suggested that the energy generated by the bit while drilling was used as a source of seismic waves. As roller-cone drill bits became widespread, researchers demonstrated their interest in this area. In 1985, the algorithm for instantaneous acoustic logging in a borehole was patented [79]. The proposed seismic while drilling (SWD) signal acquisition principle described in [79] is shown in Figure 13.
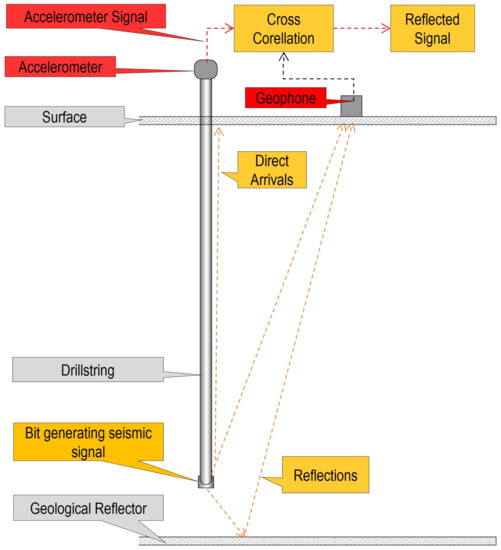
Figure 13.
Schematic view of seismic while drilling signal acquisition—based on [79].
In the proposed signal acquisition principle, the drilling bit is used to generate the acoustic impulse reflected from a geological interface signal and then propagated back to the surface which can be detected by a geophone. To estimate the travel time of the signal that passes through the formation, the cross-correlation technique is used. Cross-correlation between the signal that propagates through the drillstring and the reflected signal passing through the formation is used to estimate the time shift and the speed of sound in the formation. To detect the signal that propagates through the drillstring, accelerometers are mounted on top of the drillstring, as shown in Figure 13.
However, in reality, this process is more challenging since the speed of sound propagation in metal is significantly dependent on the BHA and drillstring component lengths, diameters, drill pipe wall thickness, etc. Thus, the inaccuracy of the speed of sound propagation measurements in metal introduced inaccuracy in the estimation of the formation speed of sound. The analysis of seismic waves generated by the roller-cone bit was quite popular during this period.
Many attempts have been made to increase the accuracy of direct arrivals’ measurements. Farr and Ward in 1973 [72] implemented a top drillstring sensor. Later, Yves Ollivier in 1993 [80] invented a device that was installed and rotated together with the drillstring. These inventions helped register shocks experienced by the BHA during drilling with almost no attenuation.
In addition to the improvements in the signal-processing techniques, the described inventions used surface-located geophones. In this regard, the source of seismic energy (drill bit) should be preferably a low-frequency source with a long wavelength. This limits the resolution of the SWD method which can be roughly estimated at approximately 15–20 m. This has better resolution compared with the conventional seismic study. Additionally, as stated earlier, it is challenging to obtain an accurate reference signal solely based on the measurements of drillstring vibrations. In 1992 [81], to address this issue, the Atlantic Richfield Company in 1992 [81] proposed using a set of sensors, similarly positioned to sonic tools at a small distance from the bit to detect seismic waves emitted from the bit while drilling. This was intended to improve both the resolution and the depth of investigation in front of the bit along with the improvement of weak reflection detection from distant objects.
It is important to mention that these inventions were not theoretical. In the 1990s, a number of experiments were performed which confirmed the viability of the seismic while drilling approach. For instance, in 1992, an experiment confirmed the possibility of signal extraction, generated by the source of sound with unknown properties (drill bit). To detect this signal, a total of 12 km of 40 channel geophones were placed on the ground at one of the onshore rigs in Germany. Data were recorded during 5 h of drilling at a depth of up to 3735 m. The technique described in [82] showed that it can be used to detect reflectors ahead of the bit based on SWD measurements. Extensive work was performed by James Rector and Bob Hardaj in the study of radiation patterns and seismic waves generated by SWD [83].
In 1991, Western-Atlas published interesting results obtained from wells drilled in North America [84]. The experience of operating companies was that the proposed type Tomex® SWD survey (Baker Atlas) would not lead to consistently satisfactory results. In general, the results were inconsistent even with the use of roller-cone bits under favorable conditions (hard/medium formations, vertical well trajectory, long teeth of roller-cone bits).
Later, the French Institute of Petroleum (IFP) introduced the TRAFOR® system using electrical wired pipe technology for the fast data transmission of downhole data. This system was used for drill-bit seismic profiling [85].
In 1996, following these works, Miranda et al. [86] developed SEISBIT®. This system uses a selective data processing technique depending on current drilling conditions.
Starting from this time, the DBSeis® system was presented by Schlumberger. The SWD system performs the recognition of drilling through the estimation of the spectral difference between drilling and non-drilling events. The data from 12 to 36 geophones were digitally processed (beam-forming) to separate the noise from the bit signal [87].
After a series of successful and unsuccessful experiments, the 90th attempt in this direction was continued. An important experiment devoted to studying the drill bit pattern was performed by Chabot in 2002 [88]. The aim was to obtain seismic maps of the surrounding formations. On the one hand, the experiment demonstrated the advantages of a bit-seismic approach for remote feature detection. On the other hand, it was shown that there is a significant limitation in the SWD method as the BHA vibrations during drilling have high amplitude which complicates the process of weak reflection detection from geological objects.
In 2002, Comelli et al. [89] proposed a methodology to increase the signal-to noise ratio of the SWD signal. The proposed idea was to utilize mud-logger surface measurements to describe the downhole process. This way, the type of rock drilled and the drilling parameters can be taken into account and related to the signal from the bit.
In 2008, Flavio Poletto [90] presented the results of an experiment where test drilling was performed to study the pattern of waves generated by the drill bit. The experiment confirmed that the drill bit can generate both compressional and shear waves. In addition, it demonstrated that the signal generated by the drill bit can propagate to significant distances in front of the bit and reflected signals can be detected by receivers.
To prevent falling into hazardous situations during drilling, a principle similar to the seismic while drilling approach was proposed by Espen Birger Raknes et al. [91] in 2017. The proposed method uses the seismic diffraction response from the borehole to image the well-path using surface seismic detectors. It was claimed that no extra tools are needed and the well can be imaged while drilling. The main application of this approach was in relief well drilling where this method can reduce the accuracy for intersecting the blowing well. The numerical simulations of the approach have shown good results and seismic while drilling images have been used to identify the exact position of the drill bit. The approach was tested on a synthetic well on data from the Kvalhovden area in east Spitsbergen, Norway.
In summary, despite the number of SWD advantages over the conventional seismic approach, the bit-seismic study has not become popular due to the following reasons. First, there is no methodology for interpreting seismic signals from the drill bit in deviated and horizontal wells. The primary cause explaining existing challenges in interpretation is related to the unwanted randomly distributed additional sources of seismic wave generation at numerous points of drillstring contact with the wellbore walls. The necessity to deal with these additional seismic sources becomes especially important for wells with high deviation, extended horizontal sections and intervals with high dogleg severity.
Second, roller-cone bits can produce high-energy seismic signals. Today, the vast majority of wells are drilled with polycrystalline diamond compact (PDC) bits which are quiet in comparison with roller-cone bits and cannot produce high-energy signals. Such low-energy signals are more difficult to detect, which limits the applicability of the SWD method.
Third, the SWD method demonstrated reliable results only during rotary drilling, as in this mode, the bit can produce a more powerful signal than in the sliding mode of drilling. Today’s most used mud motors and rotary steerable systems do not contribute to producing high-energy signals by the drill bit, which also constrains the further development of the discussed methodology.
In the next section, we consider a method of employing downhole high-resolution seismic surveying without wireline logging. This can increase the accuracy of geological objects’ detection as the high-resolution seismic data can be acquired by the tool installed in the drilling BHA.
4.5.1. VSP While Drilling
Due to a number of difficulties associated with the discussed SWD methods, further development of look-ahead acoustic methods was based on a different principle.
Traditionally, in vertical seismic profiling (VSP), receivers are installed on the wireline BHA and seismic sources are placed on the surface of the ground. To perform a wireline seismic survey (checkshot), the tool is lowered to a certain depth, and once the surface source of seismic waves is fired, a downhole tool records the travel time required for seismic waves to reach receivers. Knowing the depth of receivers, the interval velocity of the formation can be estimated. Thereafter, the time-depth conversion depths of geological reflectors can be estimated, including those located in front of the bit. A significant drawback of this method is the time cost required to do a seismic survey. Drilling has to be stopped and the drillstring must be pulled out of the hole to run wireline seismic logging.
In 1999, Halliburton patented an invention aiming to overcome the problem of inefficient rig-time usage [92]. The invention was proposed to detect seismic waves by the downhole apparatus located in the drilling BHA. This apparatus can also detect reflections from the boundaries ahead of the bit and can thus enable significant rig-time savings. This technology was further developed, and similarly to Halliburton’s invention, the principle was implemented in early prototypes created by Schlumberger in 2001 [93]. This led to the development of the seismic drilling tool which became an alternative to the conventional VSP by providing the same quality of data much faster. Interested readers are referred to references [94,95,96] for details about seismic waveform processing techniques used in VSP while drilling. The seismic-guided drilling concept described in [93] is shown in Figure 14.
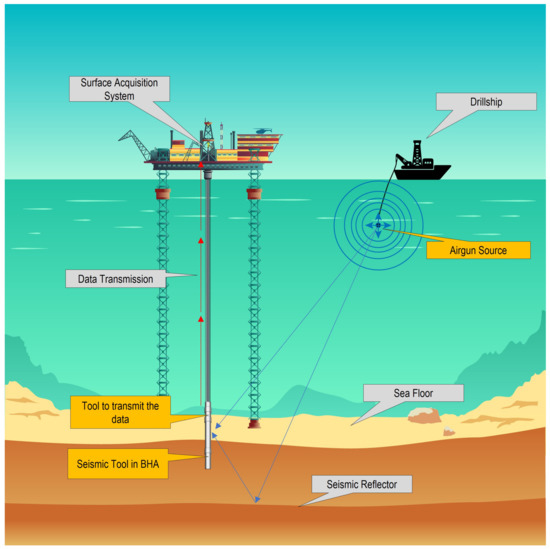
Figure 14.
The seismic-guided drilling technology—based on the concept described in [93].
In this concept, a set of sensitive seismic receivers was mounted on the downhole seismic tool. The downhole tool processes the incident energy and utilizes a special algorithm that is based on a series of checkshots that compares signals from repeated firings to make sure that the arrival time and shape of waveforms are similar. This logic helps one filter out noise and perform an initial quality check of the checkshots. As the tool gathers a pre-defined number of similar waveforms, it starts to stack them together. When the mud circulation is on again after the drill–pipe connection, data are transmitted to the surface through the mud pulse telemetry. The same process is repeated at each survey station. Field tests of this system were successfully performed in the Gulf of Mexico [97].
An example of the SGD technique for carbonate cave detection was demonstrated by the successful detection of Ordovician caves buried at a 6000–8000 m depth in the Tarim Oilfield in China [98]. The challenge was to improve the accuracy of carbonate cave detection. Caves, in this example, have different genesis mechanisms leading to the development of “tremendous storage spaces” [99]. The seismic responses to such large paleo karst caves are evident as “strong amplitude anomalies in legacy seismic data and are characterized as a “string of beads” with different sizes and shapes [100]. Almost 600 million bbl of oil have been extracted from these huge cave systems since the beginning of production (open caves trapping of the oil) [101]. These huge cave systems are incomparably larger than the caves discovered offshore Norway and Tarim caves remain open as drillers have recorded numerous “bit drops” sometimes exceeding 10 m [99].
The SGD is a powerful technique for the detection of large karsts. However, taking into account the wavelengths generated by surface airguns, the resolution of this method is not sufficient for detecting small karstforms ranging from half a meter to several meters. As discussed earlier, the detection of small forms of karstification is equally as important as the detection of large karst forms because mall karsts might be equally dangerous to drill through.
5. Discussion
The discussed pre-drill group of methods for karst detection focuses on the identification of potentially dangerous intervals before drilling begins. This analysis is based on already available data.
An analysis of geological information can provide an overall picture of the regional karst forms’ distribution, their possible depths of occurrence and can help in the estimation of the most probable geometrical sizes of regional karst forms. The main limitation of this method depends on the coverage and quality of input data. For example, when there is a lack of geophysical or seismic data, studying only surface signs of karstification cannot be so effective in the estimation or prediction of subsurface karst properties.
Offset wells analysis is an efficient method of karst intervals’ prediction on a planned well trajectory. Different algorithms can be used to transfer the experience of drilling gained from the offset wells. This method is effective if there is evidence of karstification which was observed/logged/interpreted based on the offset wells’ analysis. Since many karstification objects can be undetected in the offset wells due to a lack of geophysical studies or if previously drilled wells were not crossing any karsts, the projection of drilling risks related to karsts on the new well trajectory is not possible. Moreover, if the offset well is located at a significant distance from the planned well, the projection of karstification intervals may be inaccurate.
One of the most common methods studies have used for the detection of different geological objects and structures is the conventional seismic one. This method can provide the most complete picture of the main subsurface geological features including the general karst distribution, the depths of extended zones of karstification and the geometrical dimensions of major karsts. However, with the conventional seismic method, smaller karst forms that are dangerous for drilling cannot be detected. In addition, there is an inaccuracy/uncertainty in the estimation of the exact subsurface positions of objects based on the conventional seismic method. These uncertainties in the exact position of karsts detected by conventional seismic method leave the chance of crossing karsts during drilling.
The discussed karst detection while drilling group of methods focuses on the utilization of different types of measurements to investigate the region at or ahead of the drill bit.
Karst detection based on drilling mechanics and mud-flow measurements is based on the concept that encountering karstification objects is not always unpredictable during drilling and that zones at a high risk of karsts can be detected from real-time drilling measurements. The combination of drilling dynamics and mud-flow measurements can reveal additional signs of karstification, such as filled caves or small vugs that might be undetectable by these methods applied alone. This combination of drilling dynamics and flow-based sets of measurements can be implemented for karst detection based on real-time drilling data. Patterns of real-time measurements corresponding to karst intervals can be utilized for karst detection either by engineers, or after further development, by automatic data-processing algorithms. The main limitation of this method is linked to the fact that a full set of necessary well-log data (e.g., downhole drilling mechanics measurements, or delta-flow data) is often unavailable for analysis.
Even in well-studied fields, the percentage of wells encountering caves and at the same time containing a full set of necessary well-logged data (e.g., images or delta-flow data) is rather small. Therefore, this method was developed and validated only on available field data from the Barents Sea. Future work on this subject should concentrate on the additional analysis of well data from other fields with different geology. This will allow the collection of a complete picture of unique real-time indicators of karsts regardless of the geography of the research region.
Resistivity-based methods such as the ultra-deep and resistivity at the bit ones cannot efficiently detect karsts with low resistivity contrast. This makes the detection of low-contrast geological objects including karsts challenging. The depth of the investigation and accuracy of the methods utilizing resistivity-type measurements strongly depend on the electrical properties of the formation and drilling mud properties.
Geophysical methods utilizing acoustic surveying such as the borehole acoustic reflected survey (BARS) are promising in the detection of deep interface reflections regardless of the electrical properties of the formation. High vertical resolution and sufficient depth of investigation make this group of methods suitable for karst detection while drilling. Despite a number of advantages, these measurements are look-around and thus cannot be used for the investigation of the region at or ahead of the bit for the early detection of karst hazards.
Some of the methods that utilize seismic measurements are very promising, e.g., seismic-guided drilling methods. These can provide detailed seismic maps of the region ahead of the bit with higher resolution than the conventional seismic method. This significantly increases the probability of karst forms’ detection in front of the bit. The major limitation of these methods is linked to the relatively low wavelengths that are used in surveying. Low wavelengths are a limiting factor for the detection of smaller karsts that are dangerous for drilling, which are encountered, e.g., in the Barents Sea.
6. Conclusions
In this paper, we reviewed the methods and technologies that can be used for the prediction and early detection of karsts which are dangerous for drilling. All these methods were published in the last 40 years. The methods can be categorized into pre-drill and while-drilling karst detection methods. These are summarized, together with their advantages and limitations, in Table 2 and Table 3, respectively.
Table 2.
Pre-drill karst detection methods.
Table 3.
Methods of karst detection while drilling.
Overall, while being effective in some cases, the reviewed methods for the prediction and detection of karsts which are dangerous for drilling suffer from the following limitations:
- Small karsts which are dangerous for drilling are the most challenging objects to detect with pre-drill and while drilling karst detection methods;
- The study of geological drilling or offset wells data solely depends on the quality and coverage of input field data, and thus cannot guarantee an accurate prediction of karsts, leaving the risk of well control issues in carbonates unchanged;
- Any relevant resistivity, acoustics or seismic-based methods can hardly be used for avoiding drilling into karsts or even for the real-time detection of encountering karsts.
These limitations indicate a room for further research and development within methods and technologies for safer drilling in karstified carbonates.
Taking everything into account, we can conclude that at the moment, there is no technology or geophysical method that can consistently investigate the region in front of the bit and therefore be used for the early detection of smaller karsts which are dangerous for drilling based on direct measurements ahead of the bit. Only the combination of the pre-drill study of karstification signs and the identification of karsts based on real-time drilling data can significantly reduce the risk of sudden encounters of karsts.
Future work on this subject should concentrate on the development of an acoustic system that can utilize methods of sound wave generation and registration discussed in this study. Further research might also be undertaken to investigate the different signal processing techniques that might be applicable to the methods described in this paper.
Author Contributions
Concept and literature study, D.M.; formal analysis, D.M.; methodology, A.P. and S.S.; writing—original draft preparation, D.M. and A.P.; review and editing—S.S.; supervision, A.P. and S.S. All authors have read and agreed to the published version of the manuscript.
Funding
This research was funded by Lundin Energy.
Institutional Review Board Statement
Not applicable.
Informed Consent Statement
Not applicable.
Data Availability Statement
Data sharing not applicable.
Acknowledgments
This research is a part of the BRU21—NTNU Research and Innovation Program on Digital and Automation Solutions for the Oil and Gas Industry (www.ntnu.edu/bru21, accessed on 29 September 2021) and supported by Lundin Energy. In particular, we wish to thank Per Haugum and Bård Fjellså at Lundin Energy for their technical contributions in important stages of this research. Stewart Clark from NTNU is acknowledged for editing the final paper.
Conflicts of Interest
The authors declare that they have no known competing financial interests or personal relationships that could have appeared to influence the work reported in this paper.
Abbreviations
For readers unfamiliar with the technology used in the oil and gas industry, we refer them to a review of the definitions given in https://glossary.oilfield.slb.com/, accessed on 29 September 2021.
| BHA | Bottom Hole Assembly |
| BARS | Borehole Acoustic Reflected Survey |
| DOI | Depth of Investigation |
| FMI | Formation Micro Imager |
| LCM | Lost Circulation Material |
| LWD | Logging while Drilling |
| MPD | Managed Pressure Drilling |
| MWD | Measurements while Drilling |
| PDC bit | Polycrystalline Diamond Compact Bit |
| PMCD | Pressurized Mud Cap Drilling |
| ROP | Rate of Penetration |
| SGD | Seismic-Guided Drilling |
| SPP | Stand Pipe Pressure |
| S&V | Shocks and Vibrations |
| SWD | Seismic while Drilling |
| TST | True Stratigraphic Thickness |
| VSP | Vertical Seismic Profiling |
| WOB | Weight on Bit |
| SS | Stick and Slip |
References
- Conran, G. Technology Focus: Horizontal and Complex-Trajectory Wells. J. Pet. Technol. 2009, 61, 52. [Google Scholar] [CrossRef]
- Gawor, L.; Jonczy, I. Surface Karst Landforms of the Notranjska region (south-western Slovenia). Geotourism 2014, 37, 55–60. [Google Scholar] [CrossRef][Green Version]
- Mahry, A.; Suryadi, D.; Sufiadi, E.; Hadinata, D.; Wahyudi, Y. Well Control in Carbonate Zone—Total Loss and Kick in Gas Reservoir. In Proceedings of the Offshore Technology Conference, Houston, TX, USA, 2–5 May 2016. [Google Scholar] [CrossRef]
- Hamizan, A.A.; Hasbullah, U.P.; Upadhyay, A.; Buch, M.; Eren, S.; Zahari, M.Z.; Roslan, M.R.; Hajiyeva, M.; Rashid, E.R.; Ishak, S.N.; et al. Mud Cap Drilling (MCD) with Continuous Annular Injection—Offshore Malaysia. In Proceedings of the IADC/SPE Asia Pacific Drilling Technology Conference, Bangkok, Thailand, 25–27 August 2014. [Google Scholar] [CrossRef]
- Sallee, A.; Dick, H.; Sudhakar, V.; Morgan, A.; Payton, S.; Paddock, D. Implementation of PMCD to Explore Carbonate Reservoirs from SemiSubmersible Rigs in Malaysia results in Safe and Economical Drilling Operations. In Proceedings of the SPE/IADC International Drilling Conference and Exhibition, The Hague, The Netherlands, 5–7 March 2019. [Google Scholar] [CrossRef]
- Sallee, A.; Dick, H.; Sudhakar, V.; Morgan, A.; Payton, S.; Paddock, D. Managing Drilling Losses in the Permian Using Airborne Gravity Full Tensor Gradiometry. In Proceedings of the SPE/IADC International Drilling Conference and Exhibition, The Hague, The Netherlands, 5–7 March 2019. [Google Scholar] [CrossRef]
- Kumar, R.; Perumalla, S.; Verma, S.K. Geomechanical Evaluation of Mud Losses and Wellbore Instability in Mumbai High North Field—Implications to Infill Drilling and Reservoir Development. In Proceedings of the SPE Oil and Gas India Conference and Exhibition, Mumbai, India, 28–30 March 2012. [Google Scholar] [CrossRef]
- Giniatullin, R.R.; Kireev, V.V.; Krepostnov, D.D.; Chernokalov, K.A.; Zagrivniy, F.A.; Dobrokhleb, P.Y.; Voitenko, D.N.; Polyarush, A.M. Effective solution for wells drilling in conditions of catastrophic mud losses in fractured reservoirs of the Yurubcheno-Tokhomskoye field. Neft. Khozyaystvo Oil Ind. 2017, 2017, 40–43. [Google Scholar] [CrossRef]
- Murchison, W.J. Lost Circulation for the Man on the Rig; Murchison Drilling Schools: Houston, TX, USA, 2006. [Google Scholar]
- Ivan, C.; Bruton, J.; Bloys, B.; Texaco, C. How can we best manage lost circulation. In Proceedings of the AADE 2003 National Technology Conference “Practical Solutions for Drilling Challenges”, Houston, TX, USA, 1–3 April 2003. [Google Scholar]
- Bahar, A.; Kelkar, M. Journey From Well Logs/Cores to Integrated Geological and Petrophysical Properties Simulation: A Methodology and Application. SPE Reserv. Eval. Eng. 2000, 3, 444–456. [Google Scholar] [CrossRef]
- Heggland, R.; Nygaard, E.; Gallagher, J.W. Techniques and Experiences Using Exploration 3D Seismic Data to Map Drilling Hazards. In Proceedings of the Offshore Technology Conference, Houston, TX, USA, 6–9 May 1996. [Google Scholar] [CrossRef]
- Lewis, S.; Tambe, R.; Dumbre, M.; Ahuja, G.; Sharma, A. Evaluation of LCMs in Cement to Seal Wide Natural Fractures. In Proceedings of the SPE/IATMI Asia Pacific Oil & Gas Conference and Exhibition, Jakarta, Indonesia, 17–19 October 2017. [Google Scholar] [CrossRef]
- Savari, S.; Butcher, J.; Al-Hulail, M. Managing Lost Circulation in Highly Fractured, Vugular Formations: Engineered Usage of High Fluid Loss Squeeze and Reticulated Foam Lost Circulation Materials. In Proceedings of the IADC/SPE International Drilling Conference and Exhibition, Galveston, TX, USA, 3–5 March 2020. [Google Scholar] [CrossRef]
- Houng, N.H.; Zapata, J.F.G.; Fauzi, M.A.A. PMCD Technique Enables Coring and Wireline Logging Operations in Total Lost Circulation. In Proceedings of the IADC/SPE Drilling Conference and Exhibition, Fort Worth, TX, USA, 1–3 March 2016. [Google Scholar] [CrossRef]
- Kyi, K.K.; Han, M.; Lee, S.; Roberts, I.; Maeso, C. Maximising Logging While Drilling Value in Carbonate Wells Drilled in Pressurised Mud Cap Drilling Conditions: Challenges, Solutions, and Advances. In Proceedings of the SPE/IATMI Asia Pacific Oil & Gas Conference and Exhibition, Nusa Dua, Bali, Indonesia, 20–22 October 2015. [Google Scholar] [CrossRef]
- Houng, N.H.; Rubianto, I.; Abuelaish, A.R.; Abdullah, M.A. Successful PMCD Application Significantly Improved Drilling Efficiency on Carbonate Drilling. In Proceedings of the IADC/SPE Asia Pacific Drilling Technology Conference, Singapore, 22–24 August 2016. [Google Scholar] [CrossRef]
- Amanbayev, Y.; Karmanov, K. Successful Implementation of PMCD Technology in Kazakhstan. In Proceedings of the SPE Russian Petroleum Technology Conference, Moscow, Russia, 15–17 October 2018. [Google Scholar] [CrossRef]
- Laouafa, F.; Guo, J.; Quintard, M. Underground Rock Dissolution and Geomechanical Issues. In Proceedings of the 53rd U.S. Rock Mechanics/Geomechanics Symposium, New York, NY, USA, 23–26 June 2019. [Google Scholar]
- Nicod, J. A Little Contribution to the Karst Terminology: Special or Aberrant Cases of Poljes? Acta Carsol. 2003, 32, 29–39. [Google Scholar] [CrossRef]
- Palmer, A. Origin and morphology of limestone caves. Geol. Soc. Am. Bull. 1991, 103, 1–21. [Google Scholar] [CrossRef]
- Veress, M. Karst Types and Their Karstification. J. Earth Sci. 2020, 31, 621–634. [Google Scholar] [CrossRef]
- Andreychouk, V.; Dublyansky, Y.; Ezhov, Y.; Lysenin, G. Karst in the Earth’s Crust: Its Distribution and Principal Types; University of Silesia: Katowice, Poland, 2009; pp. 53–62. [Google Scholar]
- Tangen, G.I.; Smaaskjaer, G.; Bergseth, E.; Clark, A.; Fossli, B.; Claudey, E.; Qiang, Z. Experience from Drilling a Horizontal Well in a Naturally Fractured and Karstified Carbonate Reservoir in the Barents Sea Using a CML MPD System. In Proceedings of the IADC/SPE Managed Pressure Drilling and Underbalanced Operations Conference and Exhibition, Amsterdam, The Netherlands, 9–10 April 2019. [Google Scholar] [CrossRef]
- Bysveen, J.; Fossli, B.; Stenshorne, P.C.; Skärgård, G.; Hollman, L. Planning of an MPD and Controlled Mud Cap Drilling CMCD Operation in the Barents Sea Using the CML Technology. In Proceedings of the IADC/SPE Managed Pressure Drilling & Underbalanced Operations Conference & Exhibition, Rio de Janeiro, Brazil, 28–29 March 2017. [Google Scholar] [CrossRef]
- Claudey, E.; Fossli, B.; Elahifar, B.; Qiang, Z.; Olsen, M.; Mo, J. Experience Using Managed Pressure Cementing Techniques with Riserless Mud Recovery and Controlled Mud Level in the Barents Sea. In Proceedings of the SPE Norway One Day Seminar, Bergen, Norway, 18 April 2018. [Google Scholar] [CrossRef]
- Swan, A. Geostatistical Software Library and User’s Guide, 2nd ed.; Cambridge University Press: New York, NY, USA, 1999. [Google Scholar] [CrossRef]
- Peiling, M.; Dong, L.; Yonglei, L.; Haiting, A.; Xingyin, X.; Qiang, X.; Zujun, W.; Xiangzhou, Z. Seismic Reflection Characteristics of Deeply-Buried, Layered, Karstic Carbonate Reservoir Strata. In SEG International Exposition and Annual Meeting; SEG: Tulsa, OK, USA, 2013. [Google Scholar] [CrossRef]
- Jianxun, Z.; Xukui, F.; Shujun, L.; Shengming, W.; Yan, G. High Resolution 3D Seismic for Mapping of Subsurface Karsting of Carbonate. In CPS/SEG 2004 International Geophysical Conference; World Petroleum Congress (WPC): Houston, TX, USA, 2002. [Google Scholar]
- Xiaowei, W.; Gang, Y.; Yancan, T.; Lei, L.; Shuhai, Q. Analysis of Factors Affecting Carbonate Fracture-Cave Imaging. In SEG International Exposition and Annual Meeting; SEG: Tulsa, OK, USA, 2013. [Google Scholar] [CrossRef]
- Feng, X.; Wang, Y.; Wang, X.; Wang, N.; Gao, G.; Zhu, X. The application of high-resolution 3D seismic acquisition techniques for carbonate reservoir characterization in China. Lead. Edge 2012, 31, 168–179. [Google Scholar] [CrossRef]
- Lin, P.; Peng, S.; Zhao, J.; Cui, X. Diffraction separation and imaging using multichannel singular-spectrum analysis. Geophysics 2020, 85, 1–88. [Google Scholar] [CrossRef]
- Sheriff, R. Factors affecting seismic amplitude. Geophys. Prospect. 1975, 23, 125–138. [Google Scholar] [CrossRef]
- Piwakowski, B.; Watelet, J.; Moreaux, D.; Sbai, K. High resolution seismic prospection of old gypsum mines—Evaluation of detection possibilities. Environ. J. Eng. Geophys. 1996, 2, 149–152. [Google Scholar]
- Wang, N.; Xie, X.B.; Duan, M.C.; Li, D.; Wu, R.S. Improving seismic image resolution in a carbonate fracture cave region: A case study. In SEG Technical Program Expanded Abstracts 2019; SEG: Tulsa, OK, USA, 2019; Chapter 1; pp. 32–36. [Google Scholar] [CrossRef]
- Dhelie, P.E.; Danielsen, V.; Lie, J.E.; Evensen, A.K.; Wright, A.; Salaun, N.; Rivault, J.L.; Siliqi, R.; Grubb, C.; Vinje, V.; et al. Improving seismic imaging in the Barents Sea by source-over-cable acquisition. In SEG Technical Program Expanded Abstracts 2018; SEG: Tulsa, OK, USA, 2018; Chapter 2; pp. 71–75. [Google Scholar] [CrossRef]
- Maksimov, D.; Pavlov, A.; Sangesland, S. Drilling in Karstified Carbonates: Early Risk Detection Technique. In Proceedings of the ASME 2020 39th International Conference on Ocean, Offshore and Arctic Engineering, Fort Lauderdale, FL, USA, 28 June–3 July 2020; Volume 11, pp. 1–10. [Google Scholar]
- Macpherson, J.D.; Mason, J.S.; Kingman, J.E.E. Surface Measurement and Analysis of Drillstring Vibrations While Drilling. In Proceedings of the SPE/IADC Drilling Conference, Amsterdam, The Netherlands, 22–25 February 1993. [Google Scholar] [CrossRef]
- Kirkman, M. Use of Surface Measurement of Drillstring Vibrations to Improve Drilling Performance. In Proceedings of the 14th World Petroleum Congress, Stavanger, Norway, 29 May–1 June 1994. [Google Scholar]
- Wylie, R.; Soukup, I.; Mata, H.; Cuff, S.; Ho, A. The Drilling Optimization Benefits of Direct Drillstring Surface Measurements—Case Studies from Field Operations. In Proceedings of the SPE/IADC Drilling Conference and Exhibition; Society of Petroleum Engineers: London, UK, 2015; pp. 1–28. [Google Scholar] [CrossRef]
- Tanguy, D.R.; Zoeller, W.A. Applications Of Measurements While Drilling. In Proceedings of the SPE Annual Technical Conference and Exhibition, San Antonio, TX, USA, 4–7 October 1981. [Google Scholar] [CrossRef]
- Grosso, D.S.; Raynal, J.C.; Rader, D. Report on MWD Experimental Downhole Sensors. J. Pet. Technol. 1983, 35, 899–904. [Google Scholar] [CrossRef]
- LaGros, F.W., Jr.; Martin, C.A. Applications of Measurements While Drilling (MWD): Development of the East Breaks Field, Offshore Texas. In Proceedings of the SPE/IADC Drilling Conference, New Orleans, LA, USA, 5–8 March 1985. [Google Scholar] [CrossRef]
- Warren, T.W.; Oster, J.H.; Sinor, L.A.; Chen, D.C.K. Shock Sub Performance Tests. In Proceedings of the IADC/SPE Drilling Conference, Dallas, TX, USA, 3–6 March 1998. [Google Scholar] [CrossRef]
- Constable, M.V.; Antonsen, F.; Stalheim, S.O.; Olsen, P.A.; Fjell, O.Z.; Dray, N.; Eikenes, S.; Aarflot, H.; Haldorsen, K.; Digranes, G.; et al. Looking Ahead of the Bit While Drilling: From Vision to Reality. Petrophysics 2016, 57, 426–446. [Google Scholar]
- Brie, A.; Kimball, C.V.; Pabon, J.; Saiki, Y. Shear Slowness Determination From Dipole Measurements. In Proceedings of the SPWLA 38th Annual Logging Symposium, Houston, TX, USA, 15–18 June 1997. [Google Scholar] [CrossRef]
- Hilchie, D.W. Wireline: A History of the Well Logging and Perforating Business in the Oil Fields; D.W. Hilchie: Boulder, CO, USA, 1990; p. 200. [Google Scholar]
- Wu, P.T.; Lovell, J.R.; Clark, B.; Bonner, S.D.; Tabanou, J.R. Dielectric-Independent 2-MHz Propagation Resistivities. In Proceedings of the SPE Annual Technical Conference and Exhibition, Houston, TX, USA, 3–6 October 1999. [Google Scholar] [CrossRef]
- Simms, J.E.; Morgan, F.D. Is There Any Uniqueness And/or Resolution In Resistivity Inversion. In SEG International Exposition and Annual Meeting; SEG: Tulsa, OK, USA, 1989. [Google Scholar] [CrossRef]
- Kim, J.H.; Schon, J.; Towle, G.; Whitman, W.W. An Automatic Inversion Of Normal Resistivity Logs. Log Anal. 1990, 31, 1–10. [Google Scholar]
- Yang, H.J.; Guo, S.S.; Gao, Y.D.; Chen, M.; Wang, C.; Shim, Y.H.; Chang, B.T.; Wang, F.; Li, T. Reduce Drilling Risk in HPHT Gas Field Using Innovative Look-Ahead Technology—A Case Study from South China Sea. In Proceedings of the International Petroleum Technology Conference, Dhahran, Saudi Arabia, 13–15 January 2020. [Google Scholar] [CrossRef]
- Asch, T.; Abraham, J.; Irons, T. A Discussion on Depth of Investigation in Geophysics and AEM Inversion Results. In SEG Technical Program Expanded Abstracts 2015; SEG: Tulsa, OK, USA, 2015; pp. 2072–2076. [Google Scholar] [CrossRef]
- Brian, C.; Stephen, D.B.; Jacques, J.; Martin, L. Well Logging Apparatus Having Toroidal Induction Antenna for Measuring, While Drilling, Resistivity of Earth Formations. U.S. Patent 5,235,285A, 10 August 1993. [Google Scholar]
- Meyer, W.H.; Wu, J.; Macune, D.T.; Harvey, P.R. Near-Bit Propagation Resistivity for Reservoir Navigation. In Proceedings of the SPE Annual Technical Conference and Exhibition, New Orleans, LA, USA, 25–28 September 1994. [Google Scholar] [CrossRef]
- Lindsay, G. An analysis of the at-bit resistivity decision making process. In Proceedings of the International Petroleum Technology Conference, Kuala Lumpur, Malaysia, 3–5 December 2008. [Google Scholar] [CrossRef]
- Rosthal, R.A.; Young, R.A.; Lovell, J.R.; Buffington, L.; Arceneaux, C.L., Jr. Formation Evaluation and Geological Interpretation from the Resistivity-at-the-Bit Tool. In Proceedings of the SPE Annual Technical Conference and Exhibition, Dallas, TX, USA, 22–25 October 1995. [Google Scholar] [CrossRef]
- Biot, M. Theory of Propagation of Elastic Waves in a Fluid Saturated Porous Solid. II. Higher Frequency Range. J. Acoust. Soc. Am. 1956, 28, 179–191. [Google Scholar] [CrossRef]
- Tang, X.; Patterson, D.; Wu, L. Measurement of Formation Permeability Using Stoneley Waves From an Lwd Acoustic Tool. Petrophysics 2009, 51, 2. [Google Scholar]
- Sayers, C.; Nagy, Z.; Adachi, J.; Singh, V.; Tagbor, K.; Hooyman, P. Determination of in situ stress and rock strength using borehole acoustic data. SEG Tech. Program Expand. Abstr. 2009, 28, 3505–3509. [Google Scholar] [CrossRef]
- Morris, C.F.; Little, T.M.; Letton, W., III. A New Sonic Array Tool for Full Waveform Logging. In Proceedings of the SPE Annual Technical Conference and Exhibition, Houston, TX, USA, 16–19 September 1984. [Google Scholar] [CrossRef]
- Maia, W.; Rubio, R.; Junior, F.; Haldorsen, J.; Guerra, R.; Dominguez, C. First Borehole Acoustic Reflection Survey mapping a deepwater turbidite sand. SEG Tech. Program Expand. Abstr. 2006, 25, 87–92. [Google Scholar] [CrossRef]
- Hirabayashi, N.; Martinez, G.A.; Wielemaker, E. Case Studies of Borehole Acoustic Reflection Survey (BARS). In Proceedings of the SPWLA 22nd Formation Evaluation Symposium of Japan, Chiba, Japan, 29–30 September 2016. [Google Scholar]
- Brett, J.F.; Goetz, J.F.; Roberts, A.P. Methods of Employing Vibrational Energy in a Borehole. U.S. Patent 5,309,405A, 3 May 1994. [Google Scholar]
- Bjorn, N.; Paulsson, P. Nondestructive Downhole Seismic Vibrator Source and Processes of Utilizing the Vibrator to Obtain Information about Geologic Formations. U.S. Patent 4,702,343A, 18 March 1986. [Google Scholar]
- Dedole, P.; Grolet, P.; Laurent, J. Device for Generating Sound Pulses Inside a Well, by Percussion. U.S. Patent 4,648,478A, 23 January 1984. [Google Scholar]
- Hardee, H.C. Downhole pereodic seismic sources. Geophys. Prospect. 1983, 31, 57–71. [Google Scholar] [CrossRef]
- Hardee, H.C.; Hills, R.G.; Striker, R.P. Down Hole Periodic Seismic Generator. U.S. Patent 4,805,727A, 28 October 1982. [Google Scholar]
- Hardee, H.C. Fluid Driven Torsional Dipole Seismic Source. U.S. Patent 4,982,811A, 8 August 1989. [Google Scholar]
- Paulsson, B.N.P. Three-component Downhole Seismic Vibrator. In Proceedings of the SEG Annual Meeting, Anaheim, CA, USA, 30 October–3 November 1988. [Google Scholar]
- Chen, S.T.; Eriksen, E.A. Experimental Studio of Downhole Seismic Sources. In Proceedings of the SEG Annual Meeting, Dallas, TX, USA, 29 October–2 November 1989. [Google Scholar]
- Howlett, D.L. Comparison of borehole seismic sources under consistent field conditions. In SEG Technical Program Expanded Abstracts 1991; SEG: Tulsa, OK, USA, 2005; Chapter 2; pp. 18–21. [Google Scholar] [CrossRef]
- Farr, J.B.; Ward, R.W. Seismic Velocity Determination. U.S. Patent 3,881,168A, 11 December 1973. [Google Scholar]
- Klaveness, A. Seismic Well Logging System and Method. U.S. Patent 4,207,619A, 24 February 1975. [Google Scholar]
- Beresford, J.M.; Crowther, P.A. Acoustic Sensor. U.S. Patent 5,798,488A, 30 March 1994. [Google Scholar]
- Leggett, J.V. Measurement-While-Drilling Acoustic System Employing Multiple, Segmented Transmitters and Receivers. U.S. Patent 6,084,826A, 12 January 1995. [Google Scholar]
- Mathiszik, H.; Oppelt, J. Apparatus and Method for Acoustic Position Logging Ahead-of-the-Bit. U.S. Patent 2005/003,491,7A1, 14 August 2003. [Google Scholar]
- Wajid, R. Look Ahead Advance Formation Evaluation Tool. International Publication Patent Number WO2011/080,640,A3, 7 July 2011. [Google Scholar]
- Meehan, R.; Miller, D.; Haldorsen, J.; Kamata, M.; Underhill, B. Rekindling interest in seismic while drilling. Oilfield Rev. 1993, 5, 3–13. [Google Scholar]
- Staron, P.; Gros, P.; Arens, G. Instantaneous Acoustic Logging in a Borehole. Canada Patent 1,255,783A, 25 May 1984. [Google Scholar]
- Ollivier, R.M. Apparatus for the Acquisition of a Seismic Signal Transmitted by a Rotating Drill Bit. U.S. Patent 5,248,857A, 27 April 1990. [Google Scholar]
- Airhart, T.P.; Montgomery, M.G.; Kingman John, E.E.; Livesay, R.B. System for Real-Time Look-Ahead Exploration of Hydrocarbon Wells. WIPO (PCT) Patent WO1993/007,514,A1, 2 October 1992. [Google Scholar]
- Haldorsen, J.; Miller, D.; Walsh, J. Multichannel approach to signature estimation and deconvolution for drill bit imaging. In SEG Technical Program Expanded Abstracts 1992; SEG: Tulsa, OK, USA, 2005; Chapter 1; pp. 181–184. [Google Scholar] [CrossRef]
- James, W.; Rector, I.; Hardage, B.A. Radiation pattern and seismic waves generated by a working roller-cone drill bit. Geophysics 1992, 57, 1319–1333. [Google Scholar] [CrossRef]
- Rector, J.W.; Marion, B.P. The use of drillbit energy as a downhole seismic source. Geophysics 1991, 56, 628–634. [Google Scholar] [CrossRef]
- Naville, C.; Layotte, P.; Pignard, G.; Guesnon, J. Well seismic—Application of the TRAFOR MWD system to drill-bit seismic profiling. In Conference Proceedings, 56th EAEG Meeting, Jun 1994, cp-47-00132; European Association of Geoscientists & Engineers: Houten, The Netherlands, 1994. [Google Scholar] [CrossRef]
- Petronio, L.; Miranda, F.; Poletto, F.; Miandro, R. Seisbit Seismic-while-Drilling Technique Summary of Results Obtained in Onshore Surveys. In Conference Proceedings, 1st EAGE North African/Mediterranean Petroleum & Geosciences Conference & Exhibition, Oct 2003, cp-8-00128; European Association of Geoscientists & Engineers: Houten, The Netherlands, 2003; pp. 18–26. [Google Scholar] [CrossRef]
- Azbek, A. Adaptive beamforming with generalized linear constraints. In SEG Technical Program Expanded Abstracts 2000; SEG: Tulsa, OK, USA, 2005; Chapter 5; pp. 2081–2084. [Google Scholar] [CrossRef]
- Chabot, L.; Henley, D.C.; Brown, R.J.; Bancroft, J.C. Single-well seismic imaging using full waveform sonic data: An update. In SEG Technical Program Expanded Abstracts 2002; SEG: Tulsa, OK, USA, 2005; Chapter 7; pp. 368–371. [Google Scholar] [CrossRef]
- Comelli, P.; Craglietto, A.; Dordolo, G.; Schleifer, A.; Vascotto, G.; Zgauc, F. SEISBIT 3D: The new seismic while drilling data acquisition system. Geophysics 2002, 43, 109–118. [Google Scholar] [CrossRef]
- Poletto, F.; Miranda, F.; Corubolo, P.; Schleifer, A. Drill Bit As a Seismic Source For Near-well Imaging. In SEG International Exposition and Annual Meeting; SEG: Tulsa, OK, USA, 2008. [Google Scholar] [CrossRef]
- Raknes, E.; Moser, T.; Arntsen, B.; Johansen, S.E.; Sangesland, S. Surface Seismic While Drilling—Imaging of Well Bores in Seismic Context. In Proceedings of the 79th EAGE Conference and Exhibition 2017, Paris, France, 12–15 June 2017; pp. 1–5. [Google Scholar] [CrossRef]
- Robbins, C.A.; Linyaev, E.J.; Malloy, R.L.; Young, D.J.; Birchak, J.R.; Minear, J.; Shah, V. Vertical Seismic Profiling in a Drilling Tool. Canada Patent 2,342,765A1, 2 September 1999. [Google Scholar]
- Esmersoy, C.; Underhill, W.; Hawthorn, A. Seismic Measurement While Drilling: Conventional Borehole Seismics on Lwd. In Proceedings of the SPWLA 42nd Annual Logging Symposium, Houston, TX, USA, 17–20 June 2001. [Google Scholar]
- Bertelli, L.; Abramo, F.; Gatti, V. Seismic While Drilling and Geophysical Monitoring in the Southern Apennine Range. In Conference Proceedings, 60th EAGE Conference and Exhibition, Jun 1998, cp-110-00198; European Association of Geoscientists & Engineers: Houten, The Netherlands, 1998. [Google Scholar] [CrossRef]
- Underhill, W.; Esmersoy, C.; Hawthorn, A.; Hashem, M.; Hendrickson, J.; Scheibel, J. Demonstrations of Real-Time Borehole Seismic From an LWD Tool. In Proceedings of the SPE Annual Technical Conference and Exhibition, New Orleans, LA, USA, 30 September–3 October 2001. [Google Scholar] [CrossRef]
- Haldorsen, J.; Krasovec, M.; Raikes, S.; Harrold, T.; Day, D.; Clippard, J. Comparison of Full Waveform SeismicMWD and Conventional VSP Data from the South Caspian Sea. In Conference Proceedings, 64th EAGE Conference & Exhibition, May 2002, cp-5-00592; European Association of Geoscientists & Engineers: Houten, The Netherlands, 2002. [Google Scholar] [CrossRef]
- Adrian, S.B.O.; Alfonso, M.; Leonardo, A.; Rito, G. Minimizing drilling risks for exploration well in deep water using seismic while drilling technology. In Proceedings of the Rio Oil and Gas Expo and Conference, Rio de Janeiro, Brazil, 13–16 September 2010; Volume 8, pp. 115–125. [Google Scholar]
- Peng, C.; Dai, J.; Yang, S. Seismic Guided Drilling: Near Real Time 3D Updating of Subsurface Images and Pore Pressure Model. In Proceedings of the International Petroleum Technology Conference, Beijing, China, 26–28 March 2013. [Google Scholar] [CrossRef]
- Montaron, B.A.; Xue, F.J.; Tian, W.; Han, R.P.R. Cave Geomorphology and its Effects on Oil Recovery Factors in Tarim Karst Reservoirs, West China. In Proceedings of the International Petroleum Technology Conference, Kuala Lumpur, Malaysia, 10–12 December 2014. [Google Scholar] [CrossRef]
- Yang, H.; Pan, W.; Chen, L.; Yang, P. Seismic Description of Karst Topography Furthermore, Caves of Ordovician Carbonate Reservoirs, Lungu Area, Tarim Basin, West China. In SEG Technical Program Expanded Abstracts 2010; SEG: Tulsa, OK, USA, 2010. [Google Scholar]
- Luo, C.; Xue, F.; Deng, X.; Mao, Q.; Yang, P.; Zeng, R. Cave System Analysis—An Effective Approach to Predict Hydrocarbons in Cavernous Carbonate Reservoir. In Proceedings of the International Petroleum Technology Conference, Beijing, China, 26–28 March 2013. [Google Scholar] [CrossRef]


Publisher’s Note: MDPI stays neutral with regard to jurisdictional claims in published maps and institutional affiliations. |
© 2021 by the authors. Licensee MDPI, Basel, Switzerland. This article is an open access article distributed under the terms and conditions of the Creative Commons Attribution (CC BY) license (https://creativecommons.org/licenses/by/4.0/).