Review

Optical Methods for Measuring Icing of Wind Turbine Blades

Kutateladze Institute of Thermophysics SB RAS, 630090 Novosibirsk, Russia
*
Author to whom correspondence should be addressed.
Energies 2021, 14(20), 6485; https://doi.org/10.3390/en14206485
Submission received: 31 August 2021 / Revised: 3 October 2021 / Accepted: 4 October 2021 / Published: 10 October 2021
(This article belongs to the Section A3: Wind, Wave and Tidal Energy)

Abstract

:
The development of wind-power engineering in the Arctic has led to increasing wind turbines in cold climatic zones. A problem operating wind turbines in cold conditions is the icing of blades. The icing of the blades leads to a change in rotor aerodynamics, a decrease in energy production, the additional weight of blades, and load on the rotor, which increase wear and reduce the lifetime of the turbines. The growth of icing on the blades threatens the uncontrollable separation of ice pieces from the blade edges, and the operation is unsafe. Non-contact methods for detecting icing on the blades need to prevent critical operating modes with ice formation on the blades. This review analyzes methods for detecting icing. The advantages and disadvantages of various optical methods are presented to give valuable insights on ice prevention for wind turbines operating in cold regions.

1. Introduction

Europe could have wind energy power of 323 GW in 2030 [1]. The use of wind turbines is economically efficient and environmentally friendly. Currently, there is an increased interest in the operation of wind turbines in cold climatic conditions, in mountainous or hilly areas [2]. The installed capacity of wind power in these regions is steadily growing from year to year. According to the latest forecasts, 65 to 75 gigawatts of wind energy will be generated in cold climates by 2022, which would mean an increase of as much as 50 per cent since the end of 2017 [3]. These are the wind areas with a high density of cold air, which may be considered as an advantage for generating more power from wind energy. However, in these regions, the high potential of wind energy is often associated with extreme weather conditions and icing of the rotating parts of the wind turbine.
When operating wind turbines in cold climate zones, the problem of icing of wind turbine blades arises [4]. Icing not only increases the weight of the blades and the load on the wind turbine elements but also changes the blade’s profile, worsening the wind turbine aerodynamics, which decreases its efficiency and changes the formed vortex wake [5]. The ice formed on the blade leads to an increase in the drag coefficient and the lifting force of the blade profile, increasing its resistance. Icing can reduce power production from a few percent (with minor icing) to a complete loss of power when too much ice forms on the wind turbine blade [3]. In addition, ice on the rotor blades sometimes critically disrupts the blades aerodynamics, increasing their vibrations. When these vibrations reach a critical value, the wind turbine has to be shut down to prevent wind turbine failure [6]. The icing of the wind turbine blades can cause mass imbalances, which reduce the service life due to increased vibrations and loads. If the blades are covered with ice, the wind turbine nacelle is also affected by additional loads [7].
The icing of the wind turbine blades occurs at the leading edge of the blade. This fact has been noticed at many wind farms and is well documented [8,9]. The leading edge of the rotor blade can accumulate a significant amount of ice when working in cold climate zones. This ice can break off from the blade. The separation of the formed ice poses risks to the lives of people living near wind turbines. The thrown ice distance is determined by the geometry of the ice piece, the angle of the rotor rotation, the rotation speed, the local radius, and the wind speed.
The amount of accumulated ice depends on several factors. The most important are the temperature, humidity, and duration of icing. The blade geometry also plays a role in the icing process. The formation of ice strongly depends on the temperature and the size of the droplets in the air. However, it is quite difficult to reveal a general pattern since ice forms differently depending on the above conditions. The icing on the rotor blade also depends on the rotor blade chord length and the incoming flow velocity [8,9].
To combat icing, it is important to develop methods for its prediction. Icing detection methods can be divided into direct and indirect methods [10,11,12,13,14,15]. Indirect methods are based on tracking weather conditions that lead to icing, e.g., humidity and temperature, or ice impact on the energy generation process.
In this review, we will analyze various methods for determining ice formation. The next section will focus on indirect methods for detecting icing. In Section 3, direct diagnostic methods will be analyzed. Section 4 will present an analysis of optical methods for measuring ice. For a complete understanding of the problem, we will first briefly outline the indirect and direct methods to show the advantages of optical measurement methods. The comparison and effectiveness of the methods will be described in Section 6, followed by the conclusions of the analysis.

2. Indirect Methods for Determining to Ice

The first method is based on the dew point diagnostics. Reaching the temperature corresponding to the dew point is an indicator of the icing beginning [16,17,18,19].
The difference in the expected and actual output power measuring method [20,21] is based on the measurement of the expected power based on the nominal curve and the actual output power, which is significantly reduced during icing.
The second method is based on the comparison of heated and non-heated anemometers recorded data [7,22,23]. A rough way to diagnose the formation of ice may be a comparison of two anemometers information, one of which is heated, and the other is not. An anemometer that is not heated may be exposed to ice formation, but a heated one is not. The presence of icing can be detected by the difference in their readings. The anemometer, on which icing is formed, compared with the heated one, will show a much lower or even zero wind speed value. These measurements may indicate that ice has begun to form on the wind turbine blade. The method is fairly rough, but it is an extremely cheap way to detect icing.
Diagnostics of ice by changes in the readings of temperature sensors [24]. Another method for detecting ice on the wind turbine blade may use the temperature sensor data during cyclic heating. At that, one or more temperature sensors are installed in the airflow and the sample temperature sensor is isolated from the airflow. The readings of the temperature sensors installed in the stream will change depending on the wind speed and the presence of ice on them. Comparing the readings of the sensors installed in the flow and the sample sensor, we can conclude whether ice has formed on the blade or not.
Diagnostics of icing by measuring the noise of the blades. One of the ways to measure the wind turbine icing is a method based on measuring the sound coming from the wind turbine blade motion. This sound frequency of vibrations and the noise level is shown to increase with the ice accretion on the blades [25,26].
Changes in the resonant frequency of the wind turbine blade. The resonant frequency of the rotor blade of a wind turbine changes during icing. The accredited ice load can be measured by monitoring the blade vibration frequency. The load can be determined by the observed frequency shift [18].
The method for diagnosing icing by measuring the height of the lower cloud boundary [12,13,14]. The cloud icing occurs when the air temperature is below the water crystallization temperature. There is a way to determine the intensity of icing by the height of clouds, wind speed, and temperature. Substituting these data into a known model of the phenomenon, it is possible to find out the intensity of icing according to the standard procedure. The height of the lower cloud boundary can be measured directly using the cloud-range meter. This is a standard meteorological instrument. The cloud-range meter measures the height of clouds using lasers. The laser light is scattered in the cloud, and after a certain delay time, an estimate of the lower boundary of the clouds can be made from the backscattering. The clouds’ height can also be measured indirectly by the long-wave radiation emission in the air, using the Stefan–Boltzmann black body radiation law. If the temperature of the sky above the wind turbine and the air temperature at the wind turbine are the same, then there is a high probability that clouds are currently covering the turbine.

3. Direct Methods of Icing Diagnostics

Direct methods of icing diagnostics detect changes in physical quantities caused by icing and can be classified as mechatronic systems (integration of micromechanical and electronic devices), electrical systems, and optical systems [17].

3.1. Mechatronic Systems

Mechatronic methods based on signal attenuation are based on measuring the attenuation of ultrasonic or microwave signals.
Diagnostics of icing by ultrasonic waves attenuation is presented further [27,28,29,30,31,32,33]. Measuring the attenuation of an ultrasonic signal in an acoustic waveguide can be used as a method for detecting ice on the wind turbine blade. The sensor consists of a steel or nickel acoustic waveguide, which has low acoustic attenuation. An ultrasonic signal is generated at one end of the acoustic waveguide. At the other end of the waveguide, the received signal is measured. If the waveguide is covered with ice, the signal will fade, since the ice absorbs acoustic vibrations in the waveguide. The water in the waveguide does not cause any attenuation, since the viscosity and density of liquid water are too low. The signal can be generated and measured by piezoelectric elements. The waveguide changes testing can be done by the waveguide impedance measuring. There are also similar methods for determining the icing by the presence of a reflected wave in the waveguide. If ice forms at the end of the waveguide, the signal is well-reflected. Additionally, if there is no ice, then the signal is not reflected.
The advantages of the method include its high sensitivity to the increase in the ice mass and high accuracy in determining the amount of accumulated ice. In addition, sensors based on this method can be mounted on the blade of a wind turbine. The disadvantage of the method is the low sensitivity of ice detection due to the difference between the masses of the blade and the ice layer. Moreover, the method of installing the sensor can negatively affect the blade design. This method has a low sensitivity limit because of the difference between its local sensitivity and the large surface area of the blade. In addition, ambient noise produced by internal turbine equipment may lead to wrong measurement records, which can reduce the sensitivity and system reliability.
The ice diagnostic method based on microwave signal attenuation. The method is based on the fact that reflection parameters of a microwave waveguide are influenced by a difference in the ice accretion on the waveguide surface [34,35]. The reflected microwave signal parameters for water and ice may be different. Measurement of ice parameters, including the type, the ice growth speed, and thickness, can be carried out via microwave signal spectroscopy. The fact of water or ice formation on the waveguide and the ice type is possible to determinate using some algorithms with the measured data.
The method advantages are high sensitivity, ability of ice present detection, and the sensor can be embedded inside the blade. The method disadvantages are the difficulty of its realization on a non-flat surface, such as the convex shape of a wind turbine blade, the limitedness of the detection zone of the sensor on the surface of the wind turbine blade due to its design and the influence of a waveguide installation on the aerodynamic properties of the turbine.
The method for measuring the shift of the resonant frequency of an oscillating load is based on a change in the resonant frequency of the load vibrations during its icing. The eigenfrequency of the measured load will fall as the ice grows and can be measured by piezoelectric and magnetostrictive devices [10,11,12].
The advantage of this method is that it can detect a change in the ice mass on the blade surface. The disadvantage is the effect of the blade vibration during heavy icing, which causes a loud noise and introduces an error in the measured data.

3.2. Electrical Systems for Icing Diagnostics

Electrical systems for icing diagnostics include a capacitive method and a conductivity method.
A capacitive method for diagnosing the icing. The capacitive sensor emits an electric field. This field allow to determine the dielectric media presence. The dielectric properties of a material change are determined by a change in its capacitance [36,37,38,39]. This property is used to detect the presence of ice, its thickness, and location. Sensors can be combined into the sensors array. By scanning the sensors in the array and using the signal processing algorithms, the presence, type, and thickness of ice are measured.
The advantages of the method are high sensitivity, high speed, lightweight, installability on a large surface of wind turbine blades, ice type detectability, distinctively low power consumption, and definability of ice located on the blade. The disadvantages of the method are the permittivity dependence on temperature and the influence of the sensor (contact element) geometry on the measurement results.
Icing diagnostics based on conductivity measurement [40,41]. The method works as follows. A frequency generator emits signal and feed the inductive electrodes. When water or ice is accreted on the electrodes, the electrodes’ resistance changes. The voltage detector measures these changes. The method allows to distinguish the ice type and to measure ice thickness. The method characteristics are determined by the shape, size, and gap between the sensor electrodes, and also inductive sensitivity to ice in the outside electrodes’ space. Inductive sensors can embed onto the blade surface.
The advantages of this method are the ability to measure the ice thickness and weight. Additionally, it can detect the formation of ice along the leading edge of the blade. Electrodes can be embedded into the blade.

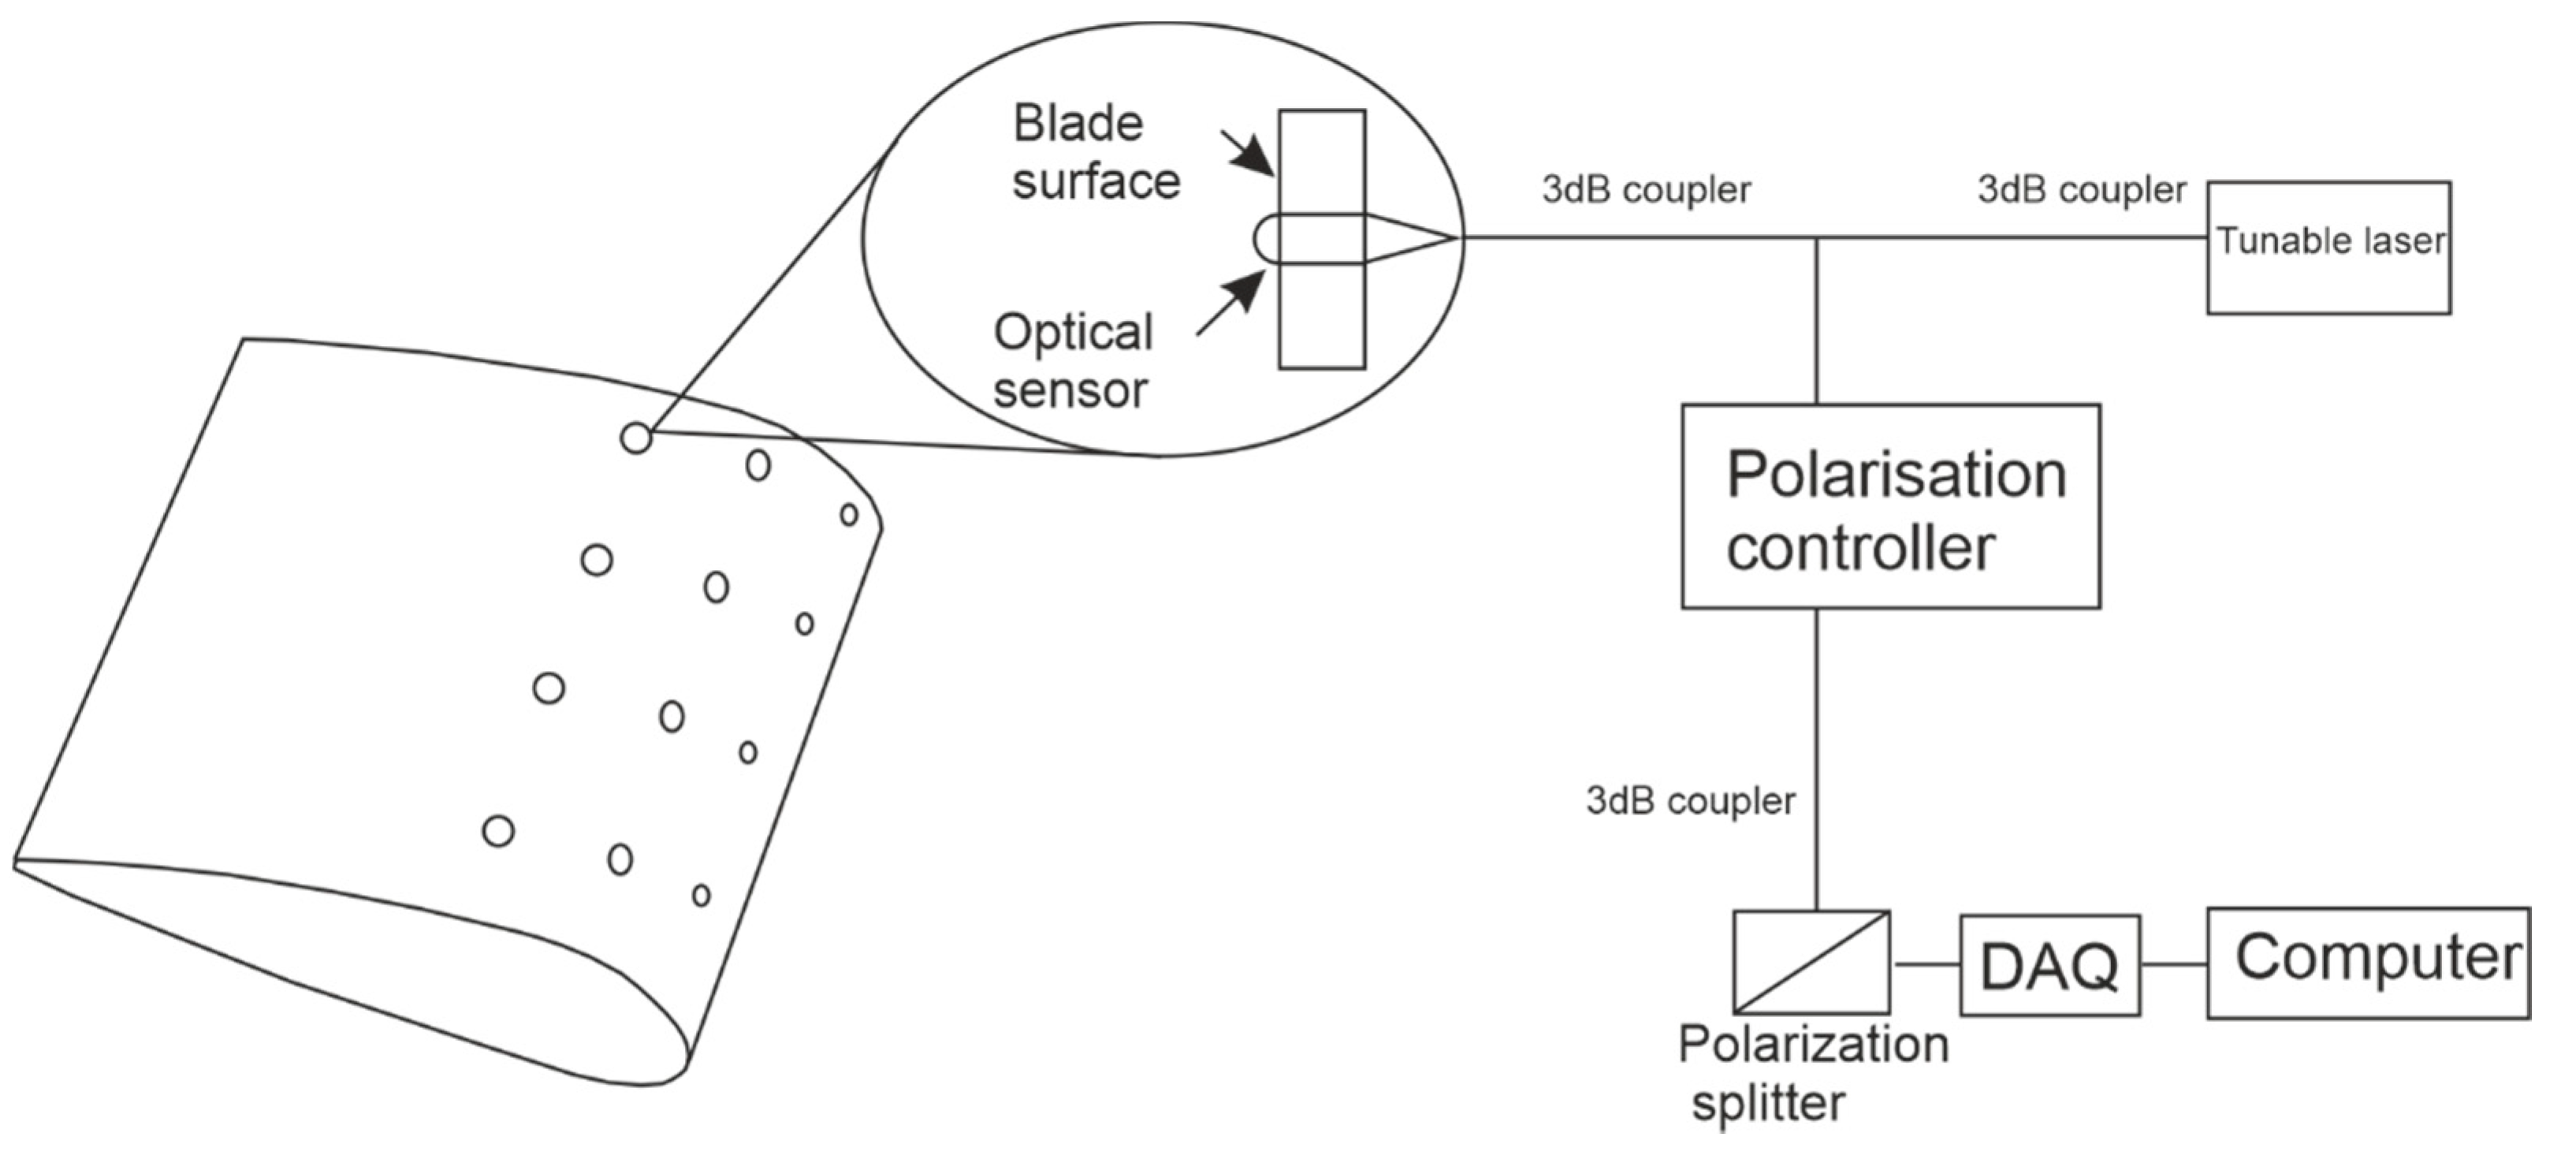
4. Optical Methods of Icing Diagnostics

Video recording method [13]. It is the simplest method for diagnosing the presence or absence of icing. For video recording, it is possible to use various cameras, including webcams. Video recording in combination with image processing methods has enormous advantages since they can not only determine the presence or absence of ice but also make it possible to measure several geometrical parameters [42,43].
A method based on direct measurement of light. One of the optical methods is to measure light diffused or scattered from the surface. If ice forms on the surface of an object that emits or scatters light, then the light from it will be disturbed and scattered differently. By measuring the emitted light, it is possible to determine the presence of ice by tracking changes in scattering properties [18].
The method of optical reflectometry in the frequency domain is based on the interaction between photons and water molecules [12,44,45,46,47,48,49]. The laser light with a tunable frequency is fed through an optical fiber to optical sensors that are located on the wind turbine blade surface (see Figure 1). The ice on the blade surface reflects part of the light beam, which interferes with the reference signal. The interference characteristics of the laser signal covering the surface of the blade are measured, and then the transmission delay and the signal amplitude are calculated. Reflectivity dependences give information about ice types and thicknesses.
The accuracy of measuring the ice presence, location, and thickness is the main advantage of the method. The high sensitivity, low time response, high resolution, ability to embed sensors into blade, and durability are other advantages of the method. High cost and commercial inaccessibility are its main disadvantages.
The absorption optical method [4,50] is based on attenuation of the intensity of light passing through the absorbing medium. The relationship between the intensity of the incident and the transmitted light is determined by the exponential law. This method works for transparent icing. The method allows measuring the field thickness of the absorbing substance. After the light passes through the substance, the intensity at each point will depend on the thickness of the absorbing layer of ice. The thickness of the ice layer is calculated from the intensity of the transmitted light. The speed of the method is only limited by the recording camera.
The fiber-optic method is based on the measurement of an optical signal in an optical fiber [51]. This method works for transparent icing. Fiber-optic sensors have several advantages: high response speed, a small area of ice surface sensing, high measurement accuracy, and a long connection line between the object and the device. Their application is particularly promising when measuring the thickness of a wavy layer of transparent ice on geometrically complex surfaces, such as wind turbine blades.
The beam of a helium–neon laser (see Figure 2) passes through a Wollaston prism into a single-mode or multimode optical fiber. The other end of the optical fiber is fixed to the blade flush with its surface, on which ice is formed.
The probing radiation comes out of the optical fiber in the form of a conical beam with a full angle at the vertex. Part of the probing radiation Ir, reflected by the film surface, returns to the optical fiber, and the other part of the probing radiation Ic is reflected from the end of the optical fiber. Both beams are transmitted by the fiber in the opposite direction and reach the Wollaston prism, which in this scheme, being a directional illuminator, spatially separates the forward and reverse beams, using their polarization characteristics. Then, the volumetric micro lens introduces the Ir + Ic back beams into the receiving optical fiber, along which they are directed to the photodetector unit. After their amplification, the electronic signals are entered into a personal computer for processing and analysis. Two fiber-modified sensors have been developed and investigated. In this case, the system is simplified by removing the directional illuminator. The receiving fiber of the first sensor is installed directly next to the optical fiber of the second sensor. The sensors may be installed on both the inner and outer sides of the ice. The dependence of the signal of the fiber-optic sensor on the thickness of the ice layer is measured during static calibration.
The method of infrared spectroscopy is based on the effect of absorption and reflection of infrared light from ice (see Figure 3). By measuring the amount of reflected light, it is possible to determine whether ice is present on the surface. In the case of ice formation on the surface, the reflectivity of the surface will change, and the optical signal will not be registered [52,53,54,55,56,57]. The measurements obtained with the help of sensitive elements form a map of temperature changes. The readings of each pixel of the camera are analyzed by the image processing software and converted into temperature values. This method allows for non-disturbing measurements and can be used for the instantaneous study of the blade surface state.
Remote measurements, high speed, high resolution, wide dynamic range, high sensitivity, high accuracy, absence of physical contact with ice, and simultaneous measurement of multiple points are the method advantages.
The low accuracy of the measured temperature, which can be influenced by the ambient temperature and the surface material, is the only disadvantage of the method. The measured data and its accuracy can be affected by the wind speed and the movement of the blades.
The next method is based on the total internal reflection of light [56,57,58,59,60]. The paper [56] presents an optical method for monitoring the transparent icing, which is applicable for remote control of wind turbine blade icing. The light source is placed on the surface of the blade, and the collected projection circle radius is observed to determine the presence of ice on the blade. This monitoring method can also calculate the thickness of the blade ice layer by the projection aperture size. The beam path in the icing layer above the light surface is shown in Figure 4a. As a result of light interaction at the interface, an image shaped like a circle (see Figure 4b) appears. From its geometric parameters, the icing thickness is reconstructed by the formula:
h = D d 4 tan ( arcsin ( n 1 n 2 ) ,
where n1 = 1 is the air refraction index and n2 = 1.31 is the ice refractive index; d is the source size; D is the image size. The method based on total internal reflection may be used in field measurements.
The next method is based on structured lighting. The methods of structured lighting are digital image projection method and phase triangulation method.
The digital image projection method is a structured light method that can be used to reproduce the three-dimensional characteristics of an object [61,62,63,64,65,66,67,68]. Figure 5 shows a diagram of a typical system with a digital projection method. A digital projector is used to project images with known characteristics onto a test object of interest (for example, an ice layer on a test surface). Due to the complex shape of the surface of the test object, the projected image templates will deform when observed from an observation axis that differs from the projection axis. The projector unit (D), the image registration unit (E), and the three-dimensional object (B) form the basis of the triangulation picture. If the corresponding points between the camera (A) and the projector (C) are determined using the calibration procedure, the three-dimensional shape of the test object can be obtained by analyzing the triangulation of the ABC triangle. For the digital image projection method presented here, the correspondence is established by finding the displacement vectors between the corresponding points on the distorted images (with ice on the tested surface) and the reference image (without ice on the tested surface). More specifically, by determining the displacement vectors at the points of interest between the modulated images and the reference image using a cross-correlation image processing algorithm, the three-dimensional shape of the test object under the study for the reference surface (the distribution of the thickness of the water film/rivulets on the test surface) can be quantified.
Another method based on structured lighting is the phase triangulation method [63,64,65]. It is a kind of digital projection method, but it is aimed at measuring the ice thickness field (see Figure 6). Initially, the method was developed to measure the geometry of large-scale objects. However, it may be successfully applied to diagnose ice on the blades of a wind turbine. The method considered in [63] is the most promising for non-contact measurement of the surface profile of three-dimensional objects. This method is based on structured illumination and observation of the object under study from a direction other than that of illumination. The observed 2D image representing the spatial distribution of the intensity of light scattered by the object contains distortions encoding information about the third coordinate [64]. The error of three-dimensional measurements depends on the accuracy of the registration of structured lighting and the light-scattering properties of the object’s surfaces. The algorithms used to reconstruct the profile are usually adapted to a certain class of objects with known light-scattering properties of the surface. The image of parallel halftone bands, the intensity of which varies in the transverse direction according to the periodic law, is used as a structured illumination in [63]. During the recording, parallel halftone bands acquire spatial distortions caused by the relief of the surface of the object under study. Information about the relief is obtained by analyzing the phase of the intensity distribution function of the image used. Therefore, the analyzed images of structured lighting are called “phase images”. The main advantage of the phase triangulation method is its resistance to defocusing of the projected and detected optical images. High accuracy is achieved when measuring the surface profile of a three-dimensional object with a relief exceeding the detection intensity of the optical system. Since phase images are similar to interference patterns, they are often processed using well-known methods for processing interference patterns.
The advantage of methods based on structured lighting is scalability. If the source of structured lighting is quite stable, an increase in the geometric dimensions of the measuring space is achieved by separating the elements of the measuring system at distances that allow lighting and fixing the entire required volume.
In the end of Section, in Table 1, the list of discussed methods with two columns “Advantages” and “Disadvantages” of the optical measurement methods is presented.

5. Discussion

From this review of the concept and working principles of ice detection methods that can be adapted for the blades of wind turbines, it appears that each method has its own advantages and disadvantages. Additionally, there is no one method suitable for solving the problem of icing detection on wind turbine blades, suitable for wide range of weather condition. The combination of methods is required for icing detection on wind turbine blades. Of course, indirect icing detection methods are extremely suitable, because they can be based on tracking weather conditions that lead to icing, e.g., humidity and temperature, or ice impact on the energy generation process. They can give information that icing can occur and after those the direct icing diagnostic methods they can give a lot of information about icing.
Mechatronic methods have such advantages such as high sensitivity to the increase in the ice mass and high accuracy in determining the amount of accumulated ice; sensors based on these methods can be mounted on the blade of a wind turbine. These methods have disadvantages concluding in that installing the sensor can negatively affect the blade design, the difficulty of their realization on a non-flat surface, such as the convex shape of a wind turbine blade, the limitedness of the detection zone of the sensor on the surface of the wind turbine blade due to its design, and the influence of a waveguide installation on the aerodynamic properties of the turbine.
Electric methods have advantages such as high sensitivity, high speed, lightweight, installability on a large surface of wind turbine blades, ice type detectability, distinctively low power consumption, and definability of ice located on the blade. The disadvantages of the method are the permittivity dependence on temperature and the influence of the sensor geometry on the measurement results.
The most promising is a combination of indirect methods with optical methods. Indirect methods can give information about weather condition and whether the icing can occur or not. Additionally, optical method is applicable for measuring the key parameters during the ice formation on the blades. Additionally, a combination of the presence of icing can give almost every mentioned above method. For transparent icing, the method of optical reflectometry in the frequency domain, the method based on total internal reflection of light, the absorption optical method, the fiber-optic method, and the method of infrared spectroscopy can be used. For non-transparent icing, the video recording method, the method of direct measurement of light, the method of infrared spectroscopy, and the method based on structured lighting can be used.
For definition of ice type, the video recording method, the method of optical reflectometry in the frequency domain and the method of infrared spectroscopy are suitable.
The ice location, thickness, and speed of ice growth on the blade can be determined with methods of optical reflectometry in the frequency domain, the video recording method, the method based on total internal reflection of light, the absorption optical method, the fiber-optic method, and the method based on structured lighting.
Sensors based on optical diagnostic methods can be mounted on a large surface of the blade similar to the method of optical reflectometry in the frequency domain, the fiber-optic method, the method of direct measurement of light, and the method based on the total internal reflection of light.
For remote icing diagnostics, such methods can be used similar to the video recording method, the method based on total internal reflection of light, the method of infrared spectroscopy, the absorption optical method, and the method based on structured lighting.

6. Conclusions

In this review, we have analyzed various methods for determining ice formation: indirect, direct, and optical, in order to give a brief description and compare their effectiveness.
The presented review shows that optical methods are highly promising for the diagnostics of icing on the blades of a wind turbine. They are applicable for measuring the key parameters during the ice formation on the blades, such as the presence, type, location, thickness, and speed of ice growth on the blade surface. They have a high sensitivity to ice growth and a high speed. Sensors based on optical diagnostic methods can be either mounted on a large surface of the blade of a wind turbine, or they can make remote measurements, complementing already installed sensors.

Author Contributions

Conceptualization, I.K. and V.O.; writing—original draft preparation, I.K.; writing—review and editing, I.K., S.D., M.G., S.K., V.L., G.G., V.Z. and V.O.; supervision, V.O.; project administration, I.K.; funding acquisition, I.K. All authors have read and agreed to the published version of the manuscript.

Funding

This research was funded by Russian Science Foundation, grant number 21-19-00205. https://rscf.ru/grant/21-19-00205/.

Institutional Review Board Statement

Not applicable.

Informed Consent Statement

Not applicable.

Data Availability Statement

Not applicable.

Acknowledgments

The study is a part of the international academic and research program for studying the icing of constructions in cold regions CoARICE.

Conflicts of Interest

The authors declare no conflict of interest.

References

  1. Wind Europe. Wind Energy in Europe: Scenarios for 2030. Report. Available online: https://windeurope.org/wp-content/uploads/files/about-wind/reports/Wind-energy-in-Europe-Scenarios-for-2030.pdf (accessed on 24 August 2021).
  2. National Energy Board. Canada’s Energy Future: Energy Supply and Demand Projections to 2035, an Energy Market. Available online: https://www.cer-rec.gc.ca/en/data-analysis/canada-energy-future/archive/2011/nrgsppldmndprjctn2035-eng.pdf (accessed on 24 August 2021).
  3. Technical Research Centre of Finland (VTT). Cold Climate Wind Energy Showing Huge Potential. Science Daily. 2013. Available online: https://www.sciencedaily.com/releases/2013/05/130528091611.htm (accessed on 24 August 2021).
  4. Kabardin, I.K. Development and Application of Optical-Laser Techniques for Improving the Efficiency of Wind Generators. Ph.D. Thesis, Minisy of Education of Russian Federation, Novosibirsk, Russia, 30 January 2015. [Google Scholar]
  5. Etemaddar, M.; Hansen, M.O.L.; Moan, T. Wind turbine aerodynamic response under atmospheric icing conditions. Wind Energy 2014, 17, 241–265. [Google Scholar] [CrossRef]
  6. Tammelin, B.; Böhringer, A.; Cavaliere, M.; Holttinen, H.; Morgan, C.; Seifert, H.; Säntti, K.; Vølund, P. Wind Energy Production in Cold Climate (WECO); Finnish Meteorological Institute: Helsinki, Finland, 2000; Available online: https://backend.orbit.dtu.dk/ws/portalfiles/portal/167477321/26134.pdf (accessed on 24 August 2021).
  7. Jasinski, W.J.; Noe, S.C.; Selig, M.S.; Bragg, M.B. Wind turbine performance under icing conditions. Trans. ASME J. Sol. Energy Eng. 1998, 120, 60–65. [Google Scholar] [CrossRef]
  8. Turkia, V.; Huttunen, S.; Thomas, W. Method for Estimating Wind Turbine Production Losses Due to Icing; VTT Technical Research Centre of Finland: Espo, Finland, 2013; Available online: https://www.vttresearch.com/sites/default/files/pdf/technology/2013/T114.pdf (accessed on 24 August 2021).
  9. Homola, M. Impacts and Causes of Icing on Wind Turbines; Narvik University College: Narvik, Norway, 2005; pp. 1–15. Available online: https://www.yumpu.com/en/document/read/20800745/impacts-and-causes-of-icing-on-wind-turbines (accessed on 24 August 2021).
  10. Siefert, H. Technical requirements for rotor blades operating in cold climate. Wind. Eng. 2003, 23, 69–79. [Google Scholar]
  11. Homola, M.C.; Nicklasson, P.B.; Sundsbø, A. Ice sensors for wind turbines. Cold Reg. Sci. Technol. 2006, 6, 125–131. [Google Scholar] [CrossRef]
  12. Madi, E.; Pope, K.; Huang, W.; Iqbal, K. A review of integrating ice detection and mitigation for wind turbine blades. Renew. Sustain. Energy Rev. 2019, 103, 269–281. [Google Scholar] [CrossRef]
  13. Wei, K.; Yang, Y.; Zuo, H.; Zhong, D. A review on ice detection technology and ice elimination technology for wind turbine. Wind Energy 2020, 23, 433–457. [Google Scholar] [CrossRef]
  14. Battisti, L. Wind turbines in cold climates: Icing impacts and mitigation systems. In Green Energy and Technology; Springer: New York, NY, USA, 2015. [Google Scholar]
  15. Mughal, U.; Virk, M.; Mustafa, M. State of the art review of atmospheric icing sensors. Sens. Transducers 2016, 198, 2–15. [Google Scholar]
  16. Rastayesh, S.; Long, L.; Dalsgaard Sørensen, J.; Thöns, S. Risk assessment and value of action analysis for icing conditions of wind turbines close to highways. Energies 2019, 12, 2653. [Google Scholar] [CrossRef] [Green Version]
  17. Zhang, L.; Liu, K.; Wang, Y.; Omariba, Z.B. Ice detection model of wind turbine blades based on random forest classifier. Energies 2018, 11, 2548. [Google Scholar] [CrossRef] [Green Version]
  18. Makkonen, L.; Laakso, T.; Säntti, K. Humidity in icing conditions. In Proceedings of the 2005 BOREAS VII, Saariselkä, Finland, 7–8 March 2005. [Google Scholar]
  19. Vetelino, K.A.; Story, P.R.; Mileham, R.D.; Galipeau, D.W. Improved dew point measurements based on a SAW sensor. Sens. Actuators 1996, 35, 198. [Google Scholar] [CrossRef]
  20. Laakso, T.; Holttinen, H.; Ronsten, G.; Tallhaug, L.; Horbaty, R.; Baring-gould, I.; Lacroix, A.; Peltola, E.; Tammelin, B. State-of-the-Art of Wind Energy in Cold Climates. 2003. Available online: https://www.semanticscholar.org/paper/State-of-the-art-of-wind-energy-in-cold-climates-Wallenius/1843e7da6ad95c6ceee0d6ee8278846dec79a97a64 (accessed on 20 August 2021).
  21. Carlsson, V. Measuring Routines of Ice Accretion for Wind Turbine Applications: The Correlation of Production Losses and Detection of Ice; Umeå University: Umeå, Sweden, 2010; Available online: https://www.diva-portal.org/smash/get/diva2:370953/FULLTEXT01.pdfViktor (accessed on 20 August 2021).
  22. Craig, D.; Craig, D. An investigation of icing events on Haeckel hill. In Proceedings of the 1995 BOREAS III Conference, Saariselkä, Finland, 19–21 March 1996; pp. 149–155. [Google Scholar]
  23. Roberge, P.; Lemay, J.; Ruel, J.; Bégin-Drolet, A. A new atmospheric icing detector based on thermally heated cylindrical probes for wind turbine applications. Cold Reg. Sci. Technol. 2018, 148, 131–141. [Google Scholar] [CrossRef]
  24. Skrimpas, G.A.; Kleani, K.; Mijatovic, N.; Sweeney, C.W.; Jensen, B.B.; Holboell, J. Detection of icing on wind turbine blades by means of vibration and power curve analysis. Wind Energy 2016, 19, 1819–1832. [Google Scholar] [CrossRef]
  25. Björkman, M. Long time measurements of noise from wind turbines. J. Sound Vib. 2004, 277, 567–572. [Google Scholar] [CrossRef]
  26. Szasz, R.Z.; Ronnfors, M.; Revstedt, J. Influence of ice accretion on the noise generated by an airfoil section. Int. J. Heat Fluid Flow 2016, 62, 83–92. [Google Scholar] [CrossRef]
  27. Luukkala, M. Detector for Indicating Ice Formation on the Wing of an Aircraft. U.S. Patent 5,467,944, 21 November 1995. [Google Scholar]
  28. Venna, S.; Lin, Y.J.; Botura, G. Piezoelectric transducer actuated leading edge de-icing with simultaneous shear and impulse forces. J. Aircr. 2007, 44, 509–515. [Google Scholar] [CrossRef]
  29. Wang, P.; Zhou, W.; Bao, Y. Ice monitoring of a full—Scale wind turbine blade using ultrasonic guided waves under varying temperature conditions. Struct. Control. Health Monit. 2018, 25, 2138. [Google Scholar] [CrossRef]
  30. Xu, B.; Guo, X.; Chen, H. Active icing monitoring for wind turbine blade models with PZT technology. Piezoelectrics Acoustooptics 2017, 39, 72–76. [Google Scholar]
  31. Xu, B.; Lu, F.; Dyke, S.J.; Guo, X. Icing monitoring for a wind turbine model blade with active PZT technology. In Proceedings of the Earth and Space 2014: Engineering for Extreme Environments, St. Louis, MO, USA, 27–29 October 2014. [Google Scholar] [CrossRef]
  32. Chamuel, J.R. Ultrasonic Aircraft Ice Detector Using Flexural Waves. U.S. Patent 4,461,178, 24 July 1984. [Google Scholar]
  33. Muñoz, C.Q.G.; Jiménez, A.A.; Márquez, F.P.G. Wavelet transforms and pattern recognition on ultrasonic guides waves for frozen surface state diagnosis. Renew. Energy 2018, 116, 42–54. [Google Scholar] [CrossRef]
  34. Ryerson, C.C. Assessment of Superstructure Ice Protection as Applied to Offshore Oil Operations Safety. 2009. Available online: https://digitalcommons.unl.edu/usarmyresearch/49/ (accessed on 24 August 2021).
  35. MacKenzie, I.K. Method and Apparatus for Measuring Ice Thickness on Substrates Using Backscattering of Gamma Rays. US Patent number 5,821,862, 13 October 1998. [Google Scholar]
  36. Geraldi, J.J.; Hickman, G.A.; Khatkhate, A.A.; Pruzan, D.A. Measuring Ice Distribution on a Surface with Attached Capacitance Electrodes. U.S. Patent number 5,551,288, 20 March 1996. [Google Scholar]
  37. Mughal, U.; Virk, M.S.; Mustafa, M. Electromagnetism based atmospheric ice sensing technique—A conceptual review. Multiphysics 2012, 6, 341–354. [Google Scholar] [CrossRef]
  38. Weinstein, L. Ice Sensor. US Patent number 4,766,369, 23 August 1988. [Google Scholar]
  39. Roggen, A. An overview of dielectric measurements. IEEE Trans. Electr. Insul. 1990, 25, 95–106. [Google Scholar] [CrossRef]
  40. Seegmillar, H. Ice Detector and Deicing Fluid Effectiveness Monitoring System. US Patent 5,523,959, 4 June 1996. [Google Scholar]
  41. Wallace, R.W.; Reich, A.D.; Sweet, D.B.; Rauckhorst, R.L.; Terry, M.J.; Holyfield, M.E. Ice Thickness Detector. U.S. Patent 6,384,611, 7 May 2002. [Google Scholar]
  42. Wang, J.; Wang, J.; Shao, J.; Li, J. Image recognition of icing thickness on power transmission lines based on a least squares hough transform. Energies 2017, 10, 415. [Google Scholar] [CrossRef] [Green Version]
  43. Liu, Y.; Li, Q.; Farzaneh, M.; Du, B.X. Image characteristic extraction of ice-covered outdoor insulator for monitoring icing degree. Energies 2020, 13, 5305. [Google Scholar] [CrossRef]
  44. Shajiee, S.; Pao, L.Y.; Wagner, P.N.; Moore, E.D.; Robert, R. Direct ice sensing and localized closed loop heating for active de-icing of wind turbines blades. In Proceedings of the American Control Conference (ACC), Washington, DC, USA, 17–19 June 2013; pp. 634–639. [Google Scholar]
  45. Ikiades, A.A.; Spasopoulos, D.; Amoiropoulos, K.; Richards, T.; Howard, G.; Pfeil, M. Detection and rate of growth of ice on aerodynamic surfaces using its optical characteristics using its optical characteristics. Aircr. Eng. Aerosp. Technol. 2013, 85, 443–452. [Google Scholar] [CrossRef]
  46. Luo, N.; Vidal, Y.; Acho, L. Advances in Industrial Control: Wind Turbine Control and Monitoring; Springer: Cham, Switzerland, 2014; p. 462. [Google Scholar] [CrossRef]
  47. Feng, C.; Papachristou, C. Grey-model based ice prediction sensor system on wind turbine system. In Proceedings of the Aerospace and Electronics Conference (NAECON), Beijing, China, 9–12 July 2012. [Google Scholar] [CrossRef] [Green Version]
  48. Hackmeister, R.L. Optical Ice Sensors for Wind Turbine—Nacelles Wind Systems Magazine. 2010. Available online: https://www.windsystemsmag.com/optical-ice-sensors-for-wind-turbine-nacelles (accessed on 24 August 2021).
  49. Oberson, P.; Huttner, B.; Guinnard, O.; Guinnard, L.; Ribordy, G.; Gisin, N. Optical frequency domain reflectometry with a narrow linewidth fiber laser. IEEE Photonics Technol. Lett. 2000, 12, 867–869. [Google Scholar] [CrossRef]
  50. Kabardin, I.K.; Rahmanov, V.V.; Meledin, V.G.; Eliseev, I.A.; Dvoinishnikov, S.V. Modified absorption optical method for wavy liqui film diagnostion on a rotational disk. Thermophys. Aeromechanics 2012, 19, 89–95. [Google Scholar]
  51. Alekseenko, S.V.; Bobylev, A.V.; Evseev, A.R.; Karsten, V.M.; Markovich, D.M.; Tarasov, B.V. Measurements of the liquid-film thickness by a fiber-optic probe. Instrum. Exp. Tech. 2003, 46, 260–264. [Google Scholar] [CrossRef]
  52. Clark, M.; McCann, D.; Forde, M. Application of infrared thermography to the nondestructive testing of concrete and masonry bridges. NDT E Int. 2003, 36, 265–275. [Google Scholar] [CrossRef]
  53. Munoz, C.Q.G.; Marquez, F.P.G.; Tomas, S.J. Ice detection using thermal infrared radiometry on wind turbine blades. Measurement 2016, 93, 157–163. [Google Scholar] [CrossRef]
  54. Pappalardo, G.; Mineo, S.; Perriello, Z.S.; Cubito, A.; Calcaterra, D. Infrared thermography proposed for the estimation of the cooling rate index in the remote survey of rock masses. Int. J. Rocket. Mech. Minist. Sci. 2016, 83, 182–196. [Google Scholar] [CrossRef]
  55. Brandt, R.; Bird, C.; Neuer, G. Emissivity reference paints for high temperature applications. Measurement 2008, 41, 731–736. [Google Scholar] [CrossRef]
  56. Honnerova, P.; Vesely, Z.; Honner, M. Experimental mathematical model as a generalization of sensitivity analysis of high temperature spectral emissivity measurement method. Measurement 2016, 90, 475–482. [Google Scholar] [CrossRef]
  57. Ferrara, L.M.; Persechino, C.; Bishop, P. Remote sensing in environmental police investigations: Aerial platforms and an innovative application of thermography to detect several illegal activities. Environ. Monit. Assess. 2014, 186, 8291–8301. [Google Scholar] [CrossRef]
  58. Kabardin, I.K.; Dvoinishnikov, S.V.; Meledin, V.G.; Naumov, I.V. Remote monitoring of ice loading on wind turbine blades based on total internal reflection. J. Eng. Thermophys. 2016, 4, 504–508. [Google Scholar] [CrossRef]
  59. Gagnon, R.E.; Groves, J.; Pearson, W. Remote ice detection equipment—RIDE. Cold Reg. Sci. Technol. 2012, 72, 1–16. [Google Scholar] [CrossRef]
  60. Kabardin, I.K.; Naumov, V.G.; Dvoinishnikov, S.V. Optical Method for Measuring the Field of Thickness of the Clear Ice on the Blades of the Wind Generator. RU Patent 2644625, 15 August 2016. [Google Scholar]
  61. Zhang, K.; Wei, T.; Hu, H. An experimental investigation on the surface water transport process over an airfoil by using a digital image projection technique. Exp. Fluids 2015, 56, 1–16. [Google Scholar] [CrossRef]
  62. Gao, L.; Veerakumar, R.; Liu, Y.; Hu, H. Quantification of the 3D shapes of the ice structures accreted on a wind turbine airfoil model. Vis. Soc. Jpn. 2019, 22, 661–667. [Google Scholar] [CrossRef]
  63. Gao, L.; Liu, Y.; Hu, H. An experimental investigation on the dynamic glaze ice accretion process over a wind turbine airfoil surface. Int. J. Heat Mass Transf. 2020, 149, 119120. [Google Scholar] [CrossRef]
  64. Lee, S.; Broeren, A.; Addy, H.; Sills, R.; Pifer, E. Development of 3D ice accretion measurement method. In Proceedings of the 4th AIAA Atnisoheric and space Environment Conference, New Orleans, LA, USA, 5–28 June 2012; pp. 1–17. [Google Scholar]
  65. Dvoinishnikov, S.V.; Anikin, Y.A.; Kabardin, I.K.; Kulikov, D.V.; Meledin, V.G. An optoelectronic method of contactless measurement of the profile of the surface of large complexly shaped objects. Meas. Tech. 2016, 59, 1. [Google Scholar] [CrossRef]
  66. Dvoynishnikov, S.V.; Rakhmanov, V.V.; Kabardin, I.K.; Meledin, V.G. Phase triangulation method with spatial modulation frequency optimization. Meas. J. Int. Meas. Confed. 2019, 145, 63–70. [Google Scholar] [CrossRef]
  67. Dvoinishnikov, S.V.; Meledin, V.G.; Shepihin, I.V.; Kabardin, I.K.; Kulikov, D.V. Method for measuring three-dimensional geometry of convex and extended objects. RU 2708940 C1, 15 January 2019. [Google Scholar]
  68. Gong, X.; Bansmer, S. Laser scanning applied for ice shape measurements. Cold Reg. Sci. Technol. 2015, 115, 64–76. [Google Scholar] [CrossRef]
Figure 1. The optical frequency domain reflectometry ice detector [12,44].
Energies 14 06485 g001
Figure 2. Block diagram (a) of a single-fiber circuit; (b) a modified two-fiber diagram (1) of a He-NE laser, (2) of a Wollaston prism, (3,7) of volumetric lenses, (4) of an optical fiber, (5) of a sleeve, (6) a plate, (8) a receiving optical fiber, (9) a photodetector unit (10) a personal computer, and (11) a halogen incandescent lamp.
Energies 14 06485 g002
Figure 3. Infrared ice sensing technique setup [12,47].
Energies 14 06485 g003
Figure 4. The principle of the total internal reflection method. (a) The beam path in the icing layer above the light scattering surface is shown. (b) As a result of refraction and reflection at the interface, an image shaped like a circle appears.
Energies 14 06485 g004
Figure 5. A schematic diagram of the principle of the digital image projection method [61].
Energies 14 06485 g005
Figure 6. Functional diagram of the measuring complex of the phase triangulation method [63]. 1—light source, 2—control object, 3—the camera; PC—personal computer; DB—database.
Energies 14 06485 g006
Table 1. The advantages and disadvantages of optical measurement methods.
The Method NameAdvantagesDisadvantages
The video recording methodSimple, capable to measure the ice present, in combination with image processing methods can measure several geometric parametersDoes not measure thickness, does not measure transparent glaze parameters
The method of optical reflectometryHigh accuracy, determining the type and presence of ice, high sensitivity, low time response, high resolution, durable, can be integrated into the wind turbineHigh cost, commercial inaccessibility
The absorption optical methodRemote measurements, accurate field ice thickness, the method speed is limited only by the recording camera.Cannot be mounted into, works only for transparent icing
The fiber-optic methodAccuracy of measuring the ice thickness, high sensitivity, low time response, high resolution, durable, can be integrated into the wind turbineHigh cost, commercial inaccessibility
The method of infrared spectroscopyPossibility of remote measurements, high speed, high resolution, wide dynamic range, high sensitivity, high accuracy, ice presence and type detection, easy sensor installing and refitting Low temperature measurement accuracy, motion significantly affects the measured data and its accuracy
The method of total internal light reflection Accurate field measurements of ice thickness, remote measurements, and mounting into the wind turbine blade Works only for transparent icing
The digital image projection methodIce location, ice thickness and ice growth measurements, high accuracy, remote measurements Cannot be embedded into the blade, works only for non-transparent icing
The phase triangulation methodIce location, thickness and growth measurements, high accuracy, remote measurements, resistance to defocusing of the projected and detected optical images Cannot be embedded into the blade, works only for non-transparent icing
Publisher’s Note: MDPI stays neutral with regard to jurisdictional claims in published maps and institutional affiliations.

