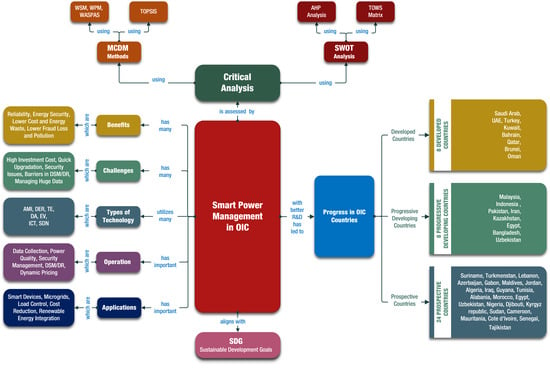
Article

Smart Power Management in OIC Countries: A Critical Overview Using SWOT-AHP and Hybrid MCDM Analysis

by
K. Habibul Kabir
1,*,
Shafquat Yasar Aurko
1 and
Md. Saifur Rahman
2,*
1
Department of Electrical and Electronic Engineering, Islamic University of Technology (IUT), Dhaka 1704, Bangladesh
2
Department of Electrical and Electronic Engineering, Bangladesh University of Engineering and Technology (BUET), Dhaka 1205, Bangladesh
*
Authors to whom correspondence should be addressed.
Energies 2021, 14(20), 6480; https://doi.org/10.3390/en14206480
Submission received: 12 August 2021 / Revised: 24 September 2021 / Accepted: 27 September 2021 / Published: 10 October 2021
(This article belongs to the Special Issue Smart Power Management of Renewable Power System)

Abstract

:
A conventional electrical grid mostly depends on the electrical power generated from fossil fuels. However, the pollutants from fossil fuels are the key factors for adverse climate change. Most of the developed countries of the world have already recognized the fact that the energy mix requires to be diversified by incorporating renewable energy. This is especially relevant for a good number of the member countries of the Organization of Islamic Cooperation (OIC), as much of their electric power is still generated from fossil fuels due to the relative abundance of fossil fuels in those countries. In order to integrate renewable energy sources into the hybrid energy mix, an existing conventional grid needs to undergo drastic changes. Alongside this, the population boom in the OIC member countries has caused higher demand for a steady supply of electricity that the conventional grids have long been struggling to cope with. With a view to solving this multifaceted problem, incorporation of the smart power management schemes is indispensable using a smart electrical grid, where information and communications technology is integrated into its major building blocks. This allows advanced applications of a grid, such as the formation of micro-grids, demand-side management, energy storage, high-tech power electronic converters, etc. As the smart grids are being adopted by many developed countries, it is high time for the OIC member countries to pay due attention to this development, if they have not already done so. This paper explains, with special focus on the OIC member countries, the various smart power management technologies, their operations and applications, and the benefits and challenges. Then, it goes on to carry out the Strength–Weakness–Opportunity–Threat with Analytical-Heuristic-Procedure (SWOT-AHP) analysis to evaluate its feasibility of incorporation and the underlying strategies appropriate for its implementation. Furthermore, a Hybrid Multi-Criteria-Decision-Making (MCDM) analysis is performed to evaluate the sequence of the emphasis that should be given on each of the technologies from those available for the smart power management initiative. Finally, the study reinforces the stance by drawing parallels from the UN Sustainable Development Goals (SDG) and highlights the importance of the smart grid in line with the global vision of SDG. This paper aims at assisting the decision-makers in implementing smart power management schemes in the OIC member countries, in particular, and other countries of the world, in general.

Graphical Abstract

1. Introduction

Electricity is the lifeblood of modern civilization. In today’s world, almost every form of technology that defines personal and social life is in some form or another dependent on electricity. In fact, if there was a sudden interruption in the supply of electricity, the civilization would come to a halt. Therefore, if electricity is the lifeblood of civilization, then an electrical grid is the heart, which emphasizes the importance of efficient power management in a grid.
The electricity supply comes from the power plants that generate electricity. An electrical network, consisting of transmission lines, transformers, and substations which connects every consumer is referred to as an electrical grid [1]. It is the intricate infrastructure that delivers electrical energy from its sources of generation to its destination [2]. A conventional electrical grid that most countries depend on is nearly a century old system that relies on one way communication with the consumers. As the number of consumers continue to grow exponentially and their demands continue to grow ever more complex, it is clear that the conventional grid system is quickly becoming insufficient for modern needs. Adding to this, a conventional grid is a centralized system that is poorly suited for integrating renewable energy resources and is heavily dependent on the fossil fuel power stations. Generating power from fossil fuels releases carbon dioxide as well as other pollutant gases, which leads to the green house effect and global warming, aggravating the negative climate change which is a major concern for the whole world at present. In addition, the fossil fuel reserves are finite in supply and are expected to reach critical limits within a foreseeable future [3]. If we do not suitably integrate renewable energy into the hybrid energy mix, the global climate is going to face massive deterioration and a serious energy crisis would arise in the future. With that in mind, an electrical grid has to be remodeled or upgraded in a way so that it can reliably support distributed renewable energy resources. It is but one of the many limitations and drawbacks of a conventional electrical grid [4], which can be solved by incorporating smart power management schemes using a smart grid.
Smart power management, in theory, is set to fill in the loopholes of a conventional grid and make it better adaptable for the future hybrid energy mix. It essentially facilitates a two-way communication system so that the utilities can know exactly how and when a consumer requires electricity. Its main aim is to reduce the costs of both the consumers and the utilities as well as to distribute the electricity in the most sustainable way. It does this by utilizing its two-way communication facility by implementing demand side management and integrates renewable energy resources such as solar and wind with the help of the energy storage systems and power electronic converters. The inclusion of distributed energy resources allows micro-grids to be installed because of the smart power management features. It also facilitates the efficient inclusion of electric vehicle charging infrastructure into a grid. The inclusion of the smart power management schemes into a conventional grid transforms it into a ‘smart grid’.
The focus of this paper is on the member states of the Organization of Islamic Cooperation (OIC), consisting of 57 countries, many of which (e.g., the wealthy Gulf Arab countries, as well as some of the lesser developed countries of the Middle East, and North Africa) have rich reserves of fossil fuels at present. This is because most of the OIC member countries are now going through a period of development, and thus have an urgent need to tackle the challenges of climate change, the energy crisis, and supplying its growing number of consumers. Therefore, it is expected that these countries are most likely to move towards implementing the smart grid systems.
Figure 1 illustrates and summarizes the structure of this paper using the concept mapping approach.
The goal of this paper is to explore the feasibility of and identify the appropriate procedures for incorporation of the smart power management schemes into the electrical grids of the OIC member countries. With this end in view, this paper has a threefold objective.
The first objective is to give an overview on the importance of smart power management schemes and to describe its various technological features and functions. This is approached by first giving a brief overview, in Section 2, on the steps being taken by the developed as well as developing countries within the Organization of Islamic Cooperation (OIC). This is followed by exploring the benefits for the OIC member countries in adopting smart power management schemes in Section 3 and the underlying challenges in Section 4. The relevant technologies are then covered in Section 5, followed by the operations and applications of the technologies, in Section 6 and Section 7, respectively.
The second objective is to evaluate the feasibility of upgrading to smart grids from the conventional ones, in the OIC member countries, through some critical analyses which are described in Section 8. The analysis is first performed by carrying out a qualitative Strength–Weakness–Opportunity–Threat test along with the Analytical-Heuristic-Procedure (SWOT-AHP) analysis, which is discussed in Section 9.
The third objective is to evaluate the various technologies of the smart power management schemes on the basis of the importance of their applications, so as to suggest to the policy makers in the OIC member countries, the relative emphasis that should be given to each technology for a smooth transition into the smart power management initiative. This critical analysis is performed through Hybrid Multi-Criteria-Decision-Making (MCDM) analysis in Section 10.
To reinforce the positive drive towards implementing the smart power management initiatives, Section 11 covers the United Nations Sustainable Development Goals (SDG) and explains how they align with the smart grids and smart power management initiatives.
Finally, Section 12 concludes the findings of the analyses and puts forward some suggestions for incorporation of the smart grids into the OIC member countries, based on the results of the critical analyses, followed by the References section at the end.

2. Advances of OIC Countries in the Implementation of Smart Power Management

In many of the world’s developed countries, much progress has been made in the process of upgrading their traditional grid into a smart one. While much of this is in the form of ever-increasing investments, there have also been efforts to implement it practically on a small scale.
Many of the non-OIC countries are leading the way for smart grid development; some of these include the USA, Canada, UK, France, Australia, Denmark, Germany, Republic of Korea, Japan, China, India, etc. [5]. This is summarized in Table 1.
Many OIC countries have already started the development and deployment of smart power management schemes, although, as of now, the scale of implementation in comparison with many non-OIC countries is lower.
Figure 2 illustrates the OIC countries and non-OIC developed countries on the world map that are undertaking steps in the development and deployment of smart power management according to the smart grids country report 2019 [5], and emerging markets smart grid outlook 2015 [7] and 2019 [8].
Table 2 summarizes the advances made by the OIC countries in implementing the smart power management schemes which are discussed as follows.

2.1. Developed OIC Countries

Some of the developed countries within the OIC have already started taking steps towards the development of smart power management schemes.

2.1.1. Saudi Arabia

The implementation of smart power management in Saudi Arabia, which is one of the few developed countries within the OIC, has only just begun, with the increasing peak demand pushing the need for an efficient smart electrical grid. The Electricity and Co-Generation Regulatory Authority (ECRA) and the Saudi Electricity Company (SEC) both have strategies relating to smart grid implementation. These include the developments in Information and Communication Technology (ICT), Wide Area Network and smart meters, or Advanced Metering Infrastructure (AMI) in the grid [5].

2.1.2. UAE

The smart grid market of the UAE, another developed country in the OIC, is expected to have a growth rate of 2.5 percent between 2020 and 2025 [9]. This is because, in the UAE, the electrical power consumption is increasing rapidly and the present electrical grid would soon prove inadequate to support the huge networks of power consumption. Besides this, the Vision 2030 of the country aims at making the country cleaner, more sustainable, and well connected [37]. Having an intelligent grid that can cut losses and manage complex loads is therefore a big part of the solution. Various steps are already being taken in that direction; for example, over a million slated smart meter installations have taken place across Dubai from 2016. The smart meter market is set to see a significant rise in the near future due to increasing government support and investments [9].

2.1.3. Turkey

Turkey is one of the developed countries within the OIC, which has already started its smart grid implementation efforts. Its electricity distribution authority plans to replace 80% of its existing conventional electric meters with smart meters by 2035 [38]. Although any major implementation project is yet to be planned, small scale projects that utilize distributed energy into the grid as well as improvements in the distribution system are already in effect. It already has a head start in the renewable energy implementation, as it is the biggest user of renewable energy among the OIC member countries [10]. Turkey has already set a roadmap for its smart grid vision for 2035, and major smart grid projects are planned to be undertaken from 2023 [11].

2.1.4. Kuwait

Kuwait has begun an ambitious drive to develop AMI in order to maximize the ease of control of their citizens by enabling them greater interaction with the utilities. In line with New Kuwait Vision 2035 goals of effective governance, the utilities have deployed over 1 million smart meters [12]. It is partnering up with private corporations to support its initiative [13], and is also collaborating with the EU for the effective deployment of AMI and the associated ICT features [14]. It also has plans to reduce dependence on fossil fuels, and renewable energy penetration into the energy mix is expected to rise to 3% in 2020 [15].

2.1.5. Bahrain

Bahrain has begun trying to reduce its dependence on oil and to focus on renewable energy. To integrate renewable energy resources into the grid, it has recognized a smart power management initiative as an undeniable necessity. The AMI technology of Bahrain is already well developed, with about 20% households in the country having installed smart meters [16]. However, the sensors, customer side systems, and renewable energy resources are still limited, and the government is formulating national strategies to adopt smart power management schemes on a wider scale [16]. The Bahrain Sustainable Energy Unit (SEU) has been set up by the government for the development of policies and strategies to deploy the smart power management technologies. Cooperation with private corporations is slated to be used to develop the final plan [17].

2.1.6. Qatar

Qatar is planning a nationwide rollout of smart grid technologies. Over 600,000 smart meters are to be set up complete with communication technologies and Internet of Things (IoT), in cooperation with private corporations [18]. Smart grid implementation projects are being undertaken by the universities, notably the Qatar Environment and Energy Research Institute (QUEERI) of Hamad Bin Khalifa University, with the collaboration of the KAHRAMAA, Qatar Electricity and Water Company, Qatar Petroleum, and the Qatar Meteorological Department [39]. Qatar had a goal of setting up 1 GW solar panels by 2020 [19]. It has launched a Demand Side Management (DSM) program called Tarsheed. It is also installing charging stations to integrate electric vehicle charging infrastructure into the grid [19].

2.1.7. Brunei

Brunei has a very high GDP and low population, thus allowing them to spend on improving the quality of life of its citizens. Implementation of smart power management is a step in that direction. The country has already started initiatives to deploy smart meters in every residential household in the country, which will be installed free of cost. Started in 2017, more than 200,000 smart meters are set to be deployed all over the country [20].

2.1.8. Oman

It is investing on developing renewable energy integration. Large solar fields are being built. It has already installed a large number of smart meters in select urban areas, undertaken by the Omani Nama Group along with international corporations such as Cesi and Wipro [21]. In addition, 25,520 AMR devices are installed so far in the capital Musqat [40].

2.2. Progressive Developing OIC Countries

While developing countries are expectedly behind the developed OIC countries in smart grid development and implementation, many of them are exceptions to this. Some have even surpassed other developed OIC countries in smart grid implementation, as may be seen below.

2.2.1. Malaysia

At present, Malaysia generates 6% of its energy from renewable sources. The country has targeted to produce one fifth of its energy from renewable energy resources by 2025. Incorporation of smart grid is indispensable in order to bring this plan to fruition. Tenaga Nasional Berhad (TNB), the largest electricity utility in Malaysia, is rapidly installing AMI across peninsular Malaysia. By 2026, almost 9.1 million smart meters is planned to be installed in the residential areas of the peninsula. The government is also taking measures to provide incentives to households for adopting renewable energy [22].

2.2.2. Indonesia

Indonesia plans to include renewable energy into its electricity mix to about 23% by 2025. For this to happen, the development of smart power management schemes is a necessity. Perusahaan Listrik Negara (PLN), the state owned electricity distribution corporation, has carried out several pilot smart grid projects to that end. In addition, the National Medium Term Development Plan (RPJPM) has targeted to develop five more smart grid systems from 2020 to 2024, raising the number of running smart grid systems to 25 by 2024. The implementation is first supposed to focus on boosting reliability, system efficiency, customer experience, and grid productivity [23].

2.2.3. Pakistan

Pakistan has secured funds for the development in multiple areas of smart grid technologies. This includes the development of AMI, distribution enhancement as well as sustainable technologies, receiving 800 million USD, 400 million USD and 400 million USD, respectively. In addition, 40,000 smart meters have been installed in both the residential and industrial areas in three cities. Multan Electric Power Company (Mepco) has completed another USAID backed project in Multan, and have already helped enhance the efficiency, and the utility to save 18.9 million USD [24].

2.2.4. Iran

Iran began its smart grid deployment program with implementation of AMI pilot projects in December 2011, with a plan to deploy 5 million smart meters with the goal of reducing network losses in the grid by 14 percent by the time of the project’s completion [41]. At present, the government is focusing on the smart meter and AMI development, spearheaded by the National Smart Metering System project (called FAHAM) [25]. The government of Iran aims to transform its present conventional electrical grid into a smart grid by incorporating the smart power management technologies by 2025 [25]. Renewable energy sources contributed to only 2% of the country’s energy mix in 2017 [3], but this has grown to 6% in 2019. The policy makers in Iran are planning to increase the share of renewable energy markedly into the energy mix [26].

2.2.5. Kazakhstan

The Ministry of Energy of Kazakhstan is leading a campaign to implement smart power management schemes into the grid. A pilot project was launched in 2017, with the aim to improve the power quality of parts of the grid [27]. It is also developing and expanding renewable energy sector, and is also cooperating with private enterprises with the deployment of energy storage as a complement to it [28].

2.2.6. Egypt

The Egyptian government corporation, the Egyptian Electricity Holding Company (EEHC), has signed a contract of 287.5 million USD with the French industrial group Schneider Electric for the implementation of a massive smart grid project. It entails the construction of four control centers, more than 12,000 smart ring units and upgrading 1000 distribution points. The aim is to improve the grid efficiency and sustainability. Once completed, it would be the first country-wide smart grid project in the region [29].

2.2.7. Bangladesh

Bangladesh is witnessing a rising demand for renewable energy, especially, in the rural areas, solar panels are seeing massive implementation in individual houses, which has led to it being the global leader in solar home system implementation. From 2003 onwards, over 4.1 million solar home systems were deployed. These are responsible for supplying electricity to over 20 million people, including residential homes, businesses, and institutions [30]. It is already creating a demand for smart power management initiatives.

2.2.8. Uzbekistan

Uzbekistan has also started investing in smart power management initiative. By 2021, 8 million smart meters are set to be installed in fourteen different states. A control center for the millions of smart meters has been established with the cooperation of South Korea [31].

2.3. Prospective OIC Countries for Smart Power Management

It has been shown in the previous subsections how many of the developed and developing OIC countries are taking part in the drive to implement smart power management schemes in their respective countries. While many OIC countries are still to take any significant move in this direction, nonetheless they are strong candidates for the effective implementation of smart power management schemes. These are referred to here as prospective countries for incorporating the smart power management initiatives. These include Nigeria [32], Cameroon [33], Morocco [34], Algeria [35], and Jordan [36], who have already taken steps in renewable energy integration, and are soon to face the demand to upgrade their grids with smart power management schemes. Other countries that supposedly have potentials in renewable energy include Suriname, Turkmenistan, Lebanon, Azerbaijan, Gabon, Maldives, Iraq, Guyana, Tunisia, Albania, Djibouti, Kyrgyz republic, Sudan, Mauritania, Cote d’lvoire, Senegal, and Tajikistan. The fact that most of the OIC member countries lie around the equator or otherwise in warm climates gives them a distinct advantage in renewable energy generation in the area of solar energy, as they get long sunshine hours and intensity. As more and more OIC countries intensify efforts to adopt renewable energy, smart power management initiatives come as the natural demand for them in order to develop their electrical grids.

2.4. Underdeveloped Countries or Countries in War

Unfortunately, a good number of OIC countries are underdeveloped and hence unable to properly invest in development. A few others are in a state of war or conflict. These are Comoros, Benin, Chad, Guinea, Burkina Faso, Afghanistan, Uganda, Mali, Togo, the Gambia, Niger, Ivory Coast, Yemen, Somalia, Libya, West Bank, and Sierra Leone. Despite this, many of these countries have very good potentials in renewable energy generation, such as Afghanistan and Somalia. Renewable energy and smart power management initiatives are soon to become a viable option for these countries as they slowly rise out of poverty and unrest.
With the knowledge that many OIC countries are indeed taking the smart power management initiative seriously, the reasons behind this drive can now be explored. In the next section, the benefits that the smart power management initiative would bring about for all the OIC countries are explained, especially, for those that have yet to work on it.

3. Benefits of Smart Power Management Initiatives for OIC Countries

In the previous section, it has been shown how the developed countries are striving for upgrading their conventional grids into the smart grids, and how the implementation of smart grids has already started taking place in many of these countries. A few of the developed OIC countries are also among the countries that are leading in this effort. However, most of the other countries of the OIC are still lagging far behind in developing and implementing the smart grids. This section covers the benefits that the OIC countries are sure to enjoy if the smart power management initiative is indeed implemented in their respective countries. The summary of the benefits of the smart power management schemes in the OIC countries are given in Table 3, and the details are as follows.

3.1. Lower Electricity Cost for Consumers

The average per capita income in the OIC countries is a little over 10,000 USD as reported in 2019 [43]. It is behind many non-OIC countries, even in growth rate, which is 17%, while the non-OIC countries have a growth rate of 41.1% [43]. As the OIC countries veer towards development, their cost of electricity per household presents a significant obstacle in the growth of the income per person. The smart grid system allows the consumers to reduce costs themselves in a number of ways. First, through Demand Response (DR), where they can connect non-essential loads at a time when the price of electricity is lower. Second, through home-based electricity generation, such as rooftop solar panels that the smart grid can accommodate. Moreover, these solar and wind systems are undergoing a major drop in price due to technological advancements and economies of scale and have now become competitive with fossil fuels [10]. The smart power management (the case of smart meters only) implementation projects today yield almost twice the benefits compared to the costs [42]. A significant decrease in the electricity bills is sure to be a big boost to the net income per household and would help raise the GDP of the country.

3.2. Lower Expenditures for the Utility

Higher energy efficiency and a more effective management lead to increased cost savings in the utility if smart power management scheme is implemented. According to a study in the US, the Net Present Value (NPV) of the benefits to the utilities due to the investments on smart grids and sustainable technologies is 20 to 25 billion USD [42]. In the OIC countries, it is sure to save significant expenditures of the country and allow the government to focus on other areas of development. In the Middle East and North Africa (MENA) region, studies show that a Net Present Value (NPV) of 300 million USD to 1 billion USD could be saved per year by implementing the smart grids [42].

3.3. Increased Reliability of Electricity

Many OIC countries struggle to supply electricity to all its citizens. The situation is worse, especially in the Sub-Saharan Africa and South Asia, and this causes setbacks in the way of development of the countries in these regions [10]. The implementation of smart grids leads to smart management of the electrical power distribution. As a result of two-way communication, the loads can be shifted to reduce the peak load consumption. This reduces excessive pressure on the grid by reducing the peak demand, thereby resulting in lesser power outages. Not only does this increase the comfort of individual citizens, but also results in an increase in the productivity of the country as a whole. Thus, this complements the goals of the OIC countries on the path to development.

3.4. Increased Energy Security

The OIC countries hold almost two-thirds of the world’s fossil fuels (natural gas and crude oil) [44]. Needless to say, at present, fossil fuels produce the majority of the energy that is consumed by the OIC countries. However, fossil fuels are in limited supply. The smart power management feature is able to integrate renewable energy sources through Distributed Generation (DG), thus reducing the reliance on fossil fuels. This is sure to help increase energy security in the future. At present, the share of the OIC countries in the global renewable energy capacity is very low, at about 2% in 2017 [10]. With most of the OIC countries, now realizing the importance of Renewable Energy Sources (RESs), the situation has begun to change.

3.5. Preventing Energy Waste

Energy access efficiency is low in many of the developing countries of the OIC [45]. A lot of energy is lost due to inefficiency of the conventional grids. The energy losses in the transmission and distribution can be mitigated by Distribution Automation (DA) and Transmission Enhancement (TE) strategies. In addition, the introduction of Demand Side Management (DSM) means that the inessential loads on the consumer side are switched off, mostly as chosen by the consumer. All these measures reduce the waste of energy as well as the consumption.

3.6. Reduced Losses through Fraud Detection

At present, a conventional grid is subjected to a lot of energy thefts. It is estimated that about 96 billion USD worth electricity is lost every year globally owing to theft [46]. This is expected to be significantly higher in many of the OIC countries as they are more likely to lag behind others in security measures. While this does not have any negative impact on the utilities, it results in an increase in the price of electricity, thus increasing the cost of the customers. The smart grid, on the other hand, makes it very difficult to commit theft. This is because most of the equipment involved in a smart grid is connected through Internet of Things (IoT) and are under constant monitoring. Smart meters are also equipped to alert the security in case of physical tampering.

3.7. Air Pollution and Adverse Climate Change Reduced

The OIC countries lag behind the developed world in terms of their air quality, as the air quality index of the OIC countries is 65.8, while that of the developed world is 87.7 [47]. This score of the OIC countries is also behind that of the world average. In particular, the regions of South Asia and Sub-Saharan Africa are doing particularly worse [47]. This problem is only going to be aggravated, as these countries accelerate in the path of industrialization. The smart power management scheme allows the incorporation of renewable energy resources into the grid. Not relying on fossil fuels means that carbon emissions are greatly cut down, as well as the other harmful gases that are produced as a by-product of energy generation from fossil fuels. This then serves to reduce the greenhouse effect and global warming. Given the fact that many of the OIC countries, especially, those on the coastline, are at major risk of suffering the brunt of the calamities caused by climate change, adopting the smart power management feature is going to help the OIC countries in the long run.

4. Challenges of Adopting the Smart Power Management Initiative

Thus far, the general benefits that smart power management would bring to the OIC countries is elucidated. However, the system, although a major upgrade from the present grid, is far from perfect. Plenty of problems remain unsolved, and as the technologies veer towards completion, newer problems are emerging. In order to have a nuanced analysis of exactly how the smart power management initiative is going to be received in the developing OIC countries, it is important to analyze the various challenges that it presents along with its known benefits. The challenges are summarized in Table 4, and the details are enumerated next.

4.1. High Investment Cost

It should not come as a surprise that upgrading a conventional grid into a smart one is by no means a financially easy task. The readers must keep in mind that this upgrade requires a lot of the existing grid infrastructure to be replaced, as well as adding newer infrastructures. The cost estimated for the US in 2011 ranged from about 338 to 476 billion USD [53]. Obviously, this cost would vary country to country depending on a wide variety of factors, as well as be subject to inflation, but this should give us an idea of how hefty the costs can be for the OIC countries. The high investment cost can be dealt with by utilizing proper strategies, as discussed in Section 9.

4.2. Upgrading the Grid on the Go

The developed countries have a distinct advantage over developing countries when it comes to the ease of transition. This is because they have a lower growth of energy demand because of their lower population growth rate as well as strong reliable grids, allowing them to concentrate on upgrading the existing grids. In contrast, many developing countries in the OIC have a high demand growth but a weaker electrical grid, such as Bangladesh. These countries must strengthen and expand their grid infrastructures to meet the demands of their population, and, at the same time, upgrade the existing grid by replacing older infrastructures and include Information and Communications Technology (ICT) to make the grid a smart one [48,49].
The obvious choice for the lesser developed of the OIC countries, which have yet to develop the grid completely, is to use smart grids for the newer parts of the grid that is to be developed. This is called technological leapfrogging, meaning an area implements a smart grid from the very start without implementing the conventional grid.

4.3. Technological Shortcomings

Many of the upgrades to implement the smart grids require high levels of technological systems or devices. These include advanced smart meters, communication infrastructures, High Voltage DC (HVDC) transmission devices, Flexible AC Transmission System (FACTS), Energy Storage Devices (ESSs), and so on. Many of these expensive components have to be procured by the OIC countries from overseas. This process not only adds to the costs, but also leaves the system vulnerable to outside interference. Since many of these technologies have to be designed for remote operations, this leaves the grid more vulnerable to foreign surveillance or even interference, as they were not developed locally.
The aforementioned technologies have, despite their expense and sophistication, some significant limitations. In the communications sector, there are unique problems to each of the main communication techniques. Wired communication like the PLC has increased cost, wireless communication, such as Zigbee, suffers from low data rates, while WiFi suffers from higher cost and lower range. Both suffer from vulnerability to outside interference. Cellular communication suffers from the vulnerability of failures due to reliance on cell towers and the control of information by the cell companies. The use of power electronic devices, which are used in essential applications, is also the sources of many vulnerabilities and even some inaccuracies, such as increased harmonics in the voltage [50].

4.4. Difficulties in Renewable Energy Integration

Integrating renewable energy for distributed generation of energy has its share of problems. The Distributed Generation (DG) has to be controlled by the Smart Distribution Management System (SDMS). However, the complexity of the system is increased by the two-way communication and the interconnection of the Distributed Energy Resources (DERs). Further complication occurs when the consumers also generate some energy on their own, using home based solar panels [50]. The increased complexity can increase the chances of failure or accidents. The complex power electronics in the Smart Distribution Management System (SDMS) can also generate harmonics, which can reduce the power quality and damage sensitive equipment [48,50].
Along with these, another downside to using renewable energy sources is that they take up more land area to produce the same amount of energy as other energy resources. This is a significant problem for OIC countries like Bangladesh, Qatar, and Bahrain, which have a small land area. Since Distributed Energy Resources (DERs) are periodically turned on and off by the Smart Distribution Management System (SDMS), it requires trained personnel to oversee the operation.

4.5. Security

Security is one of the main challenges of the smart grids. This is because a smart grid has a lot of private information of the consumers. It is especially alarming as it consists of not only the consumers’ energy usage, but also their presence or absence in their homes, their real-time activity, and what appliances they use. This information, if compromised, can be used by personal enemies or rival businesses for criminal activities [51]. There are two types of security threats that can occur. First is the passive security threat. This consists of the theft of private information, but no tampering of the original information. This type of security breach is difficult to detect. The other type of security threat is the active threat. This consists of capturing, tampering, delaying, redirecting, or termination of the information or messages [52]. While attacks can be carried out to acquire or tamper information related to the consumers, they can also be directed towards tampering usage data, with the aim of committing energy theft. There are vulnerabilities in the security measures, which can be especially worsened when large smart grids are implemented on a large scale. Given the high populations and low software infrastructure of the OIC countries, this calls for some serious concern.

4.6. Barriers in Demand Side Management (DSM) and Demand Response (DR)

Demand Side Management (DSM) and Demand Response (DR) use the two-way communication system which is one of the determining features of the smart grids. It is easy to see, however, that the effectiveness of this two-way communication is largely dependent on how responsive the consumers are and how dedicated the producers. On the consumer side, a lack of awareness about DR programs or simply a lack of enthusiasm for keeping up with the price profile of the electricity all the time result in a lack of cooperation with the utility’s directives and thus a poor demand response. This can be called a consumer-based barrier, and this can greatly reduce the effectiveness of the smart grids. On the producer side, confusion or disagreement about whose responsibility it is to implement the DR may arise. This may result in the lack of a unified standard policy, which leads to inefficiencies and even unfairness. This causes producer-based barriers [50]. Given how many developing countries, including those in the OIC, often suffers from preexisting inefficiencies in the government apparatus, these problems are not unlikely to occur.

4.7. Managing Huge Volumes of Data

The smart power management schemes, when implemented on a large scale, require the system to deal with huge amounts of data. These data include the consumption data, cost data, data of all the connected smart devices in the household, data of the presence of the people in the household, personal security, and identification information. These data have to be collected from each and every household connected to a smart grid. For the OIC countries with large populations, this can be expected to be over tens of millions. Along with the user data, a smart grid must also collect data from a number of sensors and smart components connected all over a grid. All these data have to be processed in real time within seconds. Needless to say, the software infrastructure to support such data has to be extremely capable and robust. Block-chain technology can be used to a great degree for handling the huge amount of data transparently through an open distributed ledger.

5. Overview of the Smart Power Management Initiative, Its Features, and Associated Technologies

In contrast to the unidirectional traditional grid system, a smart grid uses a two-way communication, i.e., it collects information directly from the consumers using an assortment of sensors and other Internet of Things (IoT) devices. Figure 3 shows the overall architecture of the smart power management technologies.
Along with the other sensors placed throughout a grid, it is capable of accomplishing smart power management, which would maximize energy efficiency, minimize pressure on the system as well as costs, self-heal from accidents or faults. Most importantly, it is also capable of managing micro-grids and distributed electricity generation, thus making a smart grid capable of adapting to renewable energy generating sources [1,54,55,56].
International Energy Association (IEA) has recognized eight main technology standards, which are Wide Area Monitoring and Control (WAMC), Information and Communication Technology (ICT), Renewable and Distributed Energy, Transmission Enhancement, Distribution grid management, Advanced Metering Infrastructure (AMI), Electric vehicle charging infrastructure, and Customer-Side Systems (CSSs) [57]. It is to be noted that these are not all independent entities. Particularly, the ICT and WAMC cannot be taken out of the grid; otherwise, the other entities would become ineffective. These technologies that are evaluated in Section 10 of this paper are analyzed using the hybrid MCDM for finding which one to focus on. Thus, the technologies should be such that they are able to function mostly independent of each other if any country decides to implement some more than others. For this reason, Information and Communication Technology (ICT) and Wide Area Monitoring and Control (WAMC) are not being considered as separate technologies, but it is assumed that they are part of other technologies that are being classified. Since this paper is focusing on the initiatives that the government officials or policy makers can implement, elaborating about the Customer-Side Systems (CSSs) has also been avoided, since these consist of smart household devices and appliances and depend entirely upon the customer demand and market forces.
Figure 3 illustrates that at the heart of it all is a ‘Control Center’, which monitors and manages the affairs of all the systems of a smart grid. It consists of multiple management systems, e.g., Meter Data Management System (MDMS), Distributed Energy Resource Management System (DERMS), Distributed Management System (DMS), Outage Management System (OMS), Demand Side Management (DSM), etc. These help to control and coordinate the smart meters of the AMI, Distribution Energy Resources (DERs), Distributed Automation (DA), Transmission Enhancement (TE), etc. The Distribution Energy Resources (DERs) consist of Renewable Energy Sources (RESs), Energy Storage Systems (ESSs), etc. It also consists of the solar home systems connected to the residential areas. The AMI joins the smart meters to the smart homes, industrial plants, as well as to the smart city. The wireless communication systems (shown above the smart cities) transfer power management data to the control center.
Table 5 summarizes some of the technologies and features that would be used in the smart grids and smart power management schemes. These are also explained in greater detail next.

5.1. Advanced Metering Infrastructure (AMI)

The combination of the network of smart meter devices connected to it and the communication gateways combined is called the Advanced Metering Infrastructure (AMI) [64].

5.1.1. Smart Meter

Regarded as one of the most important devices in a smart grid, the smart meters collect real time information about the consumers’ energy consumption, including information about the voltage, frequency, and phase angle, and send the information to the utilities. The utilities are then able to generate more accurate billing data about each individual consumer [58,59]. Having the exact energy consumption data for all the consumers helps the utilities to get the overall picture of the system, and hence they can manage the grid more efficiently.

5.1.2. Meter Data Management System (MDMS)

The data from the smart meters from every household are sent to the Meter Data Management System (MDMS), the task of which is to process all these data to prepare the bills for each consumer, and can be programmed to handle complex billing rates. It also checks for possible errors in the readings. It operates alongside Customer Information System (CIS) to process the data related to the personal information of the consumers [60]. This is an important part of the AMI infrastructure for the smart power management schemes.

5.2. Distributed Energy Resources (DERs)

Distributed Energy Resources (DERs) are one of the fundamental drivers behind the smart grid initiative. They are the foundation stone for setting up micro-grids and distributed generation.

5.2.1. Energy Storage Systems (ESSs)

The integration of renewable energy resources for distributed generation in a smart grid causes significant instability in the supply of electric energy as these sources have variable output. This problem is also amplified by the inclusion of energy hungry loads into a grid such as Electric Vehicle (EV) charging, which can draw huge amounts of current very sporadically (if many Electric Vehicles (EV) start charging at the same time). This can severely deteriorate the stability of the supply as well as the power factor. To mitigate this problem, Energy Storage Systems (ESSs) are used [65]. ESSs can provide support to the main supply during the peak load hours, provide power factor correction, help with the self-healing and restoration when a fault develops, and provide supply in an islanded state whenever the main supply is interrupted [65,66]. There are many types of ESSs that can be used, such as chemical storage like bio-fuels and hydrogen, electrochemical storage like fuel cells and batteries, electrical storage such as super-capacitors, mechanical storage like flywheels and hydro-storage, and thermal storage [67]. Pumped hydro storage makes up 95% of the installed capacity of storage, while electrochemical storage makes up most of the ESS projects [10]. Choosing which Energy Storage System (ESS) storage type to use depends on how it is to be used. For example, CAES operates with compressed air and works best with wind power generators [10].

5.2.2. Renewable Energy Sources (RESs)

Renewable energy sources refer to those that are abundant in nature. These include- solar, wind, tidal, geothermal, biomass, etc. Distributed Generation (DG) means that the energy is generated in small fields across a widely distributed area, as opposed to the centralized generation systems of conventional coal power plants. When applied like this, each field of Renewable Energy Sources (RESs) can be used to power only the small area surrounding it, forming a micro-grid. For this purpose, solar and wind power generators are most suitable, as unlike the other Renewable Energy Sources (RES), they are not dependent on geography or region and can be implemented everywhere. Renewable energy generators such as solar panels can be run in residential homes. The consumers here can produce their own energy, as well as feed surplus energy in a back-flow to a grid, as feed in tariffs. In addition, several of these generators can be set up in the fields, forming farms, like solar or wind farms.

5.2.3. Distributed Energy Management

One of the key features of a smart grid is that it should be able to efficiently circulate electricity from distributed energy generation (from renewable energy sources) and storage systems, as opposed to the centralized energy generation systems of today. For this, there needs to be effective management of the energy flow, which requires intelligent sensing as well as advanced network algorithms. One example is the development of an algorithm of multi-agent based energy management [68]. Network models are being developed in a similar way, such as the proposal of the user mode network [69]. Cooperation with the distribution system can be used to coordinate the power flows from the Distributed Energy Resources (DERs) in a way that would maintain stability in a grid. Distributive Energy Resource Management Systems (DERMS) allow monitoring and controlling the network and assets, voltage and power quality control, forecasting, and demand response [61]. This management system allows the isolated clusters of renewable energy generators, farms, as well as all the non-renewable power plants in different places and connects to work in conjunction, forming a Virtual Power Plant (VPP).

5.3. Transmission Enhancement (TE)

The transmission of electricity from the power stations to the substations has its own set of limitations and inefficiencies, which a smart grid is able to mitigate. To enhance the efficiency of transmission, a number of smaller technologies are to be incorporated into the transmission system [57].

5.3.1. Power Electronic Converters

This incorporates two main technologies. The first is the flexible AC transmission system (FACTS), which boosts the efficiency of transmission by maximizing the control and the power transfer capability. The second is the High Voltage DC (HVDC) technologies, which are essential for the efficient energy transmission from Renewable Energy Sources (RESs) to the main grid [57].

5.3.2. Dynamic Line Rating (DLR)

Dynamic Line Rating (DLR) is used to gauge the current carrying capability of a section of the transmission wire at a given time and adjust the current flow so as not to cause overloads and also to maximize the utilization [57].

5.4. Distribution Automation (DA)

The distribution system supplies current from the substations to the consumers, both residential and industrial. Automation of this process consists of integrating sensors extensively into these systems, for the purpose of detecting faults and allowing a rapid response and effective maintenance. It also allows for automatic reconfiguration of feeders and the optimization of voltage and reactive power [57].

5.4.1. Fault Detection Identification and Restoration (FDIR)

Using the strategically placed sensors throughout the distribution network, one of the primary features of Distribution Automation (DA) is to identify faults in the distribution network, so that they can be isolated and the network can be rerouted. Even if it does not fully prevent power outage, it would at least ensure that the service can be restored as fast as possible. For this, the sensors work in conjunction with smart relays, automated feeder switches, or reclosers that act as switches for opening or closing a section of the network. They also allow the utilities to identify the location of the faults, so the repair crews can be sent accurately, and the maintenance cost is greatly reduced improving the efficiency [61].

5.4.2. Voltage and Reactive Power Management

The automation of voltage regulation and correction of power factor help utilities to reduce the peak demands and raise the power quality. Using the Integrated Volt/Volt-ampere reactive Controls (IVVC), the reactive power requirement can be reduced to a great extent and can take the power factor close to unity. Another operation is the conservation voltage reduction (CVC), which monitors the voltage levels in the feeders and prevents them from becoming too high, reducing the line losses and improving the efficiency. This is done using the voltage regulators and load tap changing, while the capacitor banks compensate for the reactive loads [61].

5.4.3. Equipment Health Monitoring

Many of the outages are a result of the failing of equipment such as transformer banks. Sensors are placed on the equipment in order to constantly monitor their status. For the transformers, this conveys information about temperatures, oil, water, and pressure levels. The diagnostic software analyzes these data to confirm the state of the transformers. In case the data points to deteriorating health, preventive maintenance can be carried out, thus fixing the problems before they can cause an outage, improving the efficiency [61].

5.4.4. Management Systems

The Distributed Management System (DMS) is a software layer management system which processes the data from the sensors deployed in the distribution network, with the objective of monitoring and controlling a grid. It helps visualize a grid to the operators, presenting real-time information about the loads, maintenance, and outage conditions. It also helps as a decision support tool that helps the operators to implement the correct switching schemes in a given problem, as well as control the voltage and VAR levels, improving the efficiency [61].
Outage Management System (OMS), on the other hand, is another visualization and information management tool that helps the operators control and limits the damage in the event of an outage. With the help of data from the sensors, Internet of Things (IoT) devices, and the smart meters, it can quickly pinpoint the location and nature of the fault(s), and can greatly increase the efficiency of the repair crews in the restoration efforts [61].

5.5. Electric Vehicle (EV) Infrastructure

Electric vehicles are on the rise at present, especially in the developed world. In many developing countries too, hybrid vehicles have already penetrated the market, and in the future, full or hybrid electric vehicles are sure to completely replace vehicles running on oil and gas only. However, Electric Vehicles (EV) have their own set of challenges. Charging electric vehicles consume a lot of current, which increases the load on the system. This charging of vehicles is also very sporadic, and if a lot of electric vehicles attempt to charge at the same time, it would greatly increase the load on a grid, deteriorating the power quality and stability [70]. A grid, therefore, has to become smart in order to rise up to the challenge. A smart grid combines the Energy Storage Systems (ESSs) along with the smart power management schemes from utilities, in order to keep the power supply stable and maintain the power quality. The cost and life of batteries are also a critical factor in the EVs [10], and their development is a crucial part in the advancement of the EV infrastructure.

5.5.1. Fast Charging Station

While normal EV charging takes 7 or 8 h to recharge a vehicle to 80 percent of battery, fast charging stations are capable of recharging the EV to the same level in 30 min. This is, of course, at the cost of grid instability, as it can cause huge voltage drops and destabilize a grid. It has to operate alongside the ESSs to mitigate its debilitating effects [63].

5.5.2. V2G

This Vehicle to Grid or V2G is a new concept that utilizes the batteries of the EV as a makeshift ESS that can supply power to the grid in the same way as traditional the ESSs. Motivating the car owners through incentives, it greatly helps achieve grid stability [62].

5.6. Communication Technologies

Smart meters communicate with a grid using Power Line Carrier (PLC) or Radio Frequency (RF) [58]. They can also work in tandem with the IoT to remotely regulate the smart devices [59]. In a smart grid, wireless communication links exist between the utilities and the smart meters in the form of Wireless Automatic Meter Reading (WAMR) [71], and also between the smart devices in the consumers’ home, which in turn, connect to the smart meters. For this, a number of communication technologies are strong candidates. The first is Zigbee, which is good for supporting the sensor network of a smart grid due to their low cost and low power consumption in the field [72]. However, Wireless Sensor Networks based on Wi-Fi are superior to Zigbee in many areas including bandwidth, non-LOS transmission, coverage area, and robustness [73]. Another strong contender is the cellular network, particularly the Global System for Mobile (GSM) and the General Packet Radio Service (GPRS). Its comparatively higher power consumption and cost compared to Zigbee is mitigated by its higher data rate and higher level of security. They are used in Smart meters, Home Area Networks (HAN) as well as for monitoring nodes [74]. Modern cellular technologies are also strong candidates. The 4G cellular communication standard Long Term Evolution (LTE) is already proven as very capable for smart meters and remote control operations [75]. LoRA is another viable candidate for smart meter communications along with the IoT. Another important technology is the RF-based wireless mesh, which is a flexible network composed of nodes that act as independent routers. This allows the easier addition of new nodes as well as the removal of active nodes, which is an important property necessary for the self healing property of a smart grid [76].
Communication is at the very heart of the smart power management initiative. It transforms an ordinary grid into a smart grid. As a grid would continue to get smarter through the inclusion of more and more sophisticated communication technology, it would eventually transform into its next stage, where the electrical grid would become an Internet of Energy (IoE) [77].

5.7. Power Control System Using Software Defined Network (SDN)

Software Defined Network (SDN) is a new concept which comprises of separating the data layer from the control layer, meaning the control and coordination of the system would be done from a centralized controller and the rest of the system are only going to provide the data for the controller [2,78,79]. In simple words, data layer consists of all the hardware, switches, and sensors, whose task is to supply data to the control layer. The control layer is a software layer that processes the data coming from the data layer and then controls the data layer by sending back instructions. This new concept essentially separates the software and the hardware into separate layers or platforms, whereas, traditionally, layers are divided on the basis of functions, consisting of both hardware and embedded software. The SDN controller would be responsible for handling the data coming from the sensors and smart devices in the network, which act as switches [78]. SDN can be used in smart grid systems for a wide range of applications, e.g., easing substation network management [2], enhancing data exchange, connecting the distributed energy resources into a network [79], and managing and controlling the transmission and distribution [78].
The above two technologies are fundamental for the smart power management initiatives to the main smart grid technologies, which are discussed from this point onwards. All the smart grid technologies have, in some form or another, a communication system for collecting data and a central control system to process the data. Both communication and SDN are also involved in the above technologies, even if they are not explicitly mentioned.
The main technologies of a smart grid are summarized in Table 5. Now that the various technological features have been shown, how these are used in various operations of a smart grid is described next in Section 6.

6. Operations of the Smart Power Management

Based on the technological faculties shown in the previous section, a smart grid must be able to perform the advanced operations that a conventional grid is unable to do. In doing so, a smart grid solves many of the shortcomings of a conventional grid. The summary of operations of the smart power management schemes is given in Table 6.

6.1. Data Collection

Advanced and accurate data collection is one of the most important features of the smart power management initiative. While a traditional grid utilities collect data at monthly intervals, in a smart grid, data are collected minute by minute, courtesy of the smart meters and the vast sensor network. To support this, an advanced data collection system is required that can monitor, collect, and analyze the real-time data by interacting with the various IoT devices and sensors. The most widely used such process at present is the Supervisory Control And Data Acquisition (SCADA) [87]. However, new and more improved systems are also competing with it, such as the Phasor Measurement Units (PMU). While SCADA systems collect one or two data points per second, PMUs collect 30 to 60 data points in 1 s [51]. This operation is done in all the smart grid technologies.

6.2. Power System Quality

Power quality is an essential concern in an electrical grid. A smart grid must strive to ensure the highest possible quality of the electricity that is supplied to the consumers. This includes ensuring a high power factor close to unity as well as maintaining a stable voltage quality free of spikes and dips [80]. Although it introduces some additional challenges to the power quality due to the introduction of new devices, increased communication infrastructure and the increased switching operations, of the smart power management schemes also opens more doors to improving power quality by increased control and monitoring capabilities [80,81]. The power quality can be monitored by a smart grid using network, equipment, or power monitoring. The advanced automation operations such as fault location and Voltage and Var Control (VVC) can be used for monitoring. Capacitor banks can also be used, in conjunction, for power factor improvement. Micro-grid islanding can also reduce spikes and dips [81]. This is done primarily in the distribution automation.

6.3. Security and Its Management System

As smart grid handles the data of thousands or even millions of consumers, it becomes imperative that a powerful security system is in place to safeguard these data and protect the integrity of a grid. A number of measures exist, while more are being developed. One possible method is the Public Key Infrastructure (PKI) [82]. Security of information is primarily a concern for the management layers of all the technologies.

6.4. Demand Side Management (DSM)

Demand Side Management (DSM) is the name given to the planning, implementation, and supervising innovations in the policies of the utility by the companies, which would influence the consumers’ use of electricity. The ultimate aim of DSM is to lower the consumption of electricity, at least during peak hours, so that the utility can regulate the electrical supply more easily and the system would be stable [84,88,89]. This influence can be in a number of ways. The first method is by smart pricing, where the consumers are rewarded or penalized based on the set guidelines for electricity use provided by the company [83]. The second method involves Direct Load Control (DLC), where the utility can regulate and switch some of the users loads based on prior agreement [84]. This would be done using the smart meters, and the Grid Friendly Appliance Controller (GFAC) [64]. Ongoing developments in the field are mostly focused on the former, with numerous incentive based schemes being proposed, which include heuristic optimization [83] and game theory [84].

6.5. Demand Response (DR)

Unlike Demand Side Management (DSM), which involves long-term strategies adopted by the companies, the Demand Response (DR) involves policies or incentives offered to the consumers to reduce demand at any given moment (thus, for short term strategies) [85]. DR is the change in the normal consumption of electricity by the consumers due to incentives offered or due to the natural rise and fall of electricity cost. DR depends upon the consumers, unlike DSM, although DR itself is considered part of the overall DSM strategy. DR from the consumers can be achieved in three ways: curtailing loads to reduce energy consumption, timing the use of electricity to avoid the peak hours, or using domestic energy generation systems (such as solar panels in homes) to reduce the pressure on a grid [90]. Ensuring effective demand response is therefore fundamental for the market design of a smart grid [91].

6.6. Dynamic Pricing and Price Forecasting

Dynamic pricing is one of the main objectives of the smart grid, i.e., instead of an upfront charge that an electrical grid charges at present, the pricing varies, depending on the load conditions [86]. There are a number of dynamic pricing schemes proposed, the main ones being ToU (pricing based on peak/off-peak hour), RTP (Real time pricing, based on the cost of generating electricity at a specific time interval), and CPP (pricing scheme for critical days) [86].
Since the cost of electricity is variable, it becomes necessary for the consumers to have an idea about the cost of electricity beforehand in order for them to have an effective demand response. This is where price forecasting becomes important. Price forecasting can be related to load forecasting, as price ultimately depends on the load. Since dynamic pricing requires hour by hour changes in loads and prices, powerful algorithms are required in order to process available data to make timely predictions [92]. Machine learning algorithms such as Artificial Neuron Networks (ANN) [93], Auto-regressive Integrated Moving Average (ARIMA) [94], and many other techniques [92] are the foremost choices. Since the huge number of data have to be processed within a short time, Big Data frameworks such as Support Vector Machines (SVM) can also be used [95].
In this section, it has been shown how a smart grid would manage the system. From the perspective of the OIC countries, the applications of a smart grid will now be discussed in Section 7.

7. Applications of the Smart Power Management Schemes

A conventional grid system is plagued by various problems. A smart grid aims to solve all these problems and maximize the efficiency of an electrical grid. The following points illustrate how a smart grid would achieve this. The summary of the applications of the smart power management schemes is included in Table 7.
The details of the applications of the smart power management schemes are enumerated as follows.

7.1. Work in Conjunction with the Smart Devices at Homes

The cost of electricity varies throughout the day. This depends on a lot of factors, but most notably on the number of loads drawing electricity from a grid at any given time. Until very recently, it was not possible for the users and the utilities to communicate and coordinate the operation times of the devices to take advantage of the low cost hours. However, with the rise of IoT and the recent surge of smart devices, this is no longer a fantasy. The smart devices would continue to grow their influence and, in the near future, will dominate most of the households. A smart grid allows utilities to remotely communicate with the smart devices in every consumers’ household Home Area Network (HAN) through smart meters [59,64]. DSM and DR become much easier when information about a consumer’s electricity usage can be monitored by the utilities. This would allow regulation of the operating hours, which in turn, would lower the electricity cost at homes and also reduce strain on the grid during the peak hours.

7.2. Micro-Grids

Micro-grid is considered as an important step in the development of a smart grid. This is because it is central to the formation of a grid system based on the distributed energy generation and storage [96]. The micro-grid is defined as the body of an electrical distribution network that operates on the locally generated electrical energy and energy storage elements. It serves only a specific area for which it does not have to rely on the electrical supply from the central grid [97]. In an ideal smart grid system, multiple micro-grids exist, each centered around a renewable energy generation station. They can operate both in parallel with the central grid as well as completely independently (islanded mode) [97]. The multiple micro-grids would be coordinated and controlled by the smart grid central control in accordance with the desired control parameters [96]. Micro-grids, and their coordination with DERs, are the building blocks of the Energy Internet(EI), an up and coming concept which many see as the next stage of the smart grid [99,100].

7.3. Load Control and Cost Reduction

The utilities struggle in distributing electricity owing to an increased number of loads. This often leads to mismanagement, which, in turn, leads to excessive cost. In a smart grid, through DSM and DR, the utilities can directly or indirectly control the number of loads on the consumer side. This helps reduce the demand at the peak hours, and, thereby, lower the cost of electricity. In addition, the real-time pricing feature of a smart grid allows consumers to participate in DR, turning off appliances at times when the price of electricity is high. This saves on costs, for both the consumers and the utilities.

7.4. Integration of Renewable Energy Sources (RESs) to a Electrical Grid

For many countries leading the smart grid development and implementation, integration of RESs to the electrical grid is one of the main objectives. A conventional grid is unsuitable for a large scale implementation of renewable energy generation because of the centralized system of generation of a grid. This is primarily because of the variable nature of the RESs, and the rigid, inflexible grids fail to utilize the full economic potential of these resources. Another major problem that the conventional grids face is the back-flow of energy, which occurs when the RESs generate more energy than is consumed at any given moment; something that the traditional grids which are designed for one way power flow are not suitable [98]. Governments can pay a consumer for this back-flow of energy, a process called feed-in-tariffs. To mitigate the challenges related to RESs, a flexible, dynamic, and intelligent smart grid is the answer.

8. Critical Overview

In Section 3 and Section 4, the benefits and challenges of the smart power management initiative for the OIC countries has been shown, and the key technologies have also been introduced (in Section 5), including their functions and applications (in Section 6 and Section 7). It is now necessary to assess all these facts critically and implement them in quantitative analysis to find out exactly how feasible the smart power management initiative is for the OIC countries, and in what way it can be implemented. This is accomplished using the following two procedures: the Strength–Weakness–Opportunity–Threat with Analytical-Heuristic-Procedure (SWOT-AHP), and the Hybrid Multi-Criteria Decision Making (MCDM) analysis. Figure 4 shows the overall process of the critical analysis using SWOT-AHP and MCDM.
Thus far, the benefits and challenges (strengths and weaknesses) of establishing the smart grids in developing countries have been analyzed. However, along with these internal factors, the OIC countries must also take into account the external opportunities and threats. They have to utilize the strengths and weaknesses in accordance with these external factors to maximize the success of a smart grid venture. SWOT [101] is a strategic planning tool that is used for understanding and identifying the internal strengths (S) and weaknesses (W) and the external opportunities (O) and threats (T) to a project or endeavor. The various strengths, weaknesses, opportunities, and threats are referred to in this paper as SWOT factors. It is important to keep in mind that these SWOT factors are in fact subjective; what may be a highly desirable quality to one party may not be so important to another, although a direct conflict of interest is unlikely. Therefore, in order to consider the significance of a SWOT factor, one must take into consideration the stakeholders involved with each of these factors. The two main stakeholders in case of a smart grid are the utilities and the consumers. However, for the sake of simplification of the analysis, society is considered as a broad category of the stakeholders, which encompasses the interests of both the utilities and the consumers. The SWOT factors are considered on the basis of their impacts on the society, both the utilities and the consumers.
After the SWOT factors are ascertained, the next step is to calculate the relative significance of each of the SWOT factors, and use them to formulate effective strategies. This is done through the AHP analysis [102,103]. Here, an element in a matrix is compared with the other elements within the same matrix. Based on the comparison, each is given a score from 1 to 9, as shown in Table 8. For example, the elements that are equal in significance are given a score of 1. Those that are strongly more significant in comparison to the ones they are being compared with, are given a score of 5, and so on.
These values represent how significant one element is in comparison with the element being compared with. This process is called pairwise comparison. The scores of the pairwise comparison for each category is then used to find P r o d u c t 1 / n . It is the product of all the scores in that row to the power ( 1 / n ) , where n is the number of elements being compared, or the number of rows or columns in the pairwise comparison. The significance vector of each factor is calculated by Equation (1):
Significance   Vector   ( x i ) = P r o d u c t 1 / n ( x i ) i = 1 n ( ( P r o d u c t ) 1 / n ( x i ) )
The significance vector gives the relative importance of each factor in comparison with the others. This process is repeated for each of the SWOT categories (S, W, O, and T) separately. Then, the AHP process is carried out again; this time to obtain the relative weights of the SWOT categories within themselves. These relative weights are then multiplied with the significance vector of each factor for each category to obtain the overall significance of the factor. Afterwards, the TOWS matrix is formulated, where the suitable strategies are suggested that can be undertaken in order to incorporate the smart grids in the OIC countries most efficiently, as well as evaluating the strategies with respect to the expected significance or impact. The chronology of these operations is visually summarized in Figure 5, and the details are discussed in Section 9.
The SWOT-AHP analysis is carried out to evaluate the feasibility of adopting the smart grids in the OIC countries, as well as to identify the suitable strategies with which to implement them. However, given the fact that the smart grids have a wide range of technological features that has to be implemented, many of the OIC countries may not have the capability of implementing them with the same emphasis. The problem is addressed in Section 10, regarding how much emphasis should be given on the implementation of each of the five broad classes of technology, based on their respective contribution to the smart power management schemes. The emphasis is assigned by comparing the five broad classes of technology after carrying out the analysis with the help of the MCDM procedure. A hybrid MCDM incorporates the two MCDM procedures at the two stages of the analysis [104,105,106], which are discussed in greater detail in Section 10. The procedures to be followed in the process of the MCDM analysis are shown in Figure 6.
It is seen from Figure 6 that, at first, the technologies are compared in light of the selected criteria, which may be beneficial or non-beneficial. Here, a double hybrid MCDM procedure has been used incorporating the AHP to assign weights to the criteria, and then using the WASPAS and TOPSIS to evaluate the technologies using the weighted criteria. Each of the AHP-WASPAS and AHP-TOPSIS operations generate separate sets of scores, which are then combined to forecast a final suggestion.

9. SWOT-AHP-TOWS Analysis of the Smart Power Management Schemes

In the previous section, a brief overview was given on the process of the SWOT-AHP-TOWS analysis. In this section, this analysis is carried out in three parts—the SWOT analysis, the AHP analysis, and the formulation of the TOWS matrix.

9.1. SWOT Analysis and the Formation of the SWOT Table

Table 9 illustrates the different SWOT factors that are considered for this analysis. It is necessary to keep in mind that these factors may not apply equally well for all the OIC countries, which have distinct economies or issues. A generalized approach is adopted by putting greater emphasis on progressive and prospective OIC developing countries, as shown in Table 2 that have yet to prioritize the development of smart power management. However, the results of these analyses are equally applicable to the OIC developed countries as well.

9.2. AHP Analysis

9.2.1. Calculating Significance Scores of the SWOT Factors

At first, the pairwise comparison of the SWOT factors is carried out in each category. The scores determined for each comparison are assigned with respect to the economic priorities, which is one of the main concerns for most of the OIC countries. These scores have been assigned after careful consultancy with academicians with expertise in the power sector, economy, and climate change. Their insights were important for comparing the SWOT factors against each other and to ensure the fair placing of the scores. For example, S1 is strongly significant compared to S2; S1 has a score of 5 against S2, and S2 has a score of 1/5 against S1. In this way, all the scores are assigned to the pairwise comparison matrix. Table 9 will help understand the analysis discussed here.
  • Strength pairwise comparison: For the strength category, S1 (cost savings) has the highest significance among the strength factors. This is because, from the numerous features of a smart grid, the cost savings is the prime motivation for most of the developing countries [107]. The cost savings are a result of increased system efficiency and greater reliability of the electrical supply, as well as other economic benefits. The second biggest motivating factor is S4 (the drive to reduce the ill-effects of climate change). It has already been stated in Section 3 that many of the OIC countries are at the forefront of the climate change, and are likely to suffer the most in times of natural calamities. Therefore, it would only be sensible for the governments of those countries to take steps to avoid such calamities. This is why S4 has the second highest significance in this analysis. The next in significance is S2 (increase in energy security). Although this has top significance in the developed countries, it is lower in significance than the cost benefits of the smart grids in the developing countries (which includes most of the OIC countries) [107]. A reason for this is that, at present, many OIC countries have bountiful supplies of fossil fuels, and thus the drive for adopting renewable energy is less. The point of S4 and S2 may seem too similar because both consist of reducing the fossil fuel reliance, and also the reason for their having different priorities may also seem contradictory. However, it must be clarified that the core motivations for the two factors are in fact different. S4 is concerned with preventing the climate change, while S2 is driven by the future energy crisis. S2 is likely to be felt by some countries more than the others and is a problem for the future, while S4 is a common concern for the whole world, and is related to a problem that is already present and is growing more and more severe. This is why S4 outweighs S2. The fourth in significance in the strength category is S3 (savings in energy). Though similar to S1, it mainly indicates the reduction in the loss of energy, and it only indirectly affects the consumers as it would lead to an increase in electricity prices. While this is definitely important from the overall point of view, the other strength factors take precedence over it, as they directly concern both the utilities and the consumers and have a stronger impact. As a result of this analysis, it can be concluded, in accordance with the economic priorities of the OIC countries that S1 is 5 times more significant than S2, 7 times as significant as S3, and only twice as significant as S4. S4 is four times as significant as S2 and five times as S3. S2 is twice as significant as S3. The pairwise comparison of the strength factors is shown in Table 10.
  • Weakness pairwise comparison: For the weakness category, W1 (high investment cost) greatly takes precedence over the other two weakness factors. This is because it determines the ability of a country to afford investment in a smart grid, at a given time. If the initial cost surpasses a government’s ability to support it, and if the project also fails to attract enough investors, this suggests that the intended smart grid project should not be initiated. W2 (security of information) is second in importance. This is a growing concern among many of the consumers, who may hesitate to participate in the implementation process if they fear that their privacy can be breached. This hinders the efforts of smart grid implementation on a large scale. The last in significance among the weaknesses is W3 (technological challenges). This is because, while technological limitations remain a problem for now, as development continues, it becomes less of an issue in the long run, and is more benign than the other two weaknesses. In accordance with the economic constraints of many OIC countries, W1 is five times and seven times as significant as W2 and W3, respectively, while W2 is twice as significant as W3, as is shown in Table 10.
  • Opportunity pairwise comparison: The opportunities category features that O3 (growing economy of the OIC member countries) has the highest significance because it is seen as an enabler. This means that it is a determining factor that allows a country to finance the smart grid implementation venture more easily, even without private or international finance. The second in significance is O1 (support for smart grid among the public as well as the international community). Closely tied with the global push to adopt renewable energy, the importance of this factor lies in its ability to attract domestic or foreign investors and entrepreneurs, which enables or speeds up the implementation of smart grids. The third opportunity in significance is O2 (increased ease of availability of the smart grid technologies). Although less important than O3 and O1, it is nonetheless important as it reduces the overall expenditure of implementing the smart grid technology on a large scale and thus increases the ease with which the implementation can take place. The fourth in significance is O4 (increase in electricity demand in all the OIC countries). This is directly in proportion to the increase in population and urbanization, and increases the demand for electricity. The reason for this being behind O3, O1, and O2 is because those three determine the ability of an OIC country to adopt a smart grid, while O4 only sets the demand for a smart grid in a country. The last in significance is O5 (developing grid). This opportunity gives an incentive for the developing countries to implement the smart grids as it allows them to leapfrog technologically by directly implementing the smart grids in areas where the conventional grids have not been established yet, saving the cost and also making progress. This condition for opportunity is highly specific for some OIC countries, and is still subjective to significant investment costs (which is behind the other factors). Thus, the opportunity factor O3 is twice as significant as O1, 3 times as O2, 5 times as O4 and 7 times as O5. Likewise, O1 is twice as significant as O2, three times as O4, and five times as O5. O2 is twice as significant as O4 and three times as significant as O5. O4 is twice as significant as O5. These are shown in Table 10 for better understanding.
  • Threat pairwise comparison: In the category of threats, the threat factor with the highest significance is T2 (the DSM and DR barrier). As had been explained before, this refers to the consumers losing interest in regularly obeying the DSM directives. This may arise from there not being enough incentives to motivate the consumers. This is a serious threat, as it can drastically reduce the effectiveness of the DSM, as well as the flexibility of a smart grid in load management. The second most significant threat is T1 (regulatory inefficiencies) because the human element is not absent from the management and regulation process as yet. In the case of many OIC countries unfortunately, this threat is very significant given the high rate of irregularities and mismanagement in many of them. Termed as a producer based barrier, this problem can also reduce the effectiveness of a smart grid. Given the fact that this is a problem that can be more easily tackled by a government, it is less significant a threat than T2. The third in significance in this category is T3 (possible lack of interest of some of the OIC countries in investing in the renewable energy sector). This may not be on an official level, but it may be a significant factor for the countries with large reserves of fossil fuels at present. This also adversely affects the push for the smart grid implementation, as renewable energy integration is a major driver to move away from the conventional grids. Even if it does not inhibit the smart grid development, it may, however, reduce the speed of the development and implementation. This is less of a threat than T2 and T1, given the increasing international drive towards the renewable energy sources, and a growing awareness among the populace. Therefore, T2 is five times as significant as both T1 and T3, while T1 is twice as significant as T3. These are shown in Table 10 for a clear understanding.
Afterwards, the significance vector for each factor within each of the SWOT categories is calculated using Equation (1). Table 10 also depicts the AHP operation on the SWOT factors.

9.2.2. Checking Consistency of the Calculated SWOT Factor Significance Vectors

A fundamental rule of the AHP process is that it is necessary to check the consistency of the values used to avoid unreasonable results. For the consistency check, it is first necessary to determine the value of a variable called λ m a x , which is obtained by multiplying the significance vector by each factor with the sum of their scores for each column and adding the results of all the factors. This variable helps in calculating the Consistency Ratio (CR), which is used to indicate the level of consistency and reliability of the scores in the pairwise matrix. The CR is necessary because the scores assigned with the pairwise matrix are based on the qualitative analysis, which might have unavoidable human errors. For example, if S1 is seven times more significant than S3 and five times more significant than S2, it only stands to reason that S2 should be about twice more significant than S3, and any large difference between the significance score of S2 over S3 is an inconsistency. The CR is calculated for each of the four SWOT categories, as four separate pairwise comparisons are taking place here. Equation (2) is then applied to obtain the values of CR for the pairwise comparison for each SWOT categories.
C R = λ m a x n r ( n 1 )
where n is the number of factors in the category, and r is a special constant called the Random Index [108]. The random index has different values for different number of factors. For each category, the random index is different, depending on the number of factors in that particular category. For the strength category, there are four factors ( n = 4 ), so the value of r is 0.90; for the weakness and threat category with three factors ( n = 3 ), r is 0.58; for the opportunity category with five factors ( n = 5 ), r is 1.12. Table 11 shows the calculated consistency ratio (CR) values for each of the SWOT factors. One of the rules of the AHP is that the Consistency Ratio (CR) of each AHP operation has to be less than 0.1 for the pairwise comparison to be acceptable. If it is more than 0.1, then the pairwise matrix has to be reevaluated because the error is too large. In this case, the CR value obtained for the AHP operation of the strength category is 0.02, for weakness category, it is 0.01, for opportunities, it is 0.01, and, for threats, it is 0.05, as presented in Table 11. As the CR values of all the categories are set well below 0.1, it is justified that the assessment criteria for the pairwise comparison of the SWOT factors considered in this paper are sound.

9.2.3. Calculating Weights of the SWOT Categories and the Overall Significance of the SWOT Factors

In order to find out the overall significance of the SWOT factors, it is necessary first to determine the weight of each category in SWOT, meaning how much relative significance does the S, W, O, and T have with respect to each other. This is done with an AHP process of its own with the pairwise comparison process in the same way it is used for the SWOT factors.
In the pairwise comparison, the strength category will be given more significance than the other categories. This is because the factors in the strength category (S) are the main drivers for adopting a smart grid. It can be surmised that, even if the opportunities (O) presented in Table 12 were to decrease in significance or even cease to exist hypothetically, the strengths are still strong enough to convince the policy makers of the need to establish a smart grid. Using this reasoning, it can be said that the strength category outranks the opportunities in significance. As for the weaknesses (W) and threats (T), it should be clear from a cursory analogy that the factors in both these categories are relatively weaker than both the strengths and opportunities, as many of these factors can quite easily be compensated for or simply mitigated with time as the technology progresses and the awareness increases. However, the weaknesses have one quite important factor: the high investment cost. While it too can be mitigated with time or through economies of scale or by utilizing the opportunities (as is discussed in the TOWS matrix in subsection C), it still affects the ability of a country to implement the smart grids, and hence the weaknesses have more significance than the threats. Thus, S is three times more significant than W, twice more than O, and five times more than T. Likewise, O is twice as significant as W and thrice as T. W is twice as significant as T. The pairwise comparison matrix of S, W, O, and T categories is displayed in Table 12.
The significance vector of this AHP operation are then found using Equation (1) again. The significance vectors in this case are the relative weights of the SWOT categories, and can be referred to as category weights. This can be seen in Table 12. The strength category has the biggest weight, followed by the opportunities, then weaknesses, and then lastly the threats.
The final step is calculating the overall significance of each factor, which is obtained by multiplying the significance vector of each factor from Table 10, with the weight of each category (S, W, O, or T) which has been shown in Table 12. It is obtained by applying Equation (3).
Over all   Significance = Significance   Vector × Category   Weights
The overall significance of a factor indicates its significance over all the other factors, including those in other categories. These have been calculated and shown in Figure 7. For instance, the S1 has the highest significance score of 0.25. This indicates that the cost savings as a result of adopting smart grid is the most significant of all the SWOT factors. Figure 7 also shows the perception map of the SWOT factors. It is formulated with the overall significance scores of the factors, and helps to visually display the overall significance of each SWOT factor in comparison with the other SWOT factors from all the categories. For example, S1 having the highest overall significance has the largest size of the vector as can be seen in the figure. Likewise, the size of the vectors of each factor indicates their overall significance.
Now, the overall significance of each SWOT factor has been obtained, and this information is used to determine the significance of each strategy that is formulated in the TOWS matrix using these factors, which is discussed in detail in the next subsection.

9.3. TOWS Strategies

After analyzing the various SWOT factors, their weights are found by AHP analysis. Now, it is necessary to formulate the TOWS matrix to use these factors to suggest suitable strategies to maximize the success rate. Table 13 shows the TOWS matrix.
Here, three strategies have been suggested for each broad classes of strategies, resulting in a total of 12 strategies that will help the OIC countries efficiently adopt smart power management initiatives. The strategies have been formulated by combining the SWOT factors presented in Table 9.
This consists of four broad classes of strategies. The first is the Growth-Oriented Strategy (SO), of how to use the strengths to utilize the opportunities. The second is the Diversification Strategy (ST), consisting of using the strengths to minimize the threats. The third is the Transformation Strategy (WO), where the weaknesses are mitigated by seizing the right opportunities. The fourth is the Defensive strategy (WT), of how the weaknesses are defended by assessing the threats [109]. These 12 strategies are then assigned a significance score on the order of their expected effectiveness, based on the significance vectors of the SWOT factors acquired from the AHP analysis in Table 10. This is shown in Table 14.
Here, in Table 14, the highest score is 1 and the lowest is 12. These are formulated by multiplying the overall priorities of the factors of different categories, to find the total scores. The table shows that WO-1 is the most significant strategy, that is, the states’ own funds (because of increasing economy in OIC countries, O3) and international and private investors (because of the rising global interest in renewable energy, O1) can be used to counter the most significant weakness of smart grid development (High investment, W1). It is apparent in Section 2 that many OIC countries have already started adopting this strategy. The least significant strategy is WO-3, which is developing the smart grid in areas that were previously not connected or poorly connected to the conventional grid first, means that technological shortcomings may not have a large significance in such communities. However, given the fact that both the technological challenges (W3) and the opportunity of developing grids (O5) have very low significance, this strategy that combines both W3 and O5 has the lowest significance.

9.4. Justification of the SWOT-AHP-TOWS Analysis

The goal of this section is to analyze the extent of the feasibility of setting up the smart power management schemes in the OIC countries in general. The SWOT analysis, which had been carried out first, helped discover the strengths, weaknesses, opportunities, and threats of undertaking the smart power management initiatives, while the AHP analysis helped quantify the impact of these factors. The TOWS analysis then used these quantified factors to formulate suitable strategies that can help the governments in the OIC member countries implement the smart power management initiatives most effectively. The strategies are also classified in order of their perceived impact, with the top strategy being the use of the state funds and private investment to mitigate the high investment cost factor. The formulation of the strategies is the key objective of this section.

10. MCDM Analysis of the Smart Grid Technologies

In the previous section, the SWOT-AHP-TOWS analysis has been carried out, and a handful of strategies are suggested based on the TOWS matrix as to how the smart power management schemes can be implemented in an OIC country. In this section, the MCDM operation is carried out to grade the technologies in the order of their emphasis, which is assigned to each of them, in accordance with their contribution. The seven criteria with which they are compared with are classified as either beneficial or non-beneficial as shown in Table 15.

10.1. Technologies and the Criteria

The five technologies (AMI, DER, DA, TE, EV infrastructure) have their own distinct qualities for each criterion with which they are compared. These qualities are assigned numerical values for the ease of comparison, which are shown in Table 16.
In Table 16, the highest value is taken as 5, and the lowest is taken as 1. It is important to note that the difference in the numerical designations should not be assumed to hold equal value. Their purpose is to serve as a rank only and no more than that. However, in order to assign the numerical designation, it is necessary to analyze how these technologies satisfy each of these criteria.

10.1.1. System Efficiency Enhancement

System efficiency enhancement has the following three main actions: (a) load shifting through Demand Side Management (DSM) or Demand Response (DR), (b) transmission loss of electricity, and (c) fault/loss detection. Of these, the DSM or DR has a greater role in determining system efficiency.
The Advanced Metering Infrastructure (AMI) has the highest score of 4 in this criterion. This is because, although it has the minimum role in transmission loss, it allows two-way communications in the form of DSM and DR, thus preventing waste of energy and allowing load control, as well as assisting in fault detection with the Outage Management System (OMS) and Distributed Management System (DMS) of the Distribution Automation (DA) [61]. Transmission Enhancement (TE) and Distribution Automation (DA) have the second highest score of 3. They both greatly reduce the transmission losses [57,61], as well as playing an active role in fault detection, using DLR [57] and Distributed Management System (DMS)/Outage Management System (OMS) [61], respectively. However, neither of them are exactly essential in DSM and DR. Both Distributed Energy Resources (DERs) and Electric Vehicle (EV) infrastructure have the lowest scores of 1 because neither play active roles in enhancing the system efficiency.

10.1.2. Reliability Enhancement

Reliability enhancement has four actions, namely, fault detection/prevention, DSM and DR, forecast, and energy storage. All of these are assumed to have equal weights and thus contribute to the score in the same way.
The Advanced Metering Infrastructure (AMI) and Distribution Automation (DA) have the highest score of 4 under this criterion. They both play active roles in making the forecast by data collection [61], and help in easier integration of the Energy Storage Systems (ESSs) and Renewable Energy Sources (RESs), although the role of Distribution Automation (DA) is relatively more here. However, the AMI allows the DSM and DR, enabling the load shifting by the consumers and reducing pressure on the grid during the peak hours, lowering the chances of power outage. The DA plays a minimum role here, but it plays the prime role in fault detection, while AMI can only assist the Distributed Management System (DMS) and Outage Management System (OMS) of the DA [61]. The TE and EV Infrastructure both have a score of 3, and can share data for load forecasting and neither of them helps with the energy storage integration. However, the TE helps reduce the chances of fault development, while EV has no role to play here, whereas EV infrastructure utilizes DSM and DR in its operation, but the TE cannot. Therefore, their scores are equalized. The DERs have the lowest score of 2 because it supports no other actions of reliability enhancement other than enabling integration of the ESSs.

10.1.3. Reduced Theft

Reduced theft comprises having physical tampering warning system as well as strong software security.
The AMI has the highest score of 5 in this criterion because it has sensors over crucial areas to detect any attempt to physically manipulate any regulatory devices [110], as well as software protection. The DA also has sensors over crucial areas to serve the same purposes as the AMI does. However, its significance is much lower, as it is less prone to attacks than AMI. Therefore, it has a lower score of 3. All the other technologies have a minimum role in theft prevention, and is, therefore, given a score of 1.

10.1.4. Renewable Energy Adoption

The DERs have the highest score here because it has the central role in the adoption of renewable energy and can implement the RESs and ESSs. The TE and DA have the second highest score of 3 because they both assist the renewable energy integration [57,61]. The EV infrastructures reduce the demand for fossil fuels and encourage the renewable energy adoption indirectly, and is thus assigned a score of 2. The AMI allows easy integration of the DERs to some extent, especially, the domestic energy generation and storage systems, and thus also has a score of 2.

10.1.5. Deployment Challenges

The ease of deployment consists of three actions: land consumption, replacing the existing infrastructure, and dependence on the consumer choice.
The TE and DA have the highest score of 4 under this criterion. This is because both of them require land for newer infrastructures such as data centers, and calls for drastic changes to the older systems. The customer choice is not a concern for either of them. The AMI, DER, and EV infrastructures, all have a score of 3 here. This is because all three require a comparatively limited amount of land due to smaller installations, and do not require significant changes to the existing infrastructures, as they are new technologies, and they also depend on the choice of the consumers.

10.1.6. Investment Cost

The investment cost is a crucial factor for each technology. Table 17 shows the formulation of the costs. For the most part, as communication and data management infrastructures (DMS, OMS, MDMS) are crucial to all the technologies, their costs are excluded because here the technologies are only being compared. The scores here are calculated based on the ranking of the sum of per unit costs of each technology. For the costs that have a range of values, the average between the highest cost and the lowest cost is taken. The scores to each technology is assigned in accordance with their total costs. This is very easy to tell even with a cursory glance, as the difference between the costs of each technology is quite stark. The highest score of 5 is assigned to the technology with the highest cost TE, which requires a massive 122.8 million USD per unit including the substation costs. The second highest score of 4 is assigned to the DA, with its total cost of 803.3 thousand USD per unit. The EV infrastructure has a cost of 10.8 thousand USD per unit and a score of 3. The second lowest score of 2 is assigned to the DER with 1982.5 USD per unit including the charging station and interface. The lowest score 1 is assigned to the AMI because of its very small cost of 468.5 USD, which includes the cost of both the residential and industrial smart meters, as both are required for a smart grid.

10.1.7. Technological Challenges

In both the DERs and EV, power electronic converters introduce harmonics into the system and cause voltage distortion [50]. For the DERs, they require the modification of replacement of the distribution system. The harvesting of the renewable energy resources is also not perfected yet. Energy loss also occurs in the conversion and re-conversion processes between the AC and DC in the ESSs. On the other hand, fast charging on the EV chargers causes extra load on the power system, and requires proper management, such as shifting the load charging at an off-peak period. Due to the high impact of the problems, they have the highest score of 4. The AMI, TE, and DA have the same score of 3. For AMI, the smart meter deployment is a challenge for the utilities at the moment. It requires a suitable infrastructure to synchronize with the existing technology. The smart meters can only be used to their full extent after the devices and appliances are set in the communications network. Deployment of communications network is subject to terrain [59]. In addition, the Power Line Carrier (PLC) has to deal with disruptive interference from the external sources and high signal attenuation [112]. For both the TE and DA, the power electronic devices, used for conversion, introduce harmonics into the system and cause voltage distortion [50]. In TE, energy loss occurs in the conversion and reconversion processes, while the DA still has options for adapting to the two-way power flow.

10.2. Selection of the MCDM Methodologies

The basic MCDM operation involves grading of the technologies in terms of the selected criteria. These criteria have weights of their own in accordance with their relative importance. Therefore, first weights have to be assigned to the criteria, which would then be used to grade the technologies. Logically, this calls for a two step process, which requires two MCDM procedures to be formulated, one for selecting the weights for the criteria, and the other for ranking the technologies. For assigning the weights, the Analytical Hierarchical Process (AHP) is used, as this method compares the various criteria and determines the relative importance between them [102]. In this paper, since qualitative criteria are used with no quantitative values, the individual weights of the criteria have to be determined in relation to each other. For this reason, the AHP is well suited for setting up the relative weights of the criteria. For ranking the technologies in accordance with the weighted criteria, two MCDM methods have been formulated—the Weighted Aggregated Sum Product Assessment (WASPAS) and the Technique for Order Preference by Similarity to Ideal Solution (TOPSIS). The WASPAS is a combination of two other MCDM models, namely, the Weighted Sum Model (WSM) and the Weighted Product Model (WPM). The WASPAS has been selected in the current analysis because of its operational simplicity, as well as its greater accuracy compared to the WSM or WPM alone, both of which are widely used simplistic MCDM methods. Two normalization methods are used in WASPAS, the linear normalization, and the enhanced accuracy normalization, both of which generate two separate sets of grades. As for TOPSIS, its principle is that it grades the elements based on the distance from the ideal best score, as well as the distance from the ideal worst score [113]. This two-pronged analysis gives a more balanced result relative to just comparing with the best score. In essence, both the WASPAS and TOPSIS methodologies are used and the same data generated from the AHP is used in both of them. In fact, two hybrid MCDM systems are usually used—an AHP-WASPAS hybrid-MCDM and an AHP-TOPSIS hybrid-MCDM. The hybrid-MCDMs are widely used because they provide more reliable results compared to just a single MCDM method. The reason for using two of the hybrid MCDM models is to increase the reliability of the final grading, which is going to be forecast.

10.3. MCDM Operation

10.3.1. Calculation of the Criteria Weights by the AHP Analysis

In Table 18, the relative weight of each of the criteria is determined using the AHP analysis. At first, the pairwise comparison is carried out on the criteria to find their relative significance. The scores of precedence were set on the basis of the preferred driving motivations of the smart grids in the developing economies [107]. Along with this, the investment cost feature was given more precedence over the others because of the fact that this is a critical factor for many developing countries in the OIC. To find out the weights from the pairwise comparison, the same process that was used in all the previous instances of the use of AHP in the SWOT-AHP-TOWS. The scores of each row are multiplied together and the product raised to the power of the inverse of the number of criteria to form the average product, which is then divided by the sum of the average products of each row. To ensure that the pairwise comparison was fair, the consistency ratio (CR) is calculated. For that, the value of λ m a x is determined first. In doing so, the same process which was used for the SWOT-AHP analysis in this paper is applied. The value of λ m a x is 7.243, Consistency Index (CI) is 0.040 and the Consistency Ratio (CR) is 0.031. As the value of the CR is less than 0.1, it can be surmised that the assignment of the scores in the pairwise comparison is sound.

10.3.2. MCDM of the Technologies against Weighted Criteria

The MCDM operation is carried out on the base table, which has been formulated and shown in Table 19. The argument for the choice of the numeric designations or scores awarded to each of the technologies has been explained in the previous subsection.
It has already been mentioned earlier that two MCDM methods are employed for grading the technologies, namely the Weighted Aggregated Sum Product Assessment (WASPAS) and the Technique for Order Preference by Similarity to Ideal Solution (TOPSIS). For WASPAS, the Linear Normalization (LN) formula for the Non-Beneficial (NB) criteria, L N ( x i j ) N B , is given by Equation (4) and that for the Beneficial (B) criteria, L N ( x i j ) B , is given by Equation (5). Here, x i j represents the element in row i and column j, the score of a technology for a given criteria. x j represents all the elements in column j. The term m i n ( x j ) denotes the minimum score in column j, while m a x ( x j ) denotes the maximum score in column j. It is noted here that the Equations (4) and (5) are valid for the WASPAS method of MCDM:
L N ( x i j ) N B = m i n ( x j ) x i j
L N ( x i j ) B = x i j m a x ( x j )
The Enhanced-accuracy-Normalization (EN) formula for the Non-Beneficial (NB) criteria, E N ( x i j ) N B , is given by Equation (6) and that, for the Beneficial (B) criteria, E N ( x i j ) B , is given by Equation (7). These two equations are also applicable for the WASPAS method. Here, N is the total number of rows representing the number of technologies being used in the analysis:
E N ( x i j ) N B = 1 x i j m i n ( x j ) i = 1 N ( x i j m i n ( x j ) )
E N ( x i j ) B = 1 m a x ( x j ) x i j i = 1 N ( m a x ( x j ) x i j )
The TOPSIS(T) formulae for the normalization of x i j is given by Equation (8):
T ( x i j ) normalization = x i j i = 1 N ( x i j ) 2
The TOPSIS formula for the calculation of the performance score of each technology of a particular row, S i , is given by Equation (9):
T ( S i ) score = S i ( S i + ) + ( S i )
Here, S i + is the Euclidean distance from the ideal best score and S i is the Euclidean distance from the ideal worst score. For the Non-Beneficial criteria, the ideal best is the lowest weighted normalized value and the ideal worst is the highest weighted normalized value, and the vice versa is true for the beneficial criteria.
Table 20 shows the MCDM operation with linear normalization. Here, the WASPAS method of MCDM is used, and Equations (4) and (5) are used for making the calculations.
Table 21 shows the MCDM operation with enhanced accuracy normalization. Here, the WASPAS method of MCDM is used, and Equations (6) and (7) are used for making the calculations.
Table 22 shows the MCDM operation with TOPSIS method, and Equations (8) and (9) are used for making the calculations.

10.4. Results of the MCDM Analysis

Table 20, Table 21 and Table 22 have shown the grading of the five main technologies for a smart grid. The two Hybrid MCDM methods, the AHP-WASPAS and the AHP-TOPSIS, apparently produce different results. The analyses of the two normalization methods of the WASPAS also show slightly different results. A possible explanation for the difference could be the way in which these methods work. The WASPAS considers only the best possible score, while the TOPSIS works by comparing the distance from the ideal best and the ideal worst scores. Multiple hybrid MCDMs are ideal for this situation, as a bias can now be avoided because of the operational difference between the two methods. Taking an average of the ranks presented by the AHP-WASPAS linear normalization, AHP-WASPAS enhanced normalization, and AHP-TOPSIS, the overall rank can be set by choosing a value closer to 1.
Table 23 shows the overall ranks obtained by averaging each technology for each MCDM method from Table 20, Table 21 and Table 22. In addition, then ranked in the ascending order, with the lowest value signifying the highest score. It shows that the AMI has the clear dominance as the highest score, as it has the highest score for both the normalization methods, and both the hybrid MCDMs. This is expected, as its vital role in the smart power management initiative have been stated in the previous sections, along with its low cost. The second highest score is held by the DA. This is also understandable, as the DA plays a vital role in the system efficiency and reliability. The third highest score is held by the DER, again for its importance in incorporating the renewable energy and the energy storage systems. This is followed by the EV Infrastructure because of its ability to support the EVs, but it has a somewhat lower score because of its smaller role in system stability and reliability, followed by the TE as having the lowest score, primarily because of its relatively smaller role and huge cost.
It is to be noted here that the goal of the MCDM operation is not to rank which smart power management technology is to be implemented while omitting the others. For a fully functional smart grid, all the technologies are necessary. The goal of the MCDM analysis in this paper is to help the policy makers decide how much to emphasize on each technology in the light of the seven criteria of implications. This emphasis is necessary because it is not possible for the policy makers in any country to provide equal attention to all the technologies. Thus, the emphasis is envisioned to help a smooth transition into the smart power management schemes.

11. Smart Grid, Sustainable Development Goals (SDGs), and the OIC

To diminish poverty and equality and to bring about development, the United Nations has set 17 goals for the UN member countries to undertake. Declared in 2015 and to be completed by 2030, the SDG goals are a primary guide for many developing countries in their drive to become developed [114]. The OIC member countries have a lot to cover in this front, as most generally rank quite low in terms of sustainable development [115]. The development and adaptation of the smart grids by the OIC countries can achieve many of these goals, as the incorporation of the smart grids directly influences many of the 17 goals, namely, the goals 7, 9, 11, 12, and 13 [114]. Many of the strategies suggested for the OIC member countries in the TOWS matrix in Table 13 directly coincide with the objectives of these goals. This is also illustrated in Figure 8.

11.1. Goal 7: Affordable and Clean Energy for All

This is the goal to upgrade and expand the infrastructure to ensure energy and electricity supply that is both affordable for the common people and also non-polluting for the environment [114]. As one of the principles of the smart grids is to better incorporate the renewable energy resources in the form of the distributed energy generation, it ensures that the clean energy is being generated. Given the fact that the smart grids use the DSM and DR, it can better coordinate the distribution of electricity, thus saving costs by reducing the wastage and power cuts. This will help the OIC countries to achieve clean and affordable energy for their citizens. The proposed strategy WO-3 (deploying smart power management in unconnected areas first so as to limit the effects of technological shortcomings) helps supply electricity to impoverished communities and thus helps address this goal directly.

11.2. Goal 9: Industry, Innovation, and Infrastructure

This is the goal to promote innovation and technological growth through investments, and to bridge the gap in technology between people and communities [114]. The development of the smart grids is an important part of this goal because the smart grids employ the best technologies available. Developing the smart grids also helps advance innovation in other fields, which have their applications in the smart grids, such as communication, microelectronics, and machine learning, for example. Technological progress is also brought about as a result of the stable electrical supply from the smart grids. The OIC countries and their economies can greatly profit from this technological development. Adopting the proposed strategy SO-1 (Emphasizing on developing the smart grids in areas of higher technological demand) will help in speeding up the development in industry and innovation.

11.3. Goal 11: Sustainable Cities and Communities

This is the goal to develop cities that are more habitable and sustainable by having improved transport services, greener spaces, and urban planning [114]. Again, indirectly, the smart grids help achieve this goal as well. One of the prime requirements of a sustainable or habitable city is the security of energy supply, something which is one of the main goals of the smart grids. The distributed energy generation and micro-grids, which are supported by the smart grids, would help replace the existing messy electrical supply system by securing the supply at all times, and also reducing the need for the dangerous overhead supply lines, which are seen in many underdeveloped cities of the OIC member countries. The implementation of the renewable energy and micro-grids enabled by the smart power management initiative is expected to help transform the urban areas into green cities, which would maximize productivity, foster a healthy urban life as well as be environmentally sustainable. Given that the urban communities have the higher demand of power, the proposed strategy, SO-1 (focusing on developing the smart grids in high demand urban areas), will certainly help achieve these goals.

11.4. Goal 12: Responsible Consumption and Production

This is the goal to reduce waste and to produce and consume products sustainably [114]. The smart grids focus on minimizing waste of energy throughout its process, and thus is in line with this SDG goal. In addition, through its use in distributed energy generation from the renewable energy resources, carbon emission would be greatly reduced. This would also allow generation and consumption of energy, while minimizing the carbon dioxide production and greenhouse effect. The power so generated and used is called green power. The OIC countries have very high dependence on fossil fuels and thus is largely unable to produce and consume energy responsibly. The incorporation of the smart power management initiative will certainly help to improve the situation in this regard. As support from the industry leaders and the general public is vital in this regard, the proposed strategy, ST-3 (raising awareness that the smart grids help responsible consumption and production), is definitely going to help in striving towards achieving this goal.

11.5. Goal 13: Climate Action

This is the goal to protect parts of the world, which are vulnerable to the adverse affects of climate change [114]. It is known that many parts of the world are susceptible to this, including many developing countries of the OIC, like Bangladesh, the Maldives, and Pakistan. Every year, due to the monsoon storms and flooding, much of the electrical infrastructures in these areas are damaged, and the massive power failures are common during these periods. A smart grid, with its self-healing abilities, is very suitable for minimizing the adverse effects of such natural disasters. Thus, replacing the conventional grid with a smart grid in such disaster-prone areas would ensure electrical stability even during disasters and help the communities tackle the disaster better, helping to achieve the ‘climate action’ goal. In addition, the utilization of green power, enabled by the smart power management schemes, would help fight climate change by reducing carbon emissions, resulting in less greenhouse effects and global warming. This serves as a long-term strategy to fight the climate change ensuring a safe future for the OIC member countries, as well as for the world. The proposed strategy, SO-3 (raising awareness that the smart grids would help fight climate change), directly addresses this particular SDG goal.

12. Conclusions

A lot of research efforts were infused into this work to reach this current state. While the authors were diligent in the collection of data, there are certain limitations and challenges. One example would be the availability of data from the underdeveloped or conflict/war prone countries.
The Islamic world has gone through several setbacks in the past, which have cost its position as the global leader of both scientific and social developments. One of the main goals of the OIC is to exert a concerted effort in order to regain the lost glory. The incorporation of a smart grid and smart power management schemes would be a big step forward in that direction. With the dawn of the fourth industrial revolution [116] and the emergence of Society 5.0 [117], this is an era of significant change. Now, everything is becoming more and more connected, and humanity is gaining control of more and more variables that were previously considered out of reach. As smart power management brings about connectivity to the grid, exponential growth can be expected in all the related sectors ensuring the quality of human life. The deployment of smart grid and smart power management would usher in faster growth and development of a nation more than ever before. This move definitely fits well within the OIC agenda of quickly catching up with the rest of the developed world. This paper first discussed the importance of smart power management schemes and described their various technological features and functions, satisfying its first objective. In that connection, it later showed through SWOT-AHP analysis that incorporating smart power management in the OIC member countries is very feasible and suggested some essential strategies that would help implement them more efficiently. This has satisfied the second objective of this paper, which is to evaluate the feasibility of upgrading to smart grids from the conventional ones. The main strategy that has been suggested for the implementation of smart power management in OIC member countries is to combine the state funds with private investors to finance the development drive. Later, through the MCDM analysis, this study further evaluated the technologies and suggested what degree of emphasis should be assigned to each technology based on the scores, and subsequently making it easier to implement the smart power management schemes. This has fulfilled the third objective of this paper which is to evaluate the various technologies of the smart power management schemes based on the importance of their applications. Through the Hybrid MCDM analysis, this paper has suggested that the OIC member countries should emphasize developing Advanced Metering Infrastructure (AMI) and formulating the development plans centered around it. As the rest of the world has already begun implementing smart power management using smart grids, the OIC member countries should not watch as bystanders, and they must come forward to adopt the state-of-the-art technology without further delay.
As future works, the authors would like to study in greater depth the relationships between the smart power management technologies and the smart grid operations/applications over a wider scope of countries and regions.

Author Contributions

K.H.K. conceived the idea, planned, and continuously revised the manuscript for improvement and edited until the final submission. S.Y.A. performed the survey, analyzed, and produced the initial manuscript. In addition, M.S.R. supervised and gave necessary enhancements and inputs along with the work. All authors have read and agreed to the published version of the manuscript.

Funding

This research received no external funding.

Acknowledgments

The work presented in this paper has been carried out jointly by the researchers at the Department of Electrical and Electronic Engineering, IUT, and the Department of Electrical and Electronic Engineering, BUET.

Conflicts of Interest

The authors declare no conflict of interest.

References

  1. The Smart Grid. Available online: https://www.smartgrid.gov/the_smart_grid/smart_grid.html (accessed on 18 December 2020).
  2. Cahn, A.; Hoyos, J.; Hulse, M.; Keller, E. Software-defined energy communication networks: From substation automation to future smart grids. In Proceedings of the IEEE International Conference on Smart Grid Communications (SmartGridComm), Vancouver, BC, Canada, 21–24 October 2013. [Google Scholar]
  3. Worldometer. 2016. Available online: https://www.worldometers.info/ (accessed on 10 April 2021).
  4. Lerner, E. What’s wrong with the electric grid? Physics Today. Available online: https://physicstoday.scitation.org/do/10.1063/PT.5.5020/full/ (accessed on 10 April 2021).
  5. Smart Grids Innovation Challenge Country Report 2019; Mission Innovation IC1-Smart Grids: Vancouver, BC, Canada, 2019.
  6. Jensterle, M.; Venjakob, M. Smart Power Grids and Integration of Renewables in Japan—Status and Activities Concerning Smart Grids Implementation and Integration of Renewable Energy Sources in Japan; Adelphi Consult: Berlin, Germany, 2019. [Google Scholar]
  7. Emerging Markets Smart Grid: Outlook 2015; Northeast Group, LLC: Washington, DC, USA, 2015.
  8. Emerging Markets Smart Grid: Outlook 2019; Northeast Group, LLC: Washington, DC, USA, 2019.
  9. United Arab Emirates Smart Grid Market—Growth, Trends, COVID–19 Impact and Forecasts (2021–2026). Available online: https://www.mordorintelligence.com/industry-reports/united-arab-emirates-smart-grid-market-industry (accessed on 30 January 2021).
  10. Shaukat Hameed Khan and Muhammad Haris Akram Renewable Energy Profile of OIC Countries; COMSTECH Series of Reports on Science, Technology, and Innovation in OIC Member States; COMSTECH: Islamabad, Pakistan, 2018.
  11. Turkey Smart Grid 2023—Vision and Strategy Roadmap Summary Report; Electricity Distribution Services Association (ELDER). 2018. Available online: http://www.elder.org.tr/Content/yayinlar/TAS (accessed on 6 April 2021).
  12. Kuwait Utilities to Receive over 1 million Smart Meters. Available online: https://www.smart-energy.com/industry-sectors/smart-meters/kuwait-utilities-to-receive-over-1-million-smart-meters/ (accessed on 6 April 2021).
  13. Kuwait Announces Smart Meter Project with Ericsson and Zain. Available online: https://enterpriseiotinsights.com/20181001/channels/news/kuwait-announces-smart-meter-project-ericsson-zain (accessed on 6 April 2021).
  14. Kuwait and EU Experts Discussing on Smart Grids—Recommendations of the Smart Grids Conference. Available online: https://www.eugcc-cleanergy.net/node/1193 (accessed on 6 April 2021).
  15. Alsayegh, O.; Saker, N.; Alqattan, A. Integrating sustainable energy strategy with the second development plan of Kuwait. Renew. Sustain. Energy Rev. 2018, 82, 3430–3440. [Google Scholar] [CrossRef]
  16. Smart Energy Management Systems for households in Bahrain. Available online: https://www.smart-energy.com/industry-sectors/energy-grid-management/smart-energy-management-systems-for-households-in-bahrain/ (accessed on 6 April 2021).
  17. Bahrain Develops Framework for Smart Energy Deployment. Available online: https://www.smart-energy.com/regional-news/africa-middle-east/bahrain-sustainable-energy-unit/ (accessed on 6 April 2021).
  18. 600,000 Smart Meters Coming to Qatar. Available online: https://www.smart-energy.com/industry-sectors/smart-meters/600000-smart-meters-coming-to-qatar/ (accessed on 7 April 2021).
  19. Bayram, İ.Ş.; Mohsenian-Rad, H. An overview of smart grids in the GCC region. In Proceedings of the Smart City 360°, Toronto, ON, Canada, 21–24 October 2013. [Google Scholar]
  20. Unified Smart Metering System Launched. Available online: https://www.da.com.bn/unified-smart-metering-system-launched/ (accessed on 24 April 2021).
  21. Oman’s Automatic Meter Reading Initiative Goes Live. Smart Energy International. Available online: https://www.smart-energy.com/industry-sectors/smart-meters/omans-automatic-meter-reading-initiative-goes-live/ (accessed on 24 April 2021).
  22. Smart Grid Development—A New Focus. Available online: https://27.group/smart-grid-development-a-new-focus/ (accessed on 31 March 2021).
  23. Smart Grid Systems to Power Indonesia. Available online: https://opengovasia.com/smart-grid-systems-to-power-indonesia/ (accessed on 31 March 2021).
  24. Smart Grid Funding: Pakistan Completes USAID-Backed Project. Smart Energy International. Available online: https://www.smart-energy.com/regional-news/asia/smart-grid-funding-pakistan-completes-usaid-backed-project/ (accessed on 31 March 2021).
  25. Gharehpetian, G.B.; Naderi, M.S.; Modaghegh, H.; Zakariazadeh, A. Iranian smart grid: Road map and metering program. In Application of Smart Grid Technologies; Elsevier: Amsterdam, The Netherlands, 2018; pp. 13–60. [Google Scholar]
  26. Jalilov, O. Iran Increases Renewable Energy Production. Available online: https://caspiannews.com/news-detail/iran-increases-renewable-energy-production-2019-10-15-56/ (accessed on 6 April 2021).
  27. Astana Plans to Implement Pilot Project on Smart Grid. Available online: https://strategy2050.kz/en/news/45434/ (accessed on 7 April 2021).
  28. Saft Provides an Energy Storage Solution for Kazakhstan Wind Farm. Smart Energy International. Available online: https://www.smart-energy.com/industry-sectors/storage/saft-provides-an-energy-storage-solution-for-kazakhstan-wind-farm/ (accessed on 7 April 2021).
  29. Egyptian State Utility to Create Middle East’s First-Ever Smart Grid. Smart Energy International. Available online: https://www.smart-energy.com/industry-sectors/smart-grid/egyptian-state-utility-to-create-middle-easts-first-ever-smart-grid/ (accessed on 7 April 2021).
  30. Cabraal, A.; Ward, W.A.; Bogach, V.S.; Jain, A. Living in the Light: The Bangladesh Solar Home Systems Story; World Bank: Washington, DC, USA, 2021. [Google Scholar]
  31. KT Builds Smart Power Control System in Uzbekistan. Available online: http://www.businesskorea.co.kr/news/articleView.html?idxno=50809 (accessed on 24 April 2021).
  32. First Undergrid Mini-Grid Deployment in Nigeria a Success. Available online: https://www.esi-africa.com/industry-sectors/generation/solar/first-undergrid-mini-grid-deployment-in-nigeria-a-success/ (accessed on 7 April 2021).
  33. Cameroon Eyes Renewable Energy as It Scales Up Its Economy. Wartsila. Available online: https://www.wartsila.com/insights/article/cameroon-eyes-renewable-energy-as-it-scales-up-its-economy (accessed on 10 April 2021).
  34. Morocco Renewable Energy Target 2030. IEA. Available online: https://www.iea.org/policies/6557-morocco-renewable-energy-target-2030 (accessed on 10 April 2021).
  35. Bouraiou, A.; Necaibia, A.; Boutasseta, N.; Mekhilef, S.; Dabou, R.; Ziane, A.; Sahouane, N.; Attoui, I.; Mostefaoui, M.; Touaba, O. Status of renewable energy potential and utilization in Algeria. J. Clean. Prod. 2020, 246, 119011. [Google Scholar] [CrossRef]
  36. Jordan Making Strides in Renewable Energy Production. Available online: https://thearabweekly.com/jordan-making-strides-renewable-energy-production (accessed on 10 April 2021).
  37. Siddique, A.H.; Bloushi, H.K.A.; Lamont, L.A. Distributed generation and smart power grid UAE vision for 2030. In Proceedings of the 3rd IEEE PES Innovative Smart Grid Technologies Europe (ISGT Europe), Berlin, Germany, 14–17 October 2012. [Google Scholar]
  38. Turkey Sets Its Roadmap for Smart Grids. Available online: https://www.aa.com.tr/en/energy/electricity/turkey-sets-its-roadmap-for-smart-grids/19809 (accessed on 19 March 2021).
  39. Smart Grid Portfolio of Qatar Environment and Energy Research Institute (QEERI). Available online: https://www.hbku.edu.qa/en/qeeri/research-portfolios/sg (accessed on 7 April 2021).
  40. Prabhu, C. Over 25,000 Smart Meters Installed across Muscat. Available online: https://www.omanobserver.om/article/1101515/business/over-25000-smart-meters-installed-across-muscat (accessed on 2 September 2021).
  41. Jamal, S. Iran’s Smart Grid Deployment—From Smart Meter to Overall System Architecture. Available online: https://www.smart-energy.com/regional-news/africa-middle-east/irans-smart-grid-deployment-from-smart-meter-to-overall-system-architecture/ (accessed on 6 April 2021).
  42. Ruud, K.; Paul, K.; Anderson, H. Smart grids and Renewables—A Cost-Benefit Analysis Guide for Developing Countries; International Renewable Energy Agency (IRENA): Abu Dhabi, United Arab Emirates, 2015. [Google Scholar]
  43. OIC Economic Outlook 2020—Trade and Integration Challenges amid Rising Uncertainties; Economic Development Studies; SESRIC: Ankara, Turkey, 2020.
  44. Current Stance of Energy Resources and Potential in OIC Member Countries; OIC Outlook Series December 2012; SESRIC: Ankara, Turkey, 2012.
  45. Rusydiana, A.S.; Laila, N.; Tubastuvi, N.; Ibrahim, M.A.; Marlina, L. Energy Efficiency in OIC Countries: SDG 7 Output. Int. J. Energy Econ. Policy 2020, 11, 74–81. [Google Scholar] [CrossRef]
  46. Theron-Ord, A. Electricity Theft and Non-Technical Losses Total 96bn usd Annually—Report. Available online: https://www.smart-energy.com/regional-news/africa-middle-east/electricity-theft-96bn-annually/ (accessed on 30 March 2021).
  47. SESRIC. OIC Environment Report; SESRIC: Ankara, Turkey, 2019. [Google Scholar]
  48. Vineetha, C.P.; Babu, C.A. Smart grid challenges, issues and solutions. In Proceedings of the International Conference on Intelligent Green Building and Smart Grid (IGBSG), Taipei, Taiwan, 23–25 April 2014. [Google Scholar]
  49. Nayan, F.; Islam, M.A.; Mahmud, S. Feasibility study of smart grid in Bangladesh. Energy Power Eng. 2013, 5, 1531–1535. [Google Scholar] [CrossRef]
  50. Colak, I.; Sagiroglu, S.; Fulli, G.; Yesilbudak, M.; Covrig, C.-F. A survey on the critical issues in smart grid technologies. Renew. Sustain. Energy Rev. 2016, 54, 396–405. [Google Scholar] [CrossRef]
  51. Khurana, H.; Hadley, M.; Lu, N.; Frincke, D. Smart-grid security issues. IEEE Secur. Priv. Mag. 2010, 8, 81–85. [Google Scholar] [CrossRef]
  52. Komninos, N.; Philippou, E.; Pitsillides, A. Survey in smart grid and smart home security: Issues, challenges and countermeasures. IEEE Commun. Surv. Tutor. 2014, 16, 1933–1954. [Google Scholar] [CrossRef]
  53. Estimating the Costs and Benefits of the Smart Grid: A Preliminary Estimate of the Investment Requirements and the Resultant Benefits of a Fully Functioning Smart Grid; Electric Power Research Institute (EPRI): Palo Alto, CA, USA, 2011.
  54. IEEE Smart Grid. Available online: https://smartgrid.ieee.org/about-ieee-smart-grid (accessed on 18 December 2020).
  55. Bari, A.; Jiang, J.; Saad, W.; Jaekel, A. Challenges in the smart grid applications: An overview. Int. J. Distrib. Netw. 2014, 10. [Google Scholar] [CrossRef] [Green Version]
  56. Ahmadiahangar, R.; Rosin, A.; Palu, I.; Azizi, A. Challenges of smart grids implementation. In Demand-Side Flexibility in Smart Grid; SpringerBriefs in Applied Sciences and Technology; Springer: Singapore, 2020; ISBN 978-981-15-4627-3. [Google Scholar]
  57. Technology Roadmap—Smart Grids; International Energy Agency (IEA): Paris, France, 2011.
  58. Zheng, J.; Gao, D.W.; Lin, L. Smart Meters in Smart Grid: An Overview. In Proceedings of the IEEE Green Technologies Conference (GreenTech), Denver, CO, USA, 4–5 April 2013. [Google Scholar]
  59. Depuru, S.S.S.R.; Wang, L.; Devabhaktuni, V.; Gudi, N. Smart meters for power grid: Challenges, issues, advantages and status. In Proceedings of the IEEE/PES Power Systems Conference and Exposition, Phoenix, AZ, USA, 20–23 March 2011. [Google Scholar]
  60. Advanced Metering Infrastructure and Customer Systems—Results from the Smart Grid Investment Grant Program; Department of Energy: Washington, DC, USA, 2016.
  61. Distribution Automation—Results from the Smart Grid Investment Grant Program; Department of Energy: Washington, DC, USA, 2016.
  62. Vehicle-to-Grid (V2G): Everything You Need to Know. Virta Global. Available online: https://www.virta.global/vehicle-to-grid-v2g (accessed on 9 April 2021).
  63. Brenna, M.; Foiadelli, F.; Leone, C.; Longo, M. Electric Vehicles Charging Technology Review and Optimal Size Estimation. J. Electr. Eng. Technol. 2020, 15, 2539–2552. [Google Scholar] [CrossRef]
  64. Ahmad, S. Smart metering and home automation solutions for the next decade. In Proceedings of the International Conference on Emerging Trends in Networks and Computer Communications (ETNCC), Udaipur, India, 22–24 April 2011. [Google Scholar]
  65. Roberts, B.P.; Sandberg, C. The Role of Energy Storage in Development of Smart Grids. Proc. IEEE 2011, 99, 1139–1144. [Google Scholar] [CrossRef]
  66. Wade, N.; Taylor, P.; Lang, P.; Jones, P. Evaluating the benefits of an electrical energy storage system in a future smart grid. Energy Policy 2010, 38, 7180–7188. [Google Scholar] [CrossRef] [Green Version]
  67. Guney, M.S.; Tepe, Y. Classification and assessment of energy storage systems. Renew. Sustain. Energy Rev. 2017, 75, 1187–1197. [Google Scholar] [CrossRef]
  68. Radhakrishnan, B.M.; Srinivasan, D. A multi-agent based distributed energy management scheme for smart grid applications. Energy 2016, 103, 192–204. [Google Scholar] [CrossRef]
  69. Alagoz, B.; Kaygusuz, A.; Karabiber, A. A user-mode distributed energy management architecture for smart grid applications. Energy 2012, 44, 167–177. [Google Scholar] [CrossRef]
  70. Deb, S.; Tammi, K.; Kalita, K.; Mahanta, P. Impact of Electric Vehicle Charging Station Load on Distribution Network. Energies 2018, 11, 178. [Google Scholar] [CrossRef] [Green Version]
  71. Gungor, V.C.; Lu, B.; Hancke, G.P. Opportunities and Challenges of Wireless Sensor Networks in Smart Grid. IEEE Trans. Ind. Electron. 2010, 57, 3557–3564. [Google Scholar] [CrossRef] [Green Version]
  72. Zhang, Q.; Sun, Y.; Cui, Z. Application and analysis of ZigBee technology for Smart Grid. In Proceedings of the International Conference on Computer and Information Application, Tianjin, China, 3–5 December 2010. [Google Scholar]
  73. Li, L.; Xiaoguang, H.; Ke, C.; Ketai, H. The applications of WiFi-based Wireless Sensor Network in Internet of Things and Smart Grid. In Proceedings of the 6th IEEE Conference on Industrial Electronics and Applications, Beijing, China, 21–23 June 2011. [Google Scholar]
  74. Usman, A.; Shami, S.H. Evolution of communication technologies for smart grid applications. Renew. Sustain. Energy Rev. 2013, 19, 191–199. [Google Scholar] [CrossRef]
  75. Karagiannis, G.; Pham, G.T.; Nguyen, A.D.; Heijenk, G.J.; Haverkort, B.R.; Campfens, F. Performance of LTE for smart grid communications. In Measurement, Modelling, and Evaluation of Computing Systems and Dependability and Fault Tolerance; Lecture Notes in Computer Science; Springer: Cham, Switzerland, 2014. [Google Scholar]
  76. Gungor, V.C.; Sahin, D.; Kocak, T.; Ergut, S.; Buccella, C.; Cecati, C.; Hancke, G.P. Smart grid technologies: Communication technologies and standards. IEEE Trans. Ind. Inform. 2011, 7, 529–539. [Google Scholar] [CrossRef] [Green Version]
  77. Kabalci, E.; Kabalci, Y. Roadmap from smart grid to internet of energy concept. From Smart Grid to Internet of Energy; Academic Press: Cambridge, MA, USA, 2019; ISBN 978-0-12-819710-3. [Google Scholar]
  78. Dorsch, N.; Kurtz, F.; Georg, H.; Hagerling, C.; Wietfeld, C. Software-defined networking for Smart Grid communications: Applications, challenges and advantages. In Proceedings of the IEEE International Conference on Smart Grid Communications (SmartGridComm), Venice, Italy, 3–6 November 2014. [Google Scholar]
  79. Zhang, J.; Seet, B.-C.; Lie, T.-T.; Foh, C.H. Opportunities for software-defined networking in smart grid. In Proceedings of the 9th International Conference on Information, Communications & Signal Processing, Tainan, Taiwan, 10–13 December 2013. [Google Scholar]
  80. Power Quality Aspect of Smart Grid. Asia Power Quality Initiative. Available online: https://apqi.org/archives/1370 (accessed on 1 January 2021).
  81. Bollen, M.; Zhong, J.; Zavoda, F.; Meyer, J.; McEachern, A.; Lopez, F.C. Power quality aspects of smart grids. In Proceedings of the International Conference on Renewable Energies and Power Quality (ICREPQ’10), Granada, Spain, 23–25 March 2010. [Google Scholar]
  82. Metke, A.R.; Ekl, R.L. Smart grid security technology. In Proceedings of the Innovative Smart Grid Technologies (ISGT), Gaithersburg, MD, USA, 19–21 January 2010. [Google Scholar]
  83. Logenthiran, T.; Srinivasan, D.; Shun, T.Z. Demand Side Management in Smart Grid using Heuristic Optimization. IEEE Trans. Smart Grid 2012, 3, 1244–1252. [Google Scholar] [CrossRef]
  84. Mohsenian-Rad, A.-H.; Wong, V.W.S.; Jatskevich, J.; Schober, R.; Leon-Garcia, A. Autonomous Demand-Side Management Based on Game-Theoretic Energy Consumption Scheduling for the Future Smart Grid. IEEE Trans. Smart Grid 2010, 1, 320–331. [Google Scholar] [CrossRef] [Green Version]
  85. Demand Side Management vs. Demand Response: 4 Main Differences. Respond-Demand Response for All. Available online: http://project-respond.eu/4-differences-between-demand-side-management-demand-response/ (accessed on 6 January 2021).
  86. Khan, A.R.; Mahmood, A.; Safdar, A.; Khan, Z.A.; Khan, N.A. Load forecasting, dynamic pricing and DSM in smart grid: A review. Renew. Sustain. Energy Rev. 2016, 54, 1311–1322. [Google Scholar] [CrossRef]
  87. What Is SCADA? Inductive Automation. Available online: https://www.inductiveautomation.com/resources/article/what-is-scada (accessed on 21 January 2021).
  88. Gelazanskas, L.; Gamage, K.A. Demand side management in smart grid: A review and proposals for future direction. Sustain. Cities Soc. 2014, 11, 22–30. [Google Scholar] [CrossRef]
  89. Saffre, F.; Gedge, R. Demand-side management for the smart grid. In Proceedings of the IEEE/IFIP Network Operations and Management Symposium Workshops, Osaka, Japan, 19–23 April 2010. [Google Scholar]
  90. Siano, P. Demand response and smart grids—A survey. Renew. Sustain. Energy Rev. 2014, 30, 461–478. [Google Scholar] [CrossRef]
  91. Rahimi, F.; Ipakchi, A. Demand response as a market resource under the smart grid paradigm. IEEE Trans. Smart Grid 2010, 1, 82–88. [Google Scholar] [CrossRef]
  92. Chan, S.; Tsui, K.; Wu, H.; Hou, Y.; Wu, Y.-C.; Wu, F. Load/price Forecasting and Managing Demand Response for Smart Grids: Methodologies and Challenges. IEEE Signal Process. Mag. 2012, 29, 68–85. [Google Scholar] [CrossRef]
  93. Neupane, B.; Perera, K.S.; Aung, Z.; Woon, W.L. Artificial Neural Network-based Electricity Price Forecasting for smart grid deployment. In Proceedings of the International Conference on Computer Systems and Industrial Informatics, Sharjah, United Arab Emirates, 18–20 December 2012. [Google Scholar]
  94. Karabiber, O.A.; Xydis, G. Electricity Price Forecasting in the Danish Day-Ahead Market Using the TBATS, ANN and ARIMA Methods. Energies 2019, 12, 928. [Google Scholar] [CrossRef] [Green Version]
  95. Wang, K.; Xu, C.; Zhang, Y.; Guo, S.; Zomaya, A.Y. Robust big data analytics for electricity price forecasting in the smart grid. IEEE Trans. Big Data 2019, 5, 34–45. [Google Scholar] [CrossRef]
  96. Sofla, M.A.; King, R. Control method for multi-microgrid systems in smart grid environment: Stability, optimization and smart demand participation. In Proceedings of the IEEE PES Innovative Smart Grid Technologies (ISGT), Washington, DC, USA, 16–20 January 2012. [Google Scholar]
  97. Cagnano, A.; Tuglie, E.D.; Mancarella, P. Microgrids: Overview and guidelines for practical implementations and operation. Appl. Energy 2020, 258. [Google Scholar] [CrossRef]
  98. Speer, B.; Miller, M.; Schaffer, W.; Netz, S.; Jang, B.; Widegren, K. The Role of Smart Grids in Integrating Renewable Energy; International Smart Grid Action Network (ISGAN): Washington, DC, USA, 2015. [Google Scholar]
  99. Hua, H.; Qin, Y.; Hao, C.; Cao, J. Stochastic Optimal Control for Energy Internet: A Bottom-up Energy Management Approach. IEEE Trans. Ind. Inform. 2019, 15, 1788–1797. [Google Scholar] [CrossRef]
  100. Hua, H.; Qin, Y.; Hao, C.; Cao, J. Optimal energy management strategies for energy internet via deep reinforcement learning approach. Appl. Energy 2019, 239, 598–609. [Google Scholar] [CrossRef]
  101. Gürel, E.; Tat, M. SWOT analysis: A theoretical review. J. Int. Soc. Res. 2017, 10, 994–1006. [Google Scholar] [CrossRef]
  102. Saaty, T.L. Decision making with the analytic hierarchy process. Int. J. Serv. Sci. 2008, 1, 83–98. [Google Scholar] [CrossRef] [Green Version]
  103. Kurttila, M.; Pesonen, M.; Kangas, J.; Kajanus, M. Utilizing the analytic hierarchy process (AHP) in SWOT analysis–A hybrid method and its application to a forest-certification case. For. Policy Econ. 2000, 1, 41–52. [Google Scholar] [CrossRef]
  104. Zavadskas, E.K.; Govindan, K.; Antucheviciene, J.; Turskis, Z. Hybrid multiple criteria decision-making methods: A review of applications for sustainability issues. Econ. Res.-Ekon. Istraživanja 2016, 29, 857–887. [Google Scholar] [CrossRef] [Green Version]
  105. Shyur, H.-J.; Shih, H.-S. A hybrid MCDM model for strategic vendor selection. Math. Comput. Model. 2006, 44, 749–761. [Google Scholar] [CrossRef]
  106. Ali, T.; Nahian, A.J.; Ma, H. A hybrid multi-criteria decision-making approach to solve renewable energy technology selection problem for Rohingya refugees in Bangladesh. J. Clean. Prod. 2020, 273. [Google Scholar] [CrossRef]
  107. Wang, P. Smart Grid Drivers and Technologies by Country, Economies, and Continent; International Smart Grid Action Network (ISGAN): Washington, DC, USA, 2021. [Google Scholar]
  108. Donegan, H.; Dodd, F. A note on Saaty’s random indexes. Math. Comput. Model. 1991, 15, 135–137. [Google Scholar] [CrossRef]
  109. Weihrich, H. The TOWS matrix—A tool for situational analysis. Long Range Plan. 1982, 15, 54–66. [Google Scholar] [CrossRef]
  110. McLaughlin, S.; Holbert, B.; Fawaz, A.; Berthier, R.; Zonouz, S. A multi-sensor energy theft detection framework for advanced metering infrastructures. IEEE J. Sel. Areas Commun. 2013, 31, 1319–1330. [Google Scholar] [CrossRef]
  111. How Much Does An Electric Car Charging Station Installation Cost? HomeAdvisor. Available online: https://www.homeadvisor.com/cost/garages/install-an-electric-vehicle-charging-station/#calc (accessed on 8 March 2021).
  112. Ancillotti, E.; Bruno, R.; Conti, M. The role of communication systems in smart grids: Architectures, technical solutions and research challenges. Comput. Commun. 2013, 36, 1665–1697. [Google Scholar] [CrossRef] [Green Version]
  113. Hwang, C.-L.; Yoon, K. Methods for multiple attribute decision-making. In Multiple Attribute Decision Making; Lecture Notes in Economics and Mathematical Systems; Springer: Berlin/Heidelberg, Germany, 1981; ISBN 978-3-642-48318-9. [Google Scholar]
  114. The SDGs in Action. UNDP. Available online: https://www.undp.org/content/undp/en/home/sustainable-development-goals.html (accessed on 24 January 2021).
  115. Khan, F. The 2020 SDG Index and the Muslim World. Available online: https://www.dailysabah.com/opinion/op-ed/the-2020-sdg-index-and-the-muslim-world (accessed on 24 January 2021).
  116. Schwab, K. The Fourth Industrial Revolution; Currency Books: New York, NY, USA, 2017; ISBN 978-1-5247-5886-8. [Google Scholar]
  117. Society 5.0. Cabinet Office, Government of Japan. Available online: https://www8.cao.go.jp/cstp/english/society5_0/index.html (accessed on 25 April 2021).
Figure 1. Structure of this paper using the concept mapping approach.
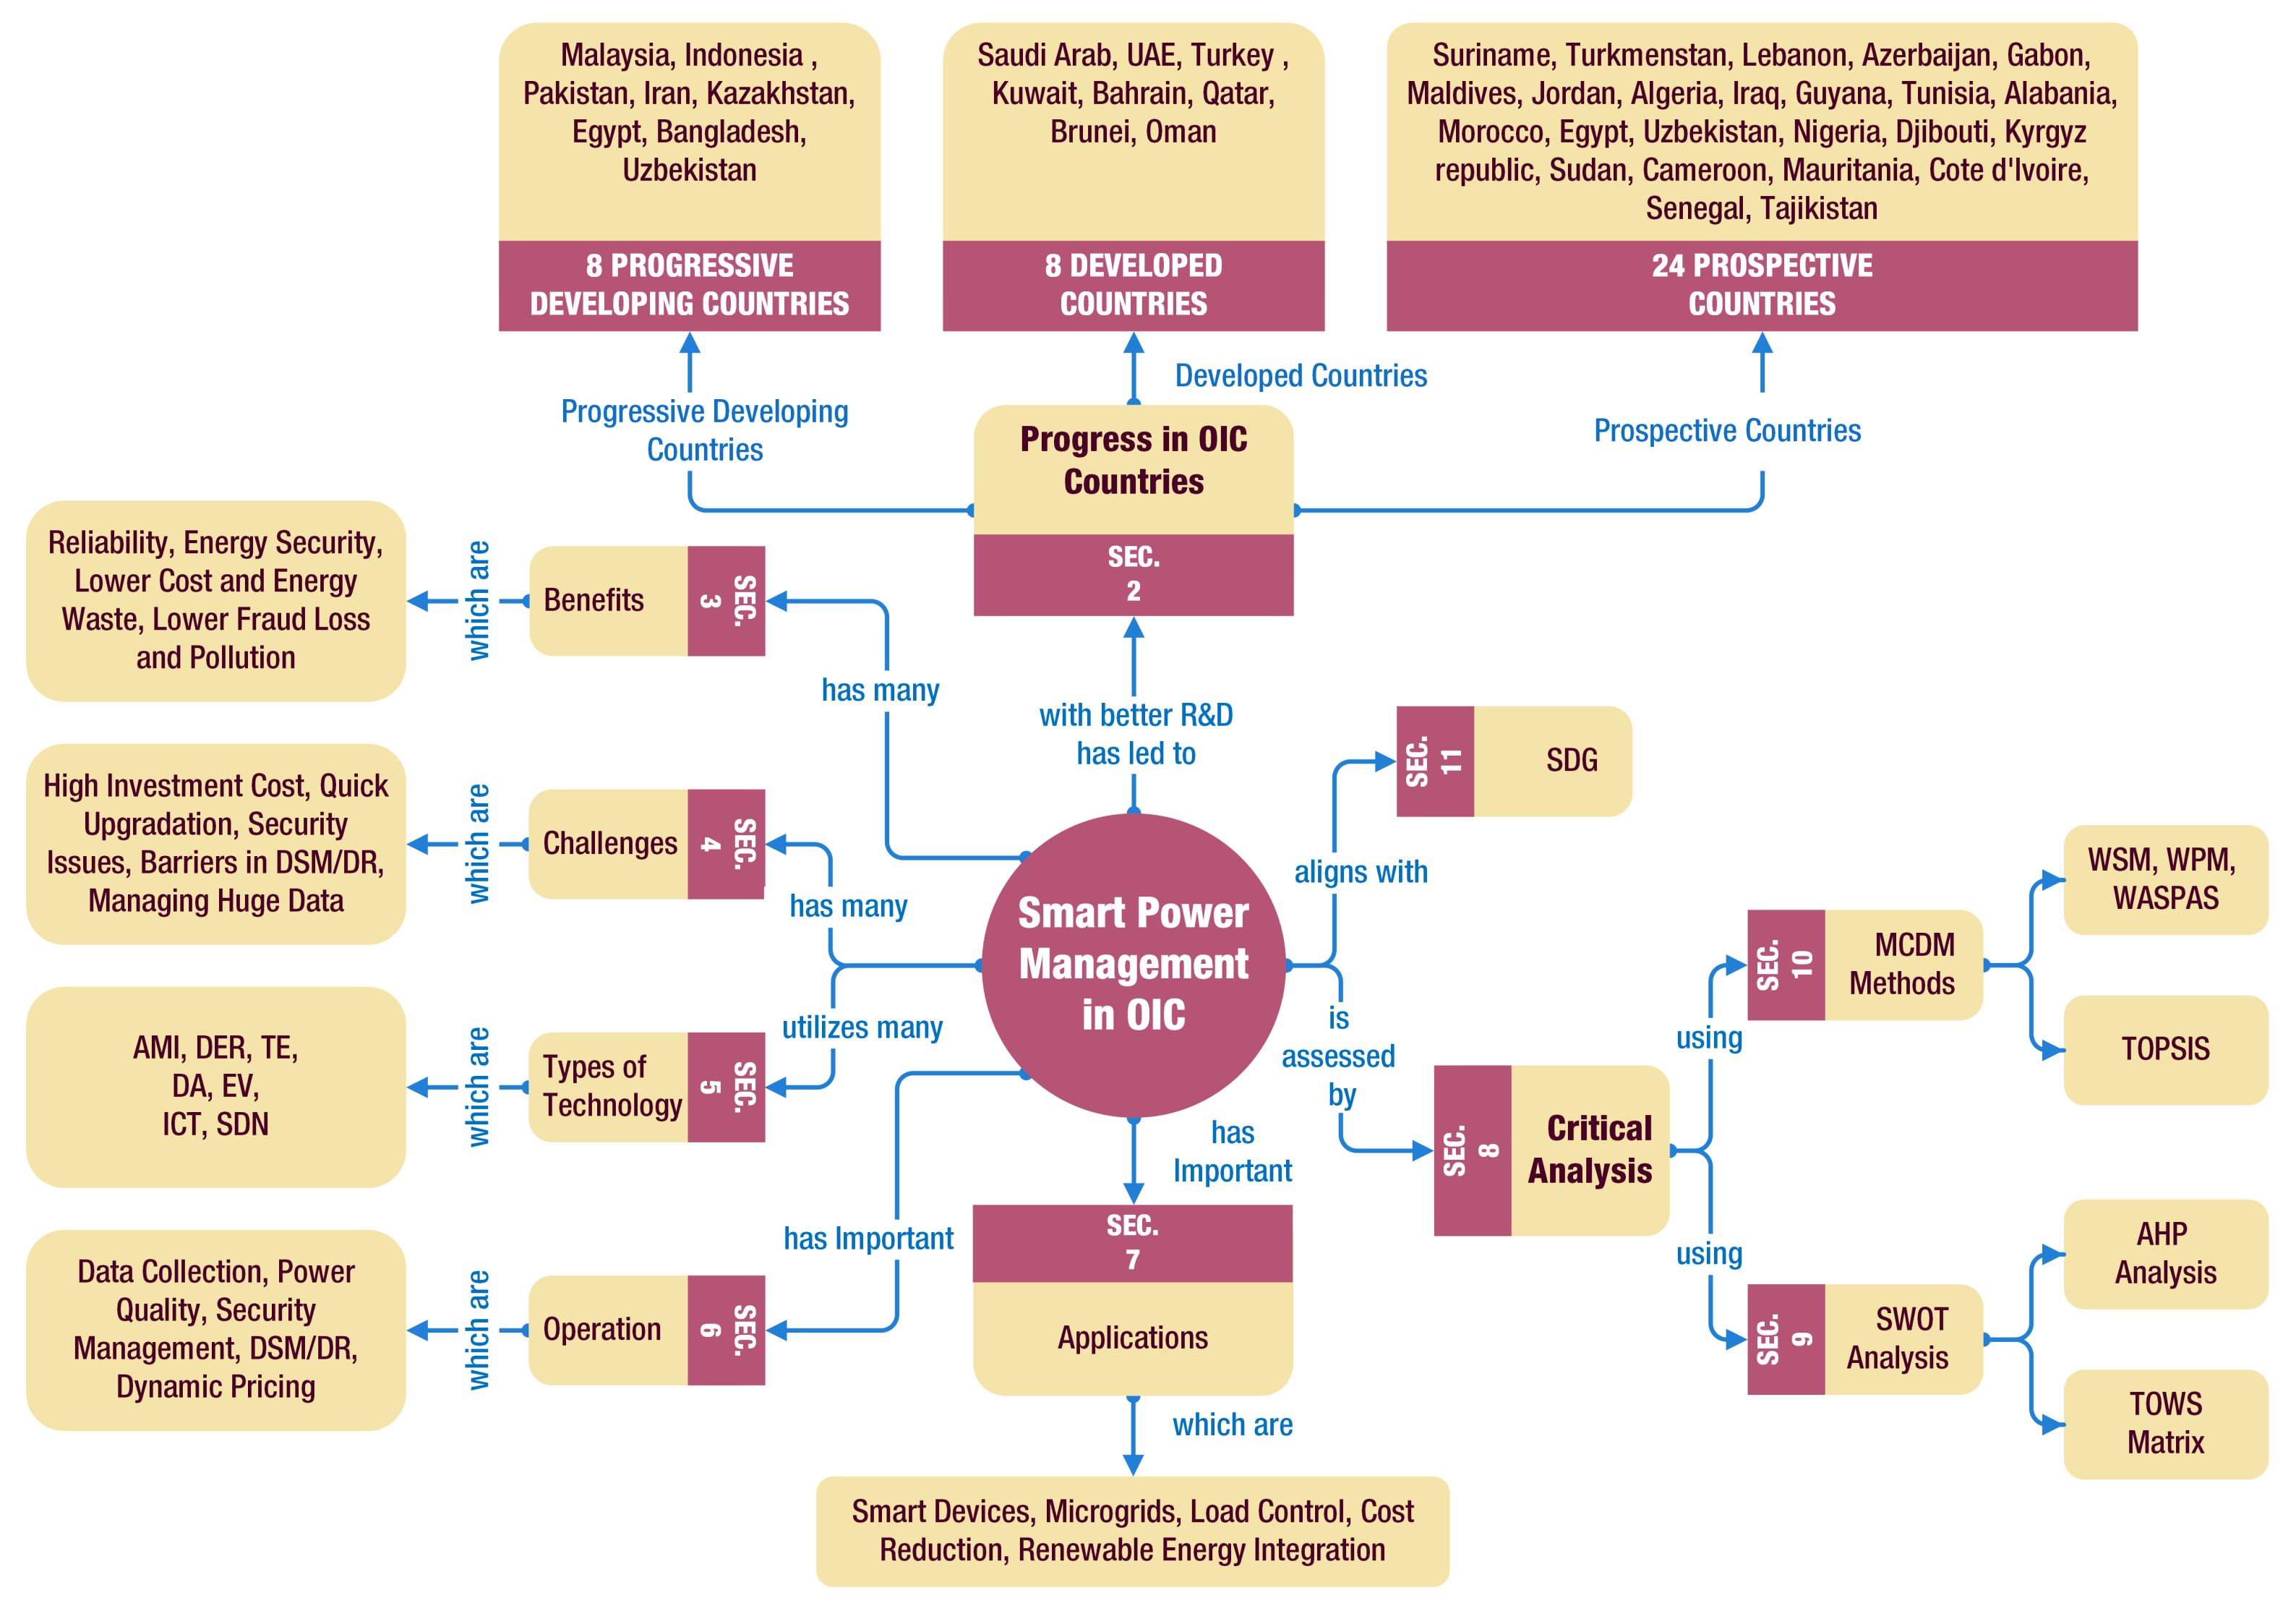
Energies 14 06480 g001
Figure 2. OIC countries and non-OIC developed countries on the world map that are undertaking steps in the development and deployment of smart power management.
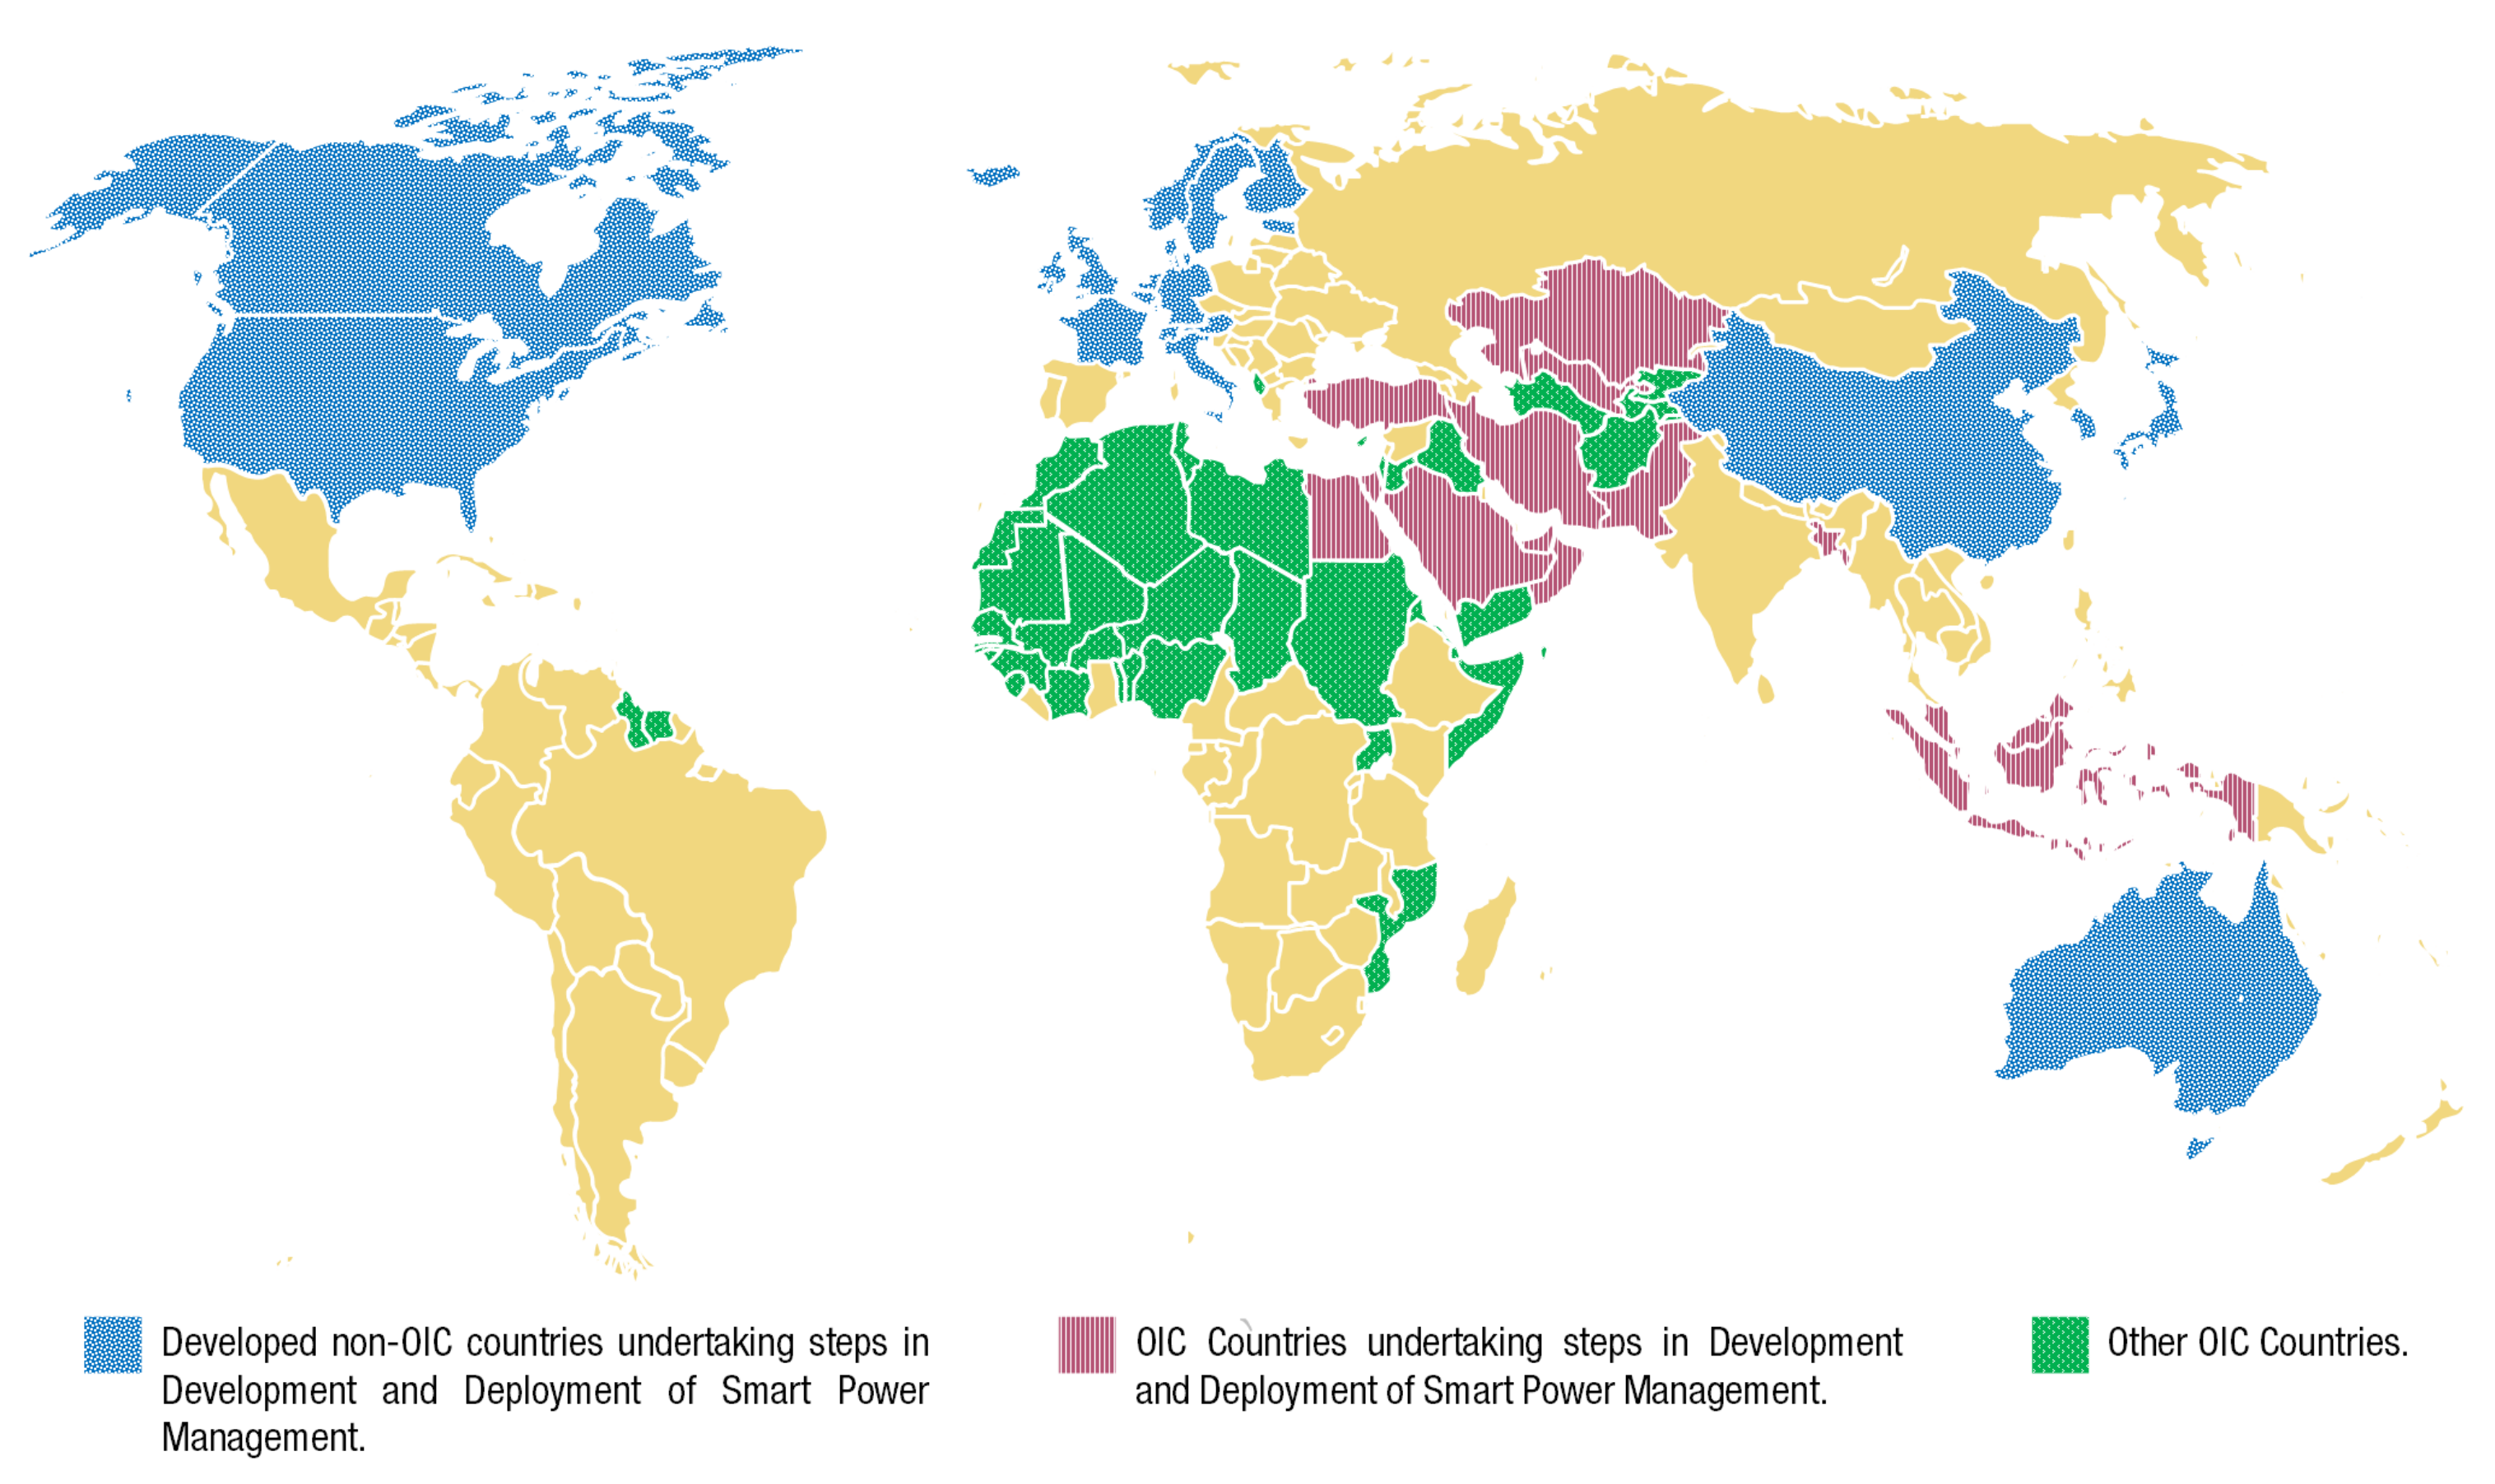
Energies 14 06480 g002
Figure 3. The overall architecture of the smart power management technologies.
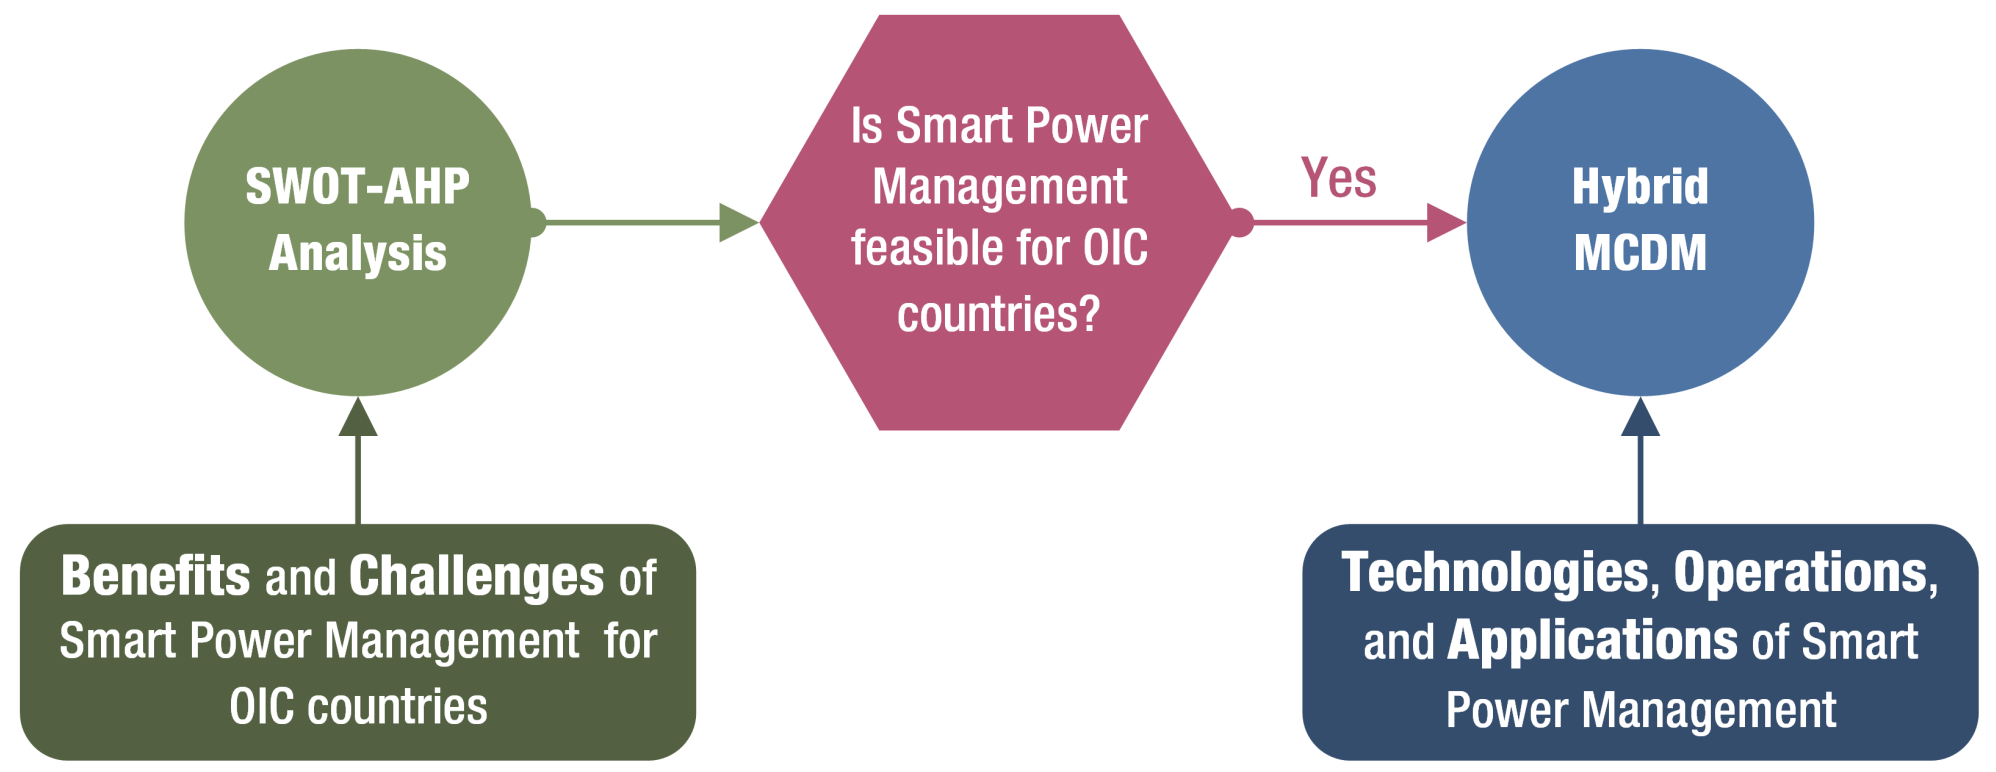
Energies 14 06480 g003
Figure 4. The overall process of the critical analysis.
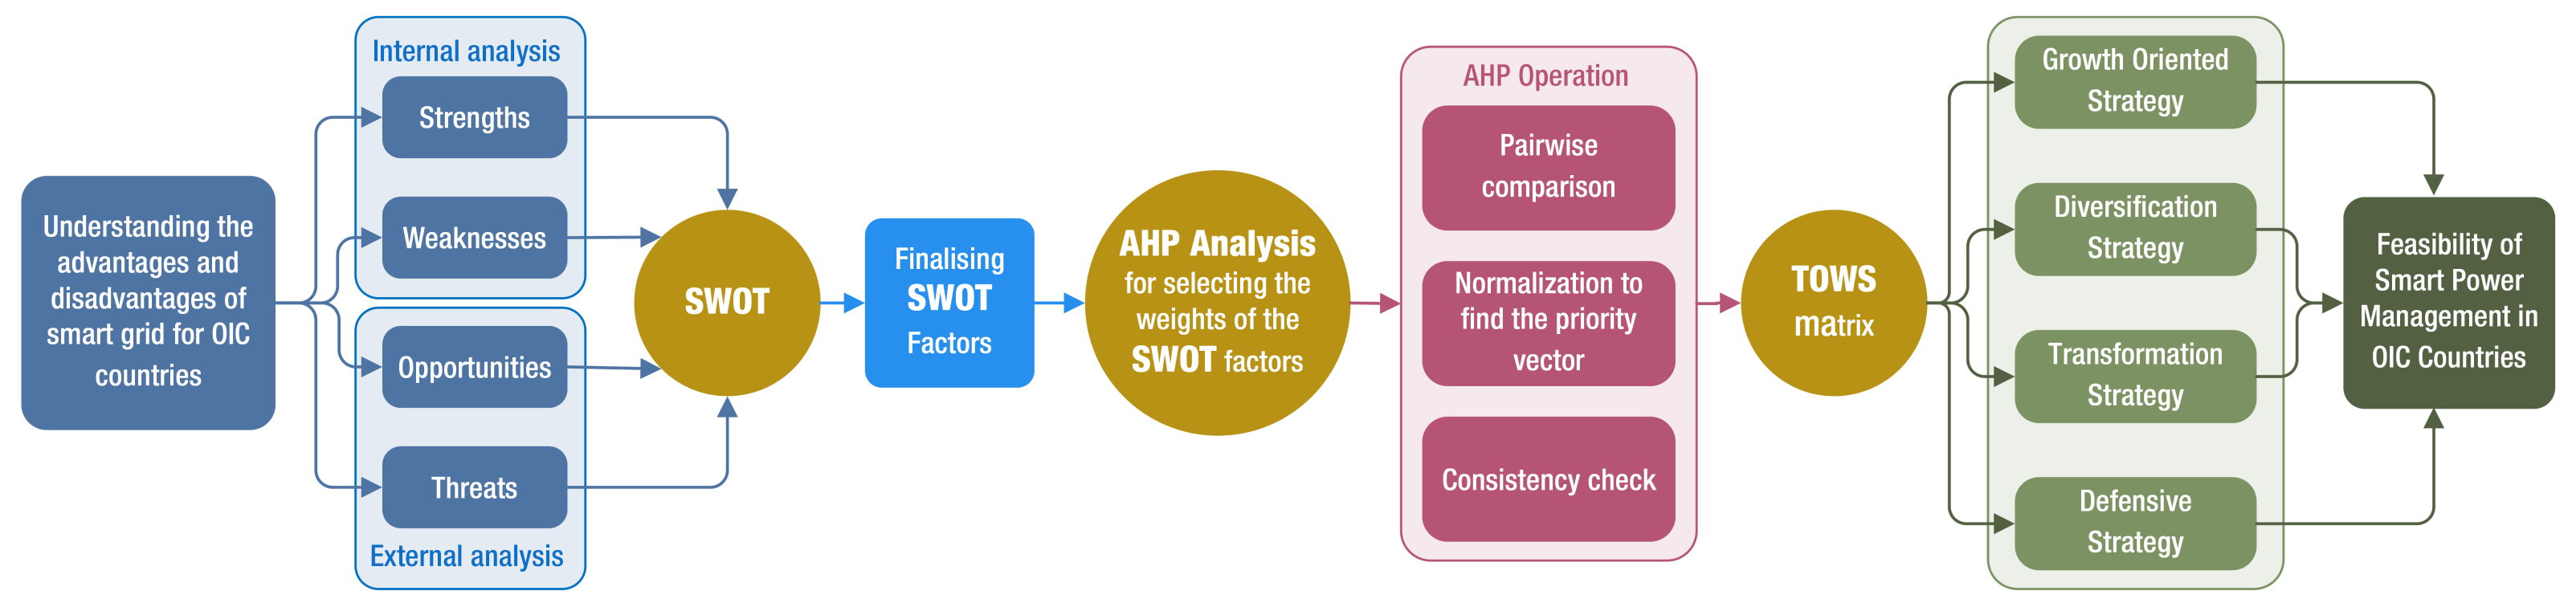
Energies 14 06480 g004
Figure 5. Process of the SWOT-AHP-TOWS analysis.
Energies 14 06480 g005
Figure 6. Process of hybrid MCDM analysis.
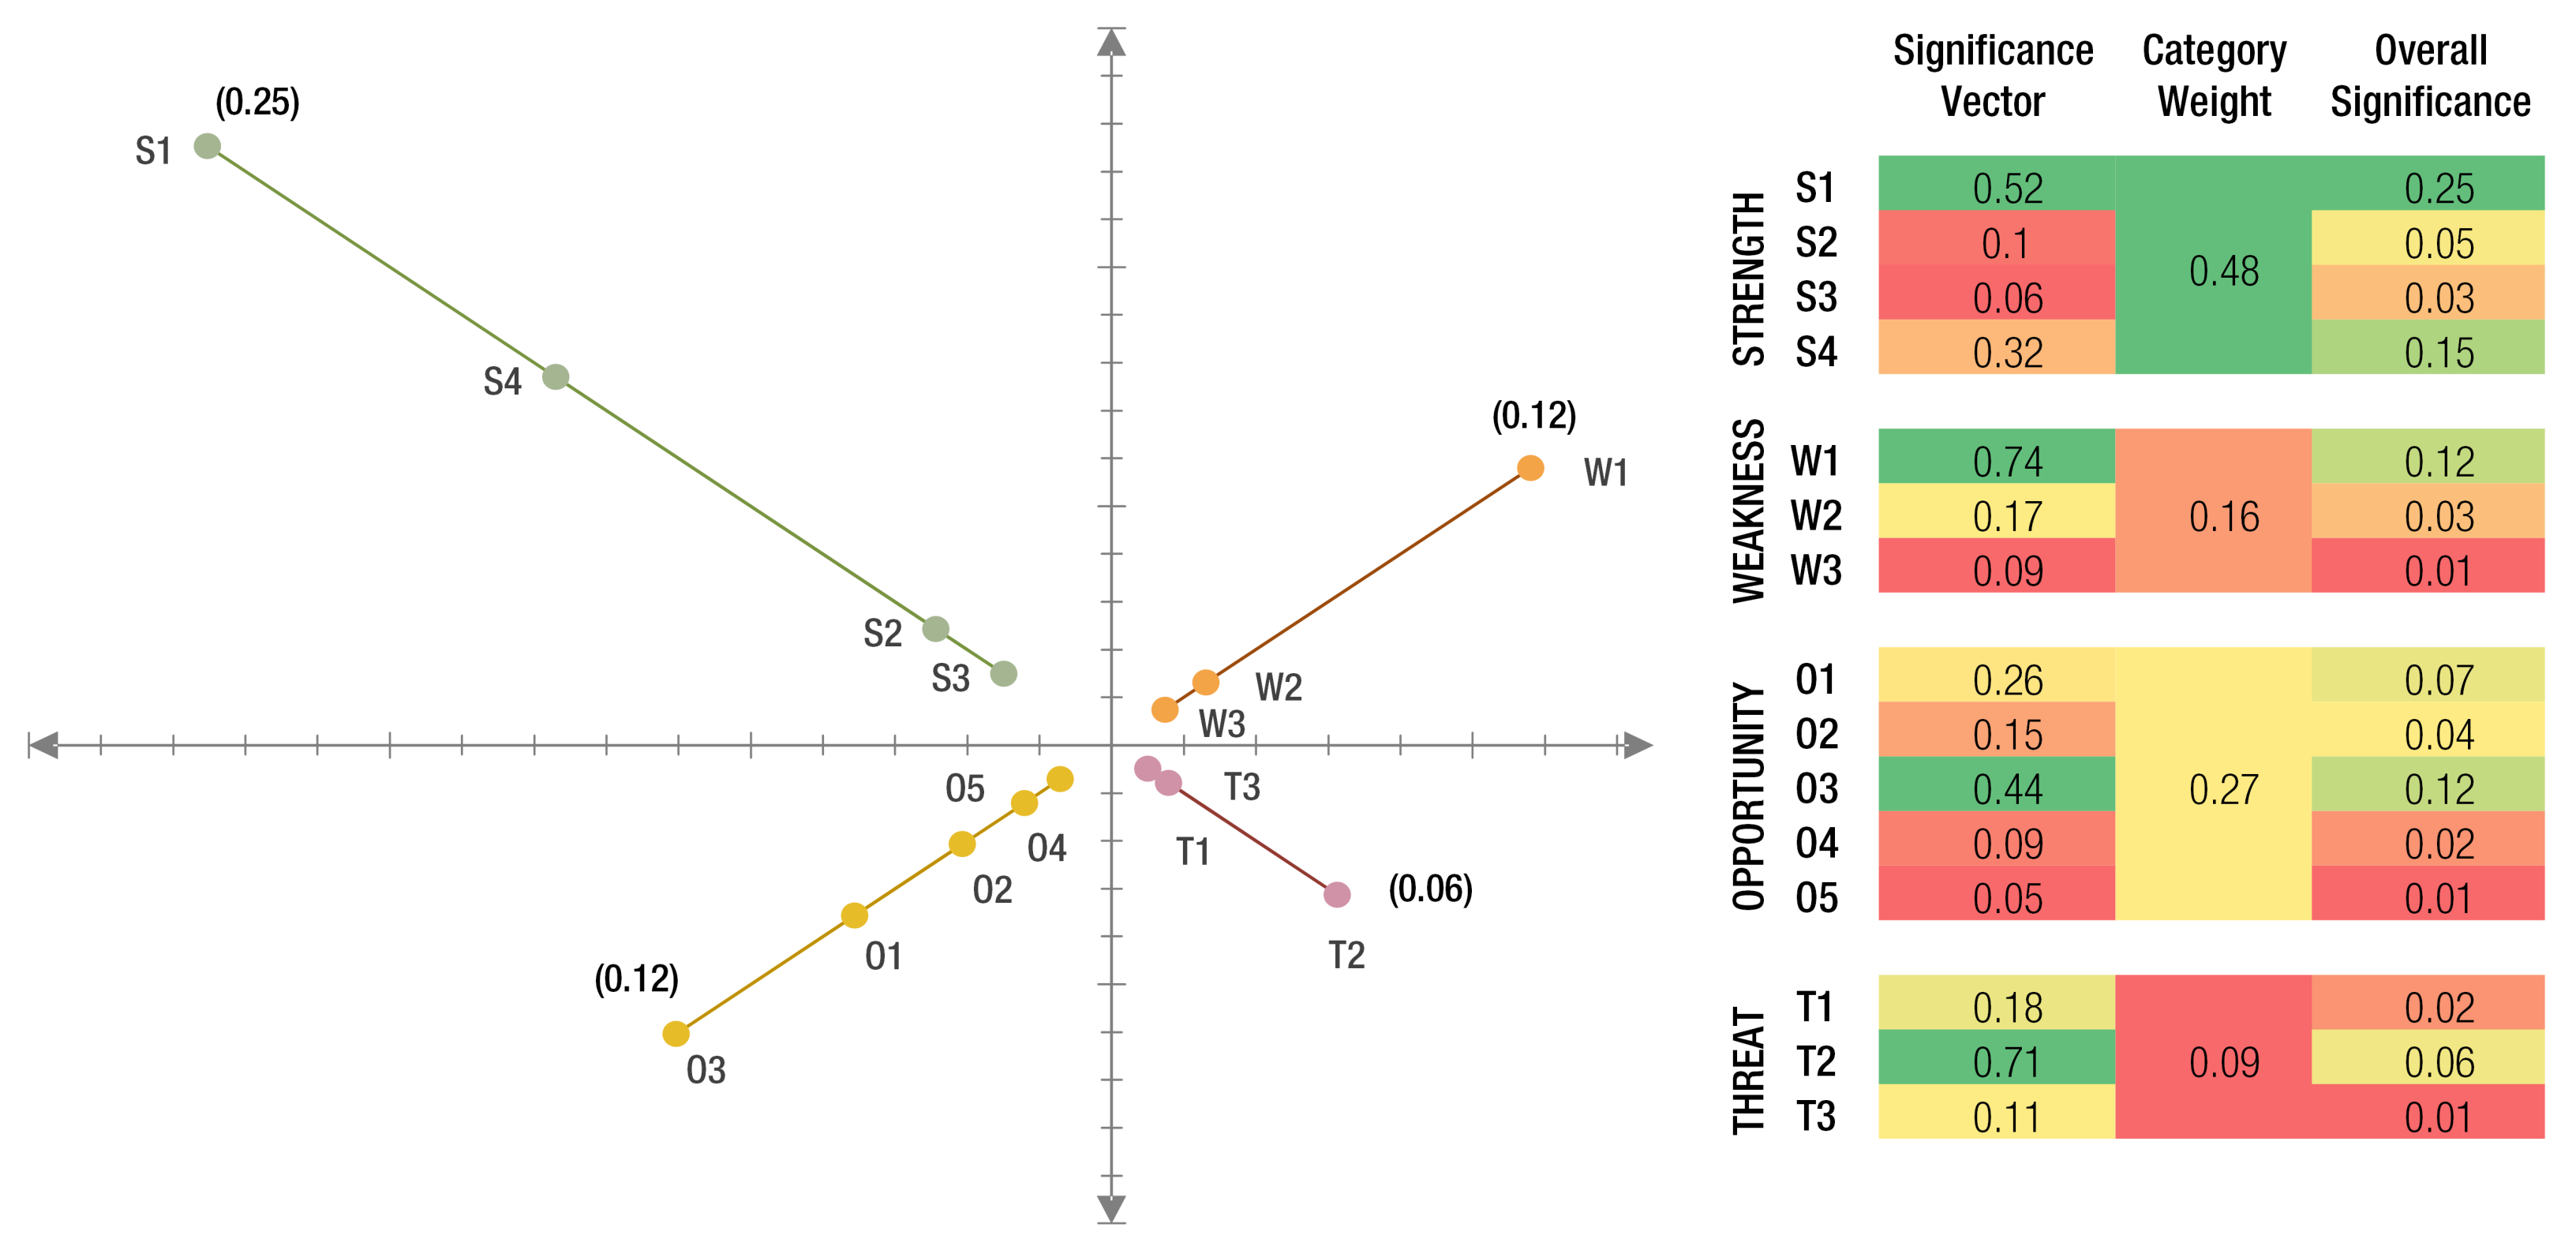
Energies 14 06480 g006
Figure 7. The perception map of the SWOT Factors.
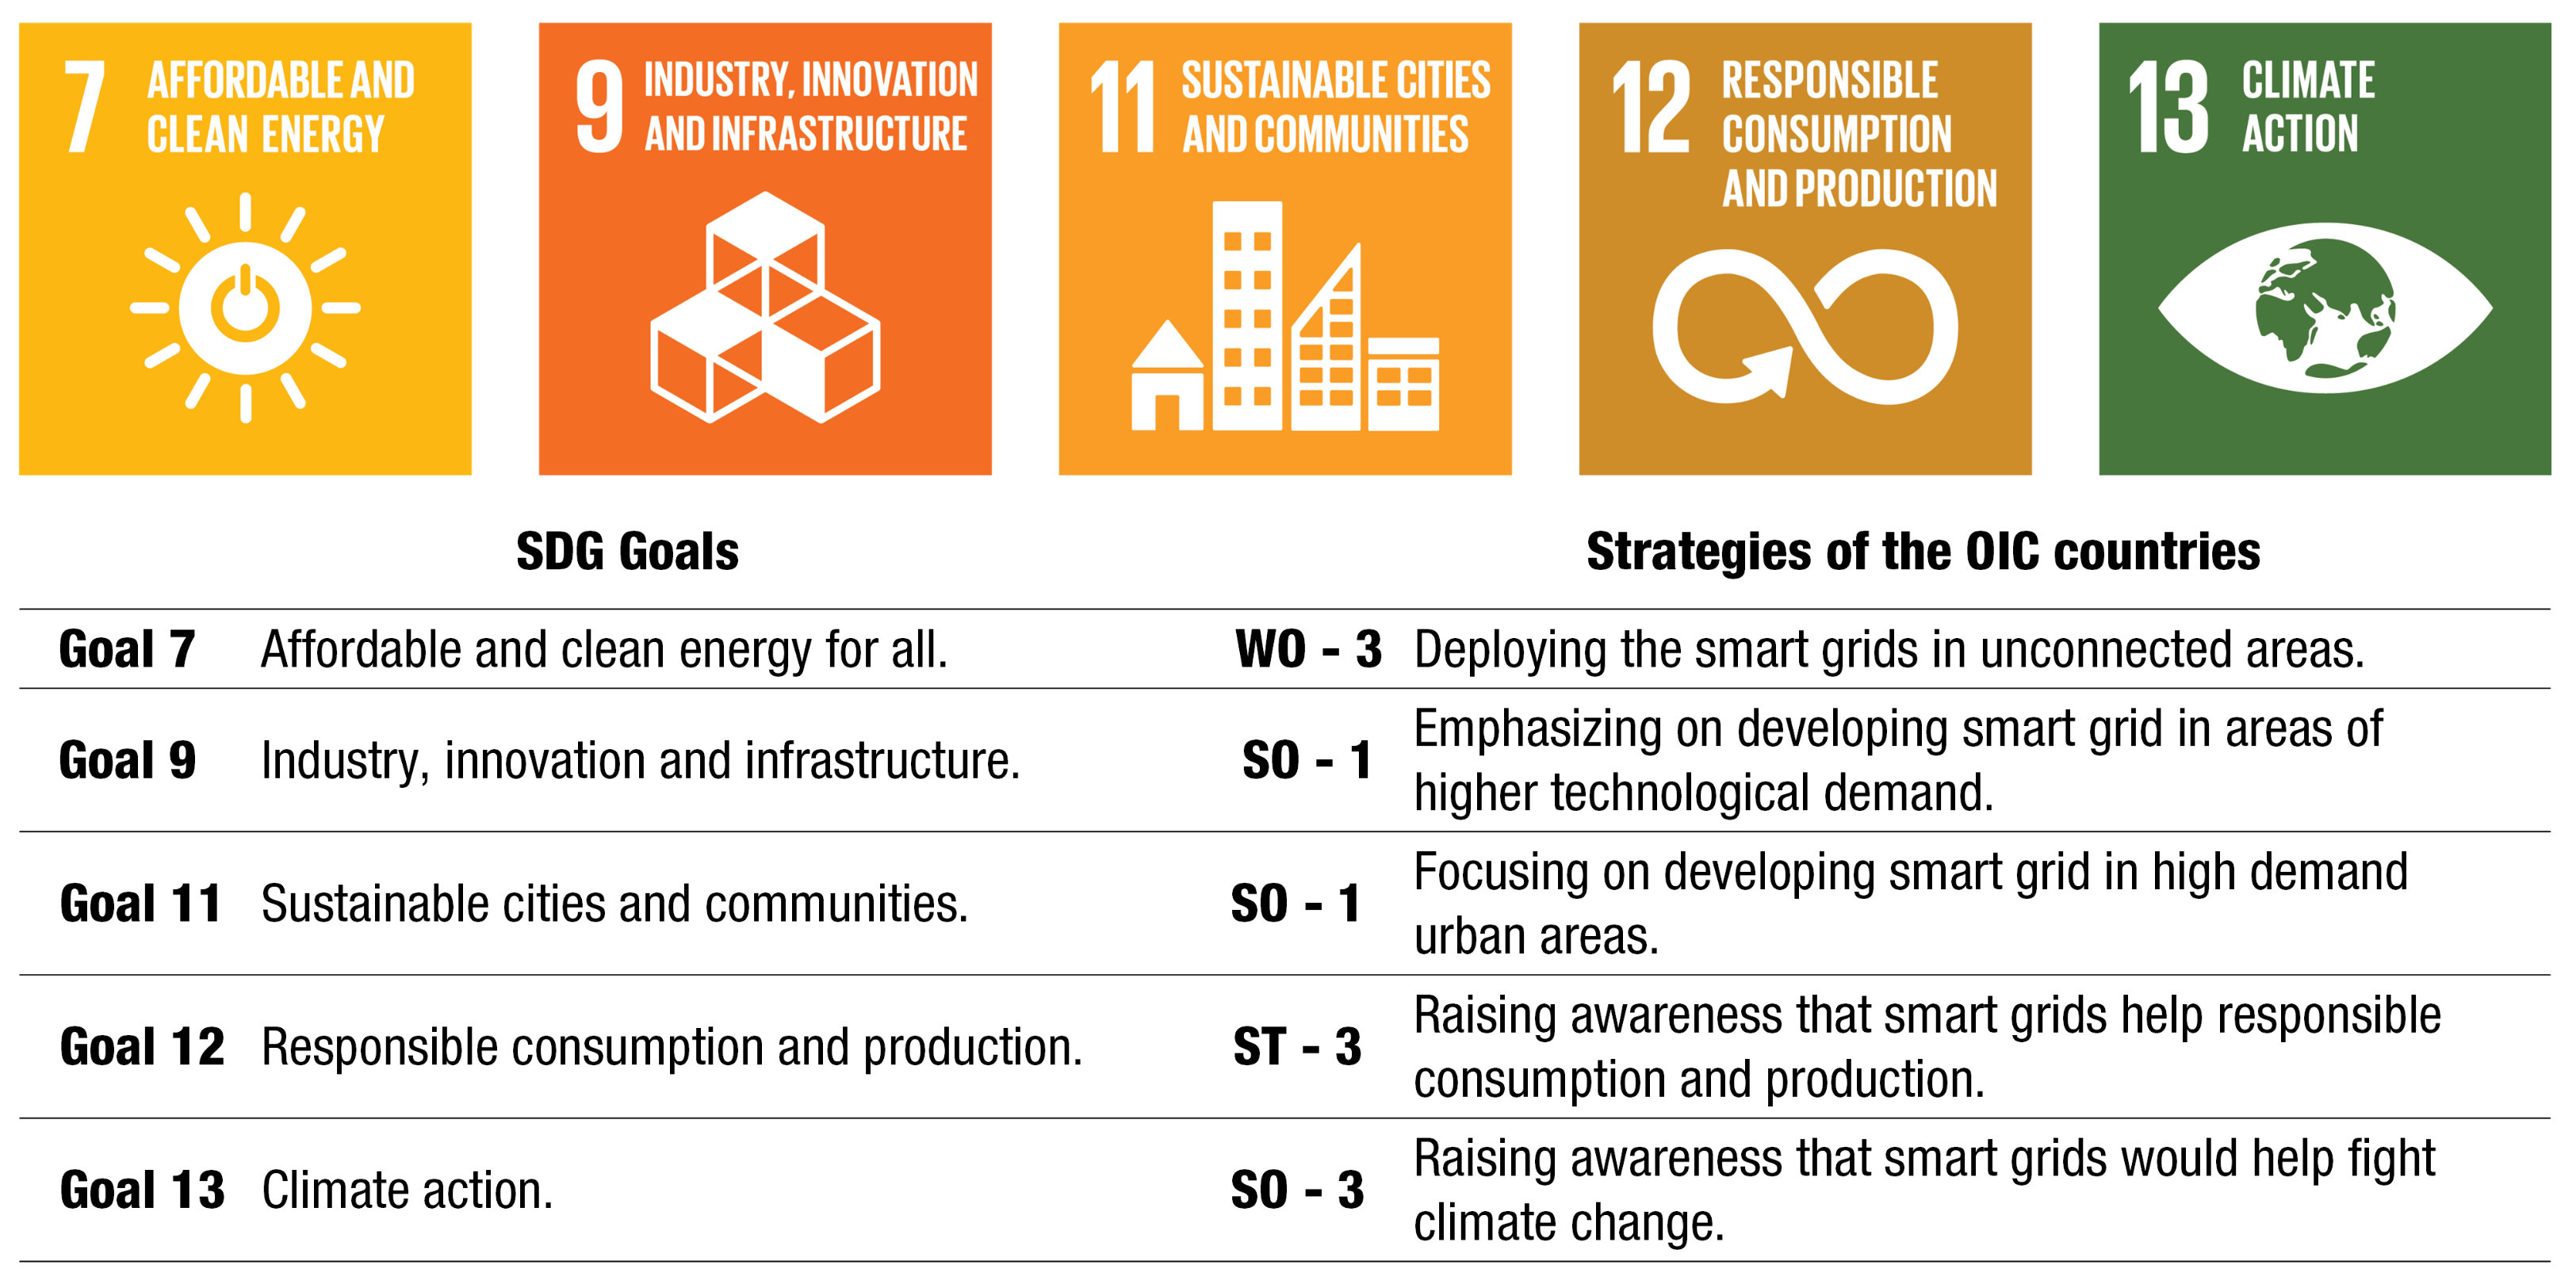
Energies 14 06480 g007
Figure 8. Smart Power management adaptation strategies in the OIC countries and the Sustainable Development Goals (SDGs).
Energies 14 06480 g008
Table 1. Summary of advancements of the non-OIC member countries with smart power management initiatives.
CountriesAdvancement with Smart Power Management Initiatives
USA39 states and the district of Columbia took 276 policies and deployment actions. Investments are expected to rise to 13.8 billion US dollars in 2024 [5].
Canada135 smart grid Research and Development (R&D) projects worth 785 million Canadian dollars are being undertaken. All of Canada’s 10 provinces started smart grid applications [5].
UKUK’s Department of Energy and Climate Change invested 278 renewable energy projects worth 175 million pounds, as well as 70 million pounds in the R&D of smart energy management [5].
FranceR&D projects related to smart power management received more than 120 million euros of public and private investments. Twenty-eight major demonstrators were funded so far [5].
AustraliaThe Australian Renewable Energy Agency (ARENA) invested in smart power management R&D, which ranges from 7 million to 35.7 million Australian dollars on advanced power system services, demand response, renewable energy projects, and short-term forecasting [5].
DenmarkApproximately 134 million euros would be invested in smart power management R&D by 2024 [5].
GermanyOver 200 million euros are being invested on 5 major smart power management and smart grid projects [5].
Republic of KoreaThe domestic smart grid market grew to 2.2 billion US dollars in 2020, at a growth rate of 28 percent from 2012. In 2018, a smart energy city was planned to be built in Seoul [5].
JapanIt is set to build the largest Energy Storage System (ESS) of 720 MWh storage. Significant efforts are being undertaken to develop Virtual Power Plants (VPPs) and Electric Vehicle (EV) infrastructure [6].
ChinaChina’s National Key Research and Development Program was formed in 2011 to spearhead the transition to smart power management in the whole country by 2050 [5].
IndiaThe government is planning to build 100 smart cities, investing in renewable energy and EVs [5].
Table 2. Summary of advancements of the OIC member countries with smart power management initiatives.
CountriesAdvancement with Smart Power Management Initiatives
Developed countries (8 countries)
KSAIn KSA, the Electricity and Co-Generation Regulatory Authority (ECRA) and the Saudi Electricity Company (SEC) both have strategies relating to smart grid implementation [5].
UAEIn UAE, over a million smart meter installations have been completed since 2016 [9].
TurkeyTurkey is the biggest renewable energy user of the OIC [10]; It has set a roadmap to implement a smart grid by 2035 [11]
KuwaitKuwait has deployed over 1 million smart meters [12]; partnering up with EU and private corporations in deploying Advanced Metering Infrastructure (AMI) and Information and Communications Technology (ICT) [13,14], and is also planning to incorporate renewable energy [15].
BahrainIn Bahrain, 20% households already have smart meters [16]; Bahrain Sustainable Energy Unit (SEU) has been tasked with the formulation of strategies and policies, and cooperating with private corporations [17].
QatarQatar is planning a nationwide smart grid roll-out [18]. DSM and EV charging programs have been initiated [19].
BruneiBrunei is deploying 200 thousand smart meters to bring smart power management schemes to every household [20].
OmanIn Oman, smart meters are being installed at several key parts of the country [21].
Progressive developing countries (8 countries)
MalaysiaIn Malaysia, Government plans to install almost 9.1 million smart meters in peninsular Malaysia by 2026 [22].
IndonesiaIndonesia is slated to have 25 operational smart grid projects by 2024 [23].
PakistanIn Pakistan, funds have been secured for Advanced Metering Infrastructure (AMI), Distribution Automation (DA) and Distributed Energy Resources (DER) development; installed over 40 thousand smart meters in 3 cities and undertaking limited scale projects [24].
IranIran is focusing on Advanced Metering Infrastructure (AMI) development [25] and plans to fully incorporate smart power management by 2025 [25], and the share of renewable energy is increasing [26].
KazakhstanKazakhstan launched a pilot project in 2017 [27], and is developing its renewable energy sector and incorporating Energy Storage Systems (ESS) [28].
EgyptEgypt has signed a contract with Schneider Electric to implement the first country-wide smart grid project in the middle east [29].
BangladeshMassive implementation of individual solar home system in rural areas has led to it being the global leader in Solar Home System (SHS) implementation [30].
UzbekistanUzbekistan is investing in smart power management, and have established a control center for smart meters present in the country [31].
Prospective OIC countries (24 countries)
Nigeria [32], Cameroon [33], Morocco [34], Algeria [35] and Jordan [36] are investing in renewable energy and are expected to adopt smart power management. Suriname, Turkmenistan, Lebanon, Azerbaijan, Gabon, Maldives, Iraq, Guyana, Tunisia, Alabania, Djibouti, Kyrgyz republic, Sudan, Mauritania, Cote d’lvoire, Senegal, and Tajikistan are the other prospective countries that are likely adopt renewable energy and smart power management in the future.
Under-developed OIC countries (17 countries)
Comoros, Benin, Chad, Guinea, Burkina Faso, Afghanistan, Uganda, Mali, Togo, The Gambia, Niger, Ivory Coast, Yemen, Somalia, Libya, West-Bank, and Sierra Leone are either underdeveloped or in a state of unrest and thus are still to go a long distance before implementing the renewable energy or smart management initiatives.
Table 3. Summary of the benefits of smart power management schemes in the OIC countries.
BenefitsDescription
Lower electricity cost for consumersConsumer cost is lowered as a result of Demand Side Management (DSM) and Demand Response (DR) and home based Distributed Energy Resources (DERs).
Lower expenditures for utilityHigh energy efficiency and efficient management can reduce utility costs [42].
Increased reliability for electricityLoad shifting by Demand Side Management (DSM) and Demand Response (DR) and efficient management.
Increased energy securityAllows distributed generation from renewable resources.
Preventing energy wasteDemand Side Management (DSM) and Demand Response (DR) help remove unnecessary loads, transmission and distribution losses are also reduced due to smart grid upgrades.
Reduced losses through fraud detectionSmart meters, sensors and Internet of Things (IoT) prevent theft and fraud.
Air pollution and adverse climate change reducedSmart power management helps integrate renewable energy to the grid more easily, reducing dependence on fossil fuels and helps reduce adverse climate change.
Table 4. General challenges of adopting the smart power management initiative for the OIC countries.
ChallengesLikelihoodImpactEffectsSolutions
High investment costModerateHighUpgrading the entirety of the existing grids and adding new infrastructures is bound to have a hefty cost.Plenty of strategies exist, such as inviting investors as it promises to have a high benefit to cost ratio.
Upgrading the grid on the goHighLowThe existing grids have to be upgraded and also the grids have to be expanded for many OIC countries with weak grids [48,49].Technological leapfrogging can be implemented.
Technological shortcomingsHighLowMany of the small technological devices to be used have their limitations as well as unintended problems [50].Workarounds have to be found for the problems or to find better replacements for them.
Difficulties in renewable energy integrationHighModerateTwo-way energy flow causes management complexity and generates harmonics [48,50]. In addition, the renewable energy resources consume land area that causes land limitations for the smaller OIC member countries.Workaround has to be found for the stability issues of two-way energy flow. In addition, proper placement of Distributed Energy Resources (DERs) has to be done accomplished by utilizing available options, such as placing photovoltaic panels in rooftops.
SecurityLowModeratePrivate information can be stolen by perpetrators; in addition, certain information can be hampered for the purpose of energy theft [51,52].Security measures have to be heightened, strong security system, and infrastructures have to be put in place.
Barriers in Demand Side Management (DSM) and Demand Response (DR)LowModerateConsumer and producer based barriers [50].Awareness has to be raised and lucrative Demand Side Management (DSM) offers have to be made to the consumers to motivate them; decisions must be made intelligibly by people with the authority to avoid any decision-making conflicts.
Managing huge volumes of dataHighLowSecurity, identification and usage data of millions of consumers have to be managed in a very short time.Big data and block-chain can be utilized.
Table 5. Summary of technologies and features used in the smart grids and smart power management schemes.
TechnologiesDescription
A. Advanced Metering Infrastructure (AMI)
Smart meterRecords the consumers’ electricity consumption data in real time, as well as the power quality, and sends them to the utility. Can also be used by the utilities to regulate or supervise other devices, allowing two way communications [58,59].
Meter Data Management System (MDMS)It operates alongside Customer Information System (CIS) to process the data related to the personal information of the consumers [60].
B. Distributed Energy Resources (DERs)
Renewable Energy
Sources (RESs)
Allows distributed generation from renewable resources.
Energy Storage Systems
(ESSs)
Energy stored in batteries and similar systems that can be used to provide backup power during power outages or voltage irregularities due to RESs.
Distributed Energy
Resource Management
System (DERMS)
Allow monitoring and controlling the network and assets, voltage and power quality control, forecasting and demand response [61].
C. Transmission Enhancement (TE)
Power electronic
converters
Flexible AC Transmission System (FACTS) and HVDC for increasing transmission efficiency and conversion [57].
Dynamic Load Rating
(DLR)
Increasing transmission efficiency by gauging the current carrying capacity of each wire [57].
D. Distribution Automation (DA)
Fault Detection
Identification
Restoration (FDIR)
Sensors used to detect and quickly resolve faults [61].
Voltage and reactive
power management
Uses Integrated Volt/Volt-ampere reactive Controls (IVVC) and conservation voltage reduction (CVC) to monitor and control voltage and reactive power [61].
Equipment health
monitoring
Uses sensors to monitor equipment so that they can be repaired before a major fault develops [61].
Management systemsUses Distributed Management System (DMS) for monitoring and controlling the network and Outage Management System (OMS) for damage control 61].
E. EV infrastructure
Fast chargingAllows EVs to charge within a very short time [62].
Vehicle to GridSupplies power to the grid from the car battery, helps boost grid stability [63].
F. Communication technologies
Wireless technologiesWireless technologies and infrastructure for Zigbee, cellular, WiFi, etc.
Power Line
Communication
Wired communication through the power line. Standard for the Advanced Metering Infrastructure (AMI).
G. Software Defined Network (SDN)
Control PlatformThe software layer that controls everything.
Data PlatformThe layer of switches that supplies data to the control layer and which is maintained by the control layer.
Table 6. Operations of the smart power management schemes.
OperationsDescription
Data collectionData is collected from throughout the grid using the advanced sensors and communication systems; data are to be collected using schemes such as Supervisory Control And Data Acquisition (SCADA) or Phasor Measurement Unit (PMU) [51].
Power system qualityThe power factor has to be maintained close to unity and the voltage must be kept stable. This is monitored and controlled by the sensors and Voltage and Var Control (VVC), capacitor banks [80,81].
Security and its management systemPublic Key Infrastructure (PKI) is used to handle the information security of millions of users on the grid [82].
Demand Side Management (DSM)The loads on the consumer side are shifted by the utilities in order to reduce the demand at peak hours. This is done using smart pricing [83] or direct load control [84].
Demand Response (DR)It involves policies or incentives offered to the consumers to reduce demand at any given moment [85].
Dynamic pricing and price forecastThe pricing varies, depending on load conditions [86].
Table 7. Applications of the smart power management schemes.
ApplicationsDescription
Work in conjunction with the smart devices at homesUtilities can communicate with the smart equipment in the households through smart meters, which would ease Demand Side Management (DSM) and Demand Response (DR) [59,64].
Micro-gridsDistributed Energy Resources (DERs) allows micro-grids to be set up centered around the distributed generator and storage [96], which can act independently from the main grid [97].
Load control and cost reductionDemand Side Management (DSM) and Demand Response (DR) can allow load shifting at the peak usage times, thus reducing the cost of electricity.
Integration of RESs into the gridAllows two-way flow of energy and thus allows the integration of RESs into the grid [98].
Table 8. Scale for the SWOT factor comparison.
Description of SignificanceEqualEqual to ModerateModerateModerate to StrongStrongStrong to Very StrongVery StrongVery Strong to ExtremeExtreme
Representation on an absolute scale123456789
Table 9. Formation of the SWOT factors.
Factor NumberFactorDescription
STRENGTHS
S1Cost savingsIt is expected to have a high cost to benefit ratio. This is altogether a result of the reduced equipment failures, energy theft, electricity losses, service cost, and sustained outages [42].
S2Energy security increasedThe easy integration of renewable energy resources means lesser reliance on fossil fuels and therefore an increased energy security for the future.
S3Energy wastes reducedIncreased efficiency of transmission and distribution, sustainable use of electricity due to Demand Side Management (DSM) and Demand Response (DR) reduce the waste of energy.
S4Climate change reducedImplementation of the smart power management initiative allows the integration of renewable energy into the hybrid energy mix and reduces the usage of fossil fuels, thus reducing the greenhouse effect and air pollution.
WEAKNESSES
W1High investmentIt is very capital intensive, as the entire grid has to be upgraded. The lesser developed countries of the OIC may not be able to invest enough capital.
W2Security of informationThere remains a risk of loss of privacy and the leak of private information of the consumers [51,52].
W3Technological challengesThe technologies to be used have limitations and drawbacks as well as being expensive [50].
OPPORTUNITIES
O1Public and International supportThere is an increasing public and international support to modernize an existing grid to make it more reliable, and to integrate renewable energy and improve the system efficiency [107]. Changes are welcome and there would be a lot of domestic and international investors.
O2Increased availability and lower cost of required technologyThe technologies, required for a smart grid, are becoming more available and more affordable on a massive scale.
O3Growing economy in OICAlmost all of the OIC member countries are growing economically. The average growth rate is 2.4% for the OIC countries in 2019 [43]. Without taking into account the anomalies in the global economy due to any unforeseen effects, such as the COVID-19, more and more countries are becoming financially capable of investing in the smart grids.
O4Increasing electricity demandThe electricity demand is growing in the OIC countries due to the increase of population and spread of technology in everyday lives and Information and Communications Technology (ICT). Conventional grids are inefficient and insufficient to properly satisfy this demand.
O5Developing gridMany countries of the OIC have electrical grids, which are not fully developed. Due to technological leapfrogging, integration of the smart grids early on in the newer areas is easier for these countries.
THREATS
T1Regulatory inefficiencies and irregularitiesIrregularities are common in many developing countries. As a result, it may become difficult to coordinate the complex procedures of a smart grid operation, and the policy setting in the cases of DSM and DR.
T2Demand Side Management (DSM) and Demand Response (DR) barrierConsumer based barriers, such as the waning of interest in the participation of DR in a daily basis is a likely possibility. Distrust would also arise if the utilities had regulatory control over the home area network.
T3Lack of motivation towards renewable energy sourcesIn many countries of the OIC, in particular the oil-rich countries of Middle East and North Africa (MENA), the large fossil fuel reserves at present may cause policy makers not to consider renewable resource integration with due urgency. Since renewable resource integration is one of the major drivers of a smart grid, this may reduce the development and implementation efforts of a smart grid.
Table 10. Determination of the significance vector of each SWOT factor by the AHP analysis.
Pair-Wise ComparisonRoot Mean ProductSignificance Vector
StrengthS1S2S3S4
S11.005.007.002.00 2.890.52
S20.201.002.000.25 0.560.10
S30.140.501.000.20 0.350.06
S40.504.005.001.00 1.780.32
WeaknessW1W2W3
W11.005.007.00 3.270.74
W20.201.002.00 0.740.17
W30.140.501.00 0.410.09
OpportunityO1O2O3O4O5
O11.002.000.503.005.001.720.26
O20.501.000.332.003.001.000.15
O32.003.001.005.007.002.910.44
O40.330.500.201.002.000.580.09
O50.200.330.140.501.000.340.05
ThreatT1T2T3
T11.000.202.00 0.740.18
T25.001.005.00 2.920.71
T30.500.201.00 0.460.11
Table 11. Calculated consistency ratio (CR) values.
CategoriesConsistency Ratio (CR)
Strength0.02
Weakness0.01
Opportunity0.01
Threat0.05
Table 12. Determination of weights of the SWOT categories.
Pair-Wise ComparisonRoot Mean ProductCategory Weights
SWOT
S1.003.002.005.002.340.48
W0.331.000.502.000.760.16
O0.502.001.003.001.320.27
T0.200.500.331.000.430.09
Table 13. TOWS matrix. The Growth-Oriented Strategy (SO), Diversification Strategy (ST), Transformation Strategy (WO), and Defensive Strategy (WT) for adopting smart power management in OIC countries.
OPPORTUNITYTHREAT
STRENGTHGrowth-Oriented Strategy (SO)Diversification Strategy (ST)
SO-1. The energy demand is increasing, so it is especially necessary to develop smart grids in areas where demand is more likely to be concentrated, such as in urban areas. Focusing on these areas would maximize the cost benefits and minimize the energy losses. (S1, S3, O4).ST-1. The authorities can promote renewable energy among those still disinterested by stressing their importance for energy security of the future, as well as their importance in reducing carbon footprint. This would also serve the purpose of increasing support for smart grids among the populace, attracting more investors and entrepreneurs. (S2, T3).
SO-2. The fact that smart grids are a necessity for the integration of renewable energy resources can be utilized to garner support from the public towards large scale developments as well as attract foreign investors. This is because it aligns with the international push for the adoption of renewable energy. (S2, O1).ST-2. To avoid consumers losing interest in cooperating with the DR instructions, the cost savings to their bills as a result of their cooperation have to be clearly and routinely promoted to them. Lucrative incentives also have to be provided, ensuring however that the overall cost does not increase as a result. (S1, T2).
SO-3. The economic growth could be sustained by reducing natural calamities. Thus, the fact that climate change can be reduced by smart power management schemes has to be recognized by the governments and policy makers, and this narrative can help further accelerate the implementation of smart power management by attracting public interest and investors. (S4, O3).ST-3. Awareness has to be raised on the fact that fossil fuel combustion is largely responsible for the adverse climate change. The fact that this is a problem at present and not of the future, and that no nations are exempt from the effects of climate change has to be propagated through awareness programs to the industry leaders, policy makers, and the general public. (S4, T3).
WEAKNESSTransformation Strategy (WO)Defensive Strategy (WT)
WO-1. The high investment requirements of developing smart grids can be fulfilled by the states’ own funds, as well as by attracting private and international investors by cashing in on the global interest in promoting renewable energy. (W1, O1, O3).WT-1. Other than technological limitations, the only other way in which the information security in a smart grid can be compromised is by the regulatory inefficiencies of the professionals in charge of the network integrity. Hence, there should be strong supervisory committee overseeing the performance of the officials in charge, which cracks down on any form of professional negligence on part of the professionals in charge. (W2, T1).
WO-2. The state can fund development of emerging technologies for smart grids, as well as choosing from among the wide variety of available options. This allows maneuvering around the limitations of the existing technologies as well as addressing the security concerns, which are also in a way dependent on the technological capabilities. (W2, W3, O2).WT-2. Strenuous efforts have to be made to assure the concerned consumers that DSM is not compromising their privacy and security in any way. (W2, T2).
WO-3. As many of the OIC countries are likely to implement smart grids in areas that were previously not connected to an electrical grid, the quality of service can be expected to be relatively lower there initially. Thus, the policymakers may not need to worry about the technological limitations to a great extent in these cases, and have more flexibility in allocating their resources. (W3, O5).WT-3. Concerned officials and investors, whose support is necessary for the successful financing of the smart grid development, have to be assured that the smart grid has a high benefit to cost ratio, and the profits are lucrative. This would motivate the concerned parties to invest. (W1, T3).
Table 14. Calculation of the significance scores of the TOWS strategies.
StrategiesSWOT FactorsOperationTotal WeightSignificance Scores
SO-1S1, S3, O4S1 × O4 + S3× O40.00684
SO-2S2, O1S2 × O10.00355
SO-3S4, O3S4 × O30.01862
ST-1S2, T3S2 × T30.000510
ST-2S1, T2S1 × T20.01573
ST-3S4, T3S4 × T30.00158
WO-1W1, O1, O3W1 × O1 + W1× O30.02231
WO-2W2, W3, O2W2 × O2 + W3× O20.00176
WO-3W3, O5W3 × O50.000212
WT-1W2, T1W2 × T10.000411
WT-2W2, T2W2 × T20.00167
WT-3W1, T3W1 × T30.00129
Table 15. The nature of the criteria used in the MCDM analysis.
CriteriaNature
System Efficiency Enhancement (SEE)Beneficial
Reliability Enhancement (RE)Beneficial
Reduced Theft (RT)Beneficial
Renewable Energy Adoption (REA)Beneficial
Deployment Challenges (DC)Non-beneficial
Investment Cost (IC)Non-beneficial
Technological Challenges (TC)Non-beneficial
Table 16. Numerical designation of the qualities awarded to each technology for the given criterion.
QualityNumerical Designation
Very low1
Low2
Moderate3
High4
Very high5
Table 17. Cost of various smart grid components.
TechnologyComponentsLowest Cost (USD/Unit)Highest Cost (USD/Unit)Average Cost (USD/Unit)Total Cost (USD/Unit)
AMI [53]Residential smart meters70140105469
Residential installation71511
Industrial or commercial smart meters120500310
Commercial installation206542
DER [10]ESSs11617109131983
PV inverter (USD/KW)8001000900
RESs (Wind) (USD/MWh)120500310
RESs (PV) (USD/MWh)--75
TE [53]Direct Line Rating10,00020,00015,000122,800,000
Transmission Line sensors--50,000
FACTS-STATCON and UPFC10,000,00012,000,00011,000,000
FACTS-HVDC Terminals22,500,00027,500,00025,000,000
FACTS-Power Electronic Transformers--40,000,000
FACTS-Geomagnetic Controllers5,000,0007,000,0006,000,000
IED--110,000
PMU--125,000
DA [53]Smart Switches, Monitored Capacitors--308,000803,250
Power Electronics (Distribution, Current Limiters)--80,000
Voltage and VAR Control on Feeders60,000258,000159,000
Intelligent Reclosers100,000150,000125,000
Remotely Controlled Switches50,00075,00062,500
Intelligent Universal Transformer37,500100,00068,750
EVV2G power converter [53]30050040010,813
Charging station [111]75020,00010,375
Smart grid interface [53]255037
Table 18. The AHP analysis for calculating the weights of each criterion. B ≡ Beneficial, NB ≡ Non-Beneficial. SEE ≡ System Efficiency Enhancement, RE ≡ Reliability Enhancement, RT ≡ Reduced Theft, REA ≡ Renewable Energy Adoption, DC ≡ Deployment Challenges, IC ≡ Investment Cost, TC ≡ Technological Challenges.
BBBBNBNBNBProcess
SEERERTREADCICTCAverage ProductWeights
SEE1.000.502.002.005.000.507.001.660.17
RE2.001.004.004.007.000.509.002.690.27
RT0.500.251.002.002.000.255.000.940.09
REA0.500.250.501.000.500.203.000.570.06
DC0.200.140.502.001.000.142.000.500.05
IC2.002.004.005.007.001.009.003.380.34
TC0.140.110.200.330.500.111.000.250.02
Table 19. The base table. B ≡ Beneficial, NB ≡ Non-Beneficial. SEE ≡ System Efficiency Enhancement, RE ≡ Reliability Enhancement, RT ≡ Reduced Theft, REA ≡ Renewable Energy Adoption, DC ≡ Deployment Challenges, IC ≡ Investment Cost, TC ≡ Technological Challenges.
BBBBNBNBNB
SEERERTREADCICTC
Weightage0.170.270.090.060.050.340.02
AAdvanced Metering Infrastructure (AMI)4452313
BDistributed Energy Resources (DER)1215324
CTransmission Enhancement (TE)3313453
DDistribution Automation (DA)3433443
EElectric Vehicle (EV) infrastructure1312334
very lowlowmoderatehighvery high
Table 20. MCDM operation with the Linear Normalization. B ≡ Beneficial, NB ≡ Non-Beneficial. SEE ≡ System Efficiency Enhancement, RE ≡ Reliability Enhancement, RT ≡ Reduced Theft, REA ≡ Renewable Energy Adoption, DC ≡ Deployment Challenges, IC ≡ Investment Cost, TC ≡ Technological Challenges. The Linear Normalization Formula for NB: L N ( x i j ) N B = m i n ( x j ) x i j , for B: L N ( x i j ) B = x i j m a x ( x j ) .
BBBBNBNBNBPerformance ScoreRank
SEE RERT REA DC IC TC WSM WPM WAS PAS
Weightage0.170.270.090.060.050.340.02
AAMI1.001.001.000.401.001.001.000.970.950.961
BDER0.250.500.201.001.000.500.750.490.440.473
CTE0.750.750.200.600.750.201.000.510.420.474
DDA0.751.000.600.600.750.251.000.630.540.592
EEV0.250.750.200.401.000.330.750.470.410.445
lowhigh
Table 21. MCDM operation with the Enhanced-accuracy-Normalization. B ≡ Beneficial, NB ≡ Non-Beneficial. SEE ≡ System Efficiency Enhancement, RE ≡ Reliability Enhancement, RT ≡ Reduced Theft, REA ≡ Renewable Energy Adoption, DC ≡ Deployment Challenges, IC ≡ Investment Cost, TC ≡ Technological Challenges. The Enhanced-accuracy-Normalization formula for NB: E N ( x i j ) N B = 1 x i j m i n ( x j ) i = 1 N ( x i j m i n ( x j ) ) , for B: E N ( x i j ) B = 1 m a x ( x j ) x i j i = 1 N ( m a x ( x j ) x i j ) .
BBBBNBNBNBPerformance ScoreRank
SEERERTREADCICTCWSMWPMWAS PAS
Weightage0.170.270.090.060.050.340.02
AAMI1.001.001.000.701.001.001.000.980.980.981
BDER0.630.500.711.001.000.900.500.730.710.724
CTE0.880.750.710.800.500.601.000.710.700.715
DDA0.881.000.860.800.500.701.000.830.810.822
EEV0.630.750.710.701.000.800.500.750.740.743
lowhigh
Table 22. MCDM operation using TOPSIS. B ≡ Beneficial, NB ≡ Non-Beneficial. SEE ≡ System Efficiency Enhancement, RE ≡ Reliability Enhancement, RT ≡ Reduced Theft, REA ≡ Renewable Energy Adoption, DC ≡ Deployment Challenges, IC ≡ Investment Cost, TC ≡ Technological Challenges. The TOPSIS formulae for the normalization: T ( x i j ) n o r m a l i z a t i o n = x i j i = 1 N ( x i j ) 2 and for the performance score: T ( S i ) s c o r e = S i ( S i + ) + ( S i ) . ED ≡ Euclidean-Distance, PS ≡ Performance Score.
BBBBNBNBNBEDPSRank
SEERERTREADCICTCS+S
Weightage0.170.270.090.060.050.340.02
AAMI0.110.150.080.020.020.050.0100.020.220.901
BDER0.030.070.020.040.020.090.0130.130.140.512
CTE0.080.110.020.020.030.230.0100.200.070.255
DDA0.080.150.050.020.030.180.0100.140.110.433
EEV0.030.110.020.020.020.140.0130.140.100.414
lowhigh
Table 23. The overall ranks.
TechnologiesAHP-WASPAS
Linear
Normalization
AHP-WASPAS
Enhanced
Normalization
AHP-TOPSISOverall Score
AAdvanced Metering
Infrastructure (AMI)
1111
BDistributed Energy Resources (DER)3423
CTransmission Efficiency (TE)4554.67
DDistribution Automation (DA)2232.33
EElectric Vehicle (EV) Infrastructure5344
lowhigh
Publisher’s Note: MDPI stays neutral with regard to jurisdictional claims in published maps and institutional affiliations.

