
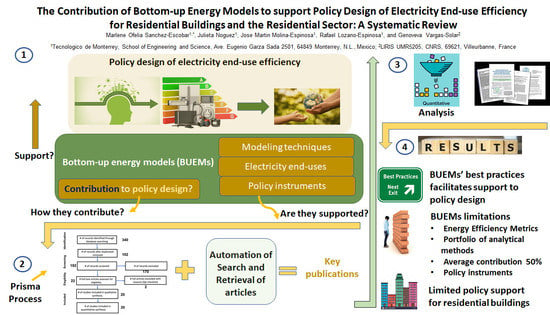
The Contribution of Bottom-Up Energy Models to Support Policy Design of Electricity End-Use Efficiency for Residential Buildings and the Residential Sector: A Systematic Review

 , , , and
Abstract
1. Introduction
- RQ1: What kind of bottom-up energy models aim to support policy design of electricity end-use efficiency for residential buildings and the residential sector, and how do they relate to specific policy instruments ?
- RQ2: Which types of analytical methods are used in bottom-up energy models that aim to support policy design of electricity end-use efficiency in residential buildings and the residential sector?
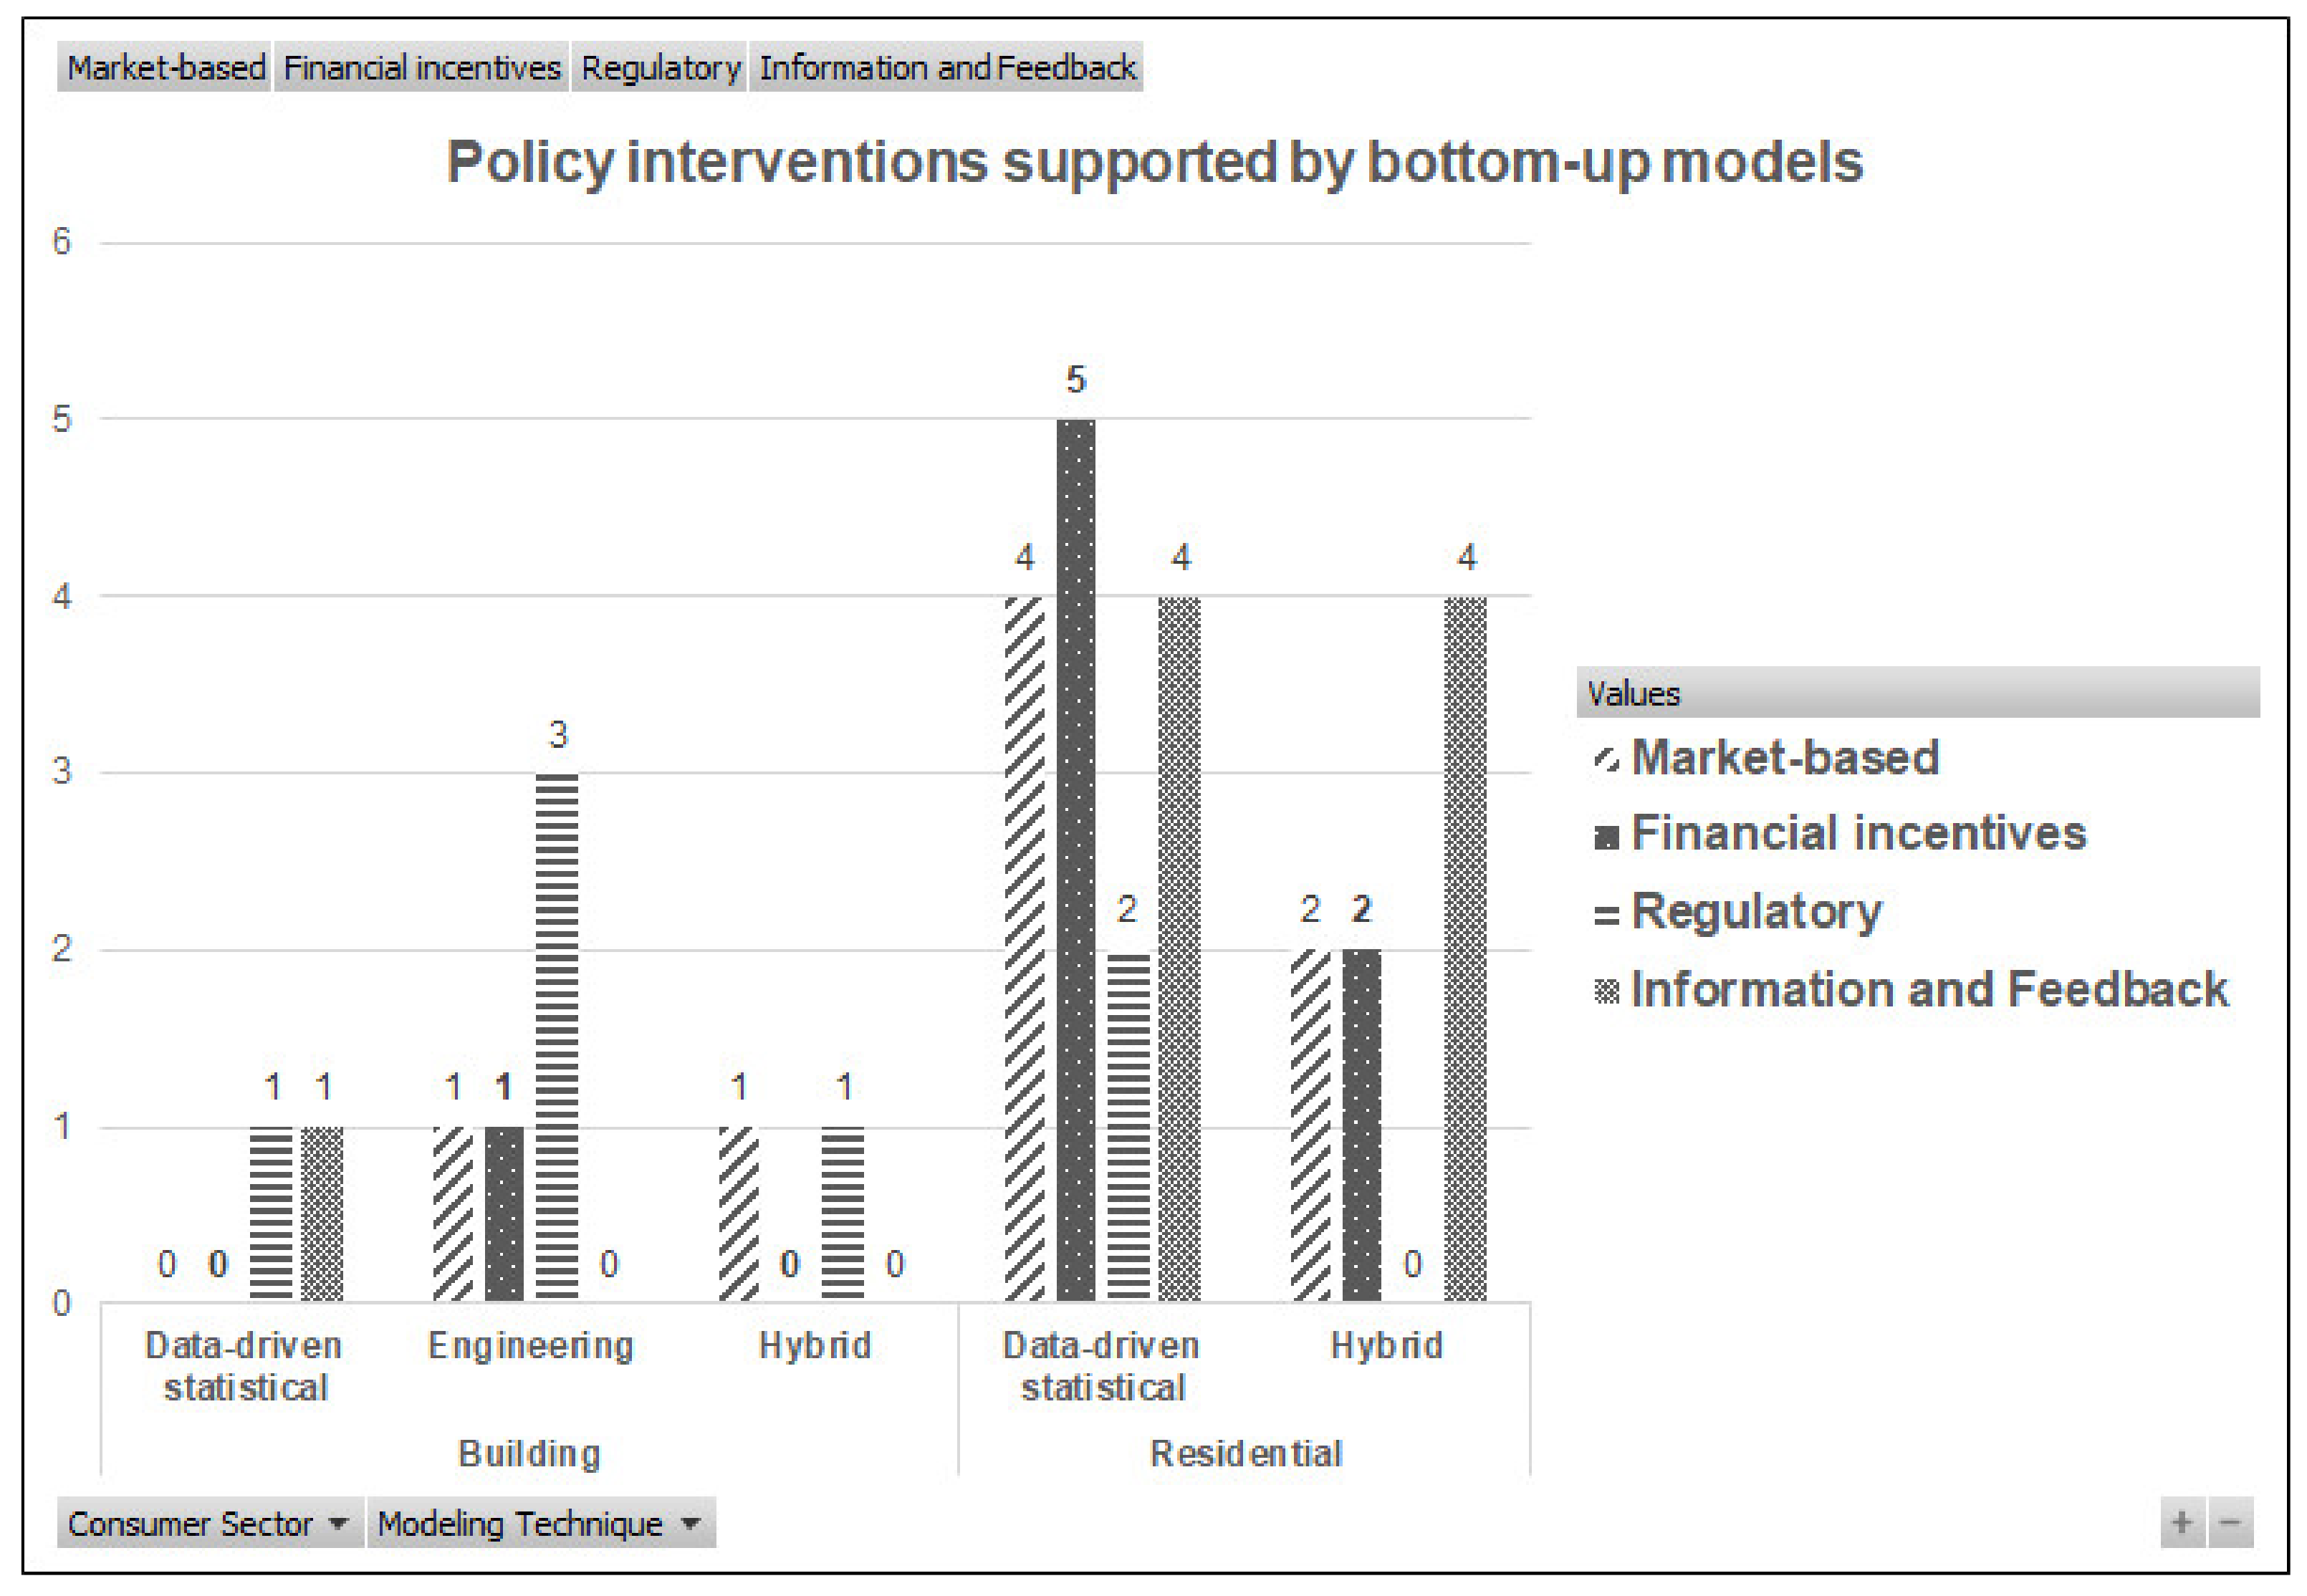
- RQ3: Which types of energy policies are supported by bottom-up energy models that aim to support policy design of electricity end-use efficiency in residential buildings and the residential sector?
1.1. Classification of Energy Models
1.2. Bottom-up Energy Models (Bottom-up Energy Models)
1.2.1. Sector Coverage
1.2.2. Geographical Coverage
1.2.3. Time Horizon
1.2.4. Programming Technique
1.2.5. Data Time Split
1.2.6. Metrics and Tools
1.3. Energy Efficiency Policies and Policy Design
Residential Energy End-Uses
2. Literature Review
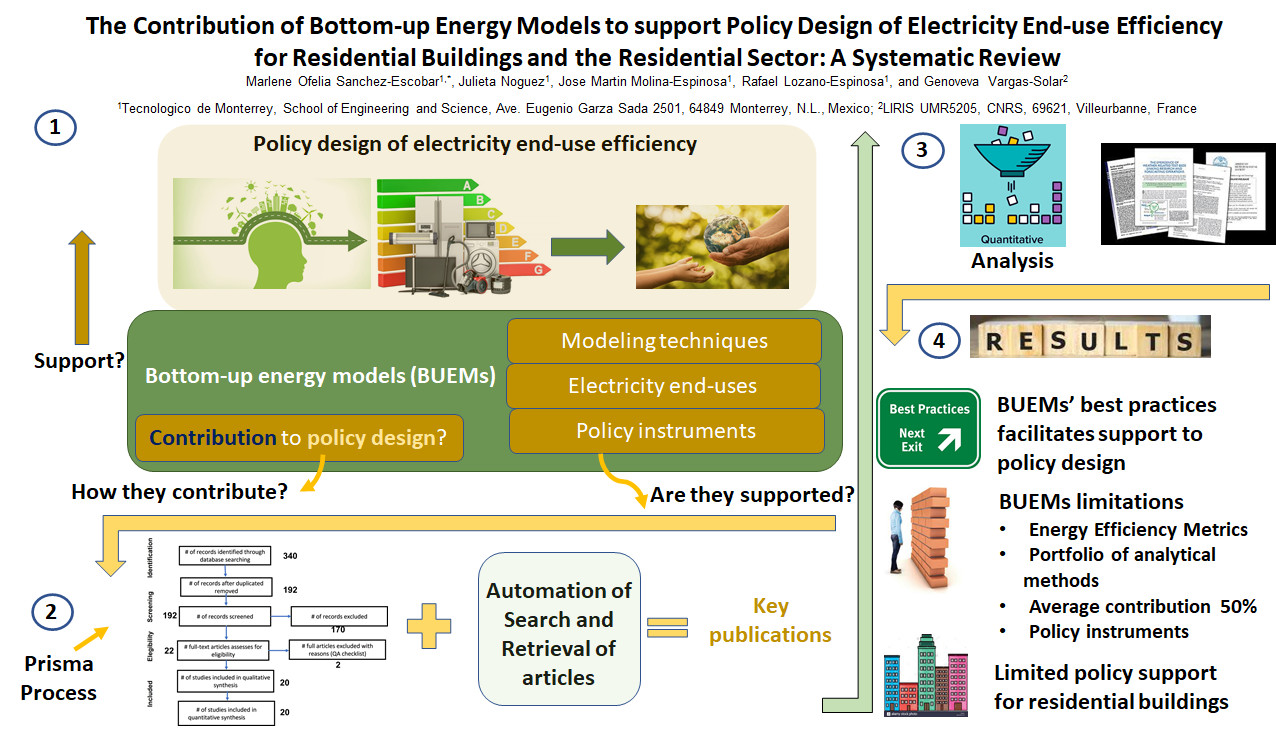
3. Methodology
3.1. Identification Phase
- RQ1: What characteristics have bottom-up energy models that support energy efficiency policy design in the residential sector and residential buildings?
- RQ2: Which analytical techniques are used in bottom-up energy models to support energy efficiency policy design in the residential sector and residential buildings?
- RQ3: Which types of energy policies are supported by bottom-up energy models in the residential sector and residential buildings?
3.1.1. Search Strategy
3.1.2. Keyword Identification and Selection
3.1.3. Query Construction
- Queries that consider papers published after 2014 and with a compelling keyword combination in its title. We review articles from the last five years of research.
- Queries that include the following combination of domains: DS1, DS2, and DS3 or DS1, DS2, and DS4. We exclude the policy term (DS5) since it affects the query result. For instance, using DS5 keywords, we retrieve an excessive or limited number of articles with poor orientation to the study domain. To overcome this problem, we validate the article’s policy orientation in future phases.
- Queries that return more than 200 records and that that fail to pass a pre-screening process. In this case, we perform manual screening to validate the granularity of the returned articles. If we detect that the majority of records are not in the scope of the research, we discard them. In future examinations, we plan to automate this screening process.
3.1.4. Query Execution
3.2. Screening Phase
- Research papers (RPs) published between 2015 and 2020 will be considered for the study.
- RPs that allow to answer the defined research questions
- RPs from journals and conferences (with citations)
- RPs should be in English
- RPs should have an available and complete abstract
- RPs without models applied to the residential sector or residential buildings
- RPs without policy orientation. The abstract or title must include at least one of the following terms: policy, policies, regulation, scenario, intervention, program, or incentive.
- RPs without orientation to energy efficiency (i.e., energy savings or energy conservation)
- RPs without application to electricity end-use
3.3. Eligibility and Inclusion Phases
4. Results and Discussion
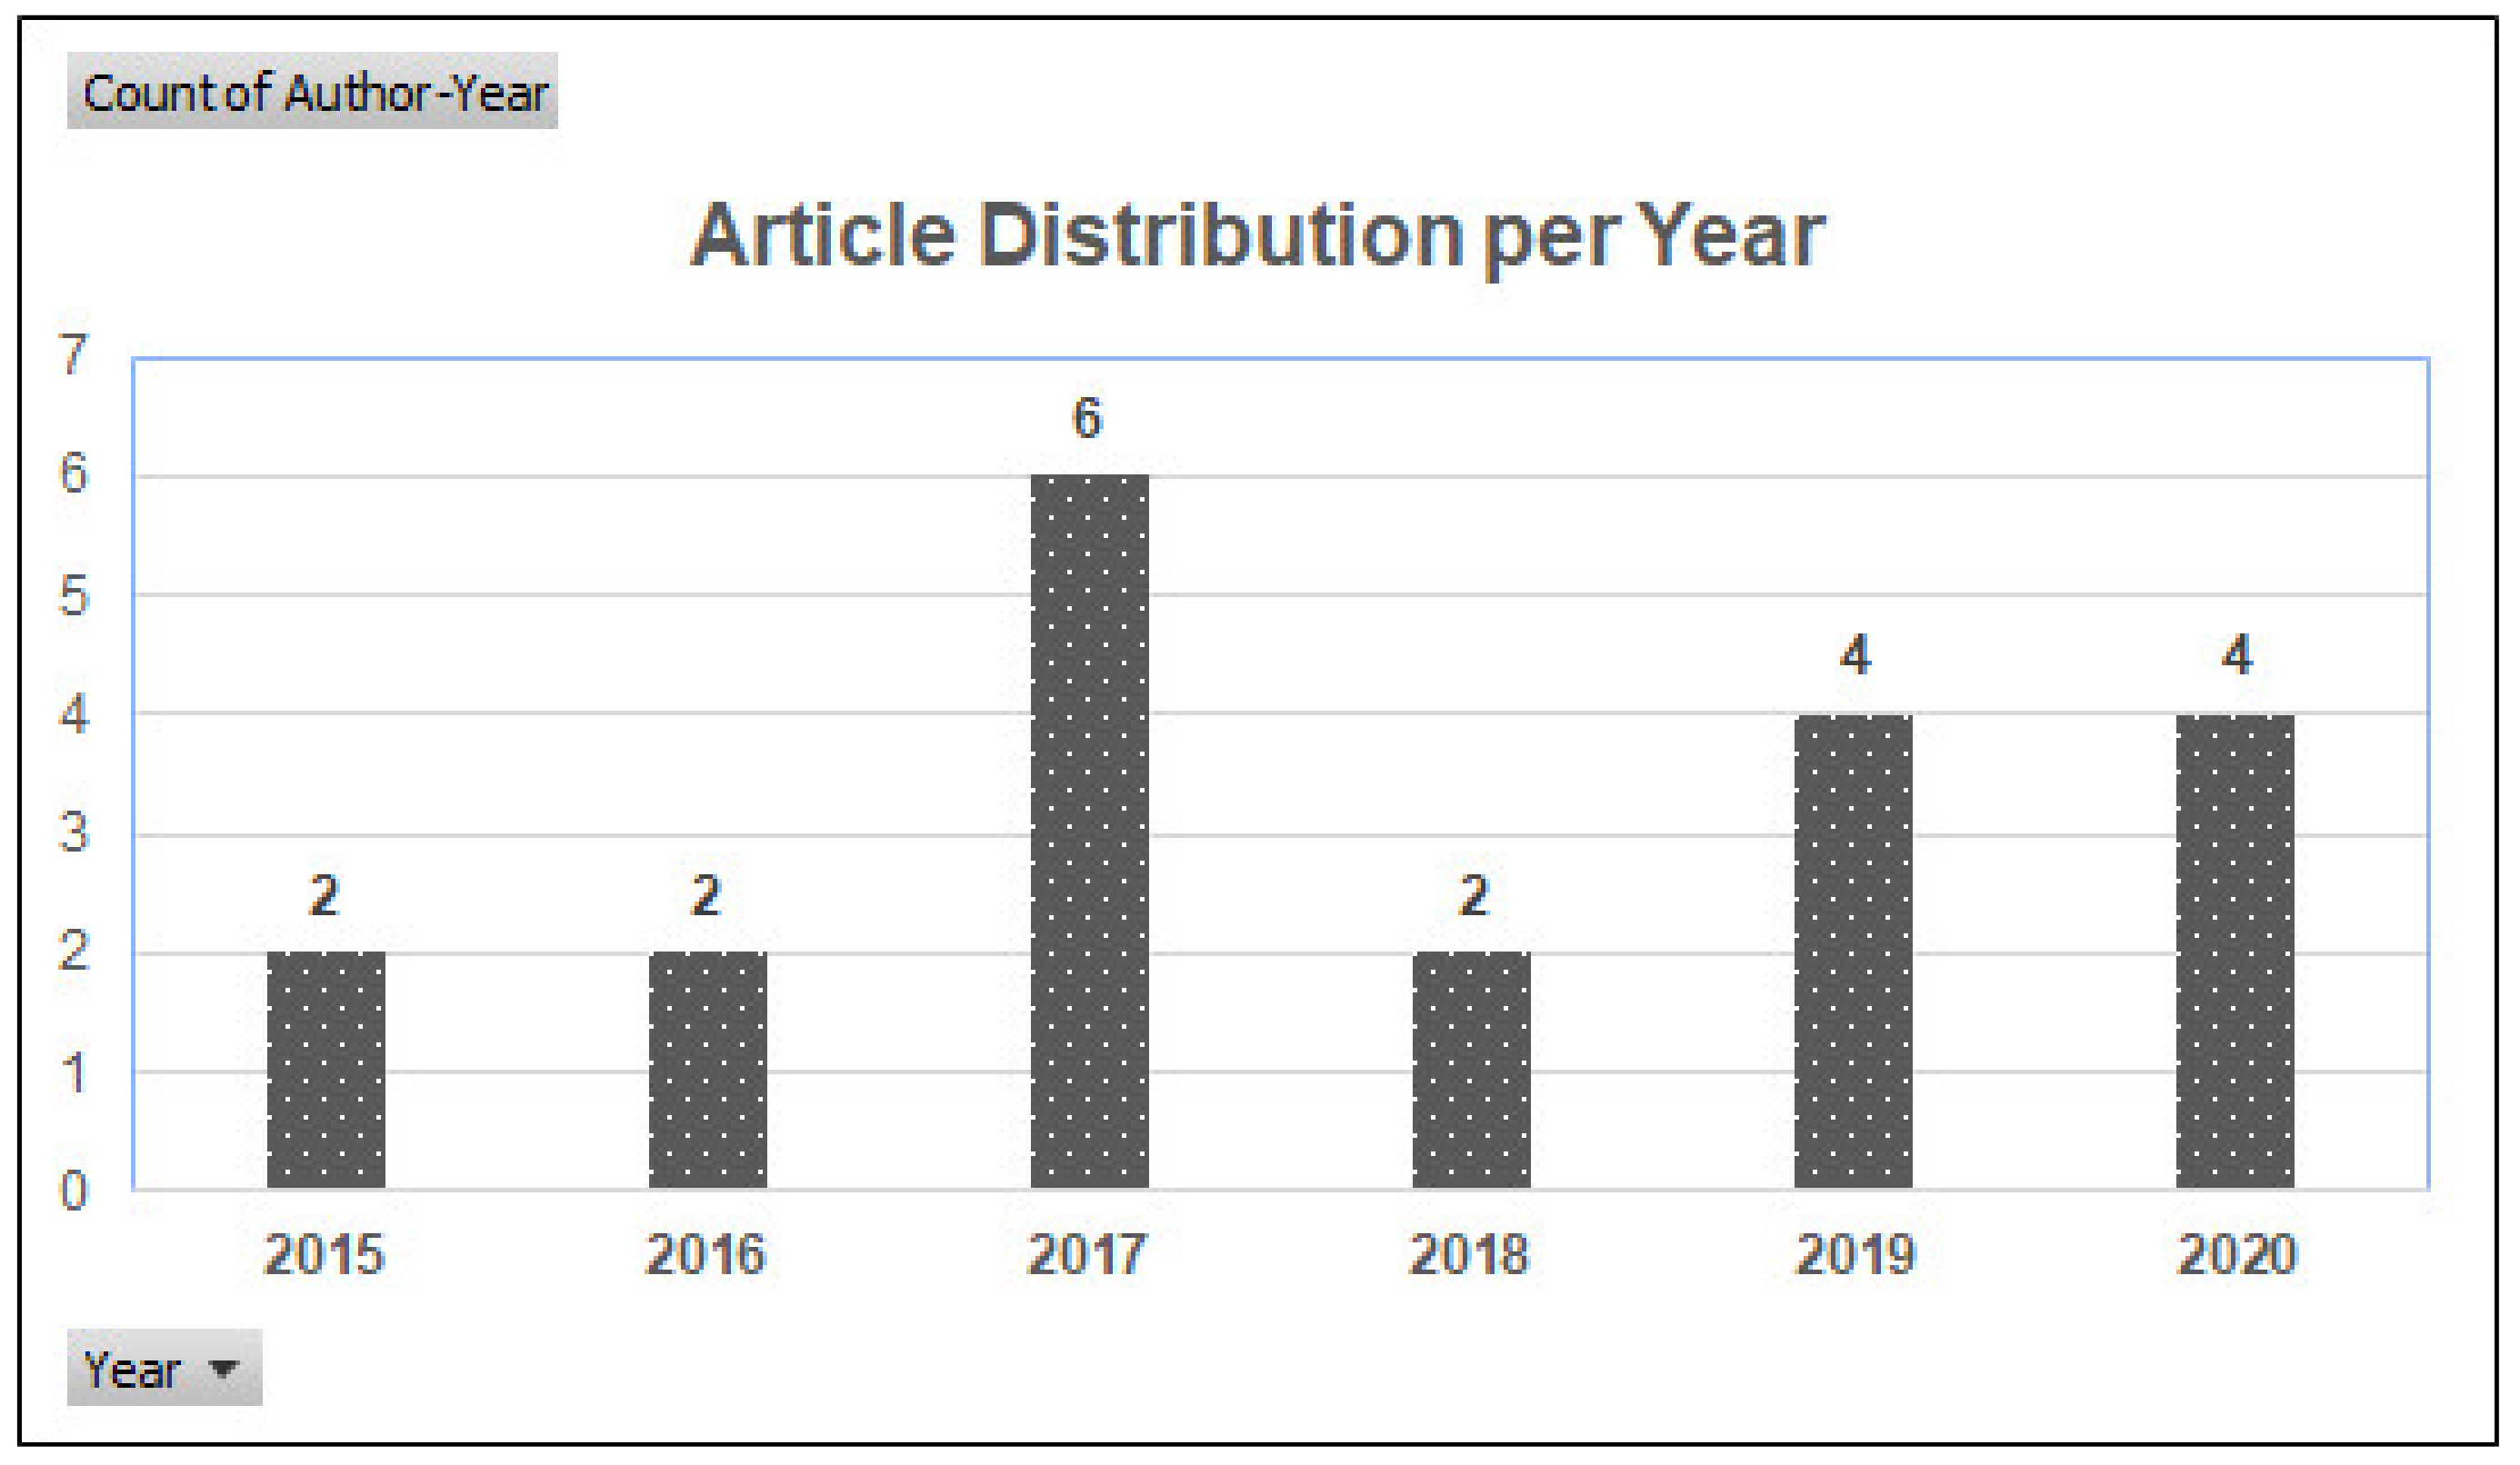
4.1. Summary of Selected Studies
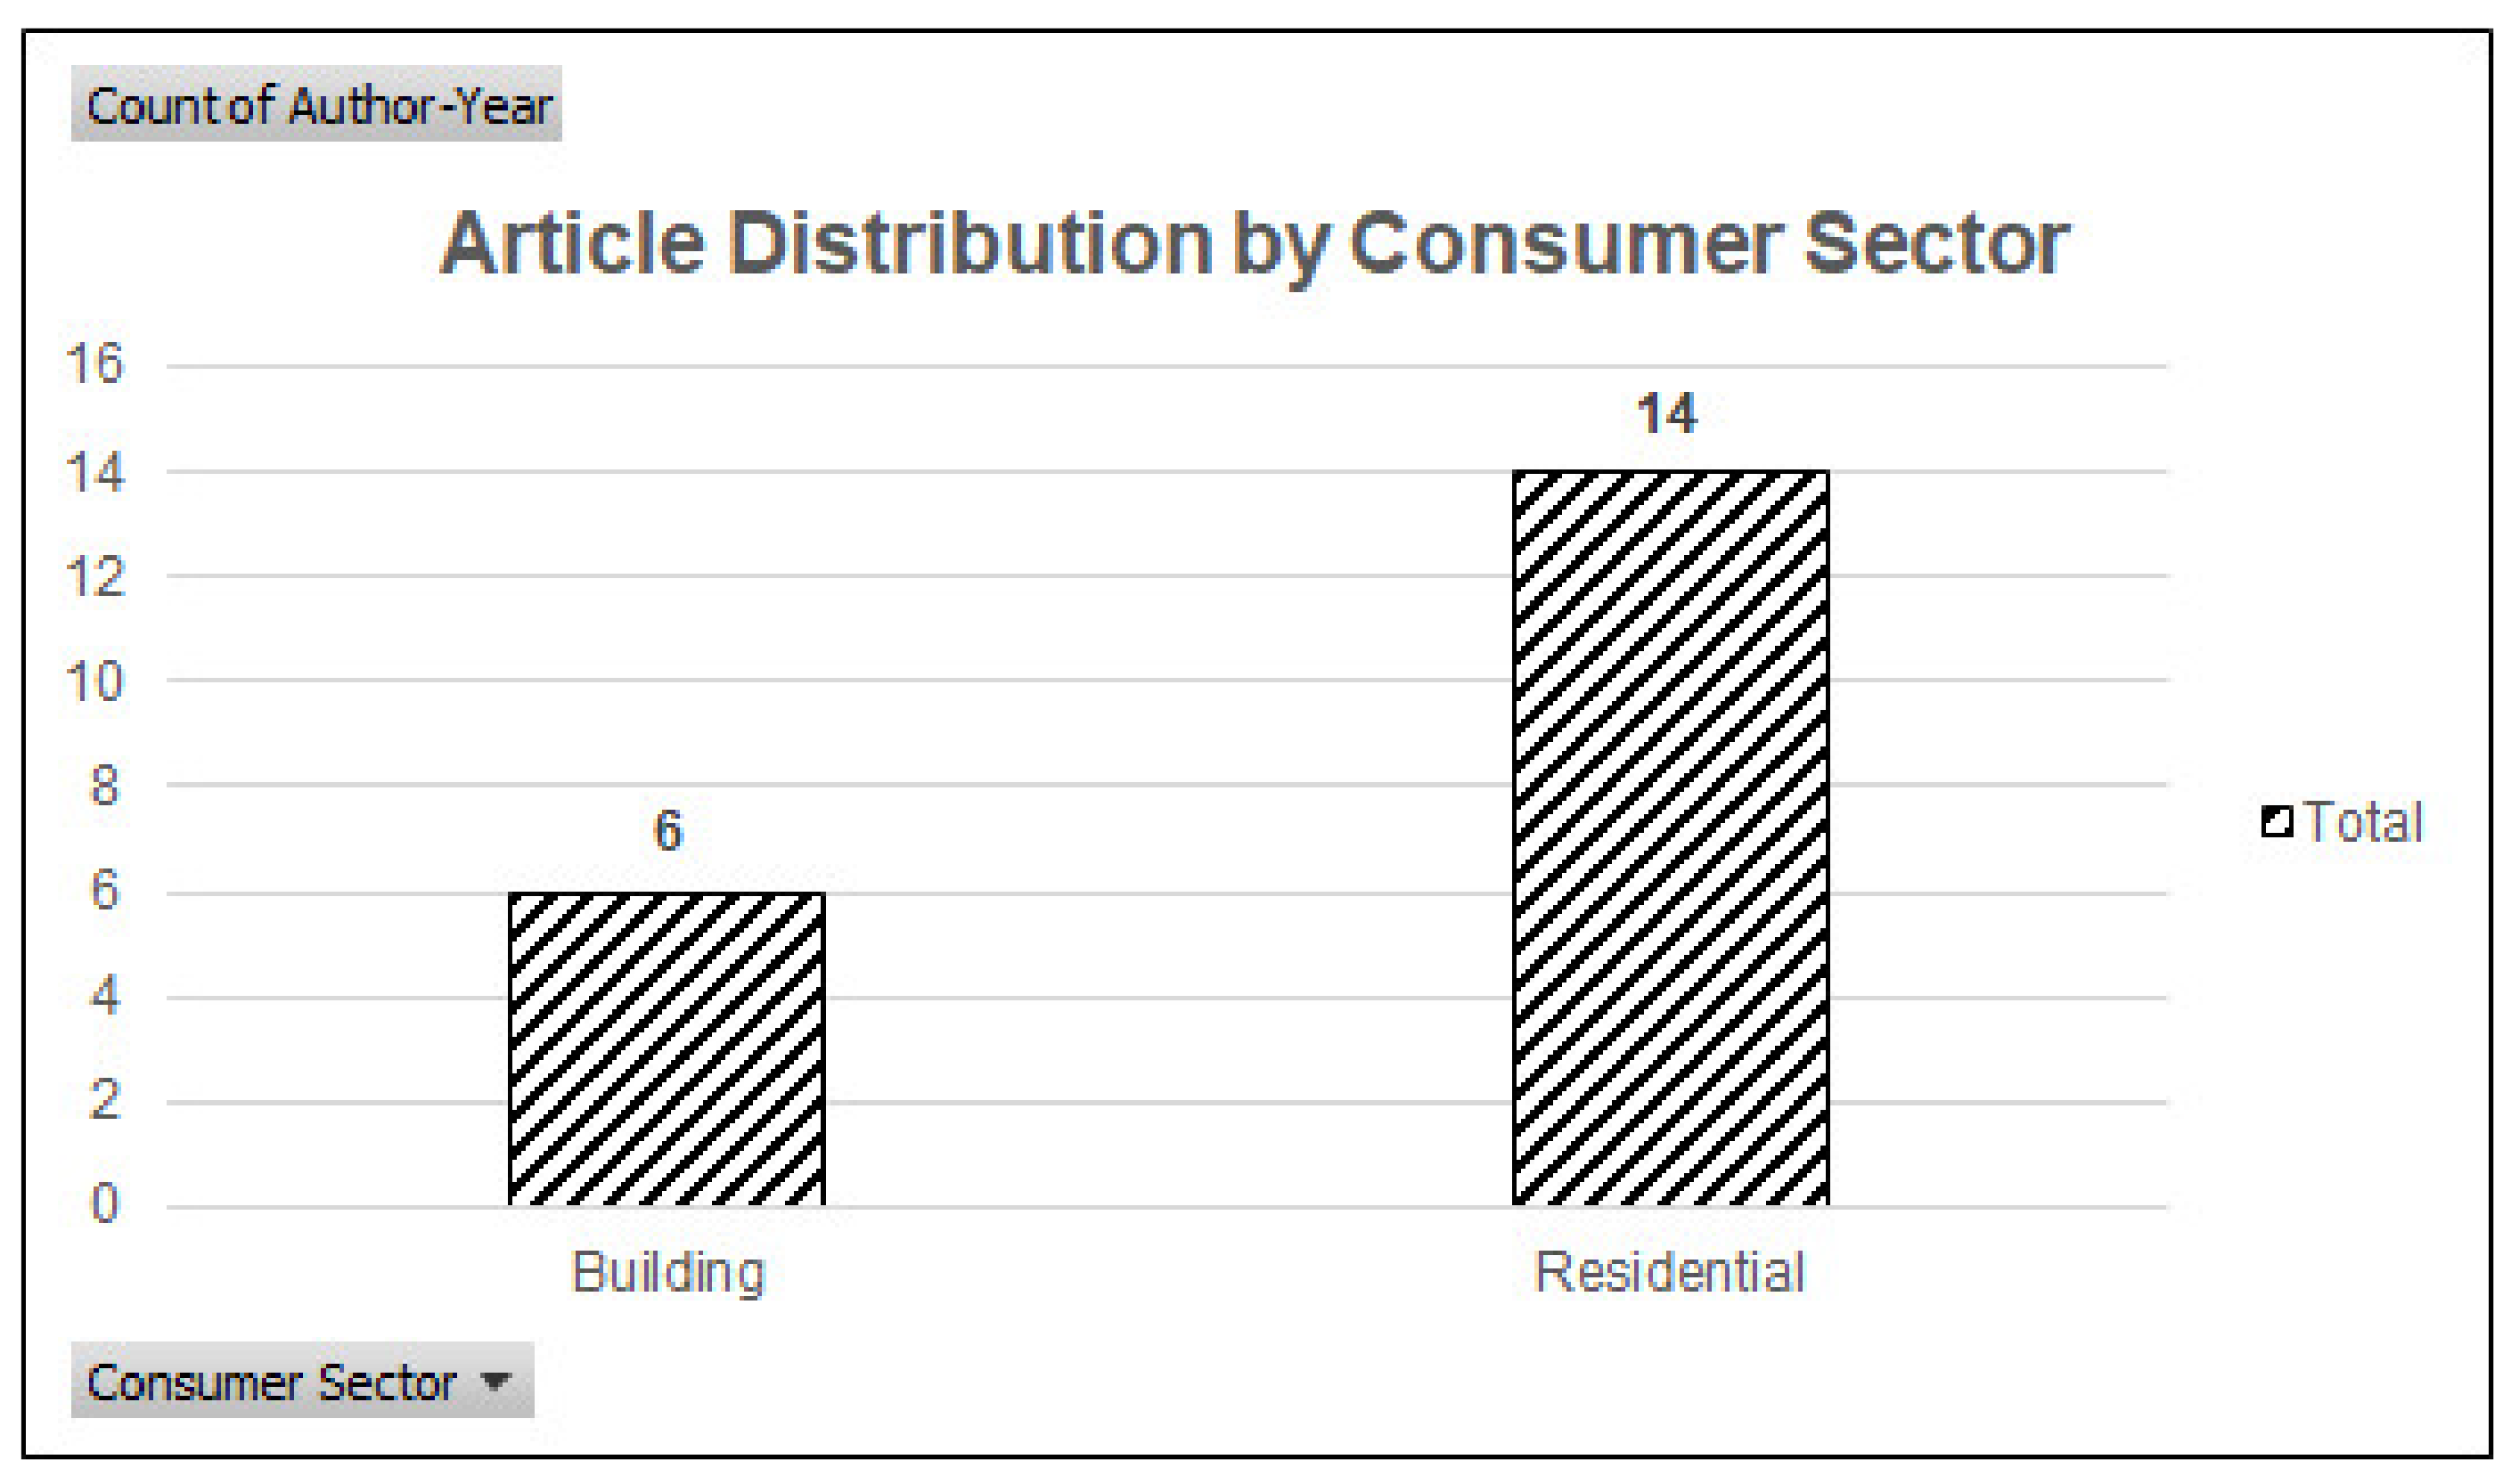
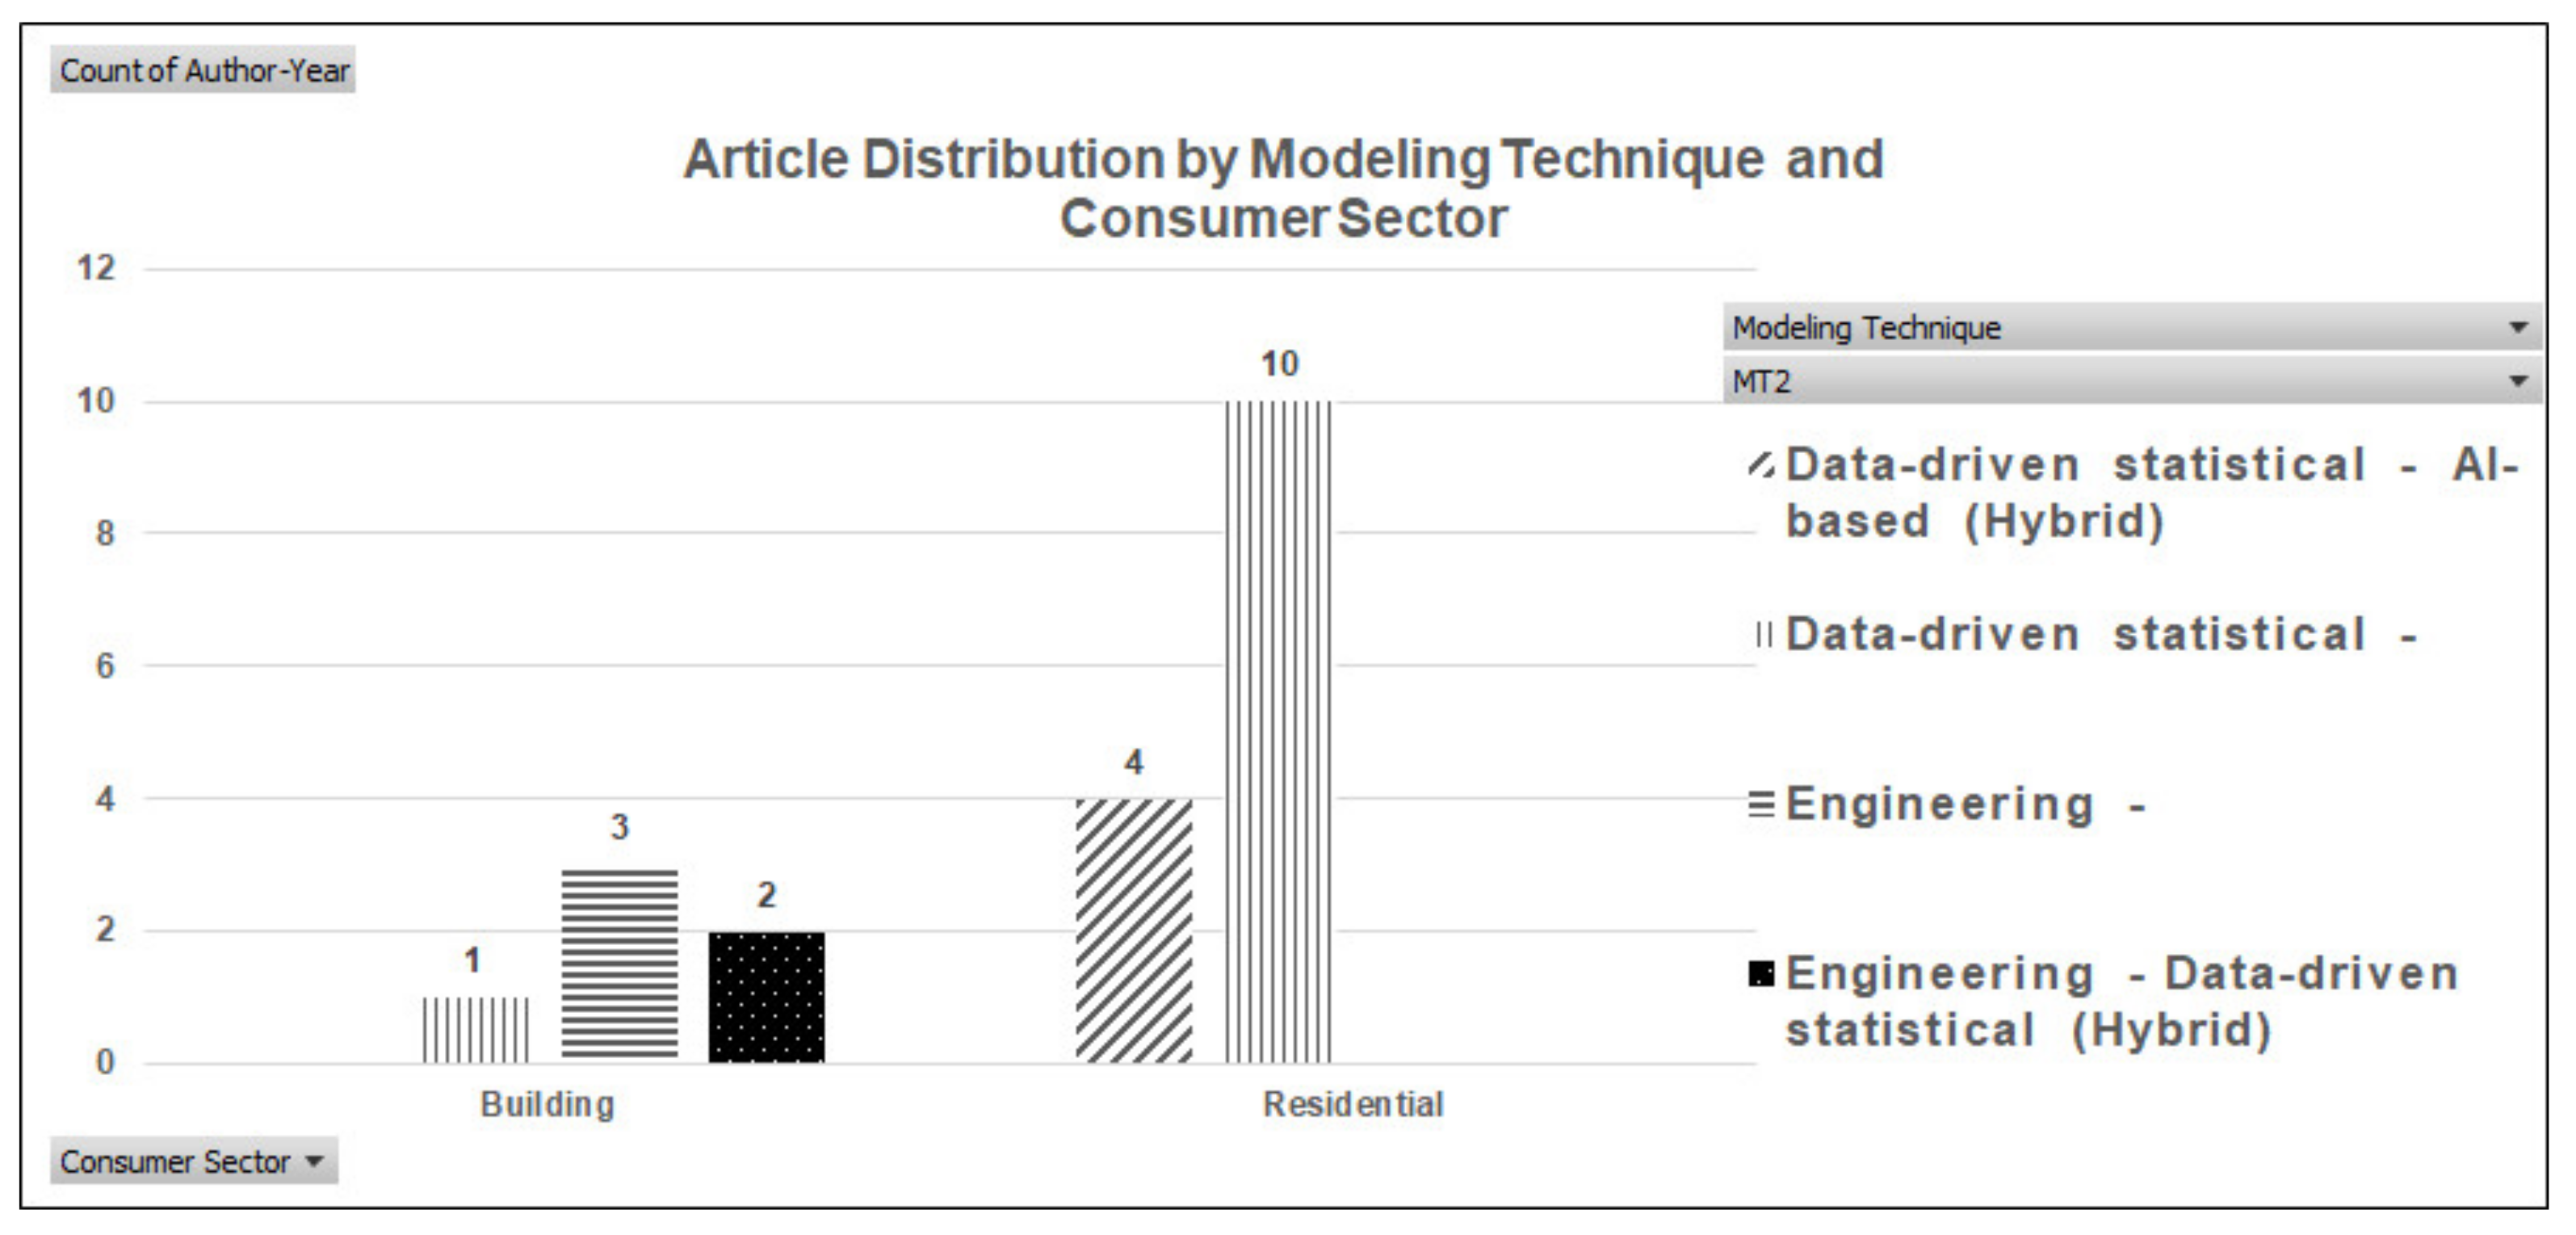
4.2. Analysis by Consumer Sector
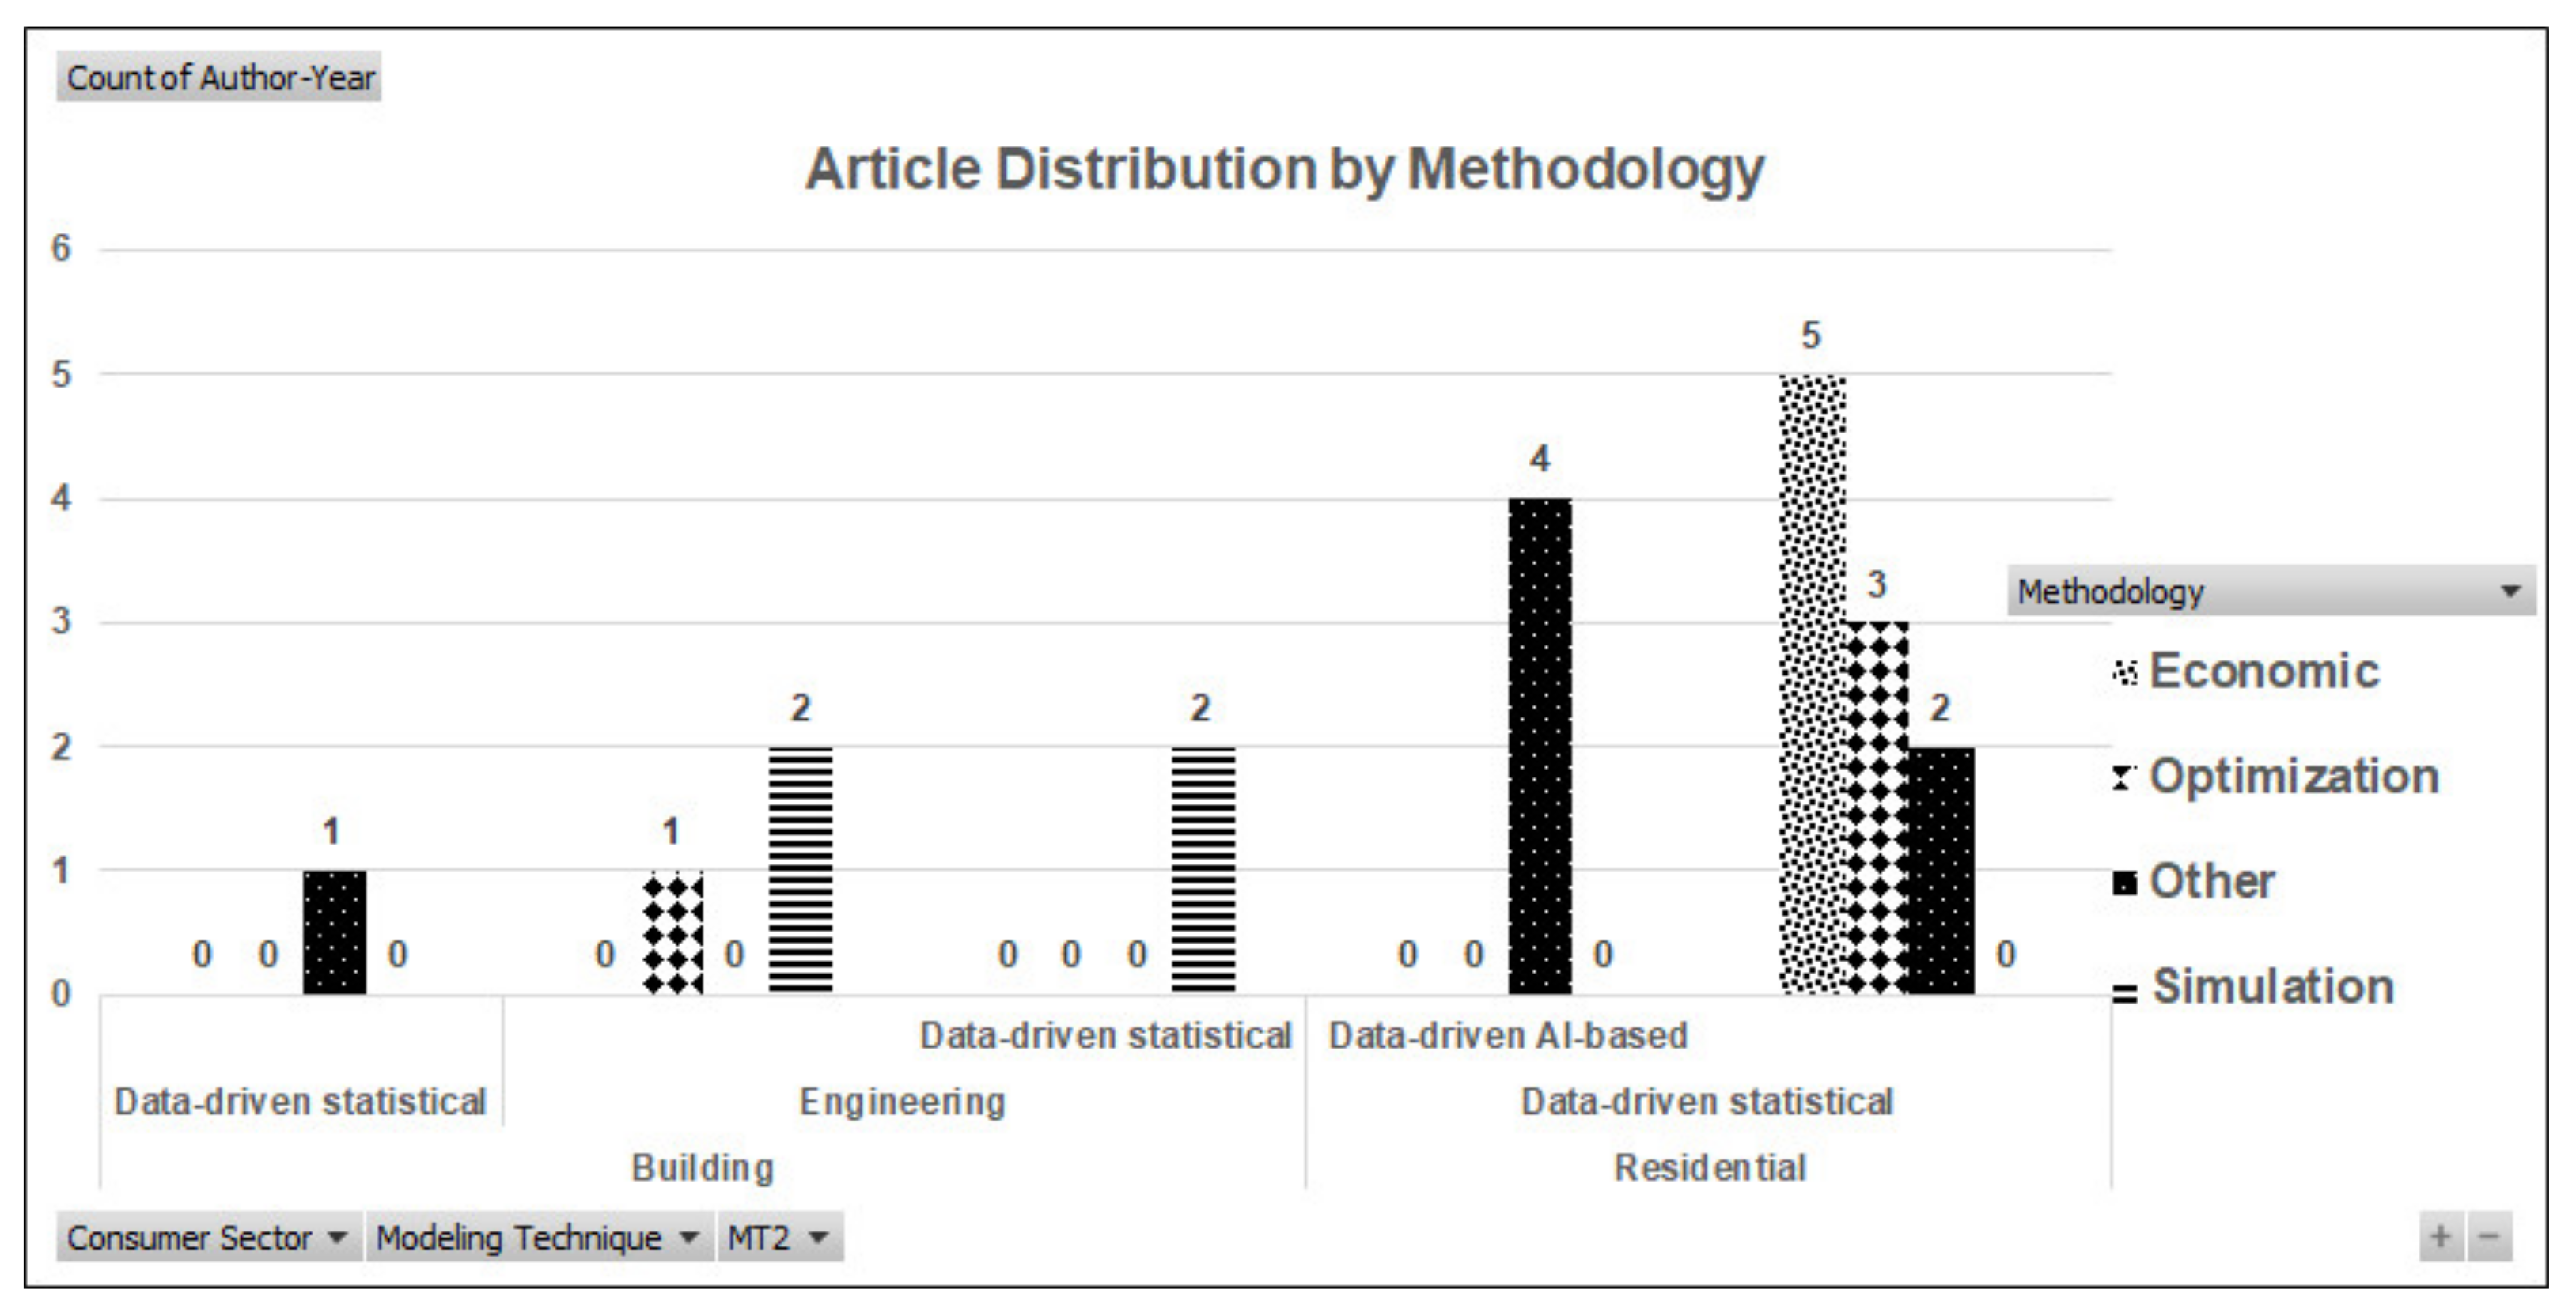
4.3. Results
Residential Sector
Residential Buildings
Residential Sector
Economic DDS Models
Optimization DDS Models
DDS Models with Other Methodologies
DDH Models with Other Methodologies
Residential Buildings
Engineering Models with Simulation
Engineering Models with Optimization
EDDS Hybrid Models with Simulation
DDS Models with Other Methodologies
Residential Sector
Information and Feedback (IF)
Financial Incentives
Market-Based
Hybrid Instruments
Residential Buildings
Regulatory Measures
Financial Incentives
Hybrid Interventions
5. Comparison with Other Studies and Findings
5.1. Findings in RQ1
5.2. Findings in RQ2
5.3. Findings in RQ3
6. Conclusions and Future Work
Author Contributions
Funding
Institutional Review Board Statement
Informed Consent Statement
Data Availability Statement
Acknowledgments
Conflicts of Interest
References
- (IEA) International Energy Agency. World Energy Outlook 2019; IEA Publications: Paris, France, 2019. [Google Scholar]
- Levine, M.D.; Koomey, J.G.; Price, L.; Geller, H.; Nadel, S. Electricity end-use efficiency: Experience with technologies, markets, and policies throughout the world. Energy 1995, 20, 37–61. [Google Scholar] [CrossRef]
- Mundaca, L.; Neij, L. Energy-economy models and energy efficiency policy evaluation for the household sector. In An Analysis of Modelling Tools and Analytical Approaches; Technical Report; Lund University: Lund, Sweden, 2009. [Google Scholar]
- Varone, F.; Aebischer, B. Energy efficiency: The challenges of policy design. Energy Policy 2001, 29, 615–629. [Google Scholar] [CrossRef]
- Doris, E.; Cochran, J.; Vorum, M. Energy Efficiency Policy in the United States: Overview of Trends at Different Levels of Government. Natl. Renew. Energy Lab. 2009. [Google Scholar] [CrossRef]
- Morvaj, Z.; Bukarica, V. Energy Efficiency Policy. In Energy Efficiency; Palm, J., Ed.; IntechOpen: Rijeka, Croatia, 2010; Chapter 1. [Google Scholar] [CrossRef]
- Wiese, C.; Larsen, A.; Pade, L.L. Energy Efficiency Policy: A Review of Instruments and Potential Interaction Effects. In Proceedings of the Meeting the Energy Demands of Emerging Economies, 40th IAEE International Conference, Singapore, 18–21 June 2017; Technical University of Denmark: Lyngby, Denmark, 2017. [Google Scholar]
- Moarif, S.; Rastogi, N.P. Market-Based Climate Mitigation Policies in Emerging Economies; Center for Climate and Energy Solutions: Arlington, VA, USA, 2012. [Google Scholar]
- Bartoszczuk, P. Tradable emission permits as efficient strategy for achieving environmental goals. In Proceedings of the International Workshop on Uncertainty in Greenhouse Gas Inventories: Verification, Compliance and Trading, Warsaw, Poland, GHG Uncert. 24–25 September 2004. [Google Scholar]
- Farinelli, U.; Johansson, T.B.; McCormick, K.; Mundaca, L.; Oikonomou, V.; Örtenvik, M.; Patel, M.; Santi, F. “White and Green”: Comparison of market-based instruments to promote energy efficiency. J. Clean. Prod. 2005, 13, 1015–1026. [Google Scholar] [CrossRef]
- Iwaro, J.; Mwasha, A. A review of building energy regulation and policy for energy conservation in developing countries. Energy Policy 2010, 38, 7744–7755. [Google Scholar] [CrossRef]
- Abrahamse, W.; Steg, L.; Vlek, C.; Rothengatter, T. A review of intervention studies aimed at household energy conservation. J. Environ. Psychol. 2005, 25, 273–291. [Google Scholar] [CrossRef]
- Rezessy, S.; Bertoldi, P.; Persson, A. Are voluntary agreements an effective energy policy instrument? Insights and experiences from Europe. American Council for Energy Efficient Economy (ACEEE) Summer Study on Energy Efficiency in Industry; ACEEE: Washington, DC, USA, 2005. Available online: https://www.aceee.org/files/proceedings/2005/data/papers/SS05_Panel05_Paper14.pdf (accessed on 8 August 2021).
- Worrell, E.; Price, L.; Ruth, M. Policy modeling for energy efficiency improvement in us industry. Annu. Rev. Energy Environ. 2001, 26, 117–143. [Google Scholar] [CrossRef]
- Herbst, A.; Toro, F.; Reitze, F.; Jochem, E. Introduction to Energy Systems Modelling. Swiss J. Econ. Stat. 2012, 148, 111–135. [Google Scholar] [CrossRef]
- Aydin, E.; Brounen, D. The impact of policy on residential energy consumption. Energy 2019, 169, 115–129. [Google Scholar] [CrossRef]
- Nejat, P.; Jomehzadeh, F.; Taheri, M.M.; Gohari, M.; Abd. Majid, M.Z. A global review of energy consumption, CO2 emissions and policy in the residential sector (with an overview of the top ten CO2 emitting countries). Renew. Sustain. Energy Rev. 2015, 43, 843–862. [Google Scholar] [CrossRef]
- Abbasabadi, N.; Mehdi Ashayeri, J. Urban energy use modeling methods and tools: A review and an outlook. Build. Environ. 2019, 161. [Google Scholar] [CrossRef]
- Swan, L.G.; Ugursal, V.I. Modeling of end-use energy consumption in the residential sector: A review of modeling techniques. Renew. Sustain. Energy Rev. 2009, 13, 1819–1835. [Google Scholar] [CrossRef]
- Van Beeck, N.M.J.P. Classification of Energy Models; FEW Research Memorandum ; Operations Research: Tilburg, The Netherlands, 1999; Volume 777. [Google Scholar]
- Prina, M.G.; Manzolini, G.; Moser, D.; Nastasi, B.; Sparber, W. Classification and challenges of bottom-up energy system models—A review. Renew. Sustain. Energy Rev. 2020, 129, 109917. [Google Scholar] [CrossRef]
- Kannan, R.; Turton, H.; Panos, E. Methodological Significance of Temporal Granularity in Energy-Economic Models—Insights from the MARKAL/TIMES Framework. In Informing Energy and Climate Policies Using Energy Systems Models: Insights from Scenario Analysis Increasing the Evidence Base; Giannakidis, G., Labriet, M., Ó Gallachóir, B., Tosato, G., Eds.; Springer International Publishing: Cham, Switzerland, 2015; pp. 185–200. [Google Scholar] [CrossRef]
- White, D.; Winchester, N.; Atkins, M.; Ballingall, J.; Coates, S.; Mercader, F.; Greenhalgh, S.; Kerr, A.; Kerr, S.; Leaver, J.; et al. Energy- and Multi-Sector Modelling of Climate Change Mitigation in New Zealand: Current Practice and Future Needs. SSRN Electron. J. 2018. [Google Scholar] [CrossRef]
- Ringkjøb, H.K.; Haugan, P.M.; Solbrekke, I.M. A review of modelling tools for energy and electricity systems with large shares of variable renewables. Renew. Sustain. Energy Rev. 2018, 96, 440–459. [Google Scholar] [CrossRef]
- McNeil, M.A.; de la Rue du Can, S.; Hamza-Goodacre, D.; Roy, P. Energy Efficiency Indicators and Impact Metrics; Technical Report; Berkeley National Laboratory: Berkeley, CA, USA, 2016. [Google Scholar]
- Paltsev, S. Energy scenarios: The value and limits of scenario analysis: The value and limits of energy scenario analysis. Wiley Interdiscip. Rev. Energy Environ. 2017, 6, e242. [Google Scholar] [CrossRef]
- Karjalainen, J.; Karjalainen, M.; Vehmas, J.; Luukkanen, J. Energy Models and Scenarios in the Era of Climate Change; Technical Report; University of Turku: Turku, Finland, 2014. [Google Scholar]
- Beheshti, Z.; Shamsuddin, S.M.H. A review of population-based meta-heuristic algorithms. Int. J. Adv. Soft Comput. Appl. 2013, 5, 1–35. [Google Scholar]
- (IEA) International Energy Agency. Energy Efficiency Indicators 2020; IEA Publications: Paris, France, 2020. [Google Scholar]
- Calvillo, C.; Turner, K.; Bell, K.; McGregor, P.; Hawker, G. Potential for the Use of TIMES in Assessing Energy System Impacts of Improved Energy Efficiency: Using the TIMES Model in Developing Energy Policy; University of Strathclyde: Glasgow, UK, 2017. [Google Scholar]
- Calvillo Munoz, C.; Turner, K.; Bell, K.; McGregor, P. Residential energy efficiency in times—Analysis of modelling approaches and impacts on energy policy. In Proceedings of the 41st IAEE International Conference, Groningen, The Netherlands, 10–13 June 2018. [Google Scholar]
- Hong, T.; Wang, Z.; Luo, X.; Zhang, W. State-of-the-art on research and applications of machine learning in the building life cycle. Energy Build. 2020, 212, 109831. [Google Scholar] [CrossRef]
- Afroz, Z.; Shafiullah, G.; Urmee, T.; Higgins, G. Modeling techniques used in building HVAC control systems: A review. Renew. Sustain. Energy Rev. 2017, 83. [Google Scholar] [CrossRef]
- Kitchenham, B.; Charters, S. Guidelines for Performing Systematic Literature Reviews in Software Engineering; Technical Report; University of Durham: Durham, UK, 2007. [Google Scholar]
- Afini Normadhi, N.B.; Shuib, L.; Md Nasir, H.N.; Bimba, A.; Idris, N.; Balakrishnan, V. Identification of personal traits in adaptive learning environment: Systematic literature review. Comput. Educ. 2019, 130, 168–190. [Google Scholar] [CrossRef]
- Moher, D.; Liberati, A.; Tetzlaff, J.; Altman, D.G.; Group, T.P. Preferred Reporting Items for Systematic Reviews and Meta-Analyses: The PRISMA Statement. PLoS Med. 2009, 6, e1000097. [Google Scholar] [CrossRef]
- Jridi, O.; Aguir Bargaoui, S.; Nouri, F.Z. Household preferences for energy saving measures: Approach of discrete choice models. Energy Build. 2015, 103, 38–47. [Google Scholar] [CrossRef]
- Hara, K.; Uwasu, M.; Kishita, Y.; Takeda, H. Determinant factors of residential consumption and perception of energy conservation: Time-series analysis by large-scale questionnaire in Suita, Japan. Energy Policy 2015, 87, 240–249. [Google Scholar] [CrossRef]
- Marshall, E.; Steinberger, J.K.; Dupont, V.; Foxon, T.J. Combining energy efficiency measure approaches and occupancy patterns in building modelling in the UK residential context. Energy Build. 2016, 111, 98–108. [Google Scholar] [CrossRef]
- Braulio-Gonzalo, M.; Juan, P.; Bovea, M.D.; Ruá, M.J. Modelling energy efficiency performance of residential building stocks based on Bayesian statistical inference. Environ. Model. Softw. 2016, 83, 198–211. [Google Scholar] [CrossRef]
- Aghamohamadi, M.; Amjady, N. Modelling and optimisation for costly efficiency improvements on residential appliances considering consumers income level. IET Gener. Transm. Distrib. 2017, 11, 3992–4001. [Google Scholar] [CrossRef]
- Kleebrang, W.; Bunditsakulchai, P.; Wangjiraniran, W. Household electricity demand forecast and energy savings potential for Vientiane, Lao PDR. Int. J. Sustain. Energy 2017, 36, 344–367. [Google Scholar] [CrossRef]
- Mohseni, A.; Mortazavi, S.S.; Ghasemi, A.; Nahavandi, A.; Talaei abdi, M. The application of household appliances’ flexibility by set of sequential uninterruptible energy phases model in the day-ahead planning of a residential microgrid. Energy 2017, 139, 315–328. [Google Scholar] [CrossRef]
- Schütz, T.; Schiffer, L.; Harb, H.; Fuchs, M.; Müller, D. Optimal design of energy conversion units and envelopes for residential building retrofits using a comprehensive MILP model. Appl. Energy 2017, 185, 1–15. [Google Scholar] [CrossRef]
- Radpour, S.; Hossain Mondal, M.A.; Kumar, A. Market penetration modeling of high energy efficiency appliances in the residential sector. Energy 2017, 134, 951–961. [Google Scholar] [CrossRef]
- Davila, C.; Jones, N.; Al-Mumin, A.; Hajiah, A.; Reinhart, C. Implementation of a Calibrated Urban Building Energy Model (UBEM) for the Evaluation of Energy Efficiency Scenarios in a Kuwaiti Residential Neighborhood; Massachusetts Institute of Technology: Cambridge, MA, USA, 2017. [Google Scholar]
- Jafary, M.; Shephard, L. Modeling the Determinants of Residential Appliance Electricity Use Single-Family Homes, Homes with Electric Vehicles and Apartments. In Proceedings of the 2018 IEEE Green Technologies Conference (GreenTech), Austin, TX, USA, 4–6 April 2018. [Google Scholar] [CrossRef]
- Heidari, M.; Majcen, D.; van der Lans, N.; Floret, I.; Patel, M.K. Analysis of the energy efficiency potential of household lighting in Switzerland using a stock model. Energy Build. 2018, 158, 536–548. [Google Scholar] [CrossRef]
- Pradhan, B.B.; Limmeechokchai, B.; Shrestha, R.M. Implications of biogas and electric cooking technologies in residential sector in Nepal—A long term perspective using AIM/Enduse model. Renew. Energy 2019, 143, 377–389. [Google Scholar] [CrossRef]
- Lundgren, B.; Schultzberg, M. Application of the economic theory of self-control to model energy conservation behavioral change in households. Energy 2019, 183, 536–546. [Google Scholar] [CrossRef]
- Meangbua, O.; Dhakal, S.; Kuwornu, J.K. Factors influencing energy requirements and CO2 emissions of households in Thailand: A panel data analysis. Energy Policy 2019, 129, 521–531. [Google Scholar] [CrossRef]
- Wang, X.; Feng, W.; Cai, W.; Ren, H.; Ding, C.; Zhou, N. Do residential building energy efficiency standards reduce energy consumption in China? A data-driven method to validate the actual performance of building energy efficiency standards. Energy Policy 2019, 131, 82–98. [Google Scholar] [CrossRef]
- Wen, L.; Cao, Y. A hybrid intelligent predicting model for exploring household CO2 emissions mitigation strategies derived from butterfly optimization algorithm. Sci. Total Environ. 2020, 727, 138572. [Google Scholar] [CrossRef]
- Liang, H.; Ma, J.; Sun, R.; Du, Y. A Data-Driven Approach for Targeting Residential Customers for Energy Efficiency Programs. IEEE Trans. Smart Grid 2020, 11, 1229–1238. [Google Scholar] [CrossRef]
- Wen, L.; Cao, Y. Influencing factors analysis and forecasting of residential energy-related CO2 emissions utilizing optimized support vector machine. J. Clean. Prod. 2020, 250, 119492. [Google Scholar] [CrossRef]
- Krarti, M.; Aldubyan, M.; Williams, E. Residential building stock model for evaluating energy retrofit programs in Saudi Arabia. Energy 2020, 195, 116980. [Google Scholar] [CrossRef]
- Hirst, E. A model of residential energy use. Simulation 1978, 30, 69–74. [Google Scholar] [CrossRef]
- Wessels, J.; Wierzbicki, A.P. Model-based decision support. In Model-Based Decision Support Methodology with Environmental Applications; Springer: Berlin/Heidelberg, Germany, 2000; pp. 9–28. [Google Scholar]
- Oladokun, M.G.; Odesola, I.A. Household energy consumption and carbon emissions for sustainable cities: A critical review of modelling approaches. Int. J. Sustain. Built Environ. 2015, 4, 231–247. [Google Scholar] [CrossRef][Green Version]


| Type of Instrument | Instrument | Description |
|---|---|---|
| Market-based | Energy Taxes | Impact the price of goods and services that generate high greenhouse emissions or the price of the emission itself [8]. |
| Tradable emissions permits | Limited emission permits are divided among companies that pollute to control the amount of emissions agreed by regulatory agencies [9]. | |
| White certificates schemes | Energy suppliers commit to (1) Promote energy efficiency in final uses and (2) implement interventions to save a percentage of their distributed or supplied energy [10]. | |
| Financial incentives | Subsidies | Direct payments or tax rebates are used to motivate expenditure on energy efficiency [7]. |
| Access to capital measures | Grants and loans are provided to drive specific energy efficiency expenditures [7]. | |
| Regulatory Measures | Codes and Standards | Building codes and energy performance standards [7] are used to impose the compliance of minimum energy efficiency levels to products or services (e.g., building design or construction [11]). |
| Information and Feedback | Information | Certificates, labels, or audits are used to avoid suboptimal energy efficiency investments [7]. |
| Feedback | Consumption and energy information is given to consumers to promote energy conservation [12]. | |
| Non-regulatory measures | Voluntary Agreements | Adjustable agreements among firms and public authorities used to increase energy efficiency and diminish greenhouse emissions [13]. |
| Category | Subcategory | Model Focus |
|---|---|---|
| Sector Coverage [20] | Single-Sector | Just one sector |
| Multi-Sector | Interaction between sectors | |
| Geographical Coverage [20] | Global | World economy/situation |
| Regional | International regions | |
| National | All sector within a country | |
| Local | Regions within a country | |
| Project | Specific energy project | |
| Time Horizon [20] | Short | Less than 5 years model |
| Medium | 5 to 15 years model | |
| Long-Term | Greater than 16 years model | |
| Methodology [20] | Economic | Representation of economic and technical effects of alternative economic strategies |
| Optimization | Optimization of choices on energy investment | |
| Simulation | Replication of a system operation in a simplified form | |
| Spreadsheet | Utilization of a flexible tool to generate customized energy models | |
| Back-casting | Creation of views of a desired future and identification of trends to be broken to achieve the future | |
| Multi-criteria | Inclusion of additional criteria to the model beyond economic efficiency | |
| Other | Other methodology | |
| End-use Energy Modeling Technique [18,19] | Engineering | Calculation of energy consumption based on thermodynamics and heat transfer of all end-uses |
| Data-driven statistical | Correlation of end-use features with its energy use using statistical techniques | |
| Data-driven AI-based | Correlation of end-use features with its energy use using artificial intelligence techniques | |
| Programming Technique [21] | Linear Programming (LP) | Discover arrangement of activities to minimize or maximize a defined criterion |
| Mixed Integer LP | Extension to LP programming which include detailed formulation of technical properties and relations in modeling of energy systems | |
| Dynamic | Discover optimal growth path through division of an original problem and optimization of sub-problems | |
| Heuristic | Manage high dimension optimization problems [28] | |
| Other | Other type of programming technique | |
| Data Time Split [22] | Hourly/Minute | Hourly/Minute data resolution |
| Daily | Daily data resolution | |
| Monthly | Monthly data resolution | |
| Yearly | Yearly data resolution | |
| Metrics and Tools [20] | Metrics | CO emissions and cost as outputs in the model |
| Tools | Scenario utilization to show model’s results | |
| Residential Electricity end-uses [29] | A, SH, SC, L, WH, C | Detailed identification of electricity consumption, energy use and energy savings by end-use. |
| Domains of Study | Keywords (IEEE/ACM/Indexed Journals) and Synonyms |
|---|---|
| DS1. Energy Efficiency | Energy efficiency, energy-efficiency, CO, appliance, technology, energy conservation, retrofit, energy saving, insulation |
| DS2. Residential Sector and Residential Buildings | Household, dwelling, residential |
| DS3. Analytics techniques | Analytics, mining, prediction, data analysis, decision support, forecast, time series, regression, data-driven, data driven, Machine learning |
| DS4. Energy Modeling | Model |
| DS5. Policy design | Policy, policies, regulation, scenario, intervention, program, incentive |
| Query | Domain Combination | Keywords in Query | Constraint |
|---|---|---|---|
| Q1 | DS1, DS2 and DS3 | “energy efficiency” OR energy-efficiency OR CO OR appliance OR technology OR “energy conservation” OR retrofit OR “energy saving” OR insulation AND household OR dwelling OR residential AND “machine learning” OR analytics OR mining OR prediction OR “data analysis” OR “decision support” OR forecast OR “time series” OR regression OR “data-driven” OR “data driven” | TITLE AND Year > 2014 |
| Q2 | DS1, DS2 and DS4 | “energy efficiency” OR energy-efficiency OR CO OR appliance OR technology OR “energy conservation” OR retrofit OR “energy saving” OR insulation AND household OR dwelling OR residential AND model | TITLE AND Year > 2014 |
| Database | Num. Queries | Num. Articles | Duplicated | After Duplicates | Deduplicated | Final |
|---|---|---|---|---|---|---|
| IEEE | 312 | 38 | 8 | 30 | 105 | 192 |
| ACM | 2 | 16 | 1 | 15 | ||
| Science Direct | 56 | 56 | 3 | 53 | ||
| Scopus | 2 | 112 | 8 | 104 | ||
| Google Scholar | 24 | 118 | 23 | 95 | ||
| TOTAL | 396 | 340 | 43 | 297 | 105 | 192 |
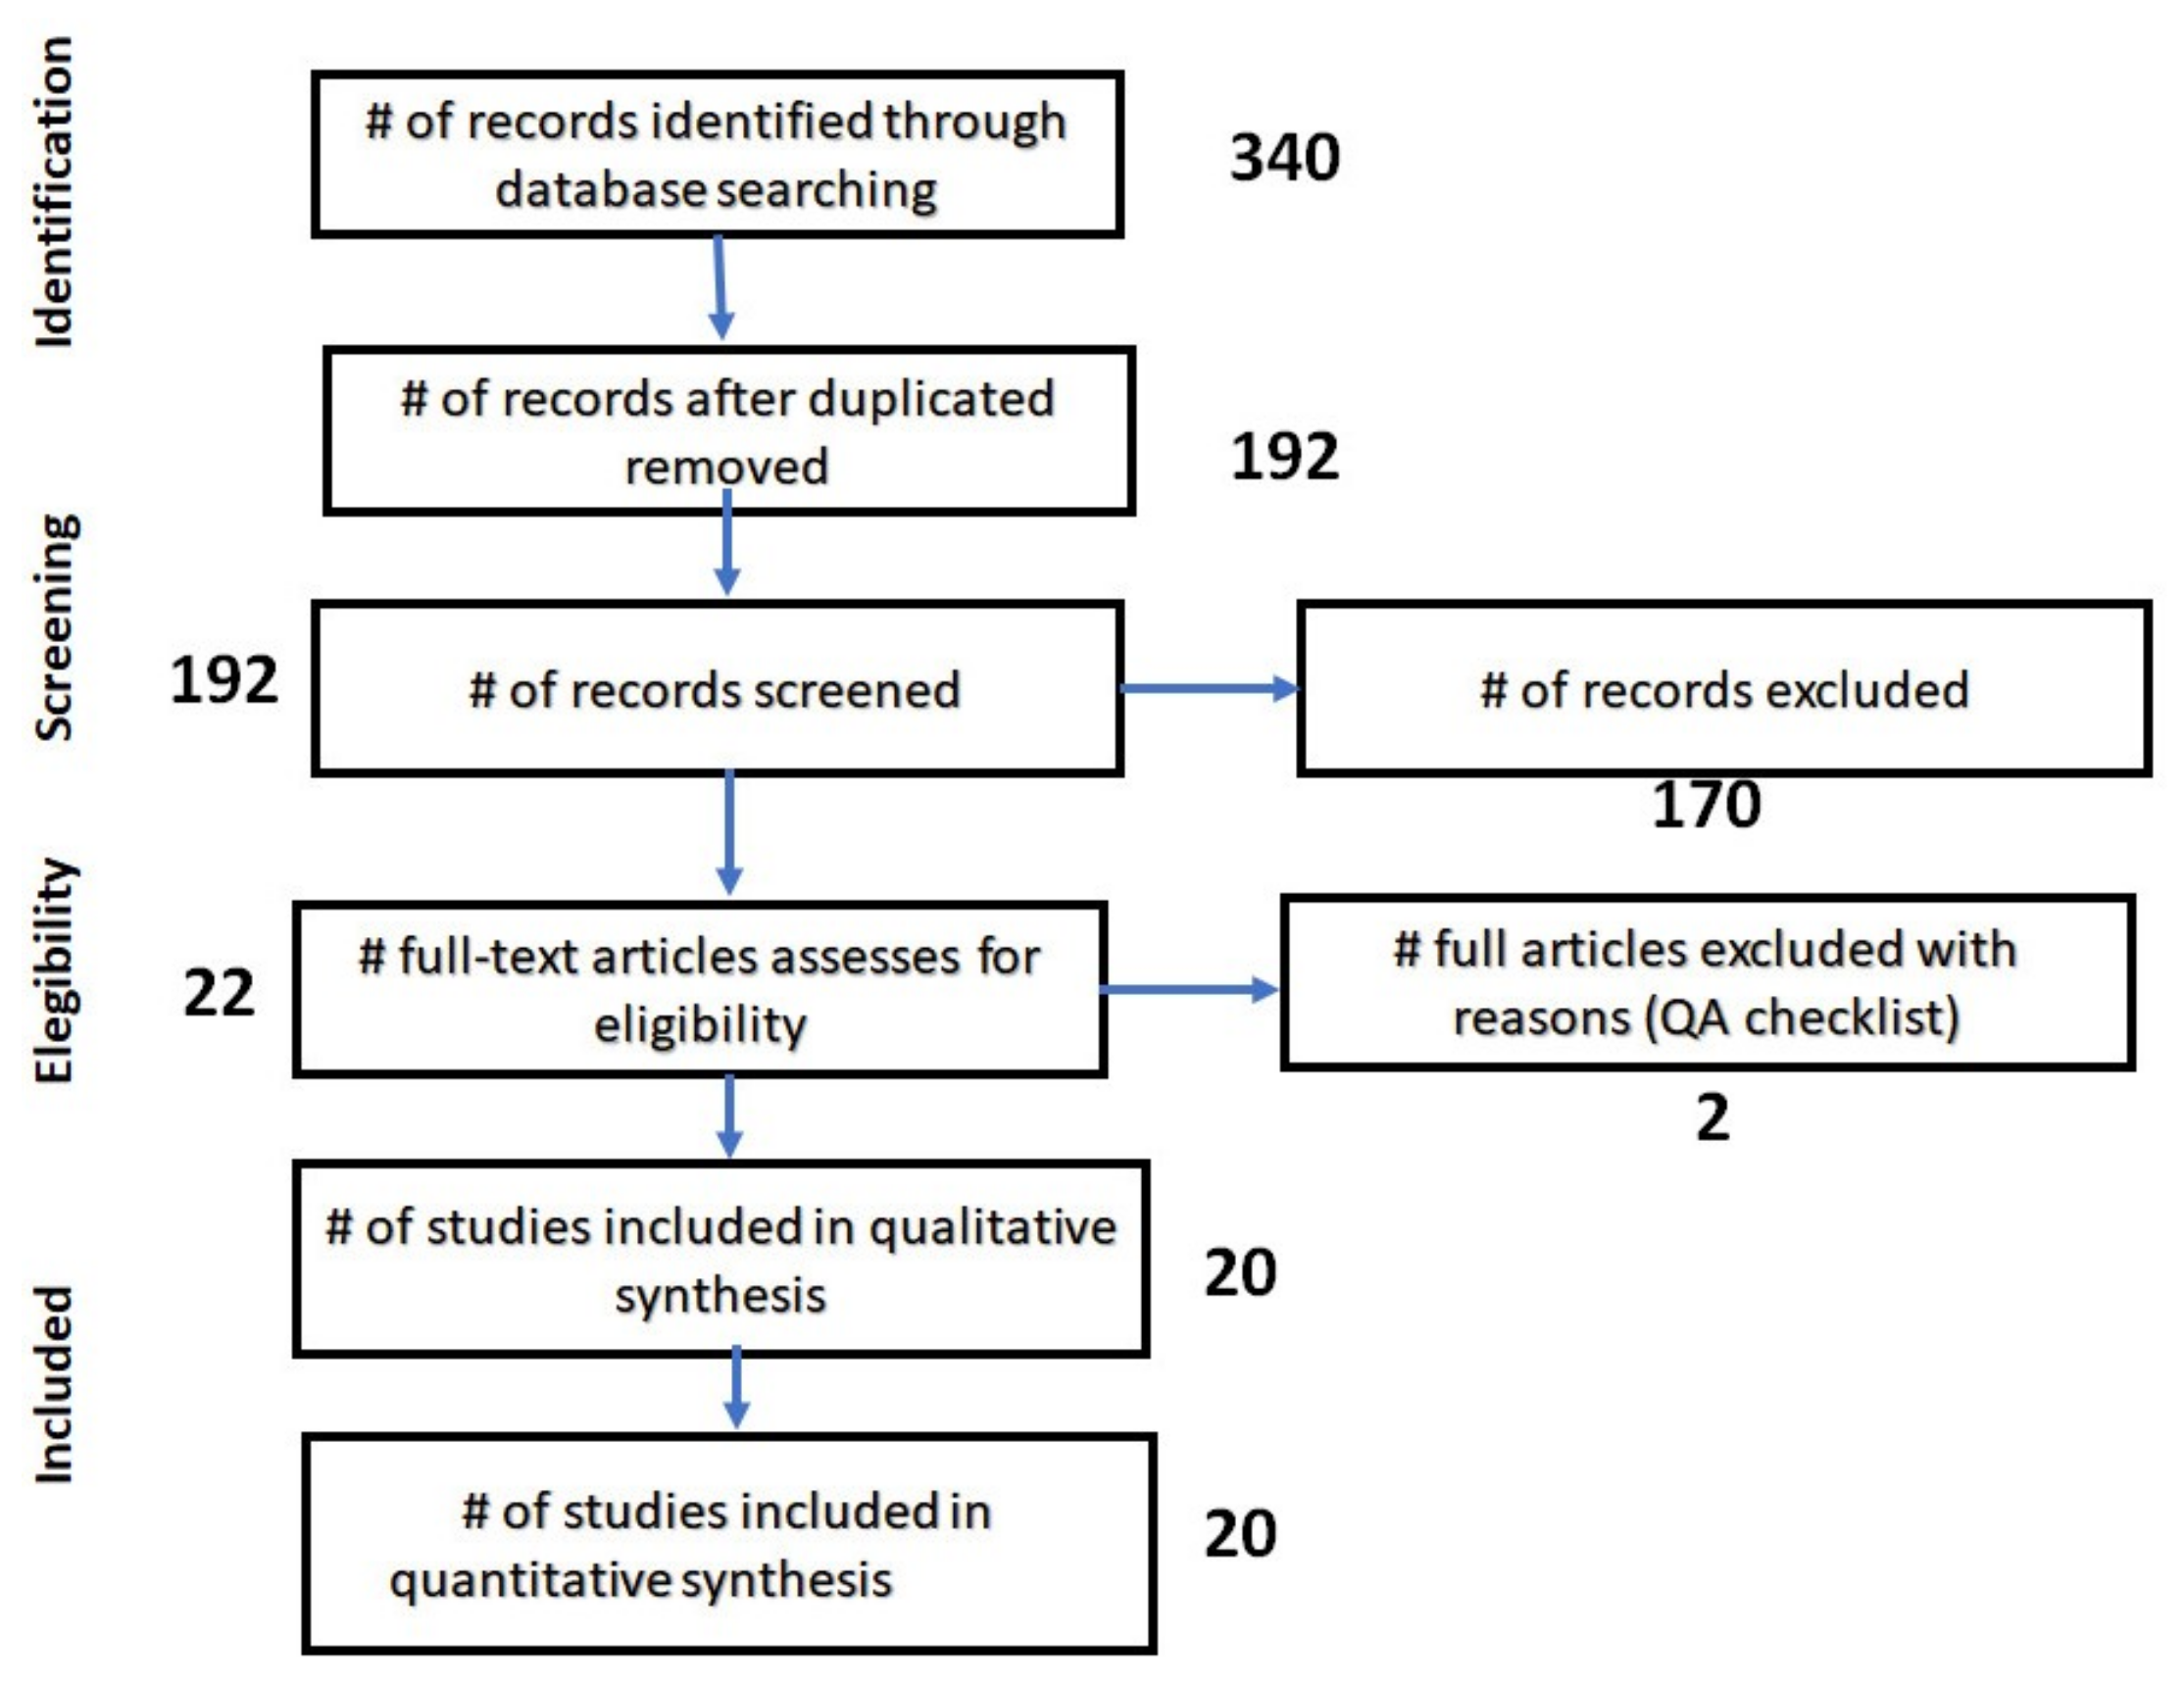
| Item | Assessment Criteria | Checklist Description |
|---|---|---|
| CK1 | Are the aims of the article clearly defined? | No, the aim is not definedYes, the aim is clearly defined |
| CK2 | Are endogenous and exogenous variables of the model described? | No, the variables are not described Yes, the variables are clearly listed and described |
| CK3 | Are the variables used in the study adequately measured? | No, the variables measurement process is not explained or justifiedYes, the variable measurement process is clearly explained and justified. |
| CK4 | Are methods for analyzing model’s data described? | No, the methods for data analysis are not described nor explained Yes, the methods for data analysis are clearly described and explained. |
| CK5 | Do the study present a validation procedure? | No, the study does not present a validation procedure of the obtained results Yes, the study presents a validation procedure of the obtained results. |
| Citation | Authors | Consumer Sector | Sector Coverage | Geographical Coverage | Time Horizon | Methodology | Modeling Technique | Programming Technique | Electricity End-Use | Technique Used |
|---|---|---|---|---|---|---|---|---|---|---|
| [37] | Jridi et al. | Residential | Single-Sectorial | Local | Short | Economic | DDS | Other | AL | Discrete choice models (Logit model) |
| [38] | Hara et al. | Residential | Single-Sectorial | Local | Medium | Economic | DDS | Other | SC | Discrete choice models (Logit and probit), Time-series analysis |
| [39] | Marshall et al. | Building | Single-Sectorial | Local | Short | Simulation | E | Other | SH | Transient Thermodynamics equations |
| [40] | Braulio Gonzalo et al. | Building | Single-Sectorial | Local | Short | Simulation | E | Other | SH, SC | Bayesian Inference, INLA (Integrated Nested Laplace Approximation) |
| [41] | M. Aghamohamadi et al. | Residential | Single-Sectorial | Local | Short | Optimization | DDS | Other | AL, SC | Probability Density Functions Least Square Method, Person distribution |
| [42] | w. Kleebrang et al. | Residential | Multi-Sectorial | Local | Long-Term | Economic | DDS | Other | AL, SC, WH | End-use Model Linear Regression |
| [43] | A. Mohseni et al. | Residential | Single-Sectorial | Project | Short | Optimization | DDS | Mixed LP | A, SC | Set of Sequential Uninterruptible Energy Phases MILP |
| [44] | Schutz et al. | Building | Single-Sectorial | Project | Short | Optimization | E | Mixed LP | SH, SC | Dynamic Building Model MILP |
| [45] | Radpour et al. | Residential | Single-Sectorial | Local | Long-Term | Economic | DDS | Other | A | Econometric diffusion models, market share functions, energy system parameters |
| [46] | Cerezo Davila et al. | Building | Single-Sectorial | Local | Long-Term | Simulation | E | Other | AL, SC | Occupant uncertainty modeling |
| [47] | Jafary et al. | Residential | Single-Sectorial | Project | Short | Other | DDS, DDAI | Other | A | Cluster analysis Regression analysis |
| [48] | Heidari et al. | Residential | Single-Sectorial | Local | Long-Term | Economic | DDS | Other | L | Material flow analysis (MFA) Weibull distribution, Techno-economic analysis |
| [49] | Pradhan et al. | Residential | Multi-Sectorial | National | Long-Term | Optimization | DDS | Linear Programming | C | Linear optimization |
| [50] | Lundgren et al. | Residential | Single-Sectorial | Local | Medium | Other | DDS, DDAI | Other | AL | Two level time series mediation model, Regression analysis, Principal Component analysis |
| [51] | Meangbua et al. | Residential | Single-Sectorial | Local | Medium | Other | DDS | Other | SC | Panel data regression |
| [52] | Wang et al. | Building | Single-Sectorial | Local | Short | Other | DDS | Other | SC, SH | Propensity score matching method |
| [53] | Wen and Cao | Residential | Single-Sectorial | Local | Medium | Other | DDS, DDAI | Heuristic | SC, A | Bivariate correlation analysis Butterfly optimization algorithm, Least square support vector machine |
| [54] | Liang et al. | Residential | Single-Sectorial | Project | Short | Other | DDS | Other | A | Sliding Window Linear Regression, Kernel Density |
| [55] | Wen and Cao | Residential | Single-Sectorial | Local | Long-Term | Other | DDS, DDAI | Heuristic | SC, A | Grey Relational analysis, chicken swarm optimization, Support Vector Machine |
| [56] | Krarti et al. | Building | Single-Sectorial | Local | Long-Term | Simulation | E | Other | AL, SC | Mathematical equations |
| Citation | Authors | Sector Coverage | Geographic Coverage | Time Horizon | Electricity End-Uses | Data | Cost | Scenario Based | CO |
|---|---|---|---|---|---|---|---|---|---|
| [37] | Jridi et al. | Single-sector | Local | Short | AL | Yearly | no | no | no |
| [41] | Aghamohamadi and Amjady | A, L, SC | Hourly | yes | yes | no | |||
| [38] | Hara et al. | Single-sector | Local | Medium | SC | Yearly | no | no | no |
| [50] | Lundgren and Schultzberg | AL | Yearly | yes | no | no | |||
| [51] | Meangbua et al. | SC | Yearly | no | no | yes | |||
| [53] | Wen and Cao | A, SC | Yearly | no | no | yes | |||
| [45] | Radpour et al. | Single-sector | Local | Long-term | A | Yearly | yes | yes | no |
| [48] | Heidari et al. | L | Yearly | yes | yes | no | |||
| [55] | Wen and Cao | A, SC | Yearly | no | no | yes | |||
| [43] | A. Mohseni et al. | Single-sector | Project | Short | A, SC | Hourly | yes | yes | no |
| [47] | Jafary and Shephard | A | Hourly | no | no | no | |||
| [54] | Liang et al. | A | Hourly | no | yes | no | |||
| [42] | w. Kleebrang et al. | Multi-sector | Local | Long-term | A, L, SC, WH | Yearly | no | yes | no |
| [49] | Pradhan et al. | Multi-sector | National | Long-term | C | Yearly | yes | yes | yes |
| Citation | Authors | Sector Coverage | Geographic Coverage | Time Horizon | Electricity End-Uses | Data | Cost | Scenario Based | CO |
|---|---|---|---|---|---|---|---|---|---|
| [39] | Marshall et al. | Single-sector | Local | Short | SH | Yearly | no | yes | no |
| [40] | Braulio Gonzalo et al. | SH, SC | Daily | no | no | no | |||
| [52] | Wang et al. | SH, SC | Monthly | no | no | no | |||
| [46] | Davila et al. | Single-sector | Local | Long-term | A, L, SC | Yearly | yes | yes | no |
| [56] | Krarti et al. | A, L, SC | Yearly | yes | no | no | |||
| [44] | Schutz et al. | Single-sector | Project | Short | SH, SC | Hourly | yes | yes | yes |
| Modeling Technique | Methodology | Programming Technique | Techniques Used | Citations |
|---|---|---|---|---|
| Data-driven statistical | Economic | Other | Discrete choice models (Logit model or/and probit models), time-series analysis, end-use model, linear Regression, econometric diffusion models, market share functions, material flow analysis (MFA), weibull distribution, techno-economic analysis | [37,38,42,45,48] |
| Optimization | Other | Probability Density Functions, least Square Method, Pearson distribution | [41] | |
| Linear Programming | Linear optimization | [49] | ||
| Mixed LP | Set of sequential uninterruptible energy phases, MILP | [43] | ||
| Other | Other | Panel data regression, Sliding window linear regression, kernel density | [51,54] | |
| Data-driven statistical and data-driven AI-based (Hybrid) | Other | Other | Cluster analysis, regression analysis, two level time series, mediation model, regression analysis, principal component analysis | [47,50] |
| Heuristic | Bivariate correlation analysis, Butterfly optimization algorithm, Least square support vector machine, Grey relational analysis, Chicken swarm optimization, Support Vector Machine | [53,55] |
| Modeling Technique | Methodology | Programming Technique | Techniques used | Citations |
|---|---|---|---|---|
| Data-driven statistical | Other | Other | Propensity score matching method | [52] |
| Engineering | Simulation | Other | Transient thermodynamics equations, mathematical equations | [39,56] |
| Optimization | Mixed LP | Dynamic Building Model, MILP | [44] | |
| Engineering-Data-driven statistical (Hybrid) | Simulation | Other | Occupant uncertainty modeling, Bayesian inference, INLA (Integrated Nested Laplace Approximation) | [40,46] |
Publisher’s Note: MDPI stays neutral with regard to jurisdictional claims in published maps and institutional affiliations. |
© 2021 by the authors. Licensee MDPI, Basel, Switzerland. This article is an open access article distributed under the terms and conditions of the Creative Commons Attribution (CC BY) license (https://creativecommons.org/licenses/by/4.0/).
Share and Cite
Sanchez-Escobar, M.O.; Noguez, J.; Molina-Espinosa, J.M.; Lozano-Espinosa, R.; Vargas-Solar, G. The Contribution of Bottom-Up Energy Models to Support Policy Design of Electricity End-Use Efficiency for Residential Buildings and the Residential Sector: A Systematic Review. Energies 2021, 14, 6466. https://doi.org/10.3390/en14206466
Sanchez-Escobar MO, Noguez J, Molina-Espinosa JM, Lozano-Espinosa R, Vargas-Solar G. The Contribution of Bottom-Up Energy Models to Support Policy Design of Electricity End-Use Efficiency for Residential Buildings and the Residential Sector: A Systematic Review. Energies. 2021; 14(20):6466. https://doi.org/10.3390/en14206466
Chicago/Turabian StyleSanchez-Escobar, Marlene Ofelia, Julieta Noguez, Jose Martin Molina-Espinosa, Rafael Lozano-Espinosa, and Genoveva Vargas-Solar. 2021. "The Contribution of Bottom-Up Energy Models to Support Policy Design of Electricity End-Use Efficiency for Residential Buildings and the Residential Sector: A Systematic Review" Energies 14, no. 20: 6466. https://doi.org/10.3390/en14206466
APA StyleSanchez-Escobar, M. O., Noguez, J., Molina-Espinosa, J. M., Lozano-Espinosa, R., & Vargas-Solar, G. (2021). The Contribution of Bottom-Up Energy Models to Support Policy Design of Electricity End-Use Efficiency for Residential Buildings and the Residential Sector: A Systematic Review. Energies, 14(20), 6466. https://doi.org/10.3390/en14206466