Article

Heat Loss Due to Domestic Hot Water Pipes

1
nZEB Research Group, Tallinn University of Technology, 19086 Tallinn, Estonia
2
Smart City Centre of Excellence (Finest Twins), Tallinn University of Technology, 19086 Tallinn, Estonia
*
Author to whom correspondence should be addressed.
Energies 2021, 14(20), 6446; https://doi.org/10.3390/en14206446
Submission received: 3 September 2021 / Revised: 29 September 2021 / Accepted: 30 September 2021 / Published: 9 October 2021
(This article belongs to the Special Issue Energy Performance of Buildings 2021)

Abstract

:
Domestic hot water (DHW) system energy losses are an important part of energy consumption in newly built or in reconstructed apartment buildings. To reach nZEB or low energy building targets (renovation cases) we should take these losses into account during the design phase. These losses depend on room and water temperature, insulation and length of pipes and water circulation strategy. The target of our study is to develop a method which can be used in the early stages of design in primary energy calculations. We are also interested in how much of these losses cannot be utilised as internal heat gain and how much heat loss depends on the level of energy performance of the building. We used detailed DHW system heat loss measurements and simulations from an nZEB apartment building and annual heat loss data from a total of 22 apartment buildings. Our study showed that EN 15316-3 standard equations for pipe length give more than a twice the pipe length in basements. We recommend that for pipe length calculation in basements, a calculation based on the building’s gross area should be used and for pipe length in vertical shafts, a building’s heating area-based calculation should be used. Our study also showed that up to 33% of pipe heat losses can be utilised as internal heat gain in energy renovated apartment buildings but in unheated basements this figure drops to 30% and in shafts rises to 40% for an average loss (thermal pipe insulation thickness 40 mm) of 10.8 W/m and 5.1 W/m. Unutilised delivered energy loss from DHW systems in smaller apartment buildings can be up to 12.1 kWh/(m2·a) and in bigger apartment buildings not less than 5.5 kWh/(m2·a) (40 mm thermal pipe insulation).

1. Introduction

Nearly zero energy (nZEB) apartment buildings have a relatively higher share of energy use for domestic hot water (DHW) because of reduced heat loss from the well-insulated building envelope, the use of ventilation heat recovery and LED lighting systems. DHW energy consumption can be divided between energy used to heat the water and energy consumed by system losses. Bøhm and Danig showed [1] that in apartment buildings the heat losses from the hot water system correspond to approximately 65% of the energy consumption for domestic hot water and the cause of these heat losses should be further investigated. Later, Bøhm specified [2] that most of the energy demand for DHW is lost in the circulation system. As the system’s apartment building’s DHW heat loss was 23–70%, its efficiency was 0.30–0.77. Gassel [3] showed that if the DHW circulation is constantly in operation, this equates to 15 kWh/m2·a energy consumption, the circulation share being 19% of total DHW heating demand. Horvath et.al [4] showed that when the specific DHW annual heat demand is between 23.2 and 32.2 kWh/(m2·a), the distribution and circulation losses are between 5.7 and 9.9 kWh/(m2·a). Zhang et al. [5] indicated that recirculation loop pipes heat loss represented about one third of a system’s fuel energy consumption and the average overall system efficiency was only about 34%. Similar results were found in the study by Marszal-Pomianowska et al. [6], where DHW accounted for 16% to 50% of total DHW heating consumption. Huhn and Davids [7] showed that the energy losses from hot water circulation are in the range of 25% to 75% of the energy used for DHW supply. In buildings with low DHW consumption, the efficiency is particularly poor. When DHW use is small than DHW circulation heat loss is more or less the same as in buildings with a bigger DHW consumption, but the relative share of DHW system losses in those buildings is bigger.
Minimising DHW distribution and circulation losses improves the efficiency of the system and the energy performance of the whole building. Kitzberger et al. [8] showed that minimising the runtime of the circulation pumps and decreasing hot water flow and storage capacities reduces the annual energy consumption for DHW by 15–25%. Mühlbacher and Carter [9] deduced a dependency between the energy loss and the operating time of the circulation pump in buildings with DHW circulation energy use from 21% to 65%. Without a reduction in the operating time of the circulation pump, energy loss from circulation was more than 60%. Cholewa et al. [10] showed in their long term field measurements on performance of DHW, that a significant part (57% to 71%) of the heat loss is allocated to the circulation of hot water. Using temperature control valves in the risers of the circulation installation to limit the circulation flow during periods of time when it is not required, generated average energy savings of 19%. Adam et al. [11] proposed shortening the circulation runtime (a minimum of 16 h per day) to decrease DHW circulation heat loss. Bøhm [2] suggested that replacing the bypass function with an in-line supply pipe and a heat pump can help to reduce the return temperature of the decentralised substation system. As a result, the annual distribution heat loss decreased by 12%.
Lowering circulation time is one possibility but it depends on how people use DHW. Ahmed et.al. [12] studied hourly DHW consumption in 86 apartments with 191 occupants over the course of one year and found that almost 90% of hourly consumption was between 0 and 20 L/(person·h). Two sharp peak consumption periods were present on week-days. Morning peak consumption was between 7:00 and 9:00 whereas evening peak consumption was between 20:00 and 22:00. The average consumption was 4.1 and 1.1 L/(person·h) for peak and non-peak hours respectively. Overnight, DHW consumption was almost zero.
Another possibility for decreasing DHW energy consumption is to lower the DHW temperature. Navalón [13] showed that by reducing the return temperature to 52 °C (limit temperature to avoid Legionella), the theoretical saving is 15–18%. The growth of Legionella bacteria is high risk and that is why water temperatures between 25 °C and 45 °C should be avoided, ideally maintaining hot water above 50 °C. To improve energy efficiency and avoid the risk of Legionella, Brand [14] suggested stopping the use of DHW circulation.
In old apartment buildings, heat from DHW distribution and circulation heat losses are distributed mainly in unheated basements and through shaft walls into apartments. Grasmanis et.al [15] showed that DHW circulation heat losses in an unheated basement vary between 10–12% during the non-heating season and 12–15% during the heating season. Depending on the season, the rate of circulation heat losses from vertical distribution circulation loop pipes varies from 55% to 60% for five floor buildings and 62% to 67% for 9 or 12 floor buildings. Rocheron [16] showed that the insulation of storage and distribution systems is an essential parameter in the process of energy savings, especially in the case of the DHW circulation.
Hamburg and Kalamees [17,18,19] have found that in reconstructed apartment buildings with DHW circulation, the energy consumption for circulation is on average 14 kWh/(m2·a) higher than in buildings without circulation (apartment-based boilers) in the cold Estonian climate. To minimise the energy performance gap, more accurate design work is needed. During the early stages of design, exact and accurate input data for dynamic simulation is usually missing. Over-optimistic assumptions in the initial data and over-simplified energy calculations may lead to energy performance targets not being met [20]. Arumägi [21] studied the design of the first net-zero energy buildings in Estonia and concluded that more thorough analyses are needed in the very first stage of the design to find suitable solutions and possible compromises between architecture and energy efficiency. Attia and De Herde [22] compared ten early design simulation tools for net zero energy buildings and showed that for nZEBs we should invest more in the early design applications and tools. At the detailed design stage, it is possible to get the exact length of DHW pipes from the final building information model (BIM), but this information is missing in the preliminary design, which is when the designer must demonstrate that energy performance has been achieved. The length of DHW pipes and their heat loss can be calculated with EN 15316-3 standard [23], based on the length and width of the building. However, these parameters are complicated to find in existing buildings which are not rectangular in shape. This is why using equations of lengths and widths in L-shaped and other irregular shaped buildings becomes so complex. Therefore, there is a need for a tool that estimates the DHW system parameters and energy performance that can be used at an early stage of design, and for the improvement of the methodology for assessing the energy performance of a building.
The working hypotheses of this study are the following:
  • It is possible to estimate accurately enough the length of DHW piping based on the general characteristics of the building at the early design stage of the building.
  • Based on the data of the early design stage, it is possible to calculate DHW circulation losses with sufficient accuracy and to propose a corresponding supplement to the calculation method.
Our goal was to find a better equation for calculating DHW and DHW circulation pipe lengths in basements and shafts than that used in EN 15316-3 standard equations [23].

2. Methods

2.1. Research Scheme to Investigate DHW and DHW Circulation Heat Losses

Our goal was to investigate DHW pipe length and heat loss in Estonian apartment buildings. We used for this a detailed model of an nZEB case building and compared the results with measured data from different apartment buildings:
Detailed calibrated dynamic indoor climate and energy simulation model for a nZEB apartment building (nZEB case building in the information we have from 4 types of building categories is shown in Table 1.
  • Detailed calibrated dynamic indoor climate and energy simulation model for a nZEB apartment building (nZEB case building in Table 1) to determine heat loss factors on room (21 °C heated and unheated basement) and water temperature, insulation (0, 20, 40 mm with and without valve insulation) and length of pipes and water circulation strategy (continuous circulation, clock based);
  • Design DHW pipe length from 15 apartment buildings (Test building in Table 1);
  • Generating a method for calculating pipe length and heat loss from pipes to be used in early stages of design;
  • Validating of pipe length equation in7 reference apartment buildings (Reference buildings in Table 1);
  • Validation of DHW heat loss with earlier studied 23 buildings measured heat losses.
In following Table 1 are shown which kind of information we have from 4 types of building categories.

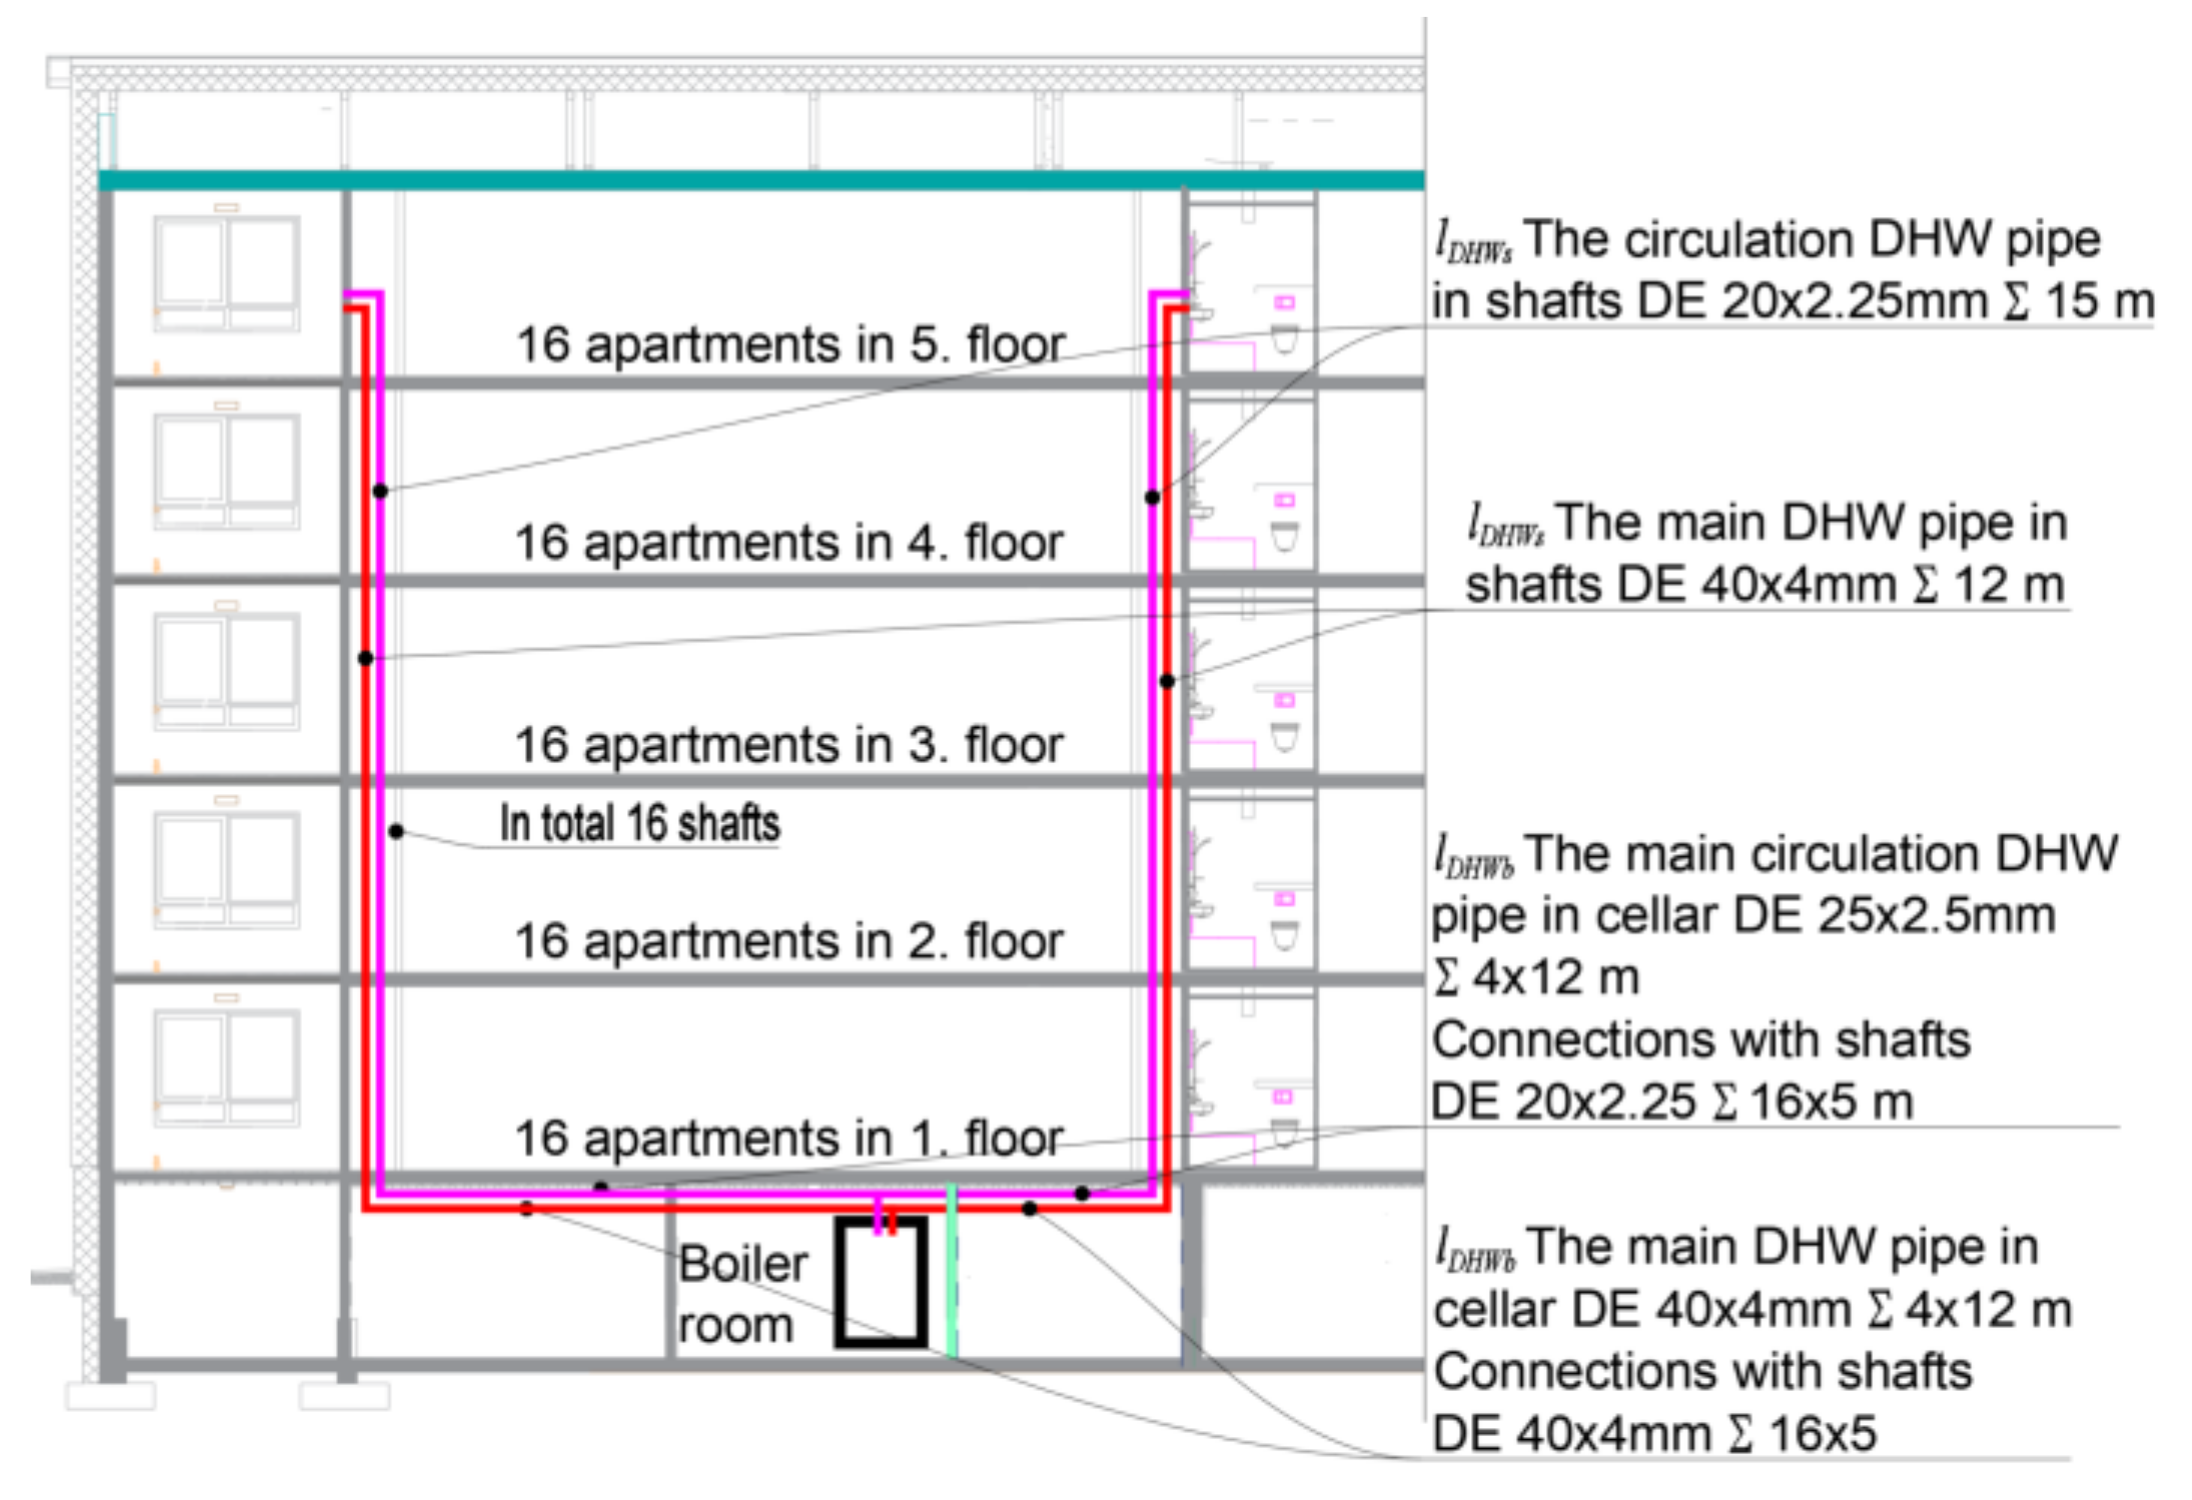
2.2. nZEB Case Building

The nZEB case building has 80 small sized, one or two bedroomed apartments. More or less the same sized typical apartment buildings from the period end of 1970s until early 1990s usually have 60 apartments. The building is a 5-storey, large concrete panel apartment building with a total heated area of 3562 m2, constructed in 1986 (Figure 1) d renovated to nZEB in 2018 [24,25]. We chose this building because it had a good monitoring system in place after its reconstruction, therefore we have hourly data from DHW use, DHW heating and DHW circulation.
The DHW consumption and heating energy consumption, together with DHW and DHW circulation heating, was measured from all apartments. In the case study building which we chose for calibrating our pipe heat loss model, we measured hourly data from every source (detailed information about DHW volumes and DHW heating energy per every hour and also circulation energy use) between the period June to November 2019. The indoor temperature in the main basement room was also measured during the same period.

2.3. Test Buildings and Reference Buildings

We selected test buildings from among the buildings where we have detailed information about pipe length and energy use (DHW, DHW circulation) in both basement and shafts. We included both new buildings and renovated buildings in the selection. Our goal was to involve as wide a range of buildings from the sector as possible. These buildings were constructed between 1970 and 2017 and the main construction method was concrete (large panels) or brick (Table 2). The average number of apartments was 50 apartments and floor gross area was 730 m2. Table 2 presents the basic building parameters [26].
The data on DHW and DHW circulation heating energy use from 15 test buildings (coded 1.1…1.15) and 7 reference buildings (coded 2.1…2.7) was calculated from measured heating energy consumption. We also used data from 23 previously analysed buildings to compare the calculated energy use of our test and reference buildings with measured values [17,18,19].

2.4. Determining DHW Pipe Length

To come up with an appropriate method for determining DHW pipe length, we selected 15 buildings with basic data available (which are presented in (Table 2). We analysed the data (building volume, heating area, net area, floor gross area, total number of apartments, etc.) from 15 test buildings to find out which data could be used and how to formulate an equation to generate the length and energy use of the DHW systems. The buildings’ perimeter and the number of DHW shafts were calculated and counted from the design drawings of these buildings.
We used R square to find the best parameter model with intercept and for the two parameter model we used a bootstrapping method [27] to find best frequency by randomly sampling 2 parameters 10,000 times. Our goal was to find a minimum pipe length difference from measured values. All measured pipe lengths in the buildings are presented in (Table 2). Measured DHW pipes and DHW circulation pipes were more or less the same (measured pipe length in test and reference buildings), which is why we decided to present, for measured pipe length, an average DHW and DHW circulation pipe length in each building.
These so-determined DHW and DHW circulation pipe lengths were compared with EN standard (EN-15316-3 [23]) calculated pipe lengths.
Pipe length of DHW (lDHW) (1) and DHW circulation system (lcirc.) (2) in the basement can be calculated by standard EN-15316-3 [23]. In the Equations, LL is length and LW is width of the building.
lDHWb = LL + 0.0625·LL·LW,    (m)
lcirc.b = 2·LL + 0.0125·LL·LW,    (m)
Pipe length of DHW (lDHWs) (lDHWs = 0.038·LL·LW·Nlev·Hfl, (m)) and DHW circulation system (lcirc.s) (4) in the shafts can be calculated by standard EN-15316-3 [23]. In Equations LL is length, LW is width, Nlev is number of floors and Hfl is height of floor of the building.
lDHWs = 0.038·LL·LW·Nlev·Hfl,    (m)
lcirc.s = 0.0752·LL·LW·Nlev·,    (m)

2.5. Indoor Climate and Energy Performance by nZEB Case Building Calibration

The indoor climate and energy performance model was built in the simulation program IDA ICE 4.8 [28,29]. This software allows the modelling of a multizone building, internal heat gains and external solar loads, outdoor climate, heating and ventilation systems and dynamic simulation of heat transfer and air flows. We were also able to model heat losses from the zones in which they occurred and represent uninsulated valves by using a 2 m uninsulated pipe length, which is more or less an average from calculated values [30].
To calibrate the model we built up a complex model using detailed DHW and DHW circulation drawings for the reference building and then simplified it to create our calculation model (Figure 2).
Building a simulation model that matched all losses with the zones where those losses were occurring was very complex. Therefore we simplified the basement to a one zone model (originally this was a multizone basement with 14 rooms, as we wanted to see how heat losses affected indoor temperatures in the basement in different thermal insulation cases (0, 20, 40 mm with and without valve insulation)) but calculated with the different EPC that we used in earlier studies of the same building [31].
The calculations can be repeated when the design of DHW and DHW circulation has been simplified by using a standard length for all main pipe lengths between shafts, and all pipe lengths and thermal insulation thicknesses have been described. The pipe model used is important, as is showing where pipes are located (in which zone). All pipes in the model must be hydraulically balanced, and inlet and outlet water temperature from the plant should be accurately represented.
Using measured pipe lengths in basement and shafts, we built up a dynamic simulation model with previously calibrated building heat losses. We measured indoor temperatures in the basement and used this for calibrating measured heat losses with calculated ones.

2.6. Heat Losses Calculations from DHW and DHW Circulation Pipes

Heat loss was calculated based on standard EN 15316-3 [23]. By this standard, pipe heat losses are calculated per length when the temperature difference is 1 Kelvin (Table 3). In this case, we can assume heat loss from pipes when we know the average basement or shaft temperature and pipe length in those places. However, indoor temperatures and how much these losses can be utilised as internal heat gain are both unknown.

2.7. The Influence of DHW and DHW Circulation Heat Loss on the Whole Building Energy Performance and Indoor Climate

The dependence of DHW heat loss on the energy performance of the building was analysed by using IDA ICE 4.8 dynamic simulation software. That is why we analysed the annual loss in the nZEB case building (Figure 1) with different thicknesses of thermal pipe insulation and with the different building envelope thermal insulations which are typically used in renovation scenarios in Estonia. Inputs for the simulation model are presented as the following:
Simulations were done in two different cases, with a heated basement and with an unheated basement. For this reason, we used two different heated areas 3562 m2 (without basement) and 4324 m2 (with basement). In the Figures, EPC classes are designated by class symbols (A, C, D, E and F).
Our goal was to find out, firstly, how much energy could be utilised from DHW system pipe losses in the basement and in shafts per calculated length and how large non-utilised losses per calculated length would be and, secondly, what the EPC class would be with and without pipe losses in the different cases.

3. Results

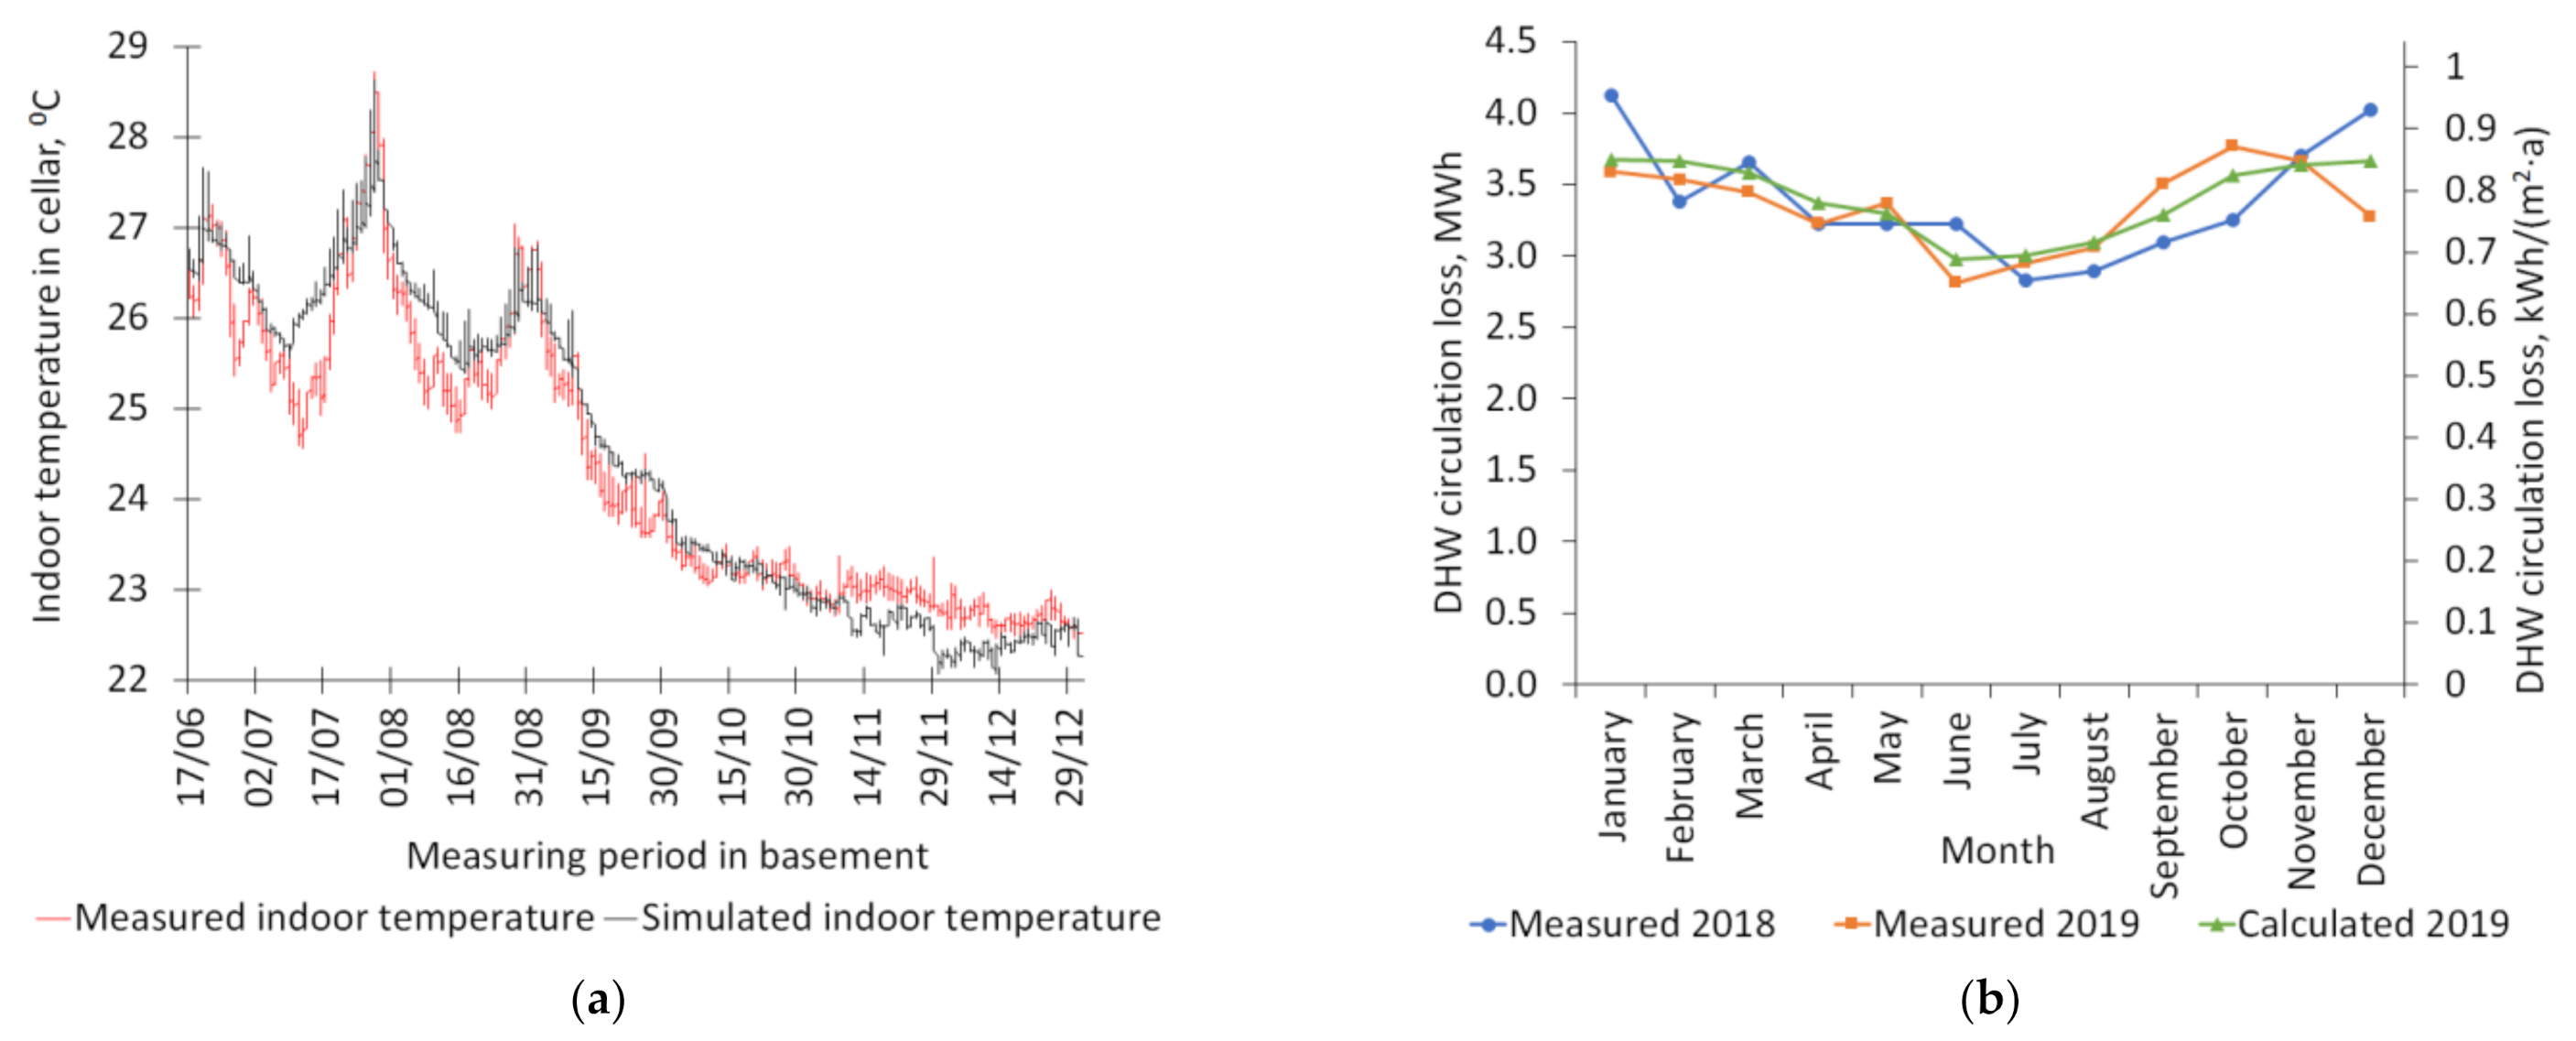
3.1. Measured and Calculated DHW Circulation Losses in Case Building

The DHW use in 2018 was 47.6 kWh/m2·a, with energy consumption and DHW circulation losses having been measured in the nZEB case building at an hourly level. Two years’ measurements of DHW circulation are shown in Figure 3b. In 2018 the total DHW circulation loss was 9.4 kWh/(m2·a) (per heated area) and 11.4 kWh/(m2·a) (per apartment area). In 2019, DHW circulation loss was even higher at 10.3 kWh/m2·a (12.5 kWh/(m2·a)), as was total DHW system energy use (49.2 kWh/(m2·a)). In both years, the DHW circulation heating energy loss was approximately 20%. The DHW system energy loss in a typical reconstructed apartment building in Estonia is more or less the same [17].
In Figure 3a, we can see that measured temperatures during the summer–autumn period in the basement were constantly more than 22 °C, which shows that pipe losses from DHW, DHW circulation and heating pipe connections with shafts were holding temperatures higher than the modelled heating set point temperature of 21 °C. In this case, we can see that indoor temperatures are more dependent on losses from piping lengths and thermal isolation than indoor setpoint temperatures.

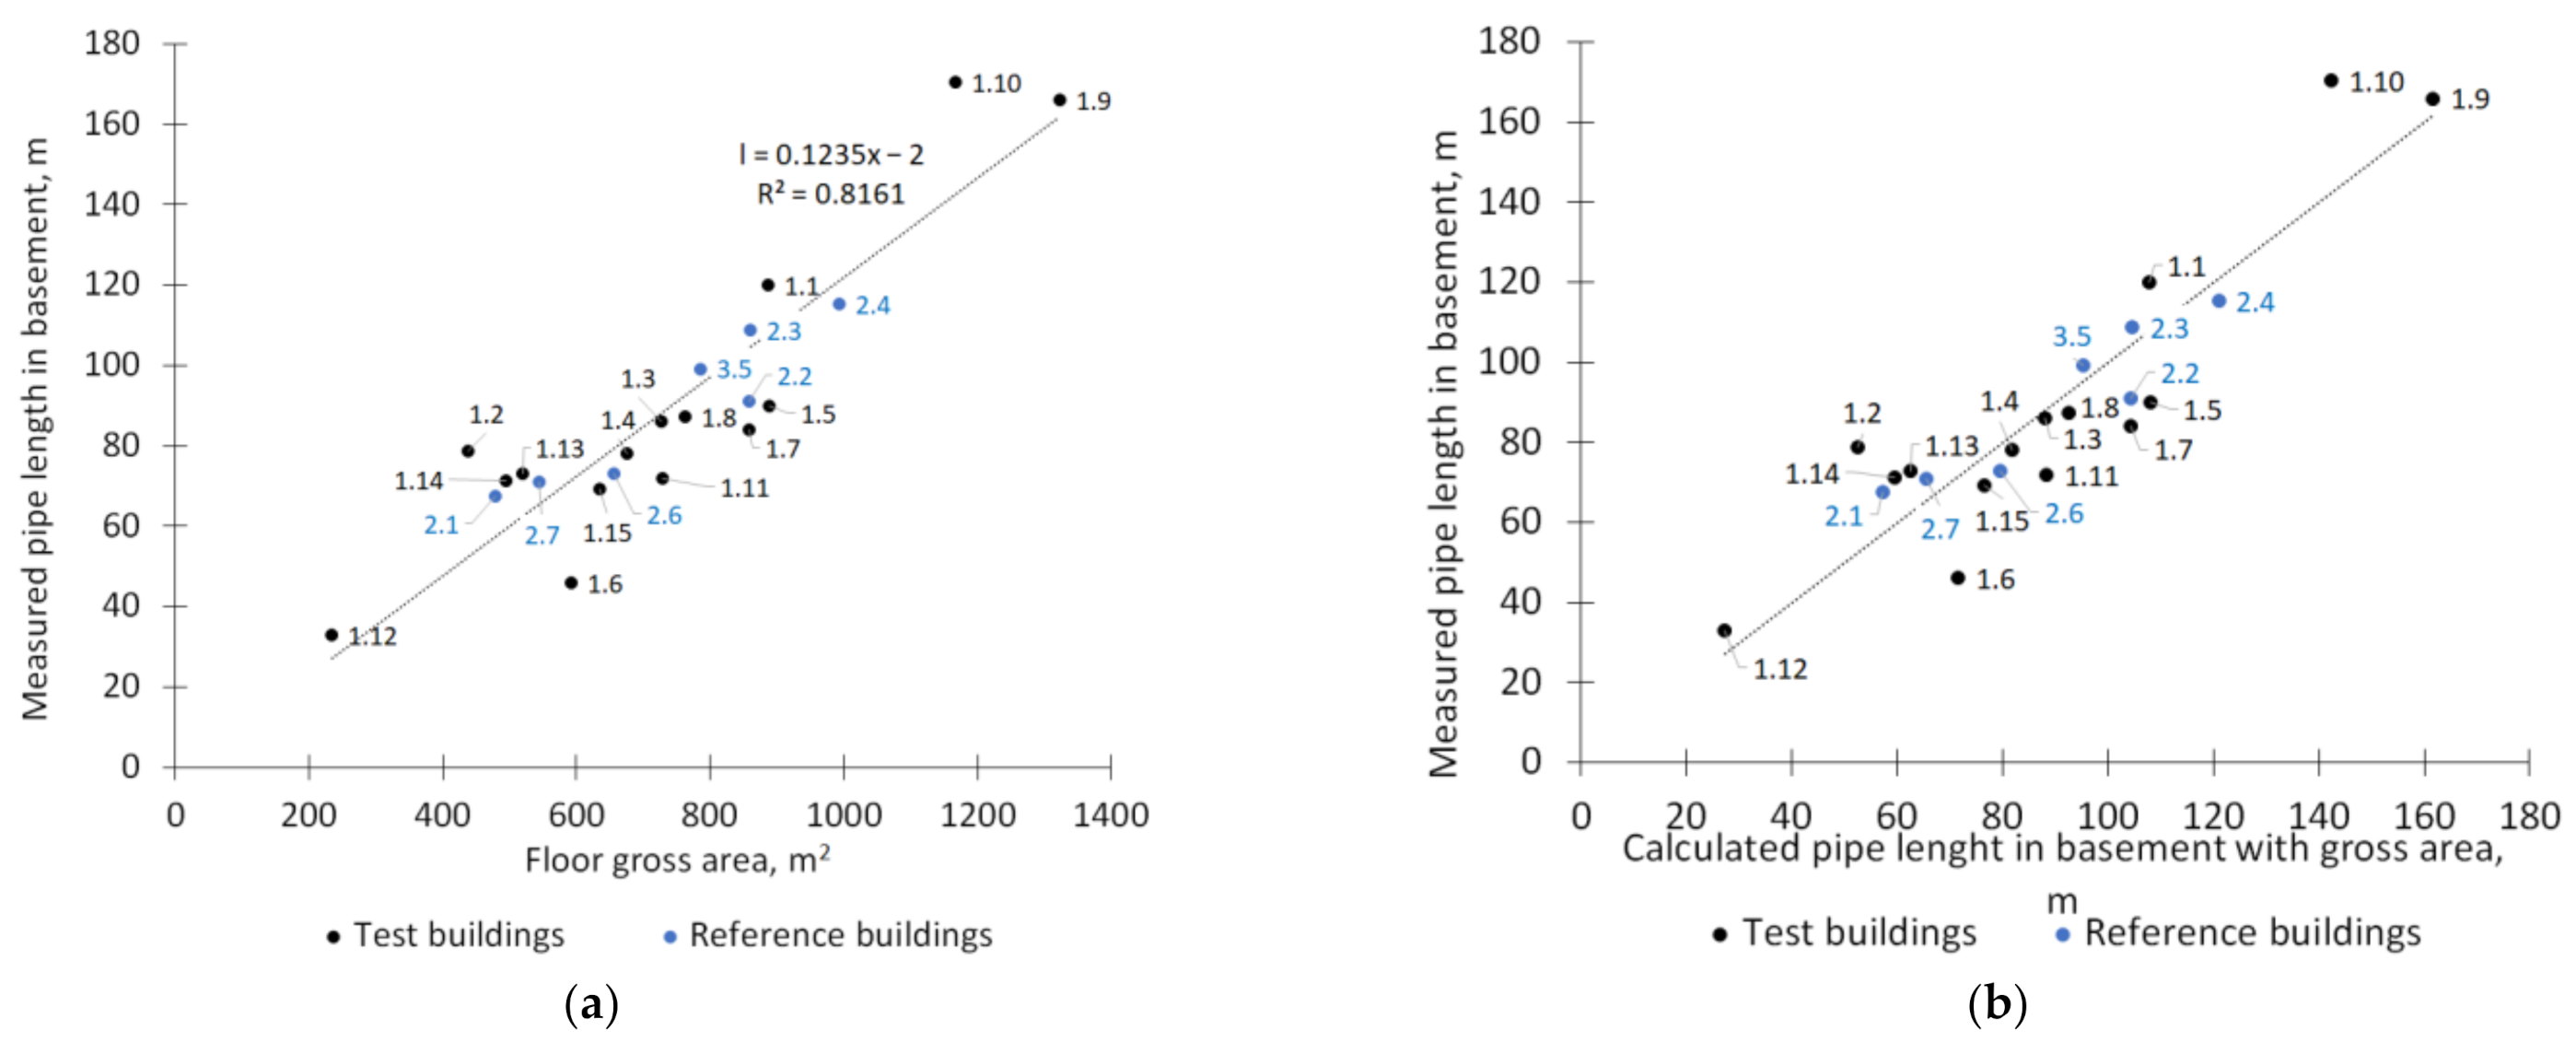
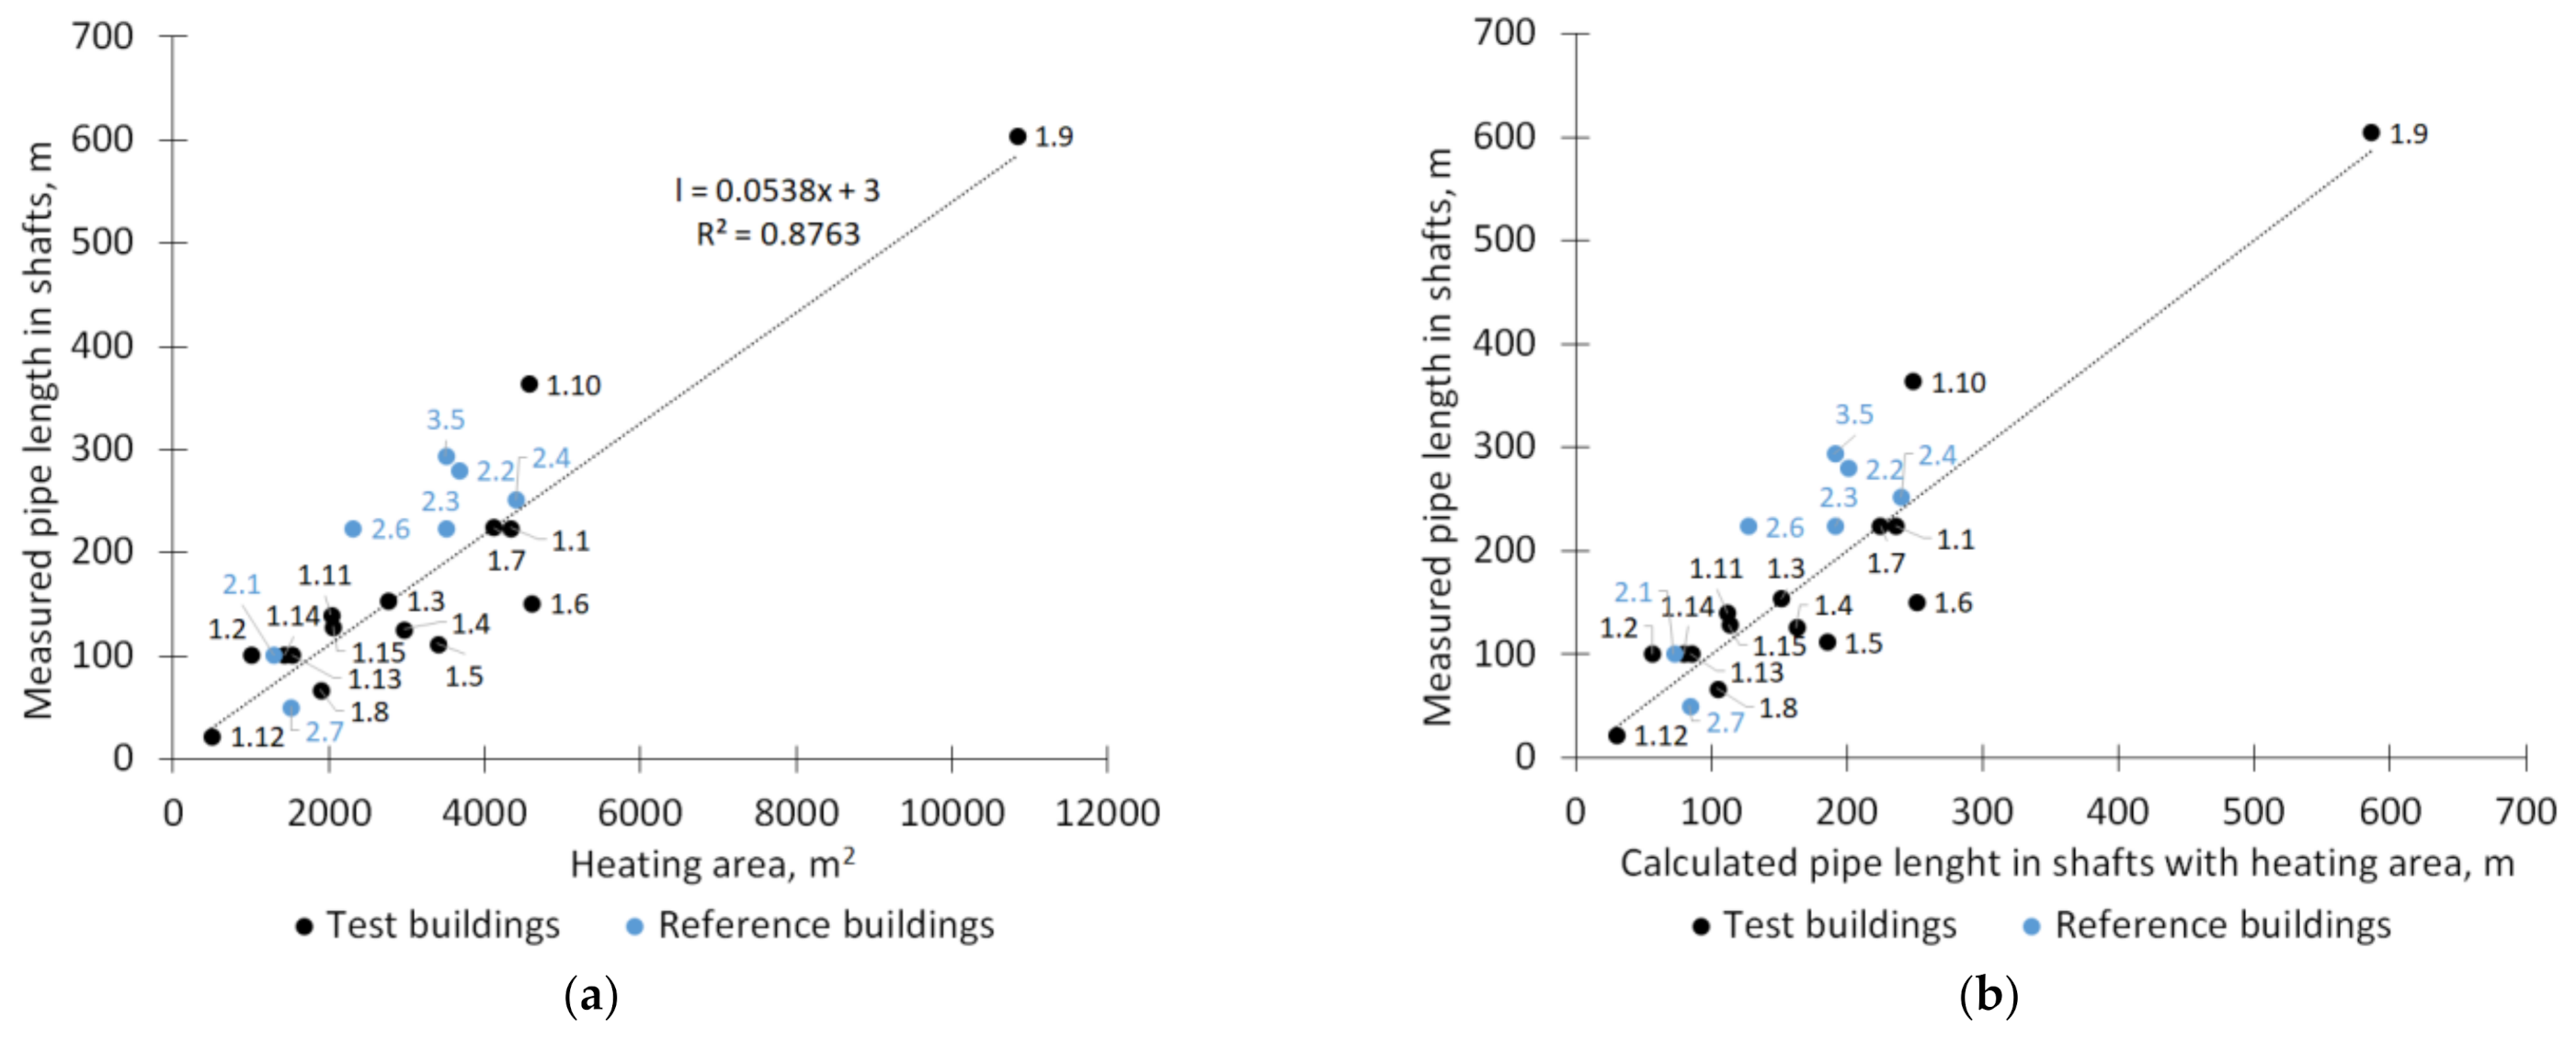
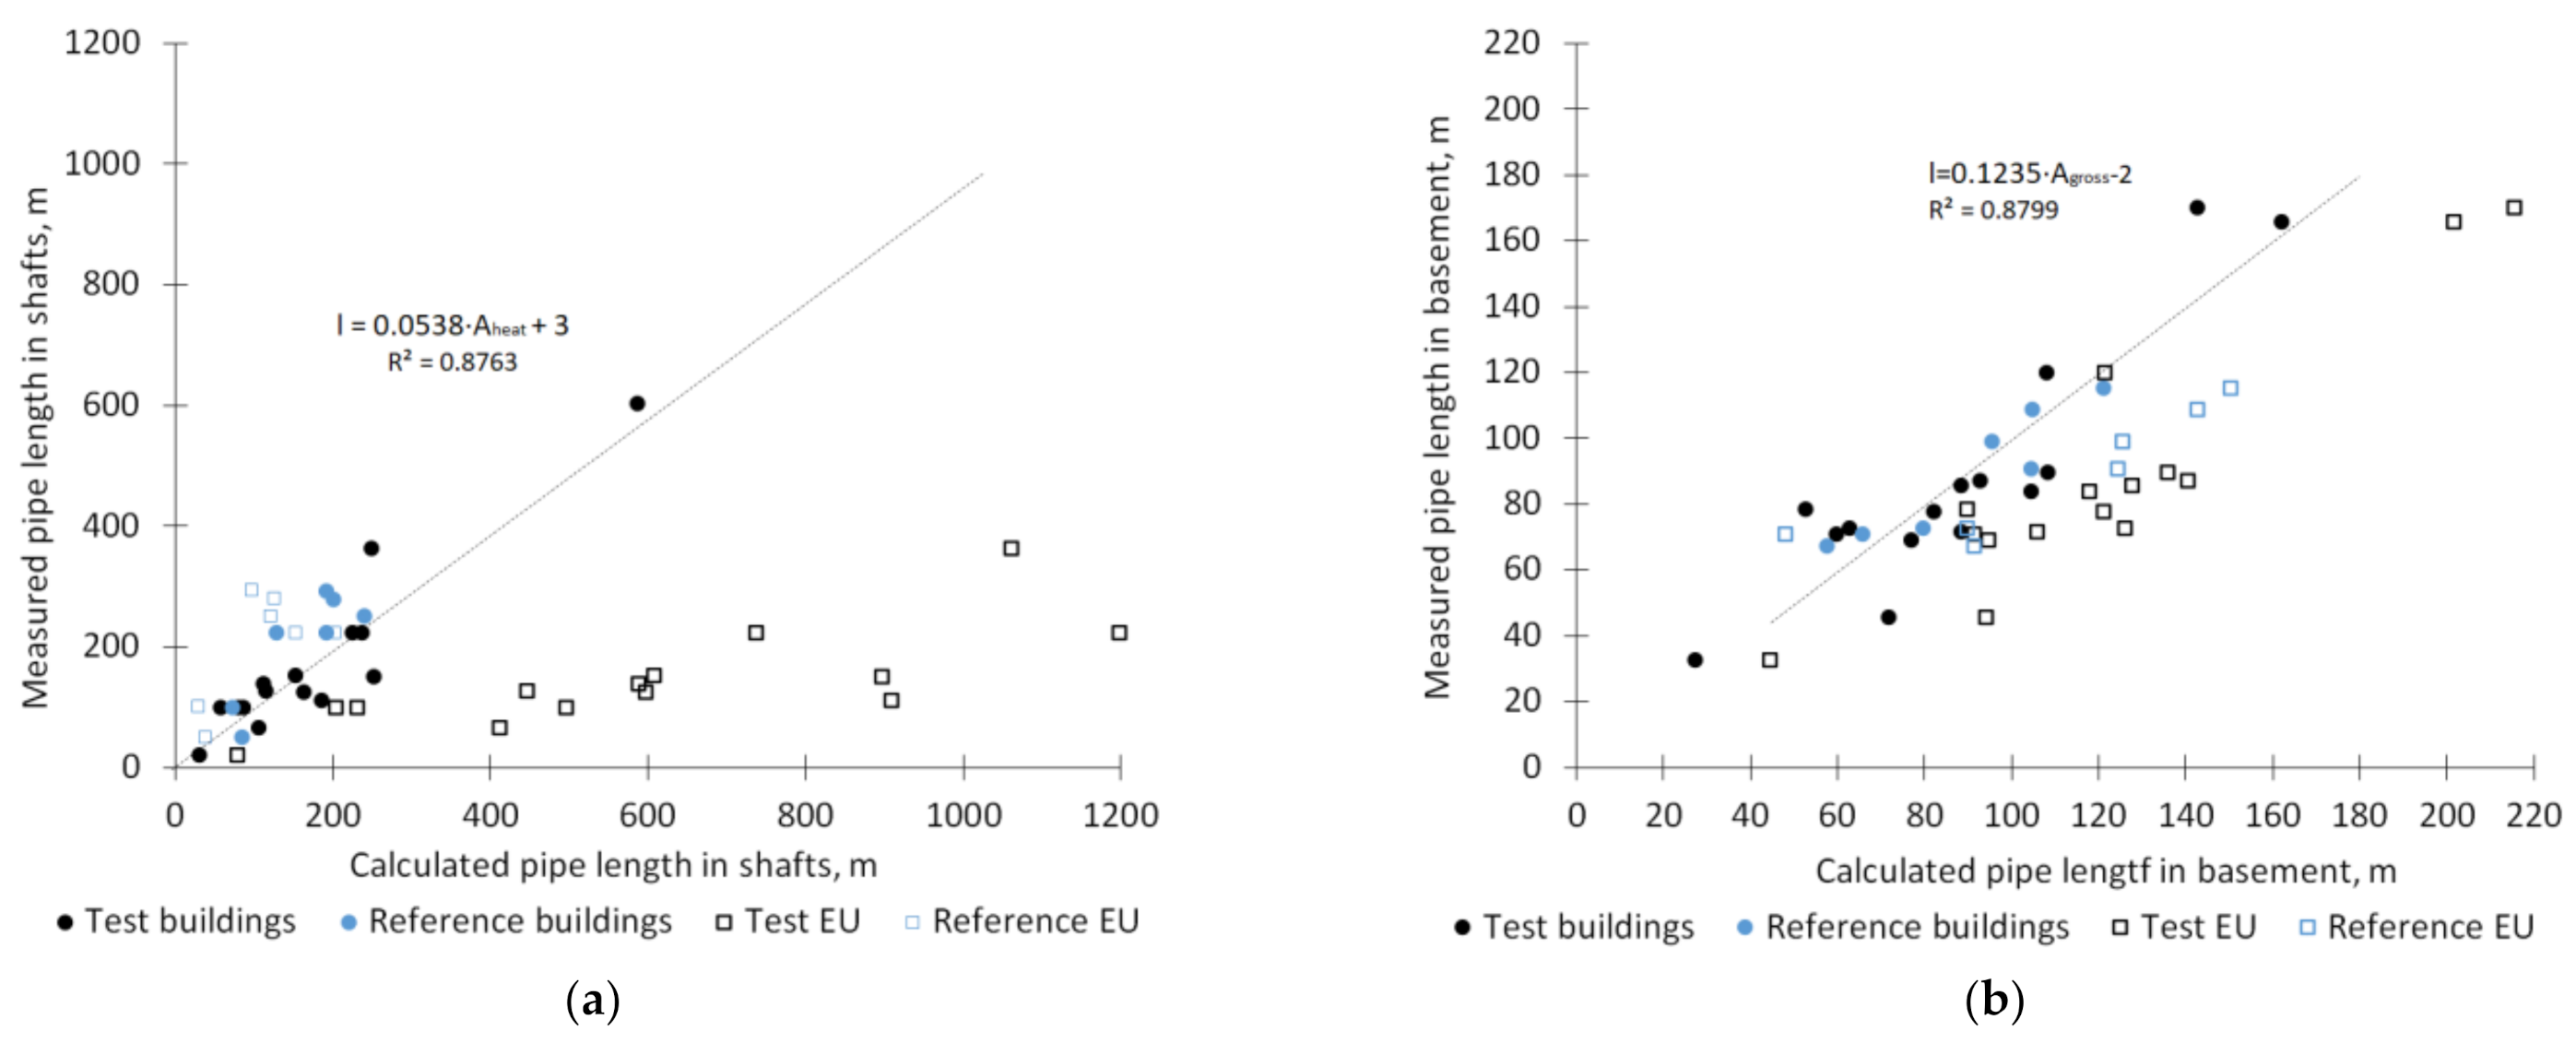
3.2. Pipe Length Calculation

To go about finding a best equation for the DHW pipe length in the basements and shafts, we generated both one and two parameter equations. Table 4 presents the best results using our buildings’ basic data (equations are made used test buildings’ data). The best results (the smallest difference in pipe length difference) gained with the one parameter model equation for basement pipe length using building gross area, was a length difference between that measured and calculated in the test buildings of 17% and in reference buildings of 8%, which gave an average of 14%. Using a building perimeter calculated from the building design drawings gave slightly better results (15.6% with test buildings) but with reference buildings the average was the same.
Pipe lengths in shafts was the best fit with the building heating area equation (pipe length difference from measured lengths were on average 28.3%).
Using for analyses also mean bias error or root mean square error, we can see (Table 5) that the equation selected in the first step fits well in both cases.
For the two parameter equation we used a bootstrapping method. Best results for pipe lengths in basements when combining building gross area and number of DHW shafts (frequency from 1000 samples was 182) gave an average calculated length difference from measured length in the test buildings of 10%. However, we were unable to produce good results using any of the other basic building parameters which are known in the early design stages. The same lack of good results occurred when calculating pipes in shafts.
Figure 4a shows how well the floor gross area equation corelates with measured pipe lengths. Black points represent test buildings and blue points reference buildings. From this graph we can say that in buildings 1.2 and 1.6, the difference between measured pipe length and calculated pipe length was a little bit more than 30%. In the other test buildings, the calculated pipe length was on average 13% different from measured values (Figure 4b).
DHW pipe lengths in shafts are detailed in Figure 5a,b. Our calculations showed that on average the pipe length difference from measured values was lowest when using this equation (in test buildings 35 m). The measured pipe length in six reference buildings was larger, which showed that by using this equation for calculations, we will probably get over-optimistic results compared to measured values in the future.
Compared with the EN standard calculation method of using the heating area in the calculations, we can see large differences in the results for pipe lengths in shafts when compared to our equations. In test buildings, the average length difference using the EN standard equation was 258%. In comparison, our generated equation using the heated area gave an average length difference of 28%. In Figure 6a, we can see that the EN standard equation gave us results that were a little too pessimistic. The calculated pipe lengths in basements, when using the EN standard, was better than in shafts. The difference from measured length on average (test and reference buildings) was 39%, while the difference from calculated length, when using floor gross area, was 14% (Figure 6b).

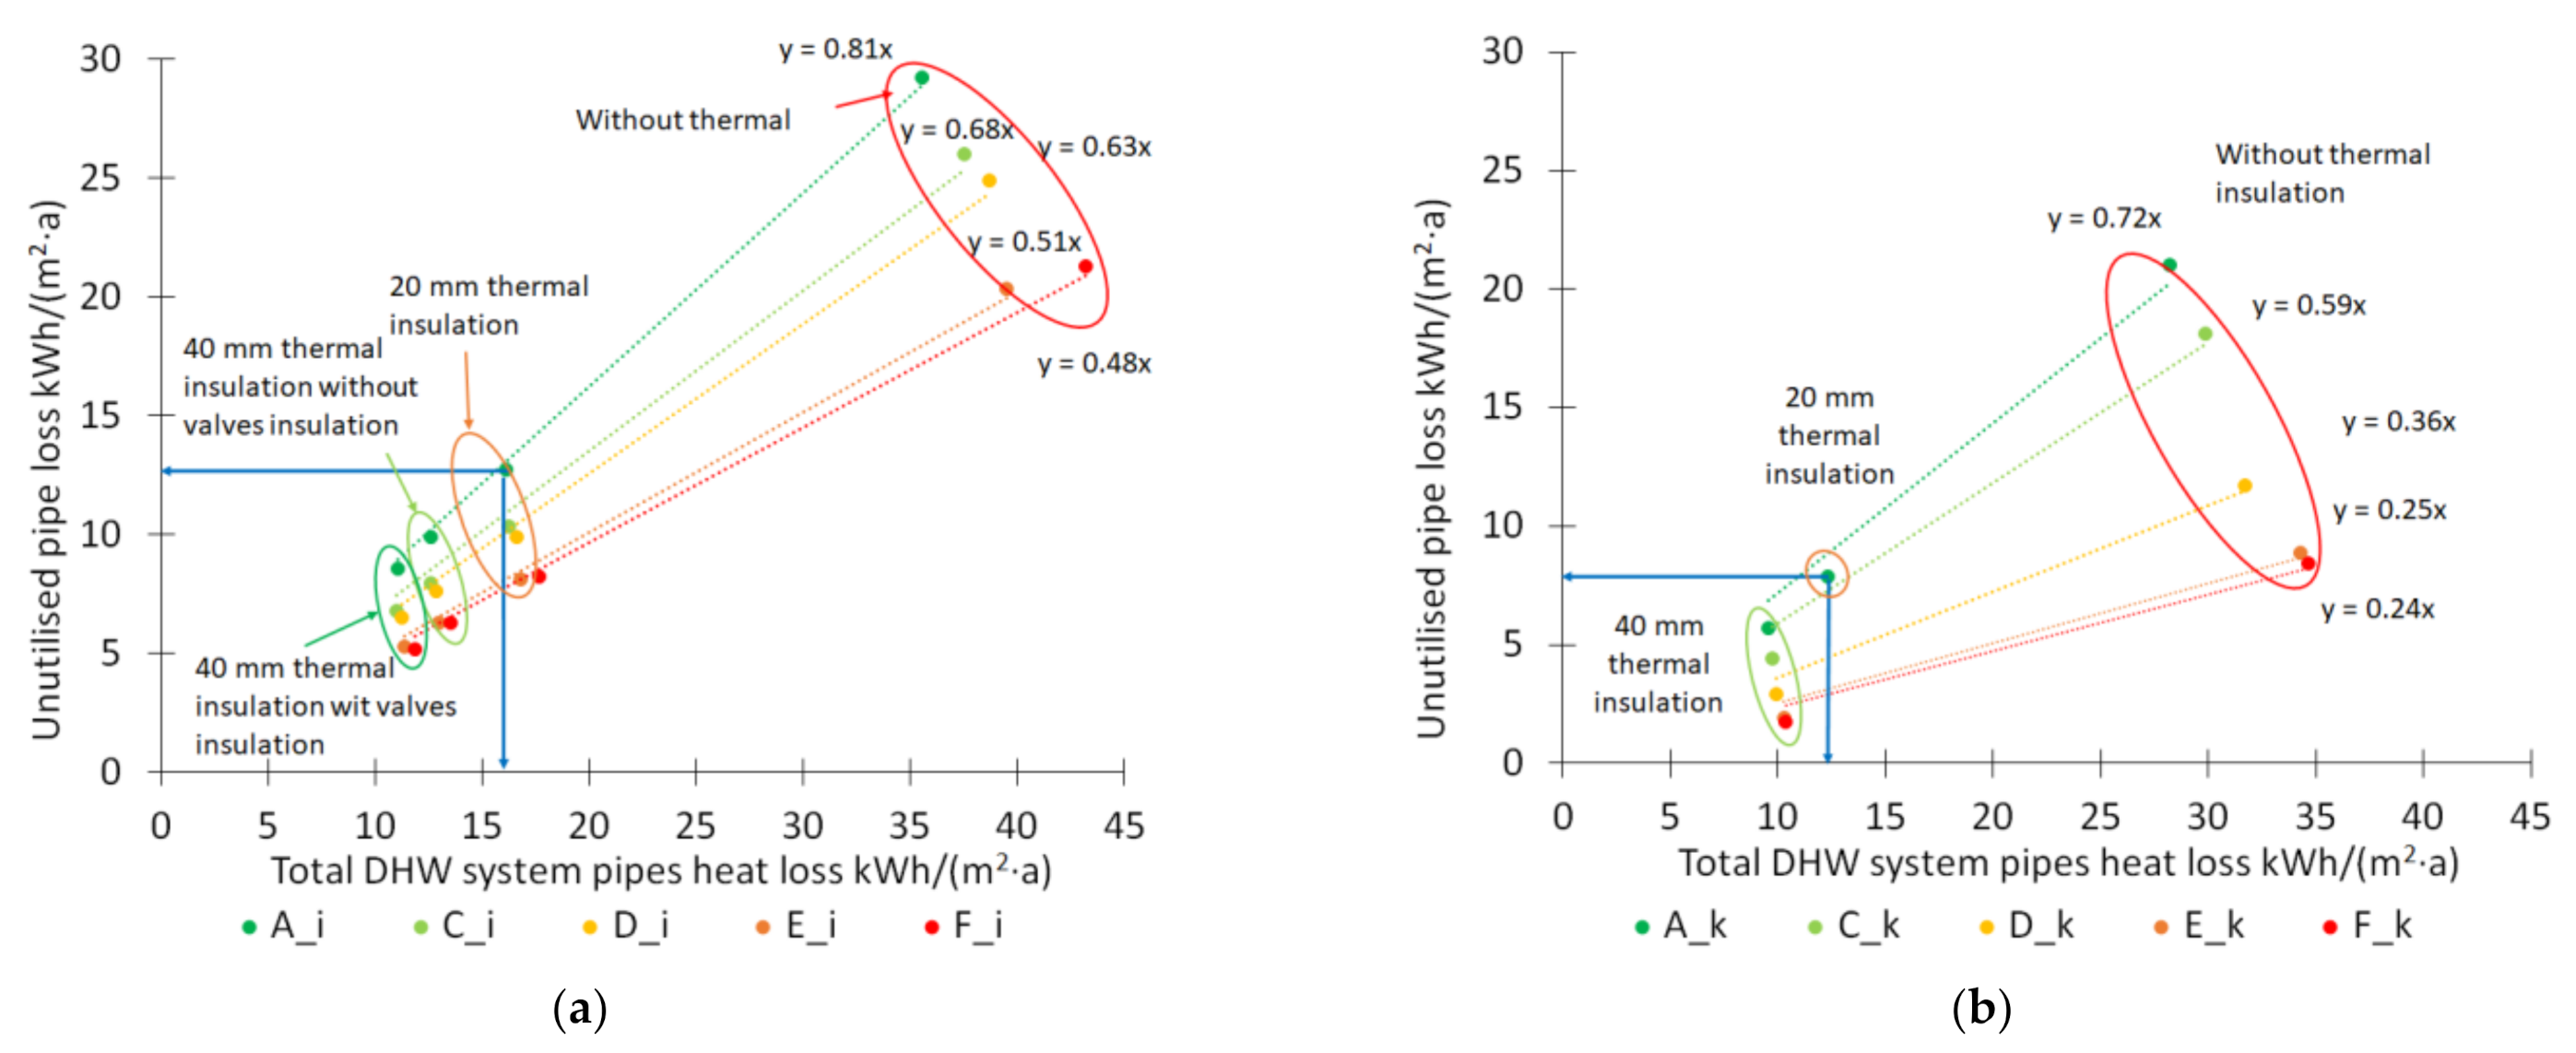
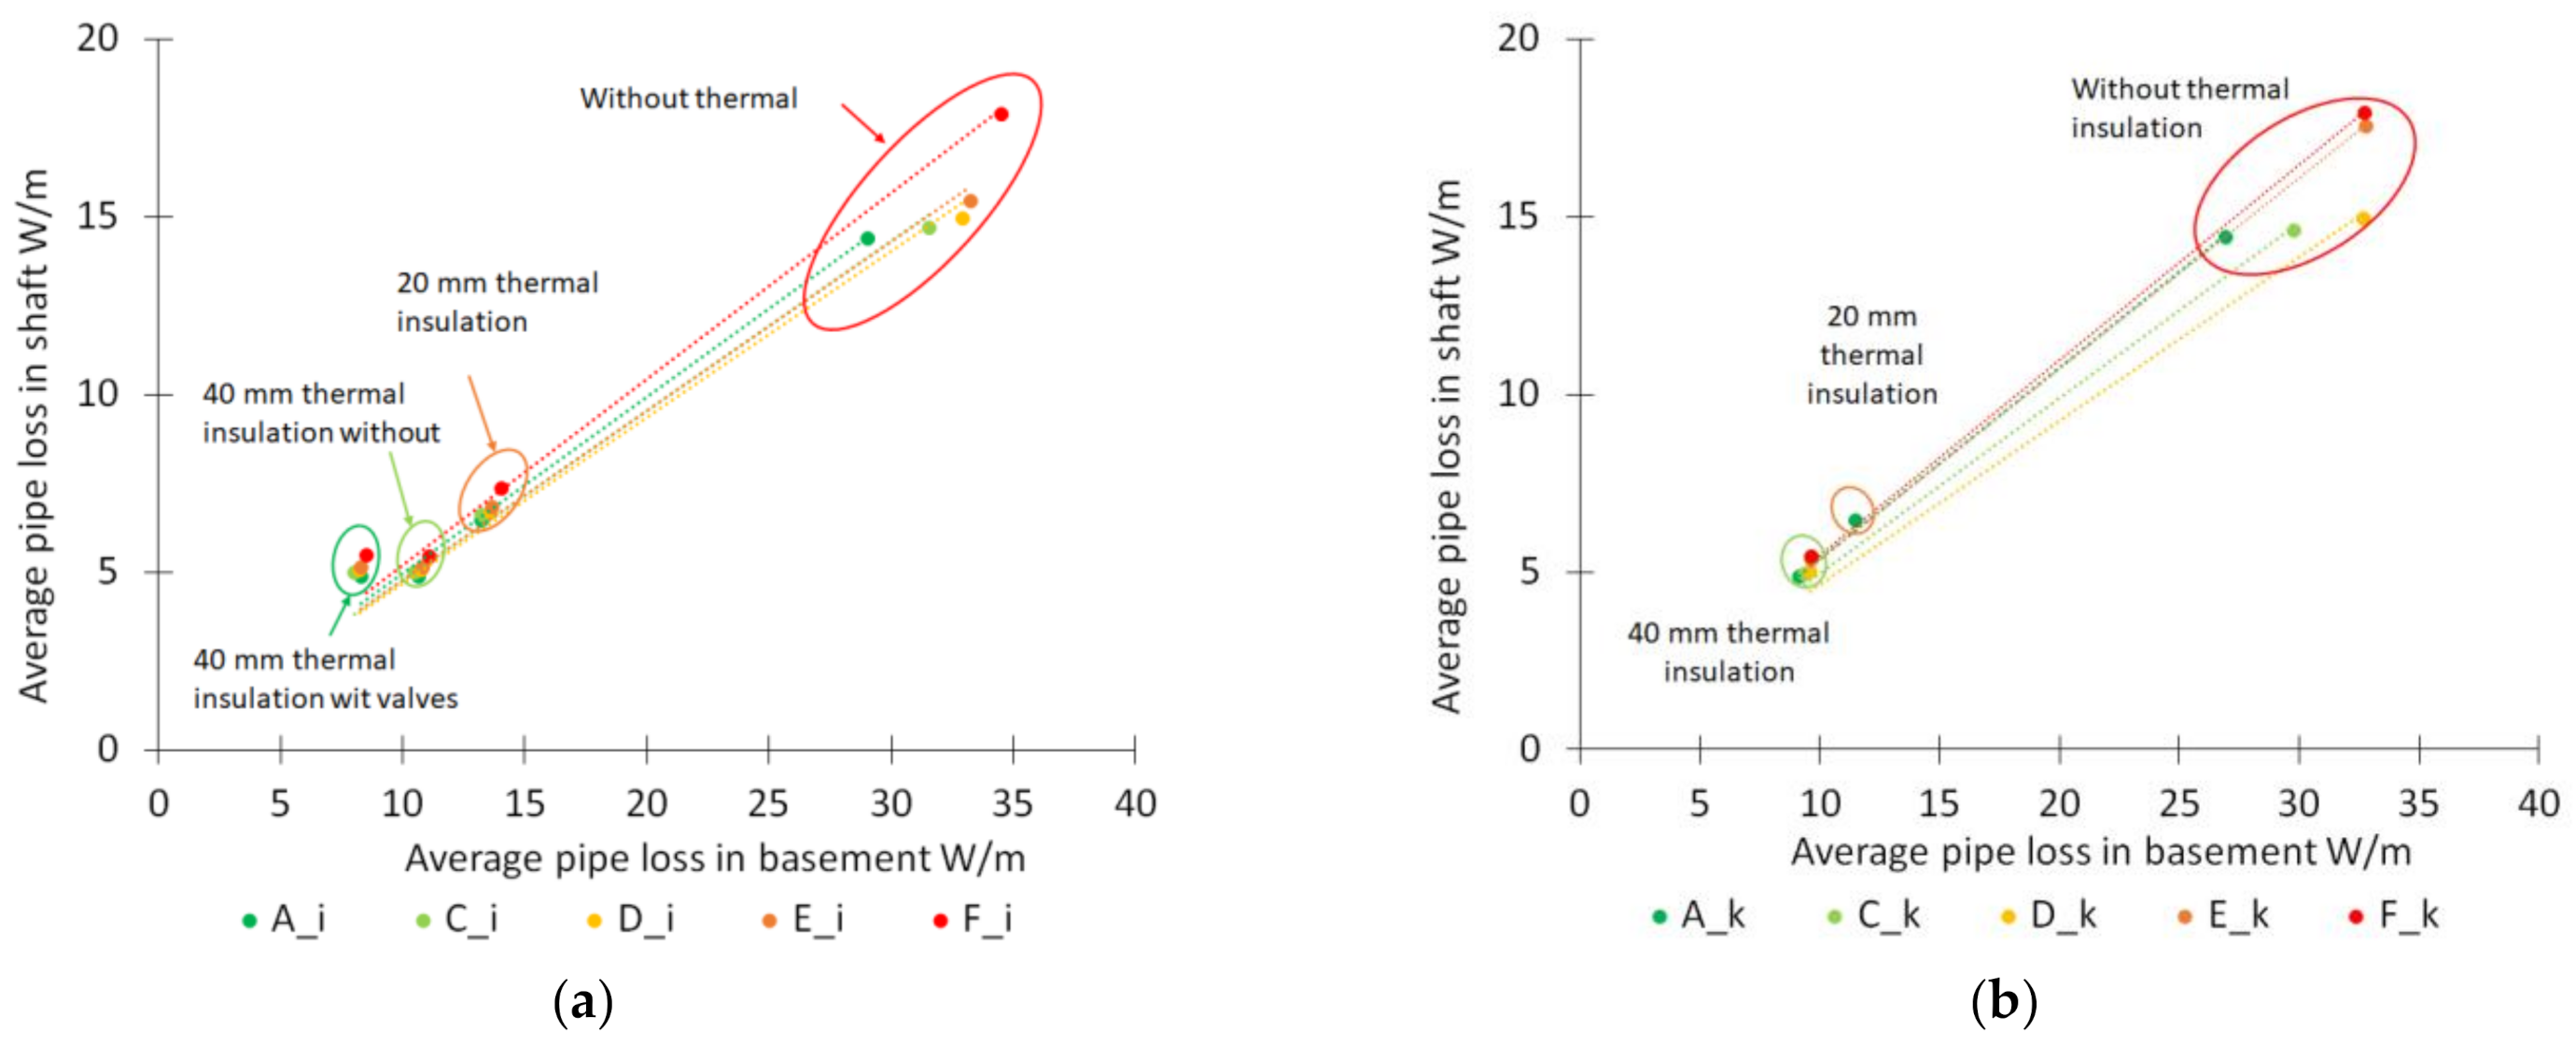
3.3. Parameters Influencing Heat Loss from DHW Circulation Piping

We investigated DHW pipe heat losses in the reference building:
  • With different thickness of thermal insultation (0, 20 and 40 mm);
  • With and without DHW circulation balancing valve insulation;
  • Temperature in basement 21 °C or unheated;
  • With different energy performance classes (EPC) (A, C, D, E, and F);
  • Circulation pump working time.
To visualise how the various parameters influence energy loss from pipes, we decided to compare all EPC classes separately with different thicknesses of DHW thermal pipe insulation when the basement is both unheated and heated. In Figure 7a, we can see that with different EPC classes, unutilised DHW system losses varied between 48% to 81% in the unheated basement and this variance did not depend on the thickness of the pipes’ thermal insulation. In the heated basement, unutilised heat loss from DHW pipes was between 24% to 71% (Figure 8b). Figure 7 shows the influence of thermal pipe insulation. When DHW system pipes are insulated with 20 mm of thermal insulation (EPC class A) than the total heat loss from pipes is 16 kWh/(m2·a) but unutilised pipe losses are 13 kWh/(m2·a) which means that utilised pipe losses, as an internal gain, are 3 kWh/(m2·a). The same situation was apparent in the heated basement with 12 kWh/(m2·a) total loss, 8 kWh/(m2·a) unutilised losses and a utilised pipe loss of 4 kWh/(m2·a). We also analysed what occurs when the circulation pump is switched off during the night (22.00 until 6.00) and day-time (9.00 until 16.00), when DHW usage is low. We used for our calculations a measured usage profile and we found out that energy loss was decreased by only 0.5 kWh/(m2·a) compared with constant circulation. As this effect was so low, we did not include this analysis in the figures.
In cases where we have found the equation for pipe length separately in the basement and shafts, we wanted to see how large the pipe heat loss was, per length (W/m). We discovered that in all EPC classes, pipe losses from pipes covered with same thickness of thermal pipe insulation are almost the same (Figure 8a,b). With 40 mm of thermal pipe insulation, the pipe heat loss in an unheated basement averaged 11 W/m and in a heated basement 9.5 W/m. In shafts, the loss was more or less the same at 5 W/m. From Figure 7a,b, we can see how much of the entire losses are unutilised but we are not able to separate this between basements and shafts.
In Figure 9a, we can see that in unheated basements, the unutilised pipe losses in EPC classes C to F were more or less the same, between 58% and 70%. Only class A has unutilised losses of more than 80%. In Figure 10b, we can see a bigger gap between unutilised pipe losses in basements. In pipes with thermal insulation, the unutilised pipe losses in classes D, E and F are on average 18%, whereas for classes A and C these are over 60%. When the basement is heated, it is more realistic to assume that the basement envelopes are insulated and most of the pipe losses there are not utilised. Unutilised losses in shafts are, in classes E and F, on average 35% and in other classes from 55% to 80%.
When comparing measured and calculated pipe lengths with the gross area equation (l = 0.1235x − 1.6744), then the difference between measured and calculated lengths in the basement is (DHW + DHW circulation pipes) 44 m (measured 260 and calculated 216 m) (10.1%) and in shafts using the calculation heating area equation (l = 0.0538x + 2.7782) the difference is 24 m (measured 448 m and calculated 472 m) (11.7%).

3.4. Heat Loss from DHW Piping in Earlier Studied Buildings

Based on nZEB case building DHW system heat loss analyses (Figure 7a, Figure 8a and Figure 9a), we compared earlier studied building measured heat losses with calculated values. We calculated all 23 buildings’ pipe lengths in basement and in shaft using generated pipe length equations. EPC did not make a difference to DHW pipe heat losses in cases where the basement was not heated. We selected EPC class C for the DHW system heat loss calculations, in the first step with a pipe insulation of 40 mm (without circulation valve insulation) (Figure 10a), the total calculated loss in the basement was (10.5 W/m) 5.6 kWh/(m2·a) with unutilised losses of 3.8 kWh/(m2·a) (69% of total); and in shafts (5 W/m) 5.8 kWh/(m2·a) with unutilised losses of 3.3 kWh/(m2·a) (57% of total). Total unutilised pipe loss was 7.1 kWh/(m2·a). In other buildings, the average calculated pipe loss was 12.9 kWh/(m2·a) (Figure 10a) and average unutilised loss was 67% of this figure. Compared with the average measured loss of 16.3 kWh/(m2·a) we can calculate a similar loss with a 20 mm thickness of thermal pipe insulation in Figure 10b.
If the average pipe loss in these buildings with 20 mm thermal pipe insulation is good then, building by building, we can see big differences from the measured loss. The mean absolute error from measured values is 4.2 kWh/(m2·a).

3.5. Generating Heat Loss Equation from DHW Piping

While generating the equation from our nZEB case building, we noticed that, to a certain extent, pipe heat loss and DHW system loss utilisation as an internal heat gain depend on the EPC class and also on how much the DHW system pipes are insulated. Basement heat losses also depend on whether the basement is heated or not. We decided not to include EPC classes D, E and F with heated basements into the generated equation.
Our reference building showed that pipe losses per length were more or less the same across the different EPC classes.
From our research we generated an equation for DHW system heat loss from our case study loss analyses. In Table 6., pipe losses per length are presented with different thicknesses of thermal pipe insulation and also how much the pipe losses are unutilised as internal heat gain.
From this, we can generate a different heat loss equation for unutilised DHW system heat loss in the basement (ΦaDHW basement Equation (5)) and in shafts (ΦaDHW shaft Equation (6)):
ΦaDHW basement = lDHW cella·qa.basement·Qunut. basement·8760·10−3/Aheat,  kWh/(m2·a)
ΦaDHW shaft = lDHW shaft·qa.shaft·Qunut.shaft·8760·10−3/Aheat  kWh/(m2·a)
Aheat is building heating area (m2)
lDHW is calculated pipe length (l)
qa is pipe heat loss per calculated length (W/m)
Qunut. is unutilised pipe loss (%)
8760 is hours per year (h)
Using for our calculations the best equation to find the pipe length in basements (equation with floor gross area) and in shafts (equation with heating area), we then calculated, in all test and reference buildings with thermal pipe insulation of 40 mm (without thermal insulation on circulation pipe valves), the annual heat loss per heated area (basement is unheated). In Figure 10, we can see good correlation with the heating area. Buildings which have a larger heating area have lower pipe losses. The minimum unutilised pipe heat loss in a building is 5.5 kWh/(m2·a) (total 7.6 kWh/(m2·a)) even though the heated area is more than twice as large as the second biggest building. From this graph we can say that, for over 5000 m2 of heated area, the pipe heat losses are the same. In smaller buildings however, there can be unutilised losses of up to 12.1 kWh/(m2·a).
All buildings calculated average was 8.7 kWh/(m2·a) and median 8.2 kWh/(m2·a).

4. Discussion

In existing buildings where circulation losses are not measured separately, it is hard to separate the share of these losses from the entire building’s energy use. In a previous study, we also analysed DHW circulation losses. In 23 buildings, the DHW circulation losses were not directly measured but were calculated from measured DHW consumption and the known total energy consumption for DHW. The graph Figure 11. presents all the buildings’ DHW circulation heat loss against the heated area. In those buildings, DHW circulation heat loss was 16.3 kWh/(m2·a) except in one outlier building, where it was extremely high (34 kWh/(m2·a)). Earlier studies of other buildings’ measured DHW system heat loss showed that, in similar buildings, it can vary considerably.
From the Figure, we can see that across the same types of building (code 1.2), the measured DHW system energy loss can be from 9.5 to 34 kWh/(m2·a) and the calculated loss (with 40 mm pipe insulation) 15.4 kWh/(m2·a). In all seven of these buildings, the DHW and DHW circulation pipe lengths are very similar. The differences in heat loss came from the quality of the thermal pipe insulation installation work and the thickness of insulation. Basement heat losses in those buildings were also different.
In earlier studies we have noticed, when comparing volume-based measured DHW-calculated energy use with measured entire DHW energy consumption, that losses from pipes were on average 16.3 kWh/(m2·a) [17,18,19]. From all the buildings’ DHW energy need this was 27–62%, the average from 22 buildings was 44%. Very similar results were found in earlier studies. Bøhm and Danig showed, from the entire DHW heating energy need, a 65% loss [1] and later Bøhm specified it as 23–70% [2]. Similar losses have also been shown by Gassel [3] and Zhang et al. [5]. Horvath et al. [4] showed a slightly lower DHW system heat loss of between 5.7 and 9.9 kWh/(m2·a). Our calculations showed that 5.5 kWh/(m2·a) is the minimum loss in apartment buildings.
If DHW system pipe losses are not integrated into energy efficiency calculations we have shown that the predicted energy consumption is lower than the actual measured values taken in use. Furthermore, the expected EPC might be one class higher (C class improved to D class). One of our goals for finding an equation for DHW system pipe lengths was that, in the design phase, we would be able to make accurate predictions of the probable future energy consumption of apartment buildings.
In our research, we analysed different factors such as building volume, heating area, net area, floor gross area, total number of apartments. Our decision was not to analyse as per EN standard (EN 15316-3 [23]) with building lengths and DHW pipe lengths in the basement.
From our analysis, we decided to consider in our future calculation method for assuming DHW and DHW circulation pipe length, that for pipes located in basements, we would use the building gross area and for pipes located in shafts, the building heating area. Our analysis showed that the two parameter model quality is no better than the one parameter model, which is why we decided to only use the one parameter model for the length calculations.
As we had data from DHW system pipe losses from buildings studied earlier, we wanted to see how the calculated length correlated with measured pipe losses. As we had detailed the measured DHW losses in our reference building, we were able to analyse pipe losses in different EPC classes (A, C, D, E and F) with different thickness of thermal pipe insulation and with heated and without heated basements. From these analyses, we have found that in different EPC class buildings, pipe loss per heated area is more or less the same. The difference is in how these losses are utilised as an internal heat gain, and here there is a difference between heated and unheated basements. In an EPC class C building with an unheated basement, we can utilise, in the entire building, ca. 33% of pipe heat losses, but separately basement losses of 30% and shaft losses of 40%. If we focus on 40 mm of pipe insulation then heat loss per pipe length in the basement is 10.5 W/m and in shafts 5.0 W/m. From this we can calculate, for a similar building with calculated pipe length, the entire DHW system pipe losses. With a larger heated area, we have lower heat loss from pipes and our calculation showed in Figure 11 that, in buildings of over 5000 m2 heated area, the unutilised loss cannot fall below 5.5 kWh/(m2·a) (total 7.6 kWh/(m2·a)) with 40 mm of thermal pipe insulation, when the basement is unheated. We have also shown that the maximum unutilised heat loss is 12.1 kWh/(m2·a) (total 15.7 kWh/(m2·a)). This shows that in smaller apartment buildings, the same piping heat loss from DHW systems is over 6 kWh/(m2·a) greater. The EPC class in smaller buildings can be affected by the net DHW system loss of 12.1 kWh/(m2·a) with a primary energy factor 0.65 (efficient district heating), 8.7 kWh/(m2·a) (district heating efficiency 0.9) and with factor 1.0 (heating with gas) 12.7 kWh/(m2·a) (gas boiler efficiency 0.95). To reach current EPC limits we should, in the future, also include in the calculations the DHW unutilised system losses.
Comparing the calculated length in all buildings (test and reference) then, on average, the pipe length in shafts is 0.11 m/m2 (per heated area) with the Finnish method for calculating heat loss for EPC classes giving 0.2 m/m2 [32]. According to this regulation, the loss from pipes in heated areas (depending on pipe insulation) is 6 or 10 W/m. Compare this to our calculation, which gave an average of 5 or 7 W/m. The Finnish regulation for calculated length in basements was not simplified. There is, however, a sentence in the regulation which states that pipe length in basements should be measured.
If volume-based DHW energy use by Estonian regulations [33] is 30 kWh/(m2·a) and calculated unutilised circulation loss is between 5.5 kWh/(m2·a) and 12.1 kWh/(m2·a), then circulation loss is between 18% and 40%. This is more than Grasmanis at.al. [15] have found.
Himpe [34] concluded that simplified heat loss calculation methods can be significantly improved when the estimation of two influential parameters, that is the average temperature of the heat conducting medium and the working time of the system, reflects the actual design and operation of the systems. In their suggested equation, there is a simple question regarding the length of DHW and DHW circulation pipes. Our study showed that EN standard equations give us an overly pessimistic pipe length in basements and shafts and also that indoor temperatures in basements vary depending on the basement’s thermal envelope properties.

5. Conclusions

Pipe heat losses in low-energy or nZEB apartment buildings can be more than 10% of the entire primary energy consumption. At this point in time, DHW and DHW circulation energy consumption heat losses are based on the volume of water consumption. Most apartment buildings have unheated basements where the main pipelines for DHW and DHW circulation are located.
Our work shows that:
  • Pipe length is the most important value to use when assessing pipe heat losses in apartment buildings;
    Pipe length with EN standard equation is not relevant for Estonian apartment buildings:
    Length and width of buildings in the Estonian Registry of Buildings database is presented as a maximum and is not useful for nonrectangular shaped buildings;
    Length according to EN 15316-3 standard for pipe gives over-long pipe lengths compared to Estonian apartment buildings;
    Using floor gross area for calculating basement pipe length gave an average 14% difference from measured pipe length in all buildings;
    Using the building heating area for calculating vertical shaft pipe lengths gave an average 28.3% difference from measured pipe length in all buildings;
    With 40 mm thermal insulation on the pipes, heat losses from pipes in an EPC C class basement were 10.8 W/m and in shafts 5.1 W/m, and with 20 mm thermal insulation heat losses were 13.6 W/m in the basement and 6.5 W/m in the shafts.
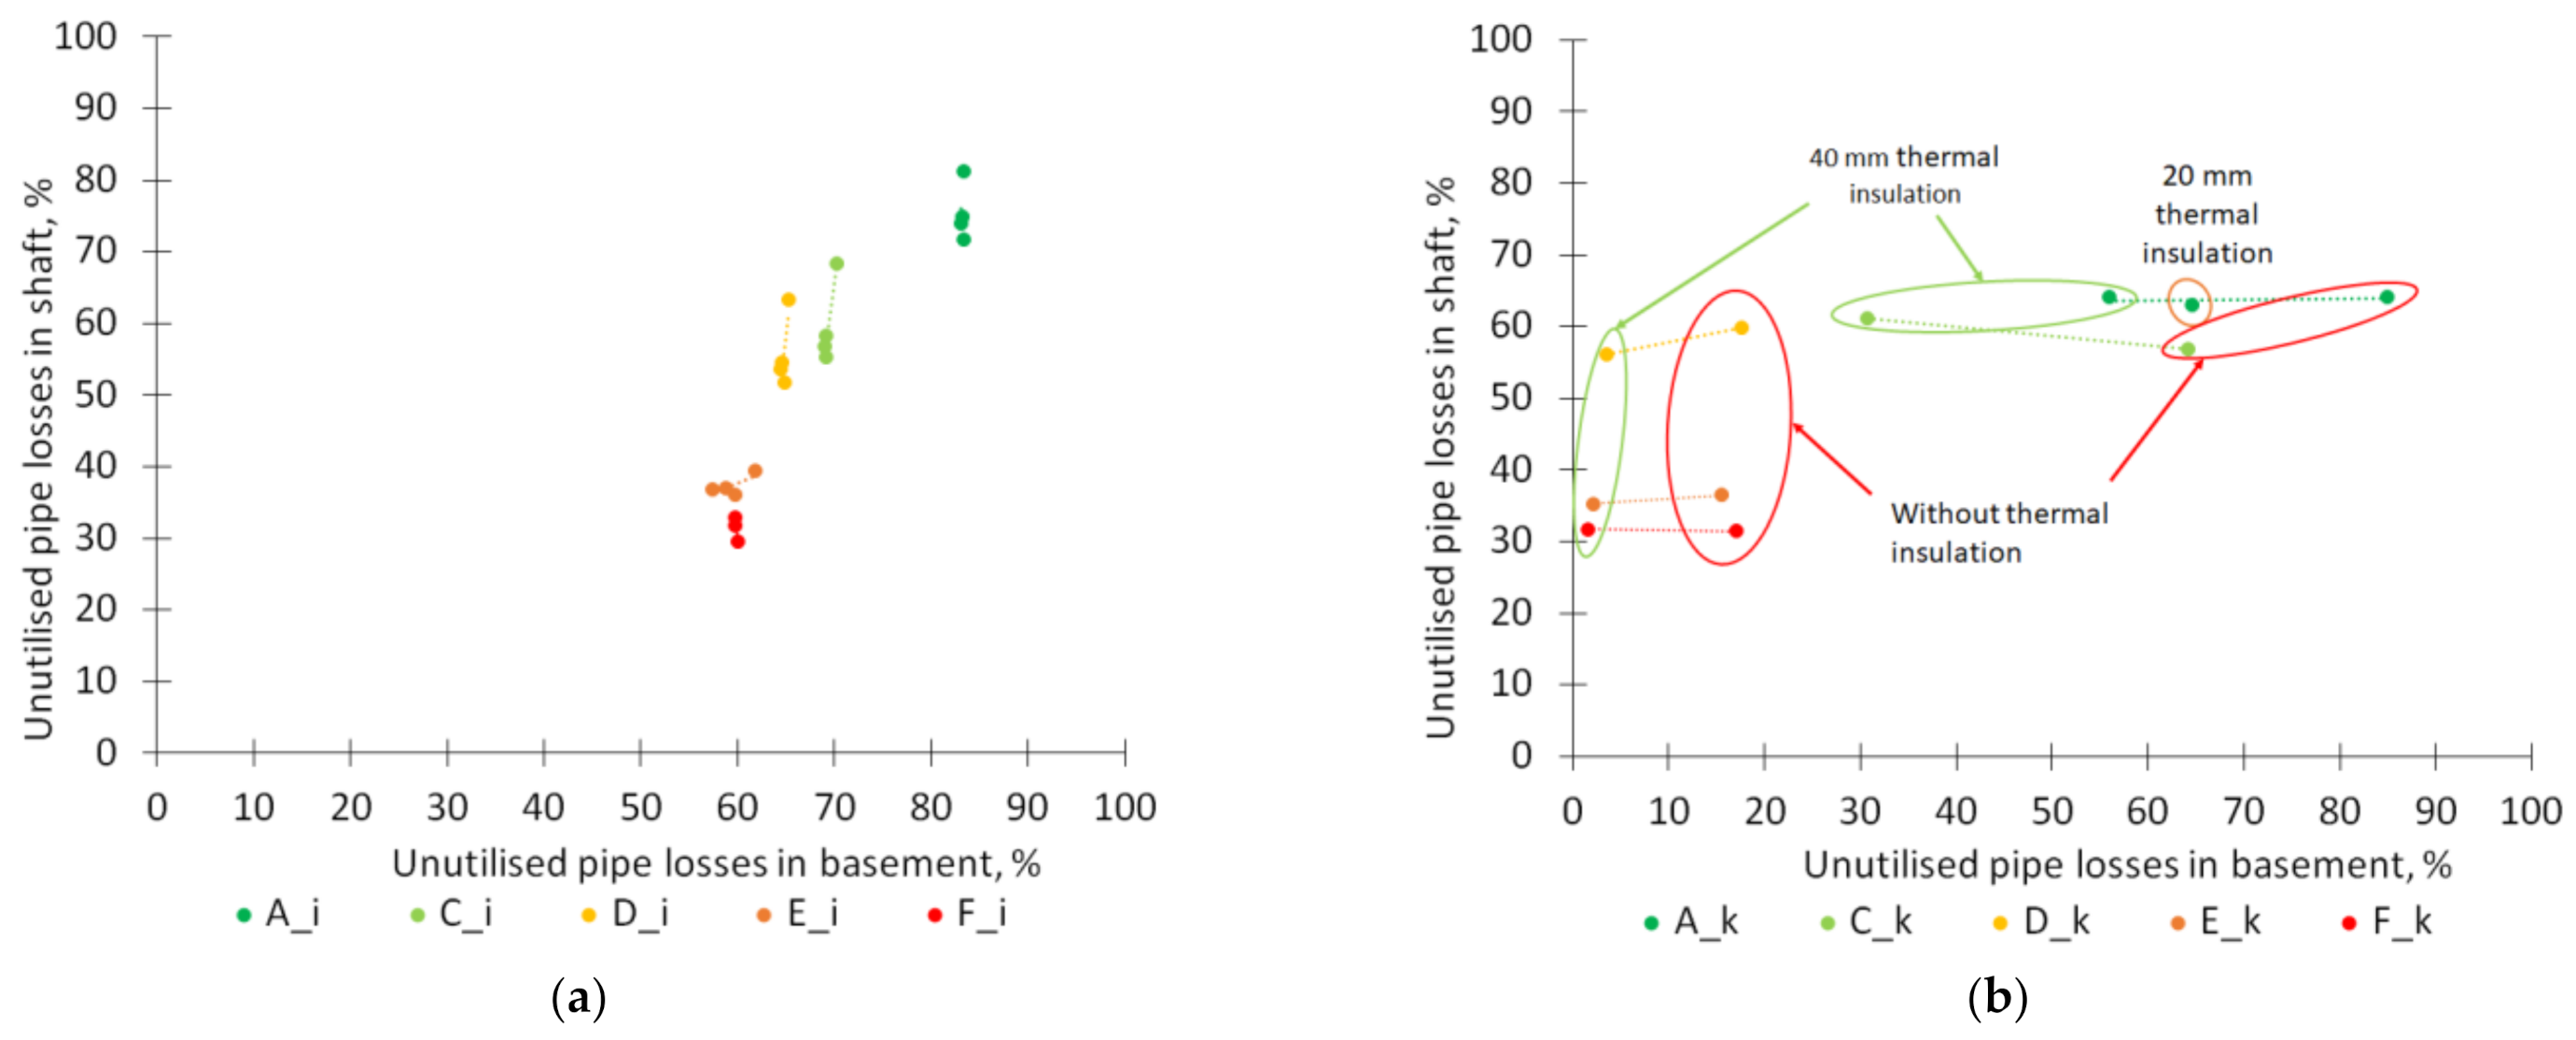
  • Pipe heat loss calculations in the reference building showed that the difference between thermal insulation levels on pipes did not affect how much heat loss from pipes can be utilised as internal heat gain;
    For EPC class C buildings without basement heating, utilised pipe heat losses were in total 33%, and separately, in basements 30% and in shafts 40%.
  • Heat loss from calculated lengths compared between the different thicknesses of thermal pipe insulation was more or less the same in buildings with different EPC classes and the actual value itself was more or less the same, which enables our equations to be used in all EPC classes of buildings.
Our study gives an alternative method for calculating heat losses from DHW systems in apartment buildings.

Author Contributions

A.H. carried out analyses of the measured data for the thesis. T.K. helped to develop the research principles of the study with the main author. A.M. helped build up the calibration model and T.-M.P. helped with equations. All authors have read and agreed to the published version of the manuscript.

Funding

This research was supported by the Estonian Centre of Excellence in Zero Energy and Resource Efficient Smart Buildings and Districts, ZEBE, grant TK146, funded by the European Regional Development Fund, by the personal research funding grant PRG483, Moisture Safety of Interior Insulation, Constructional Moisture and Thermally Efficient Building Envelope, and Finest Twins (grant No. 856602).

Acknowledgments

Authors would also like to thank Fund Kredex for cooperation and financial support for our previous research work.

Conflicts of Interest

No potential conflict of interest was reported by the authors.

References

  1. Bøhm, B.; Danig, P. Monitoring the energy consumption in a district heated apartment building in Copenhagen, with specific interest in the thermodynamic performance. Energy Build. 2004, 36, 229–236. [Google Scholar] [CrossRef]
  2. Bøhm, B. Production and distribution of domestic hot water in selected Danish apartment buildings and institutions. Analysis of consumption, energy efficiency and the significance for energy design requirements of buildings. Energy Convers. Manag. 2013, 67, 152–159. [Google Scholar] [CrossRef]
  3. Gassel, A. Beiträge zur Berechnung Solarthermischer und Exergieeffizienter Energiesysteme. Ph.D. Thesis, TU Dresden, Dresden, Germany, 1999. [Google Scholar]
  4. Horváth, M.; Hrabovszky-Horvath, S.; Csoknyai, T. Parametric analysis of solar hot water production in “commi-block” buildings. In Proceedings of the 5th International Youth Conference on Energy (IYCE), Pisa, Italy, 27–30 May 2015; Institute of Electrical and Electronics Engineers (IEEE): Piscataway, NJ, USA, 2015; pp. 1–5. [Google Scholar]
  5. Zhang, Y.; Bonneville, C.; Wilson, S.; Maroney, M.; Staller, J.; Yun Wei, J. Using Energy Flow Analysis to Assess Energy Savings from Recirculation Controls in Multi-Family Central Domestic Hot Water System. ASHRAE Trans. 2012, 118, 357–366. [Google Scholar]
  6. Marszal-Pomianowska, A.; Zhang, C.; Pomianowski, M.; Heiselberg, P.; Gram-Hanssen, K.; Hansen, A.R. Simple methodology to estimate the mean hourly and the daily profiles of domestic hot water demand from hourly total heating readings. Energy Build. 2019, 184, 53–64. [Google Scholar] [CrossRef]
  7. Huhn, R.; Davids, A. Savings potential: Decrease of the circulation losses in centralized drinking water heating systems Einsparpotenziale: Senkung der Zirkulationsverluste in Zentralen Trinkwassererwärmungsanlagen. Euroheat Power/Fernwarme Int. 2008, 37, 38–39. [Google Scholar]
  8. Kitzberger, T.; Kilian, D.; Kotik, J.; Pröll, T. Comprehensive analysis of the performance and intrinsic energy losses of centralized Domestic Hot Water (DHW) systems in commercial (educational) buildings. Energy Build. 2019, 195, 126–138. [Google Scholar] [CrossRef]
  9. Mühlbacher, H.; Carter, J. Warmwasserbereitung-Vergleich Zentraler und Dezentraler Warmwasserversorgung; Forschungsstelle für Energiewirtschaft eV (FfE): München, Germany, 2002. [Google Scholar]
  10. Cholewa, T.; Siuta-Olcha, A.; Anasiewicz, R. On the possibilities to increase energy efficiency of domestic hot water preparation systems in existing buildings—Long term field research. J. Clean. Prod. 2019, 217, 194–203. [Google Scholar] [CrossRef]
  11. Adam, M.; Walter, D.; Backes, K.; Steinweg, J. Classification of hydraulic designs and hardware-in-the-loop-tests of solar assisted heating systems for multi-family houses. In Proceedings of the 2016 International Energy and Sustainability Conference (IESC), Cologne, Germany, 30 June–1 July 2016; Institute of Electrical and Electronics Engineers (IEEE): Piscataway, NJ, USA, 2016; pp. 1–6. [Google Scholar]
  12. Ahmed, K.; Pylsy, P.; Kurnitski, J. Hourly consumption profiles of domestic hot water for different occupant groups in dwellings. Sol. Energy 2016, 137, 516–530. [Google Scholar] [CrossRef]
  13. Navalón, P.S. Evaluation of Heat Losses from a Domestic Hot Water Circulation System. Ph.D. Thesis, University of Gävle, Gävle, Sweden, 2015. [Google Scholar]
  14. Brand, M. Heating and Domestic Hot Water Systems in Buildings Supplied by Low-Temperature District Heating. Ph.D. Thesis, Technical University of Denmark, Copenhagen, Denmark, 2013. [Google Scholar]
  15. Grasmanis, D.; Talcis, N.; Greķis, A. Heat Consumption assessment of the domestic hot water systems in the apartment buildings. In Proceedings of the REHVA Annual Conference 2015 “Advanced HVAC and Natural Gas Technologies”, Riga, Latvia, 6–9 May 2015; RTU Press, Riga Technical University Press: Riga, Latvia, 2015; pp. 167–176. [Google Scholar]
  16. Rocheron, C. Domestic Hot Water—An Energy Approach Application of Heat Pumps for Residential Apartment Buildings. Master’s Thesis, Chalmers University of Technology, Gothenburg, Sweden, 2012. [Google Scholar]
  17. Hamburg, A.; Kalamees, T. The Influence of Energy Renovation on the Change of Indoor Temperature and Energy Use. Energies 2018, 11, 3179. [Google Scholar] [CrossRef] [Green Version]
  18. Hamburg, A.; Kalamees, T. Improving the Indoor Climate and Energy Saving in Renovated Apartment Buildings in Estonia. In Proceedings of the Cold Climate HVAC Conference, Kiruna, Sweden, 12–15 March 2018; Springer Science and Business Media LLC: Berlin/Heidelberg, Germany, 2018; pp. 243–251. [Google Scholar]
  19. Hamburg, A.; Kalamees, T. How well are energy performance objectives being achieved in renovated apartment buildings in Estonia? Energy Build. 2019, 199, 332–341. [Google Scholar] [CrossRef]
  20. Raide, I.; Kalamees, T.; Mauring, T. Lessons learnt from the first public buildings in Estonia intended to be passive houses. Proc. Estonian Acad. Sci. 2015, 64, 157. [Google Scholar] [CrossRef]
  21. Arumägi, E.; Kalamees, T. Design of the first net zero energy buildings in Estonia. Sci. Technol. Built Environ. 2016, 22, 1039–1049. [Google Scholar] [CrossRef]
  22. Attia, S.G.; de Herde, A. Early design simulation tools for net zero energy buildings: A comparison of ten tools. In Proceedings of the 12th International Building Performance Simulation Association, Sydney, Australia, 14–16 November 2011. [Google Scholar]
  23. European Standards. EN 15316-3. Energy Performance of Buildings—Method for Calculation of System Energy Requirements and System Efficiencies—Part 3: Space Distribution Systems (DHW, Heating and Cooling), Module M3-6, M4-6, M8-6; European Standards: Brussels, Belgium, 2017. [Google Scholar]
  24. Kuusk, K.; Kalamees, T. nZEB Retrofit of a Concrete Large Panel Apartment Building. Energy Procedia 2015, 78, 985–990. [Google Scholar] [CrossRef] [Green Version]
  25. Journal of Physics: Conference Series; IOPscience: Bristol, UK, 2013; Volume 132, pp. 1006–1011. [CrossRef]
  26. Majandus-ja Kommunikatsiooniministeerium. Estonian Registry of Buildings Database. 2021. Available online: www.ehr.ee (accessed on 2 September 2021).
  27. Davison, A.C.; Hinkley, D.V. Bootstrap Methods and Their Application; Cambridge University Press: Cambridge, UK, 1997. [Google Scholar]
  28. Shalin, P. Modelling and Simulation Methods for Modular Continuous System in Buildings; KTH: Stockholm, Sweden, 1996. [Google Scholar]
  29. Björsell, N.; Bring, A.; Eriksson, L.; Grozman, P.; Lindgren, M.; Sahlin, P.; Shapovalov, A. IDA indoor climate and energy. In Proceedings of the IBPSA Building Simulation 99 Conference, Kyoto, Japan, 13–15 September 1999; pp. 1–8. [Google Scholar]
  30. ISO. ISO/DIS 12241 Thermal Insulation for Building Equipment and Industrial Installations—Calculation Rules; ISO: Geneva, Switzerland, 2008. [Google Scholar]
  31. Hamburg, A.; Kalamees, T. The influence of heat loss from pipes in an unheated basement on the heating energy consumption of an entire typical apartment building. E3S Web Conf. 2020, 172, 12005. [Google Scholar] [CrossRef]
  32. Ympäristöministeriö, Energiatehokkuus, Rakennuksen energiankulutuksen ja lämmitystehontarpeen laskenta, (Ministry of the Environment, Energy efficiency, Calculation of building energy consumption and heating power demand), Regulation, Helsinki, Finland. 2018.
  33. 7 RT I, 19.01.2018. MKM määrus nr. 58, Hoonete energiatõhususe arvutamise metoodika (Minister of Economic Affairs and Communications regulation nr. 58, Methodology for calculating the energy performance of buildings). 2018.
  34. Himpe, E.; Rebollar, J.V.; Janssens, A. Heat losses in collective heat distribution systems: Comparing simplified calculation methods with dynamic simulations. In Proceedings of the 13th International Conference of the International Building Performance Simulation Association (Building Simulation 2013), Chambéry, France, 26–28 August 2013; International Building Performance Simulation Association (IBPSA): Chambery, France, 2013; pp. 3432–3439. [Google Scholar]
Figure 1. Overview of the nZEB case building after the renovation.
Energies 14 06446 g001
Figure 2. Simplified case building DHW and DHW circulation piping in basement and shafts.
Energies 14 06446 g002
Figure 3. (a) Measured and calculated indoor temperature in basement; (b) measured and calculated DHW system heat loss in basement.
Energies 14 06446 g003
Figure 4. DWH pipe length in basement: (a) measured pipe length compared with floor gross area; (b) measured pipe length compared with calculated pipe lengths in basement.
Energies 14 06446 g004
Figure 5. DHW pipe length in shaft: (a) measured pipe length compared with heating area; (b) measured pipe length compared with calculated pipe lengths in shafts.
Energies 14 06446 g005
Figure 6. (a) Calculated pipe length in shafts with EN standard 15316-3 and using heating area; (b) calculated pipe length in basement with EN standard 15316-3 and using building gross area.
Energies 14 06446 g006
Figure 7. Total DHW pipe heat losses per heated area compared with unutilised pipe heat loss with different EPC classes and thermal pipe insulation: (a) when basement is not heated (i—unheated basement); (b) when basement is heated (k—heated basement).
Energies 14 06446 g007
Figure 8. Pipe loss in basement and in shafts (W/m): (a) when basement is not heated (i—unheated basement); (b) when basement is heated (k—heated basement).
Energies 14 06446 g008
Figure 9. Unutilised pipe losses in basements and in shafts: (a) when basement is not heated (i—unheated basement); (b) when basement is heated (k—heated basement).
Energies 14 06446 g009
Figure 10. Measured and calculated DHW system pipe losses in buildings: (a) calculated as if in all buildings thermal pipe insulation is 40 mm and valves are not insulated; (b) calculated as if in all buildings thermal pipe insulation is 20 mm.
Energies 14 06446 g010
Figure 11. Test and reference building calculated unutilised DHW system pipe heat loss with 40 mm thermal pipe insulation without circulation valve thermal insulation and basement heating (EPC A).
Energies 14 06446 g011
Table 1. Research scheme and description of studied buildings.
CharacteristicnZEB Case
Building
Test Buildings Reference
Buildings
Earlier Studied Buildings
TargetCalibration of model and energy use of DHWDetermination of pipe length equationsValidating of pipe length equationValidating of DHW heat loss
Description
No. of buildings115723
Building’s basic dataHeated area, net area, layout area (floor gross area), volume, length, width, height, number of: floors, apartments, DHW shafts.
Building pipe lengthDetailed 3D BIM and energy simulation model with real length of pipesMeasured length of pipes from 2D-design drawings + onsite surveyMeasured length of pipes from 2D-design drawings + onsite survey
A. Length of DHW and DHW circulation pipes
Pipe lengthsDetailed simulation with measured pipe lengthsGenerating of Equation with real pipe lengthValidation of the performance of Equation with real pipe lengthCalculated pipe length with generated Equations
B. Heat loss of DHW pipes
DHW and DHW circulation heat lossDetailed simulation model, calibrated based on detailed field measurementsCalculated pipe heat loss with measured length, calculated length and assumed measured losses from earlier studyCalculated pipe heat loss with measured length, calculated length and assumed measured losses from earlier studyMeasured DHW system energy losses
The influence of DHW system heat loss.Calibrated model calculations with different renovation scenariosCalculated DHW system unutilised heat lossCalculated DHW system unutilised heat lossCalculated DHW system heat loss comparison with measured consumption
Table 2. Basic properties of studied buildings.
CodeConstruction Material for WallsConstruction YearVolumeHeating AreaNet AreaBuilding Gross AreaLengthWidthApartments per FloorNo. ShaftsNo. of ApartmentsPerimeterDHW Pipe Length in BasementDHW Pipe Length in Shafts
m3m2m2m2mm mmm
nZEB case building
1.1Concrete1986157574330433088757.516.2161680147120224
Test buildings
1.2LWC block19743283998130643849.08.86121811679101
1.3Concrete1975120172763337872765.711.711115515586154
1.4Concrete1966106962968351967661.712.212126014878126
1.5Brick1983142523393411088861.718.610105016190112
1.6Concrete1970161144606503059346.813.4887212146151
1.7Concrete2017159674112411285943.132.815157515284225
1.8LWC block198679441887241576272.012.088241688767
1.9Concrete19813540310840108401323101.013.21624144228166605
1.10Concrete197918400456759331167109.912.2182690244171364
1.11Brick1977111432022321172851.914.310105013272140
1.12Brick1970184449849823423.410.5448683323
1.13Brick197254951526117252057.718.16121815273101
1.14LWC block197952111426103649548.89.96121811771101
1.15LWC block197589452054244863449.211.2994512169129
Reference buildings
2.1Concrete197739591291195947848.89.96121811768101
2.2Concrete1986127633669366985962.313.112206015191280
2.3Concrete1964138333501449486173.012.0161680170109224
2.4Concrete1977164124399439999375.912.7121860177115252
2.5Brick1976133413495349578662.313.69214515299294
2.6Brick1975104842309286865733.232.08164013073224
2.7LWC block198759791508186254523.813.56618757150
Table 3. The dependence of pipe’s heat loss on insulation thickness and pipe diameter.
Pipe’s Outer
Diameter, mm
50402520
Thermal pipe insulation thickness, mmPipe’s linear thermal transmittance Ψ (W/m·K)
400.250.220.170.15
200.370.320.230.21
01.220.980.620.50
Table 4. Case study building EPC classes with different building envelope thermal transmittances and ventilation strategy.
Energy Performance of Building—Primary Energy (PE) Use and Energy Performance Certificate (EPC) Class
EPC “A *” and “B”
PE ≤ 125 kWh/(m2·a)
EPC “C”
PE ≤ 150 kWh/(m2·a)
EPC “D”
PE ≤ 180 kWh/(m2·a)
EPC “E”
PE ≤ 220 kWh/(m2·a)
EPC “F”
PE ≤ 280 kWh/(m2·a)
Thermal transmittance of building envelope U, W/(m2·K)External wall0.130.170.220.221.0
Basement wall0.100.210.610.610.61
Basement floor0.230.380.390.390.39
Roof0.110.170.170.220.76
Window0.821.01.21.41.7
Ventilation strategyApartmentsMechanical ventilation 0.5 L/(s·m2), ventilation heat recovery (VHR) 0.8.0.5 L/(s·m2)
no VHR
0.35 L/(s·m2) no VHR
Common rooms and heated basementMechanical ventilation 0.5 L/(s·m2), VHR 0.8.No VHR
0.5 L/(s·m2)
In unheated room0.15 L/(s·m2) without heat recovery
* A is together with solar collectors and locally used PV panel electricity production (PE ≤ 105 kWh/(m2·a).
Table 5. Pipe length (in meters) equations, R-square values in test buildings, length difference from measured values, mean bias errors and root mean square errors in test and reference buildings.
FactorEquation to Calculate the Pipe Length, mR2Difference between Measured and Calculated, %MBE (Mean Bias Error)RMSE (Root Mean Square Error)
Test BuildingsTest BuildingsReference BuildingsAll Buildings AverageTest BuildingsReference BuildingsAll Buildings AverageTest BuildingsReference BuildingsAll Buildings Average
One parameter modelPipe length in basement
x = Volumel = 0.0034·x + 460.5623.89.219.2−0.57−5.8−2.224.49.520.8
x = Heating areal = 0.0109·x + 530.5223.26.818.0−0.04−4.6−1.525.49.221.6
x = Net areal = 0.0112·x + 490.5724.67.819.20.03−4.5−1.423.99.420.5
x = Gross areal = 0.1235·x − 20.8217.18.414.4−0.010.20.115.77.713.6
x = Apartments per floorl = 7.2845·x + 130.6822.514.519.90.00−4.6−1.51.014.618.9
x = No. shaftsl = 6.1258·x + 110.8913.028.718.00.0017.15.412.328.418.9
x = Perimeter of buildingl = 0.8015·x − 310.8515.611.814.40.00−8.9−2.814.116.414.9
One parameter modelPipe length in shafts
x = Volumel = 0.0163·x − 240.8733.931.633.2−0.1−48.4−15.550.765.255.7
x = Heating areal = 0.0538·x + 30.8826.831.628.30.1−45.8−14.548.765.054.4
x = Net areal = 0.0522·x − 110.8733.929.932.6−0.1−54.111.350.771.960.0
x = Gross areal = 0.4471·x − 1510.7455.932.548.50.0−23.8−7.669.956.866.0
x = Apartments per floorl = 25.768·x − 910.5936.934.736.20.0−41.1−13.188.285.887.4
x = Tot apartmentsl = 3.6964·x − 240.8634.734.734.70.0−58.2−18.553.583.364.5
x = No shaftsl = 21.648·x − 980.7736.525.132.80.035.511.366.144.460.0
x = Perimeterl = 2.5985·x − 2110.6259.337.452.30.0−54.1−17.285.071.981.1
Two parameter modelPipe length in basement
x = Gross area and y = No. shaftsl = 1.04236·x + 3.56701·y0.949.718.412.50.810.94.09.418.913.2
x = No. shafts and y = Perimeterl = 3.02566·x + 0.44814·y − 160.9610.318.412.90.54.11.79.718.213.0
EN 15316-3 42.630.638.833.320.629.336.827.934.2
Two parameter modelPipe length in shafts
x = no. shafts and y = heating areal = 10.1399·x + 0.03717·y − 670.9423.814.39.80.0−5.7−1.820.220.620.4
EN 15316-3 325.3144.7267.8515.2−94.6321.2610.3114.3508.0
Table 6. Pipe losses per length with different thicknesses of thermal pipe insulation (qa) and how much of the losses are unutilised as internal heat gain (Qunut.).
Insulation of PipesBasement is Unheated
Basement losses qa.basement, W/mQunut. basement, %
EPC “A”EPC “C”
40 mm (insulated valves)8.38370
40 mm (uninsulated valves)10.8
20 mm13.6
Basement is heated +21 °C
qa.basement, W/mQunut. basement, %
40 mm (insulated valves)7.05648
40 mm (uninsulated valves)9.2
2011.5
Shaft losses qa.shaft, W/mQunut. shaft, %
40 mm5.16959
20 mm6.8
0 mm15.5
Publisher’s Note: MDPI stays neutral with regard to jurisdictional claims in published maps and institutional affiliations.

