Article

Multi-Objective Unified Optimal Control Strategy for DAB Converters with Triple-Phase-Shift Control

1
College of Electrical and Information Engineering, Hunan University of Technology, Zhuzhou 412007, China
2
College of Electrical and Information Engineering, Hunan University, Changsha 410082, China
*
Author to whom correspondence should be addressed.
Energies 2021, 14(20), 6444; https://doi.org/10.3390/en14206444
Submission received: 7 September 2021 / Revised: 26 September 2021 / Accepted: 2 October 2021 / Published: 9 October 2021
(This article belongs to the Special Issue Frontier in Special Power Conversion Systems and Control)

Abstract

:
To solve the problems of large current stress, difficult soft-switching of all switches, and slow dynamic response of dual active bridge converters, a multi-objective unified optimal control strategy based on triple-phase-shift control was proposed. The forward power flow global modes of triple-phase-shift control were analyzed, and three high-efficiency modes were selected to establish the analytical models of current stress and soft-switching. Combined with these models, the optimal solutions in different modes were derived by using the cost function-optimization equation to overcome the limitation of the Lagrange multiplier method, such that the DAB converter achieved the minimum current stress, and all switches operated in the soft-switching state over the entire power range. At the same time, the virtual power component was introduced in the phase-shift ratio combination, which improved the dynamic response of output voltage under the input voltage or load steps changed by power control. The theoretical analysis and experimental results show that the proposed control strategy can optimize the performance of the DAB converter from three aspects, such as current stress, soft-switching, and dynamic response, which achieves multi-objective optimization of the steady-state and dynamic performance of DAB converters.

1. Introduction

In recent years, with the rapid development of DC conversion technology, dual active bridge (DAB) converters have been widely used in flexible DC distribution networks, power electronic transformers, and electric vehicles, because of their advantages, such as wide voltage range regulation, double quadrant operation, and ease of realizing soft-switching [1,2,3]. However, when the voltage conversion ratio does not match, the efficiency of DAB converters is low, and the sudden change in system operating state has a great influence on the dynamic response of output voltage. At present, the research on DAB converters is mainly focused on single-performance optimization such as efficiency or dynamic response [4], while the research taking into account high-efficiency and fast dynamic response is not perfect.
To improve the efficiency and dynamic response of the DAB converter, multi-objective optimization control strategies are proposed in some references. Based on dual-phase-shift (DPS) control, ref. [5] introduces feedforward control into the output voltage discrete model and combines current-stress optimization to improve the efficiency and dynamic performance of DAB converters at the same time. In [6], the current stress is optimized based on extended-phase-shift (EPS) control, and the transmission power is estimated on-line by introducing a virtual voltage component to improve the response speed of the converter. A direct power control scheme based on triple-phase-shift (TPS) control is proposed in [7], which minimizes the current stress and improves the dynamic characteristics when load steps change. However, these studies only aim at the single-efficiency goal of the DAB converter and cannot achieve the optimal efficiency. In fact, the efficiency of the DAB converter is related to many factors, such as inductor current, reactive power, soft-switching, and so on. Considering multiple efficiency objectives comprehensively, the performance of the DAB converter can be improved to the greatest extent [8]. Reference [9] analyzes the minimum reactive power based on DPS control, which contradicts with the zero-voltage-switching (ZVS) of all switches, that is, giving up ZVS can obtain less reactive power and power loss of the converter. In [10], the Karush–Kuhn–Tucker (KKT) condition is used to optimize the reactive power of DAB converters under EPS control, and all switches can realize ZVS, resulting in the improvement of the converter efficiency. Using the same analysis method, ref. [11] minimizes the current stress based on TPS control, achieving all switches ZVS at the same time. However, studies [9,10,11] have some shortcomings: in the modulation strategy, reactive power and soft-switching under DPS control cannot be optimized at the same time, and DPS and EPS control are special cases of TPS control. The efficiency optimization of the converter with DPS and EPS control can only achieve local optimal solutions, such as it is difficult to achieve the optimal efficiency over the entire power range [12]. In the solution method, the KKT condition is an extended form of the Lagrange multiplier method (LMM), but the solution of minimum efficiency objectives by LMM methods is not perfect [13].
In the aspect of the dynamic performance optimization of the DAB converter, the improvement effect of multi-objective optimization control strategy is also different, which brings some difficulties to the selection of control strategies in practice. In the existing research, different dynamic performance optimization control strategies are compared in [14,15,16]. The results show that the dynamic performance of the DAB converter was optimal under virtual direct power control (VDPC). The VDPC strategy was proposed for the first time in [17], which realizes no obvious overshoot and fast dynamic response of the output voltage in the case of step change in input voltage, load, and output voltage. The control strategy compensates for the power deviation caused by power loss and voltage drop, and it also has good compatibility and portability. However, the dynamic performance optimization control strategy is based on single-phase-shift (SPS) control, which cannot optimize the efficiency of the DAB converter. Reference [6] combines VDPC strategy with EPS control, but EPS control cannot achieve the optimal efficiency of the DAB converter.
The conduction loss related to current-stress characteristics and the switching loss related to soft-switching characteristics account for the major total loss of DAB converters [18]. Therefore, the optimization of current stress and soft-switching is more conducive to improve the efficiency of DAB converter. In view of this, to optimize the performance of the DAB converter from three aspects, such as current stress, soft-switching, and dynamic response, an MUOC strategy based on TPS control was proposed in this study. Overcoming the limitation of the traditional LMM that it is difficult to obtain all the optimal solutions, the cost function-optimization equation was used to solve the optimal solutions in three high-efficiency modes of TPS control. As a result, the DAB converter achieved the minimum current stress, and all switches operated in the soft-switching state over the entire power range, thus improving the steady-state performance of the DAB converter. In addition, the virtual power component was constructed in the phase-shift ratio combinations, and the dynamic performance of the DAB converter was improved by power control: the output voltage of the DAB converter had almost no overshoot and regulation time when the input voltage or load steps changed.
The remainder of this paper is organized as follows. Section 1 analyzes and selects the high-efficiency modes of TPS control, and the analytical models of transmission power, current stress, and soft-switching are established. In Section 2, the MUOC strategy is proposed to optimize the performance of the DAB converter. The experimental results are presented and discussed in Section 3. Finally, the paper is summarized in Section 4.

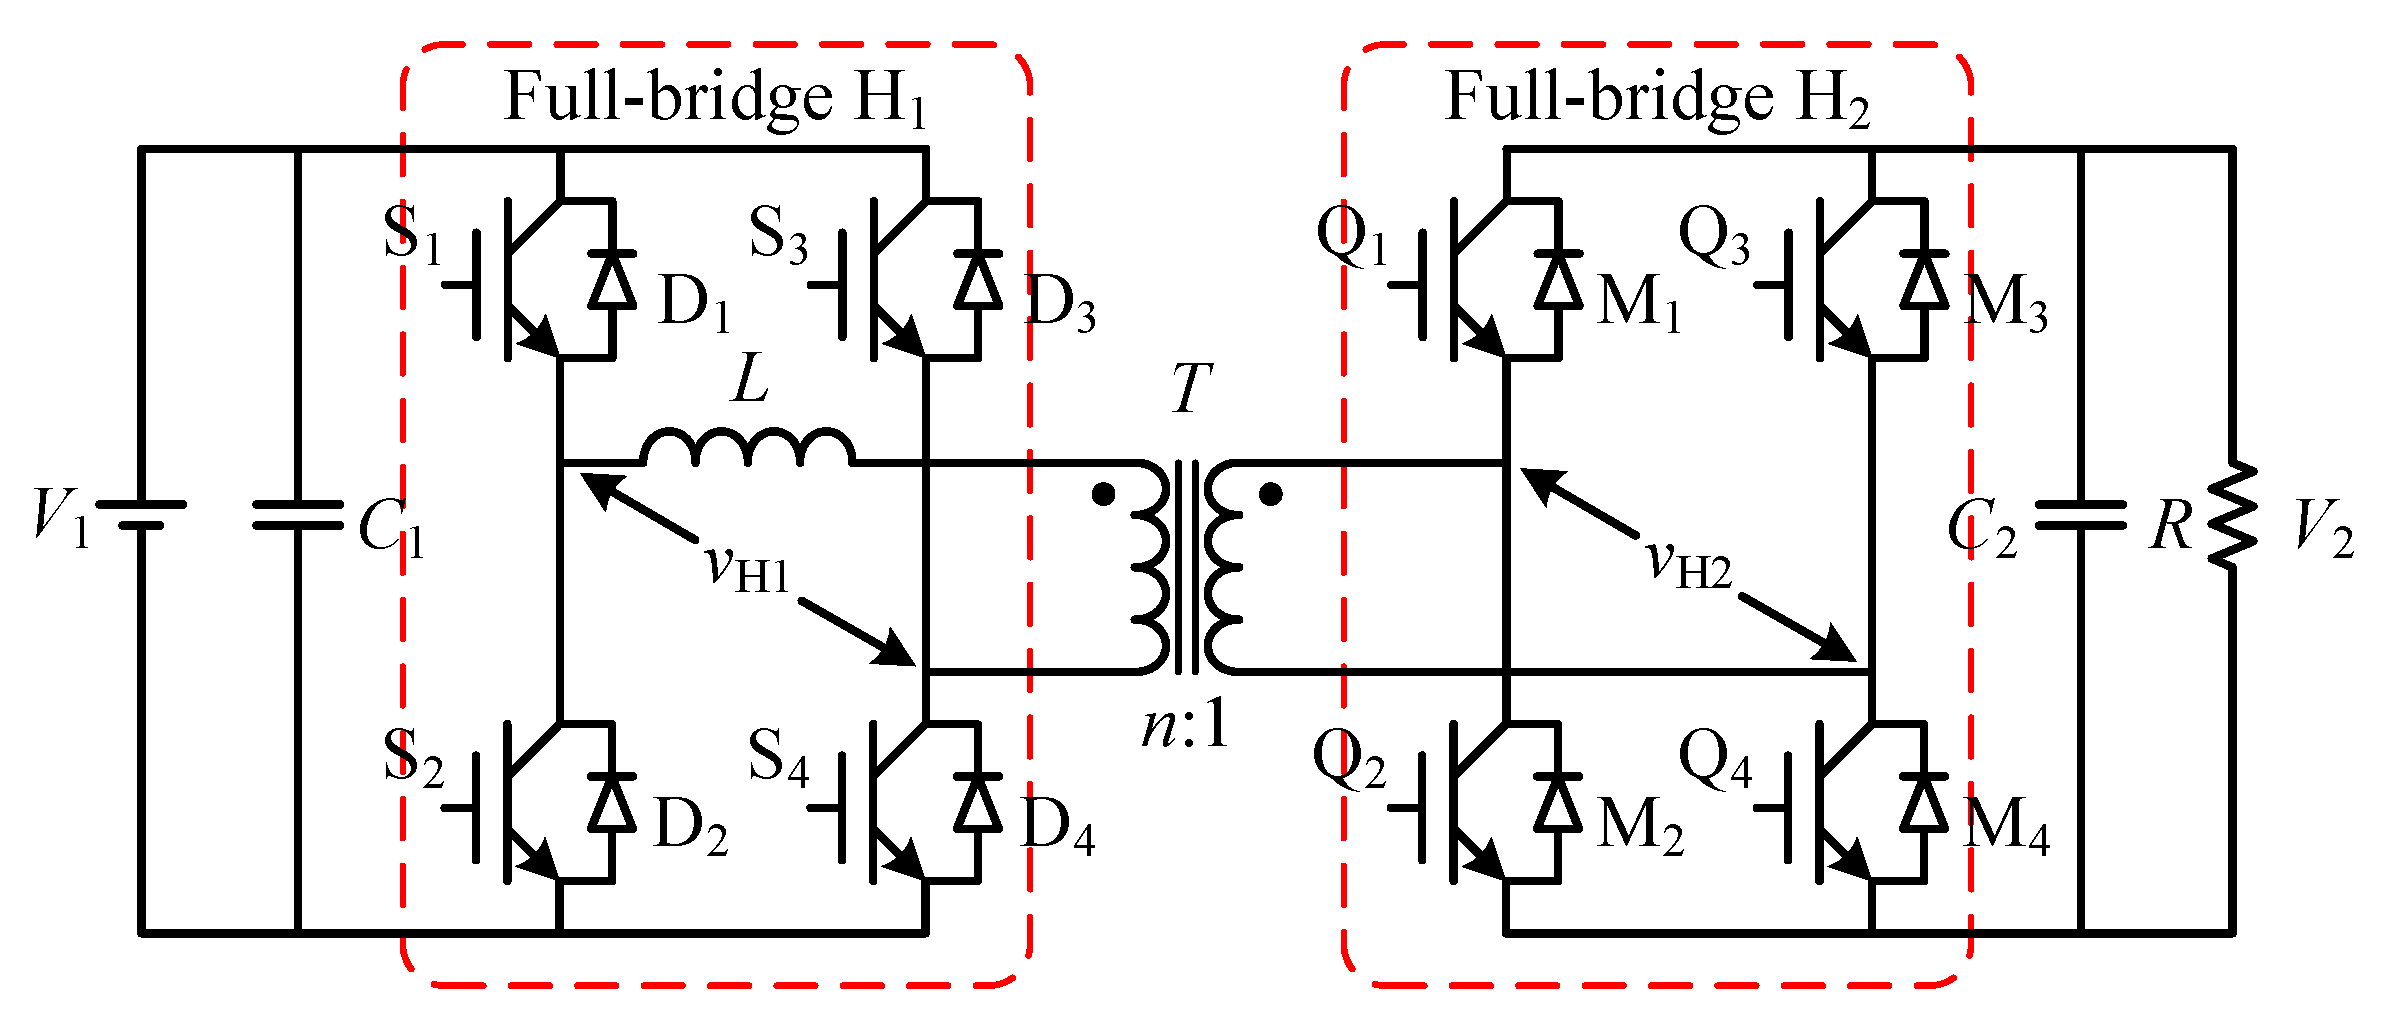
2. Analytical Model of High-Efficiency Modes of TPS Control

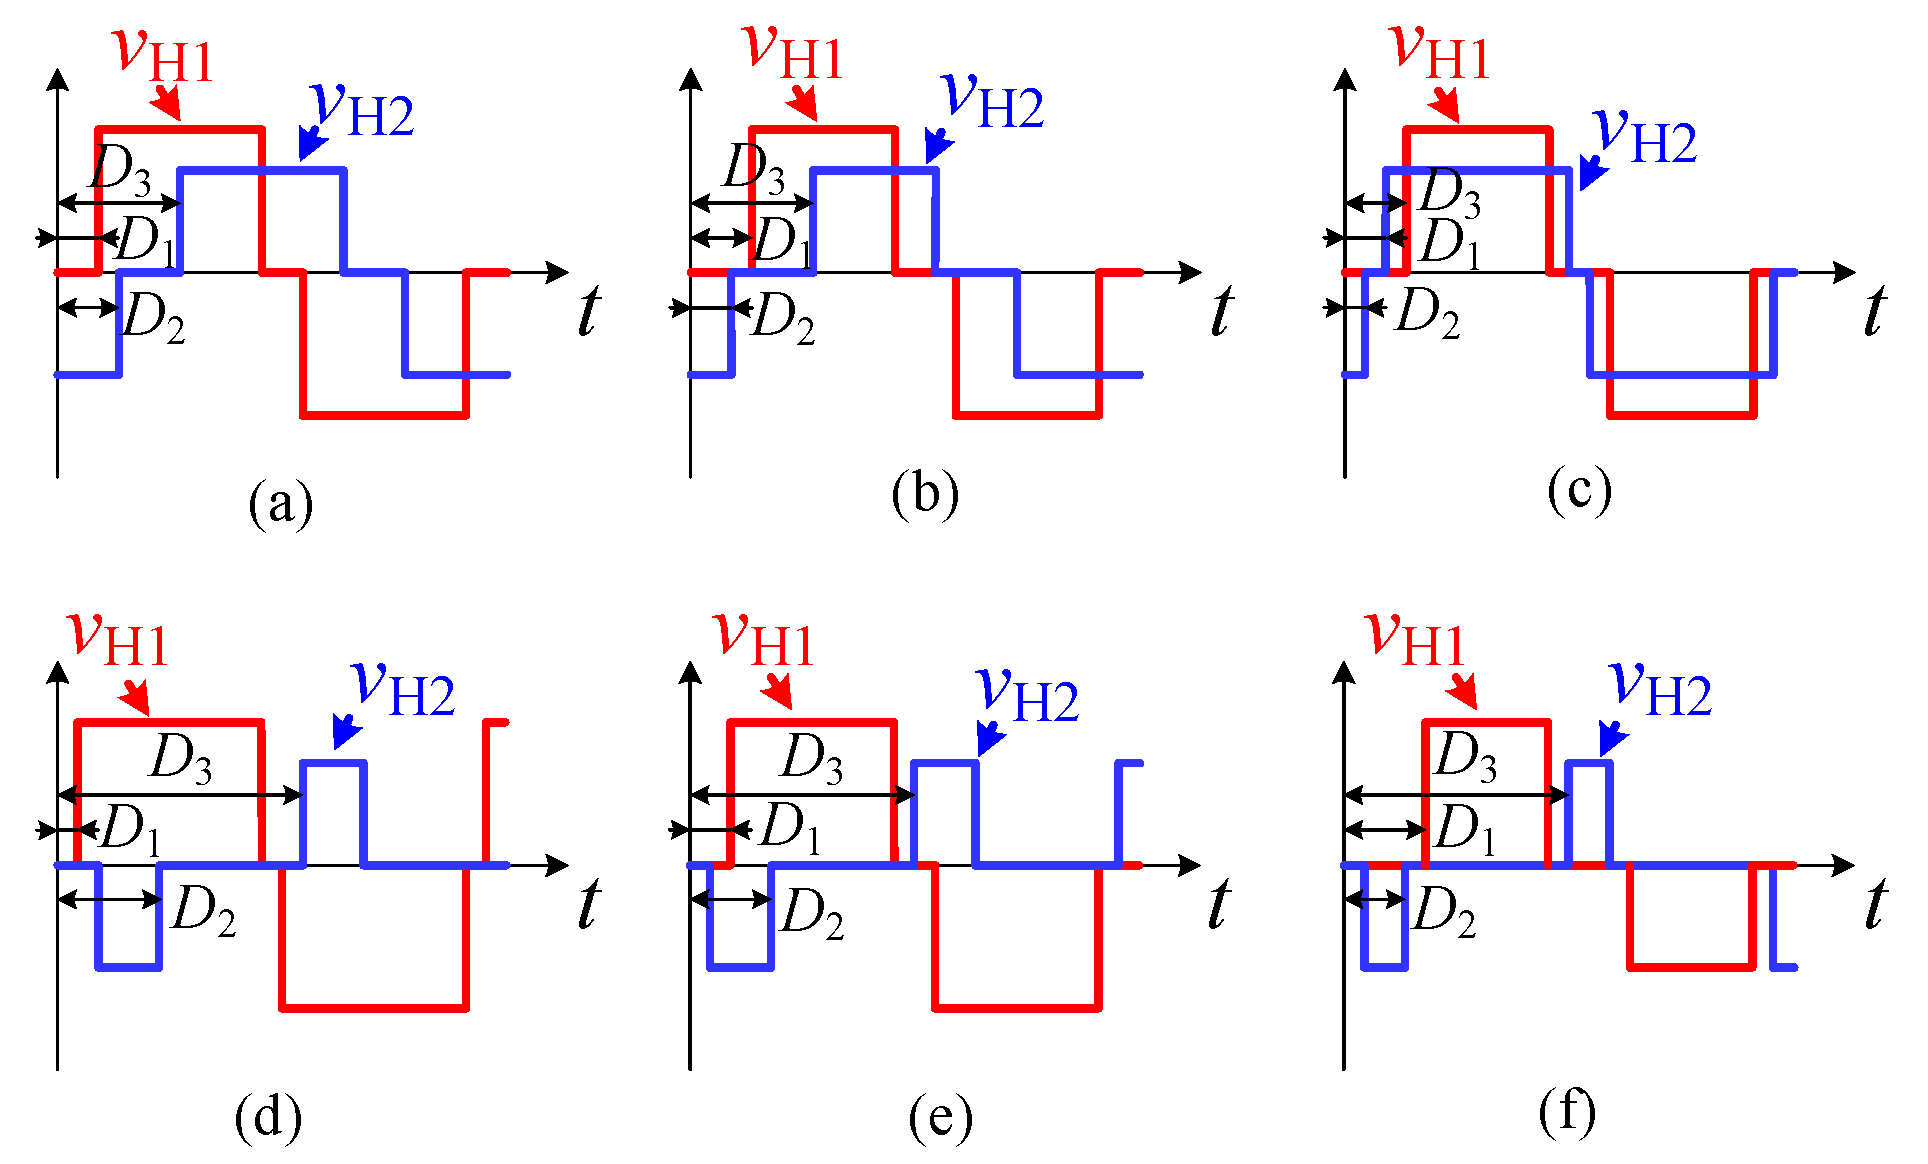
2.1. High-Efficiency Modes Selection

The topology of a DAB converter is shown in Figure 1, where T is the transformer with turn ratio n, C 1 and C 2 are the capacitors of full-bridge H 1 and H 2 , respectively, L is the sum of the transformer leakage inductance and auxiliary inductance, v H 1 and v H 2 are the AC output voltages of H 1 and H 2 on the V 1 side, respectively, and i L is the inductor current.
D 1 and D 3 are the phase-shift ratio of full-bridge H 1 and H 2 , respectively, which is called the internal phase-shift ratio, and D 2 is the phase-shift ratio between full-bridge H 1 and H 2 , which is called the external phase-shift ratio. According to Kirchhoff’s voltage law v L = v H 1 v H 2 , a different inductor voltage v L further forms a different inductor current i L . Therefore, the operating mode of TPS control can be distinguished based on v L [19]. D 1 D 3 is related to the order of rising and falling edges of v H 1 and v H 2 . The waveform of v H 1 is only determined by D 1 , while the waveform of v H 2 is determined by D 2 and D 3 . Considering the forward power flow, that is, the power is transmitted from v H 1 to v H 2 , D 1 [ 0 , 1 ] D 2 [ 0 , 1 ] D 3 [ 0 , 2 ] . According to the relationship of the phase-shift ratio, TPS control can be divided into six modes. The full-bridge AC output voltage waveforms in different modes are shown in Figure 2, and the ranges of D 1 D 3 are shown in Table 1.
Since 1 D 3 was satisfied in modes 4–6, before Q 1 and Q 4 are turned on (i.e., the rising edge of v H 2 ), S 1 was turned off (i.e., the falling edge of v H 1 ), and there was no time period satisfying the same polarity of v H 1 and v H 2 , that is, the power could not be transferred directly from H 1 to H 2 , resulting in a very large reactive power and a significant increase in i L in modes 4–6. Therefore, modes 4–6 were no longer considered when optimizing the converter efficiency. The current-stress optimization of modes 1–3 is analyzed in detail below.

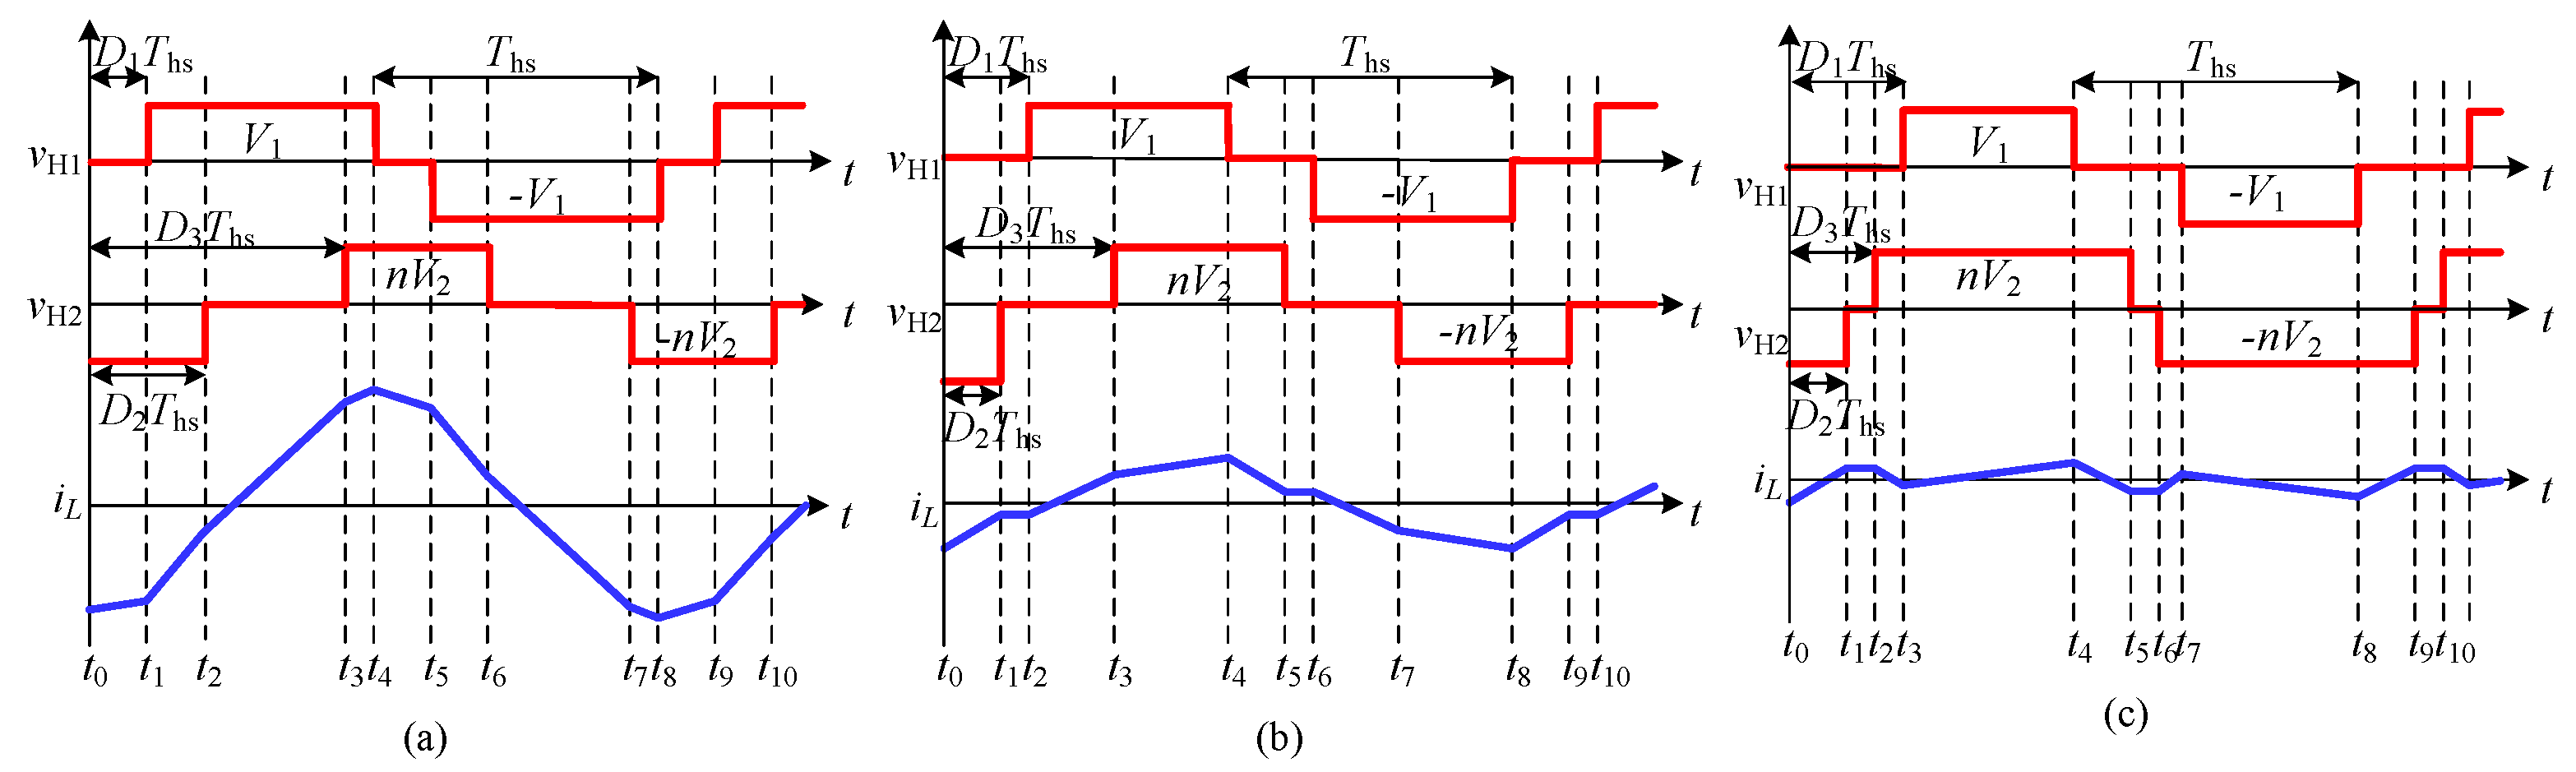
2.2. Transmission Power and Current-Stress Characteristics

The analysis methods of TPS control include the numerical method and analytical method [20]. As the analytical method can accurately describe the mathematical model between the objective function and the control strategy, the piecewise analysis method was used to derive the analytical models of transmission power and current stress in three high-efficiency modes of TPS control. In this study, the voltage conversion ratio of the DAB converter was defined as k = V 1 / n V 2 , and only the case of k 1 was analyzed, but k < 1 could be deduced using the same method. When k 1 , the full-bridge switching times and steady-state operating waveforms under modes 1–3 of TPS control are shown in Figure 3. T hs is the half switching cycle, and T hs = 1 / 2 f s .
Assuming that the DAB converter was at steady-state in mode 1, and t 0 was zero, then each switching time could be expressed as: t 1 = D 1 T hs , t 2 = D 2 T hs , t 3 = D 3 T hs , and t 4 = T hs . Therefore, the corresponding inductor current at each switching time was as follows:
i L t 1 = i L t 0 + n V 2 L D 1 T hs i L t 2 = i L t 1 + V 1 + n V 2 L D 2 D 1 T hs i L t 3 = i L t 2 + V 1 L D 3 D 2 T hs i L t 4 = i L t 3 + V 1 n V 2 L 1 D 3 T hs
The inductor current satisfied i L ( t 0 ) = i L ( t 4 ) in half a cycle because of the odd symmetry, such that the inductor current could be further deduced as follows:
i L ( t 0 ) = 1 4 L f s V 1 D 1 n V 2 D 2 n V 2 D 3 V 1 + n V 2 i L ( t 1 ) = 1 4 L f s V 1 D 1 + 2 n V 2 D 1 n V 2 D 2 n V 2 D 3 V 1 + n V 2 i L ( t 2 ) = 1 4 L f s V 1 D 1 + 2 V 1 D 2 + n V 2 D 2 n V 2 D 3 V 1 + n V 2 i L ( t 3 ) = 1 4 L f s V 1 D 1 + n V 2 D 2 + 2 V 1 D 3 n V 2 D 3 V 1 + n V 2 i L ( t 4 ) = 1 4 L f s V 1 D 1 + n V 2 D 2 + n V 2 D 3 + V 1 n V 2
The calculation equations of transmission power and inductor current stress of the DAB converter were as follows [4]:
P = 1 T hs 0 T hs v H 1 i L ( t ) d t G = max i L t 0 , , i L t 4
Combining (2) and (3), the transmission power and current stress could be obtained as follows:
P = 1 T hs t 0 t 1 v H 1 i L ( t ) i L t 0 d t + t 1 t 2 v H 1 i L ( t ) i L t 1 d t + t 2 t 3 v H 1 i L ( t ) i L t 2 d t + t 3 t 4 v H 1 i L ( t ) i L t 3 d t = n V 1 V 2 D 1 2 D 2 2 D 3 2 + D 1 D 2 + D 1 D 3 D 1 + D 2 + D 3 4 L f s
G = i L t 4 = n V 1 V 2 k 1 D 1 + D 2 + D 3 + 1 4 L f s
To simplify the analysis, the transmission power and the current stress were unified as follows:
p = P P base = 8 L f s P n V 1 V 2 = 2 D 1 2 D 2 2 D 3 2 + D 1 D 2 + D 1 D 3 D 1 + D 2 + D 3 G = i max I base = 8 L f s i max n V 2 = 2 k 1 D 1 + D 2 + D 3 + 1
where p and G are unified transmission power and current stress, respectively; P base and I base are rated power and rated current of traditional SPS control, respectively.
Similarly, the analytical models of the other two modes could be deduced in the same way, which will not be repeated here. Therefore, the expressions of transmission power and current stress of the three high-efficiency modes were as follows:
p = 2 D 1 2 D 2 2 D 3 2 + D 1 D 2 + D 1 D 3 D 1 + D 2 + D 3 mode 1 2 D 3 2 D 1 D 2 + D 1 D 3 D 1 + D 2 + D 3 mode 2 2 D 1 2 D 1 D 2 D 1 D 3 D 1 + D 2 + D 3 mode 3
G = 2 k 1 D 1 + D 2 + D 3 + 1 mode 1 , 2 max 2 ( 1 k ) D 1 + k D 3 2 ( 1 k ) D 1 + 2 D 2 + ( k 2 ) D 3 2 ( k 1 ) D 1 + 2 D 2 k D 3 mode 3
From (7), the transmission power range of mode 1 was p 1 = [ 0 , 1 ] , the transmission power range of mode 2 was p 2 = [ 0 , 2 / 3 ] , and the transmission power range of mode 3 was p 3 = [ 1 / 2 , 1 / 2 ] . As can be seen, the transmission power range of mode 1 was the largest, covering the whole operating area, and mode 3 could realize bidirectional power transmission. It can be seen from (8) that the current stress of mode 1 was the same as that of mode 2; as the inductor current of mode 3 was not monotonous, the current stress may have occurred at a specific switching time, and the magnitude was determined by both D 1 D 3 and k.

2.3. Soft-Switching Characteristics

In practice, the transformer turn ratio of the DAB converter is fixed. When the input or output voltage changes, that is, the voltage conversion ratio does not match, it cannot guarantee that every switch can achieve ZVS. Since each switch of the DAB converter has an anti-parallel diode, the anti-parallel diode must be turned on before the switch to achieve ZVS. Therefore, the ZVS range of the DAB converter could be obtained from the polarity of the inductor current at different times [21], as shown in Table 2.
From the above analysis, the soft-switching ranges of the three modes are shown in (9)–(11) as follows:
( k + 2 ) D 1 D 2 D 3 k + 1 0 k D 1 ( 2 k + 1 ) D 2 + D 3 + k 1 0
k D 1 + D 2 D 3 k + 1 0 k D 1 + D 2 D 3 k + 1 0
k D 1 D 2 D 3 k + 1 0 k D 1 + D 2 D 3 k + 1 0 ( k 2 ) D 1 + D 2 + D 3 k + 1 0

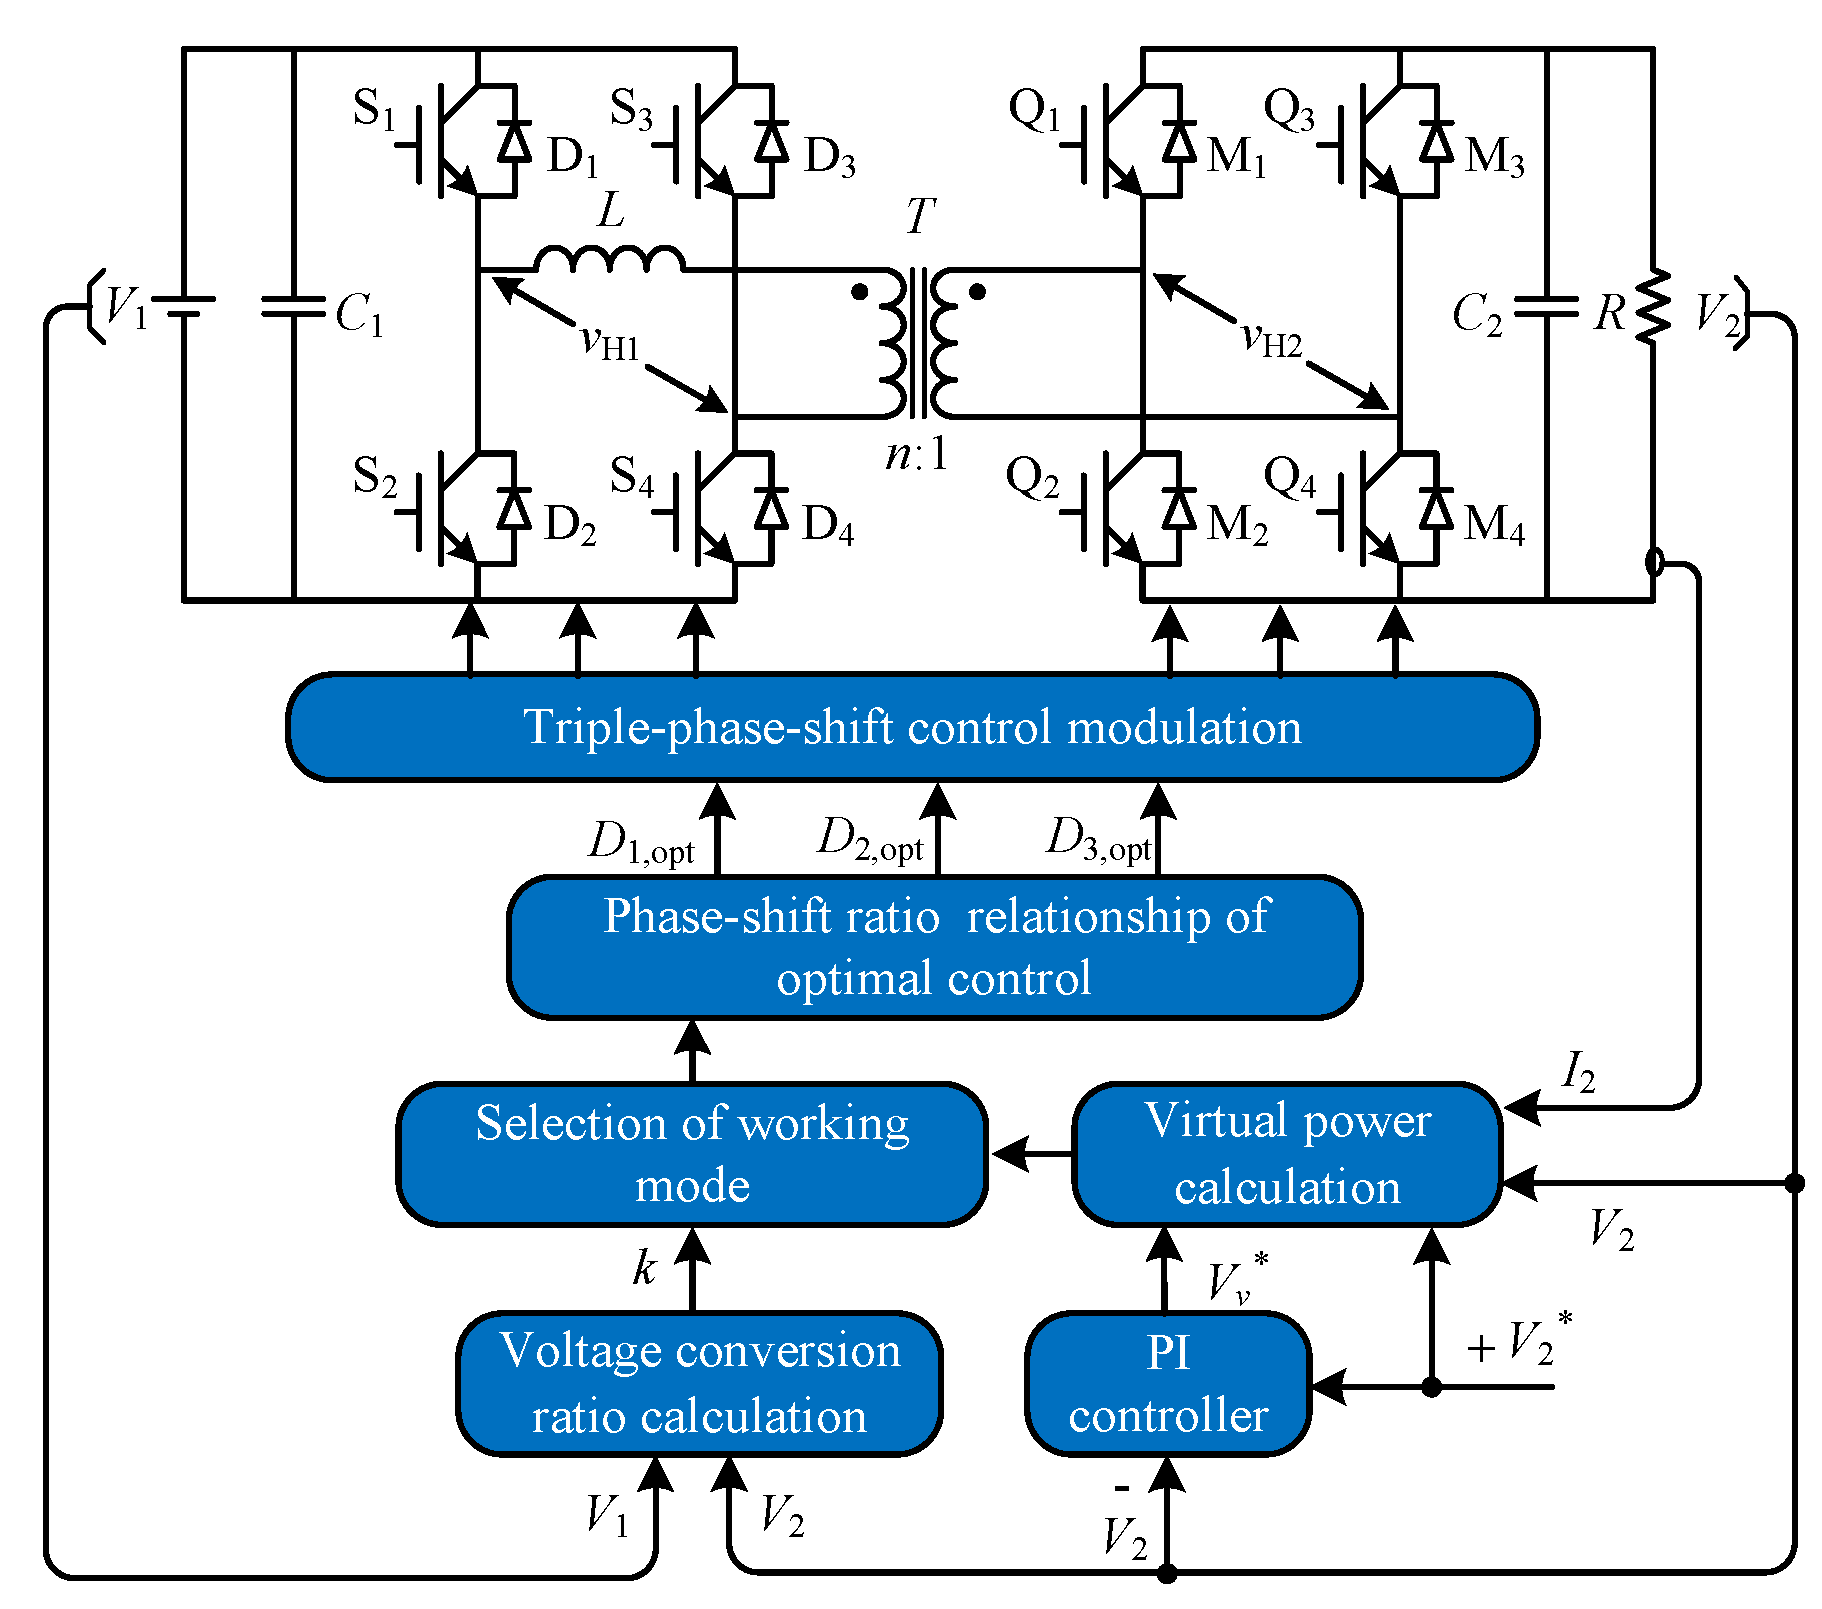
3. The MUOC Strategy and Performance Analysis

3.1. The MUOC Strategy

The optimization of the MUOC strategy was divided into two parts. The steady-state part took the current stress and soft-switching as the optimization goals, minimized the current stress, and made all the switches achieve ZVS; the dynamic part was to construct the virtual power component, and improve the dynamic performance of the DAB converter through power control.
LMM is generally used to solve the minimum current stress [5,6,7,11,12]. However, there are two problems in constructing the mathematical model of LMM: (1) considering the constraints of transmission power and phase-shift ratio, its feasible region may not be a convex set; (2) there is overlap in the power transmission range under different operating modes, and there may be different optimal phase-shift ratio combinations corresponding to specific power transmission points. Therefore, it is difficult to find the optimal solution of current stress by LMM [13].
To overcome the limitation of the LMM analysis, the cost function was considered to solve the current-stress optimization problem of TPS control under specific transmission power. The cost function λ is defined as:
λ ( i , j ) = G j D i · D i P j s . t . D i , z min D i , opt D i , z max
where i represents the control variable, that is, D i represents the different phase-shift ratios, D i , opt represents the optimized phase-shift ratio, D i , zmin and D i , zmax represent the maximum phase-shift ratio and minimum phase-shift ratio that satisfy the ZVS constraint range, respectively; j represents the operating mode, that is, G j and P j represent the current stress and transmission power in different modes, respectively. The values of i and j are 1, 2, and 3. The cost function λ represents the change between cost and gain based on the disturbance in the control variable.
If the three cost functions are not equal, the current stress can be further reduced by adjusting one of the cost functions. Therefore, to realize the current-stress optimization, it was necessary to make the three cost functions equal, as shown in (13).
λ ( 1 , j ) = λ ( 2 , j ) = λ ( 3 , j )
Equation (13) is defined as a cost function-optimization (CFO) equation, which contains equality constraints of two cost functions. Combined with the specific transmission power constraints, the unique optimal phase-shift ratio combination of current stress under the power stage could be solved.
According to (13), the CFO equation under mode 1 could be obtained as follows:
k 2 D 1 + D 2 + D 3 1 = 1 2 D 2 + D 1 + 1 k 2 D 1 + D 2 + D 3 1 = 1 2 D 3 + D 1 + 1
Solving (14), we could get:
D 2 , opt = k 2 2 k 2 D 1 , opt + 1 2 D 3 , opt = D 2 , opt
where D 1 , opt that all switches of DAB converter that realized ZVS in mode 1 meet:
0 D 1 , opt k 1 k
Similarly, the CFO equation in mode 2 could be obtained as follows:
k D 2 + D 3 1 = 1 D 1 + 1 k D 2 + D 3 1 = 1 2 D 3 + D 1 + 1
Furthermore, (18) could be obtained by solving (17) as follows:
D 2 , opt = ( k 1 ) 1 D 1 , opt D 3 , opt = D 1 , opt
where D 1 , opt that all switches of the DAB converter that realized ZVS in mode 2 meet:
0 D 1 , opt < 1
For mode 3, due to the uncertainty of current stress in the analytical model, it was difficult to directly solve the optimized phase-shift combination in this mode. However, after determining the transmission power, voltage conversion ratio and phase-shift ratio, the current stress could be determined accordingly. In addition, it could be seen from (18) that the phase-shift ratio combination solved by mode 2 was at the domain boundary of modes 2 and 3, so the optimal solution of mode 3 was the same as that of mode 2.
Moreover, because the phase-shift ratios of the non-power control mode were directly output by PI control, its dynamic performance could not meet the needs of actual projects. To improve the output dynamic performance, this study optimized the dynamic performance of the DAB converter based on the idea of virtual direct power control. The construction of the virtual power component [18] was as follows:
p * = V v * V 2 * i ˙ 2 V 2
where V v * is defined as the virtual voltage component, which is the output value of the PI controller; V 2 * is the expected output voltage; V 2 and i 2 are the actual sampled output voltage and output current, respectively. By constructing the virtual power component, the power deviation caused by the voltage drop of switches, the power loss, and the internal converter parameters could be compensated, and the internal parameters of the system (inductance L, switching frequency f s , and transformer turn ratio n, etc.) were not involved in the calculation process, which reduced the parameter sensitivity of the system and increased the compatibility and portability of the control strategy.
Combining (7), (15), and (20), the optimized phase-shift ratio combination with respect to k and p * was derived as follows:
D 1 , opt = ( k 1 ) 1 p * k 2 2 k + 2 D 2 , opt = k 2 2 1 p * k 2 2 k + 2 + 1 2 D 3 , opt = k 2 2 1 p * k 2 2 k + 2 + 1 2
Similarly, the optimized phase-shift ratio combination of modes 2 and 3 were as follows:
D 1 , opt = 1 p * 2 k 2 D 2 , opt = ( k 1 ) p * 2 k 2 D 3 , opt = 1 p * 2 k 2
From the above analysis, an MUOC strategy based on TPS control was proposed, as shown in Figure 4. In the MUOC strategy, the system needed to sample input voltage V 1 , output voltage V 2 , and output current i 2 . Secondly, the virtual voltage component V v * was output by the output voltage PI controller to compensate for the power deviation, and the operating mode of the DAB converter was judged and selected by calculating the values of k and p * . Next, based on the relationship of the phase-shift ratio combination, k, and p * , that is, (21) and (22), the three optimal phase-shift ratios of TPS control were calculated. Finally, the pulse signal of the DAB converter was generated by the PWM signal generator to drive the turn-on and turn-off of switches.

3.2. Minimum Current Stress and ZVS Analysis

By substituting the phase-shift ratios in (21) into the current stress expression, the minimum current stress in mode 1 could be obtained as follows:
G min = 2 k 2 1 p * k 2 2 k + 2
where the range of the phase-shift ratio D 1 , opt and transmission power p * is:
0 D 1 , opt k 1 k 2 k 2 k 2 p * 1
Similarly, the minimum current stress and range of the phase-shift ratio D 1 , opt and transmission power p * in modes 2 and 3 are:
G min = 2 2 p * ( k 1 )
k 1 k < D 1 , opt D 3 , opt 0 p * < 2 k 2 k 2
To better compare the performance of the SPS control strategy, the current-stress optimization control strategy under DPS control [5], and the current-stress optimization control strategy under TPS control, Table 3 shows the minimum current stress of the DAB converter in various ranges of transmission power under different control strategies, and the comparison curves were shown in Figure 5. As can be seen from Figure 5, the TPS control had the minimum current stress, which made the DAB converter achieve the highest efficiency over the entire power range.
Equation (27) could be obtained by substituting the phase-shift ratio extremum combination into the ZVS range in mode 1, and the ZVS power constraint range was exactly the same as the power range satisfied by the current-stress extreme value, that is, the switches could achieve ZVS in the whole operating range of mode 1.
k 2 1 p k 2 2 k + 2 k 0 1 k 1 p k 2 2 k + 2 0
By substituting (22) into the ZVS range, we could obtain (28). Since the value of one of the inequalities was equal to zero, that is, the inequality was critical, such that all switches in the operating range of modes 2 and 3 achieved ZVS critically.
2 ( k 1 ) p 2 k 2 0 ( k 1 ) p 2 k 2 + ( k 1 ) 1 p 2 k 2 k + 1 = 0
To sum up, all switches in mode 1 could achieve ZVS within the operating range, and all switches in modes 2 and 3 were critical to achieve ZVS. Compared with SPS and DPS control, the optimization of TPS control not only minimized the current stress over the entire power range, but also ensured all switches ZVS, which could effectively reduce the conduction loss and switching loss of the converter.

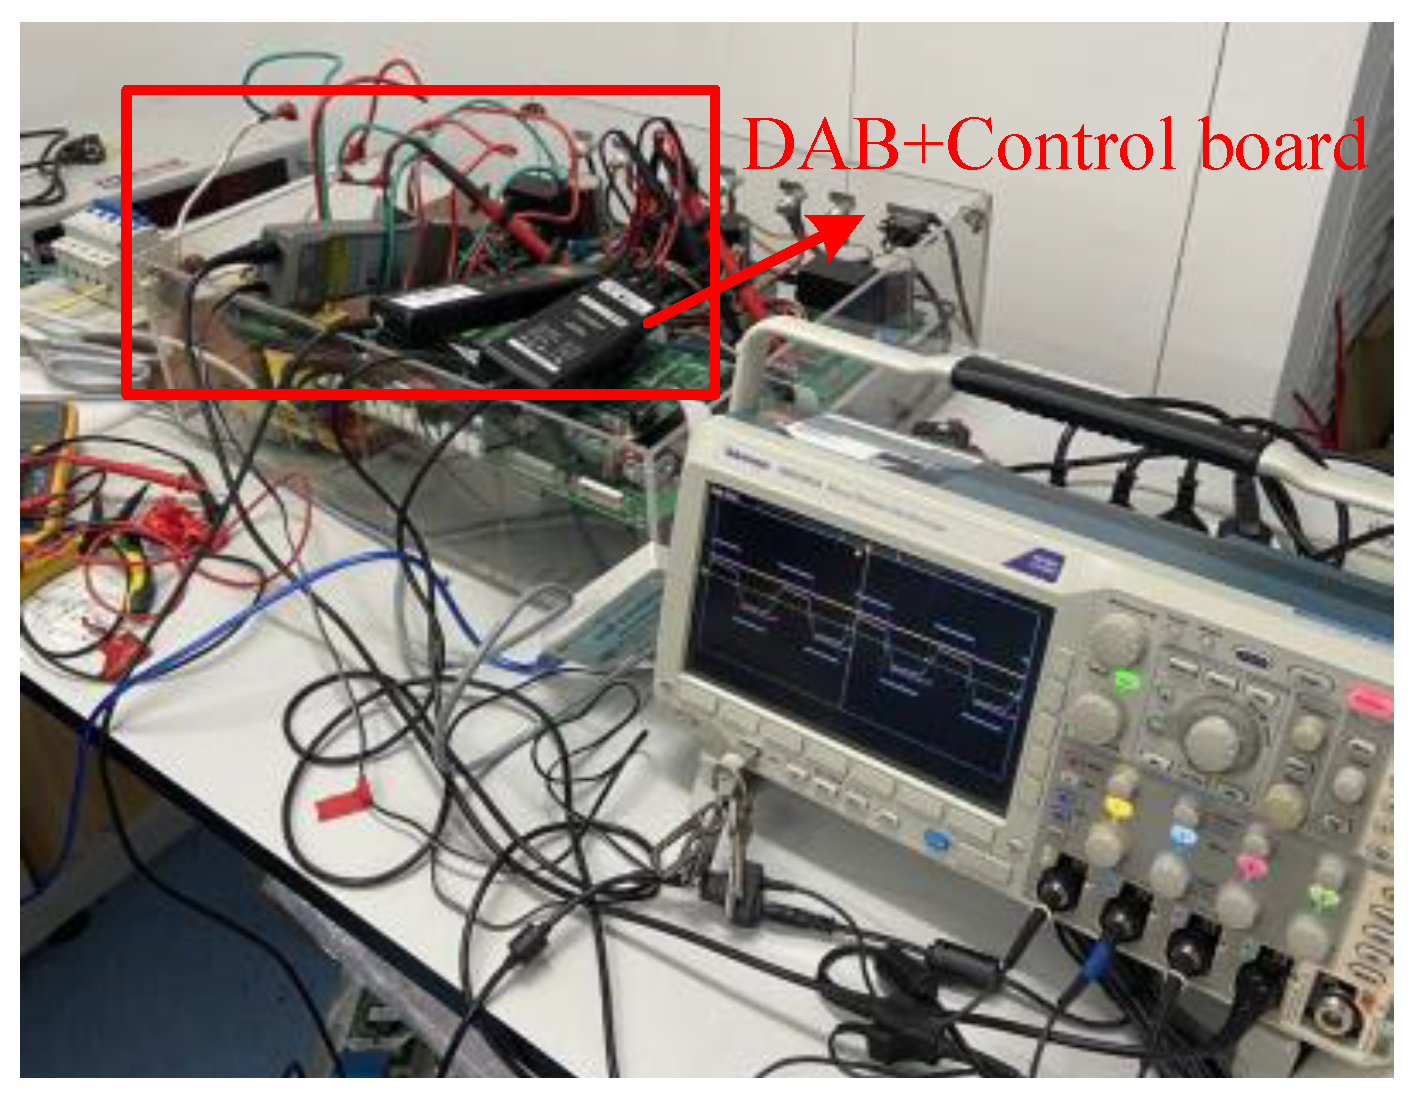
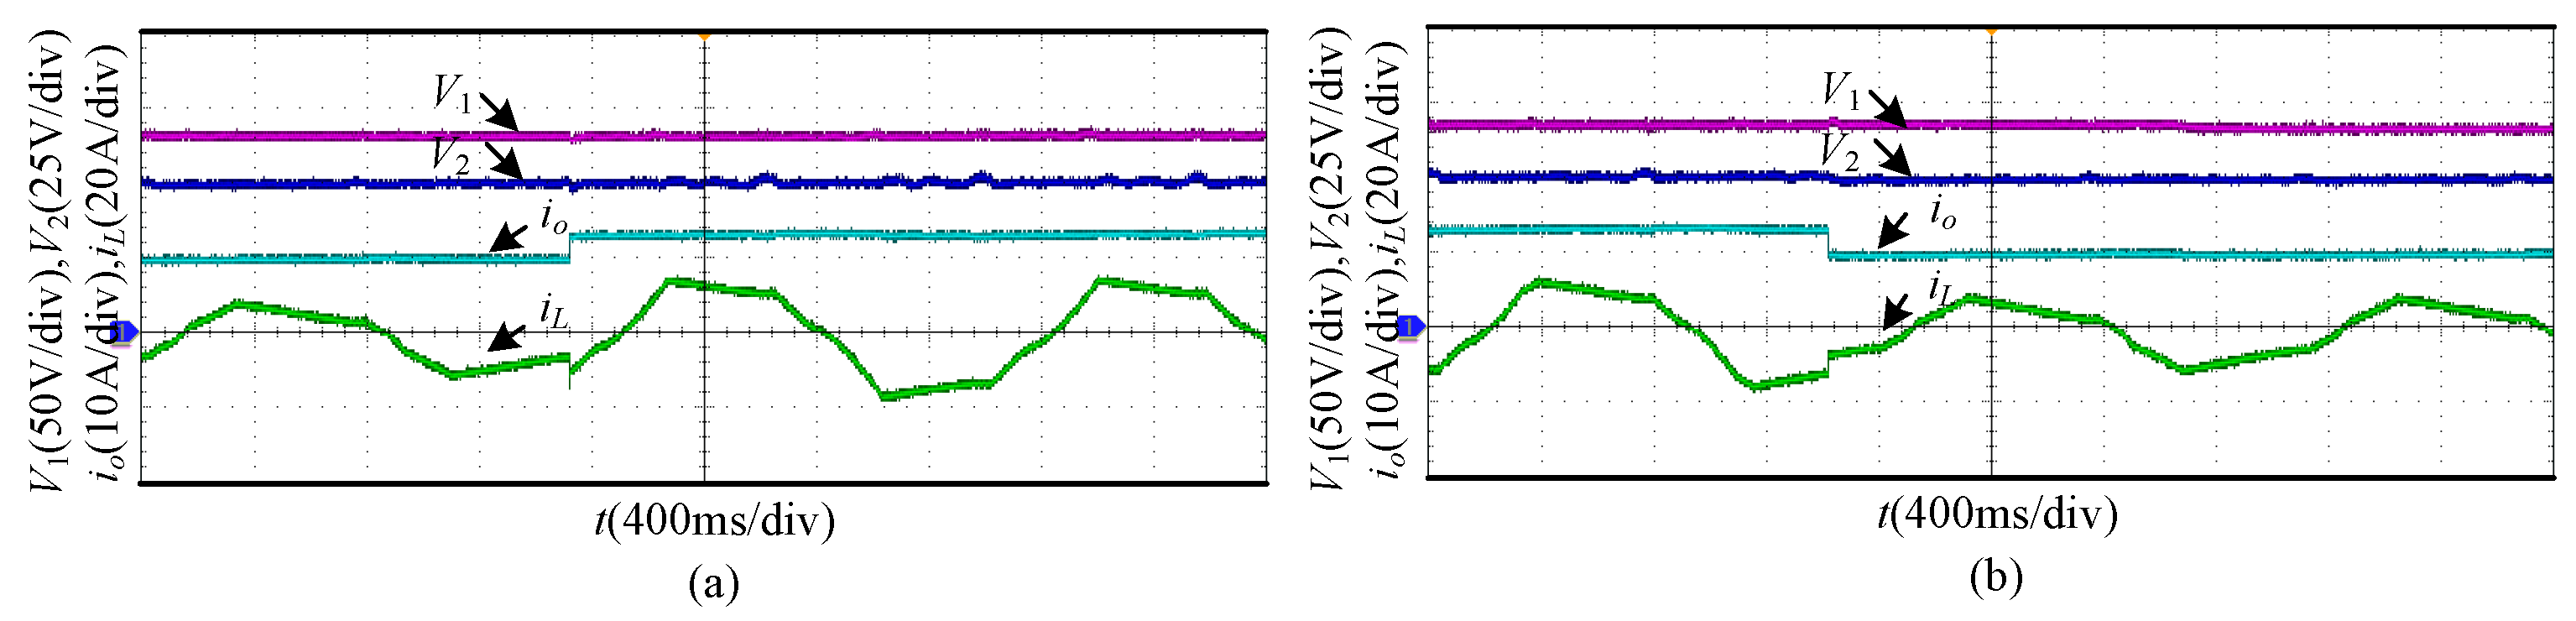
4. Experimental Results and Analysis

To verify the correctness of theoretical analysis and the effectiveness of the proposed control strategy, the hardware experimental platform of the DAB converter was built with TMS320F28335. The experimental platform is shown in Figure 6, and the main parameters of the experimental platform are shown in Table 4.

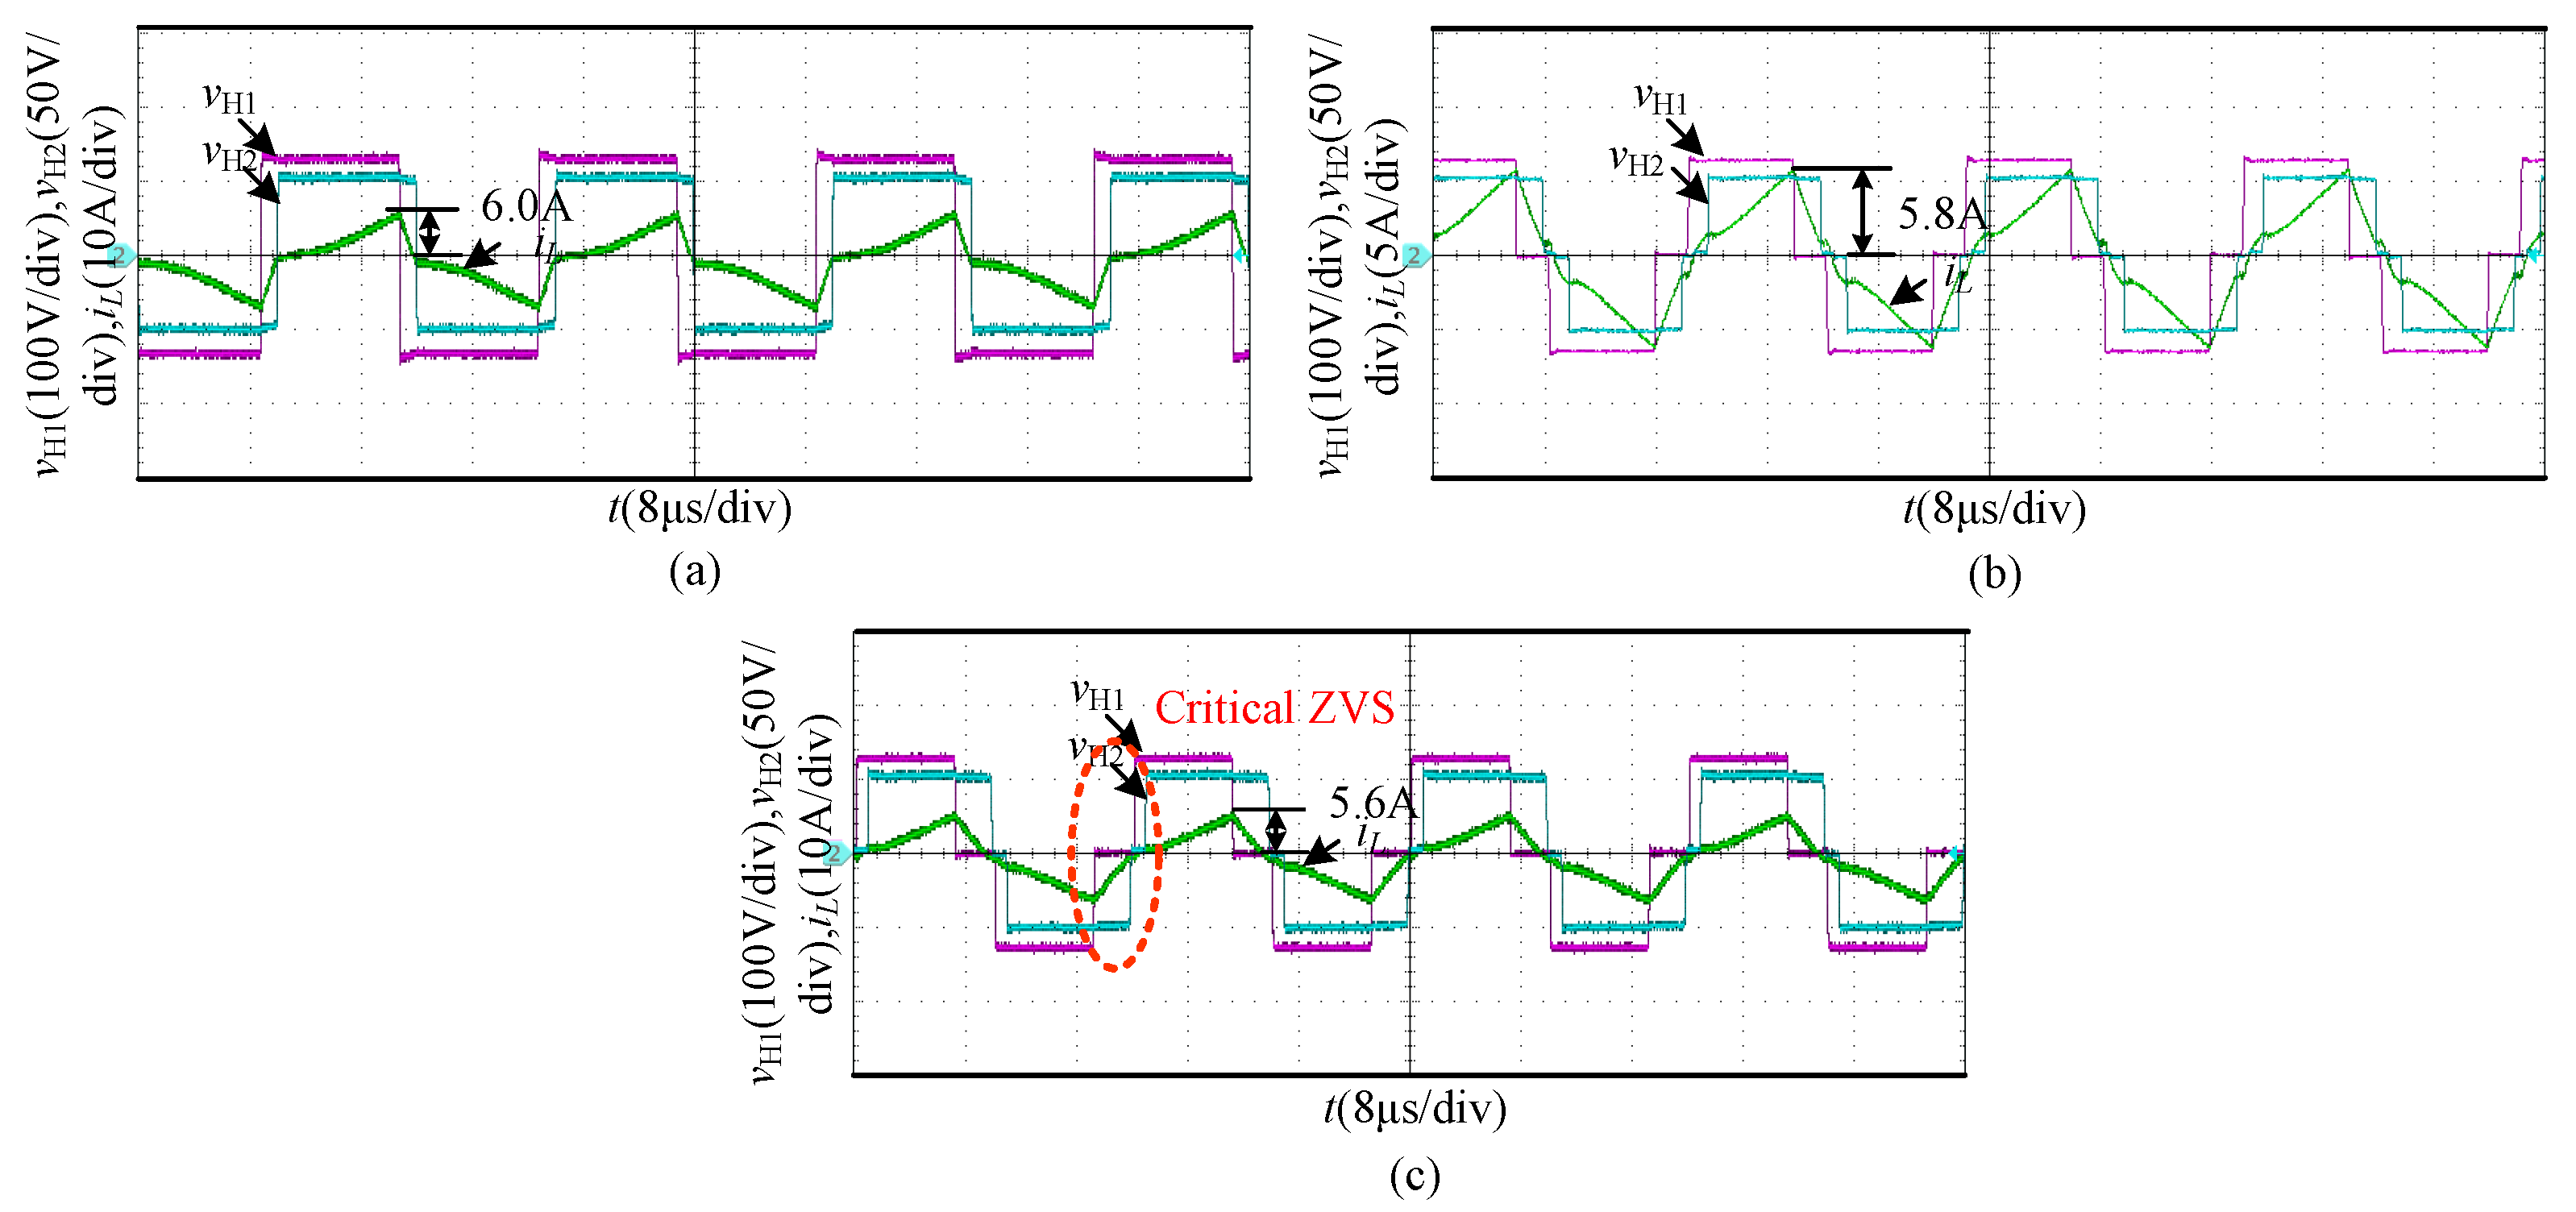
4.1. Steady-State Experimental Analysis

To verify the steady-state performance improvement of the DAB converter under the MUOC strategy in a wide voltage-regulation range, the input voltage V 1 = 130 V , the output voltage V 2 = 50 V , the transformer turn ratio n = 26 / 15 , and the voltage conversion ratio k = 1.5 could be obtained. When the load R = 5 Ω , Figure 7 shows the AC output voltage and inductor current steady-state experimental waveforms of the traditional SPS control strategy, current-stress optimization control strategy of DPS control, and MUOC strategy under heavy load, respectively. The current stress was 9.6 A under the traditional SPS control strategy; the current stress was 9.3 A under the current-stress optimization control strategy of DPS control; the current-stress optimization result was 8.8 A under the MUOC strategy. Therefore, it can be seen that the current stress of the MUOC strategy was the lowest under the three control strategies.
Similarly, when the voltage state of the system was constant and the load R = 10 Ω , Figure 8 shows the AC output voltage and inductor current steady-state experimental waveforms of the traditional SPS control strategy, current-stress optimization control strategy of DPS control, and MUOC strategy under light load, respectively. As can be seen from Figure 8, the current stress of the SPS control strategy was 6.0 A; the current stress was 5.8 A under the current-stress optimization control strategy of DPS control; while the current stress was 5.6 A under the MUOC strategy. Therefore, the current stress of the MUOC strategy was also lower than that of the other two control strategies under light load.
In addition, in the steady-state waveform of the MUOC strategy, the rising edge and the falling edge of full-bridge AC output voltage represent the turn-on and turn-off time of switches, respectively. In the case of the heavy load, the polarity of the inductor current corresponding to the switching time satisfied ZVS; in the case of the light load, the polarity of the inductor current corresponding to the switching time satisfied critical ZVS, which was consistent with the theoretical analysis, and proved that the MUOC strategy could optimize the switching loss of the DAB converter.

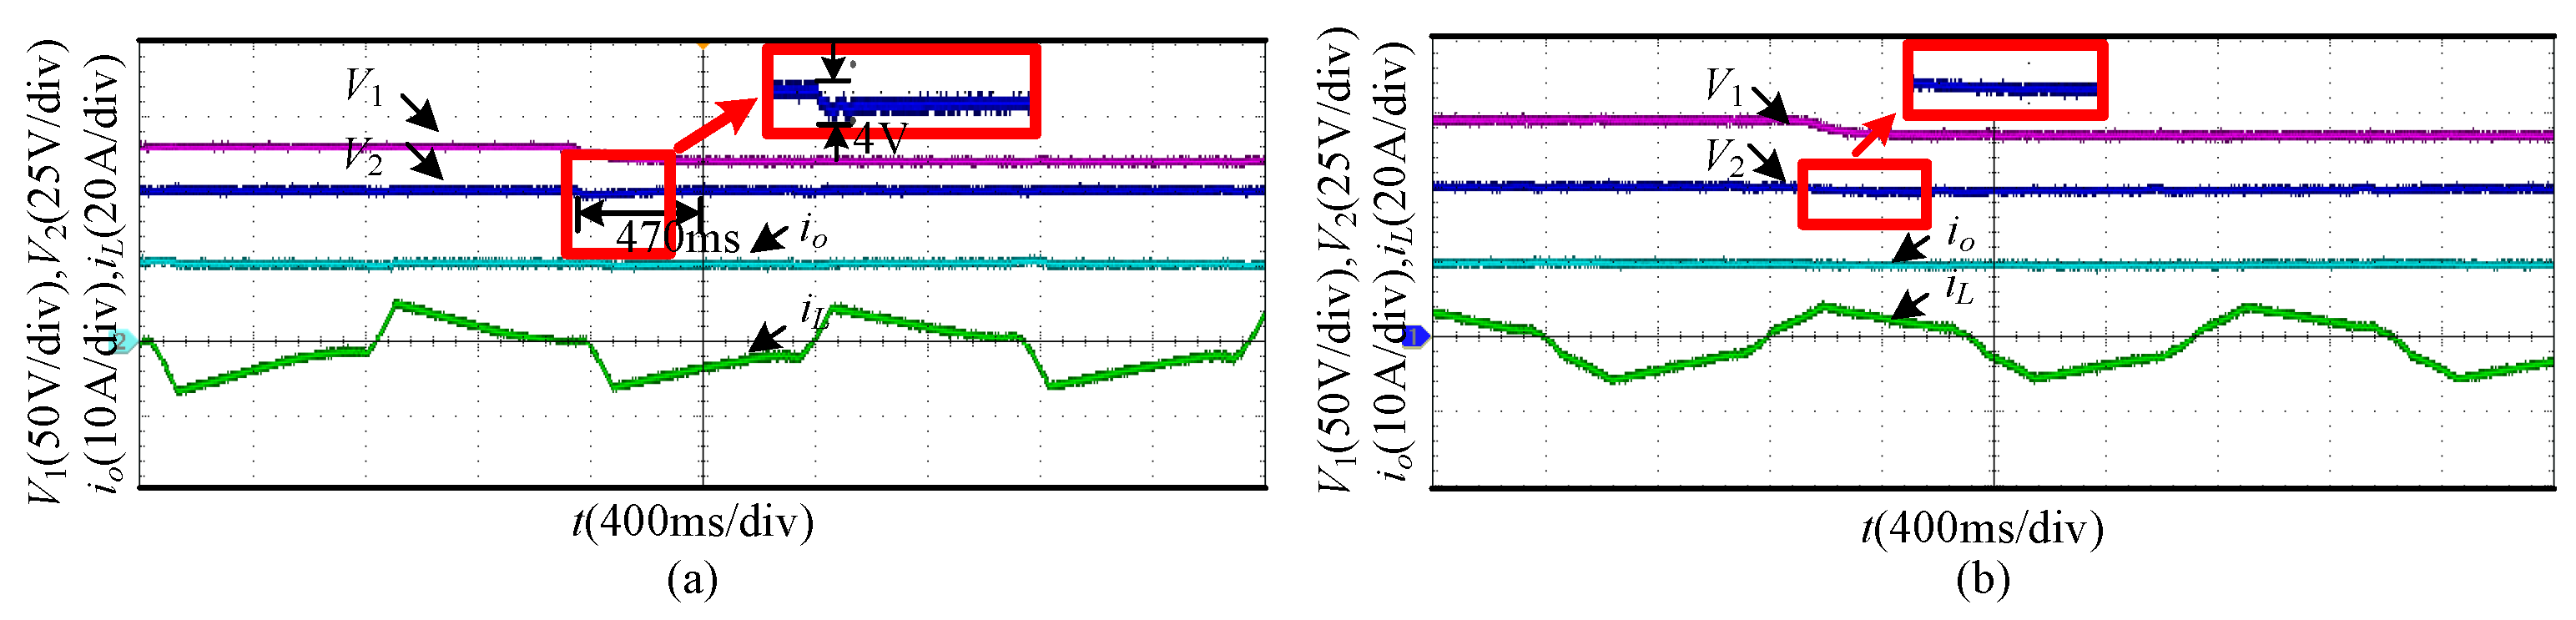
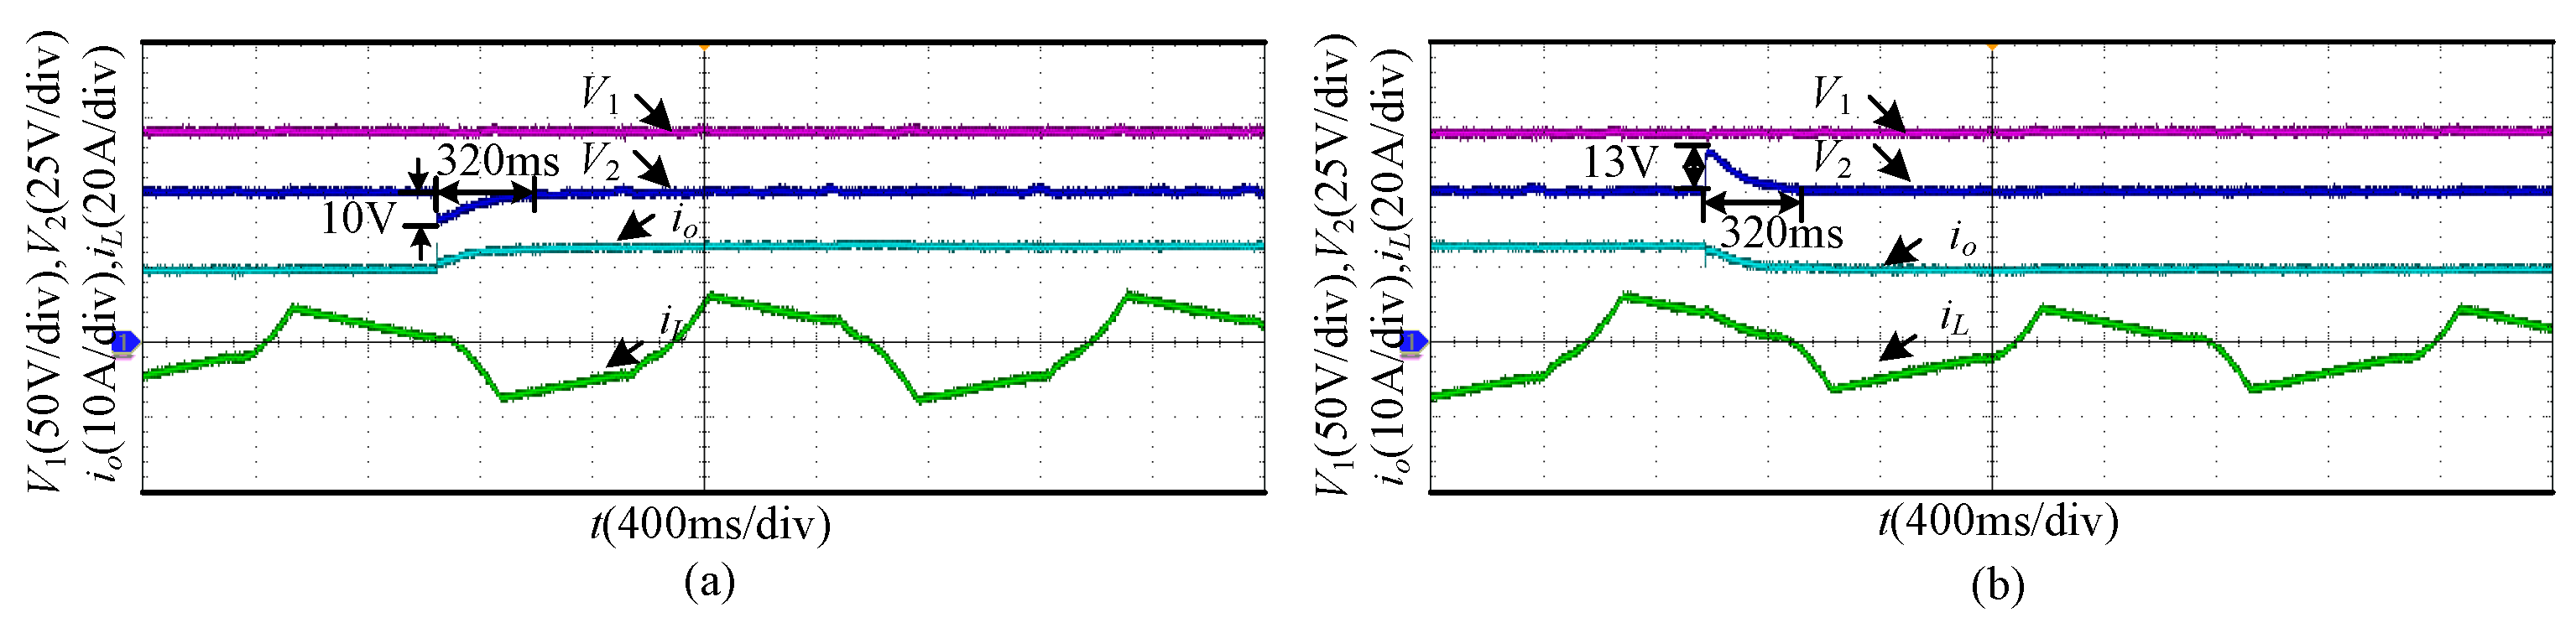
4.2. Dynamic Experimental Analysis

To verify the effectiveness of the MUOC strategy on improving the dynamic performance of the DAB converter, the proposed control strategy was compared with the traditional voltage closed-loop control strategy based on SPS control.
When the output voltage V 2 = 50 V , the load R = 5 Ω , and the input voltage V 1 was switched from 130 V to 120 V, Figure 9 shows the dynamic response waveforms of the DAB converter under the two control strategies. As can be seen from Figure 9a, after the input voltage fluctuation, the transient fluctuation amplitude of the output voltage under the traditional voltage closed-loop control strategy based on SPS control was about 4 V (8%), and the adjustment time was about 470 ms. Figure 9b shows the dynamic response waveform of the MUOC strategy under the step changes of input voltage. As can be seen from Figure 9b, even if the input voltage changed, the output voltage was almost constant. Compared with the traditional control strategy, the MUOC strategy could restrain the disturbance of input voltage.
In the case where the input voltage V 1 = 130 V , the output voltage V 2 = 50 V , and the load R was set as 5 Ω and 3.79 Ω , Figure 10a,b show the experimental waveforms of input voltage, output voltage, output current, and inductance current of the DAB converter under the traditional voltage closed-loop control strategy based on SPS control under the load steps change. As can be seen from Figure 10, the output voltage dropped by about 10 V (20%) and was stable again after about 320 ms when the load was decreased; the output voltage suddenly increased by about 13 V (26%), and the system was also stable after about 320 ms when the load was increased.
When the input and output state and load of the system remained constant, Figure 11 showed the experimental waveforms of the input voltage, output voltage, output current, and inductor current of the DAB converter based on the MUOC strategy under the load steps change. As can be seen from Figure 11, whether the load increased or decreased, the output voltage almost did not change, and the adjustment time was close to zero, which verifies the effectiveness of the proposed control strategy for improving the dynamic performance of the DAB converter.

5. Conclusions

To achieve current-stress reduction, the soft-switching operation of all switches, and the fast dynamic response of the DAB converter at the same time, an MUOC strategy based on TPS control was proposed in this study. Combined with the analytical model of current stress and soft-switching under three high-efficiency modes of TPS control, the current stress was optimized by CFO equation, and all switches could achieve ZVS; the virtual power component was constructed simultaneously, and the power control was used to improve the dynamic response of the DAB converter. Through theoretical analysis and comparative experiments, the following conclusions can be drawn as:
(1) The MUOC strategy minimizes the current stress over the entire power range, and makes all switches achieve ZVS, reducing the conduction loss and switching loss of the DAB converter at the same time.
(2) In the process of efficiency optimization, the MUOC strategy improves the dynamic response of the output voltage of the DAB converter in the case of step change in input voltage or load.

Author Contributions

Conceptualization, J.Z., Y.R. and Z.L.; methodology, J.Z., Y.R. and Z.L.; software, Y.R., B.L. and F.X.; validation, Y.R., B.L. and F.X.; data curation, Y.R. and B.L.; writing—original draft preparation, Y.R.; supervision, J.Z., Z.L. and D.H.; project administration, J.Z., Z.L. and D.H. All authors have read and agreed to the published version of the manuscript.

Funding

This research was funded by Natural Science Foundation of China, grant number 51807058, Natural Science Foundation of Hunan Province, grant number 2020JJ6082 and 2021JJ50059, and Postgraduate Innovation Fund of Hunan University of Technology under Grant, grant number CX2027.

Institutional Review Board Statement

Not applicable.

Informed Consent Statement

Not applicable.

Data Availability Statement

Not applicable.

Conflicts of Interest

The authors declare no conflict of interest.

References

  1. Zhao, B.; Song, Q.; Li, J.; Liu, W.; Liu, G.; Zhao, Y. High-Frequency-Link DC Transformer Based on Switched Capacitor for Medium-Voltage DC Power Distribution Application. IEEE Trans. Power Electron. 2016, 31, 4766–4777. [Google Scholar] [CrossRef]
  2. Liu, J.; Yang, J.; Zhang, J.; Nan, Z.; Zheng, Q. Voltage balance control based on dual active bridge dc/dc converters in a power electronic traction transformer. IEEE Trans. Power Electron. 2018, 33, 1696–1714. [Google Scholar] [CrossRef]
  3. Xue, L.; Shen, Z.; Boroyevich, D.; Mattavelli, P.; Diaz, D. Dual active bridge-based battery charger for plug-in hybrid electric vehicle with charging current containing low frequency ripple. IEEE Trans. Power Electron. 2015, 30, 7299–7307. [Google Scholar] [CrossRef] [Green Version]
  4. Zhao, B.; Song, Q.; Liu, W.; Sun, Y. Overview of dual-active-bridge isolated bidirectional dc–dc converter for high-frequency-link power-conversion system. IEEE Trans. Power Electron. 2014, 29, 4091–4106. [Google Scholar] [CrossRef]
  5. An, F.; Song, W.; Yu, B.; Yang, K. Model predictive control with power self-balancing of the output parallel dab dc–dc converters in power electronic traction transformer. IEEE J. Emerg. Select. Top. Power Electron. 2018, 6, 1806–1818. [Google Scholar] [CrossRef]
  6. An, F.; Song, W.; Yang, K.; Luo, S.; Feng, X. Optimised power control and balance scheme for the output parallel dual-active-bridge DC-DC converters in power electronic traction transformer. IET Power Electron. 2019, 12, 2295–2303. [Google Scholar] [CrossRef]
  7. An, F.; Song, W.; Yang, K. Direct power control of dual-active-bridge dc–dc converters based on unified phase shift control. J. Eng. 2019, 2019, 2180–2184. [Google Scholar] [CrossRef]
  8. Bhattacharjee, A.K.; Batarseh, I. Optimum Hybrid Modulation for Improvement of Efficiency Over Wide Operating Range for Triple-Phase-Shift Dual-Active-Bridge Converter. IEEE Trans. Power Electron. 2020, 35, 4804–4818. [Google Scholar] [CrossRef]
  9. Hu, Y.; Zhang, Y.; Chen, Q.; Zhang, T.; Guan, Q.; Liu, Y.; Jia, Y.; Yu, J. Efficiency Evaluation for DAB Converter with Reactive Power Minimization Strategy and Full ZVS Operation. In Proceedings of the 2019 IEEE Energy Conversion Congress and Exposition (ECCE), Baltimore, MD, USA, 29 September–3 October 2019. [Google Scholar]
  10. Shi, H.; Wen, H.; Chen, J.; Hu, Y.; Jiang, L.; Chen, G.; Ma, J. Minimum-backflow-power scheme of dabbased solid-state transformer with extended-phase-shift control. IEEE Trans. Ind. Appl. 2018, 54, 3483–3496. [Google Scholar] [CrossRef]
  11. Huang, J.; Wang, Y.; Li, Z.; Lei, W. Unified triple-phase-shift control to minimize current stress and achieve full soft-switching of isolated bidirectional dc–dc converter. IEEE Trans. Ind. Electron. 2016, 63, 4169–4179. [Google Scholar] [CrossRef]
  12. Hou, N.; Song, W.; Wu, M. Minimum-Current-Stress Scheme of Dual Active Bridge DC–DC Converter With Unified Phase-Shift Control. IEEE Trans. Power Electron. 2016, 31, 8552–8561. [Google Scholar] [CrossRef]
  13. Tong, A.; Hang, L.; Li, G.; Jiang, X.; Gao, S. Modeling and Analysis of a Dual-Active-Bridge-Isolated Bidirectional DC/DC Converter to Minimize RMS Current With Whole Operating Range. IEEE Trans. Power Electron. 2018, 33, 5302–5316. [Google Scholar] [CrossRef]
  14. An, F.; Song, W.; Yang, K. Improved dynamic performance of dual active bridge dc-dc converters using MPC scheme. IET Power Electron. 2018, 11, 1756–1765. [Google Scholar] [CrossRef]
  15. Hou, N.; Li, Y. Overview and comparison of modulation and control strategies for a nonresonant single-phase dual-active-bridge dc–dc converter. IEEE Trans. Power Electron. 2020, 35, 3148–3172. [Google Scholar] [CrossRef]
  16. Hou, N.; Li, Y. The Comprehensive Circuit-Parameter Estimating Strategies for Output-Parallel Dual-Active-Bridge DC–DC Converters With Tunable Power Sharing Control. IEEE Trans. Ind. Electron. 2020, 67, 7583–7594. [Google Scholar] [CrossRef]
  17. Song, W.; Hou, N.; Wu, M. Virtual Direct Power Control Scheme of Dual Active Bridge DC-DC Converters for Fast Dynamic Response. IEEE Trans. Power Electron. 2018, 33, 1750–1759. [Google Scholar] [CrossRef]
  18. Zhao, B.; Song, Q.; Liu, W. Efficiency Characterization and Optimization of Isolated Bidirectional DC–DC Converter Based on Dual-Phase-Shift Control for DC Distribution Application. IEEE Trans. Power Electron. 2013, 28, 1711–1727. [Google Scholar] [CrossRef]
  19. Gu, Q.; Yuan, L.; Nie, J.; Sun, J.; Zhao, Z. Current Stress Minimization of Dual-Active-Bridge DC-DC Converter Within the Whole Operating Range. IEEE J. Emerg. Sel. Top. Power Electron. 2019, 7, 129–142. [Google Scholar] [CrossRef]
  20. Tong, A.; Hang, L.; Li, G.; Guo, Y.; Zou, Y.; Chen, J.; Li, J.; Zhuang, J.; Li, S. Power flow and inductor current analysis of PWM control for Dual Active Bridge converter. In Proceedings of the 2016 IEEE 8th International Power Electronics and Motion Control Conference (IPEMC-ECCE Asia), Hefei, China, 22–26 May 2016. [Google Scholar]
  21. Jin, L.; Liu, B.; Duan, S. ZVS Soft Switching Operation Range Analysis of Three-Level Dual-Active Bridge DC–DC Converter Under Phase Shift Control Strategy. IEEE Trans. Ind. Appl. 2019, 55, 1963–1972. [Google Scholar] [CrossRef]
Figure 1. Topology of a DAB converter.
Energies 14 06444 g001
Figure 2. AC output voltage waveforms in different modes of TPS control: (a) mode 1, (b) mode 2, (c) mode 3, (d) mode 4, (e) mode 5, (f) mode 6.
Energies 14 06444 g002
Figure 3. Switching times and steady–state waveform of different modes under TPS Control: (a) mode 1, (b) mode 2, (c) mode 3.
Energies 14 06444 g003
Figure 4. The MUOC strategy.
Energies 14 06444 g004
Figure 5. Comparison curves of current stress under different control strategies.
Energies 14 06444 g005
Figure 6. Experiment platform.
Energies 14 06444 g006
Figure 7. Steady-state waveforms of different control strategies under heavy load: (a) the SPS control strategy, (b) the current-stress optimization control strategy of DPS control, (c) the MUOC strategy.
Energies 14 06444 g007
Figure 8. Steady-state waveforms of different control strategies under light load: (a) the SPS control strategy, (b) the current-stress optimization control strategy of DPS control, (c) the MUOC strategy.
Energies 14 06444 g008
Figure 9. Transient waveform of different control strategies when the input voltage steps change: (a) the traditional voltage closed-loop control strategy based on SPS control, (b) the MUOC strategy.
Energies 14 06444 g009
Figure 10. Transient waveform of the traditional voltage closed-loop control strategy when the load steps change: (a) the load steps from 5 to 3.79 Ω , (b) the load steps from 3.79 to 5 Ω .
Energies 14 06444 g010
Figure 11. Transient operating waveform of the MUOC strategy when the load steps change: (a) the load steps from 5 to 3.79 Ω , (b) the load steps from 3.79 to 5 Ω .
Energies 14 06444 g011
Table 1. The ranges of phase-shift ratio under TPS control.
ModeThe Ranges of Phase-Shift Ratio
mode 1 0 D 1 D 2 1 , D 1 D 3 1
mode 2 0 D 2 D 1 1 , D 1 D 3 1
mode 3 0 D 2 D 1 1 , 0 D 3 D 1
mode 4 0 D 1 D 2 1 , 1 + D 1 D 3 2
mode 5 0 D 1 D 2 1 , 1 D 3 1 + D 1
mode 6 0 D 2 D 1 1 , 1 D 3 1 + D 1
Table 2. ZVS range of modes 1–3 of TPS control.
ModeZVS Range
mode 1 S 1 / S 2 : i L ( t 0 ) 0 Q 1 / Q 2 : i L ( t 2 ) 0
S 3 / S 4 : i L ( t 1 ) 0 Q 3 / Q 4 : i L ( t 3 ) 0
mode 2 S 1 / S 2 : i L ( t 0 ) 0 Q 1 / Q 2 : i L ( t 1 ) 0
S 3 / S 4 : i L ( t 2 ) 0 Q 3 / Q 4 : i L ( t 3 ) 0
mode 3 S 1 / S 2 : i L ( t 0 ) 0 Q 1 / Q 2 : i L ( t 1 ) 0
S 3 / S 4 : i L ( t 3 ) 0 Q 3 / Q 4 : i L ( t 2 ) 0
Table 3. Minimum current stress of the DAB converter under different control strategies.
Control StrategyThe Range of Transmission PowerMinimum Current Stress
SPS control 0 p * 1 2 ( k 1 p * )
DPS control 0 p * k 2 + 2 k 3 / 2 k 2 2 p * ( k 1 ) ( k + 3 )
k 2 + 2 k 3 / 2 k 2 < p * 1 2 k ( 1 p * ) ( 2 k 2 4 k + 6 )
TPS control 0 p * 2 k 2 / k 2 2 2 p * ( k 1 )
2 k 2 / k 2 < p * 1 2 k 2 ( 1 p * ) ( k 2 2 k + 2 )
Table 4. Experimental platform parameters.
ParametersValue
Input voltage V 1 = 130 V
Output voltage V 2 = 50 V
Switching frequency f = 50 kHz
Turn ratio of transformer n = 26 / 15
Input DC capacitor C 1 = 510 μ F
Output DC capacitor C 2 = 510 μ F
Series inductor L = 30 μ H
Publisher’s Note: MDPI stays neutral with regard to jurisdictional claims in published maps and institutional affiliations.

