Article

Hybridizing Lead–Acid Batteries with Supercapacitors: A Methodology

1
Department of Electrical and Electronic Engineering, Imperial College London, London SW7 2AZ, UK
2
Department of Mechanical Engineering, Imperial College London, London SW7 2AZ, UK
3
Department of Chemical Engineering, Imperial College London, London SW7 2AZ, UK
4
Dyson School of Design Engineering, Imperial College London, London SW7 2AZ, UK
*
Author to whom correspondence should be addressed.
Energies 2021, 14(2), 507; https://doi.org/10.3390/en14020507
Submission received: 18 December 2020 / Revised: 11 January 2021 / Accepted: 13 January 2021 / Published: 19 January 2021

Abstract

:
Hybridizing a lead–acid battery energy storage system (ESS) with supercapacitors is a promising solution to cope with the increased battery degradation in standalone microgrids that suffer from irregular electricity profiles. There are many studies in the literature on such hybrid energy storage systems (HESS), usually examining the various hybridization aspects separately. This paper provides a holistic look at the design of an HESS. A new control scheme is proposed that applies power filtering to smooth out the battery profile, while strictly adhering to the supercapacitors’ voltage limits. A new lead–acid battery model is introduced, which accounts for the combined effects of a microcycle’s depth of discharge (DoD) and battery temperature, usually considered separately in the literature. Furthermore, a sensitivity analysis on the thermal parameters and an economic analysis were performed using a 90-day electricity profile from an actual DC microgrid in India to infer the hybridization benefit. The results show that the hybridization is beneficial mainly at poor thermal conditions and highlight the need for a battery degradation model that considers both the DoD effect with microcycle resolution and temperate impact to accurately assess the gain from such a hybridization.

1. Introduction

Among the Sustainable Development Goals (SDGs) established by the United Nations General Assembly in 2015 [1], SDG 7 aims at affordable, reliable, sustainable and modern energy access for all. Microgrids are a key technology to this end, and have seen recently remarkable expansion in isolated rural areas around the world with limited or no access to the main electric grid. The typical standalone microgrid utilizes renewable or other local energy sources to provide electricity in places where long-distance power transmission and substantial grid investments are deemed uneconomical [2]. An irreplaceable component of these miniature power grids is the energy storage system (ESS), whose main role is to ensure power quality and energy balance between the intermittent supply and demand [3,4]. Batteries are the most widely used energy storage technology in microgrids, mainly due to their scalability, modularity and limited maintenance needs. Lead–acid batteries, in particular, remain to this day the most commonly found battery technology in operating microgrids, being the most commercially mature. A big challenge in these ESS, however, is battery degradation due to deep discharge and surge currents often found in standalone microgrids supplied by intermittent renewables supply, such as solar [5]. For example, lead–acid batteries under high charge/discharge rates suffer from the formation of smaller sulphate crystals that lead to inhomogeneous current distribution and increased internal resistance, all of which have a negative impact on battery life [6]. To this day, the longevity and associated replacement costs of batteries remain one of the most critical factors for the economic viability of an off-grid microgrid investment.
To overcome these challenges, the scientific community has explored in the last decade how to hybridize a battery ESS with other storage technologies, such as supercapacitors [7,8,9,10,11,12,13,14], fuel cells [15,16] and flywheels [17], to come up with a more reliable hybrid energy storage system (HESS) that features longer lifespan and higher resistance to degradation. Supercapacitors (or ultracapacitors) are deemed among the most suitable coupling candidates, as they exhibit high power density (though low energy density) and complementary characteristics to electrochemical batteries [18,19]. They can readily support high charge/discharge rates as often as required with negligible impact to their life, which typically exceeds a decade [20]. For this reason, they couple nicely with batteries in absorbing the sudden changes in power demand that allows for a smoother power profile to the batteries and reduced deterioration. Furthermore, the two energy storage technologies exhibit relatively similar operating principles as they are both electrochemical devices, which translates to similar low set-up costs [2]. Furthermore, the long-term operation and maintenance (O&M) costs of supercapacitors are lower than those of batteries [21]. This paper takes a deep look on how to hybridize an ESS with lead–acid batteries and supercapacitors, providing recommendations for the topology selection, the design of the control scheme, the battery degradation modeling and economic viability analysis of the investment.
The state of the art in HESS topologies involves mainly three different configurations of batteries and supercapacitors: passive, semi-active and fully active [2,7]. The most appropriate topology for an application is selected based on factors such as the set-up cost, efficiency, controllability, system complexity and utilization rate. The passive HESS is the simplest and cheapest topology, according to which the batteries and supercapacitors are directly coupled in parallel at the DC link without any power electronics or control [8,9]; this approach is widely applied in high voltage ESS, benefiting from low internal losses and reduced system complexity. However, this way the supercapacitors voltage varies little and their capacity is severely underutilized, which entails only limited extension of the battery life. Furthermore, this approach faces also challenges related to impedance matching between the batteries and supercapacitors. The semi-active configuration, on the other hand, employs power electronics in either batteries or supercapacitors—not both—to expand the operating region of the latter [10,
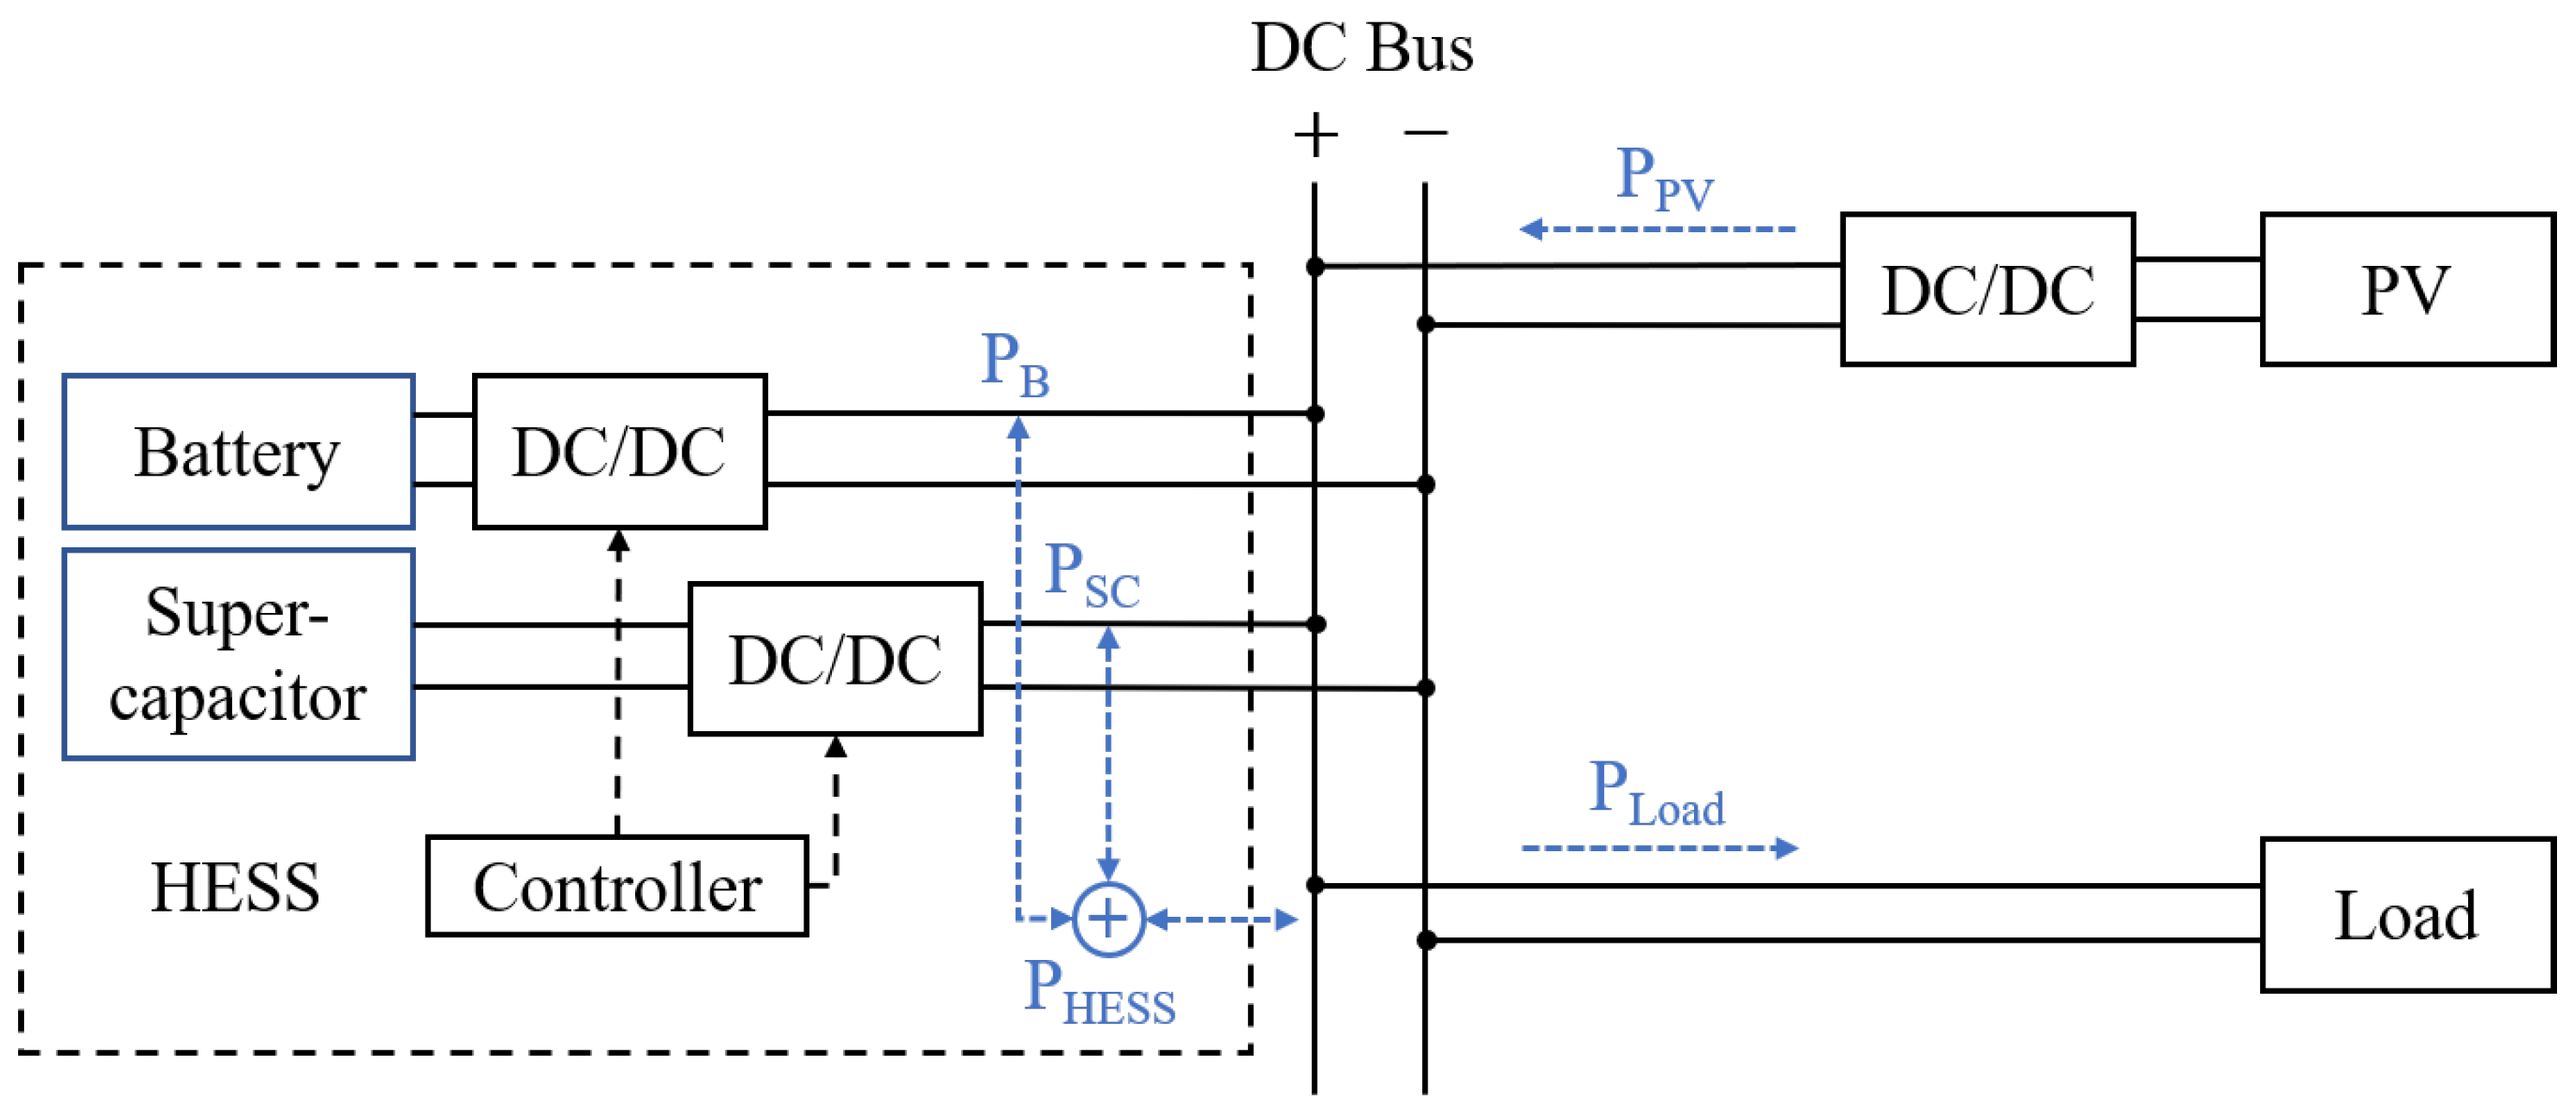
11]. With this approach, one of the two storage devices is effectively isolated, thus allowing for more flexible power allocation between the two. Nonetheless, the passive element may suffer from surge currents—if it is the battery—or cause bus voltage fluctuation and negatively impact the power quality—if it is the supercapacitors. The third option of fully active configuration tackles all these issues. Usually a parallel connection is adopted [5,12,13,14], but cascade implementations are also reported [22]. The big gain with this topology is effective decoupling of the two components permitting independent control during operation and separate sizing at the design phase. Especially for DC standalone microgrids, this is a viable option for getting the energy storage mix right and extending the HESS lifespan as much as possible. It is worth noting that there are some recent alternatives that involve distributed hybridization combined with active balancing, achieved by incorporating supercapacitors into the balancing bus in order to enable cell-level hybridization [23]. However, this is still a new and more complex solution, so far targeted only at Li-ion batteries in e-mobility applications. Therefore, this paper adopts the fully active HESS method as the most appropriate for isolated DC microgrids.
Various philosophies exist in the literature regarding the control strategy of fully active HESS to allocate the power flows between the batteries and supercapacitors and maintain the system stability. These control strategies, commonly referred to as energy management systems (EMS), may involve power filtering [5,14,24,25,26], deterministic rule-based control [13,27], fuzzy logic [10,28] and optimization-based control [29,30,31]. In [28], a fuzzy logic rule-based control is applied to a HESS to ensure that the ESS elements operate in the safe region. Alternatives employing neural networks [29] and model predictive control [30,31] are based on multi-objective or cost functions that aim to optimize the power allocation. A combination of the rule-based concept with optimization algorithms is proposed in [27]. However, the aforementioned approaches employ sophisticated algorithms that require large amounts of input data and complex mathematical calculations, which have acted as barriers towards wider adoption. By contrast, the power filtering approach has proven quite popular, as it is both effective and easy to implement. It has been also shown that a simple filter-based control is effective in off-line sizing applications as well, yielding very similar results to more complex, non-causal, optimization control approaches as long as battery model accounts for sufficiently complex dynamics [32]. Given these considerations, this paper focuses on the power filtering method.
There are many studies on power filtering in the literature. Somayajula et al. in [
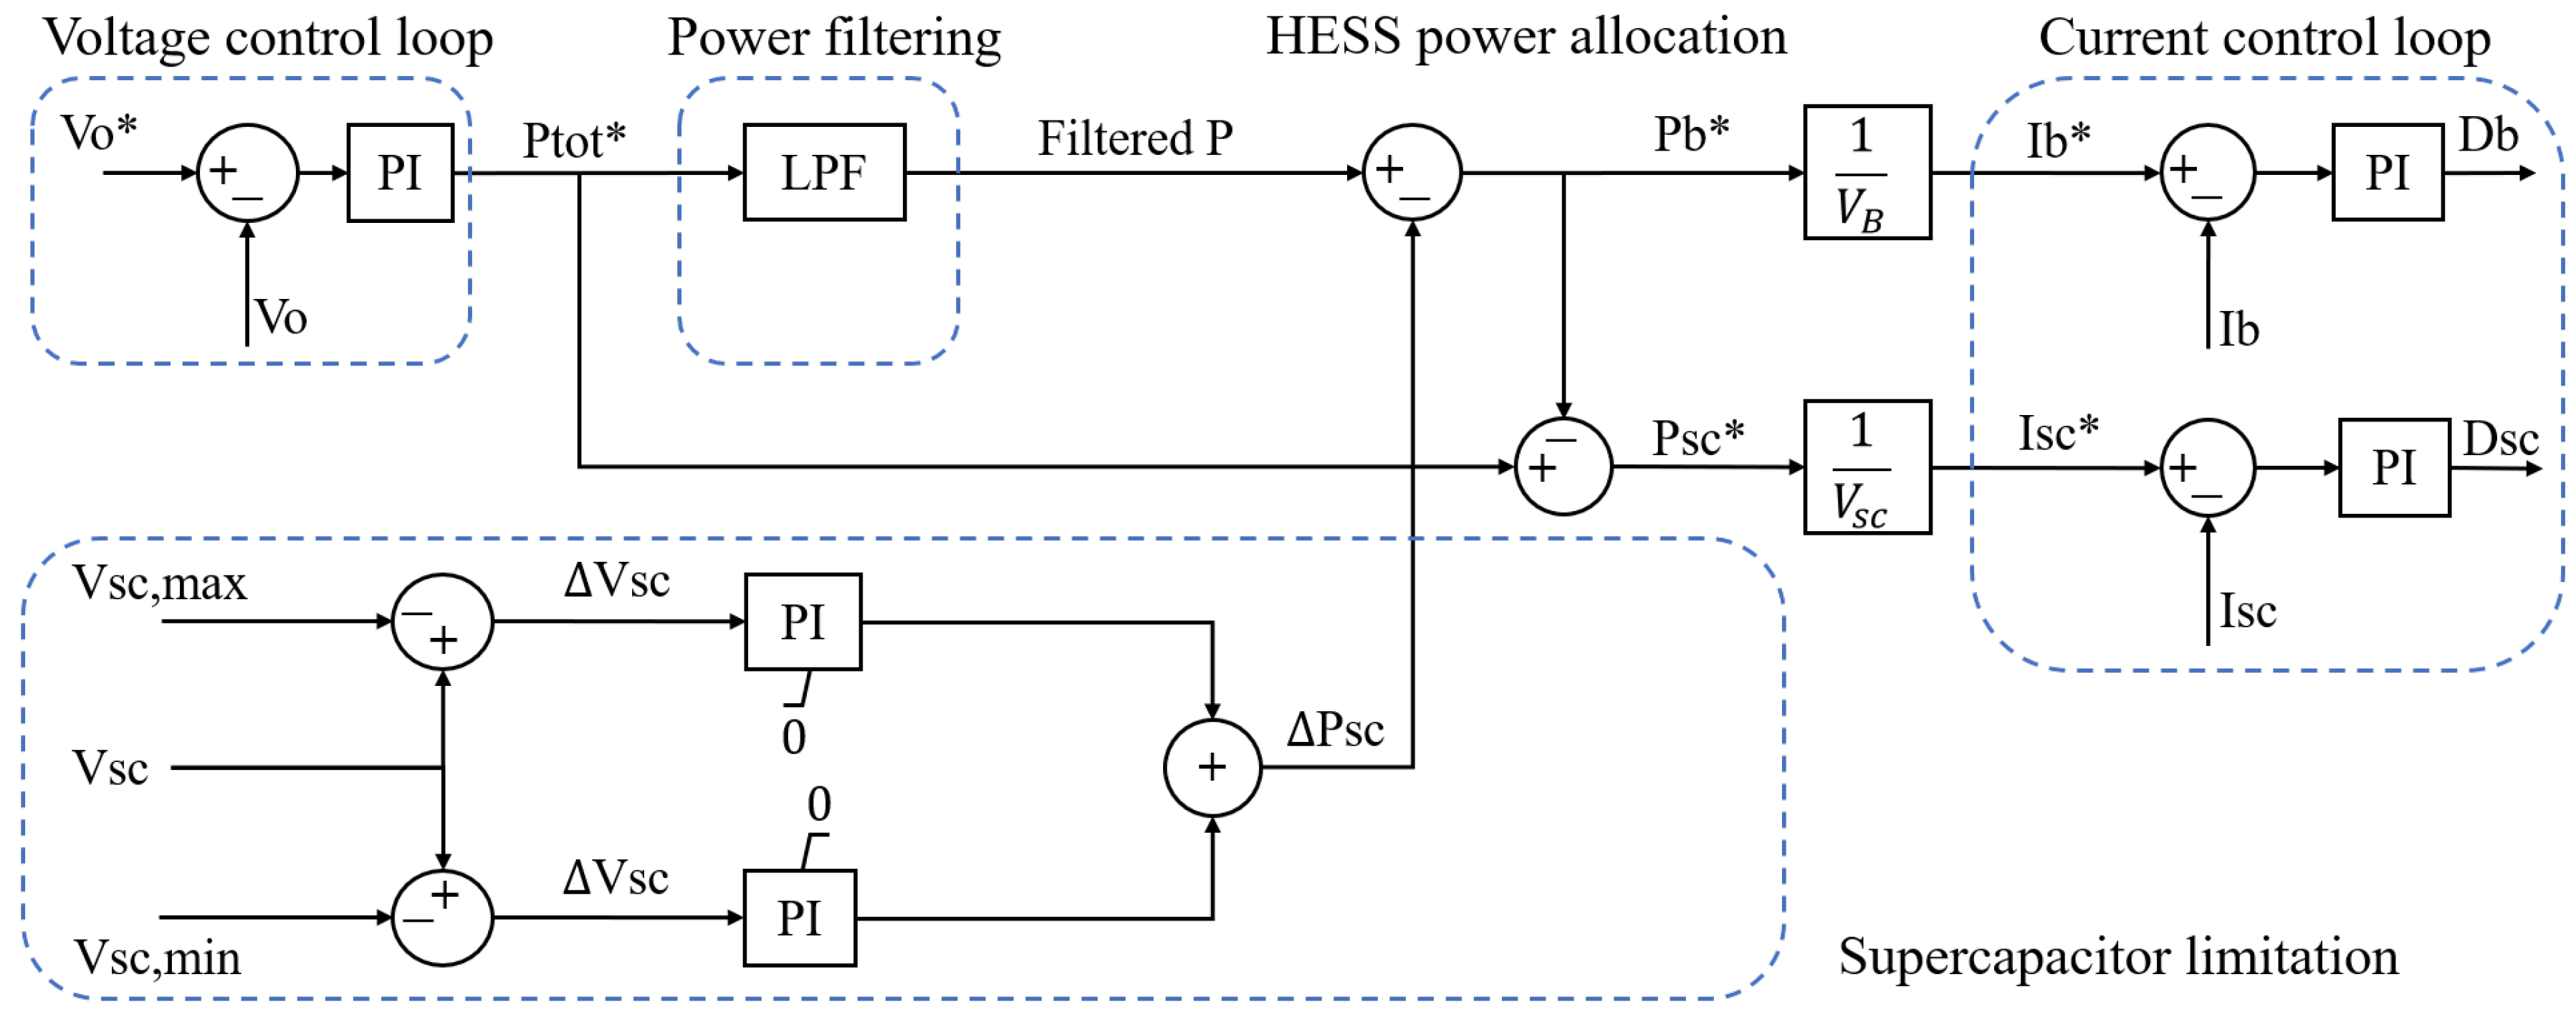
33] demonstrated an active supercapacitor control scheme to achieve smoothing of intermittent renewables generation; the adopted cascade control comprising an outer voltage loop and an inner current loop has been also applied to battery-supercapacitor hybrid systems to ensure power quality. Decoupling the high frequency part of the power control using a first-order low-pass filter (LPF) is proposed in [5,14,24,
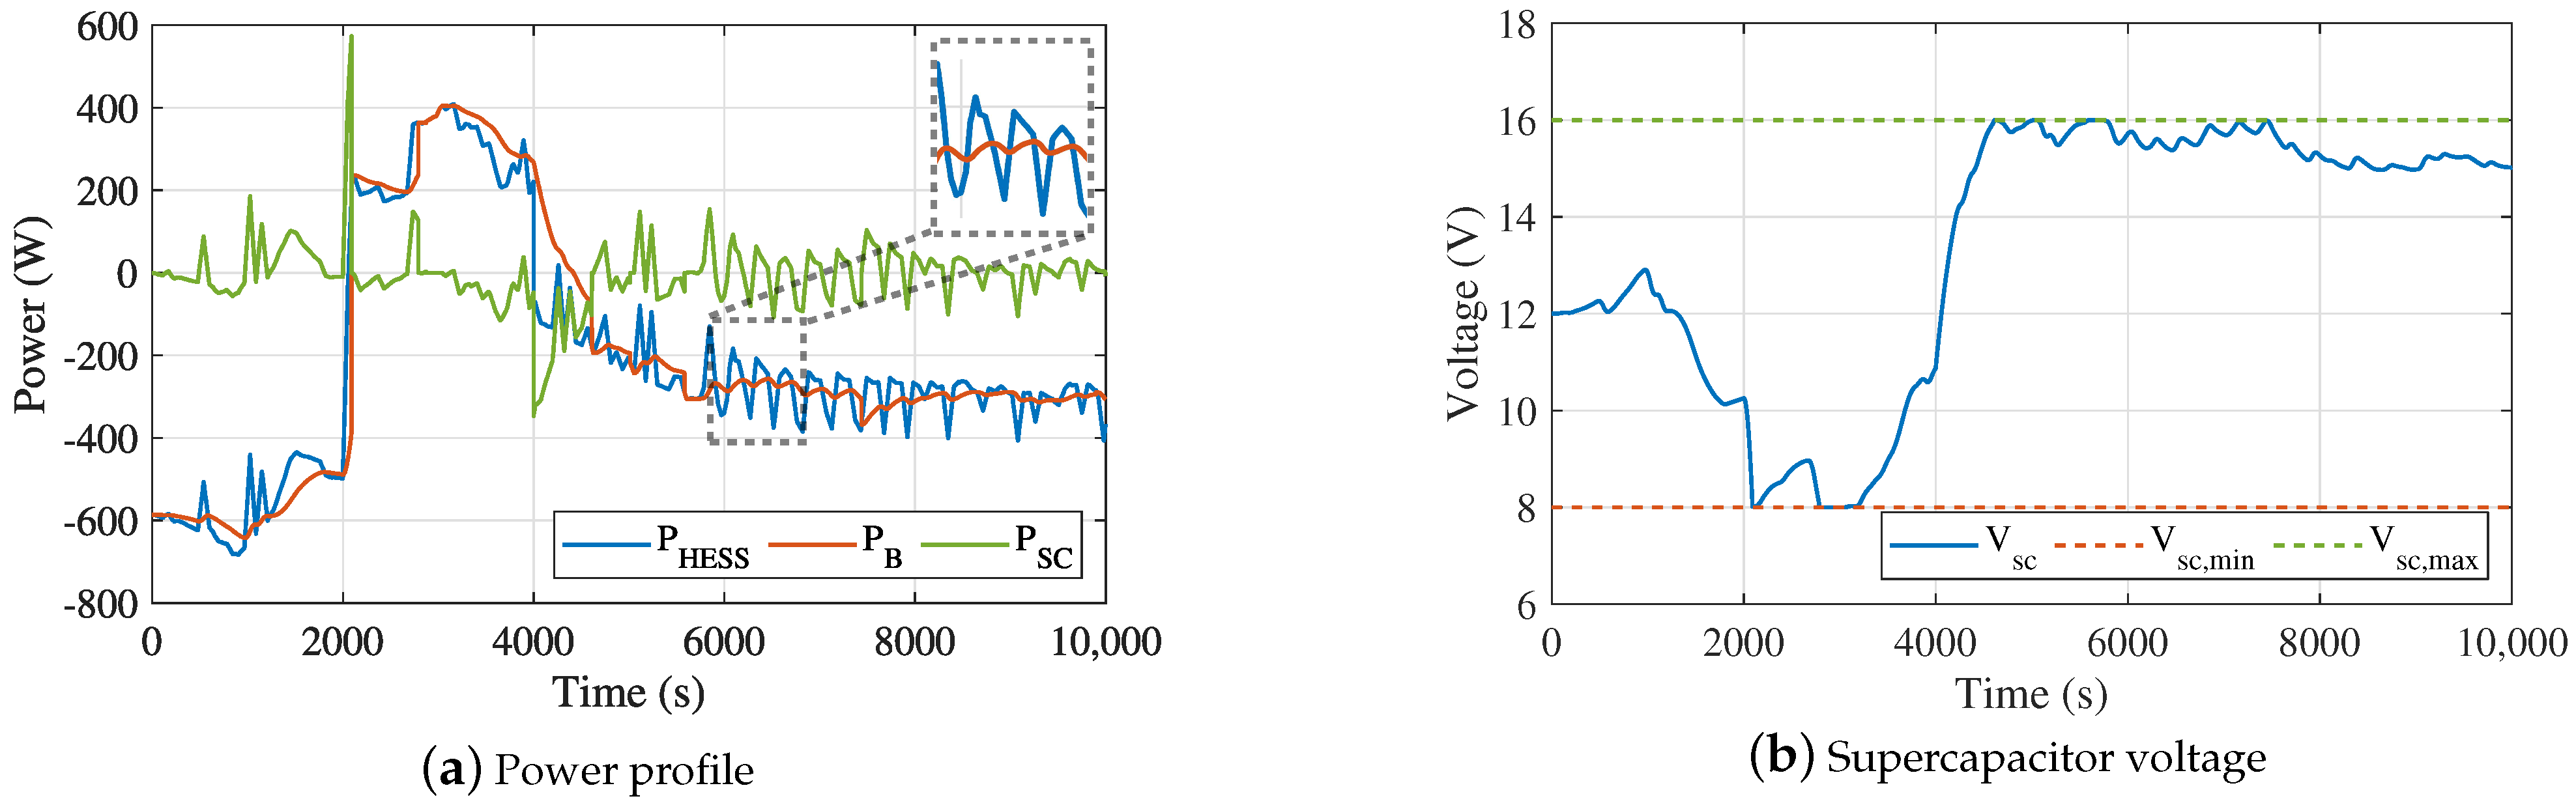
25]. However, these studies do not properly consider the safe operating region of the ESS components. Especially for the supercapacitors, their low energy density and high charge/discharge rates lead to highly volatile voltage; if not properly contained within the safety limits, this may result in irreversible damage if overcharged (e.g., voltage exceeding the structural limits) or power converter malfunction if left uncharged (e.g., power converter not managing to step-up the low input voltage). To this end, State of Charge (SoC) controllers are proposed in [26,34], which however aim to maintain the energy of the supercapacitors around the reference level and do not directly control the voltage. This may occasionally result in voltage out of limits due to SoC miscalculation caused by various factors, such as parasitic resistances or capacitance deviation due to aging and deterioration. To this day, a complete control scheme for hybrid batteries-supercapacitors systems based on power filtering that strictly adheres to the supercapacitor voltage limits is missing from the literature.
To evaluate the contribution of the hybridization to the battery lifespan, the battery degradation needs to be captured and modeled. There are three different degradation modeling philosophies in the literature: physical-mechanistic models, empirical models and data-driven models [35,36,37]. Physical-mechanistic models are generally based on electrochemical aging processes inside the battery and involve physics-inspired differential equations. For example, Dufo-López et al. in [35] consider the phenomena of internal corrosion of the battery and aging of the active material to quantify the capacity loss. Although very well-aligned with the physics, these models require many unknown parameters and laborious computations that limit their applicability only to research purposes. The empirical models, on the other hand, entail simpler mathematical functions and coefficients extracted from fitting to experimental results. This makes this approach more effective and practical, except that it requires lots of experimental data to capture a wide range of operating conditions and degradation factors. Making assumptions for untested conditions, to make up for missing data, may introduce uncertainty in the results [36]. A popular extension of this category are the cycle-counting models [38]; by adopting the principle of fatigue damage, these models measure the degradation for each cycle of use assuming that the aging factors are independent and cumulative. This allows for a more abstract and universal model structure that relies on limited empirical information usually available in the manufacturer datasheet. Examples of such quantitative cycle-counting models may be found in [6,14,22,39,40,41,42]. The third category of data-driven degradation models apply statistical analysis and machine learning on a large database to predict the battery status and extract patterns to quantify the lifespan [37,43]. These methods are not yet widely used due to their dependence on large datasets and sophisticated implementation. This paper, therefore, adopts the cycle-counting empirical approach due to practicality and wide acceptance in the field.
The battery ages and degrades over time mainly due to (i) calendar aging, i.e., capacity decrease under idle conditions, and (ii) cycle life aging, i.e., degradation during usage [44]. In standalone microgrids, the ESS is in continuous operation and the latter type of aging prevails; this is why the degradation model of this paper focuses on cycle life aging, as generally done in HESS studies. This type of deterioration can be manifested as corrosion of positive grid, hard/irreversible sulfation and shedding [45]. The most prevalent failure mode for lead–acid batteries in standalone stationary systems is the former, also known as anodic corrosion [46], which used to be a major problem in early design, thereafter overcome by the adoption of improved grid alloys. The corrosion rate is accelerated by high temperatures, extreme voltages and cycling operation (versus constant current operation) [46]. Primary factors of this degradation are the depth of discharge (DoD) (i.e., how deeply the battery is discharged), the charge/discharge rates and the battery’s operating temperature [
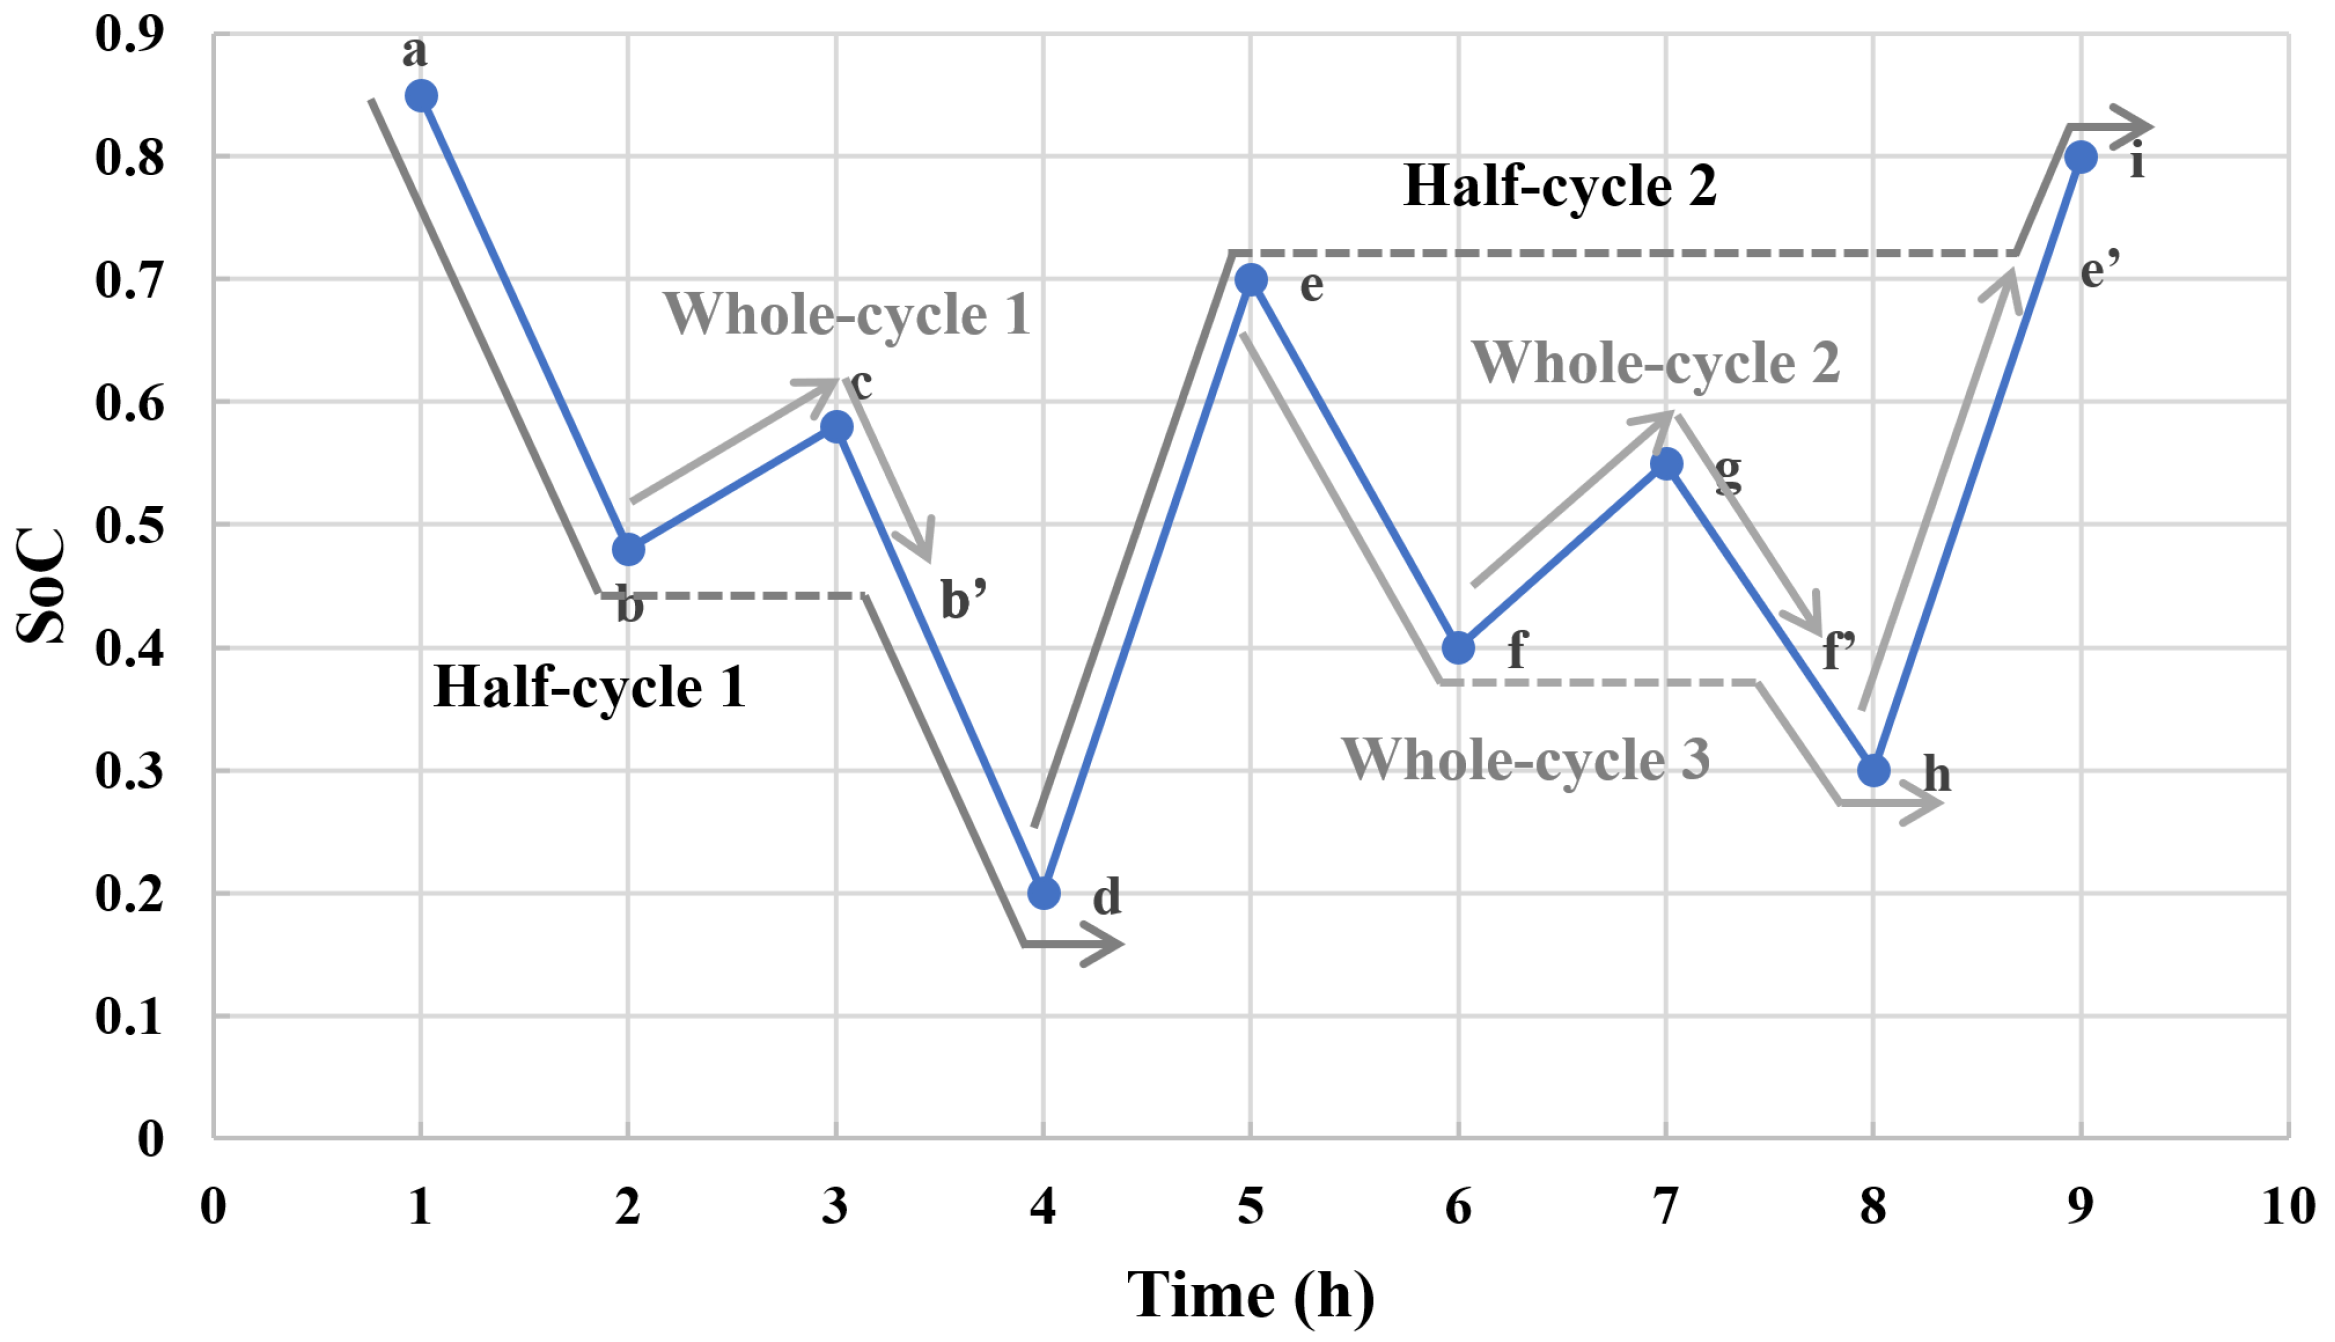
6]. Most relevant models take into account only the DoD factor and employ a cycle-counting method, such as the rainflow counting method [6,40], to capture the number and depth of the cycles [42,47]. However, these models are designed for moderate and deep discharge cycles (e.g., more than 10%) and may fail to accurately capture the effect of smaller cycles, i.e., microcycles, often found in off-grid microgrids with irregular power flows due to intermittent supply and demand [14,
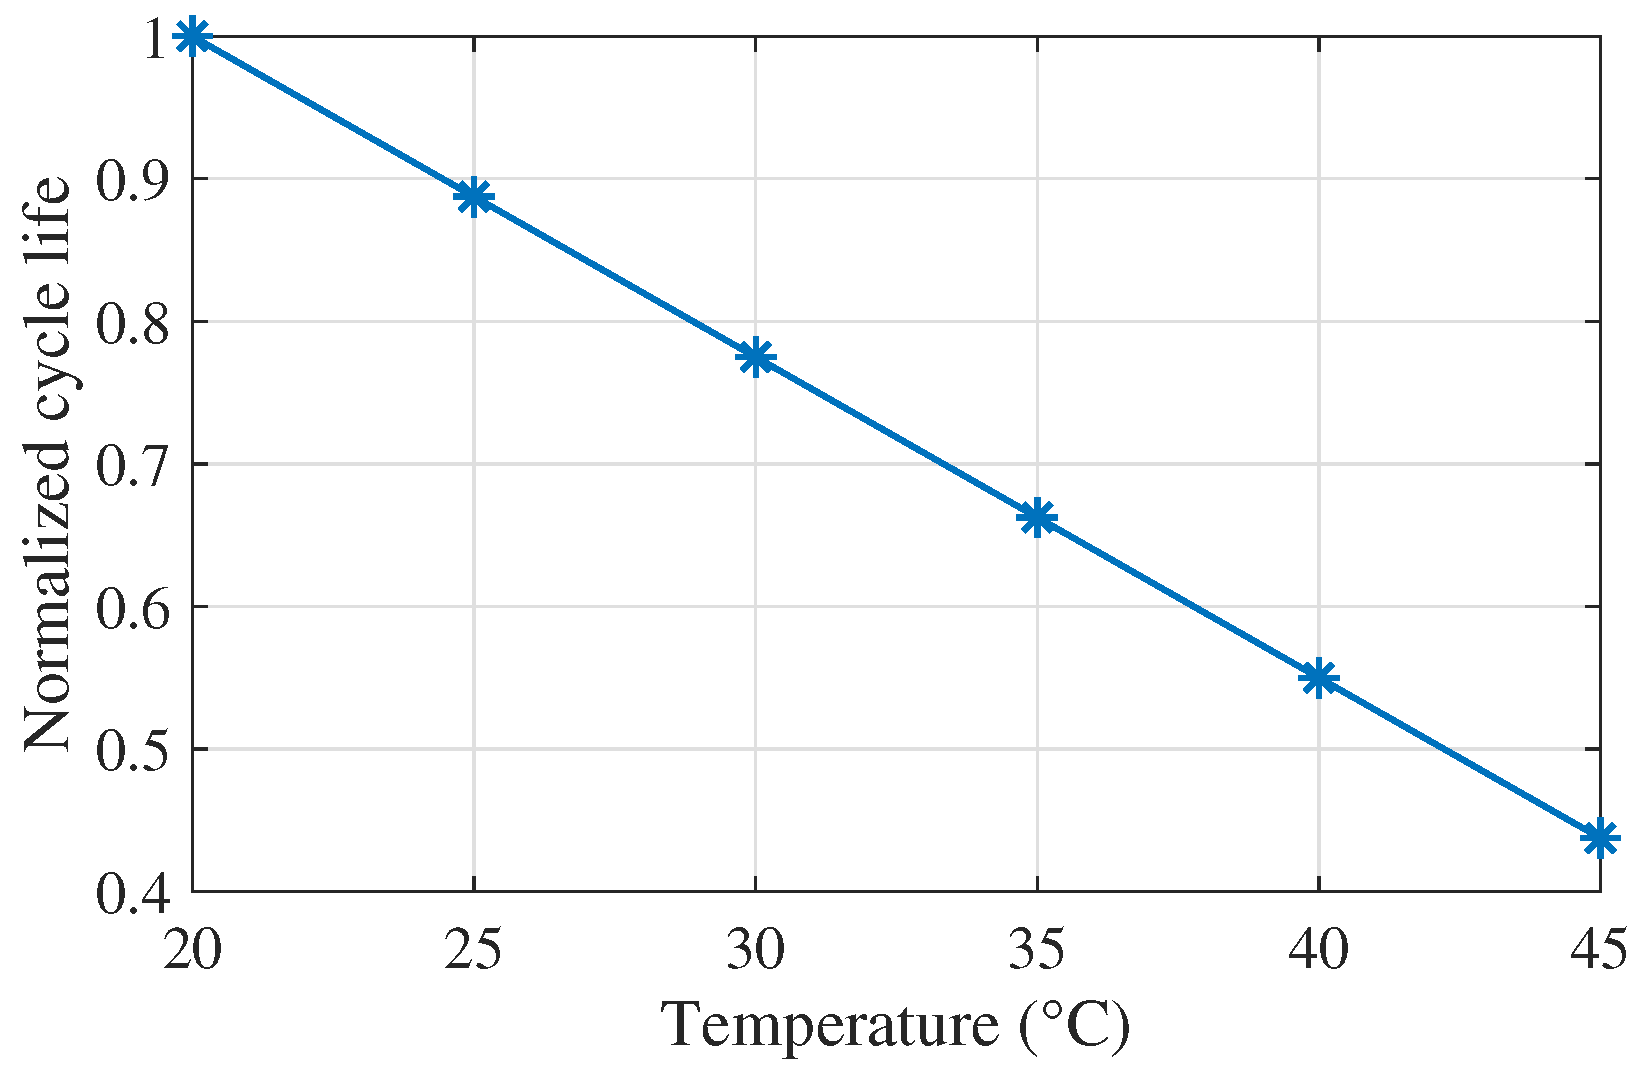
22]. The case study of this paper show that it is imperative to employ a microcycles DoD model when there is access to high time-resolution electricity data (e.g., second resolution) in order to accurately capture the DoD degradation. Furthermore, battery temperature is also an important stress factor to battery degradation, usually studied separately from the DoD effect [48]. The investigation in this paper demonstrates that the two factors are strongly related in the presence of microcycles and rapidly changing battery currents. Narayan et al. [38] have proposed a model that combines both DoD and temperature effects, albeit following an alternative dynamic capacity fading approach that is too complicated for classical cycle counting and fundamentally differs from the aforementioned mainstream DoD models. There is still a need in the literature for a lead–acid battery degradation model that accounts for the combined effect of microcycles DoD and temperature.
In applications of lead–acid battery and supercapacitor hybrid systems, the selection of energy storage components mainly depends on the availability, system size and cost. Lead–acid batteries are the industry standard for small-scale standalone photovoltaic (PV) systems, both in valve-regulated and flooded deep-cycle designs [49]. The batteries are usually connected in series to meet the system voltage requirements, and then several strings are added in parallel to meet the required capacity. Twelve-volt batteries are considered the most cost-effective solution for systems comprising up to 4–6 parallel strings, and two-volt batteries are usually preferred for larger systems. Suggestions on the selection of lead–acid battery types in different scenarios are given in [49], where there is a need to strike a balance between lifespan, cost and energy density. The supercapacitors are commercially available in modules, consisting of several cells connected in series; the maximum voltage of a single cell is usually 2.7 V. For the selection of supercapacitors, the capacity is determined by the maximum energy variation required by the system and its operating voltage range [26]. As supercapacitors are much more expensive than batteries, a thorough cost-benefit analysis should take place to come up with the appropriate size of the two components.
The aim of this paper is to propose a complete methodology to hybridize a lead–acid battery ESS with supercapacitors for standalone DC microgrids. A new power allocation control scheme and battery degradation model are proposed to accurately capture and maximize the battery life extension due to hybridization. A thorough techno-economic analysis takes place based on a 90-day electricity dataset from a real-life 4.8 kW standalone microgrid installed in rural India, to determine the viability of the hybridization at six different scenarios. The main novel points of this study are as follows:
  • A complete ESS hybridization methodology is developed, including the control design, battery degradation and economic viability analysis, while the results are based on data from a real-life DC microgrid.
  • A new power allocation control scheme is proposed, based on power filtering that strictly abides by the supercapacitors’ voltage operating limits.
  • A new degradation mechanism model for lead–acid batteries (or simply "battery degradation model") is introduced that accounts for the combined effect of microcycles DoD and battery temperature, appropriate for high time-resolution profiles.
The structure of the paper is as follows. Section 2 presents the control scheme and power filtering method that respects the supercapacitors’ voltage limits, while the new battery degradation model that accounts for both DoD and temperature impact is given in Section 3. In Section 4, the real-life case study of this paper is detailed, followed by a sensitivity analysis on the thermal parameters. Section 5 discusses the economic benefit from the hybridization at six different scenarios and Section 6 concludes this study.

2. Topology and Control Strategy of the HESS

The HESS under consideration corresponds to the case-study 24 V DC microgrid described in Section 4. Figure 1 shows a simplified diagram with aggregated PV generation and load that involves the proposed parallel, fully-active HESS. Both the battery bank and supercapacitors bank have their own bidirectional DC/DC converter to allow separate power flows according to the controller. The objective of the controller is multi-fold: to regulate the DC link voltage and maintain the power balance in the microgrid, whilst cleverly allocating the power demand between the two storage components to smooth out the battery power profile but respecting the supercapacitor voltage limits. The details of the topology and control strategy follow.

2.1. The Fully Active Topology

Among various HESS configurations, the parallel, fully-active topology allows for maximum flexibility when designing and operating the system. This flexibility, however, comes at the cost of an additional DC/DC converter for the supercapacitors on top of the one used for the batteries. Nonetheless, given the low DC bus voltage of 24 V, a simple bidirectional two-quadrant converter is sufficient to step-up the supercapacitors’ voltage (8–16 V in this paper), which is an effective and economical solution [5]. It is also worth noting that the power rating of the supercapacitor converter is lower than the batteries’ one, here sized at about 30% of the ESS rated power for the case study of Section 4. At any time, the HESS maintains the power balance in the microgrid by supporting any deviation between PV generation P P V and load P L o a d with power P H E S S , the latter consisting of the batteries P B and supercapacitors P S C contribution. The level of these contributions at any time is determined by the controller detailed in the following section.

2.2. Control Strategy

Figure 2 depicts the overall control strategy designed for the HESS. It comprises three main parts: the outer voltage control loop, the power allocation mechanism and the inner current control loop. The outer voltage control loop regulates the DC bus voltage V o to the reference V o * by calculating the total reference power P t o t * that the HESS needs to inject (if positive) or consume (if negative) to maintain the power balance in the microgrid. The power allocation scheme then splits P t o t * to the two components fed into the battery P b * and supercapacitor P s c * ; the battery undertakes a low-pass-filtered version of P t o t * , possibly adjusted by Δ P s c when the supercapacitors operate close to their limits, and the remaining goes to the supercapacitors. Finally, these reference power values are converted to reference currents I b * and I s c * that drive the inner loop current controllers in adjusting the duty cycle D b and D s c of the separate DC/DC converters. The power filtering and supercapacitor voltage limitation scheme are described in more detail below.

2.2.1. Power Filtering

Supercapacitors have several features, such as fast dynamics, long cycle life and low internal resistance, which make them ideal to deal with the high-frequency power components of the load. Although some studies indicate capacitance drop for high frequencies of operation [50], they remain very useful in absorbing the high charge/discharge rates to protect the batteries. To this end, a low pass filter (LPF) is employed here to disaggregate P t o t * to the slow-changing P b * and fast-changing P s c * . The simplest approach for the LPF would be a first-order continuous time filter, with a transfer function
H ( s ) = 1 1 + T · s
where T is the time constant. The higher the time constant, the better the filtering, albeit requiring larger capacity from the supercapacitors; if it is too high, their capacity may be quickly outspent, effectively disabling them for large periods of time. A discussion on the selection of the time constant follows in Section 2.3.
High-order filters generally perform better in cutting high-frequency signals and have been employed in power filtering of energy storage systems in the literature [24,51]. There are two broad categories of digital filters: finite impulse response (FIR) filters and infinite impulse response (IIR) filters, based on the time domain characteristics of their impulse response functions. Generally, high-order IIR filters are seen to exhibit convergence and stability issues, which is in contrast to FIR filters that feature low phase distortion and are always stable without feedback loops [51,52,53]. Therefore, the second filter alternative considered in this study is an FIR filter, expressed in the z-domain as
H ( z ) = n = 0 N 1 h [ n ] z n
and in the discrete time domain as
h [ n ] = h d [ n ] ω [ n ] = s i n ( n ω c ) n π ω [ n ]
where ω [ n ] represents a window function. The window function (e.g., Hamming window [54], Kaiser window [55]) is used in cutting of the low-pass infinite pulse to obtain the FIR coefficients. The design parameters of an FIR filter are the filter length N and the cut-off frequency ω c .
A important feature of a high-order FIR filter is the group delay, directly related to the length of the window N [52]. High-length windows yield better low-pass filtering performance, albeit with a larger group delay. However, such delays lead to power lags that need to be accommodated by the supercapacitors, which may lead to power oscillations and suboptimal performance in some cases, as shown in Section 2.3. Selection of the FIR filter length and cutoff frequency is a delicate procedure that needs to strike a balance between the filtering effect and group delay.

2.2.2. Supercapacitor Voltage Limitation

The supercapacitors’ voltage varies substantially during normal operation due to their strong coupling with the stored energy: to fully charge, the voltage needs to get to the nominal value; to fully discharge, the voltage should decrease as low as possible. This variation, however, must abide by certain safety limits V S C , m i n V S C V S C , m a x to account for structural characteristics of the supercapacitors and input voltage limitations of the power converter.
Take the supercapacitor module used in this case study (see Section 4) as an example [56]. The maximum voltage V S C , m a x is set to the nominal value of 16 V (6 cells in series—about 2.7 V per cell), while the minimum value V S C , m i n is selected as 8 V, so that the DC/DC converter is required to boost the voltage up to three times to reach the target 24 V. Past experience has shown that the conduction and switching losses of such converters skyrocket for conversion ratios of higher than three [57], which entails inefficient operation or even inability of the power converter to step-up the voltage. Within this voltage range, the usable energy capacity portion of the supercapacitor E S C would be
E S C = 1 2 C V S C , m a x 2 1 2 C V S C , m i n 2 1 2 C V S C , m a x 2 = 16 2 8 2 16 2 = 75 %
Utilizing 75% of the available energy is quite reasonable, especially given the simple and economical power converter employed.
To enforce adherence of these limits, the supercapacitor limitation scheme of Figure 2 is used. The main idea is to compensate for any voltage violation by adjusting the battery power P b * by a signal Δ P S C . Δ P S C will be zero while operating within limits, but it will get positive values when the supercapacitors voltage exceed the upper bound (need to discharge) or negative values when it goes below the lower bound (need to charge). To this end, two PI controllers are employed with appropriate saturation limits and anti-windup mechanisms, each undertaking regulation around one of the two voltage limits. While voltage is in the safe region, both PI controllers are driven to their zero saturation bound, thus exporting zero Δ P S C ; when V S C > V S C , m a x , the upper PI controller gets activated while the lower controller remains stuck at zero, which brings the voltage back to V S C , m a x ; when V S C < V S C , m i n , the opposite happens and the lower PI controller regulates the voltage back into the safe region. Notably, the anti-windup mechanism is crucial for this control scheme, so that the controllers can "unstick" from saturation immediately after the voltage gets out of bounds. Here, the clamping anti-windup method has been employed, but other anti-windup alternatives will work equally as well.

2.3. Energy Management System Results

This section evaluates the proposed control scheme on a 10,000-s electricity profile from the study-case system detailed in Section 4. The following results have been produced through simulations in MATLAB/Simulink. As a benchmark, the conventional battery-alone ESS is considered first, as shown in Figure 3. The entire power demand P E S S is taken care of solely by the batteries P B , resulting in high-frequency power fluctuation that accelerates the battery degradation. Please note that positive and negative power values indicate discharging and charging respectively, while small deviations between P E S S and P B are due to power losses.
The same power profile is applied to a HESS employing different power filters, as shown in Figure 4, Figure 5 and Figure 6. A simple first-order LPF with a small time constant of 50 s yields a smoother battery power profile P B in Figure 4a, as the supercapacitors absorb the fast-changing component P S C . It is worth noting that the mean value of P S C is not far from zero, which leads to limited supercapacitor voltage variation in Figure 4b, well within the safe operating region.
When increasing the time constant to 300 s, the power profile of the battery becomes clearly smoother in Figure 5a, albeit at the cost of risking voltage going out of limits in Figure 5b. As explained by Equation (4), there is strong relation between the energy stored in the supercapacitors and their terminal voltage. For the selected supercapacitor module [56], the absolute maximum voltage is 17 V, which creates a safety margin of 1 V above the 16 V nominal voltage. In addition, the lower voltage bound of 8 V set is not really a strict limit; the power converter can readily operate slightly lower, e.g., at 7 V, for a short time, temporarily resulting in more losses that will not however risk the system integrity for a few seconds. This safety margin of 1 V from the upper and lower voltage limits provide the space for the proposed supercapacitor voltage limitation scheme to detect any deviation and act upon in by nullifying P S C whenever V S C is exceeding the limits. In fact, the designed control is very fast in responding to these events, recording an imperceptible voltage overshoot of less than 0.01 V in the example of Figure 5b, well below the 1 V margin.
A similar smoothing effect is achieved by the high-order FIR filter except for a noticeable group delay, as shown in Figure 6 ( N = 420 , ω c = 0.0005 π rad/sample). This results in a phase delay between P B and P H E S S , seen more clearly by comparing the zoom boxes in Figure 5a and Figure 6a. This group delay may trigger power oscillations and pose control and stability challenges, and use the supercapacitors’ capacity in a suboptimal manner. The conclusion from this investigation is that "too much" filtering may lead to the opposite result, with power spikes and oscillations that do not resemble a smooth profile for the battery. There is no golden rule on the selection of the filter parameters, as they strongly depend on the electricity profile and the supercapacitors’ capacity. The parameters selection for the case study of this paper is discussed in Section 4.

3. Battery Degradation Model

This section presents a new degradation model for lead–acid batteries used to evaluate the contribution of the hybridization to the battery life. This is a cycle-counting model that accounts for the cumulative fatigue from the most prevalent stress factors: the DoD and battery temperature. Most conventional models explore these effects separately and focus on medium and deep discharge cycles, i.e., DoD higher than 10%, thus neglecting smaller changes in the SoC, i.e., microcycles. However, the ESS in small-scale PV microgrids often experiences irregular charging/discharging patterns that involve lots of microcycles and rapidly changing currents that have increased DoD-related and temperature-related impact on the battery life. This paper shows that it is important in these cases to use high-resolution time series that allow for accurate approximation of both effects and thus the battery degradation. The objective of the following paragraphs is to describe a methodology for such a degradation model, which can be easily adapted to any lead–acid battery given the appropriate coefficients and inputs.

3.1. Depth of Discharge (DoD) Model

To evaluate the DoD degradation, one needs first to extract the number of cycles and their depth of discharge as explained in Section 3.1.1, to be used afterwards in a cycle life model to quantify their impact on the battery life in Section 3.1.2.

3.1.1. Rainflow Counting Method

The most widely adopted method to capture the DoD profile is the rainflow counting method. Using the SoC variation as an input, this method extracts the number of cycles, their depth and length. An example is given in Figure 7: the plot of SoC over time is rotated 90 ° clockwise and treated as a roof upon which raindrops fall. Starting from a local maximum point “a”, the rainflow reaches the next local minimum point “b” and then drops. The portion of the profile (b-c-b’) forms a whole cycle, denoted as “whole-cycle 1”. Then, the flow continues dropping till point “d” when it meets the minimum SoC value. The transition (a-b-d) is counted as a half-cycle. Thereafter, “d” is set as the new initial point for the next raindrop and these steps are repeated to identify the remaining whole and half cycles, as illustrated in Figure 7. More details on the implementation of the Rainflow counting method may be found in [6,40].

3.1.2. Cycle Life Model—CL(DoD)

Given the extracted cycles pattern, the next step is to evaluate their effect on the battery life. This is done by calculating the cycle life CL(d), i.e., the number of cycles that the battery will last if the DoD of all cycles is d. Usually, C L ( d ) is a mathematical expression that is unique for every battery and is derived based on information from the manufacturer datasheet.
An example of such datasheet information is given with the purple star markers in Figure 8a for Trojan’s deep-cycle gel lead–acid battery [58]: the cycle life heavily depends on the DoD, with higher DoD resulting in shorter cycle life. Since only a few such data points are typically provided in the datasheet, there is a need for a mathematical model to capture the cycle life for all possible DoDs. One commonly used such model, thereafter referred to as the conventional model, is given by [40,41,42]
C L ( d ) = a 5 d 5 + a 4 d 4 + a 3 d 3 + a 2 d 2 + a 1 d + a 0
where a i are coefficients extracted by fitting Equation (5) on the given data points. For the study-case battery, the fitted model is shown with a blue line in Figure 8a in regular scale and in Figure 8b in logarithmic scale, while the a i coefficients are given in Table 1.
However, a major limitation of this method is that it does not accurately capture the effect of microcycles with DoD less than 10%. Since the datasheet rarely includes information for so low DoD, the Conventional model may overestimate the impact of the microcycles, projecting low cycle life even for near-zero DoD (see how to blue line meets the y-axis in Figure 8a). This proves to be problematic when there is access to high resolution time series that permits visibility on the numerous existing microcycles. For these cases, a microcycles model is required, such as [14,22]
C L ( d ) = b 4 d 4 + b 3 d 3 + b 2 d 2 + b 1 d 1 + b 0
where b i are again coefficients extracted from the datasheet. Accurate identification of these coefficients would normally require data points for smaller DoD; in absence of this information, this paper assumes additional extrapolated points using a linear relationship in the logarithmic scale, as shown with green markers in Figure 8b (coefficients in Table 1). This way, the cycle life is very high for small DoD, providing a more realistic approximation of the limited microcycles effect.
In fact, without sufficient input data at low DoD, both models are approximations of the microcycles impact: a pessimistic one with the Conventional model and an optimistic one with the microcycle model. However, the case study of Section 4 shows that the former is clearly unsuitable in presence of microcycles, while the latter yields reasonable results. In addition, with the microcycle model the supercapacitor’s contribution to the battery life extension is more limited, which makes it a conservative benchmark when evaluating the economic viability of the hybridization. Therefore, this paper recommends adoption of the microcycle model as the safest approach in the design of a HESS.

3.2. Temperature Model

The battery’s operating temperature is also an important factor to the battery life. In the following, Section 3.2.1 explains how to calculate the battery temperature and Section 3.2.3 how to evaluate its effect on the cycle life.

3.2.1. Battery Temperature Calculation

The battery temperature T depends mainly on the ambient temperature T a and the power losses P l o s s . Taking into account the thermal inertia of the system, their combined effect can be expressed in the Laplace domain by the transfer function of a first-order low pass filter
T ( s ) = P l o s s · R t h + T a 1 + t c · s
where R t h is the thermal resistance and t c is the thermal time constant. Equation (7) reflects the fact that any change in T a or P l o s s will not be transferred to the battery temperature immediately. T a is an input to the model, while P l o s s is the aggregate power losses on the battery P l o s s _ b a t t e r y and on the power converter P l o s s _ c o n v e r t e r (assuming they are both placed in the same cabinet):
P l o s s = P l o s s _ b a t t e r y + P l o s s _ c o n v e r t e r
The converter power losses are found directly from the DC/DC converter efficiency. Typical efficiencies vary around 95% [59], thus P l o s s _ c o n v e r t e r is assumed here to be 5% of the actual power output at any time. The internal losses of the battery is described in detail in Section 3.2.2 below.

3.2.2. Battery Electrical Equivalent Circuit Model

The battery internal losses P l o s s _ b a t t e r y are calculated using the equivalent circuit of the battery shown in Figure 9. This circuit involves the following parasitic elements [60]: (i) an internal series resistance R s e r i a l that reflects losses due to ohmic polarization of instantaneous nature; (ii) a pair of resistance/capacitance R t _ f a s t , C t _ f a s t that accounts for activation polarization (or charge-transfer) phenomena with fast dynamics; and (iii) another pair R t _ s l o w , C t _ s l o w that models slower concentration polarization effects. The parameter values used in this paper are listed in Table 2, taken from [61]. The power losses were found by solving the algebraic and differential equations of this circuit for the given input battery current I b a t :
P l o s s _ b a t t e r y = I b a t 2 R s e r i a l + V t _ f a s t 2 R t _ f a s t + V t _ s l o w 2 R t _ s l o w
I b a t = C t _ f a s t d V t _ f a s t d t + V t _ f a s t R t _ f a s t
I b a t = C t _ s l o w d V t _ s l o w d t + V t _ s l o w R t _ s l o w
It is worth noting that the relation between P l o s s _ b a t t e r y and I b a t is non-linear; there is a quadratic dependence of the I 2 R losses on the current, which means that the charging/discharging pattern matters for the losses. For example, charging the battery with a constant current yields lower power losses than with a fluctuating current with the same mean value. However, the equivalent model of Figure 9 does not consider any dependence of the parasitic elements on the operating frequency, which some experimental studies have shown to be apparent.

3.2.3. Temperature’s Effect on Cycle Life

The temperature mainly affects the corrosion of the lead–acid battery’s positive electrode [6]: the higher the temperature, the faster the corrosion process. An investigation in [38] has shown that there is a linear relationship between the battery temperature and the cycle life for the same DoD, as shown in Figure 10. This means that the cycle life of the battery C L ( d ) calculated in Section 3.1 is only valid at 20 ° C and needs to be translated to the actual operating temperature T by multiplying with a coefficient n C L ( T ) given here by
n C L ( T ) = 0.0225 · T + 1.45
This equation taken from [38] refers to a flooded lead–acid battery, but it is assumed here that it applies more or less to deep-cycle gel-type lead–acid batteries as well. The typical gel battery datasheet does not provide any information on the cycle life-temperature relationship, but it includes data on the dependence of the battery capacity loss on the temperature, which is also linear [58,63]. Therefore, in absence of datasheet information or other relevant knowledge on the battery, this paper deems it better to use Equation (12) to model the temperature effect rather than to ignore it completely, as often done in the literature.

3.3. The Complete Battery Degradation Model

Given the cycles profile and operating temperature calculated in the previous paragraphs, the battery fatigue damage D is given by the Palmgren-Miner rule [64]:
D = d = 0 % d = 100 % c o u n t ( d ) C L ( d ) · n C L ( T )
where c o u n t ( d ) is the number of cycles with a DoD equal to d, and C L ( d ) · n C L ( T ) the respective battery cycle life at battery temperature T. Equation (13) reflects that D comes essentially from the weighted average of the various cycles depending on their frequency in the profile. It is worth noting that during a particular cycle, the temperature T is not constant and may vary; here the maximum temperature recorded during each cycle is selected for T.
The fatigue damage D gives by how much the battery has degraded for the particular charging/discharging profile, e.g., 5%. To get an estimate of the life expectancy L b a t assuming that the battery will operate under that profile, one needs to simply divide the duration of the study-case profile N d a y s by D:
L b a t = N d a y s D
For example, if a 90-day profile is used that yields 5% aging, the estimated lifespan of the battery will be 1800 days or equivalently 4.9 years. The full picture of the proposed battery degradation model is given in Figure 11.
  • First, the input SoC profile is analyzed using the rainflow counting method to identify the various cycles, which are then grouped together based on their DoD.
  • Then, the microcycle model (Equation (6)) is applied to every DoD captured to determine the respective cycle life C L ( d ) .
  • Next, the battery temperature variation is calculated from Equations (7)–(11) for the entire profile.
  • For every cycle, the temperature coefficient n C L ( T ) is determined based on the respective temperature through Equation (12).
  • Finally, applying Equations (13) and (14) yields the fatigue damage D and lifespan of the battery L b a t .

4. Case Study and Analysis

This section outlines the case study adopted in this paper to evaluate the proposed hybridization methodology. The electricity profile from a real-life standalone DC microgrid is used, followed by a sensitivity analysis on the impact of various thermal factors. It is worth noting that many parameters related to the ESS are assumed or taken from the literature and do not necessarily correspond to the case-study microgrid. The purpose of this section is to extract general conclusions on how different factors influence the battery life and hybridization benefit, rather than to be contained to a specific system.

4.1. The Case Study

The system under consideration is a DC microgrid installed in rural India (Bahraich district, Uttar Pradesh) that supplies electricity to 43 households. The microgrid comprises a total of 4.6 kWp of solar PV generation, 24 lead–acid batteries of 12 V/100 Ah each, and a 24 V distribution network over 1 km distance. The household loads are LED bulbs (1 W or 4 W), fans (15 W) and mobile phone chargers (max 5 W). Two profiles were provided over a period of 2 days and 90 days that include information on generation, load and ambient temperature at 1 s time resolution. It is worth noting that the acquired profiles refer to a subset only of the entire system.
Figure 12a depicts the PV generation and load profiles for two days in April 2019, extracted from the 90-day dataset. Solar generation expectedly varies slowly during the day, although it occasionally features high-frequency oscillations due to intermittent clouding. The domestic load profile exhibits its peak in the evening hours, when the people finish their agricultural activities and return back to their home. This deviation between supply and demand is the net power profile seen by the ESS. Figure 12b shows the ambient temperature profile during that period.
Figure 13 depicts the 90-day profile referring to 20 February to 20 May in 2019. The electricity and ambient temperature variation is given in Figure 13a,b, both featuring the anticipated daily fluctuation; the temperature also exhibits an interseasonal variation, increasing from about 20 ° C to 35 ° C on average. The power distribution is further studied in the histogram of Figure 13c: the load varies usually from 0 to 200 W, while solar generation is often zero or very low during the the night-time and low-light hours. The mismatch between the two is the net power accommodated by the ESS, varying here from −311 W to 993 W. To investigate how quickly the net power changes, the distribution of the rate of change of net power (RoCoP) is given in Figure 13d. It is apparent that rates of ±50–200 W/s are not rare at all; such high power rates for the scale of the system have a negative impact on the battery life both in terms of DoD and battery temperature.
The following sections explore how the supercapacitors can mitigate these power fluctuations, and how this improvement relates to the thermal parameters. The default parameters of the system used as a benchmark below are given in Table 3. The battery-alone ESS is assumed to comprise 6 batteries, while the HESS has also 1 supercapacitor module. The rest of the parameters are based on reasonable assumptions taken from the literature [61,65,66] and do not necessarily reflect the case study system. For the remainder of the analysis, the 90-day profile is used.

4.2. Power Filtering Results and Analysis

Based on the given 90-day profile and design specifications of Table 3, the optimal parameters for the two power filter alternatives are extracted through exhaustive search (testing wide ranges for each of the parameters, and select the ones that deliver the most favorable performance) and are appended in Table 4. Apparently, both filters increase the expected battery lifespan by almost the same amount. The first-order filter effectively smooths out the power profile resulting in much lower standard deviation in battery RoCoP and number of microcycles compared to the battery-alone system. The FIR filter yields approximately the same life extension but by squeezing more the number of microcycles while allowing for more deep cycles with higher DoD compared to the first-order LPF. Given that the FIR filter comes also with some stability and control issues related to the group delay, the first-order LPF is selected as more preferable and used in the remainder of the paper.
For a closer look at the filtering effect on the battery life, Figure 14 compares the battery RoCoP and DoD distribution between the battery-alone and HESS cases. Clearly, the hybridized batteries are exposed to a much more narrow RoCoP spectrum with substantially smaller power rates in Figure 14a, which translates to much fewer microcycles in Figure 14b (logarithmic scale). Please note also the large proportion of microcycles over the total number of cycles in each case in Table 4. This analysis consolidates the importance of an accurate battery degradation model with microcycles DoD resolution in order to properly assess the hybridization benefit.

4.3. Sensitivity Analysis of Thermal Parameters

Although the importance of the battery temperature on the battery life is a well-known fact, it is still somewhat unclear how the supercapacitors can influence this phenomenon and therefore the hybridization benefit. For this reason, the following paragraphs present a sensitivity analysis, in which some of the most prevalent thermal parameters, i.e., thermal resistance R t h , thermal time constant t c and converter power losses P l o s s _ c o n v e r t e r , are varied over a wide range to capture their effect on the temperature and battery life with and without the hybridization. The default parameters of Table 3 are used as a benchmark.

4.3.1. The Effect of Thermal Resistance

The thermal resistance R t h reflects how the power losses from the battery and power converter translate to battery temperature. Figure 15a shows the resulting HESS battery temperature for R t h varying from 0 to 1 ° C/W in the form of sorted curves (i.e., the temperature values of the entire profile are sorted from high to low). Clearly, R t h is a crucial factor, which may lead to very high temperatures for large values.
Figure 15b illustrates how this relates to the battery life with and without the hybridization. The R t h impact is indeed negative, but the HESS seems to be much more resilient compared to the battery-alone ESS. This is because the hybridization effectively reduces the battery internal power losses P l o s s _ b a t t e r y due to a smoother battery current I b a t , as explained in Section 3.2.2; this entails lower battery temperature, and fewer number of cycles in total. As a result, the life extension from hybridization in Figure 15c increases in an exponential manner with R t h . The conclusion from this investigation is that the supercapacitors not only alleviate some of the DoD degradation, but they also bring a thermal benefit which proves to be substantial when the thermal resistance is high.

4.3.2. The Effect of the Thermal Time Constant

The thermal time constant t c plays essentially the role of inertia for the battery temperature (see Equation (7)), typically few hours [66,67]. Small values entail steep temperature rise during short-term power peaks, whereas large values effectively flatten out the temperature distribution. This is why a t c = 1 h in Figure 16a results in occasional very high temperatures, but most of the time the temperature is slightly lower than the t c = 10 h case. This effect is reflected to the battery life and hybridization benefit as Figure 16b,c show; the trend is somewhat similar to the R t h effect but with a reversed x-axis. Again, the supercapacitors may prove of little or major importance depending on the time constant value.

4.3.3. The Effect of Converter Power Losses

The converter power losses P l o s s _ c o n v e r t e r have a rather limited impact on the battery temperature as shown in Figure 17a: higher losses lead to higher temperatures, but the difference is not as significant as with the previous factors. This translates to a more limited effect on the battery life in Figure 17b and to a linear life extension from the hybridization in Figure 17c. The general conclusion from this sensitivity analysis is: the more severe the thermal conditions of the ESS, the more useful the supercapacitors are. This gives an additional perspective on the hybridization benefits, apart from the most commonly considered DoD impact.

5. Economic Analysis and Discussion

Although the previous section shows that hybridization is more or less beneficial to the battery’s life, it is not clear when it makes sense in terms of economic viability. Here, the benefit of more long-lived batteries is weighted against the additional investment burden of the supercapacitors and their power converter to evaluate the overall economic benefit of the hybridization. The case study of the previous section is used as an example, assessed in six different scenarios to understand when the investment is viable and when it is not.
The net present cost (NPC) metric is adopted in this paper to evaluate the total investment required for the two alternative ESS over the entire project life. NPC involves the initial one-time investment I 0 , any replacement costs R and operation and maintenance (O&M) costs O M during the lifetime of the project [22,68]:
N P C = I 0 + R + O M
In the battery-alone system, I 0 comprises the costs for the batteries C b a t E b a t and their converter C c o n v E c o n v b a t , while the HESS involves additionally the supercapacitors costs C s u p E s u p and their own converter costs C c o n v E c o n v s u p . Equation (16) shows the full picture for the HESS case.
I 0 = C b a t E b a t + C s u p E s u p + C c o n v ( E c o n v b a t + E c o n v s u p )
The parameters used in this paper are given in Table 5. The capital cost accounts for the main investment. According to [21], the capital cost of lead–acid batteries in 2018 was approximately 260 $/kWh and it was predicted to drop to 220 $/kWh by 2025. Assuming that this project starts in 2020, a battery capital cost of 250 $/kWh is considered, with a discount rate of 2.4%. The capital cost of supercapacitors is typically 10,000 $/kWh [69], as adopted for example in the case study of [70]. The O&M costs of supercapacitors are generally lower than that of batteries, selecting here 0.1% and 0.45% of the investment, respectively, based on [21]. The cost of the power converters is taken from [21,68].
Assuming a project lifetime of 15 years, the replacement costs R in both battery-alone ESS and HESS refer only to the batteries, since the supercapacitors and converters lifespan typically reaches or exceeds 15 years [21,68]. Given the battery lifespan L b a t calculated in years by the proposed degradation model in Section 3, the batteries need to be replaced r = 15 / L b a t 1 times during the project lifetime; every replacement will cost C b a t E b a t adjusted by the annual market discount rate d r that reflects the fact that technology becomes cheaper over time. As r may not be an integer, the equation below involves the cost of full replacements r (rounded down) plus the cost of the final replacement that accounts only for the remaining years and is adjusted by r r . The latter intervention is a simple way to account for capital recovery after the project life.
R = n = 1 r C b a t E b a t ( 1 + d r ) n L b a t + r r C b a t E b a t ( 1 + d r ) r L b a t
Finally, the O&M costs increase every year due to aging of the equipment, reflected in the actual discount rate d. During the first battery lifetime, the annual maintenance costs will be an adjusted version of O M 0 b a t based on d, where O M 0 b a t is a percentage of the initial investment (see Table 5). When the batteries are replaced, the maintenance costs will be a discounted value of O M 1 b a t , which is again a percentage but of the respective replacement cost (see Equation (17)). The final O&M expression is given below for the HESS.
O M = n = 1 15 / L b a t t = 1 L b a t O M n 1 b a t ( 1 + d ) t + t = 1 15 O M 0 s u p ( 1 + d ) t + t = 1 15 O M 0 c o n v ( 1 + d ) t
It is worth noting that the O&M costs of the hybridized system will not fundamentally differ from the battery-alone ESS. Being both electrochemical storage devices, the battery and supercapacitor require simple and straightforward maintenance, i.e., keeping the surface clean and the connectors sealed etc. [71]. The skillset required by the local technicians for installation, operation and maintenance is practically the same in the two systems, which does not create any additional barriers in adopting the HESS in isolated rural communities. However, it should be noted that supercapacitors consumables are not as readily available as lead–acid batteries in local markets in rural India, although currently the market size of Indian supercapacitor manufacturing industry grows steadily every year [72].

5.1. Base Scenario

The base scenario refers to the default HESS parameters of Table 3 and the economic considerations of Table 5. This includes a set of reasonable assumptions corresponding to a realistic system, used thereafter as a benchmark for the remaining scenarios. The results of the techno-economic analysis are given in Table 6. The battery life in the basic scenario is estimated to be 5–5.5 years, which is well-aligned with industry’s expectations for real-life microgrids [71]. The supercapacitors’ contribution reduces the total number of cycles by 2/3, mainly the microcycles, which translates to about 8% longer lifespan for the batteries. However, given the additional investment costs in the HESS, the economic benefit is much more limited at 1.9%. This makes the hybridization economically viable, albeit very marginally. The following scenarios explore how these numbers change for different thermal and economic considerations.

5.2. Scenario 2: Conventional Cycle Life DoD Model

The discussion in Section 3.1.2 outlines two cycle life models that evaluate the DoD degradation effect: the conventional model designed for cycles with substantial DoD, and the microcycle model that accounts also for the cycles with very little DoD. Given that the case-study electricity profile is of high time-resolution and the numerous microcycles are visible, it is of paramount importance to use the latter model in all analyses, as has been done throughout this paper. To support this claim, scenario 2 employs the conventional model instead, with the results given in Table 7. Clearly, the battery degradation is severely overestimated, yielding about 1 year lifespan for the battery-alone and 3 years for the HESS. Although, hybridization seems very beneficial indeed in this case, the results of 1–3 years are not realistic [71], highlighting that this type of model can not reflect reality and should not be used to inform an investment. In fact, the main conclusion from this scenario is how important is to use a microcycles life model when the SoC profile is of high time-resolution and the microcycles are visible. In cases that a microcycle model is not available, it is preferable to completely disregard the microcycles from the profile when evaluating the DoD degradation.

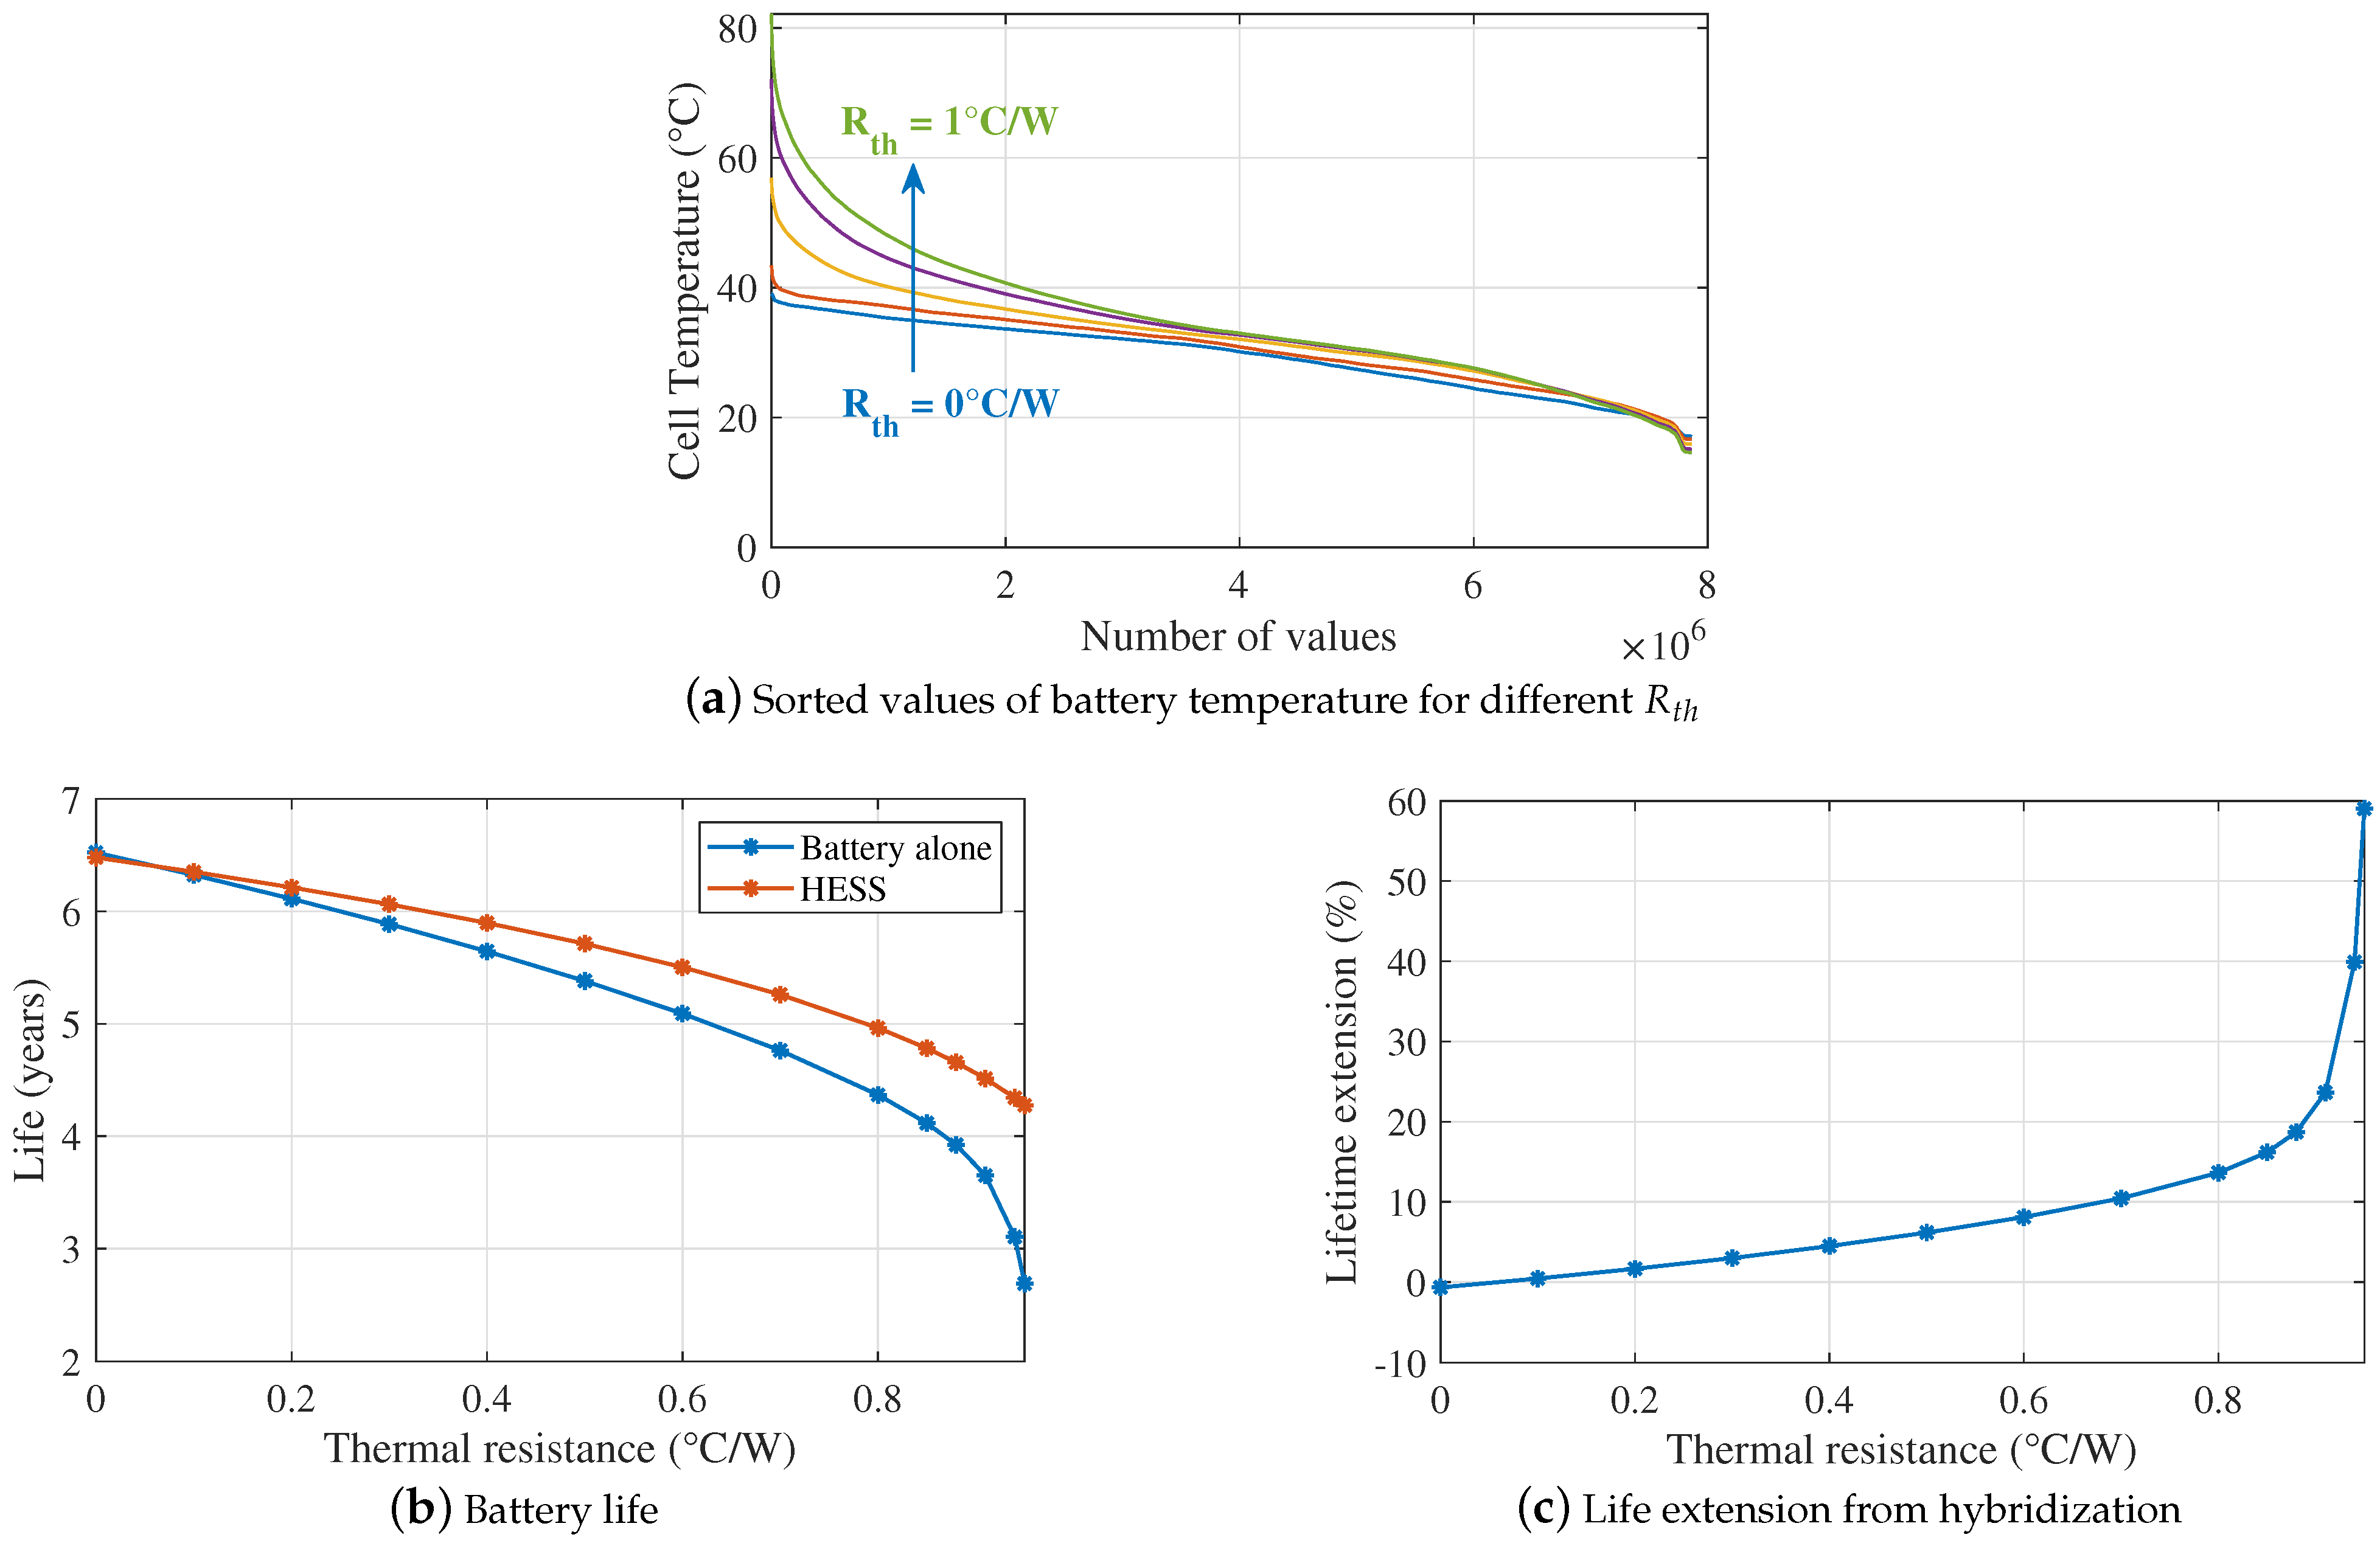
5.3. Scenario 3: Poor Thermal Characteristics

The thermal parameters of Table 3 are indicative and strongly depend on the specific system and environment. Their influence on the battery life is discussed in Section 4.3; here, the respective economic impact is assessed in a scenario with worse thermal characteristics (e.g., poor ventilation and thermal management system): thermal resistance 0.8 ° C/W, thermal time constant 14,400 s (4 h) and converter losses 8%. For example, [66] shows that the thermal resistance can be in some cases as high as 1.1 ° C/W and the thermal constant around 3–4 h. The results of Table 8 show a lifespan reduction of more than a year in both systems compared to the base scenario due to the higher battery temperature. These severe thermal conditions result in a battery life falling short of the industrial targets [71], but hybridization manages to mitigate this impact to a large extent. The contribution of the hybridization is considerable indeed, extending the battery longevity by more than 20%, which translates to about 12% economic benefit. Clearly, hybridization is highly beneficial in this case, which indicates that a HESS is a good solution under poor thermal conditions.

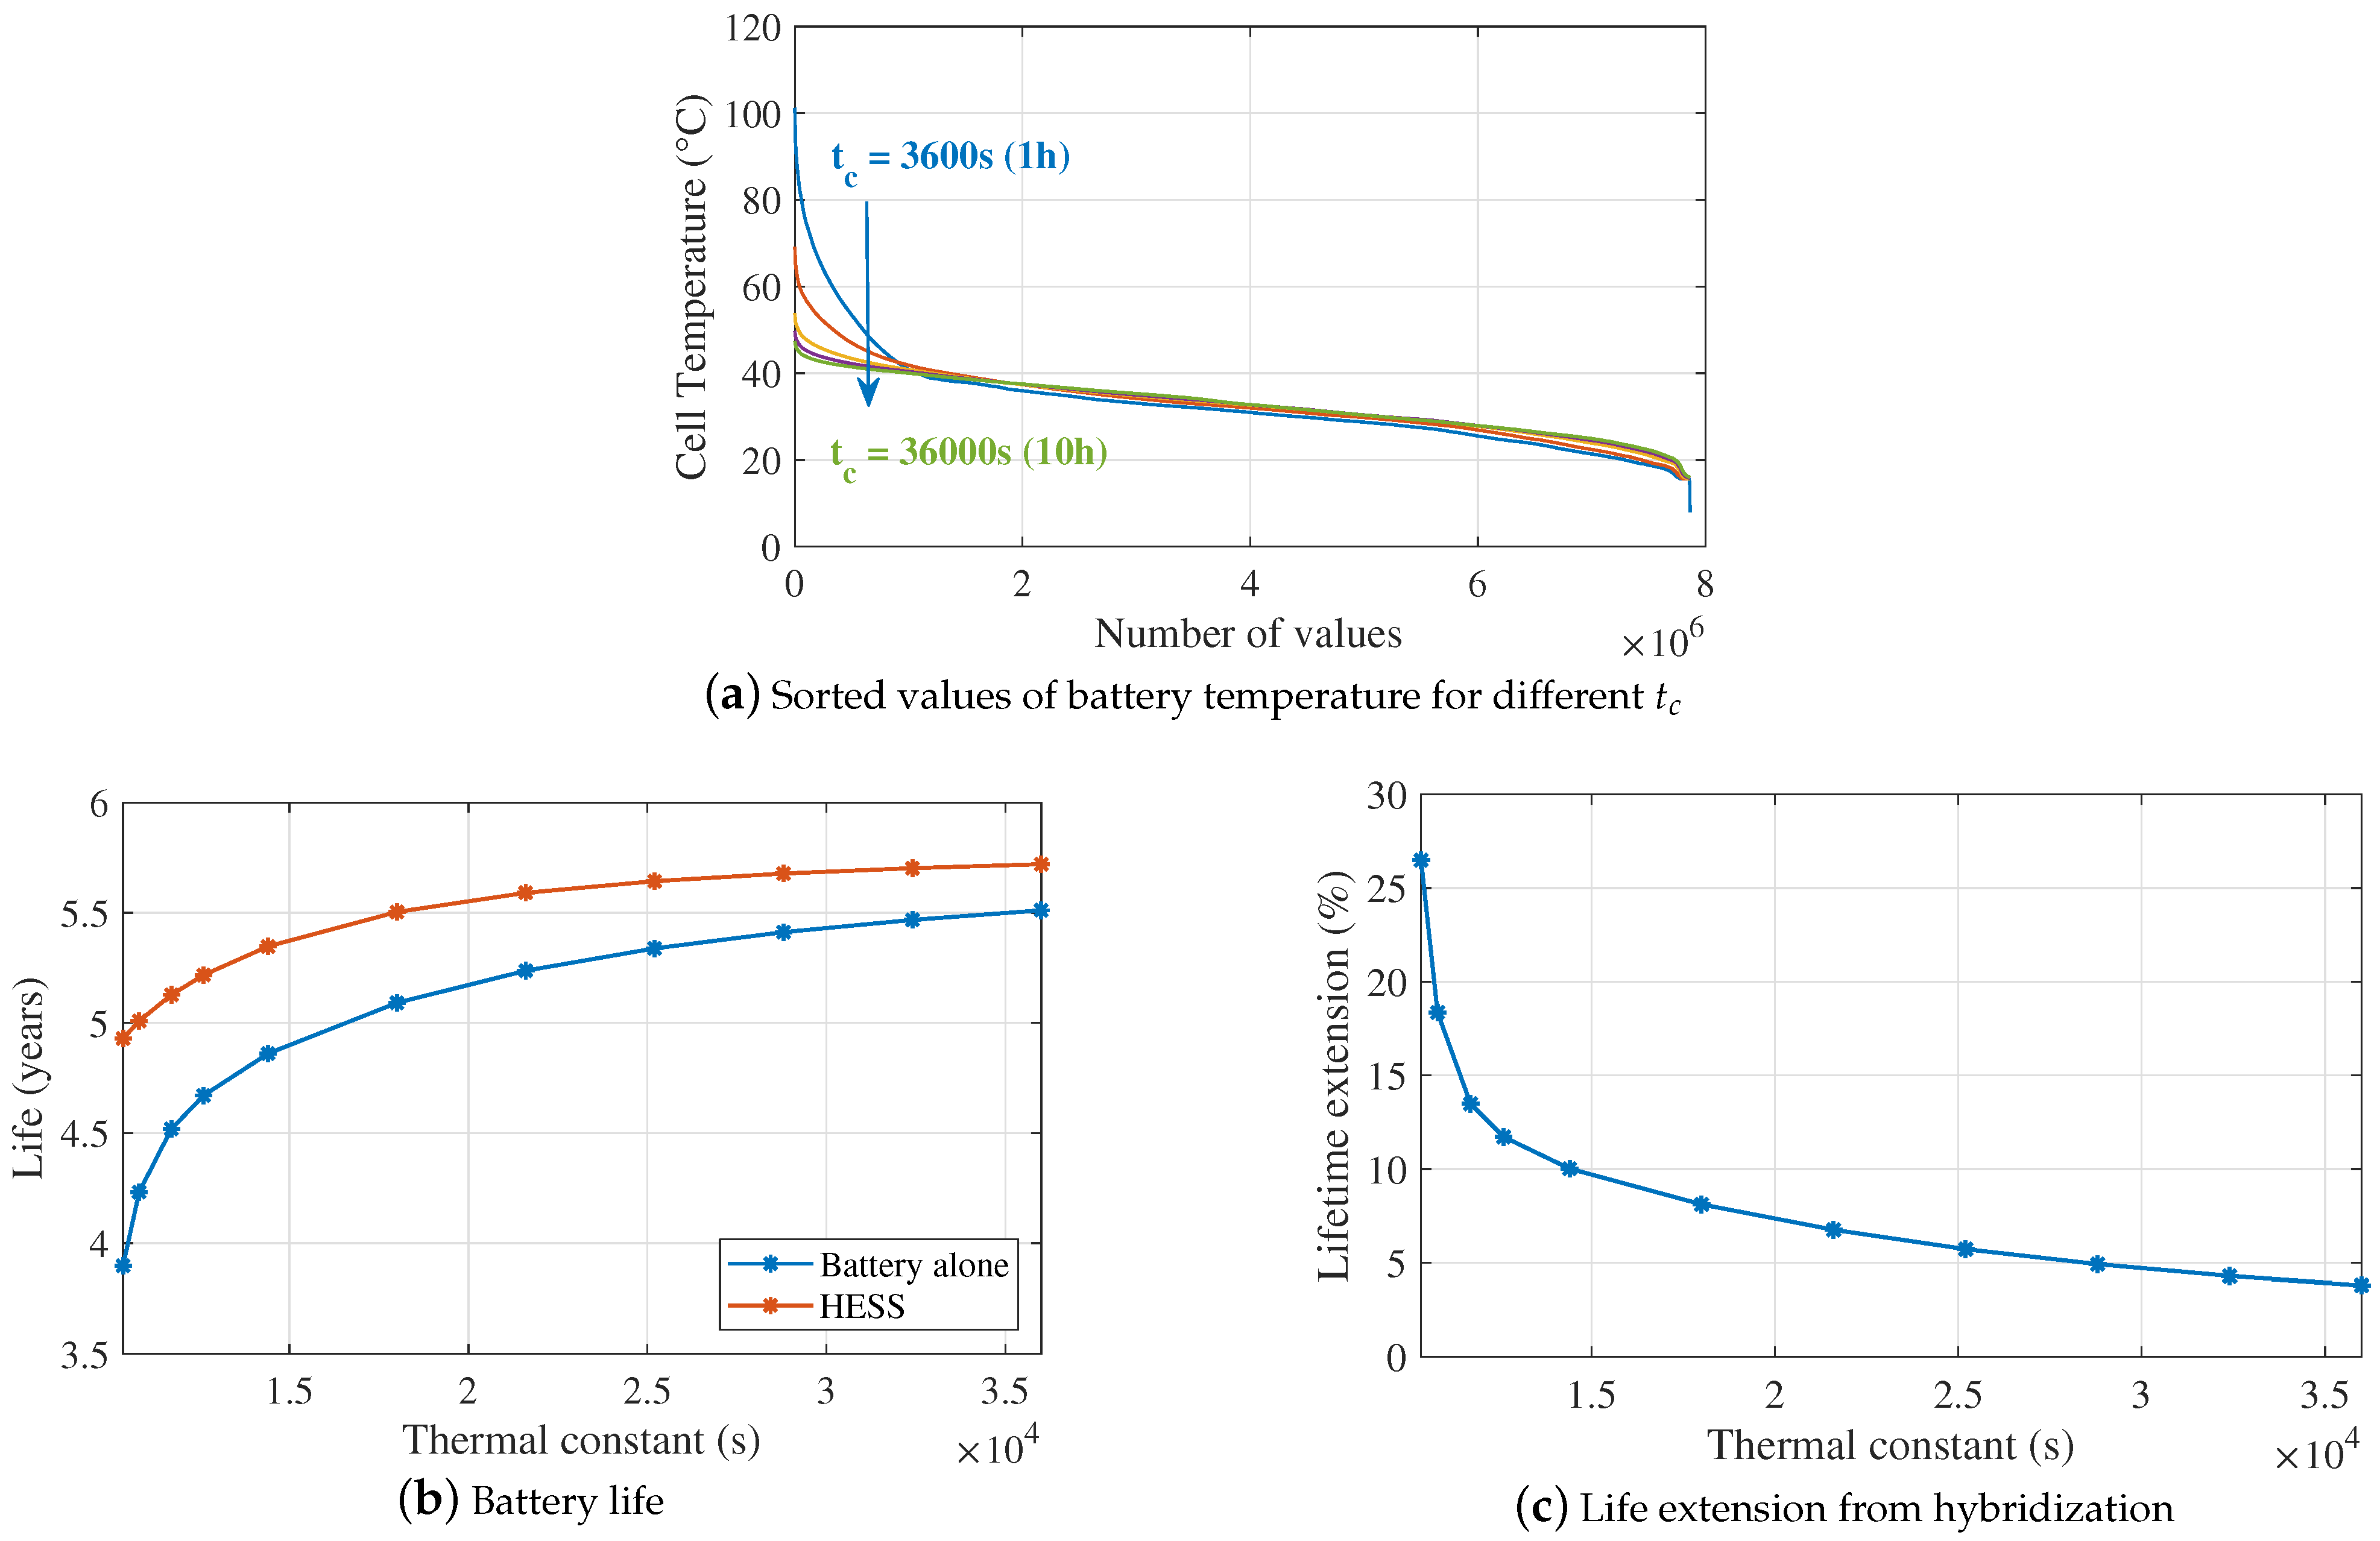
5.4. Scenario 4: Good Thermal Characteristics

On the other hand, improved thermal characteristics should affect the results in the opposite way. Here, the thermal parameters are: thermal resistance 0.4 ° C/W; thermal time constant 21,600 s (6 h); [67,73] and converter losses remain at 5%. For example, [73] shows that with a properly designed cooling system, the thermal resistance will almost be lower than 0.4 ° C/W, or even be reduced to 0.2 ° C/W. Table 8 shows that the battery life of the only-battery system meets and exceeds the industry expectations, which entails marginal only life improvement from hybridization and a negative economic benefit indeed. In other words, the hybridization contribution is too little to overcome the relevant financial overhead. This highlights once again the importance to consider both temperature and DoD factors in a battery degradation model to yield reliable conclusions.

5.5. Scenario 5: Economic Parameters in Favor of Hybridization

In order to assess the influence of the economic parameters on the viability of the hybridization, this section repeats the analysis assuming conditions more favorable to the supercapacitors. Specifically, the supercapacitors’ capital cost is reduced by 20% to 8000 $/kWh, the batteries are priced 12% higher at 280 $/kWh, the market discount rate d r drops to 0.4% and the O&M discount rate d is assumed to be −1% (see Table 5 for comparison). The resulting Table 9 differs from the base case Table 6 only in the financial figures, now increasing the economic benefit of the hybridization to 3.6%. Apparently, this is not fundamentally different from the 1.9% in the base case, which entails that the hybridization viability is more sensitive on the thermal parameters, rather than the economic ones.

5.6. Scenario 6: Economic Parameters against Hybridization

By contrast, this scenario explores economic parameters that stand against the hybridization: supercapacitors cost $12,000/kWh, battery costs $220/kWh, 5% battery market discount rate and −10% O&M discount rate. Table 9 shows a slightly negative economic benefit which renders the hybridization marginally inviable. Still, a drop from 1.9% in the base case to −0.6% here is very limited considering the substantial variations in the capital costs, which essentially confirms the relative insensitivity of the hybridization to the economic parameters.
In fact, the main conclusion from this investigation is that the main factors to assess whether a lead–acid battery ESS should be hybridized with supercapacitors are the thermal parameters, rather than the economic ones. The poorest the thermal conditions, the more likely the hybridization to be beneficial.

6. Conclusions

This paper describes a methodology to hybridize a battery-based energy storage system using supercapacitors for a smoother power profile, presenting a new control scheme, a new battery degradation mechanism model and an economic viability analysis. Compared to a system with only lead–acid batteries, the hybrid system features longer battery life. The results showed that a simple first-order low-pass filter is an effective and reliable solution for the power filtering, performing more favorably than higher order FIR filters given the limited supercapacitors capacity and strict voltage limits. Apparently, the supercapacitors result in fewer microcycles, but also in lower average battery temperature due to the smoother current profile that yields less power losses compared to a fluctuating current in the battery-alone case. This also highlights the importance in capturing both DoD and temperature effects in a battery degradation model, such as in the one proposed.
Especially when there is access to second-resolution time series that allows visibility to numerous microcycles, an appropriate microcycles cycle life DoD model should be used; if not available, the microcycles should instead be completely disregarded from the profile to avoid erroneous battery life estimation. A sensitivity analysis showed that the thermal parameters of the system not only affect the battery life, but play a major role in the hybridization benefit: poorer or better thermal conditions render the hybridization more or less useful respectively. This is confirmed by the economic analysis, which concludes that the financial benefit of the hybridization depends more on the thermal conditions rather than the economic parameters of the investment.
The methodology and findings of this study may be useful when exploring hybridization options for battery ESS in standalone microgrids. In addition, this type of hybrid ESS has great grid-connected potential as well, mainly in facilitating high levels of renewables integration. It is nowadays seen as a credible way to absorb generation and load intermittency and provide ancillary services to the power system, such as frequency response and inertia emulation, functions that again result in irregular charge/discharge battery profiles that hint towards a hybrid ESS.
Furthermore, it is worth noting that the core of the proposed methodology applies to Li-ion battery systems as well, which is increasingly gaining popularity due to longer life, smaller size and less weight. Most steps of this paper’s methodology will be common in this case, but with substantially different characteristics and parameters that do not allow for straightforward extrapolation of this study findings to Li-ion battery systems.

Author Contributions

Conceptualization, X.L. and E.B.; methodology, X.L., J.V.B. and E.B.; investigation, X.L.; writing—original draft preparation, X.L.; writing—review and editing, J.V.B., B.W., C.L.C. and E.B.; supervision, E.B. All authors have read and agreed to the published version of the manuscript.

Funding

This research has been supported by the Royal Academy of Engineering under the Engineering for Development Research Fellowship scheme (number RF\201819\18\86) and EPSRC Faraday Institution’s Multi-Scale Modelling Project (EP/S003053/1, grant number FIRG003).

Institutional Review Board Statement

Not applicable.

Informed Consent Statement

Not applicable.

Data Availability Statement

No new data were created or analyzed in this study. Data sharing is not applicable to this article.

Acknowledgments

The authors would like to thank Oorja Development Solutions Limited and BBOXX for their kind provision of the electricity profile of the case study, and Mr Hamish Beath and Mr Philip Sandwell for assisting with acquiring the data.

Conflicts of Interest

The authors declare no conflict of interest.

Abbreviations

The following abbreviations are used in this manuscript:
DoDDepth of Discharge
ESSEnergy Storage System
FIRFinite Impulse Response (filter)
HESSHybrid Energy Storage System
LPFLow-Pass Filter
NPCNet Present Cost
O&MOperation and Maintenance (costs)
PVPhotovoltaic
SoCState of Charge

References

  1. United Nations Sustainable Development Goals (SDGs). Ensure Access to Affordable, Reliable, Sustainable and Modern Energy. Available online: https://www.un.org/sustainabledevelopment/energy/ (accessed on 11 December 2020).
  2. Jing, W.; Lai, C.H.; Wong, S.H.W.; Wong, M.L.D. Battery-supercapacitor hybrid energy storage system in standalone DC microgrids: Areview. IET Renew. Power Gener. 2016, 11, 461–469. [Google Scholar] [CrossRef]
  3. Serban, E.; Serban, H. A control strategy for a distributed power generation microgrid application with voltage-and current-controlled source converter. IEEE Trans. Power Electron. 2010, 25, 2981–2992. [Google Scholar] [CrossRef] [Green Version]
  4. Zhang, Y.; Wang, J.; Berizzi, A.; Cao, X. Life cycle planning of battery energy storage system in off-grid wind–solar–diesel microgrid. IET Gener. Transm. Distrib. 2018, 12, 4451–4461. [Google Scholar] [CrossRef]
  5. Kollimalla, S.K.; Mishra, M.K.; Narasamma, N.L. Design and Analysis of Novel Control Strategy for Battery and Supercapacitor Storage System. IEEE Trans. Sustain. Energy 2014, 5, 1137–1144. [Google Scholar] [CrossRef]
  6. Bindner, H.; Cronin, T.; Lundsager, P.; Manwell, J.F.; Abdulwahid, U.; Baring-Gould, I. Lifetime modelling of lead acid batteries. Risø Natl. Lab. 2005, 12, 1629–1639. [Google Scholar]
  7. Kuperman, A.; Aharon, I. Battery–ultracapacitor hybrids for pulsed current loads: A review. Renew. Sustain. Energy Rev. 2011, 15, 981–992. [Google Scholar] [CrossRef]
  8. Sarwar, W.; Engstrom, T.; Marinescu, M.; Green, N.; Taylor, N.; Offer, G.J. Experimental analysis of Hybridised Energy Storage Systems for automotive applications. J. Power Sources 2016, 324, 388–401. [Google Scholar] [CrossRef]
  9. Dezza, F.C.; Musolino, V.; Piegari, L.; Rizzo, R. Hybrid battery–supercapacitor system for full electric forklifts. IET Electr. Syst. Transp. 2018, 9, 16–23. [Google Scholar] [CrossRef]
  10. Zhang, Q.; Li, G. Experimental study on a semi-active battery-supercapacitor hybrid energy storage system for electric vehicle application. IEEE Trans. Power Electron. 2019, 35, 1014–1021. [Google Scholar] [CrossRef]
  11. Choi, M.; Lee, J.; Seo, S. Real-time optimization for power management systems of a battery/supercapacitor hybrid energy storage system in electric vehicles. IEEE Trans. Veh. Technol. 2014, 63, 3600–3611. [Google Scholar] [CrossRef]
  12. Yoo, H.; Sul, S.; Park, Y.; Jeong, J. System integration and power-flow management for a series hybrid electric vehicle using supercapacitors and batteries. IEEE Trans. Ind. Appl. 2008, 44, 108–114. [Google Scholar] [CrossRef]
  13. Carter, R.; Cruden, A.; Hall, P.J. Optimizing for efficiency or battery life in a battery/supercapacitor electric vehicle. IEEE Trans. Veh. Technol. 2012, 61, 1526–1533. [Google Scholar] [CrossRef]
  14. Mohammadi, E.; Rasoulinezhad, R.; Moschopoulos, G. Using a Supercapacitor to Mitigate Battery Microcycles Due to Wind Shear and Tower Shadow Effects in Wind-Diesel Microgrids. IEEE Trans. Smart Grid 2020, 11, 3677–3689. [Google Scholar] [CrossRef]
  15. Garcia, P.; Fernandez, L.M.; Garcia, C.A.; Jurado, F. Energy management system of fuel-cell-battery hybrid tramway. IEEE Trans. Ind. Electron. 2009, 57, 4013–4023. [Google Scholar] [CrossRef]
  16. Carignano, M.; Roda, V.; Costa-Castelló, R.; Valiño, L.; Lozano, A.; Barreras, F. Assessment of energy management in a fuel cell/battery hybrid vehicle. IEEE Access 2019, 7, 16110–16122. [Google Scholar] [CrossRef]
  17. Zhang, F.; Hu, Z.; Meng, K.; Ding, L.; Dong, Z.Y. Sequence control strategy for hybrid energy storage system for wind smoothing. IET Gener. Transm. Distrib. 2019, 13, 4482–4490. [Google Scholar] [CrossRef]
  18. Lemofouet, S.; Rufer, A. Hybrid energy storage system based on compressed air and super-capacitors with maximum efficiency point tracking (MEPT). IEEJ Trans. Ind. Appl. 2006, 126, 911–920. [Google Scholar] [CrossRef] [Green Version]
  19. Mamun, A.; Liu, Z.; Rizzo, D.M.; Onori, S. An integrated design and control optimization framework for hybrid military vehicle using lithium-ion battery and supercapacitor as energy storage devices. IEEE Trans. Transp. Electrif. 2018, 5, 239–251. [Google Scholar] [CrossRef]
  20. German, R.; Sari, A.; Briat, O.; Vinassa, J.; Venet, P. Impact of voltage resets on supercapacitors aging. IEEE Trans. Ind. Electron. 2016, 63, 7703–7711. [Google Scholar] [CrossRef] [Green Version]
  21. Mongird, K.; Viswanathan, V.V.; Balducci, P.J.; Alam, M.J.E.; Fotedar, V.; Koritarov, V.S.; Hadjerioua, B. Energy Storage Technology and Cost Characterization Report; Pacific Northwest National Lab. (PNNL): Richland, WA, USA, 2019.
  22. Gee, A.M.; Robinson, F.V.P.; Dunn, R.W. Analysis of battery lifetime extension in a small-scale wind-energy system using supercapacitors. IEEE Trans. Energy Convers. 2013, 28, 24–33. [Google Scholar] [CrossRef]
  23. de Castro, R.; Pinto, C.; Varela Barreras, J.; Araújo, R.E.; Howey, D.A. Smart and Hybrid Balancing System: Design, Modeling, and Experimental Demonstration. IEEE Trans. Veh. Technol. 2019, 68, 11449–11461. [Google Scholar] [CrossRef]
  24. Oriti, G.; Julian, A.L.; Anglani, N.; Hernandez, G.D. Novel economic analysis to design the energy storage control system of a remote islanded microgrid. IEEE Trans. Ind. Appl. 2018, 54, 6332–6342. [Google Scholar] [CrossRef]
  25. Kurm, S.; Agarwal, V. Hybrid Energy Storage System based on a Novel Reduced Rating Multi Input Converter. IEEE Trans. Power Electron. 2020, 35, 12133–12142. [Google Scholar] [CrossRef]
  26. Abeywardana, D.B.W.; Hredzak, B.; Agelidis, V.G.; Demetriades, G.D. Supercapacitor Sizing Method for Energy-Controlled Filter-Based Hybrid Energy Storage Systems. IEEE Trans. Power Electron. 2016, 32, 1626–1637. [Google Scholar] [CrossRef]
  27. Mesbahi, T.; Rizoug, N.; Bartholomeüs, P.; Sadoun, R.; Khenfri, F.; Le Moigne, P. Optimal energy management for a li-ion battery/supercapacitor hybrid energy storage system based on a particle swarm optimization incorporating Nelder–Mead simplex approach. IEEE Trans. Intell. Veh. 2017, 2, 99–110. [Google Scholar] [CrossRef]
  28. Khan, M.M.S.; Faruque, M.O.; Newaz, A. Fuzzy logic based energy storage management system for MVDC power system of all electric ship. IEEE Trans. Energy Convers. 2017, 32, 798–809. [Google Scholar] [CrossRef] [Green Version]
  29. Shen, J.; Khaligh, A. A supervisory energy management control strategy in a battery/ultracapacitor hybrid energy storage system. IEEE Trans. Transp. Electrif. 2015, 1, 223–231. [Google Scholar] [CrossRef]
  30. Ravada, B.R.; Tummuru, N.R. Control of a Supercapacitor/Battery/PV based Stand-Alone DC-Microgrid. IEEE Trans. Energy Convers. 2020, 35, 1268–1277. [Google Scholar] [CrossRef]
  31. Zhang, S.; Xiong, R.; Sun, F. Model predictive control for power management in a plug-in hybrid electric vehicle with a hybrid energy storage system. Appl. Energy 2017, 185, 1654–1662. [Google Scholar] [CrossRef]
  32. Pinto, C.; Varela Barreras, J.; de Castro, R.; Araújo, R.E.; Schaltz, E. Study on the combined influence of battery models and sizing strategy for hybrid and battery-based electric vehicles. Energy 2017, 137, 272–284. [Google Scholar] [CrossRef]
  33. Somayajula, D.; Crow, M.L. An ultracapacitor integrated power conditioner for intermittency smoothing and improving power quality of distribution grid. IEEE Trans. Sustain. Energy 2014, 5, 1145–1155. [Google Scholar] [CrossRef]
  34. Kotra, S.; Mishra, M.K. Design and stability analysis of dc microgrid with hybrid energy storage system. IEEE Trans. Sustain. Energy 2019, 10, 1603–1612. [Google Scholar] [CrossRef]
  35. Dufo-López, R.; Lujano-Rojas, J.M.; Bernal-Agustín, J.L. Comparison of different lead–acid battery lifetime prediction models for use in simulation of stand-alone photovoltaic systems. Appl. Energy 2014, 115, 242–253. [Google Scholar] [CrossRef]
  36. Reniers, J.M.; Mulder, G.; Howey, D.A. Review and performance comparison of mechanical-chemical degradation models for lithium-ion batteries. J. Electrochem. Soc. 2019, 166, A3189–A3200. [Google Scholar] [CrossRef] [Green Version]
  37. Liao, L.; Köttig, F. Review of hybrid prognostics approaches for remaining useful life prediction of engineered systems, and an application to battery life prediction. IEEE Trans. Reliab. 2014, 63, 191–207. [Google Scholar] [CrossRef]
  38. Narayan, N.; Papakosta, T.; Vega-Garita, V.; Qin, Z.; Popovic-Gerber, J.; Bauer, P.; Zeman, M. Estimating battery lifetimes in Solar Home System design using a practical modelling methodology. Appl. Energy 2018, 228, 1629–1639. [Google Scholar] [CrossRef]
  39. Dudézert, C.; Reynier, Y.; Duffault, J.; Franger, S. Fatigue damage approach applied to Li-ion batteries aging characterization. Mater. Sci. Eng. B 2016, 213, 177–189. [Google Scholar] [CrossRef]
  40. Schaltz, E.; Khaligh, A.; Rasmussen, P.O. Influence of battery/ultracapacitor energy-storage sizing on battery lifetime in a fuel cell hybrid electric vehicle. IEEE Trans. Veh. Technol. 2009, 58, 3882–3891. [Google Scholar] [CrossRef]
  41. He, G.; Chen, Q.; Kang, C.; Pinson, P.; Xia, Q. Optimal bidding strategy of battery storage in power markets considering performance-based regulation and battery cycle life. IEEE Trans. Smart Grid 2015, 7, 2359–2367. [Google Scholar] [CrossRef] [Green Version]
  42. Han, X.; Liang, Y.; Ai, Y.; Li, J. Economic evaluation of a PV combined energy storage charging station based on cost estimation of second-use batteries. Energy 2018, 165, 326–339. [Google Scholar] [CrossRef]
  43. Li, S.; He, H.; Su, C.; Zhao, P. Data driven battery modeling and management method with aging phenomenon considered. Appl. Energy 2020, 275, 115340. [Google Scholar] [CrossRef]
  44. Stroe, D.; Świerczyński, M.; Stan, A.; Teodorescu, R.; Andreasen, S.J. Accelerated lifetime testing methodology for lifetime estimation of lithium-ion batteries used in augmented wind power plants. IEEE Trans. Ind. Appl. 2014, 50, 4006–4017. [Google Scholar] [CrossRef]
  45. Reddy, T.B. Linden’s Handbook of Batteries, 4th ed.; McGraw-Hill, Inc.: New York, NY, USA, 2011. [Google Scholar]
  46. Sauer, D.U. Secondary Batteries: Lead-acid batteries—Lifetime Determining Processes. Encycl. Electrochem. Power Sources 2009, 4, 805–815. [Google Scholar]
  47. Layadi, T.M.; Champenois, G.; Mostefai, M.; Abbes, D. Lifetime estimation tool of lead–acid batteries for hybrid power sources design. Simul. Model. Pract. Theory 2015, 54, 36–48. [Google Scholar] [CrossRef]
  48. Swierczynski, M.; Stroe, D.; Stan, A.; Teodorescu, R.; Kær, S.K. Lifetime Estimation of the Nanophosphate LiFePO4/C Battery Chemistry Used in Fully Electric Vehicles. IEEE Trans. Ind. Appl. 2015, 51, 3453–3461. [Google Scholar] [CrossRef]
  49. Photovoltaics, D.G.; Storage, E. IEEE Guide for Selecting, Charging, Testing, and Evaluating Lead-Acid Batteries Used in Stand-Alone Photovoltaic (PV) Systems; IEEE Std 1361-2014 (Revision of IEEE Std 1361-2003); IEEE: Piscataway, NJ, USA, 2014; pp. 1–39. [Google Scholar]
  50. Wu, B.; Parkes, M.A.; Yufit, V.; De Benedetti, L.; Veismann, S.; Wirsching, C.; Vesper, F.; Martinez-Botas, R.F.; Marquis, A.J.; Offer, G.J. and others Design and testing of a 9.5 kWe proton exchange membrane fuel cell–supercapacitor passive hybrid system. Int. J. Hydrogen Energy 2014, 39, 7885–7896. [Google Scholar] [CrossRef]
  51. Nazaripouya, H.; Chu, C.; Pota, H.R.; Gadh, R. Battery energy storage system control for intermittency smoothing using an optimized two-stage filter. IEEE Trans. Sustain. Energy 2017, 9, 664–675. [Google Scholar] [CrossRef]
  52. Al-Alaoui, M.A. Linear phase low-pass IIR digital differentiators. IEEE Trans. Signal Process. 2007, 55, 697–706. [Google Scholar] [CrossRef] [Green Version]
  53. Mellit, A.; Benghanem, M.; Kalogirou, S.A. Modeling and simulation of a stand-alone photovoltaic system using an adaptive artificial neural network: Proposition for a new sizing procedure. Renew. Energy 2007, 32, 285–313. [Google Scholar] [CrossRef]
  54. Kumar, S.; Singh, K.; Saxena, R. Analysis of Dirichlet and generalized “Hamming” window functions in the fractional Fourier transform domains. Signal Process. 2011, 91, 600–606. [Google Scholar] [CrossRef]
  55. Kumar, A.; Singh, G.K.; Anand, R. An improved closed form design method for the cosine modulated filter banks using windowing technique. Appl. Soft Comput. 2011, 11, 3209–3217. [Google Scholar] [CrossRef]
  56. Supercapacitors/Ultracapacitors BMOD0500 P016 B01 Datasheet, Maxwell Technologies, Inc. 2014. Available online: https://www.maxwell.com/images/documents/datasheet_16v_module.pdf (accessed on 1 July 2020).
  57. Wang, Y.; Xue, L.; Wang, C.; Wang, P.; Li, W. Interleaved high-conversion-ratio bidirectional DC–DC converter for distributed energy-storage systems—Circuit generation, analysis, and design. IEEE Trans. Power Electron. 2015, 31, 5547–5561. [Google Scholar] [CrossRef]
  58. Deep-Cycle Gel Batteries, Trojan Battery Co. 2008. Available online: http://www.trojanbattery.com/pdf/GEL_SS_Web.pdf (accessed on 14 July 2020).
  59. U.S. DRIVE. Electrical and electronics technical team roadmap. In U.S. DRIVE Partnership Plan, Roadmaps, and Accomplishments; United States Department of Energy: Washington, DC, USA, 2013. [Google Scholar]
  60. Winter, M.; Brodd, R.J. What are batteries, fuel cells, and supercapacitors? Chem. Rev. 2004, 104, 4245–4270. [Google Scholar] [CrossRef] [Green Version]
  61. Dragičević, T. Hierarchical Control of a Direct Current Microgrid with Energy Storage Systems in a Distributed Topology. Ph.D. Thesis, University of Zagreb, Zagreb, Croatia, 2013. [Google Scholar]
  62. Zou, Y.; Hu, X.; Ma, H.; Li, S.E. Combined state of charge and state of health estimation over lithium-ion battery cell cycle lifespan for electric vehicles. J. Power Sources 2015, 273, 793–803. [Google Scholar] [CrossRef]
  63. 31GEL Trojan Data Sheets, Trojan Battery Co. 2019. Available online: https://www.trojanbattery.com/pdf/datasheets/31GEL_Trojan_Data_Sheets.pdf (accessed on 14 July 2020).
  64. Kauzlarich, J.J. The Palmgren-Miner rule derived. In Tribology Series; Dowson, D., Taylor, C., Eds.; Elsevier: New York, NY, USA, 1989; pp. 175–179. [Google Scholar]
  65. Berndt, D. Valve-regulated lead-acid batteries. J. Power Sources 2001, 100, 29–46. [Google Scholar] [CrossRef]
  66. Barsali, S.; Ceraolo, M. Dynamical models of lead-acid batteries: Implementation issues. IEEE Trans. Energy Convers. 2002, 17, 16–23. [Google Scholar] [CrossRef]
  67. Ceraolo, M. New dynamical models of lead-acid batteries. IEEE Trans. Power Syst. 2000, 15, 1184–1190. [Google Scholar] [CrossRef] [Green Version]
  68. Tsai, C.; Beza, T.M.; Molla, E.M.; Kuo, C. Analysis and Sizing of Mini-Grid Hybrid Renewable Energy System for Islands. IEEE Access 2020, 8, 70013–70029. [Google Scholar] [CrossRef]
  69. Ultracapacitor Overview, Maxwell Technologies, Inc. 2018. Available online: http://www.maxwell.com/products/ultracapacitors (accessed on 28 July 2020).
  70. Kim, K.; An, J.; Park, K.; Roh, G.; Chun, K. Analysis of a supercapacitor/battery hybrid power system for a bulk carrier. Appl. Sci. 2019, 9, 1547. [Google Scholar] [CrossRef] [Green Version]
  71. Sen, R. A Detailed Manual on Lead Acid Battery Operation & Maintenance for Solar PV Plants; USAID: Washington, DC, USA, 2018.
  72. Kale, B.; Chatterjee, S. Electrochemical energy storage systems: India perspective. Bull. Mater. Sci. 2020, 43, 1–15. [Google Scholar] [CrossRef]
  73. Divakaran, A.M.; Hamilton, D.; Manjunatha, K.N.; Minakshi, M. Design, development and thermal analysis of reusable Li-ion battery module for future mobile and stationary applications. Energies 2020, 13, 1477. [Google Scholar] [CrossRef] [Green Version]
Figure 1. Selected system topology: DC microgrid with a parallel, fully-active hybrid energy storage system (HESS).
Energies 14 00507 g001
Figure 2. Proposed HESS control scheme.
Energies 14 00507 g002
Figure 3. Power profile in the battery-alone ESS system.
Energies 14 00507 g003
Figure 4. Power filtering and voltage results for the HESS with a first-order low-pass filter (LPF) ( T = 50 s).
Energies 14 00507 g004
Figure 5. Power filtering and voltage results for the HESS with a first-order LPF ( T = 300 s).
Energies 14 00507 g005
Figure 6. Power filtering and voltage results for the HESS with a finite impulse response (FIR) filter ( N = 420 and ω c = 0.0005 π rad/sample).
Energies 14 00507 g006
Figure 7. Example application of the rainflow counting algorithm based on a SoC profile.
Energies 14 00507 g007
Figure 8. Battery cycle life vs. depth of discharge (DoD) curve.
Energies 14 00507 g008
Figure 9. Equivalent electrical model of the lead–acid battery [61,62].
Energies 14 00507 g009
Figure 10. Normalized cycle life with temperature in a lead–acid battery [38].
Energies 14 00507 g010
Figure 11. Flowchart of the proposed battery life estimation method.
Energies 14 00507 g011
Figure 12. Two-day electricity and temperature profiles.
Energies 14 00507 g012
Figure 13. Ninety-day electricity and temperature profiles.
Energies 14 00507 g013
Figure 14. Hybridization effect on the battery operation.
Energies 14 00507 g014
Figure 15. Thermal resistance’s effect on battery life.
Energies 14 00507 g015
Figure 16. The thermal time constant’s effect on battery life.
Energies 14 00507 g016
Figure 17. Converter power losses’ effect on battery life.
Energies 14 00507 g017
Table 1. Coefficients of conventional and microcycle models.
ModelCoefficients
Conventional model a 5 = 46,573 a 4 = 187,495 a 3 = 288,854
a 2 = 212,925 a 1 = 76,291 a 0 = 11,761
Microcycle model b 4 = 1.345 × 10 12 b 3 = 1.495 × 10 7 b 2 = 1.507 × 10 3
b 1 = 601.5 b 0 = 122.5
Table 2. Parameters of lead–acid battery equivalent circuit [61].
ParameterValue
R s e r i a l 0.0401 × e 0.0908 × S o C + 0.0366 Ω
R t _ f a s t 3.041 × 10 10 × e 0.1874 × S o C + 0.0344 Ω
R t _ s l o w 0.101 × e 0.0203 · S o C + 0.0219 Ω
C t _ f a s t 1200 F
C t _ s l o w 5000 F
Table 3. Default HESS parameters.
ParameterValue
Number of lead–acid batteries6 (2 × 3 strings; 100 Ah; 12 V)
Number of supercapacitor modules1 (BMOD0500 P016: 500 F; 16 V)
HESS LPF time constant45 s (1st order LPF)
Cycle life model of DoDMicrocycle model
Thermal resistance R t h 0.6 ° C/W
Thermal time constant t c 18,000 s (5 h)
Internal series resistance R s e r i a l 0.0401 × e 0.0908 × S o C + 0.0366 Ω
Converter power losses P l o s s _ c o n v e r t e r 5%
Table 4. Hybridization benefit with the two power filters.
ParameterBattery-Alone1st Order LPFFIR Filter
LPF parametersN/AT = 45 sN = 350; ω c = 0.007 π rad/sample
Expected battery life1858 days2009 days2003 days
Standard deviation of the P B RoCoP1.7 W/s0.3 W/s1.3 W/s
Number of microcycles (<10% DoD)1675499212
Number of deep cycles (≥10% DoD)898991
Table 5. Economic parameters [21,68,69].
ParameterLead Acid BatterySupercapacitorPower Converters
Capital cost C b a t , C s u p , C c o n v 250 $/kWh10,000 $/kWh0.25 $/W
Capacity E b a t , E s u p , E c o n v b a t / E c o n v s u p 7200 Wh18 Wh1000 W/ 300 W
Initial O&M costs O M 0 b a t , O M 0 s u p , O M 0 c o n v 0.45% of invest.0.11% of invest.1 $/kW
Other Economic Parameters
Market discount rate d r 2.4%
O&M actual discount rate d −5%
Table 6. Results of the base scenario.
ParametersBattery-AloneHESS
Total number of cycles1754579
Life estimation1858 days2009 days
Life estimation5.09 years5.50 years
Number of battery replacements1.951.73
Invest. on Supercapacitor0184 $
Invest. on Battery4734 $4386 $
Invest. on Converters250 $325 $
O&M140 $132 $
Total invest.5124 $5027 $
Life extension8.1%
Economic benefit1.9%
Table 7. Results of scenario 2.
ParametersBattery-AloneHESS
Life estimation1.05 years3.04 years
Number of battery replacements13.333.93
Total invest.22,346 $8382 $
Life extension190.6%
Economic benefit62.5%
Table 8. Results of different scenarios of thermal characteristics.
ParametersScenario 3 (Poor Thermal Char.)Scenario 4 (Good Thermal Char.)
Battery-AloneHESSBattery-AloneHESS
Life estimation3.80 years4.59 years5.72 years5.93 years
Number of battery replacements2.952.271.621.53
Total invest.6627 $5840 $4605 $4716 $
Life extension20.7%3.7%
Economic benefit11.9%−2.4%
Table 9. Results of different scenarios of economic parameters.
ParametersScenario 5 (In Favor of Hybr.)Scenario 6 (Against Hybr.)
Battery-AloneHESSBattery-AloneHESS
Life estimation5.09 years5.50 years5.09 years5.50 years
Number of battery replacements1.951.731.951.73
Invest. on Supercapacitor0147 $0224 $
Invest. on Battery5824 $5388 $3732 $3467 $
O&M150 $140 $139 $132 $
Total invest.6224 $5999 $4122 $4148 $
Life extension8.1%8.1%
Economic benefit3.6%−0.6%
Publisher’s Note: MDPI stays neutral with regard to jurisdictional claims in published maps and institutional affiliations.

