Article

Resource Intensity vs. Investment in Production Installations—The Case of the Steel Industry in Poland

by
Bożena Gajdzik
1 and
Włodzimierz Sroka
2,*
1
Department of Industrial Informatics, Faculty of Materials Engineering, Silesian University of Technology, 40-019 Katowice, Poland
2
Department of Management, Faculty of Applied Sciences, WSB University, 41-300 Dąbrowa Górnicza, Poland
*
Author to whom correspondence should be addressed.
Energies 2021, 14(2), 443; https://doi.org/10.3390/en14020443
Submission received: 24 November 2020 / Revised: 22 December 2020 / Accepted: 8 January 2021 / Published: 15 January 2021
(This article belongs to the Special Issue Management and Technology for Energy Efficiency Development)

Abstract

:
Resource intensity is a measure of the resources needed for the production, processing and disposal of good or services. Its level decides on the costs the companies have to bear both for production and for environmental protection, which in turn have a crucial importance for their competitiveness. Given these facts, our study analyses the issues of resource intensity in the Polish steel industry in correlation to investments made, and more specifically, to the impact of investments on the consumption of energy media used during steel production. Its key element is the development of econometric models presenting the impact of investments on resource consumption in steel production in Poland. Electricity and coke consumption were analysed according to manufacturing installation. The research was carried out on the basis of statistical data for the period of 2004–2018. The obtained findings confirmed the impact of the increase in investment on the decrease in the resource intensity in steel production in Poland. These facts have implications for both policy makers, as they confirm the thesis on a direct correlation between investments in technology and a reduction in resource intensity (environmental protection), as well as company managers. In the case of the latter, the data show the actions which companies should focus on in their activities.

1. Introduction

Environmental pollution and climate changes are two of the main problems we all face now and manufacturing companies are responsible for most of the harmful substances released into the environment [1,2,3,4]. This fact forced companies to re-review their strategies, aiming at the development of green strategies by integrating environmental aspects in different areas of the business [5]. As a result, it has been observed that many modern organisations implement protective environmental policies and transition toward a circular economy based on sustainable partnerships [6,7]. The so called ‘triple bottom line’ [8], which requires taking into account not only economic results but also social and environmental performance, becomes more and more popular, as it has an impact on a company’s image and reputation [9,10]. The assumptions of the circular (green) economy that aims to reduce waste (and therefore minimise costs) and to redefine sustainable development are more and more important [11,12,13,14]. It relates to all the sectors, and especially to the steel industry which is among those that have the highest negative impact on the environment. For example, the steel industry has one of the highest levels of carbon emissions and energy consumption in Europe. As to the former, it is responsible for around 5% of the overall global CO2 emissions [15]. At the same time, CO2 emissions from the steel industry are amongst the most difficult to diminish [16]. However, steel industry is of great economic importance for the European Union. Meyer and Meyer [17] opine that there is a fine line between economic importance or growth and economic development and that one should maintain a balance between these two concepts. Therefore, the main directions of change are as follows: product improvements, improvements in process efficiency, and substantial reductions in energy demand or related emissions [18]. Given these facts, resource intensity in the economy is one of the topics that is analysed in detail.
Resource intensity is a measure of the resources (e.g., water, energy, materials) needed for the production, processing and disposal of a unit of a good or a service, or for the completion of a process or activity; it is therefore a measure of the efficiency of resource use. Relatively high resource intensity indicates a high price or environmental cost of converting resource into GDP; in turn, low resource intensity indicates a lower price or environmental cost of converting resource into GDP [19].
The resource intensity in the steel industry is most often associated with energy consumption. The steel industry is a highly energy-intensive sector, especially when the steel production process is analysed using Electric Arc Furnace (EAF) technology. In addition to energy demand, an important resource used by steel mills equipped with BF (Blast Furnace installations) is coke (input materials in process installation). Converter steel mills (steel mills using Basic Oxygen Furnace (BOF) steelmaking technology) also consume energy. These two resources are considered to be crucial for integrated steel mills, i.e., steel mills equipped with Blast Furnace and Basic Oxygen Furnace (BF + BOF) installations. The key difference between the EAF and BF–BOF technologies is the type of raw materials consumed. While the main raw material for the BF–BOF installations is iron ore, EAF installations mostly use recycled steel [20]. In general, the more modern the technology that is used by the steel mills, the less resource-intensive they are, and vice versa: higher levels of resource needs are generated by mills that operate older production installations. Given the deliberations presented, the goal of our study is to analyse the resource intensity in the Polish steel industry in correlation to completed investments, especially the impact of investments on the consumption of energy media used in steel production processes. A key element of our work is development of econometric models of the impact of investments on resource consumption in steel production. The need to conduct an analysis of resource consumption in the Polish steel industry appeared to show changes in the analysed resources after the economic transformation (in 1989, Poland introduced reforms to prepare for its transition to a market economy). Transformation, privatisation and restructuring were the three priorities and, at the same time, challenges that the highly resource-intensive steel sector has been struggling with for many years. Only in the first decade of this century did strong capital groups appear on the Polish steel market, which own the largest steel mills (e.g., ArcelorMittal Poland, which controls around 70% of the capacity of steel production in Poland). Those groups favoured comprehensive and deep restructuring, including technological restructuring, and the resource consumption of steel production depends on the progress in technological restructuring and the implemented investments. Therefore, our study partly fills the information gap on the functioning of the Central and Eastern European markets which exercised the transformation from a centrally controlled economy to a market economy in the 1990s. Another argument was also the financial and economic condition of steel mills in Poland after the transformation was undertaken. In 2007 the European Commission finally accepted the final documents confirming the preparation of steel mills in Poland for functioning on the market. Steel mills are profitable, and show financial liquidity, which favoured investments in their efforts to improve (better) resource management. Given these facts, this study on resource consumption may constitute a reference point for comparative analyses in the area of the resource consumption of steel mills in other countries of Central Europe and Eastern Europe due to similar conditions in the 1990s and subsequent years. Furthermore, the third argument in favour of choosing the Polish steel sector for the analysis was the importance of this industry to the Polish economy. According to statistical data, in 2019 the steel industry employed over 24,000 people and was one of the top 10 largest industrial sectors in Poland. However, a problem which it faces is the constantly growing costs of materials and energy; reducing the consumption of these resources will result in higher profitability. For this reason, our analysis and developed models can be used by the managers of steel mills to determine the level of resource consumption in their enterprises.
Our paper is structured as follows: Section 2 analyses the literature review devoted to resource intensity, with a special focus on the steel industry. This is followed by materials and methods used in our analysis (Section 3). In turn, Section 4 presents our main findings and discusses them in detail. Finally, we conclude by presenting the main contributions to the theory, limitations and future directions of the research.

2. Literature Review

Resource intensity is a key component of the management of a company. The amount and type of resources used in its production processes have an impact on company performance. Energy efficiency is the base of the energy economy in modern industrial plants. Resource intensity refers both to macroeconomic systems, such as the world economy and economies of individual countries, and to mesoeconomic systems (e.g., particular industries), as well as to microeconomic systems created by individual enterprises [21]. With regard to production enterprises, resource intensity is understood as a measure of management (the decrease in resource consumption and the rationality of resource management is a measure of the company’s effectiveness). Enterprises express it as the ratio of resource consumption per production unit (products). The resource intensity measured in this way is a technical approach. The opposite of resource consumption is productivity, the so-called material yield as the ratio of manufactured goods (volume) to materials consumed (OECD Manual) [22]. Enterprises improve their productivity and resource efficiency by making investments, which in turn leads to reduction of resources consumption. This aspect is especially important in relation to the development of the 4.0 Industry concept [23,24,25,26,27]. In recent years, industrial production systems have begun to undergo transformation due to a higher level of digitalisation, which leads to an intelligent, connected, and decentralised production organised in cyber physical systems (CPPS) and executed in smart factories. Digital technology has significantly changed the speed of operation in the economy [28]. In Industry 4.0, business and engineering processes are deeply integrated, enabling production to operate in a flexible and efficient manner with constant high productivity and quality, low cost and low resource intensity [29].
Resource productivity and resource intensity are regarded as the key concepts in the strategies of enterprises in the global market. Their strength is that they can be used as a metric for both economic and environmental costs. Although these concepts are two sides of the same coin, they involve very different approaches and can be viewed as reflecting, on the one hand, the efficiency of resource production as outcome per unit of resource use (resource productivity) and, on the other hand, the efficiency of resource consumption as resource use per unit outcome (resource intensity) [30,31].
The sustainability objective is to maximise resource productivity while minimising resource intensity. Awareness of limited resources is at the heart of sustainable business in terms of resource management, especially in case of energy, water, materials, etc. Because of the depletion of traditional energy sources and the growing costs of their exploitation [32], investments in the energy industry should be spent on the creation and implementation of solutions that will meet the growing demand, compensation for the decline in energy supply production from the existing oil and gas fields, and the development of the infrastructure of traditional and renewable energy resources [33]. The latter is especially important, though one observes many barriers in its implementation in different countries [34]. For this reason, production companies as well as cities seek the most efficient means of energy utilisation and energy management [35]. In the case of the latter, one of the most popular ways is large district heating (DH) systems, which were accepted almost as an axiom for the densely populated urban areas (Sarma et al., 2019) [36].
One assumes that the increasing resource intensity of a production company is an undesirable phenomenon. Saving resources is identified with technological progress, expressed, inter alia, in investments (increase in investments completed in the industry). Technological investments in production enterprises reduce the consumption of resources (long-term perspective). At the same time, energy intensity relies largely on the technologies used and incremental, country-to-country knowledge transfer made by predominantly global corporations operating in several countries [37]. It means that energy intensity reduction can be achieved by improving and modernising the technologies used in production processes [38]. Furthermore, technological expenditure can significantly reduce CO2 emissions [39]. Manufacturing companies need to offer a higher return of investment, and resources intensity should be reduced at the same time. In other words, their objective is to improve productivity and economic growth but it should be merged with reduction in energy consumption and diminishing environmental impact [40]. However, one cannot forget about some barriers, especially in relation to improved energy efficiency see e.g., [41,42,43]. Investments implemented in production enterprises should contribute to the decrease in the consumption of energy media at the entrance to production (the sum of all material and energy inputs in the production system). This has a key importance, as the efficient use of energy is regarded as imperative for enhancing competitiveness [44] and is central to achieving the goal of sustainable economic growth [45]. As claimed by Czosnyska et al. [46], energy efficiency is the base of the energy economy in a modern industrial plants. This relates especially to energy-intensive industries such as the steel industry [47]. At the same time, there are also other possibilities to improve the energy efficiency in steel companies, such as implementation of energy management systems [48] or inter-organisational knowledge transfer [49].
The correlation (examining whether two phenomena are correlated) between the increase in investment outlays and the decrease in resource intensity has become the basic assumption for our research. Our attention was focused on the resource consumption sector, i.e., the need for rational use of resources supplying the steel production process (electricity, coke) by steel companies (steel mills) in Poland. In the long term, the resource intensity of the steel sector in Poland is decreasing, which is the result of technological progress and investments made in the companies. At the beginning of the transformation of the economy in Poland (in 1989 the government started building a market economy), the steel plants began to be restructured [50]. This restructuring was very broad and encompassed a set of radical changes implemented in all the important areas of economic activity [51]. Simultaneously with the restructuring of the mills, their privatisation was carried out. Foreign capital invested in Polish steel mills [52]. As a result, the former state-owned enterprises have new owners (domestic and foreign capital). Profitability, resource management and efficiency have become their basic economic metrics. In the area of technological changes, steel mills have adjusted the volume of steel production to market demand) and have removed outdated (and thus environmentally harmful) open-hearth furnaces (in 2003, production in open-hearth furnaces in Poland was completely stopped) [53]. Since 2003, steel has been produced in Poland using only two processes: BOF and EAF. After a radical technological restructuring (1990s), steel mills are investing in installations whose main objective is to improve their competitive and innovative position on the world steel market. The list of technological changes includes: (1) new and improved steel products and steel making technologies; (2) new and improved input and alloy materials for steel making; (3) recovery and recycling of raw materials from metallurgical waste and scrap; (4) optimisation of energy consumption, input materials, utilities and steel making tools and equipment; (5) innovative systems and technologies to reduce harmful emissions into the environment; and (6) innovative solutions to modernise steel making processes [54,55,56,57].
Technological innovation is accompanied by a change in the structure of consumed resources [58]. Steel mills limit the use of coal with high sulphur content, and the share of alternative fuels to support production and auxiliary processes is growing, e.g., the use of mine gases for heating purposes. In addition, they invest in the development of new energy sources (green energy). These issues are very important given the fact that European Union expects a substantial reduction of gas emissions to the environment [18].
Based on the deliberations presented we formulate the following research hypothesis:
Hypothesis H1. 
In the long term, the increase in investment expenditure positively impacts resource consumption on a unit basis.

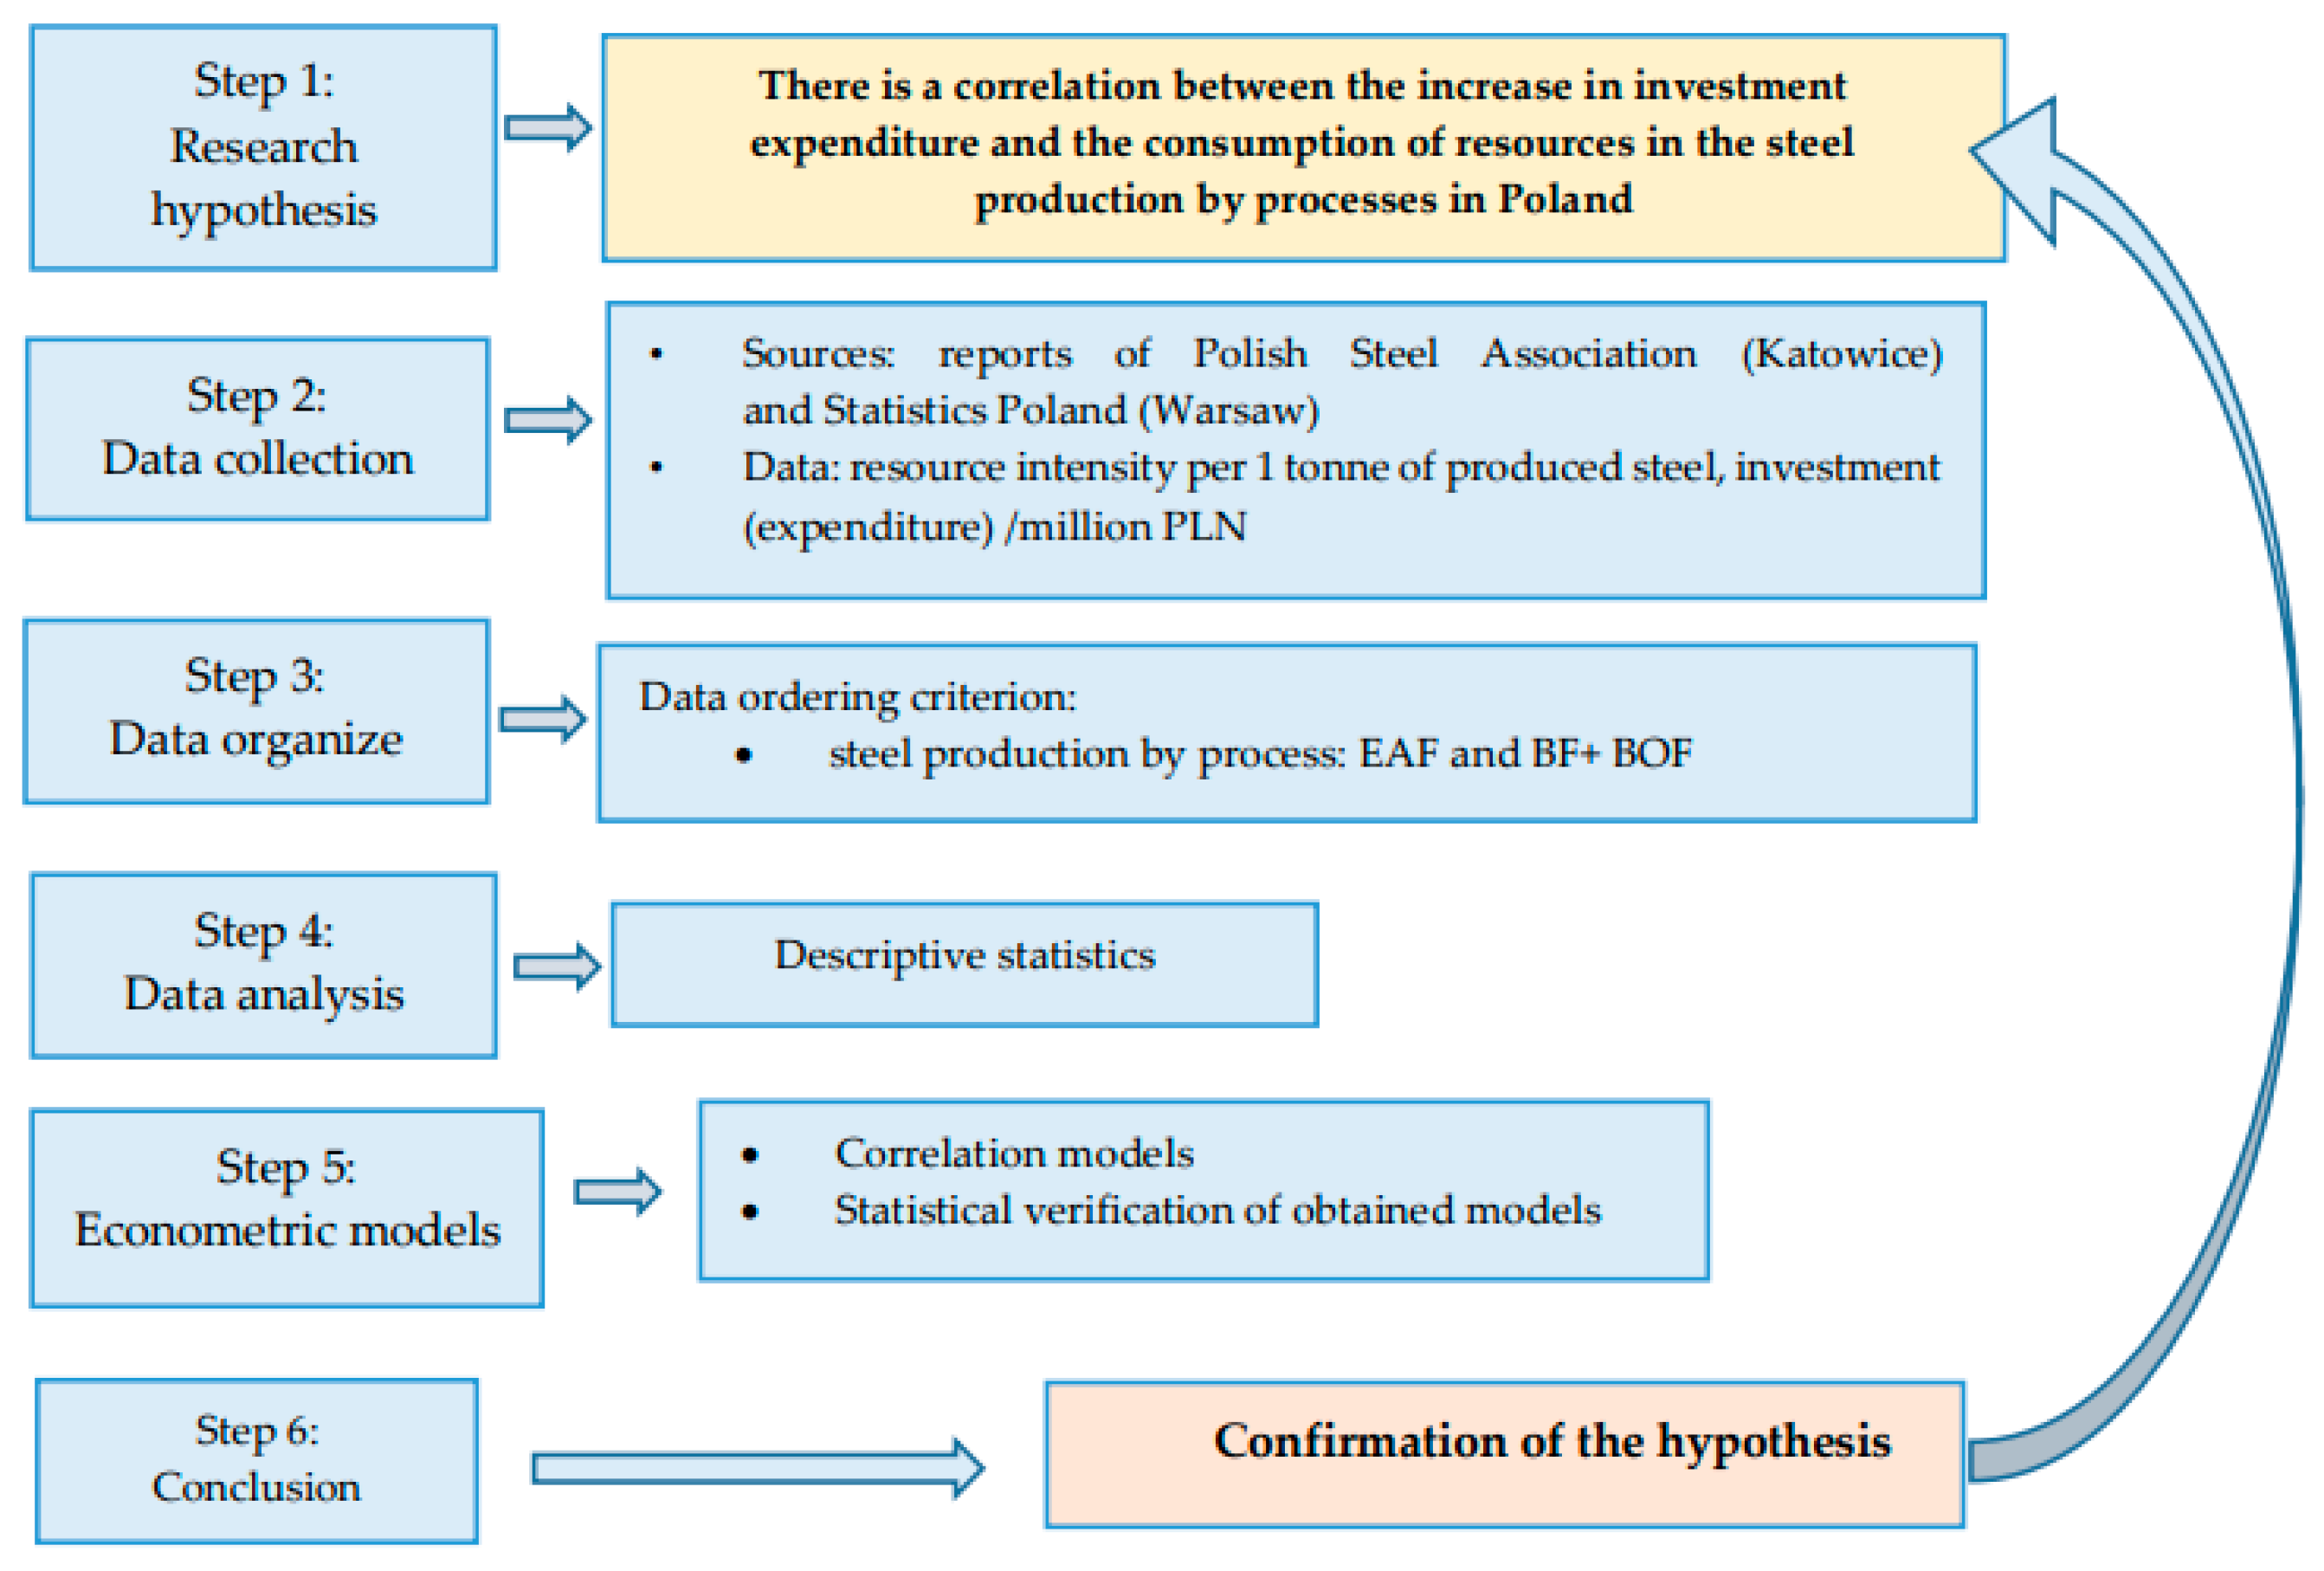
3. Materials and Methods

The subject of the research is the resource intensity of the steel industry in Poland, analysed in the area of resource consumption (energy utilities) in steel production processes. Two key resources were analysed: electricity and coking coal (coke), i.e., energy and coke intensity. Energy consumption is the consumption of electricity per 1 tonne of steel produced in electric furnaces (Electric Arc Furnace (EAF) technology/installation) and converters (Basic Oxygen Furnace (BOF) technology/installation). Coke intensity is the unit of coke consumption employing the technology: BF-Basic Furnace. Integrated steel plants are equipped with both BF and BOF installations, hence their joint analysis as a process: BF + BOF (in this process, two energy media are analysed simultaneously, i.e., coke and electricity). In the Polish steel industry, 20% of the total energy resources used in steel production is electricity. Coke in the overall structure of resources used (energy media) accounts for 42%. Figure 1 shows the structure of energy media consumption in the steel industry in Poland. The analysed power resources in total account for 62% of all utilities consumed by steel mills in Poland.
The aim of our research was to determine the impact of investments on the consumption of energy media in steel production processes. Two technological processes were analysed: EAF and BF + BOF. The following analyses were performed:
analysis of the resource consumption in the steel industry in Poland in the years 2004–2018,
determining the impact of investments on resource consumption in the steel industry. The result of this stage of research was the development of econometric models presenting the correlation between investments and resource consumption in the analysed sector.
The data used for the research comes from industry and industrial reports of institutions dealing with data collection in Poland: Statistical Office (GUS) and Polish Steel Association (HIPH). The collected data were assessed from the point of view of their usefulness for the purposes of the research topic. The statistical data included in the yearbooks described the entire steel industry. Before conducting our own research, the data on the consumption of energy utilities and completed investments were organised according to the analysed production processes. Carrying out research on the impact of investments on resource consumption by the steel sector in Poland (consumption of utilities: electricity and coke in steel production processes), descriptive statistics and econometric modelling (study of the interdependence of characteristics) were used. Figure 2 shows the phases of the research methodology used in our research.

4. Results and Discussion

4.1. Analyses of Resource Intensity in Polish Steel Industry

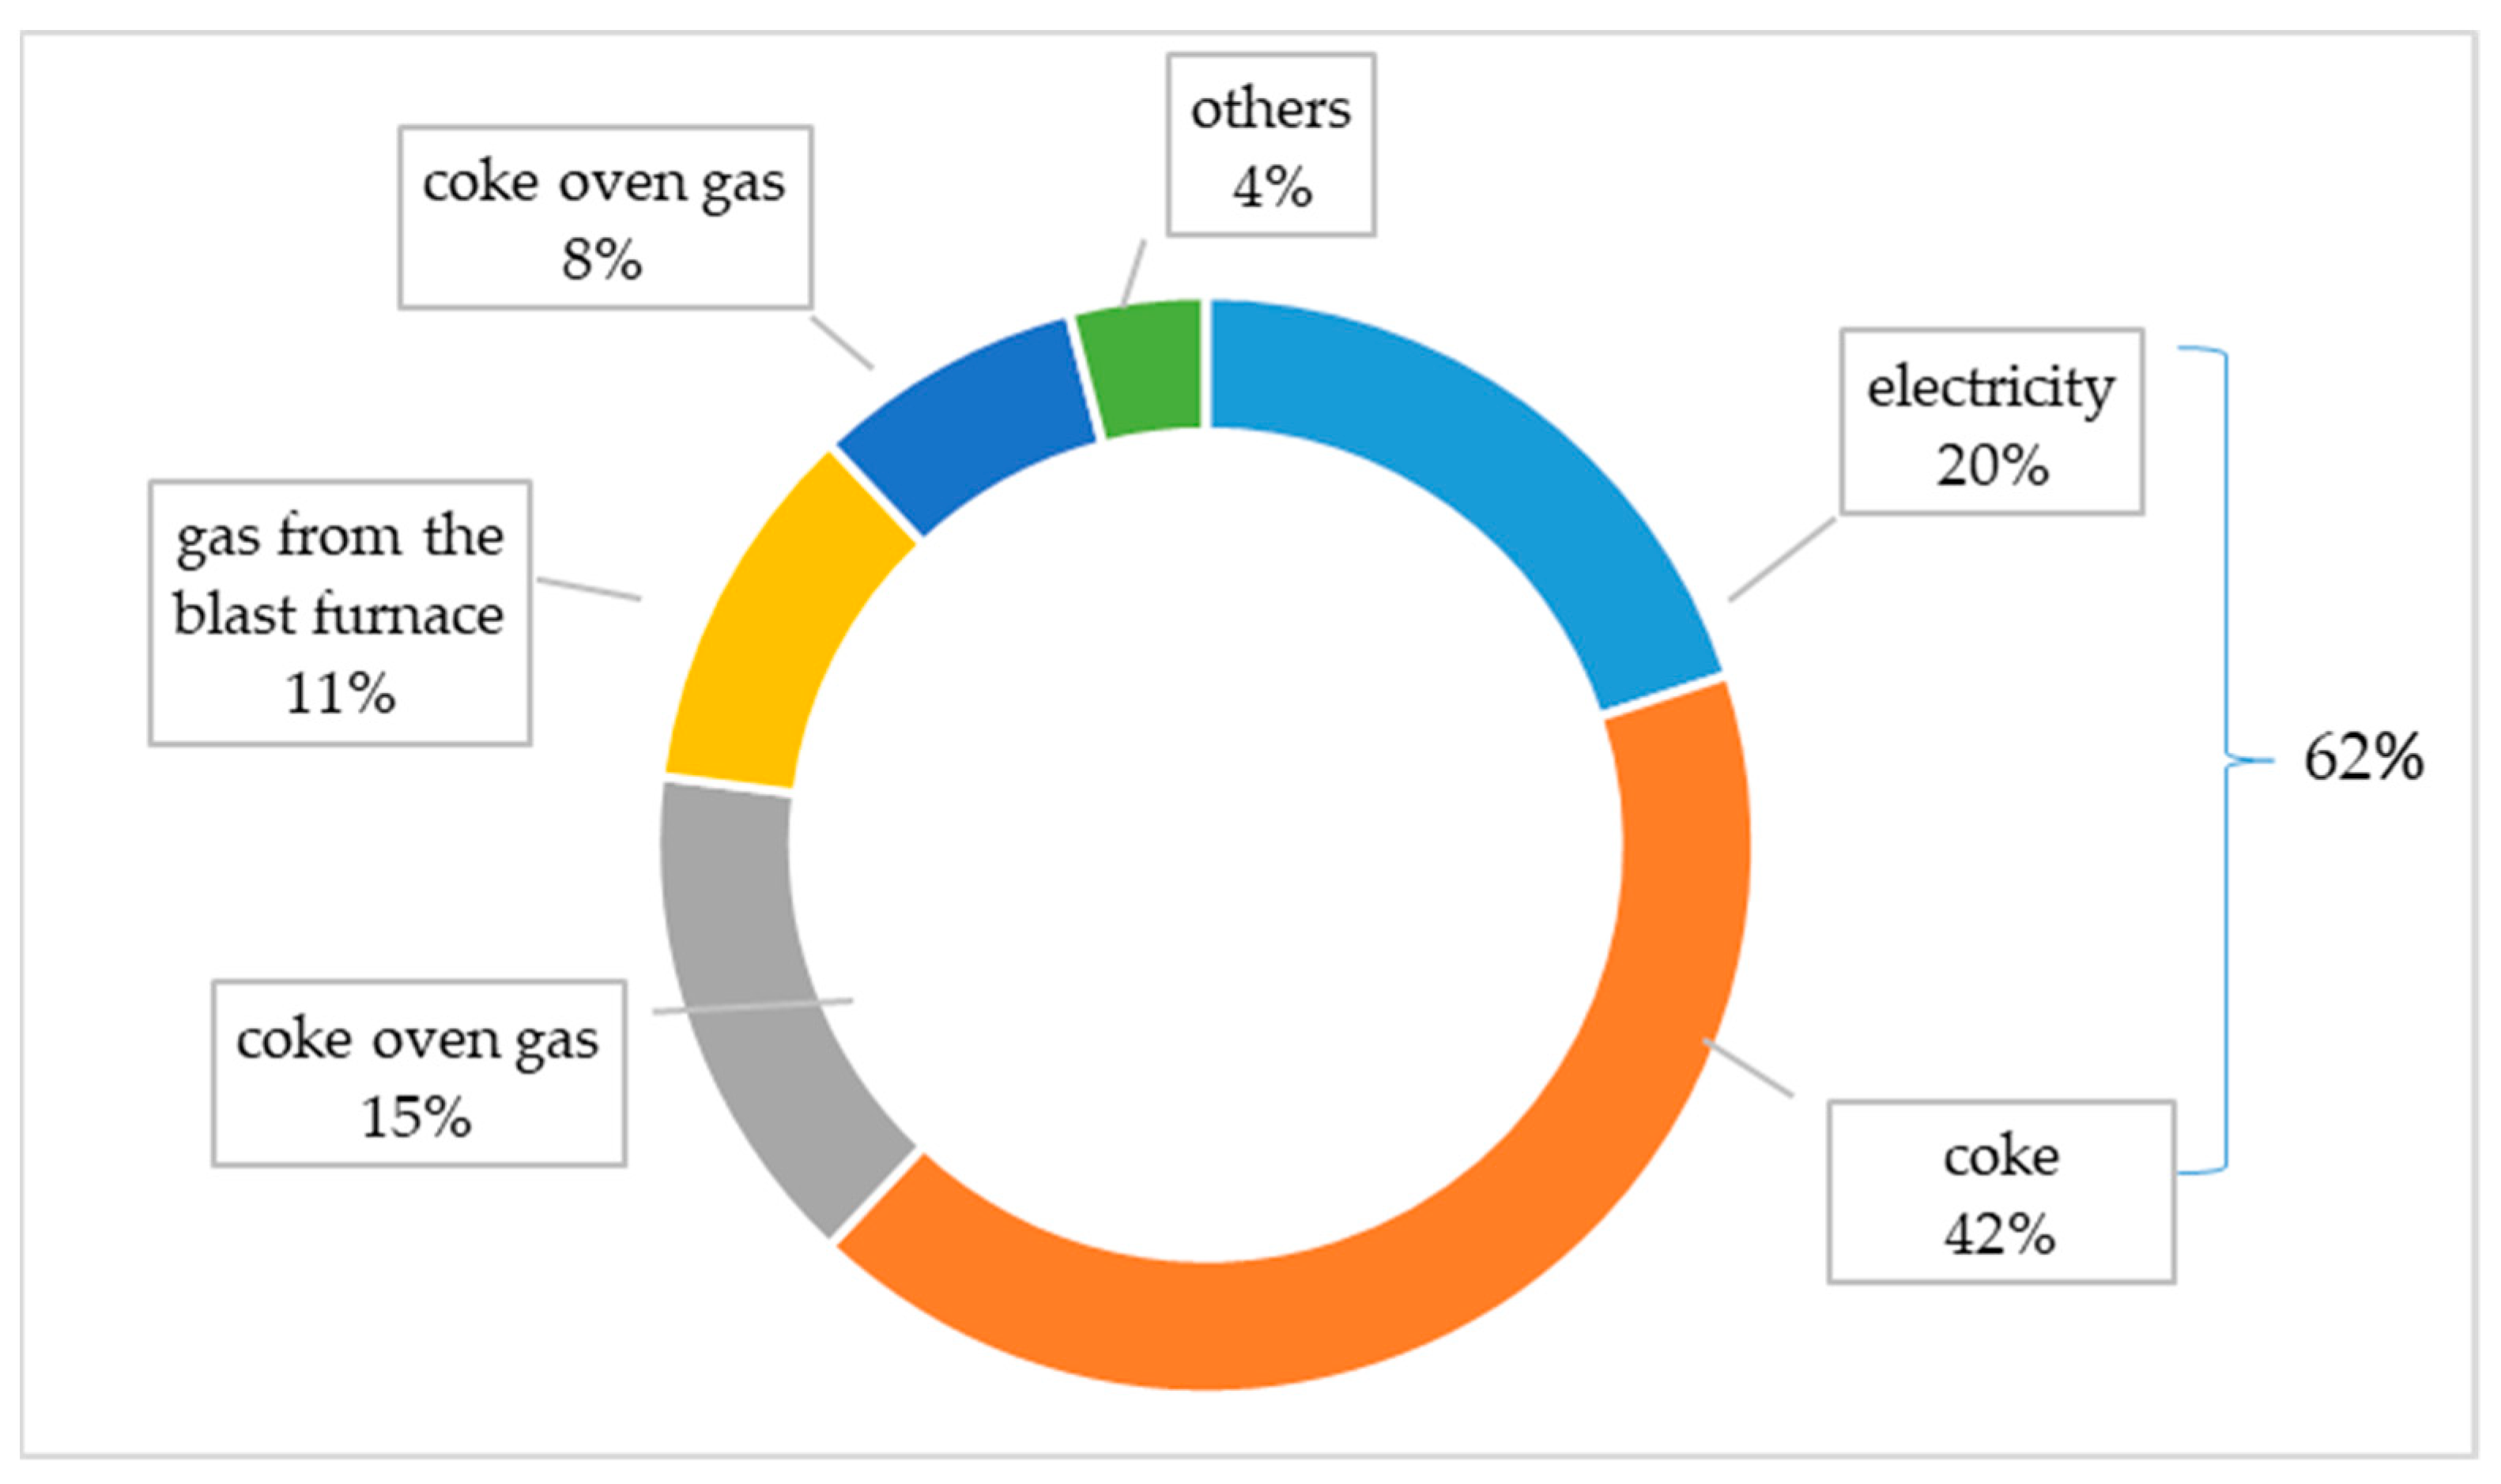
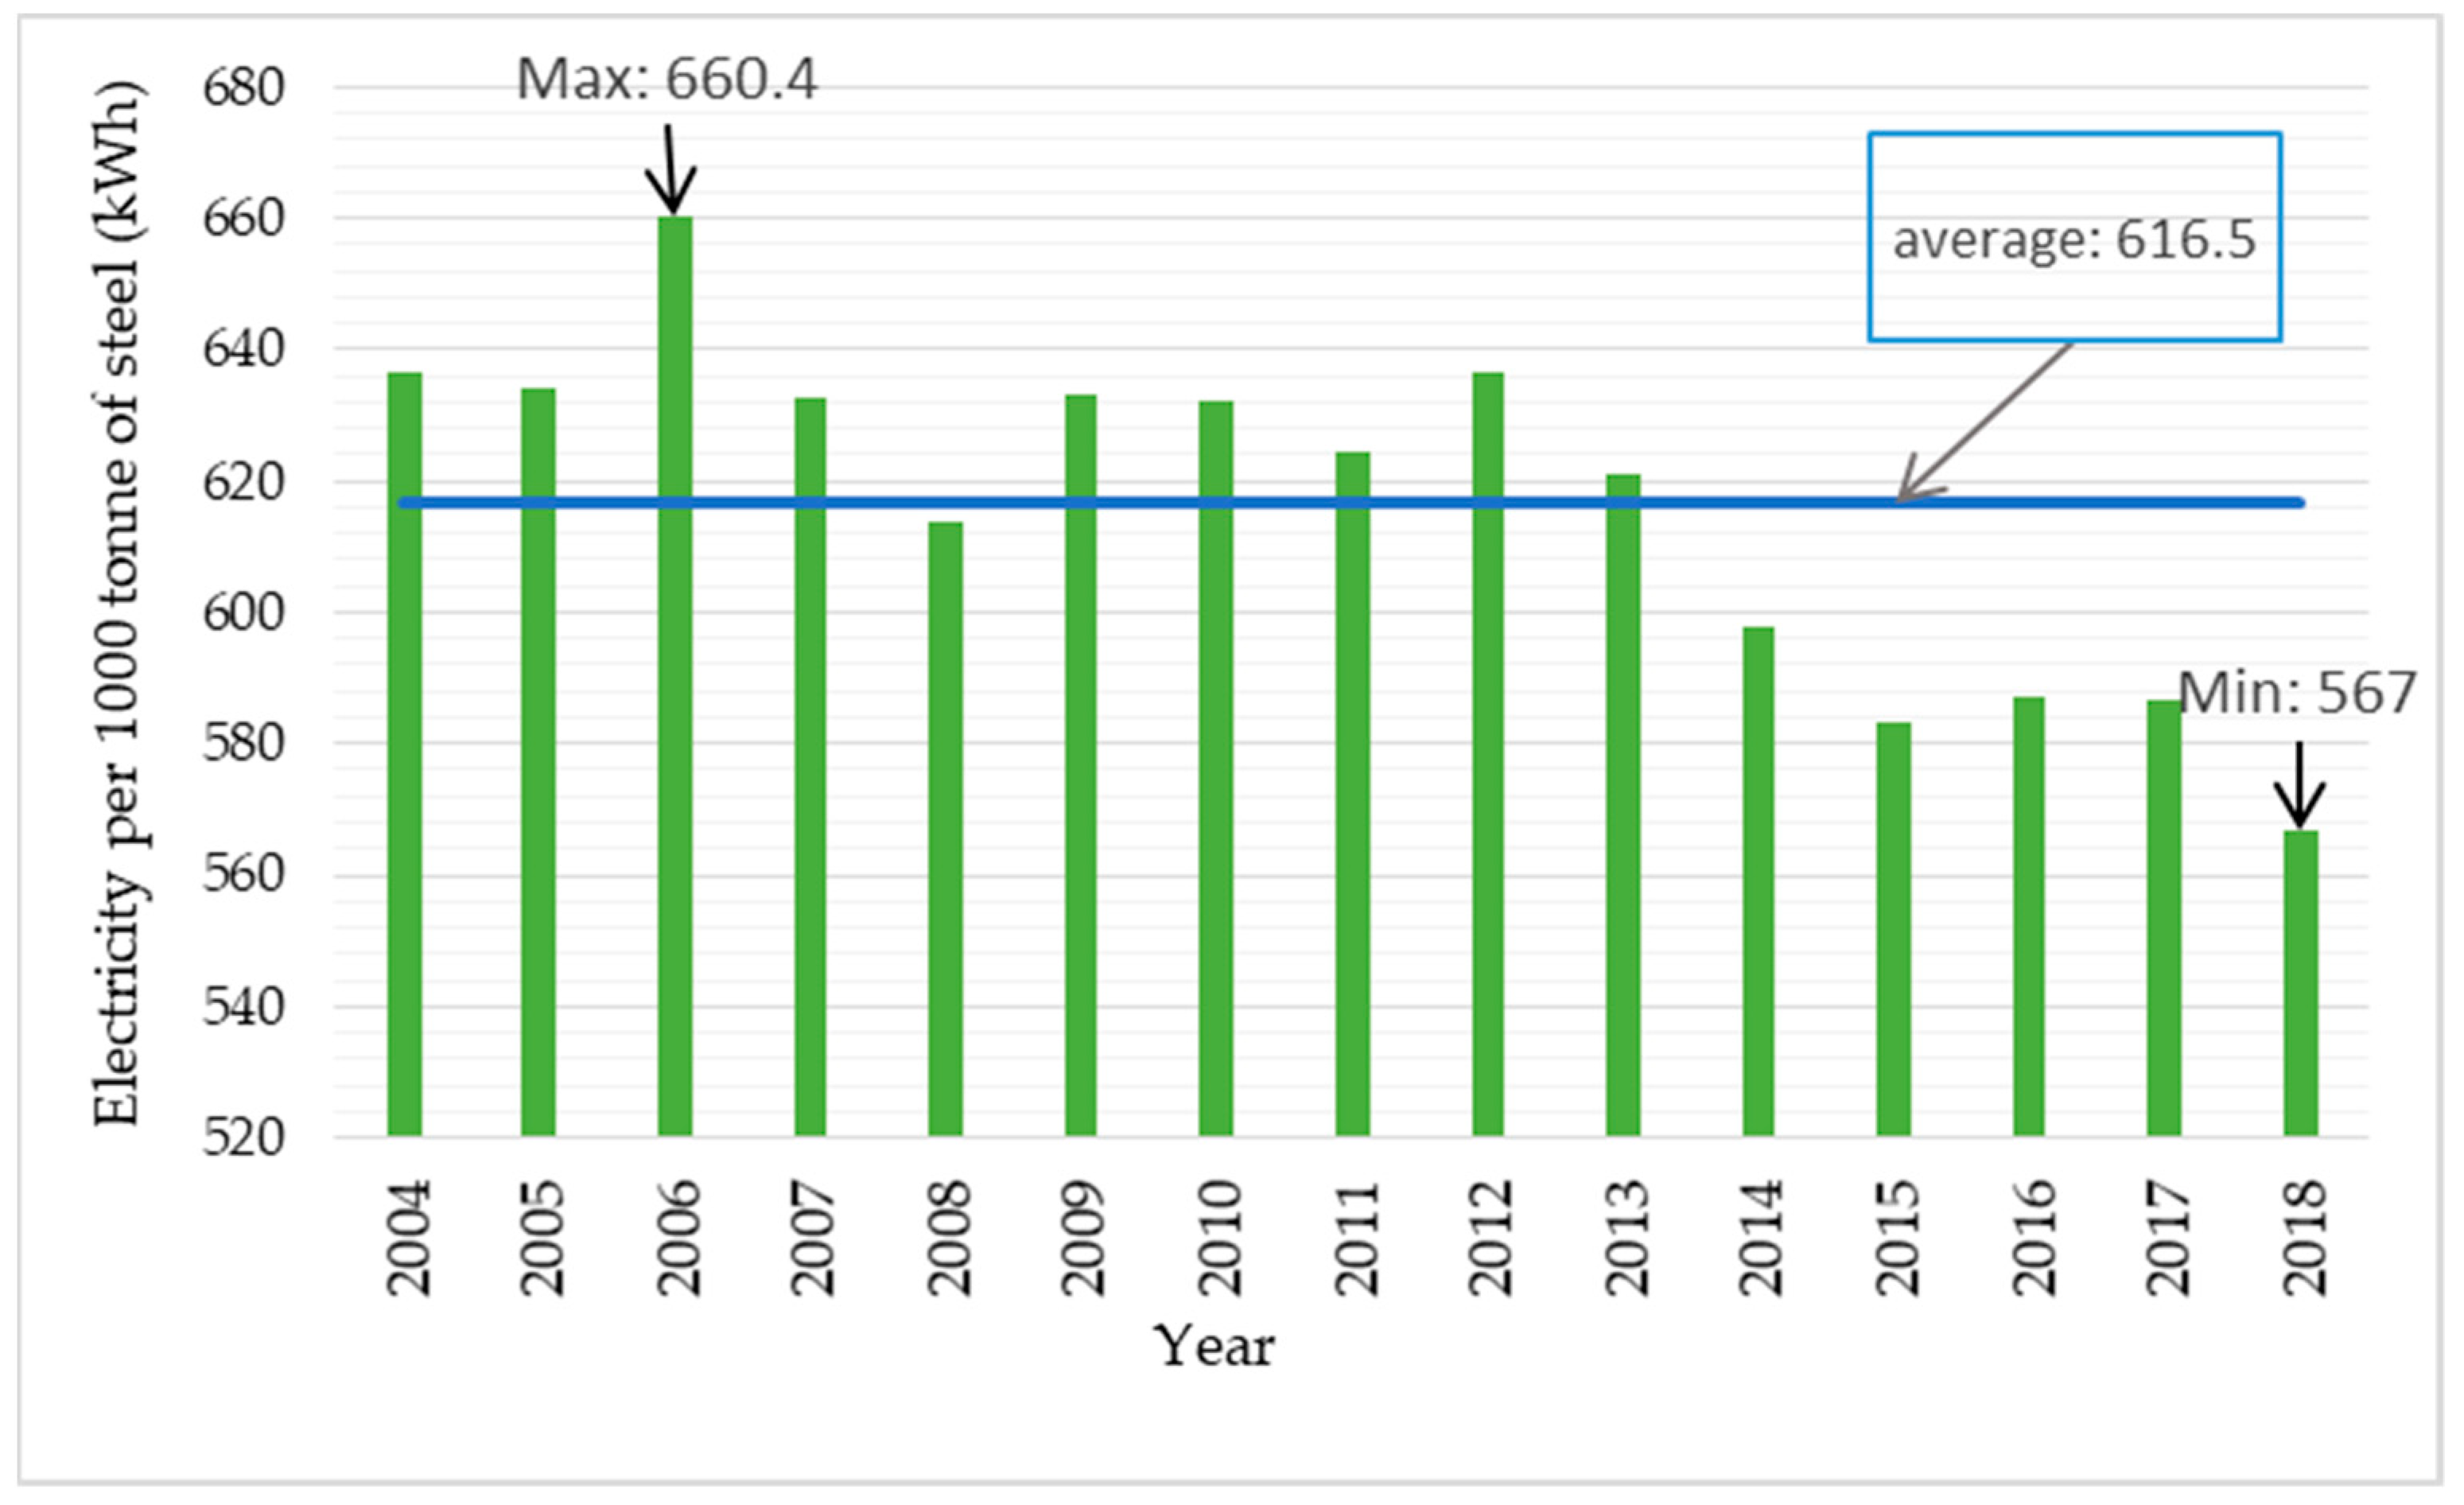
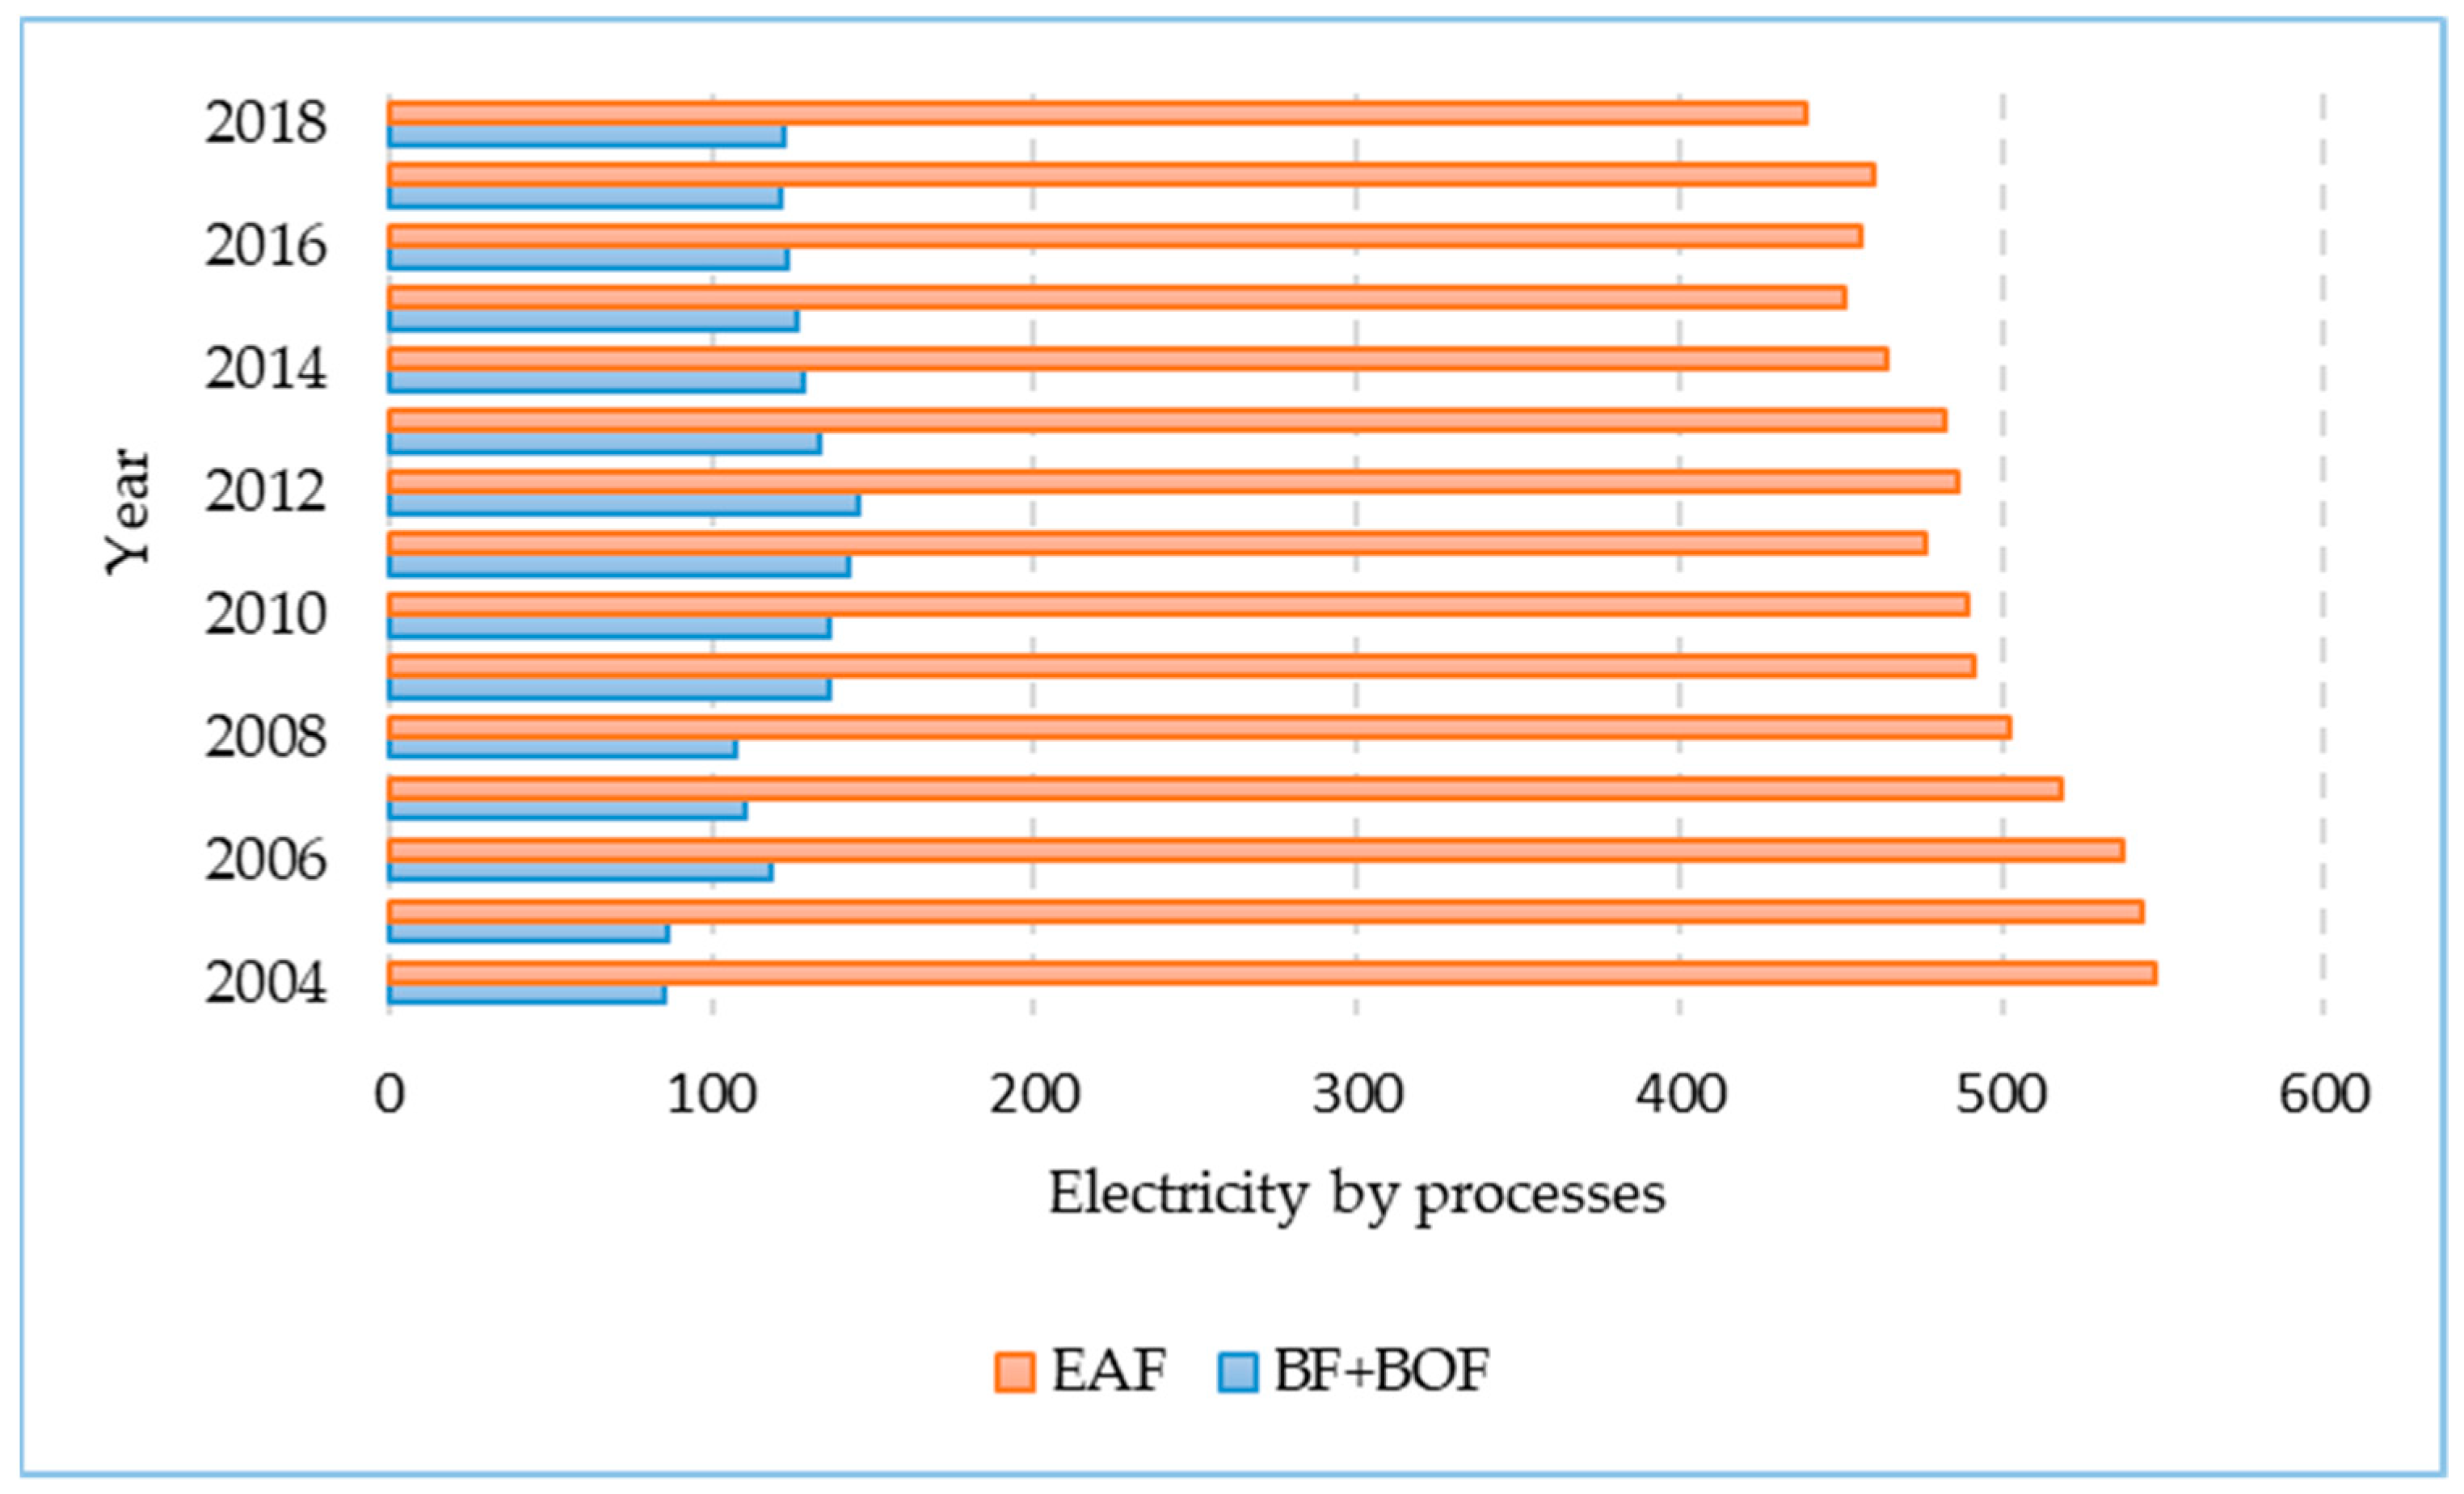
4.1.1. Electricity Intensity

The data show that from 561.4 to 655.9 kWh of electricity is consumed per 1 tonne of steel produced (in total in electric steel mills and integrated steel mills in the analysed period [59]. Figure 3 shows the unit electricity consumption (per 1 tonne of steel) in the years 2004–2018. In the last four years (from 2014 to 2018), the average electricity consumption was 452 kWh per 1 tonne of steel produced. In the entire analysed period, the average electricity consumption was 557 kWh/1 tonne of steel.
Electricity consumption is higher in the production of steel in the EAF process installation than in the BF + BOF installation (Figure 4). For comparison, in 2004 the electricity consumption of EAF technology was 6.4 times higher than in the BF + BOF technology. In 2018, electricity consumption of EAF technology was 3.6 times higher than in BOF. In 2004–2018, electricity consumption in the steel production process using EAF technology decreased by 19.89%.

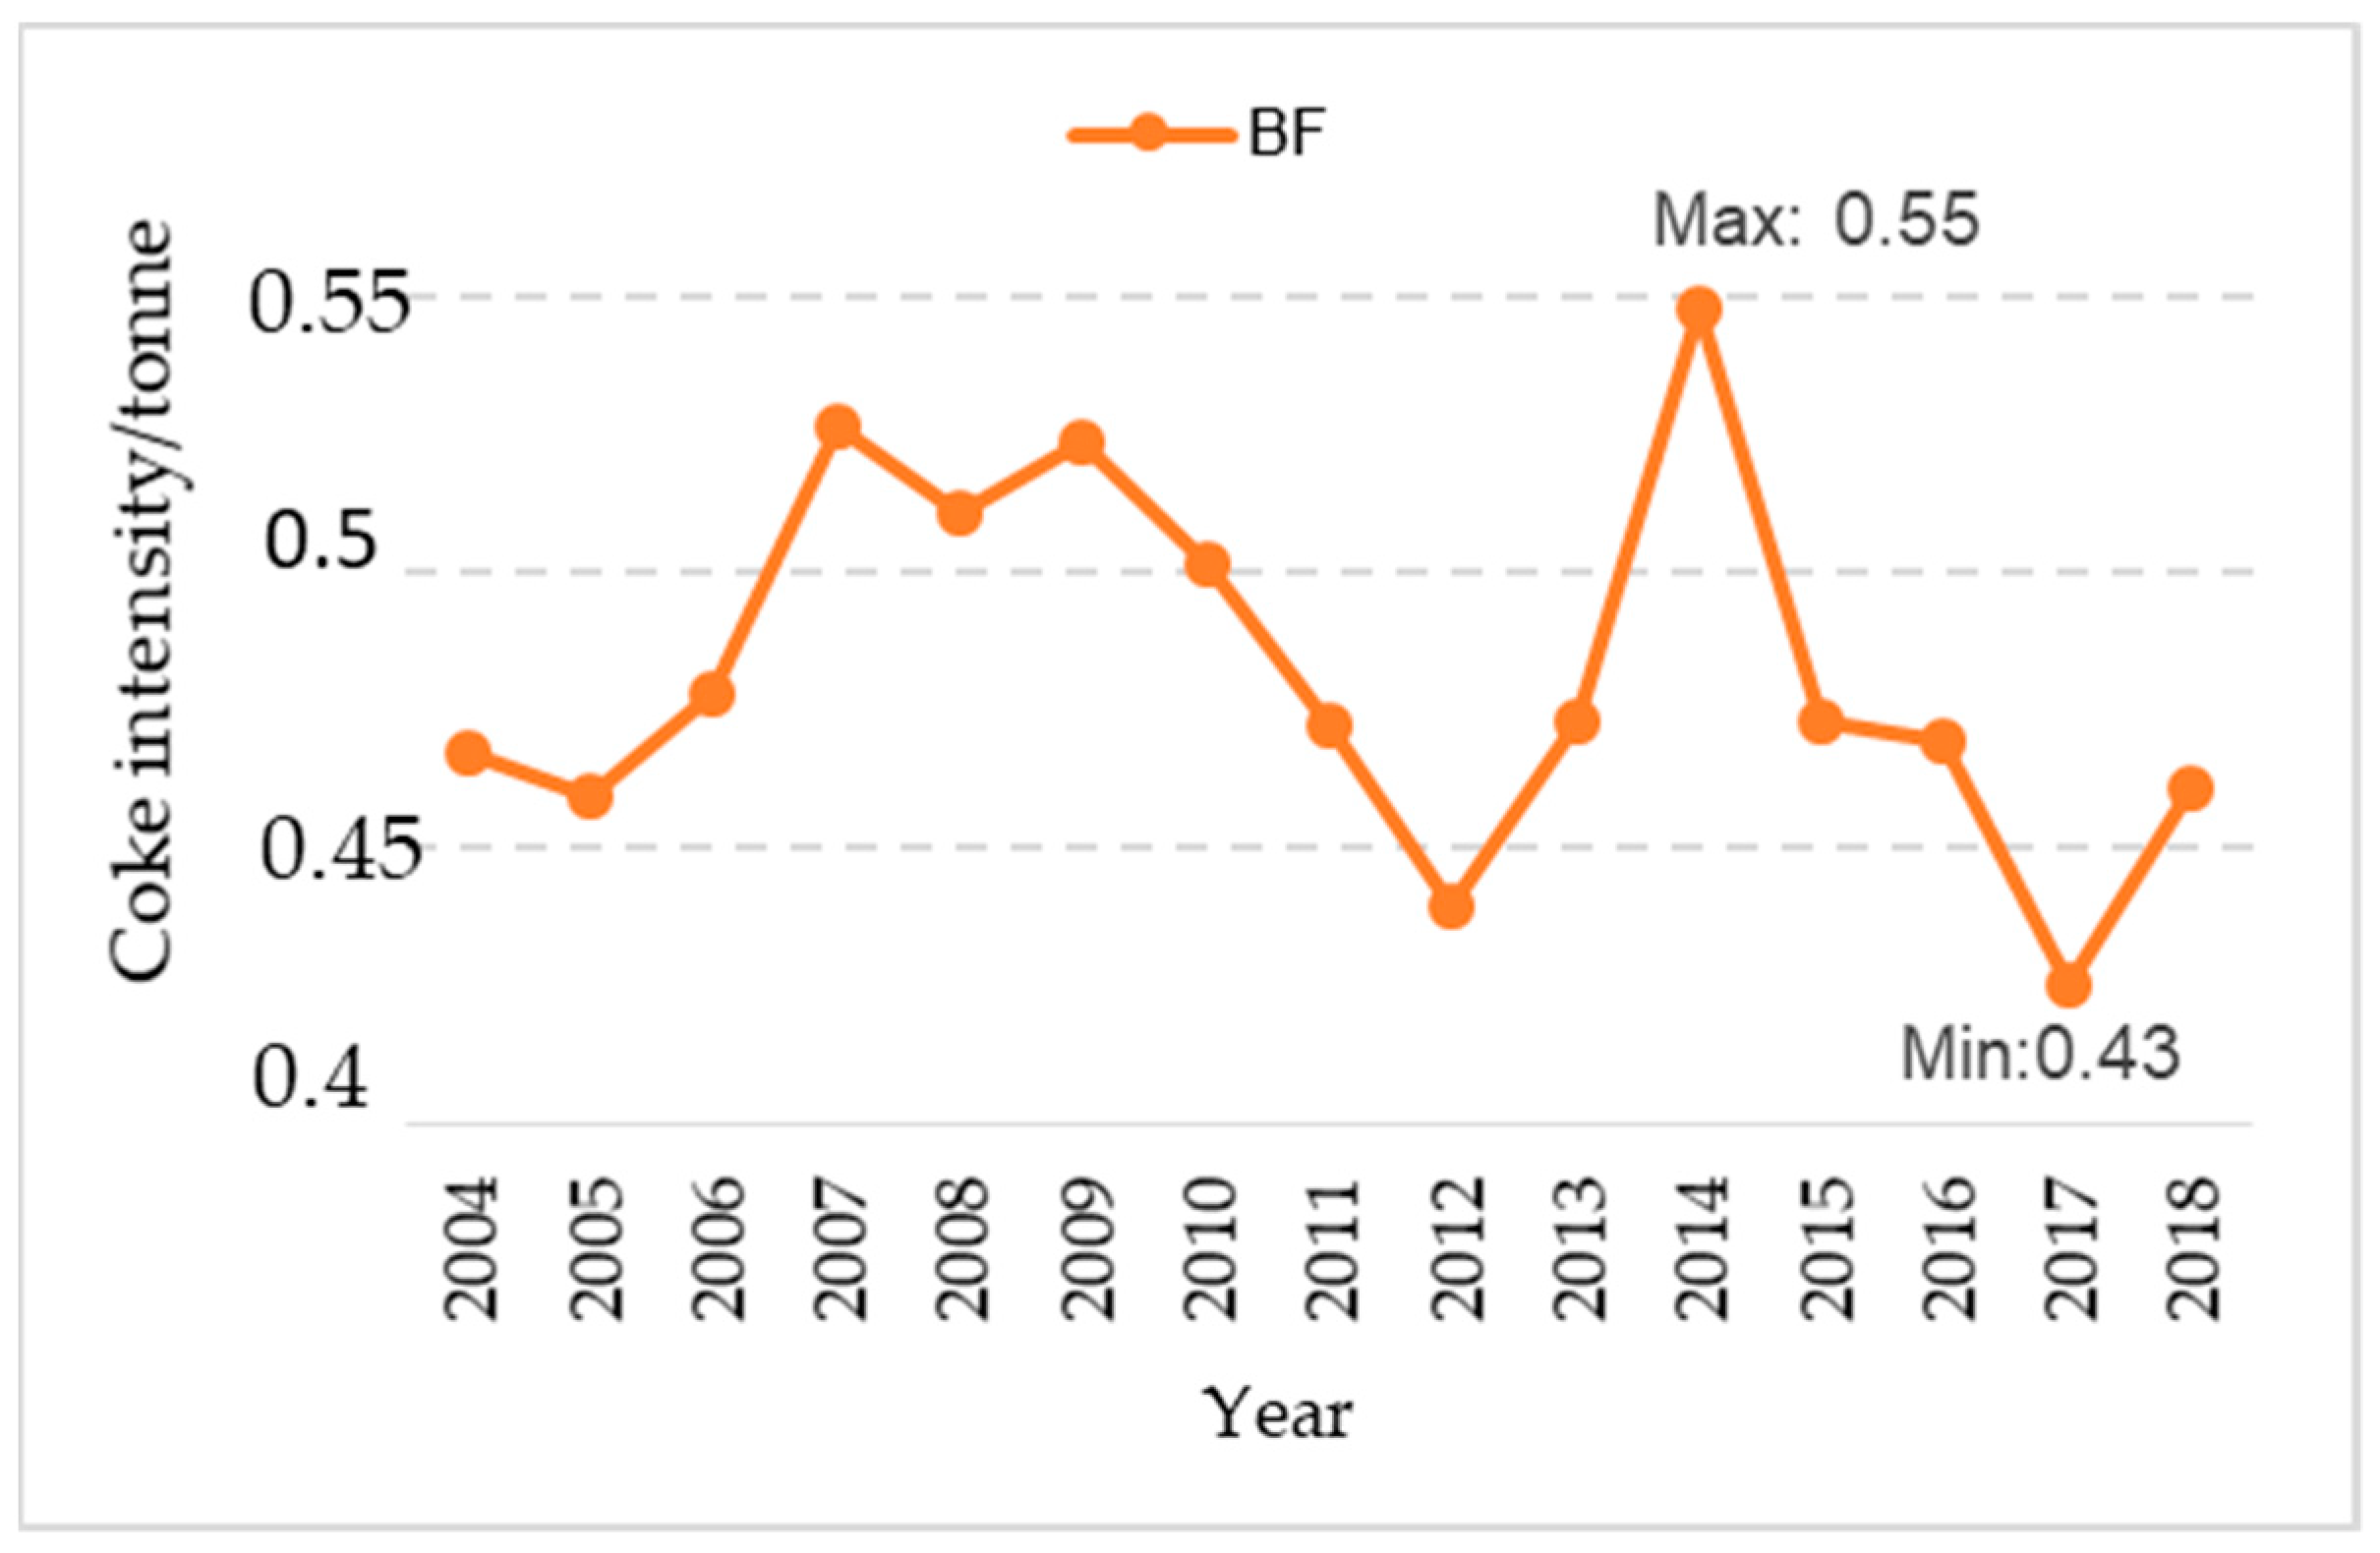
4.1.2. Coke Intensity

The second analysed resource was coke, which is the main fuel for BF technology. Figure 5 shows the unit coke consumption by BF technology. On the basis of the analysis, it was found that to produce 1 tonne of steel (pig iron), about 0.5 tonnes of coke are consumed. With BF technology, the average unit coke consumption in the analysed period was 0.48 tonnes.

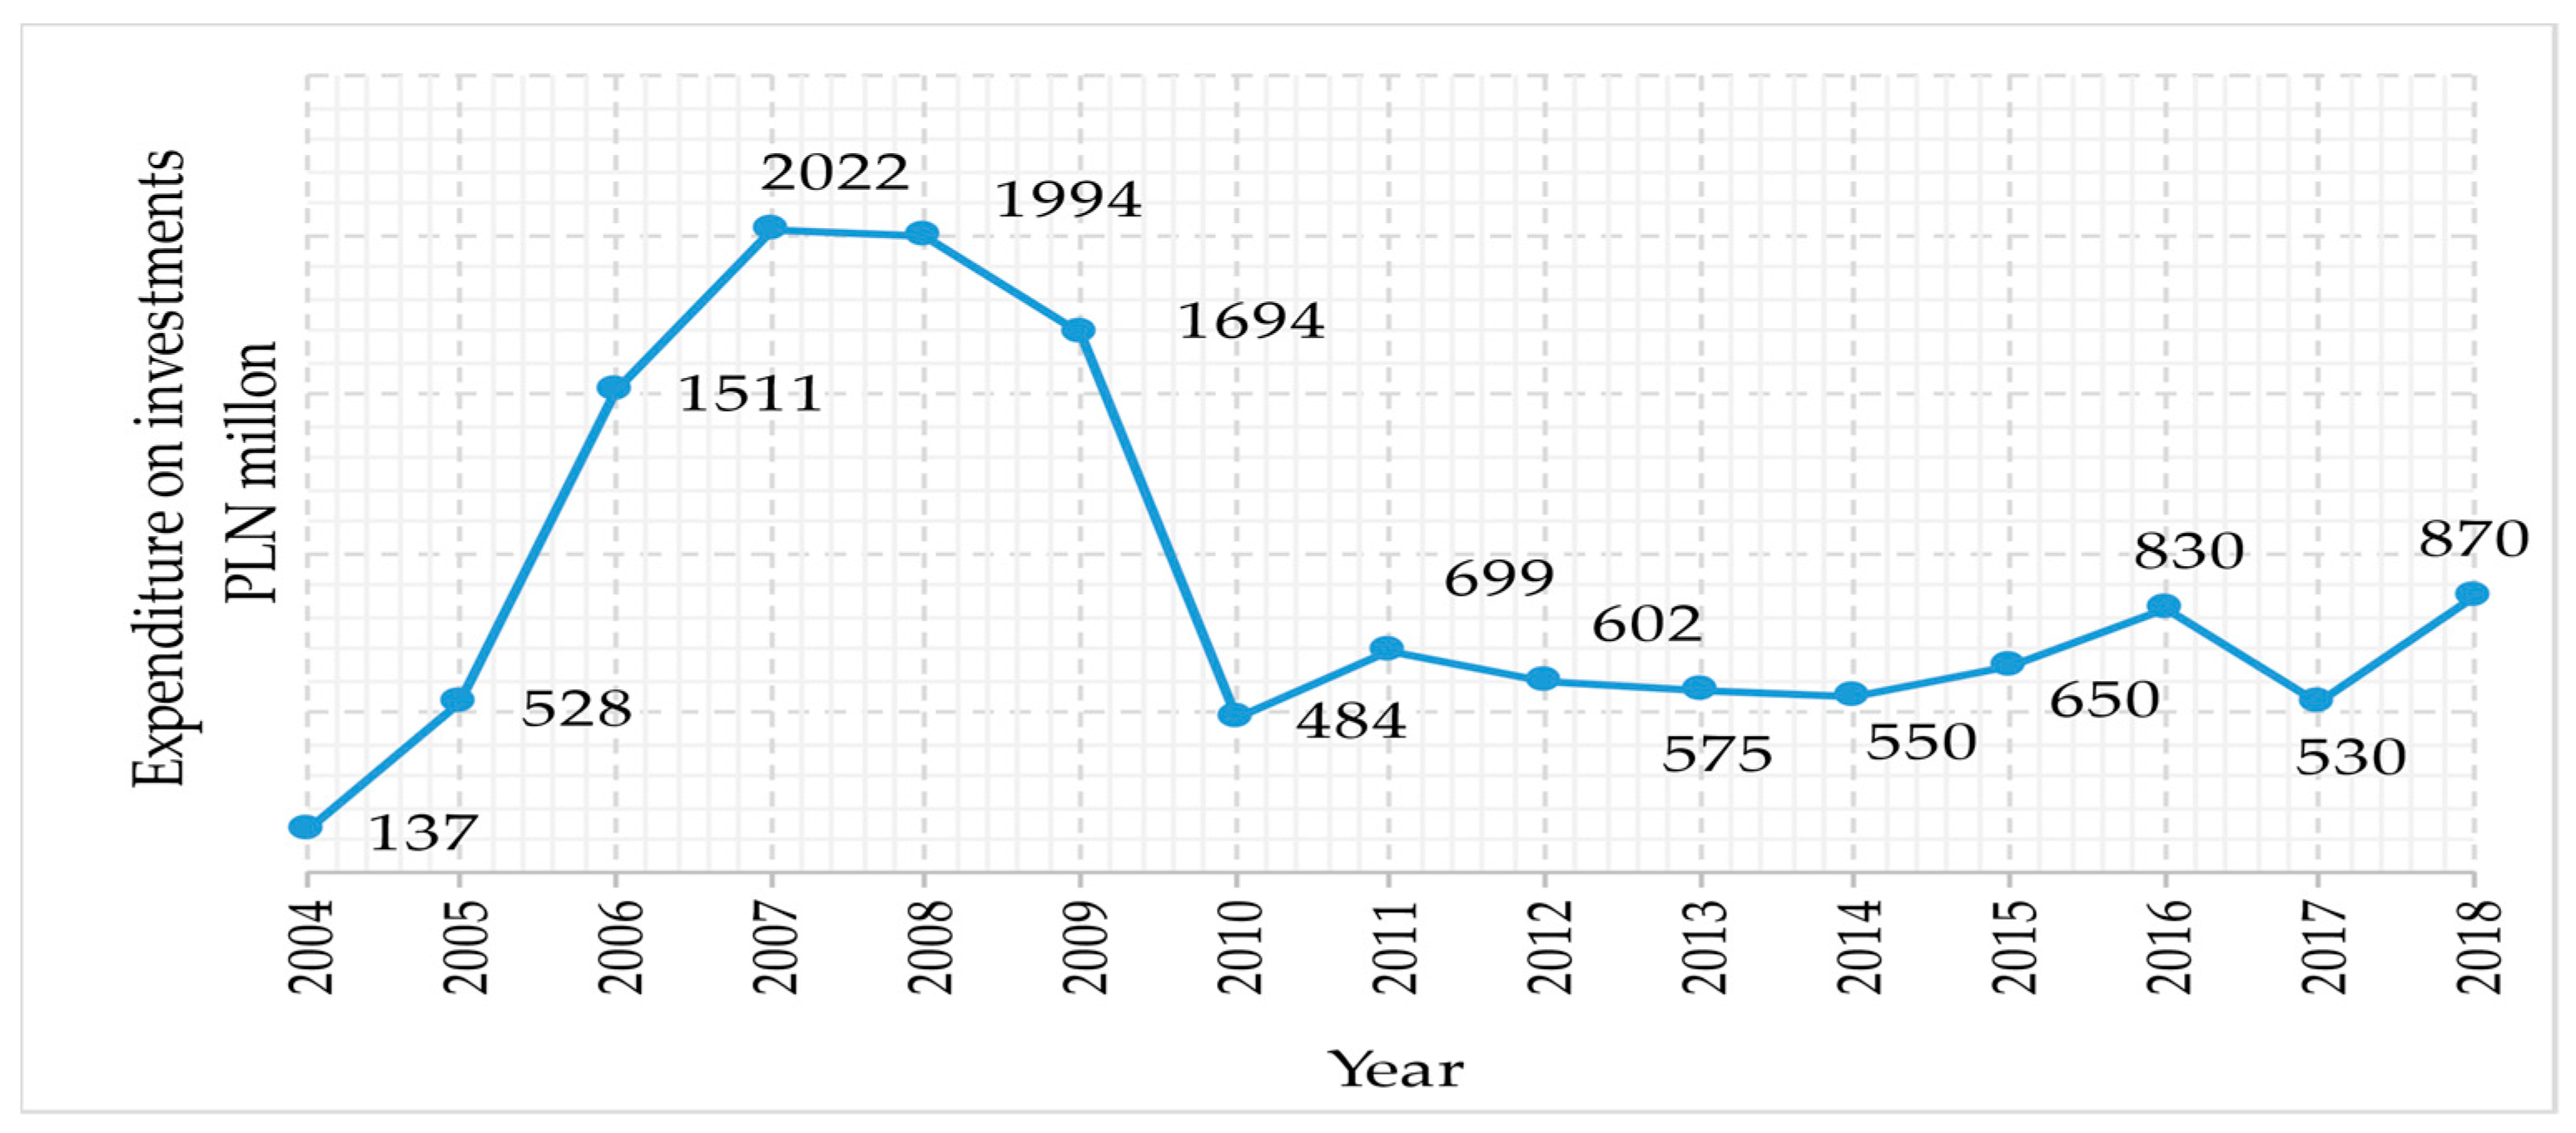
4.2. Analyses of Expenditure on Investment in Polish Steel Industry

In 2004–2018, steel companies spent PLN 13.7 billion on investments. The investment spending trend is shown in Figure 6. The highest expenditure was recorded in 2007–2008, i.e., just before the financial crisis that started on the US financial market and reached Poland in 2009. Its effects in the steel industry were intensified in 2010 by a decline in technological investments. After 2010, expenditure on investments did not exceed PLN 2 billion. Average annual expenses in the period from 2010 to 2018 amounted to PLN 643 million. High investment expenditure was recorded in the years 2006–2009. During this period, the restructuring process of the steel mills was completed, and the ‘market power’ of ArcelorMittal, which is number one on the Polish market and whose production capacity in Poland is estimated at 70% of its strength [50,52]. In 2004, the steel sector was booming. High investment expenditure in the period from 2006 to 2009 was also related to the adaptation of steel production technology to the requirements of environmental law and the steel mills’ drive towards sustainability [57].

4.3. Dependency Models between Realised Investment and Resource Intensity for Polish Steel Industry

In econometric terms, the subject of our study was to confirm or reject the thesis that, as investment expenditure increases, resource consumption (energy and coke) decreases. Both linear and nonlinear models are used in the analysis.

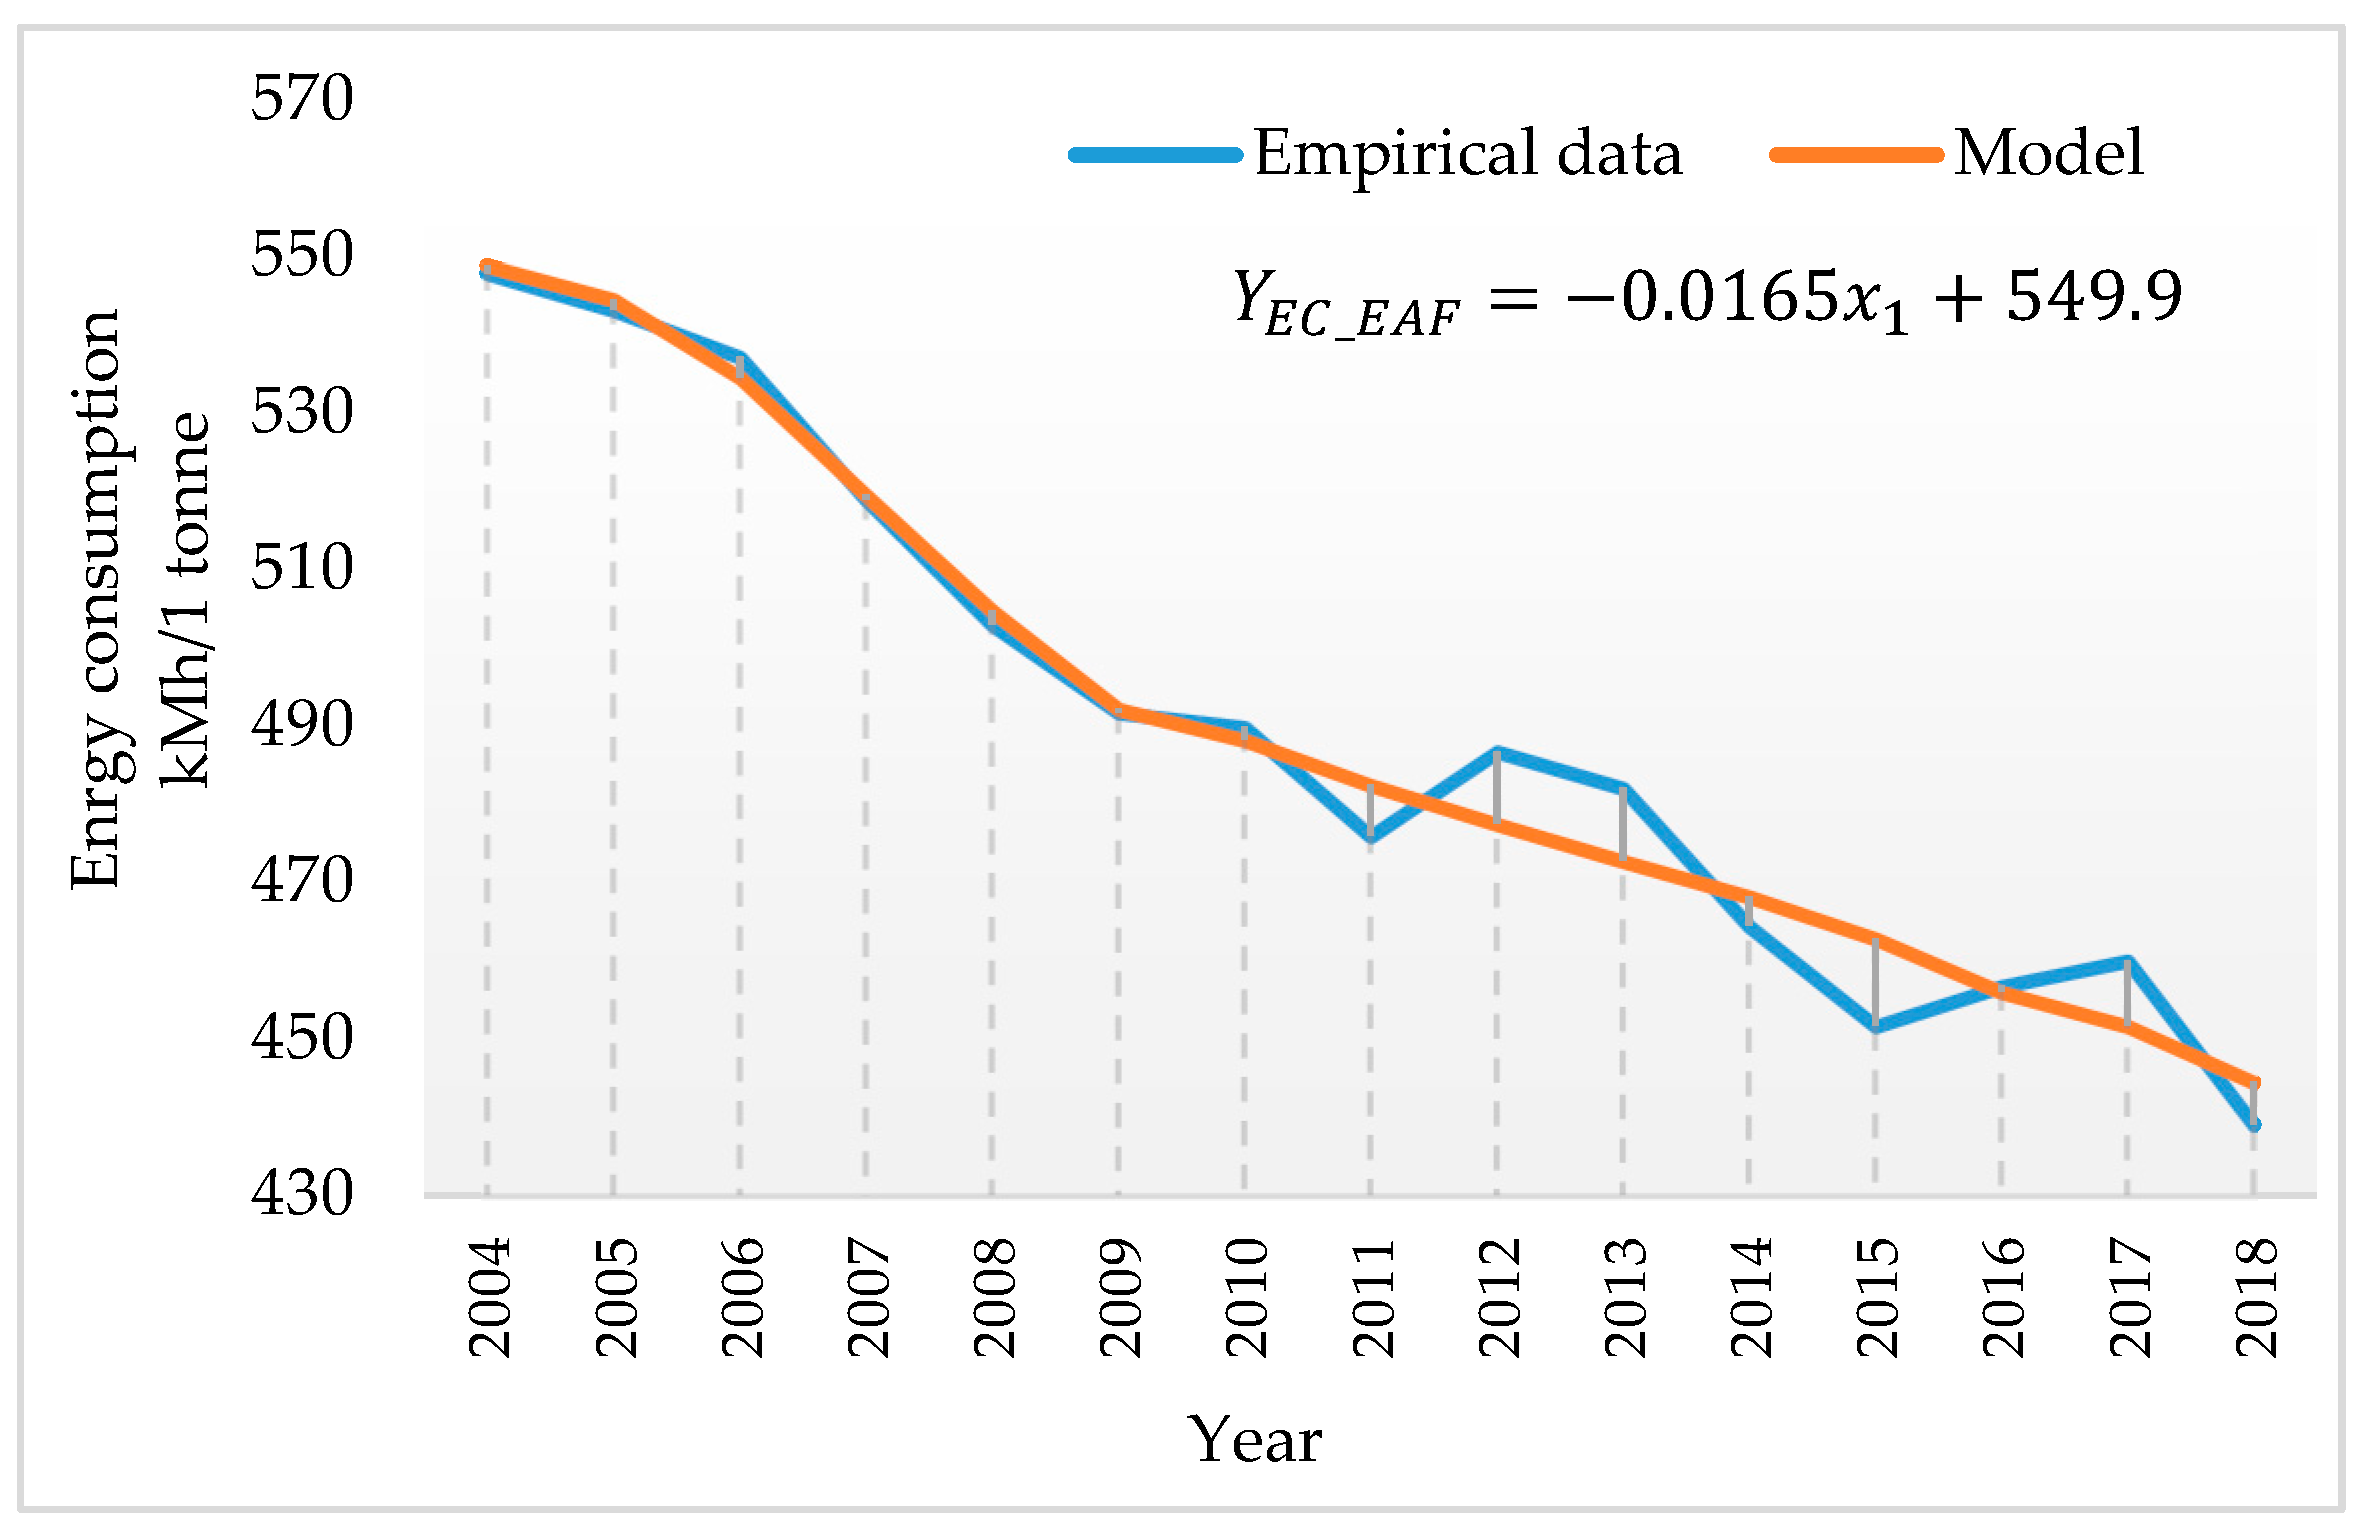
4.3.1. Investments and Energy Consumption in Steel Works with EAF Installations

The model of dependence of the characteristics tested (investments and energy consumption) for Polish steel works with the EAF process plant is presented in the Formula (1):
y E C _ E A F = 0.0165 x 1 + 549.9
where: YEC_BOF—unit energy consumption in steel mills with the EAF installations in relation to production volume (kWh /1 tonne of crude steel from the EAF process) and x1—realised investments in steel companies with the EAF installations (cumulative investment values since 2004, in PLN million).
Figure 7 shows the results of the analysis.
The model (1) is significantly statistical, and the quality of the model is very good. The statistical quality of the model was found on the basis of statistics and tests (Table 1 and Table 2).
The explanatory variable in this model (1) is important, and its match with the empirical data is very high and good for the drawing of conclusions. Therefore, further statistical verification of the model was carried out (Table 2).
Interpretation of parameters on the basis of the model no. 1: increase in investment expenditures in enterprises producing steel in electric furnaces by PLN 1 million will lead to a decrease in unit electricity consumption by 16.5 kWh/1 tonne of crude steel, with other factors unchanged. In electric steel plants, the main energy raw material is electricity, so most of the capital expenditure, which was to improve competitiveness by increasing production efficiency, also led to the decrease in the energy consumption.
These results are in line with the findings of He et al. [60], who stated that China’s steel industry has made remarkable achievements in the last two decades by improving technology levels and promoting energy-saving technologies, which resulted in considerable reductions in the energy consumption of steel production. It was possible due to outlays on technology expended, inter alia, on achieving high-class product quality, and adoption of energy-saving technologies [61]. Our results also confirm the findings of Pappas et al. (2018) [38], who revealed that “India’s energy intensity per economic output is significantly higher than that of China—caused mostly by the steel industry—which shows the urgency for innovation”.

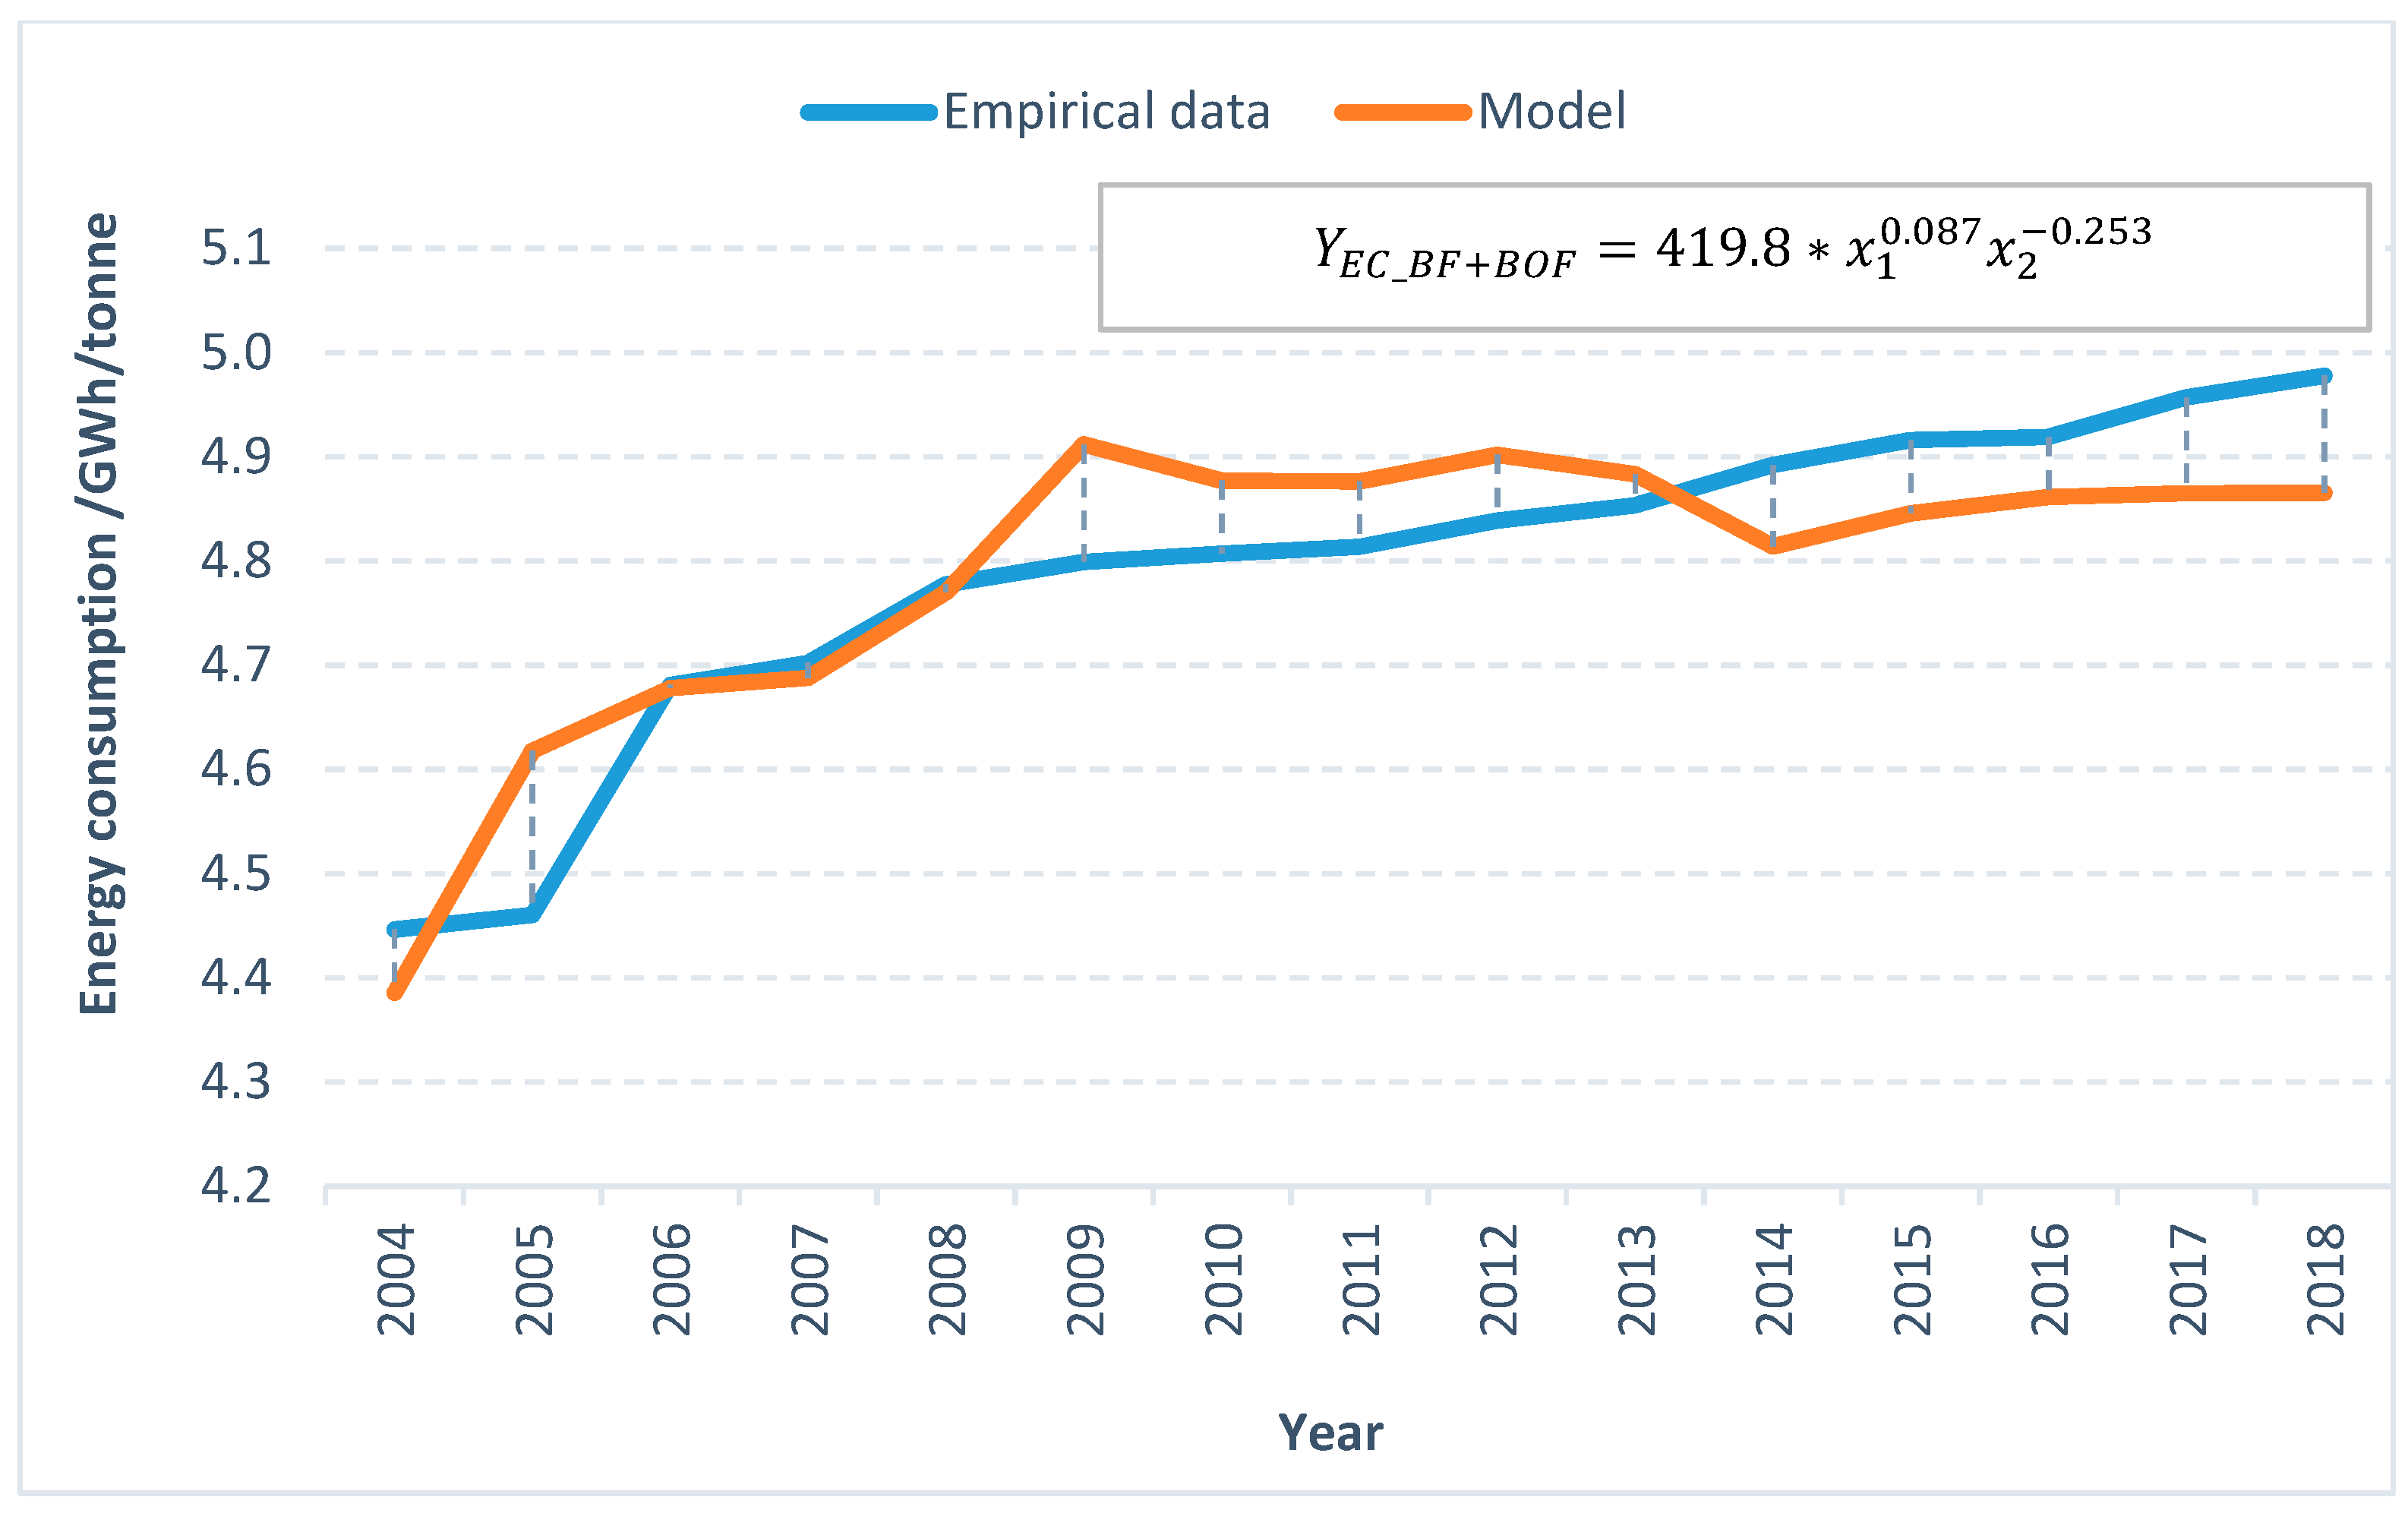
4.3.2. Investments and Coke Consumption in Steel Works with the BF + BOF Installations

When analysing the impact of the investment on coke consumption in steel mills integrated with the BF + BOF installations using the linear function, a moderate (average/cut fit of the model to empirical data) was obtained. Therefore, nonlinear modelling with two variables was used:
x1—energy consumption, x2—coke consumption.
As a result, model no. 2 was obtained (2):
Y E C _ B F + B O F = 419.8 x 1 0.087 x 2 0.253
where: YEC_BF + BOF—unit energy consumption in blast furnaces and converter steel mills in relation to production volume (kWh/1 tonne of crude steel), x1—realised investments in steel companies with the BF + BOF installations (cumulative investment values since 2004, in PLN million) and x2—coke consumption in blast furnaces and converter steel works (thousand tons).
The model was assessed for the quality of fit, and the results of applying the basic statistics are presented in Table 3 and Table 4.
The explanatory variables in this model are relevant and their match with empirical data is good for inference. The model was further verified (statistical tests) and the results are presented in Table 4.
Interpretation of dependencies based on the model no. 2: increase in investment expenditures by 1% in enterprises with integrated steel plants (BOF + BF) will increase the unit electricity consumption by 0.08%, with other factors unchanged. On the other hand, an increase in coke consumption (alternative energy raw material) by 1% will result in a decrease in unit consumption of electricity in an integrated process (BF + BOF). The coke reduction effect was associated with an increase in electricity consumption. The model leaves some of the variability of energy consumption in converter steel mills unclear. It is a process that uses a much greater quantity of materials, raw and otherwise, for the production of steel than in the EAF process, so there is a field for further research taking into account other factors as well. Figure 8 shows the obtained model (Formula (2)).
Our research to some extent may be related to the findings of Egilmez et al. [62] who have analysed manufacturing sectors in the USA between 1970 and 2011; iron and steel mills and ferroalloy manufacturing belonged to the top 5 manufacturing sectors based on total carbon footprint share. According to their study, carbon intensity of manufacturing activities has dropped significantly (by over 90%) in the last four decades, which can be attributed to technological advancements. However, while our study took into account the steel industry only, the research conducted by Egilmez et al., [62] had a much broader context. But their advantage is the long time period examined in their analysis (over 40 years) and the data obtained clearly confirm the trend that has been observed in our study as well.
Based on the results achieved in our study we can clearly state that our hypothesis about existence of a correlation between investment and resource intensity in steel production in Poland was fully confirmed.
Other linear and non-linear models presenting the impact of investments on energy intensity in the totality of Polish steel production are presented by Gajdzik [30,63]. These models confirmed the correlation between an increase in investment and a decrease in energy consumption. However, one should add that previous models described the energy intensity in the Polish steel industry, but the distinction between investments into steelworks with EAF installations, and those with integrated steel mills featuring the BF + BOF installation, was not included. In other words, investments in those models were analysed jointly as the annual sum of expenses for the development of technology in relation to the entire steel sector in Poland.
One should add here that over 75% of steel globally is produced using BF + BOF technology, hence a higher level of energy consumption than in the sectoral approach in Poland, where the share of BF + BOF in recent years slightly exceeds 50% compared to EAF technology. For comparison, in China—which is the largest producer of steel, accounting for 50% of global production in 2016 [64]—steel production is dominated by the BOS process, accounting for 94% of the total. The EAF has limited production volume mainly because of the high cost of scrap steel and energy for producing hot liquid pig iron. As a result, any comparison of the energy intensity may be diminished. Nevertheless, steel production in China has similar energy intensity to those in the U.S., with slight differences mainly attributed to the different allocation of by-products [65].
Despite these facts all the models of energy intensity presented so far build a picture of the relationship between investments and energy consumption. However, it should be noted that the previous models do not divide resources into two basic categories, i.e., energy and coke. However, such was done in this study, and the their combined presentation in the form of both models of energy intensity and models of coke intensity builds knowledge in the area of resource intensities in the Polish steel industry. Through access to previous publications of Gajdzik [30,63], readers may obtain information about the evolution of energy intensity models. It is also worth adding that development of these models started with general data (investments and energy consumption) for the entire steel sector in Poland, and extended to detailed data broken down by installation types (EAF and BF + BOF) used in the steelmaking process.
A major challenge for humanity in the 21st century is to combine energy with respect for the environment [66]. This requires governments to focus more on projects that involve renewable energy and are environmentally friendly [13]. In order to meet this challenge, as well as the ones related to Economy 4.0, including the new energy policy (green energy), on 14 February 2017, Poland adopted the Strategy for Responsible Development until 2020 (with a perspective until 2030) [67]. Energy is one of the components of this strategy. The main goal of state intervention through the Strategy is to create the conditions for the participation of enterprises of all sectors in the process of digitisation of industry. In turn, the key element of this process is the reconstruction and integration of the infrastructure based on the forecasts for the development of the Internet of Things market, renewable energy sources, fossil fuels, energy storage and electric cars. The development of the ICT industry and the implementation of large-scale sensors and control systems based on information received from them (including smart grids) should contribute to the creation of new management models, e.g., energy consumption, traffic, transport, and will also affect the emergence of new production models in other industries. The Strategy emphasises the need for correlation between investments in the energy sector and the so-called fourth industrial revolution. This synchronisation is to avoid the costs of abandoning non-amortised technologies and achieve demonstration effects and economies of scale. Above all, it will allow one to solve problems that today are regarded as serious challenges to traditional energy systems, such as the instability of renewable energy sources, the inelasticity of demand and production, or the inability to store energy.

5. Conclusions

The main goal of our study was to analyse whether the technological investments that have been made in the steel industry in Poland have had an impact on the resource intensity of two basic raw materials used in the manufacturing of steel. Using statistical data, we have analysed both the value of the investments in the said period as well as the use of those raw materials, and have sought a correlation between them. Our analysis was supported by development of both linear and nonlinear econometric models. Subsequently, one can say that there is no doubt that the investments made in the steel industry in Poland after the transformation of the political system in the 1990s allowed the industry to reduce energy consumption by eliminating outmoded production capacity (technological upgrading) and implementing energy-saving technologies. It also allowed the substantial reduction of harmful emissions to the atmosphere. A further increase in investment in the steel sector will result in a reduction both in energy consumption per 1 tonne and coke consumption per 1 tonne of crude steel. The proposed econometric model was only an example of a possible relationship between expenditure on investment and resources intensity in the analysed industry. Steel companies should focus on new technological investment throughout the whole supply chain.
The assessment of the state of the resource economy should be done within a specific industry using a particular measure or model. Analysis of energy and coke intensity in the steel industry (sector analysis) corresponds to the examination of individual products, in this case steel. The analysis performed in this way belongs to technological analyses. It is most interesting for a manufacturer (steelworks), because it gives a picture of the sector in which the company operates. The results, presented both in production units and according to technological processes, clearly present the state of resource management in the steel production process and the effects of the investments conducted in the analysed sector. The analysis of the consumption of basic resources (energy and coke) is of particular importance, as it results from the importance of these resources for ecological and efficient steel production. Based on the analysis performed, it is possible to indicate the advisability of changes in technology and investments in the steel industry in Poland. The growing popularity of solutions consisting of the ongoing control of resources results mainly from the resource-saving policy promoted as part of sustainable development. The presented models belong to the category of technological analyses in the area of production improvement (in this case, investments expressed in terms of value) in the resource-intensive sector.
The main opportunities for energy savings in the future will come from the optimal selection of production processes and raw materials, the increased use of economically available scrap, transfer of best practices, waste heat recovery and reduction of yield losses. As Edwin Basson, General Director of the World Steel Association, said: “Energy represents one of the key challenges for today’s steel industry and the efficient use of energy has always been one of the steel industry’s key priorities. Over the last 40 years, the steel industry has reduced its energy consumption per tonne of steel by 50%. Still, the cost of energy accounts for 15 to 20% of the total cost of steel production and energy consumption is directly related to the environmental impact of the industry” [68]. Therefore countries have to redefine and update their energy strategy and policy issues related to CO2 emission [69].
There are several contributions of our study to the theory. The main contribution is to prove the impact of investment in new technologies on the reduction of energy and coke consumption in the steel production processes: EAF and BF +BOF. On this basis, one can state that a new investment can decrease resource intensity in the steel industry in both of the processes. Secondly, we built up two models that can be used in other sectors of the economy, more specifically in other traditional industries such as coal mining or machinery manufacturing. To our best knowledge this is the first undertaking that was to analyse the aforementioned issues of resource intensity in the steel sector in Poland. In the future, resource intensity will be a component of personalised products [70]. In the steel industry, the strong diversification of steel products in the market is realised. The general trend is connected with an increase in the production output of personalised steel products (products with an ever higher market value according to World Class Manufacturing standards). The dynamic situation on the steel market means that steel mills have to adjust market strategies to different scenarios of steel production [71]. Polish steel mills produce approximately 9.1 million tonnes per year on average (2004–2018) but they only use about 75% capacity, so they have to reduce the technological real estate.
Of course, our study has several limitations. First of all, it relates to only one sector. In addition, this is a so-called ‘traditional’ sector of the economy, with all the attendant consequences and significances (e.g., rather stable nature compared with high technology sectors, with relatively low dynamics of changes and of a high capital-intensity character, etc.). Consequently, the analysis of other industries would be useful. Secondly, we based our considerations on the steel industry in Poland, whose capacity compared with other countries is small. It then would be recommended to conduct similar research studies in other countries to compare the data. Also, the aim of further research should focus on development of statistical models for resource intensity in the steel industry, e.g., through looking for new dependencies.

Author Contributions

The main activities of the team of authors can be described as follows: Conceptualisation, B.G.; methodology, B.G.; software, B.G.; validation, B.G.; formal analysis, B.G.; investigation, W.S. and B.G.; resources, W.S. and B.G.; data curation, B.G.; writing—original draft preparation, B.G. and W.S.; writing—review and editing, W.S. and B.G.; visualisation, B.G. and W.S.; supervision, B.G. and W.S.; funding acquisition, W.S. All authors have read and agreed to the published version of the manuscript.

Funding

The research was funded within the auspices of the programme of the Ministry of Science and Higher Education entitled ‘Regional Initiative of Excellence’ in 2019–2022, project number 018/RID/2018/19, the amount of funding was PLN 10,788,423.16.

Institutional Review Board Statement

Not applicable.

Informed Consent Statement

Not applicable.

Data Availability Statement

Not applicable.

Conflicts of Interest

The authors declare no conflict of interest.

References

  1. Wang, Z.; Jia, H.; Xu, T.; Xu, C. Manufacturing industrial structure and pollutant emission: An empirical study of China. J. Clean. Prod. 2018, 197, 462–471. [Google Scholar] [CrossRef]
  2. Kot, S.; Haque, A.U.; Kozlovski, E. Strategic SCM’s mediating effect on the sustainable operations: Multinational perspective. Organizacija 2019, 52, 219–235. [Google Scholar] [CrossRef] [Green Version]
  3. Mariyakhan, K.; Mohamued, E.A.; Asif Khan, M.; Popp, J.; Oláh, J. Does the level of absorptive capacity matter for carbon intensity? Evidence from the USA and China. Energies 2020, 13, 407. [Google Scholar] [CrossRef] [Green Version]
  4. Magda, R.; Bozsik, N.; Meyer, N. An evaluation of gross inland energy consumption of six central European countries. J. East. Eur. Central Asian Res. 2019, 6, 270–281. [Google Scholar] [CrossRef]
  5. Banerjee, S.B. Corporate environmental strategies and actions. Manag. Decis. 2001, 39, 633. [Google Scholar] [CrossRef]
  6. Androniceanu, A.; Tvaronavičienė, M. Developing a holistic system for social assistance services based on effective and sustainable partnerships. Adm. Manag. Public 2019, 33, 103–118. [Google Scholar] [CrossRef]
  7. Gunasekaran, A.; Irani, Z.; Papadopoulos, T. Modelling and analysis of sustainable operations 630 management: Certain investigations for research and applications. J. Oper. Res. Soc. 2014, 65, 806–823. [Google Scholar] [CrossRef]
  8. Elkington, J. Accounting for the Triple Bottom Line. Meas. Bus. Excell 1998, 2, 563. [Google Scholar] [CrossRef]
  9. Martínez, P.; Rodríguez del Bosque, I. Sustainability Dimensions: A Source to Enhance Corporate Reputation. Corp. Reput. Rev. 2014, 17, 239–253. [Google Scholar] [CrossRef] [Green Version]
  10. Pacana, A.; Ulewicz, R. Research of determinants motiving to implement the environmental management system. Pol. J. Manag. Stud. 2017, 16, 165–174. [Google Scholar] [CrossRef]
  11. Shpak, N.; Kuzmin, O.; Melnyk, O.; Ruda, M.; Sroka, W. Implementation of circular economy in Ukraine: Context of European integration. Resources 2020, 9, 96. [Google Scholar] [CrossRef]
  12. Šebestová, J.; Sroka, W. Sustainable development goals and SME decisions: The Czech Republic vs. Poland. J. East. Eur. Central Asian Res. 2020, 7, 39–50. [Google Scholar] [CrossRef]
  13. Hussain, H.I.; Slusarczyk, B.; Kamarudin, F.; Thaker, H.M.T.; Szczepańska-Woszczyna, K. An investigation of an adaptive neuro-fuzzy inference system to predict the relationship among energy intensity, globalization, and financial development in major ASEAN economies. Energies 2020, 13, 850. [Google Scholar] [CrossRef] [Green Version]
  14. Popp, J.; Kovács, S.; Oláh, J.; Divéki, Z.; Balázs, E. Bioeconomy: Biomass and biomass-based energy supply and demand. New Biotechnol. 2020, 60, 76–84. [Google Scholar] [CrossRef]
  15. Arasto, A.; Tsupari, E.; Kärki, J.; Sihvonen, M.; Lilja, J. Costs and potential of carbon capture and storage at an integrated steel mill. Energy Proc. 2013, 37, 7117–7124. [Google Scholar] [CrossRef] [Green Version]
  16. Flores-Granobles, M.; Saeys, M. Minimizing CO2 emissions with renewable energy: A comparative study of emerging technologies in the steel industry. Energy Environ. Sci. 2020, 13, 1923–1932. [Google Scholar] [CrossRef]
  17. Meyer, D.F.; Meyer, N. The relationships between entrepreneurial factors and economic growth and development: The case of selected European countries. Polish J. Manag. Stud. 2020, 21, 268–284. [Google Scholar] [CrossRef]
  18. Neef, C.; Hirzel, S.; Arens, M. Industry 4.0 in the European Iron and Steel Industry: Towards an Overview of Implementations and Perspectives; Fraunhofer Institute for Systems and Innovation Research ISI: Karlsruhe, Germany, 2018. Available online: https://www.isi.fraunhofer.de/content/dam/isi/dokumente/cce/2018/Industry-4-0-Implementation-and-Perspectives_Steel-Industry_Working%20document.pdf (accessed on 15 November 2020).
  19. Lorentzen, J. Resource Intensity, Knowledge and Development: Insights from Africa and South America; HSRC Press: Cape Town, South Africa, 2008; ISBN 978-07969-2213-7. [Google Scholar]
  20. International Energy Agency. Energy Technology Perspectives; IEA: Paris, France, 2012. [Google Scholar]
  21. Borocki, J.; Radisic, M.; Sroka, W.; Greblikaite, J.; Androniceanu, A. Methodology for strategic posture determination of SMEs-the case from a developing country. Eng. Econ. 2019, 30, 265–277. [Google Scholar] [CrossRef] [Green Version]
  22. OECD Manual. Measuring Productivity 2010. Available online: http://www.oecd.org/dataoecd/59/29/2352458.pdf (accessed on 7 May 2010).
  23. Frolov, V.G.; Kaminchenko, D.I.; Kovylkin, D.Y.; Popova, J.A.; Pavlova, A.A. The Main Economic Factors of Sustainable Manufacturing Within the Industrial Policy Concept of Industry 4.0. Acad. Strat. Manag. J. 2017, 16, 1–11. [Google Scholar]
  24. Rüßmann, M.; Lorenz, M.; Gerbert, P.; Waldner, M.; Justus, J.; Engel, P.; Harnisch, M. Industry 4.0: The Future of Productivity and Growth in Manufacturing Industries. Available online: www.inovasyon.org/pdf/bcg.perspectives_Industry.4.0_2015.pdf (accessed on 6 January 2020).
  25. Androniceanu, A.-M.; Georgescu, I.; Tvaronavičiene, M.; Androniceanu, A. Canonical correlation analysis and a new composite index on digitalization and labor force in the context of the industrial revolution 4.0. Sustainability 2020, 12, 6812. [Google Scholar] [CrossRef]
  26. Ślusarczyk, B.; Tvaronavičienė, M.; Ul Haque, A.; Oláh, J. Predictors of Industry 4.0 technologies affecting logistic enterprises’ performance: International perspective from economic lens. Technol. Econ. Dev. Econ. 2020, 26, 1263–1283. [Google Scholar] [CrossRef]
  27. Saniuk, S.; Grabowska, S.; Gajdzik, B. Social Expectations and Market Changes in the Context of Developing the Industry 4.0 Concept. Sustainability 2020, 12, 1362. [Google Scholar] [CrossRef] [Green Version]
  28. Afonasova, M.A.; Panfilova, E.E.; Galichkina, M.A.; Ślusarczyk, B. Digitalization in economy and innovation: The effect on social and economic processes. Polish J. Manag. Stud. 2019, 19, 22–32. [Google Scholar] [CrossRef]
  29. Wang, S.; Wan, J.; Li, D.; Zhang, C. Implementing Smart Factory of Industry 4.0: An Outlook. Int. J. Distrib. Sens. Netw. 2016, 12, 3159805. [Google Scholar] [CrossRef] [Green Version]
  30. Wolniak, R.; Saniuk, S.; Grabowska, S.; Gajdzik, B. Identification of Energy Efficiency Trends in the Context of the Development of Industry 4.0 Using the Polish Steel Sector as an Example. Energies 2020, 13, 2867. [Google Scholar] [CrossRef]
  31. Popp, J.; Oláh, J.; Farkas Fekete, M.; Lakner, Z.; Máté, D. The relationship between prices of various metals, oil and scarcity. Energies 2018, 11, 2392. [Google Scholar] [CrossRef] [Green Version]
  32. Tishkov, S.; Shcherbak, A.; Karginova-Gubinova, V.; Volkov, A.; Tleppayev, A.; Pakhomova, A. Assessment the role of renewable energy in socio-economic development of rural and Arctic regions. Entrep. Sustain. Issues 2020, 7, 3354–3368. [Google Scholar] [CrossRef]
  33. Dudin, M.N.; Frolova, E.E.; Protopopova, O.V.; Mamedov, A.A.; Odintsov, S.V. Study of innovative technologies in the energy industry: Nontraditional and renewable energy sources. Entrep. Sustain. Issues 2019, 6, 1704–1713. [Google Scholar] [CrossRef]
  34. Nasr, A.; Kashan, M.K.; Maleki, A.; Jafari, N.; Hashemi, H. Assessment of Barriers to Renewable Energy Development Using Stakeholders Approach. Entrep. Sustain. Issues 2020, 7, 2526–2541. [Google Scholar] [CrossRef] [Green Version]
  35. Pilipczuk, O. Sustainable Smart Cities and Energy Management: The Labor Market Perspective. Energies 2020, 13, 6084. [Google Scholar] [CrossRef]
  36. Sarma, U.; Karnitis, G.; Zuters, J.; Karnitis, E. District heating networks: Enhancement of the efficiency. Insights Reg. Dev. 2019, 1, 200–213. [Google Scholar] [CrossRef] [Green Version]
  37. Duan, H.; Mo, J.; Fan, Y.; Wang, S. Achieving China’s energy and climate policy targets in 2030 under multiple uncertainties. Energy Econ. 2018, 70, 45–60. [Google Scholar] [CrossRef]
  38. Pappas, D.; Chalvatzis, K.; Guan, D.; Ioannidis, A. Energy and carbon intensity: A study on the cross-country industrial shift from China to India and SE Asia. Appl. Energy 2018, 225, 183–194. [Google Scholar] [CrossRef] [Green Version]
  39. Yu, B.; Li, X.; Qiao, Y.; Shi, L. Low-carbon transition of iron and steel industry in China: Carbon intensity, economic growth and policy intervention. J. Environ. Sci. 2015, 28, 137–147. [Google Scholar] [CrossRef] [PubMed]
  40. Kan, K.; Mativengaa, P.; Marnewick, A. Understanding energy use in the South African manufacturing industry. Procedia CIRP 2020, 91, 445–451. [Google Scholar] [CrossRef]
  41. Johansson, M. Improved energy efficiency within the Swedish steel industry—the importance of energy management and networking. Energy Effic. 2015, 8, 713–744. [Google Scholar] [CrossRef] [Green Version]
  42. Soepardi, A.; Thollander, P. Analysis of Relationships among Organizational Barriers to Energy Efficiency Improvement: A Case Study in Indonesia’s Steel Industry. Sustainability 2018, 10, 216. [Google Scholar] [CrossRef] [Green Version]
  43. Ki-Hoon, L. Drivers and Barriers to Energy Efficiency Management for Sustainable Development. Sustain. Dev. 2015, 23, 16–25. [Google Scholar] [CrossRef]
  44. Martinez, C. Estimating and analyzing energy efficiency in German and Colombian manufacturing industries using DEA and data panel analysis. Part I: Strategic Planning for Energy and the Environment Energy-intensive Sectors. Energy Sources Part B Econ. Plan. Policy 2015, 10, 322–331. [Google Scholar] [CrossRef]
  45. Ohlan, R. Energy Efficiency in India’s Iron and Steel Industry: A Firm-level Data Envelopment Analysis. Strat. Plan. Energy Environ. 2019, 38, 27–36. [Google Scholar] [CrossRef]
  46. Czosnyka, M.; Wnukowska, B.; Karbowa, K. Energy efficiency as a base of the energy economy in a modern industrial plants. Prog. Appl. Electr. Eng. PAEE 2018, 8441086. [Google Scholar] [CrossRef]
  47. Martelaro, N. Energy Use in US Steel Manufacturing, Stanford University. 2016. Available online: http://large.stanford.edu/courses/2016/ph240/martelaro1/ (accessed on 21 November 2020).
  48. Lee, D.; Cheng, C. Energy savings by energy management systems: A review. Renew. Sustain. Energy Rev. 2016, 56, 760–777. [Google Scholar] [CrossRef]
  49. Kolloch, M.; Reck, F. Innovation networks in the German energy industry: An empirical analysis of inter-organizational knowledge transfer. Int. J. Energy Sect. Manag. 2017, 11, 268–294. [Google Scholar] [CrossRef]
  50. Gajdzik, B. The road of Polish steelworks towards market success—Changes after restructuring process. Metalurgija 2013, 52, 421–424. [Google Scholar]
  51. Borowiecki, R.; Nalepa, B. Restrukturyzacja w procesie funkcjonowania I rozwoju przedsiębiorstw. In Zarządzanie Restrukturyzacją Procesów Gospodarczych; Borowiecki, R., Ed.; Difin: Warsaw, Poland, 2003; p. 76. [Google Scholar]
  52. Gajdzik, B.; Sroka, W. Analytic study of the capital restructuring process in metallurgical enterprises around the World and in Poland. Metalurgija 2012, 51, 265–268. [Google Scholar]
  53. World Steel Association. Statistics: Steel Production in Figures. Available online: https://www.worldsteel.org/steel-by-topic/statistics/World-Steel-in-Figures.html (accessed on 20 November 2020).
  54. Gajdzik, B. Metallurgical sector in Poland before and after transformation restructuring. Ann. Fac. Eng. Hunedoara 2013, 176, 171–177. [Google Scholar]
  55. Gajdzik, B.; Gawlik, R. Choosing the production function model for an optimal measurement of the restructuring efficiency of the Polish metallurgical sector in years 2000–2015. Metals 2018, 8, 23. [Google Scholar] [CrossRef] [Green Version]
  56. European Commission. Restructuring in Europe. A Review of EU Action to Anticipate and Manage Employment Change; Directorate-General for Employment, Social Affairs and Equal Opportunities: Luxembourg, 2008; Chapter 4. [Google Scholar]
  57. Gajdzik, B.; Burchart-Korol, D. Eco-innovation in manufacturing plants illustrated with an example of steel products development. Metalurgija 2011, 50, 63–66. [Google Scholar]
  58. Swat, M.; Brünnet, H.; Bähre, D. Selecting manufacturing process chains in the early stage of the product engineering process with focus on energy consumption. In Technology and Manufacturing Process Selection: The Product Life Cycle Perspective; Springer: Berlin/Heidelberg, Germany, 2014. [Google Scholar]
  59. Polish Steel Association (HIPH). Expensive energy causes low competitiveness of the Polish economy on the example of the steel industry; The economic impact of the pandemic. In Proceedings of the Polish Economic Society Conference, Katowice, Poland, 22 September 2020. [Google Scholar]
  60. He, K.; Wang, L.; Li, X. Review of the energy consumption and production structure of China’s steel industry: Current situation and future development. Metals 2020, 10, 302. [Google Scholar] [CrossRef] [Green Version]
  61. Rock, M.T.; Toman, M.; Cui, Y.; Jiang, K.; Song, Y.; Wang, Y. Technological learning, energy efficiency, and CO2 emissions in China’s energy intensive industries 2013. Available online: https://23.21.67.251/handle/10986/15851 (accessed on 20 November 2020).
  62. Egilmez, G.; Bhutta, K.; Erenay, B.; Park, Y.; Gedik, R. Carbon Footprint Stock Analysis of U.S. Manufacturing: A Time Series Input-Output LCA. Ind. Manag. Data Syst. 2017, 117, 853–872. [Google Scholar] [CrossRef] [Green Version]
  63. Gajdzik, B. Modelling the impact of investments on energy intensity in the Polish steel industry as a step towards Industry 4.0. In Proceedings of the 29th International Conference on Metallurgy and Materials-Metal, Brno, Czech Republic, 20–22 May 2020; pp. 1210–1215. [Google Scholar] [CrossRef]
  64. World Steel Association. World Steel in Figures 2018. Available online: https://www.worldsteel.org/en/dam/jcr:f9359dff-9546-4d6b-bed0-996201185b12/World+Steel+in+Figures+2018.pdf (accessed on 23 November 2020).
  65. He, X.; Kim, H.C.; Wallington, T.J.; Zhang, S.; Shen, W.; De Kleine, R.; Keoleian, G.A.; Ma, R.; Zheng, Y.; Zhou, B.; et al. Cradle-to-gate greenhouse gas (GHG) burdens for aluminum and steel production and cradle-to-grave GHG benefits of vehicle lightweighting in China. Resour. Conserv. Recycl. 2020, 152, 104497. [Google Scholar] [CrossRef]
  66. El Iysaouy, L.; El Idrissi, N.E.; Tvaronavičienė, M.; Lahbabi, M.; Oumnad, A. Towards energy efficiency: Case of Morocco. Insights Reg. Dev. 2019, 1, 259–271. [Google Scholar] [CrossRef] [Green Version]
  67. Strategia na Rzecz Odpowiedzialnego Rozwoju do Roku 2020 (Z Perspektywą do 2030 R.); Ministerstwo Rozwoju-Departament Strategii Rozwoju: Warsaw, Poland, 2017.
  68. World Steel Association. 2015. Available online: https://www.worldsteel.org/media-centre/press-releases/2015/energy-use-in-the-steel-industry-report-available-now.html (accessed on 23 November 2020).
  69. Saługa, P.W.; Szczepańska-Woszczyna, K.; Miśkiewicz, R.; Chłąd, M. Cost of Equity of Coal-Fired Power Generation Projects in Poland: Its Importance for the Management of Decision-Making Process. Energies 2020, 13, 4833. [Google Scholar] [CrossRef]
  70. Saniuk, S.; Grabowska, S.; Gajdzik, B. Personalization of Products in the Industry 4.0 Concept and Its Impact on Achieving a Higher Level of Sustainable Consumption. Energies 2020, 13, 5895. [Google Scholar] [CrossRef]
  71. Gajdzik, B.; Gawlik, R.; Skoczypiec, S. Forecasting-scenario-heuristic method propos al for assessment of feasibility of steel production scenarios in Poland–Managerial implications for production engineering. Arch. Civ. Mech. Eng. 2018, 18, 1651–1660. [Google Scholar] [CrossRef]
Figure 1. Structure of consumption of energy media in the steel industry in Poland. Source: [59].
Energies 14 00443 g001
Figure 2. Research methodology.
Energies 14 00443 g002
Figure 3. Unit electricity consumption in steel production in Poland from 2004 to 2018.
Energies 14 00443 g003
Figure 4. Electricity consumption by process in Polish steel industry from 2004 to 2018.
Energies 14 00443 g004
Figure 5. Unit consumption of coke by BF technology in Poland from 2004 to 2018.
Energies 14 00443 g005
Figure 6. Expenditure on investments in the Polish steel sector from 2004 to 2018 * (* Inflation has not been taken into account as the cumulative method has been used to evaluate the value of investments. According to the Statistical Data, average inflation in Poland did not exceed 2.5%. in the analysed period).
Energies 14 00443 g006
Figure 7. Presentation of the used model (1) and empirical data in the analysed field.
Energies 14 00443 g007
Figure 8. Presentation of the used model (2) and the empirical data in the analysed field.
Energies 14 00443 g008
Table 1. Basic statistical analysis of the model no. 1.
Statistical IndicatorIndicator ValueAssessment on the Basis of an Indicator
1. Determination factorR2 = 0.971397% variability of y is explained by the model; match of the model to empirical data is very good
2. Indicator: R d 2 R d 2 = 0.9690
3. Statistics FF = 439.44
p > 0.99
Variables are correlated linearly
4. Expressiveness factorSe = 0.012Very good match
5. Significance test: t-Student testx1: t = −20.96
p > 0.99
Significant parameter
Note: Statistics were made using Excel software, used REGLINP function.
Table 2. Statistical verification of the model no. 1 by using statistical tests.
Statistical IndicatorIndicator ValueAssessment on the Basis of an Indicator
1. Autocorrelation test: Durbin-Watson statisticsDW = 2.41
DW < 4-du
There is no auto-correlation of the residuals in the model
2. Residual distribution randomness test: series test statisticsKe = 5
K1KeK2
The residuals are randomly distributed (a random pattern of residuals supports a linear model)
3. Jarque-Barre (JB) test for normality of residualsJB = 0.866
JB ≤ 5.991
The residuals are normally distributed
4. Residuals symmetric test: t statistict = 2.429
t < tα
The residuals are symmetrically distributed
5. Residuals homoscedasticity: White testLM = 0.11
LM < χ2
Homoscedasticity—variances for the residuals are equal
Table 3. Basic statistical analysis of the model no. 2.
Statistical IndicatorIndicator ValueAssessment on the Basis of an Indicator
1. Determination factorR2 = 0.800080% variability of y is explained by the model; match of the model to empirical data is very good
2. Indicator:
R d 2
R d 2
= 0.7658
3. Statistics FF = 23.88
p > 0.99
There is a linear relationship (statistics based on linearised empirical data: LN)
4. Expressiveness factorSe = 0.091Good match
5. Significance test: t-Student testx1: t = 4.95
p > 0.99
x2: t = −2.12
p > 0.95
Parameter x1 is relevant
Parameter x2 is relevant
Table 4. Statistical verification of the model no. 2 by using statistical tests.
Statistical IndicatorIndicator ValueAssessment on the Basis of an Indicator
1. Autocorrelation test: Durbin-Watson statisticsDW = 2.41
DW < 4-du
No residual autocorrelation
2. Residual distribution randomness test: series test statisticsKe = 5
K1KeK2
The residual distribution is random
3. Jarque-Barre (JB) test for normality of residualsJB = 0.866
JB ≤ 5.991
The residuals are normally distributed
4. Residual symmetry test: t statistict = 2.429
t < tα
The residuals are symmetrically distributed
5. Random component homoscedasticity test: White testLM = 0.11
LM < χ2
The random component is homoscedastic
Publisher’s Note: MDPI stays neutral with regard to jurisdictional claims in published maps and institutional affiliations.

