Article

A Study of UVER in Santiago, Chile Based on Long-Term In Situ Measurements (Five Years) and Empirical Modelling

by
Lisdelys González-Rodríguez
1,*,
Amauri Pereira de Oliveira
2,
Lien Rodríguez-López
3,
Jorge Rosas
2,
David Contreras
4 and
Ana Carolina Baeza
3
1
Faculty of Engineering, University of Concepcion, Concepcion 403000, Chile
2
Department of Atmospheric Sciences, Institute of Astronomy, Geophysics and Atmospheric Sciences, University of São Paulo, São Paulo 05508-090, SP, Brazil
3
Faculty of Environmental Sciences & EULA Center, University of Concepcion, Concepcion 403000, Chile
4
Centre for Biotechnology, Department of Analytical and Inorganic Chemistry, Faculty of Chemical Sciences, University of Concepcion, Concepcion 403000, Chile
*
Author to whom correspondence should be addressed.
Energies 2021, 14(2), 368; https://doi.org/10.3390/en14020368
Submission received: 3 November 2020 / Revised: 24 December 2020 / Accepted: 4 January 2021 / Published: 11 January 2021
(This article belongs to the Section B: Energy and Environment)

Abstact

Ultraviolet radiation is a highly energetic component of the solar spectrum that needs to be monitored because is harmful to life on Earth, especially in areas where the ozone layer has been depleted, like Chile. This work is the first to address the long-term (five-year) behaviour of ultraviolet erythemal radiation (UVER) in Santiago, Chile (33.5° S, 70.7° W, 500 m) using in situ measurements and empirical modelling. Observations indicate that to alert the people on the risks of UVER overexposure, it is necessary to use, in addition to the currently available UV index (UVI), three more erythema indices: standard erythemal doses (SEDs), minimum erythemal doses (MEDs), and sun exposure time (tery). The combination of UVI, SEDs, MEDs, and tery shows that in Santiago, individuals with skin types III and IV are exposed to harmfully high UVER doses for 46% of the time that UVI indicates is safe. Empirical models predicted hourly and daily values UVER in Santiago with great accuracy and can be applied to other Chilean urban areas with similar climate. This research inspires future advances in reconstructing large datasets to analyse the UVER in Central Chile, its trends, and its changes.

Graphical Abstract

1. Introduction

Ultraviolet solar radiation (UV, 100–400 nm) plays an important role in the upper atmosphere’s composition and material, terrestrial and aquatic ecosystems, and human health [1,2,3,4,5,6,7,8]. It is subdivided into three spectral bands: UV-C radiation (100–280 nm), UV-B radiation (280–315 nm), and UV-A radiation (315–400 nm). Their interaction with the biosphere involves different physical, chemical, and biological processes [1,5]. Some of them are harmful to humans, causing skin reddening (erythema) [9], reduction of vitamin D synthesis [10,11,12], cataracts [13], or development of melanoma skin cancer [14,15]. As a consequence, human health risk assessment requires continuous monitoring of UV levels, mainly that of erythemal ultraviolet radiation (UVER). UVER is calculated by weighting the spectral curve of the incident UV-B solar radiation at the surface with the spectral action curve proposed by the International Commission on Illumination [16]. Moreover, UVER can be used to estimate other widely used variables, such as the UV index (UVI), standard erythemal doses (SEDs), minimum erythemal doses (MEDs), and sun exposure time (tery). The last two erythemal indices are related to the effect of exposure to ultraviolet radiation (tanning) and skin colour (white, brown, or black), and are influenced by the melanin present in the skin. Melanin plays a vital role in protecting the human body from UV radiation by filtering sunlight before it can damage skin cells [17,18]. Pale or white skin burns easily and tans slowly and poorly: It needs more protection against sun exposure. The Fitzpatrick classification identifies skin types based on the UV effect on the skin [19].
Despite the global recommendation [20], few studies of UVER are available in South America [21]. This is particularly burdensome in Chile, especially in Santiago, where there is a high prevalence of melanoma cancer caused by UV exposure and which comprises 40% of the country population [22]. Given the increase of problems related to the exposure to UV radiation in Chile [11,22,23,24,25], spectral measurements of the solar resource have been incorporated into the solar network. Currently, 29 stations measure the UVER and 22 of them measure the UV-B; recently, UV-B, UV-A, photosynthetically active radiation and infrared radiation estimates have been incorporated into the online tool “Solar explorer” [26]. The main institutions involved in UV monitoring are the Chilean Meteorological Office (DMC) [27], the National Cancer Corporation (CONAC), and the University of Santiago (USACH). The last two carry out UVI measurements in some localities of the country, which can be found at [28]. However, few studies are available about the doses received in periods of exposure by workers and individual susceptibilities [9,11,29]. As will be shown in this work, long-term measurements of UVER and its corresponding erythemal indices, such as UVI, SEDs, MEDs, and tery, can provide useful information for risk assessment of sun-induced skin damage. One simple alternative is using empirical expressions derived from the correlation between solar global irradiance (IG) and its UV component, both measured independently at the surface [30,31,32]. For instance, Ref. [33] developed empirical expressions for daily UV-B values, and Refs. [34,35] did so for hourly UV-B and UVER values, respectively. Recent work has proposed simple linear regression to estimate UVER in two locations at high altitudes in Argentina [36], and in a previous work, we developed a preliminary empirical model to estimate hourly and daily values of UVER in Santiago, Chile [37].
The hypothesis that will be tested in this research is whether the UVER observed at the surface in Santiago de Chile is sufficient to generate erythemal damage in skin phototypes that characteristic of the Chilean population when the UVI indicates that it is safe. To test this hypothesis, we are going to (1) estimate the seasonal variation of the daily and hourly UVER in Santiago de Chile under different sky conditions, (2) evaluate the negative effects of UVER using four indices of erythema (UVI, SEDs, MEDs, and tery), and (3) develop and validate empirical models to estimate hourly and daily values of UVER from IG radiation at the surface, considering explicitly the seasonal variation of cloudiness and other climate features so they can be applied to assess UVER exposure of populations in other areas of Chile.

2. Materials and Methods
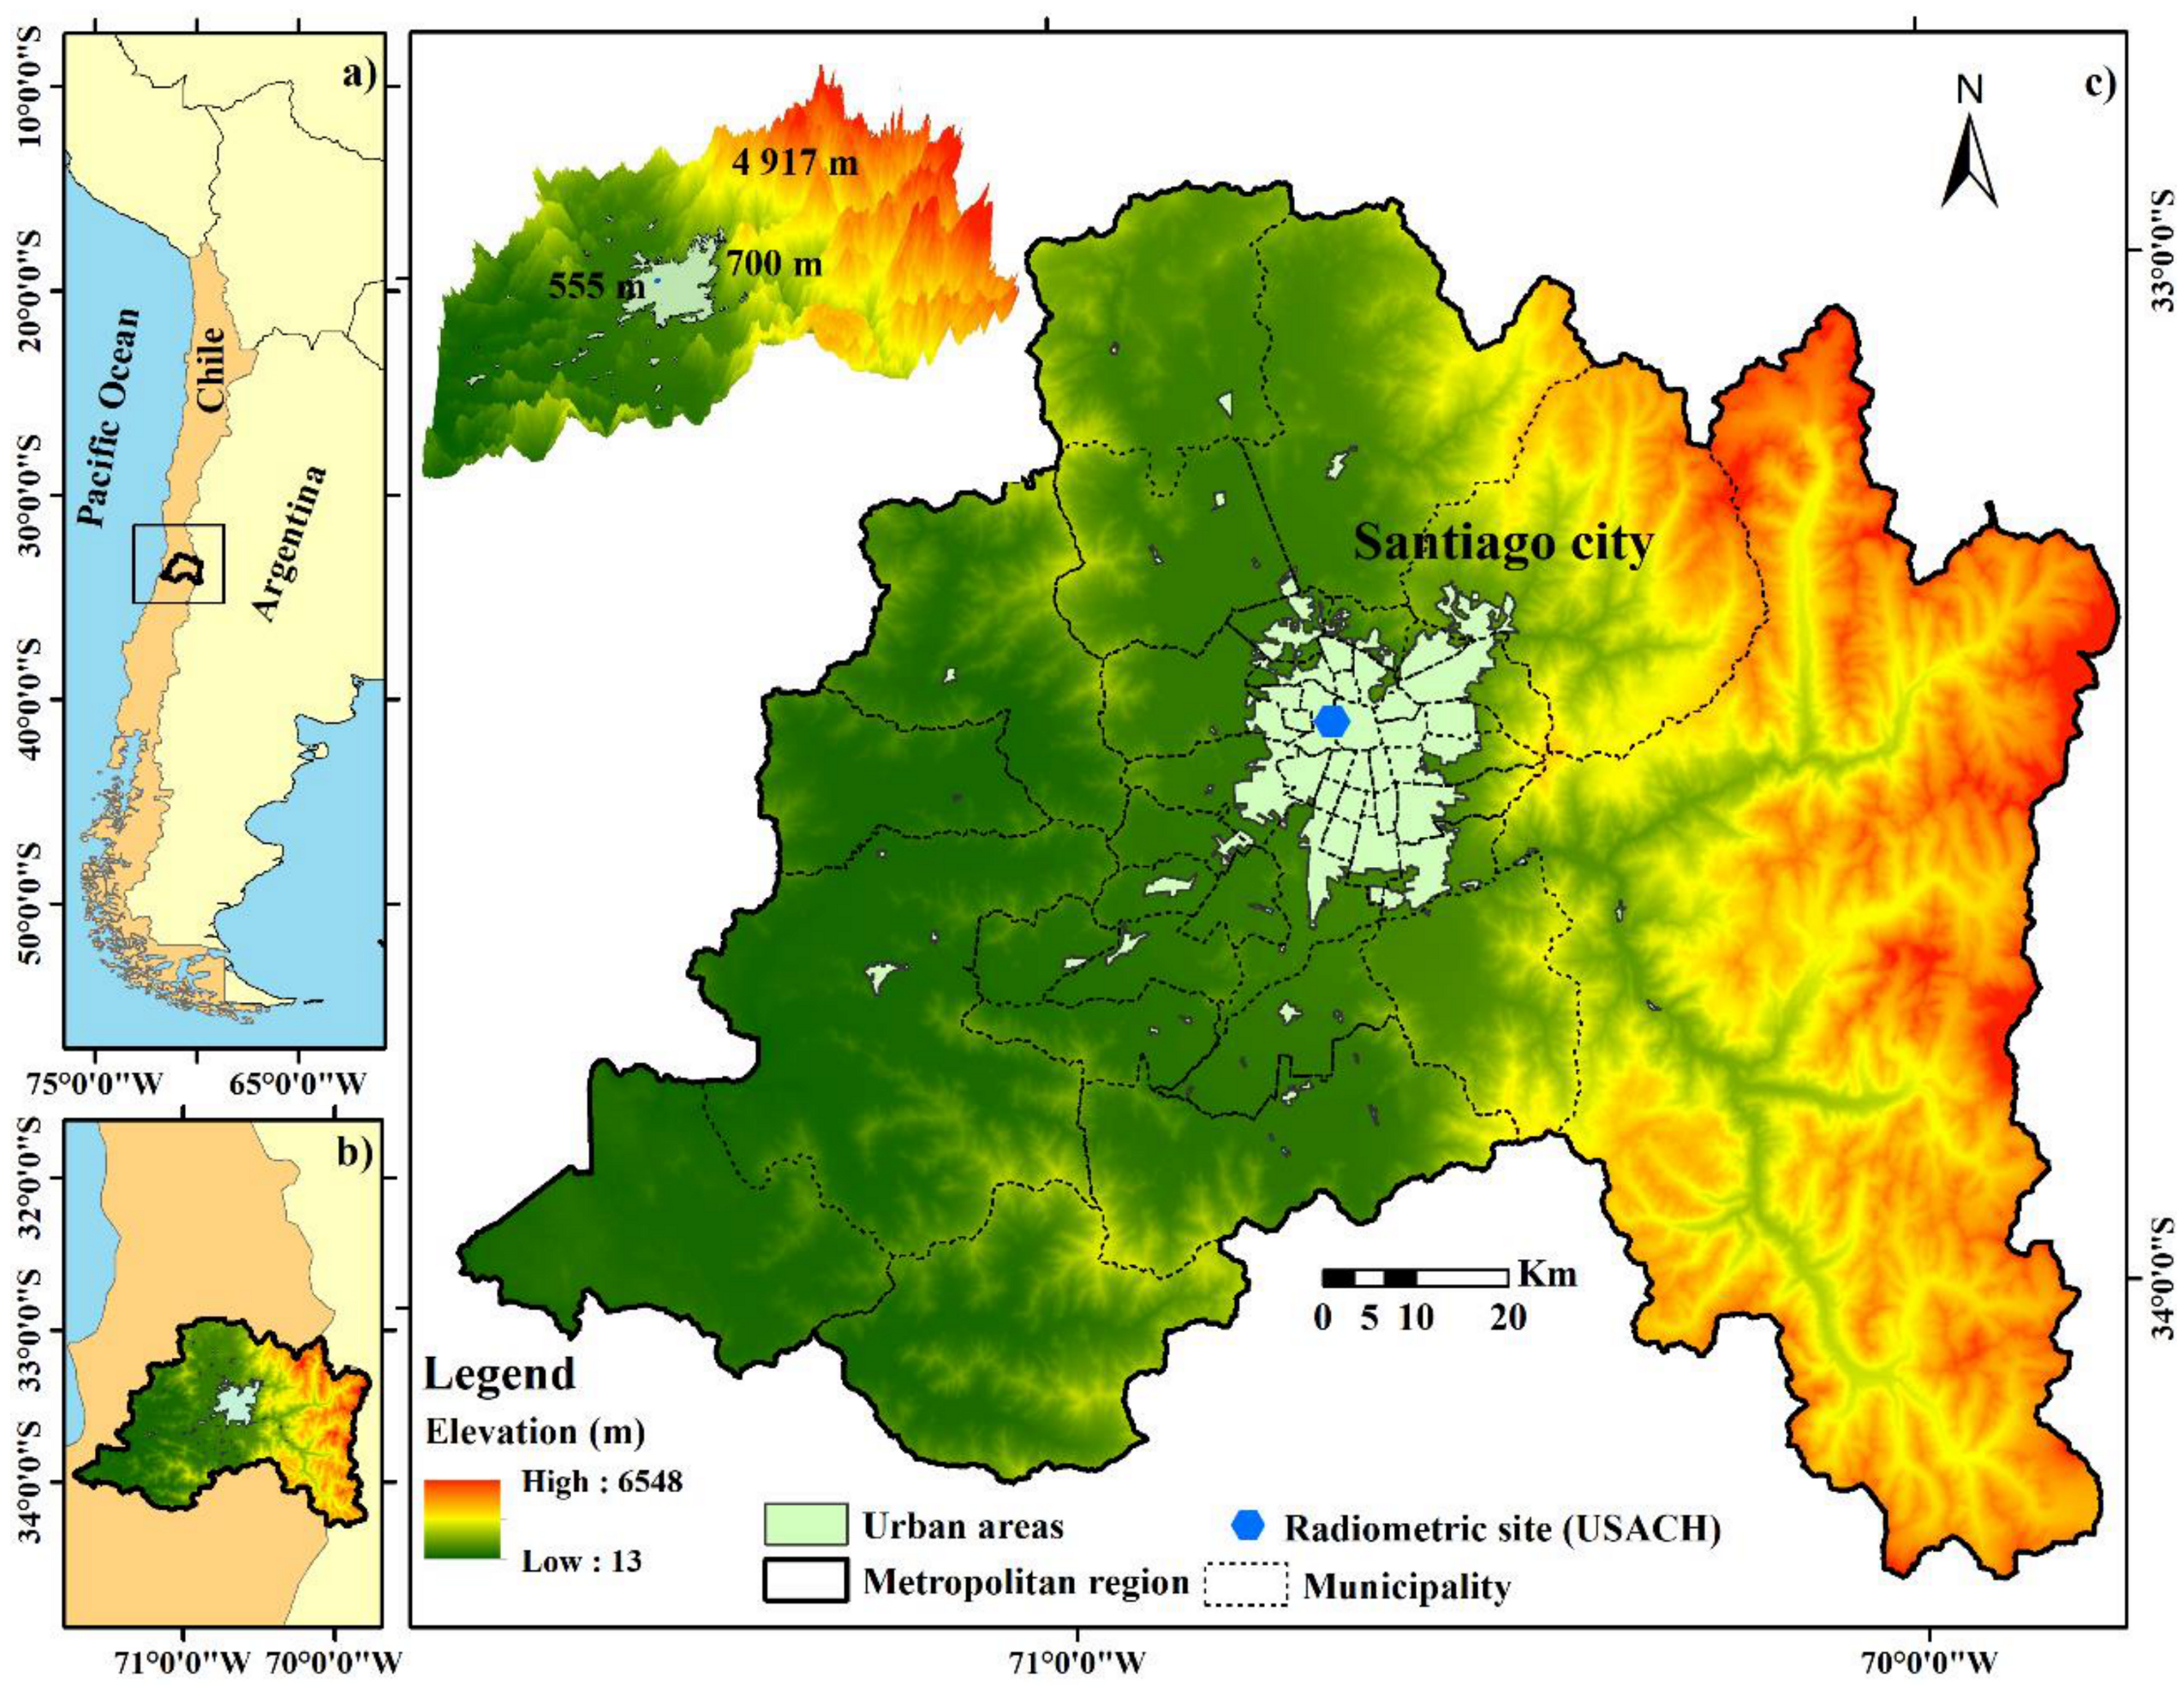
2.1. Study Area

This study was performed in the most populated area of central Chile, Santiago de Chile (33°30′ S, 70°42′ W), a city with just over 5.6 million inhabitants, accounting for 40% of the national population with a density of 393 inhabitants per km2 [38]. Santiago is located in a relatively flat and wide valley at 500 m above sea level (asl) and about 100 km from the Pacific coast (Figure 1). It is surrounded by mountain ranges, with the Andes mountains on the east side, Cordillera de la Costa heading west, Chacabuco to the north, and Paine to the south. The mountain ranges (up to 4000 m high) and hills surrounding the city reduce ventilation and affect air pollutant dispersion, mainly in winter [39]. During the warm and dry summer months, the city is exposed to relatively high concentrations of secondary oxidants, while in winter, it is exposed to high concentrations of particulate matter and nitrogen oxides [39,40]. Santiago presents a semi-arid climate with an annual mean precipitation of 350 mm, which is concentrated in the winter months [41].

2.2. Instruments and Satellite Data

The radiometric site is in the urban area of Santiago (33.27° S, 70.41° W, 512 m asl), in the Estación Central district (Figure 1). Sensors were set up on the roof of a three-story building (Department of Physics) at the University of Santiago (USACH, Universidad de Santiago). At this site, solar radiation between 280 and 315 nm (UVER) was measured with a PMA-2101 detector that was calibrated at the factory (manufactured by Solar Light Company, Orlando, Florida, USA). Solar radiation between 350 and 1150 nm (IG) was measured with a sensor built at the USACH, consisting of a silicon detector coupled to an amplifier enclosed in an aluminium housing. The sensor was calibrated against a Kipp and Zonen pyranometer model CMP22. The primary dataset comprised hourly values of global solar radiation (IG, Wm−2) and ultraviolet erythemal radiation (UVER, µWcm−2) observed continuously for five years from 1 January 2015 to 31 December 2019.
Hourly values of cloud cover (CC, oktas) were obtained from the International Satellite Cloud Climatology Project (ISCCP-H series) for Santiago for the 21 years from 1985 to 2015. These data are available on the ISCCP website (https://isccp.giss.nasa.gov/). Daily values of the total column of ozone (TOC, DU) were estimated by the Earth Probe TOMS (Total Ozone Mapping Spectrometer) for Santiago during the five years from 2015 to 2019. These data are available on the TOMS website (http://toms.gsfc.nasa.gov).

2.3. Quality Control

The quality control (QC) procedure consisted of removing the following from the primary dataset: (a) negative values of UVER and IG; (b) IG values higher than the maximum extra-terrestrial global irradiance values on the top of the atmosphere (1366 Wm−2). After the QC, the resulting time series consisted of 13,011 hourly values and 1574 daily values of IG and UVER. They correspond to hourly and daily values measured simultaneously, a mandatory requirement for modelling applications, and are expressed in irradiance (Wm−2) or irradiation (kJm−2, MJm−2) units, respectively. Table 1 presents the number of simultaneous hourly and daily measurements for each year.
Given that most of the years are well covered by observations (Table 1), it is plausible to assume that the five years of UVER and IG measurements between 2015 and 2019 are representative climatological conditions and include most of the relevant atmospheric patterns of the Santiago climate.

2.4. Clearness Index

Clearness index (KT) is defined as the ratio of global solar radiation at the surface (IG) to extra-terrestrial global irradiance on the top of the atmosphere (ITOA) [43]. By analogy, the clearness index for UVER (KTUVER) was defined as the ratio of UVER at the surface to UVER at the atmosphere top (UVERTOA).
The hourly values of UVER and IG at TOA (ITOA) were estimated using Equations (1)–(3). The solar zenith angle (SZA) in (1) was computed by the algorithm proposed by [44]. The astronomic distance (U) in (2) is based on [45]. The extra-terrestrial irradiance at an astronomical distance (ISC) of 1 was set equal to 1366 Wm−2 for IG [45] and 9.89 Wm−2 for UVER [36]. The year-long variation of the relative sun–Earth position is indicated by Γ in (3) and was estimated in terms of the year–day (Jday), varying from 1 on 1 January to 365 (366) on 31 December (leap year).
I TOA = I SC   U   cos   SZA
U = 1.00011 + 0.034221   cos   Γ + 0.00128   sin   Γ + 0.000719   cos   2 Γ + 0.00007   sin   2 Γ
Γ   = 2 π · Jday 1 / 365
The clearness index is a good indicator for the absorption and scattering process of all atmospheric constituents [46], e.g., when the atmospheric attenuation increases, the clearness index decreases, mostly due to cloudiness.

2.5. Erythema Indexes

As mentioned before, UVER can be used to estimate other widely used erythema indexes, such as the UV index (UVI), standard erythemal doses (SEDs), minimum erythemal doses (MEDs), and sun exposure time (tery).
The UV index is defined as 40 times the erythemal-weighted UV irradiance [47]. The concept of UVI originated in Canada and was designed to represent the erythemal potential in a simple form, UVI = UVER   Wm 2   ×   40 [48]. As a result, this index is usually divided into five risk categories: UVI < 2 (low); 2 ≤ UVI < 5 (medium); 5 ≤ UVI < 7 (high); 7 ≤ UVI < 11 (very high); and UVI ≥ 11 (extreme) [20].
Standard erythemal dose (SED) is defined as a standardized unit of measure of erythemal radiation; 1 SED is estimated to be equivalent to an erythemal radiant exposure of 100 Jm–2 and is independent of skin type.
The minimum erythemal dose (MED) is defined as a measure of the variable nature of the skin’s sensitivity to UV radiation exposure. The sensitivity of the skin to UV radiation exposure can be classified by the Fitzpatrick classification [19]. For the most sensitive skin types, 1 MED is equal to approximately 200 Jm−2 (weighted by the erythema action spectrum), while for resistant skins, a value of 4 is approximately 500 Jm−2. For this analysis, the MED was calculated from the UVER accumulated between 8:00 and 17:00 local time (LT) considering two Fitzpatrick skin types: skin types III–IV (MED = 350–450 Jm−2). According to Ref. [49], they are the most frequently observed skin types in Chile.
Sun exposure time (tery) is defined as the time (in minutes) that it takes to cause erythema. It depends on UVER intensity and personal sensitivity value (phototype). It is estimated as t ery = SPF MED / UVER , where SPF is the sun protection factor of skin, which is equal to 1 (without protection), and MED is the minimum UVER dosage that causes erythema after sun exposure between 8:00 and 18:00 LT (local time) for skin types III and IV in Santiago de Chile.

2.6. Modelling Strategy

To model UVER in terms of IG using linear regression analysis, the five-year-long dataset was divided into two parts. The data gathered between 2015 and 2018 (four years) were used exclusively to build the regression model. Measurements during 2019 (one year) were used only for validation (Table 1).
The regression analysis performed here consists of establishing relations between UVER and IG (hourly and daily values) for different sky conditions based on observations made between 2015 and 2018. First, a set of empirical models is developed for each season of the year and five KT categories are defined in Section 3. Each model corresponds to a polynomial curve fitted through dispersion diagrams of UVER versus IG using a simple least-squares regression method [50]. Finally, the validation of all regression models is carried out using the UVER and IG measured in 2019. The validation comprises a performance analysis based on the following statistical parameters: determination coefficient (R2), Pearson correlation coefficient (r), mean bias error (MBE), root-mean-square error (RMSE), normalized root-mean-square error (NRMSE), mean absolute percentage error (MAPE), and index of agreement (IA), given respectively by:
R 2 =   r 2 = i = 1 n O i O ¯ P i P ¯ i = 1 n ( O i O ) ¯ 2 i = 1 n ( P i P ) ¯ 2 2
MBE =   1 n i = 1 n P i O i
RMSE = i = 1 n P i O i 2 n 1 2
NRMSE = RMSE Oi n × 100
MAPE = 100 n   i = 1 n O i P i O i
IA = 1 i = 1 n P i O i i = 1 n P i O ¯ + O i O ¯
where Pi represents the modelled values, Oi represents the measured ones, and n represents the number of observations. All regression models were built using MATLAB software.

3. Results and Discussion

In this work, the analyses of seasonal variation of UVER and related variables used to assess its impact on human health, as well as the modelling, were carried based on the KT classification proposed by [30]. Here, the sky condition will be considered: (1) cloudy (KT ≤ 0.35), (2) partially cloudy (0.35 < KT ≤ 0.55), (3) partially clear (0.55 < KT ≤ 0.65), (4) clear sky (KT > 0.65), and (5) all-sky condition (0 ≤ KT ≤ 1). Daily and hourly values of irradiance (UVER, IG, IGTOA) correspond to the total flux of energy received from the Sun per unit of area and per hour and day, respectively. Daily values are expressed in MJ m−2 (IG, IGTOA) and kJm−2 (UVER), while hourly values are indicated in Wm−2.

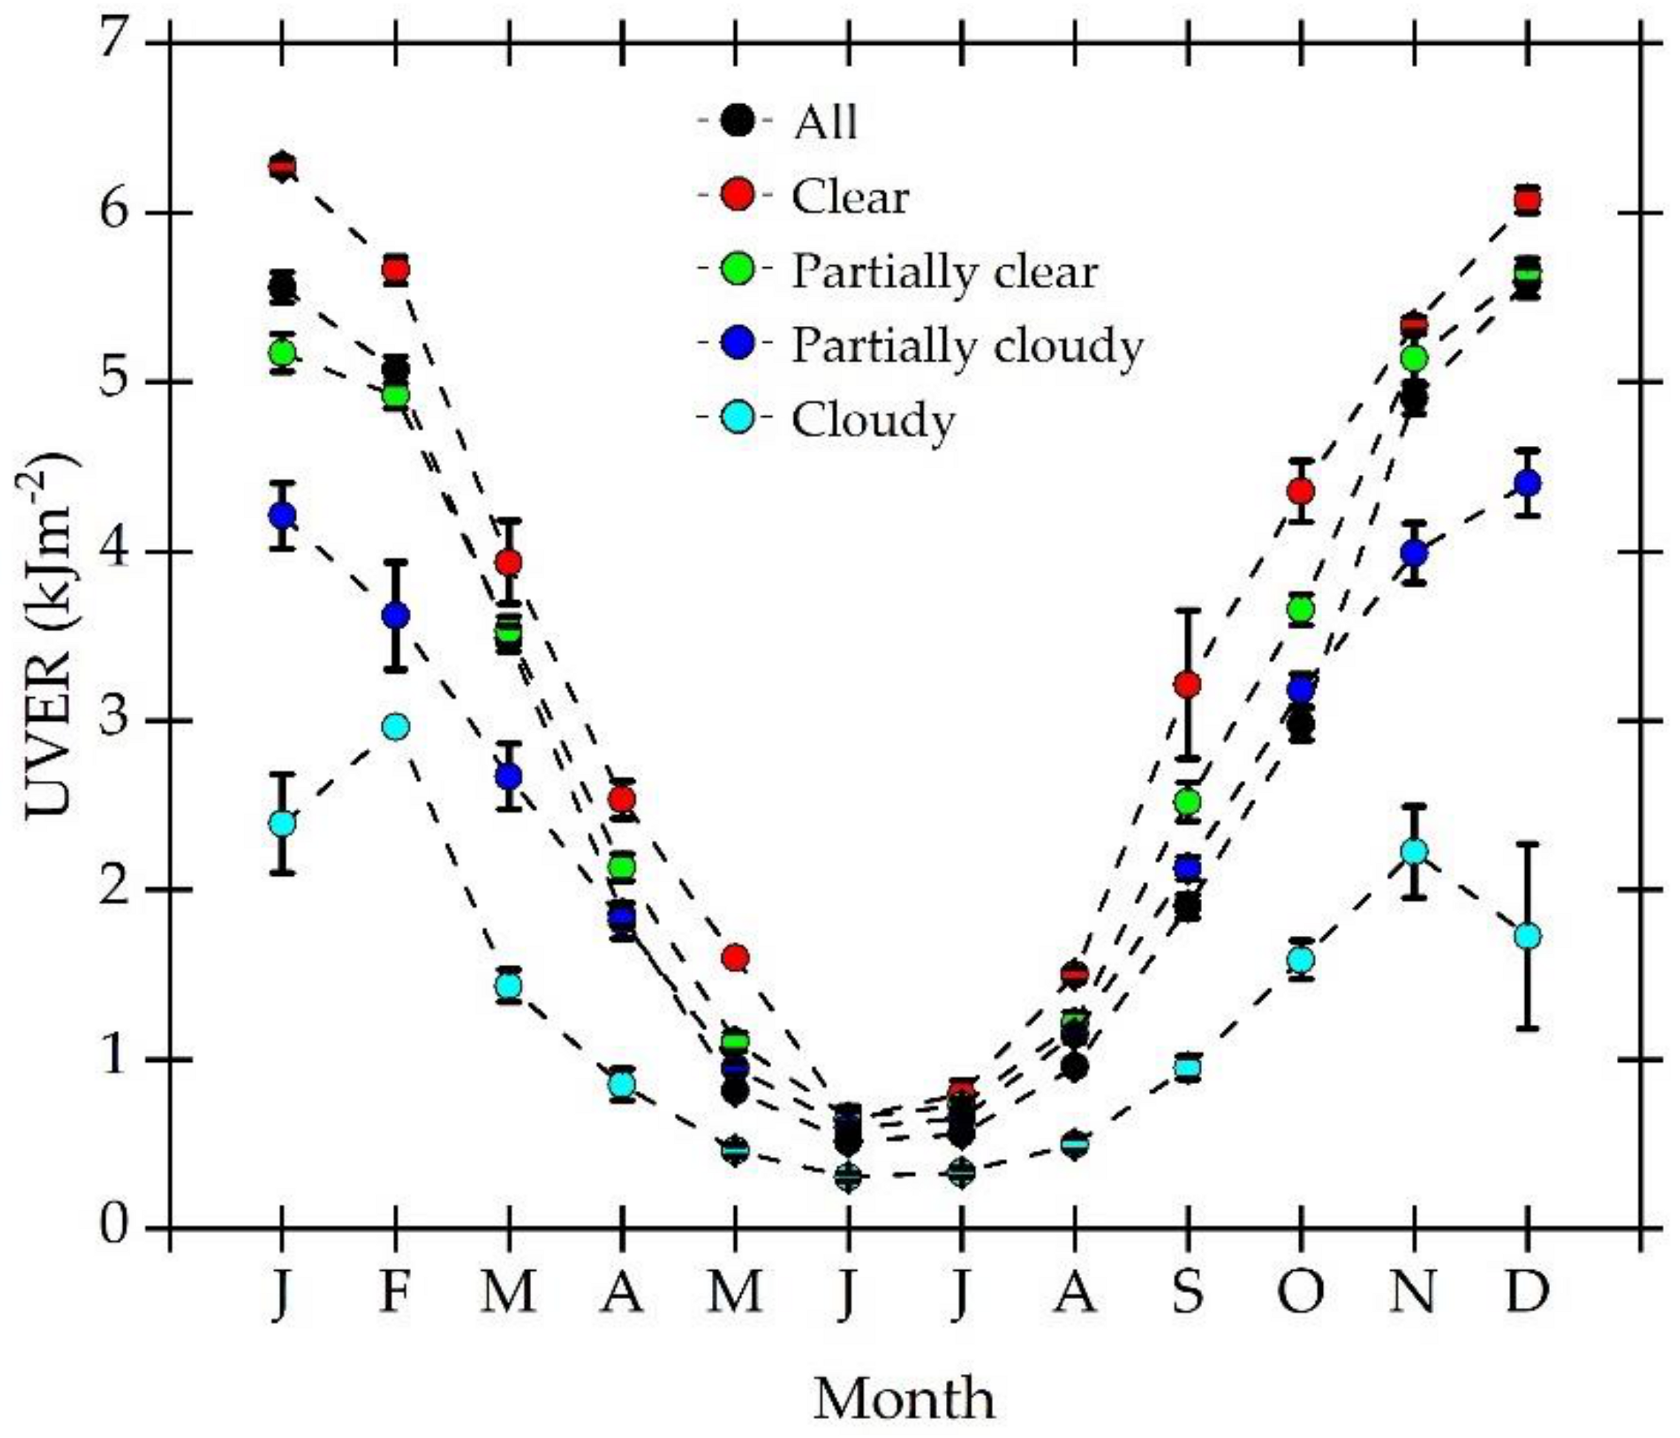
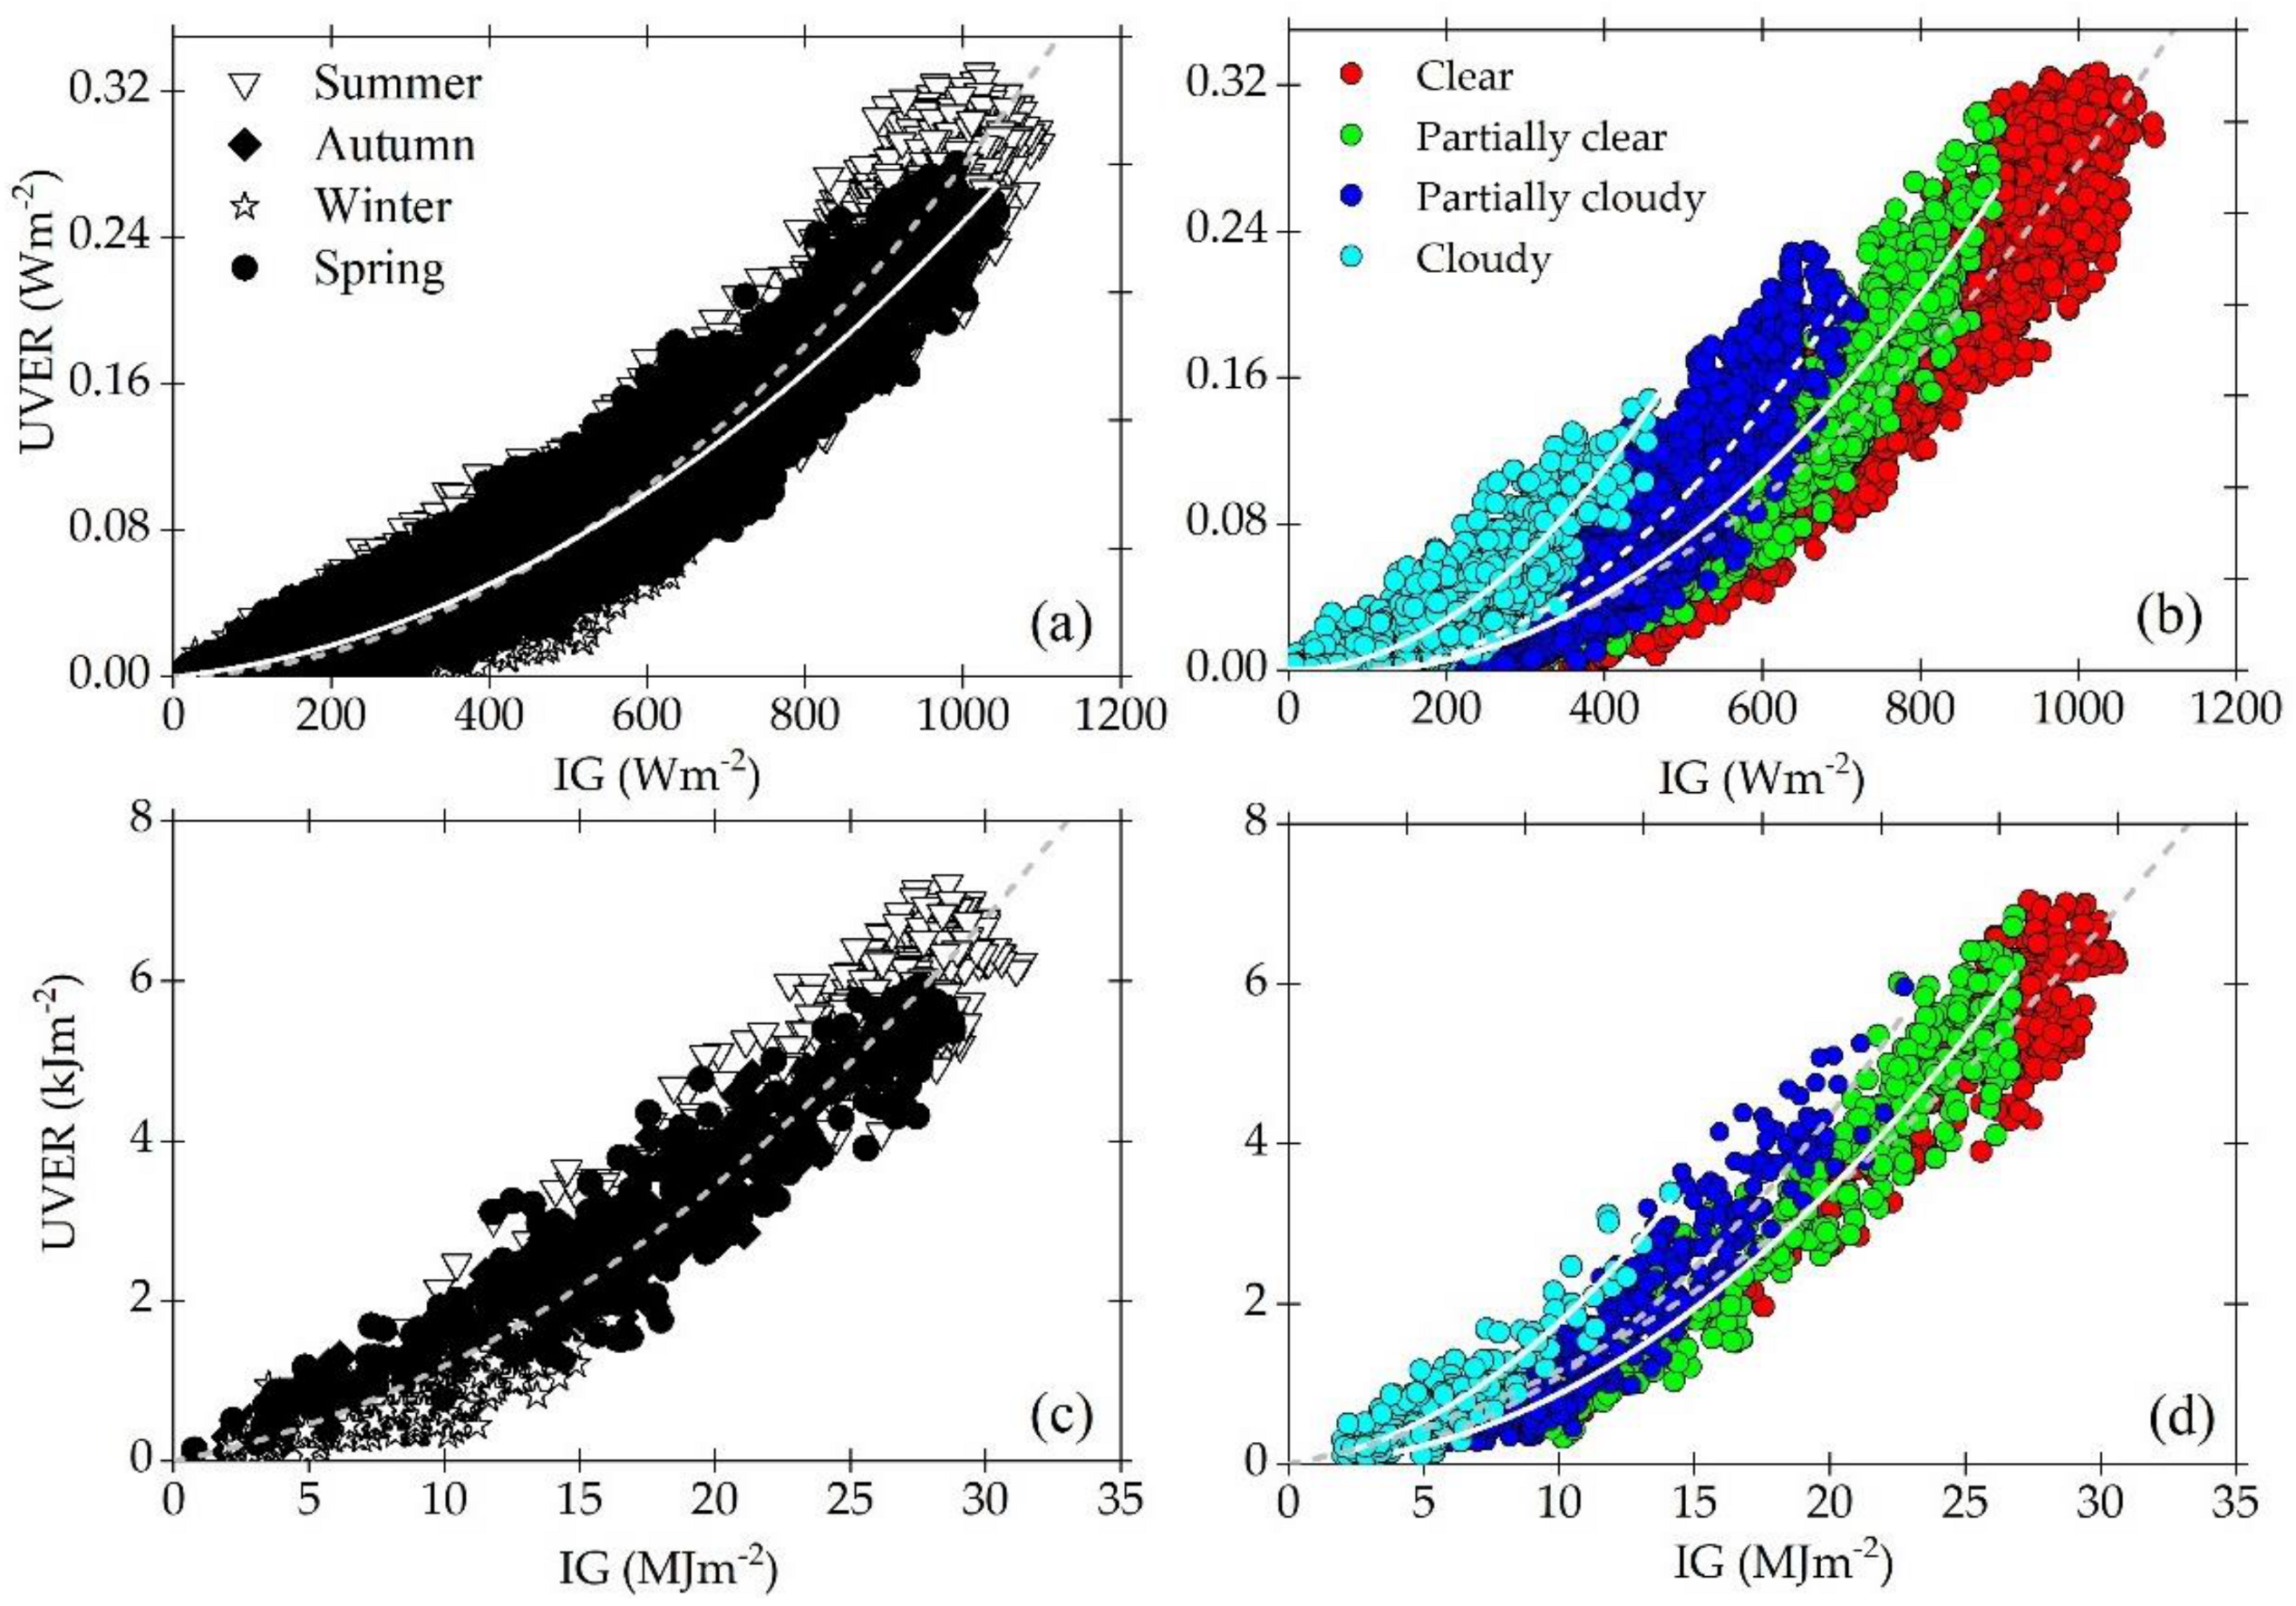
3.1. Seasonal Variation of UVER

3.1.1. Daily Values

The observations carried out in Santiago City from 2015 to 2019 indicate that the monthly average daily values of UVER are equal to 2.84 ± 0.21 kJm−2, ranging from a summer maximum of 5.59 ± 0.09 kJm−2 (December) to a winter minimum of 0.52 ± 0.02 kJm−2 (June) (Table 2). Similarly, the monthly average daily value of IG, on average, is 15.99 ± 1.12 MJm2, also varying from a summer maximum of 25.80 ± 0.36 MJm−2 (December) to a winter minimum of 7 ± 0.22 MJm−2 (June and July). The seasonal variation of both UVER and IG results from a combination of astronomical factors, cloud cover, and TOC patterns. For the latitude of Santiago (~33.50 S), the maximum day length (13.914± 0.004 h) and IGTOA (42.89 ± 0.02 MJ m−2) occur in December, and the respective minima (10.078 ± 0.003 h; 42.89 ± 0.02 MJ m−2) in June. The mean cloud cover in Santiago is 65.9 ± 3.3%, with a winter maximum of 78.4 ± 1.2% (June) and a summer minimum of 51.0 ± 1.2% (February).
The TOC displays a seasonal variation, with a maximum of 310.7 ± 1.8 DU in September, a minimum of 264.8 ± 1.5 DU in April, and a mean of 283.6 ± 4.8 DU. It is important to note that, on average, TOC levels remain below 320 DU, which is considered normal for Santiago [51].
The mean KT is 0.514 ± 0.038, ranging from a summer maximum of 0.628 ± 0.009 (January) to an autumn–winter minimum of 0.411 ± 0.014 (May and July). Similarly, the mean KTUVER is 0.0127 ± 0.0001, varying from a summer maximum of 0.0204 ± 0.0003 (January) to a winter minimum of 0.0049 ± 0.0002 (June and July). In general, CC increases in the winter months as a result of a decrease in KTUVER and KT, and vice versa during summer months. In addition, during winter, the higher frequency of fog and high aerosol loading events also contribute to reduce both clearness indexes in Santiago [52].
The frequency distribution of daily values of KT indicates that clear skies occur in Santiago on 20.3% of the days; the skies are partially clear on 30.6% of the days, partially cloudy on 31.3%, and cloudy on 17.8%. The impact of sky conditions on the seasonal distribution of daily values of UVER is indicated in Figure 2. In Santiago, the maximum daily value of UVER (6.27 ± 0.04 kJm−2) occurs in the summer (January) under clear sky conditions, and the minimum (0.31 ± 0.02 kJm−2) occurs in the winter (June) under cloudy conditions. The difference between daily values of UVER under clear and cloudy skies is, on average, largest during summer (4.34 ± 0.47 kJm−2) and smallest during winter (0.34 ± 0.06 kJm−2). The difference between clear and partially clear or partially cloudy skies drops to 1.96 ± 0.09 kJm−2.

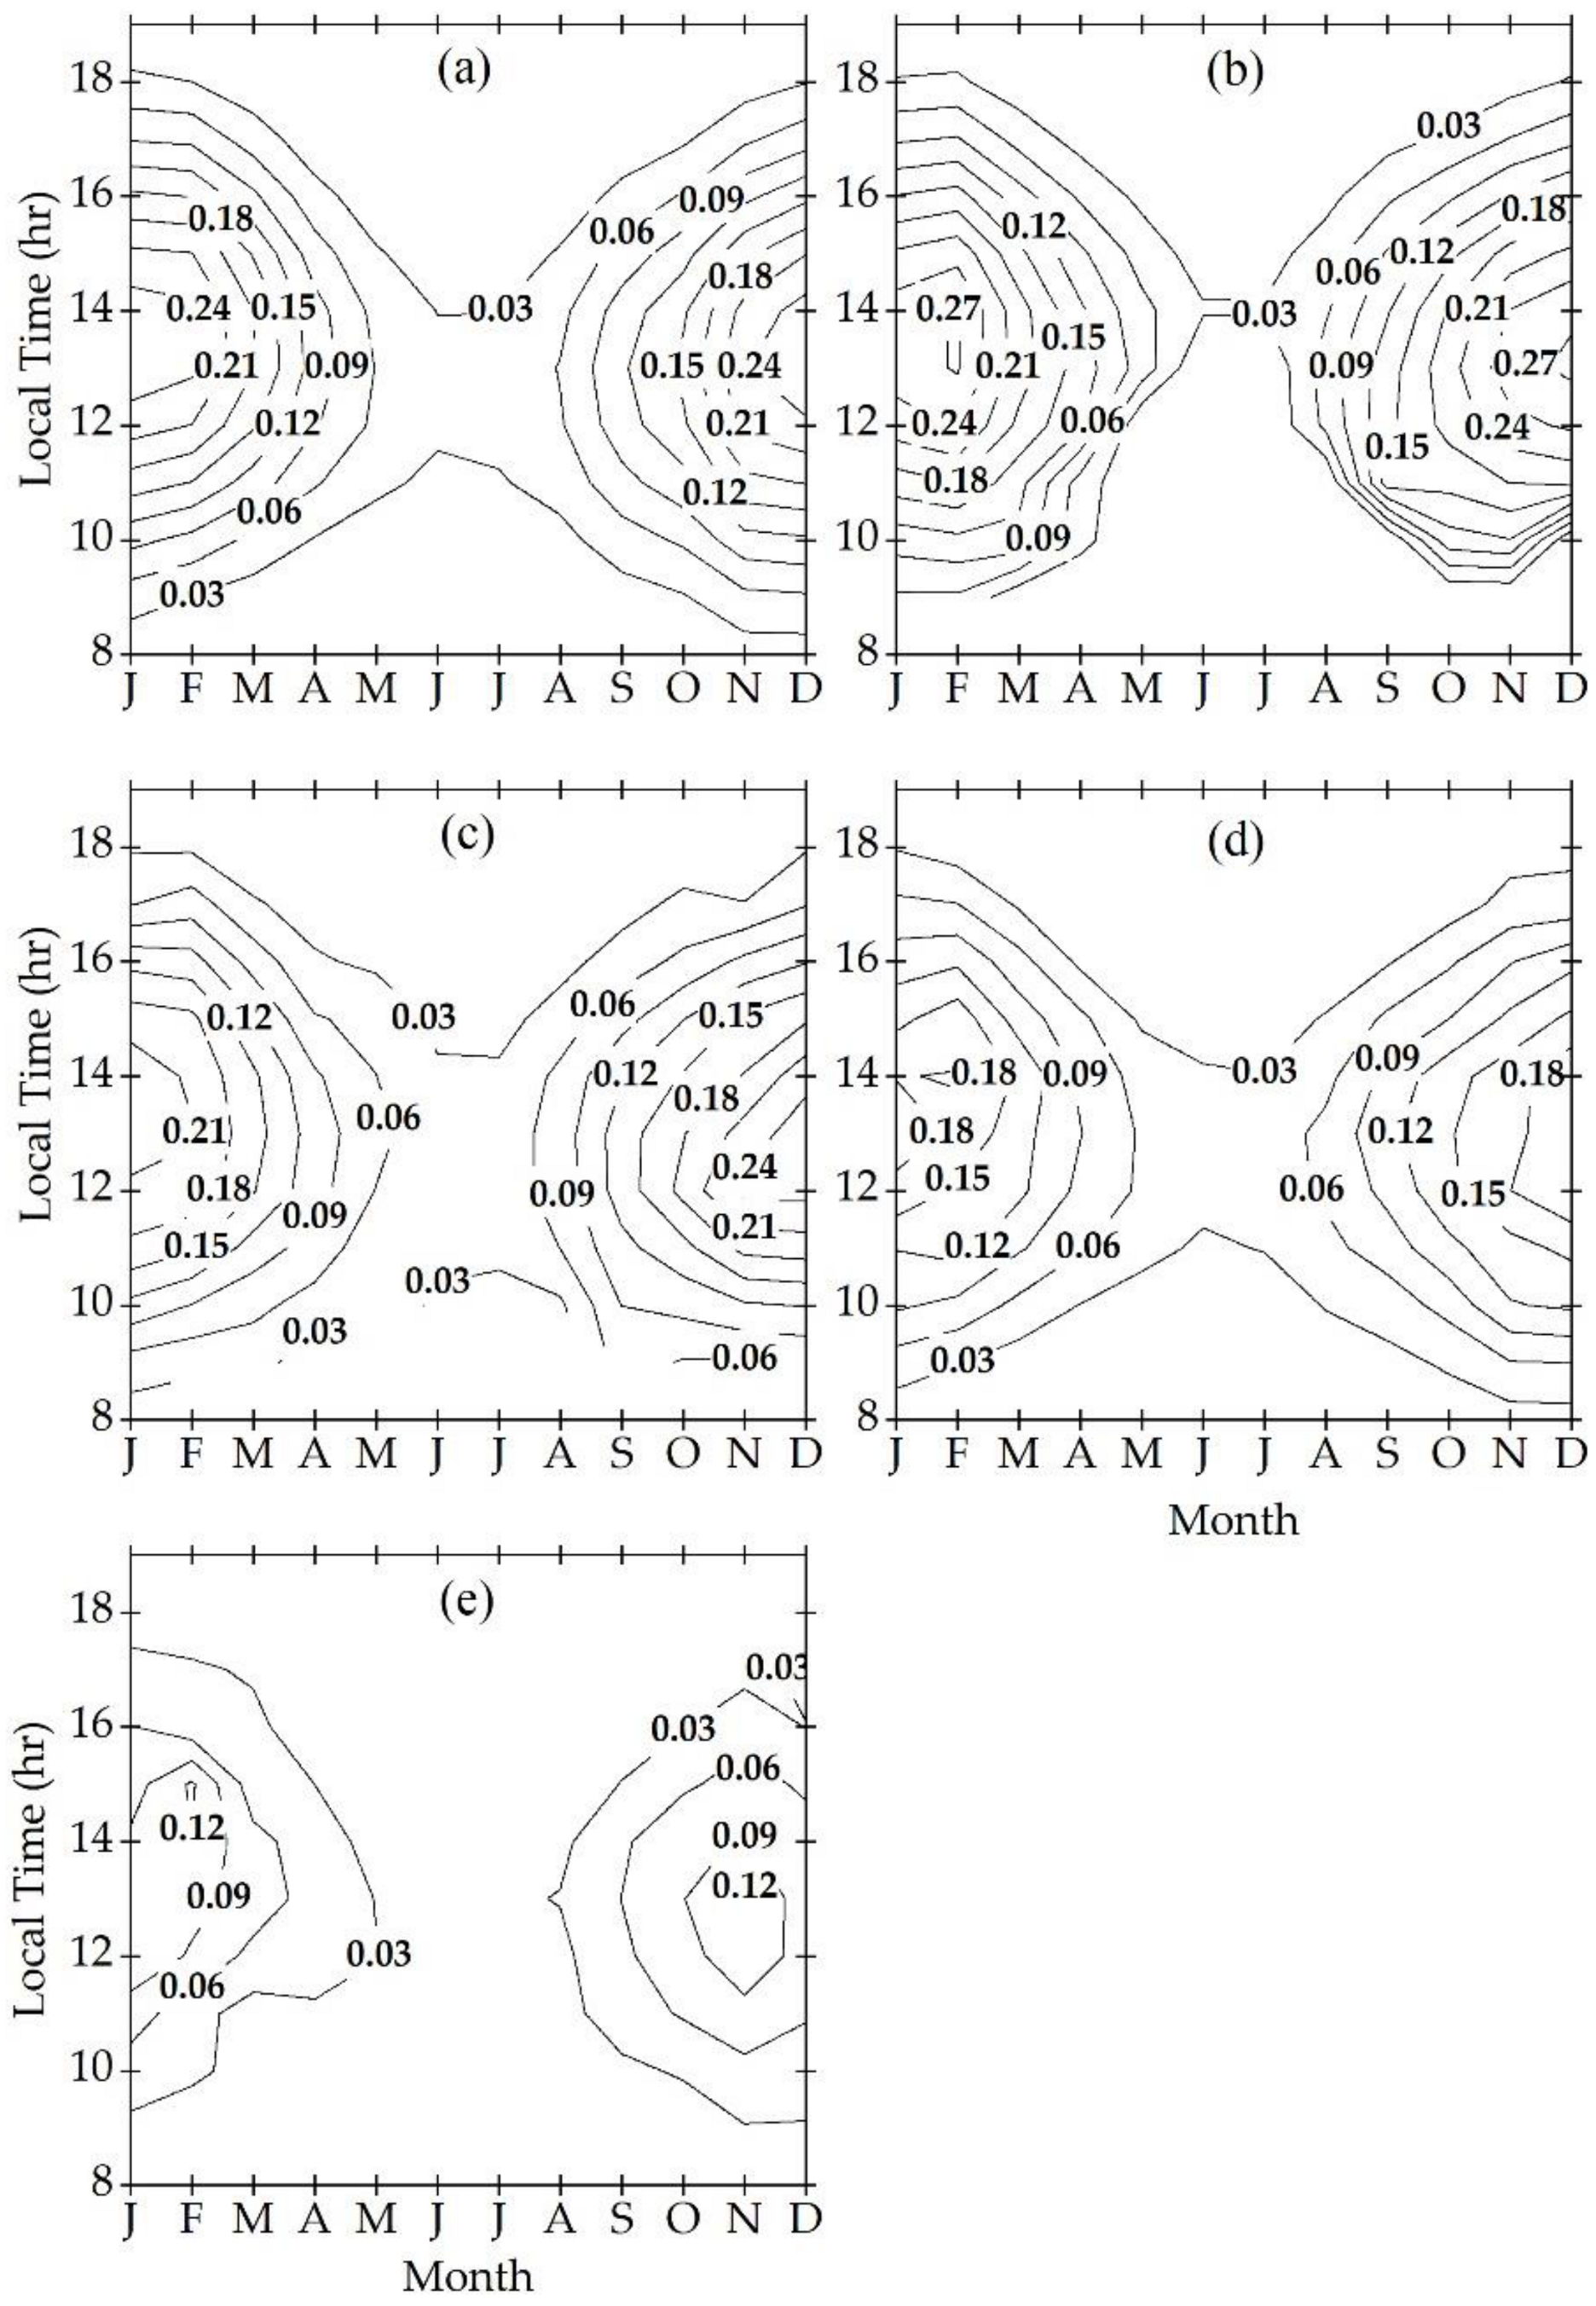
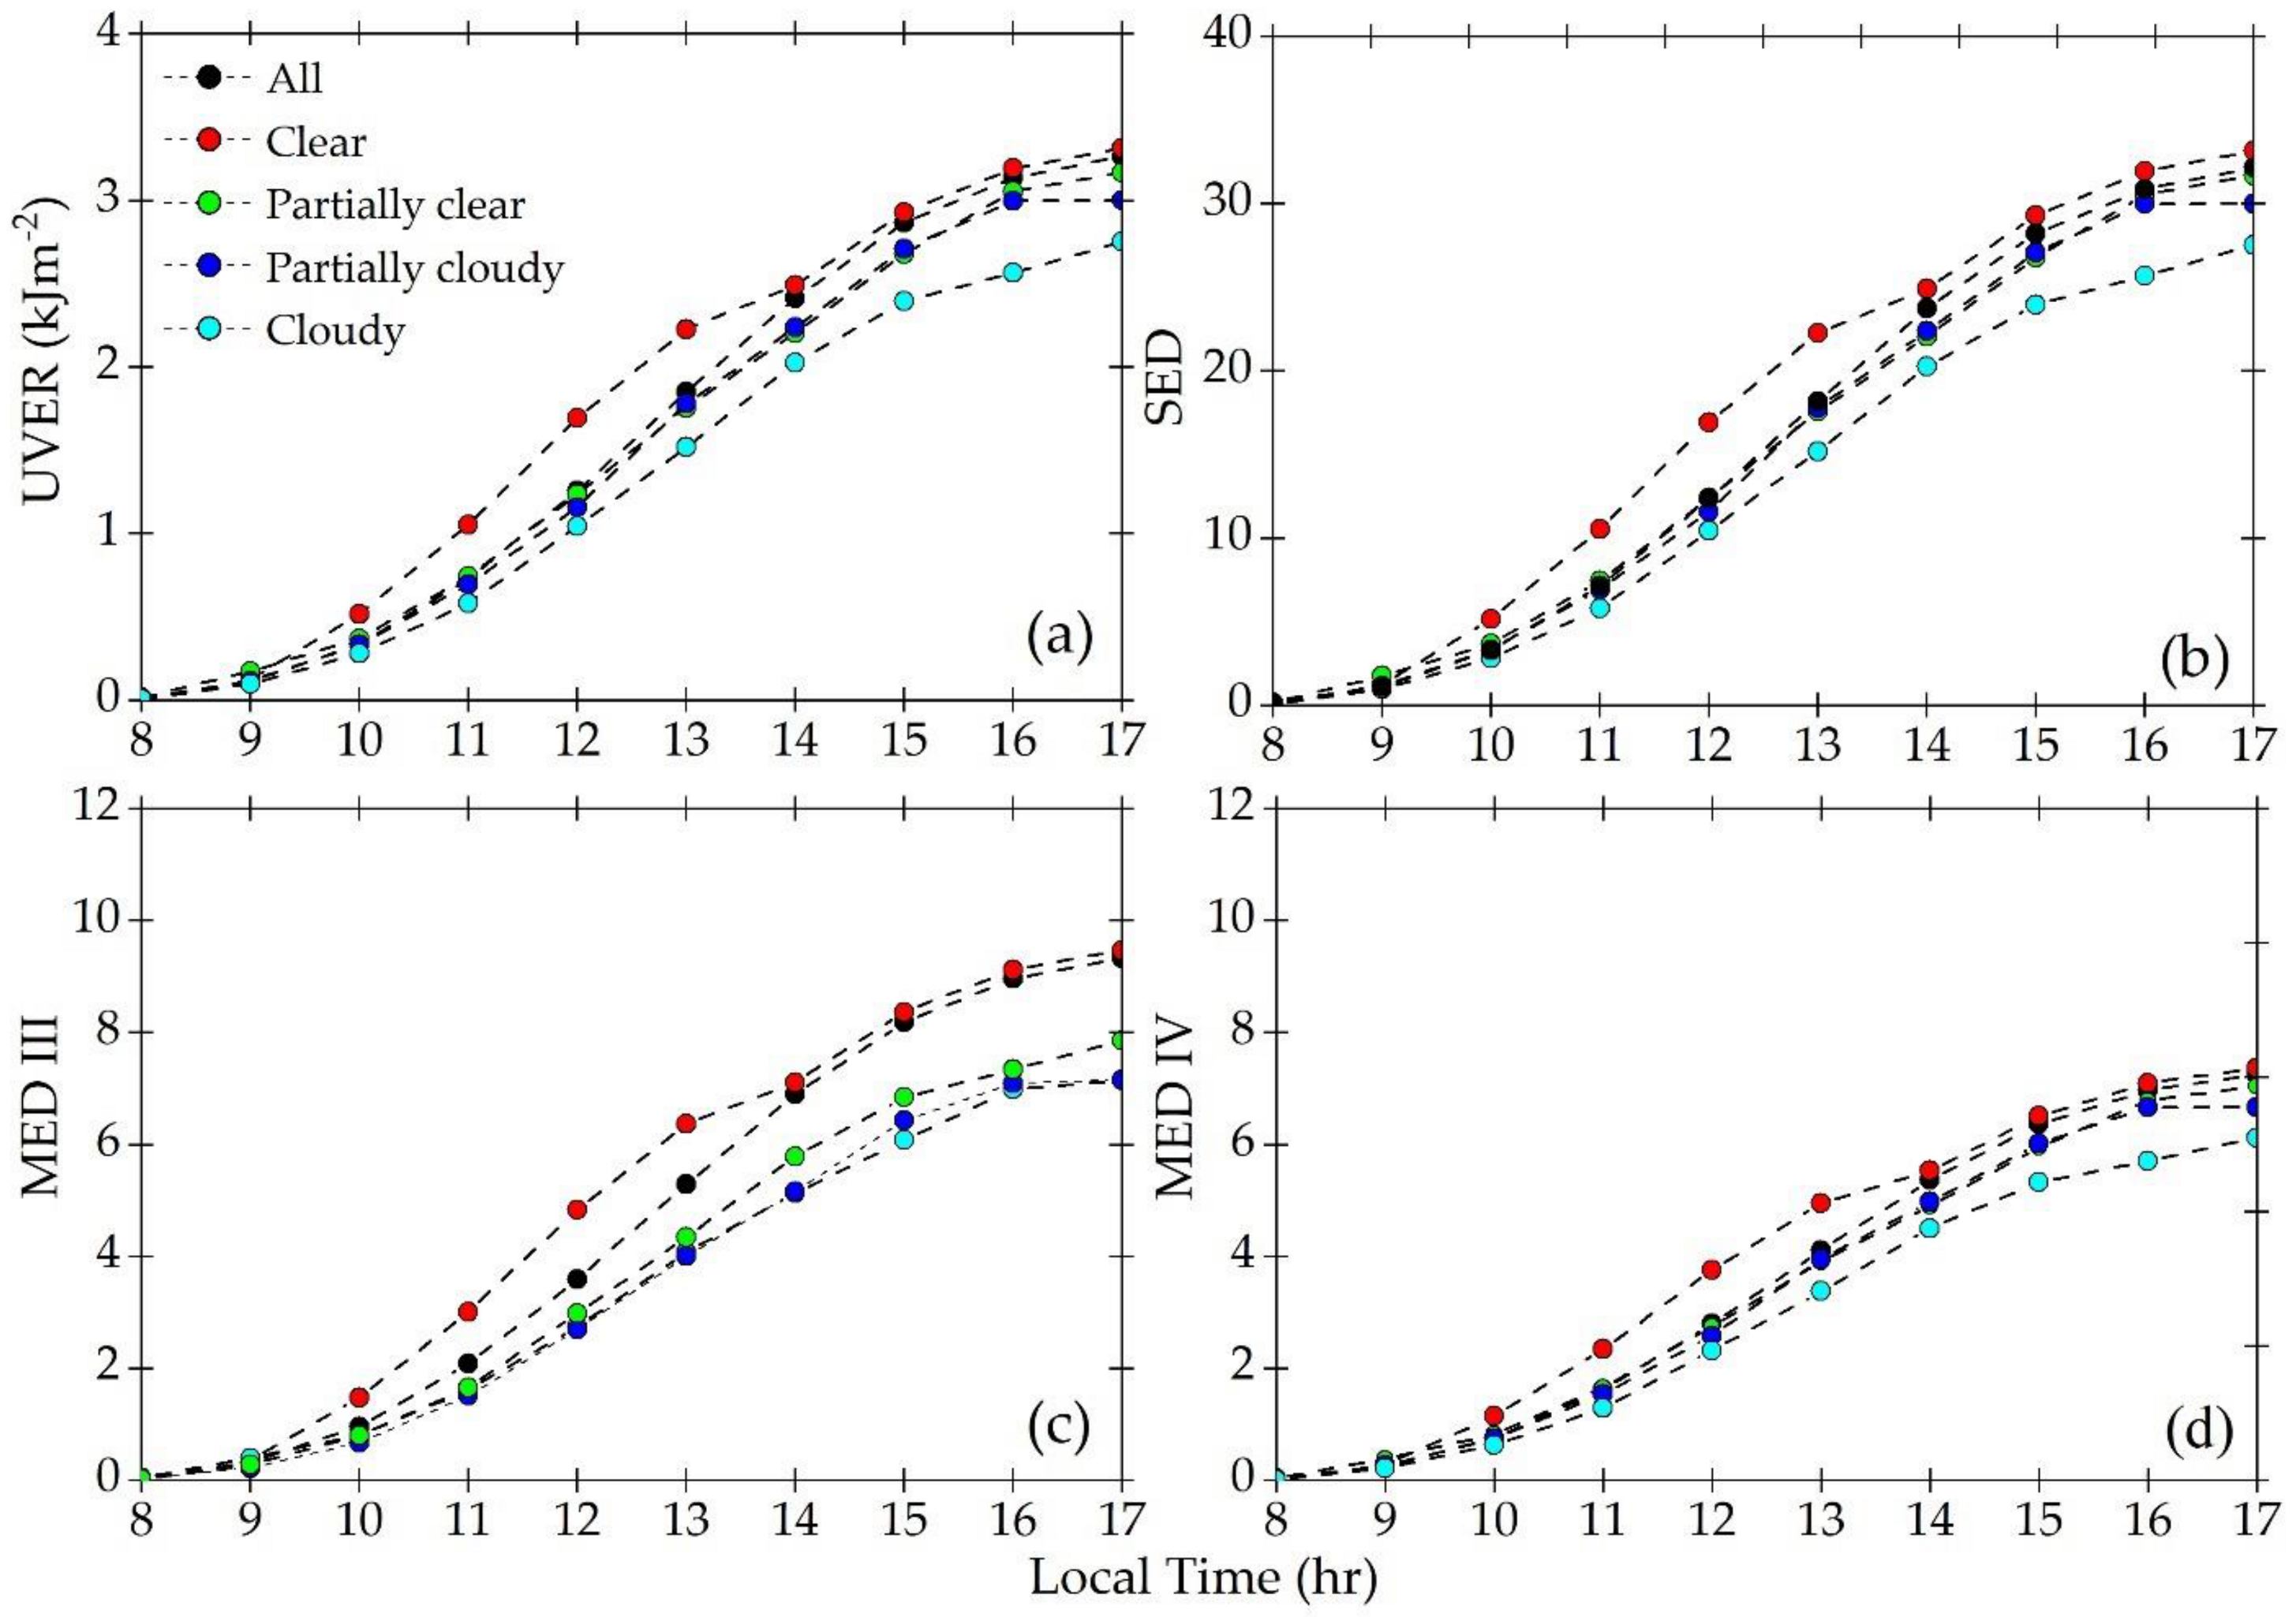
3.1.2. Hourly Values

With selected observations carried out from 8:00 to 19:00 LT, the seasonal variation of the daytime evolution of UVER as a function of sky condition is displayed by contour plots in Figure 3. Monthly average hourly values of UVER under all-sky conditions are found between 0.26 Wm−2 and 0.03 Wm−2 during the central hours period (Figure 3a). The highest differences occur between clear and cloudy skies, with hourly values of UVER exceeding 0.27 Wm−2 (Figure 3b) and 0.12 Wm−2 (Figure 3e), respectively. The maximum hourly values of UVER decrease progressively from 0.24 Wm−2 under partially clear to 0.18 Wm−2 under partially cloudy (Figure 3c,d).

3.2. UVER Effects on Human Health

In this section, four erythema indices—UVI, tery, SEDs, and MEDs—are used to assess the potential risk of exposure to UV radiation in Santiago in terms of sky conditions (Figure 4 and Figure 5). Previous studies have shown that due to the physical–geographical characteristics present in Santiago, satellite-based UVI estimates had significant errors [53,54]. Hence, it is of great importance to have long-term and in situ measurements of the UVER and its relation with the mentioned erythema indexes. There have been few studies in Chile in this direction; most of them are concentrated in the north of the country, e.g., Arica [9,15,25,55].

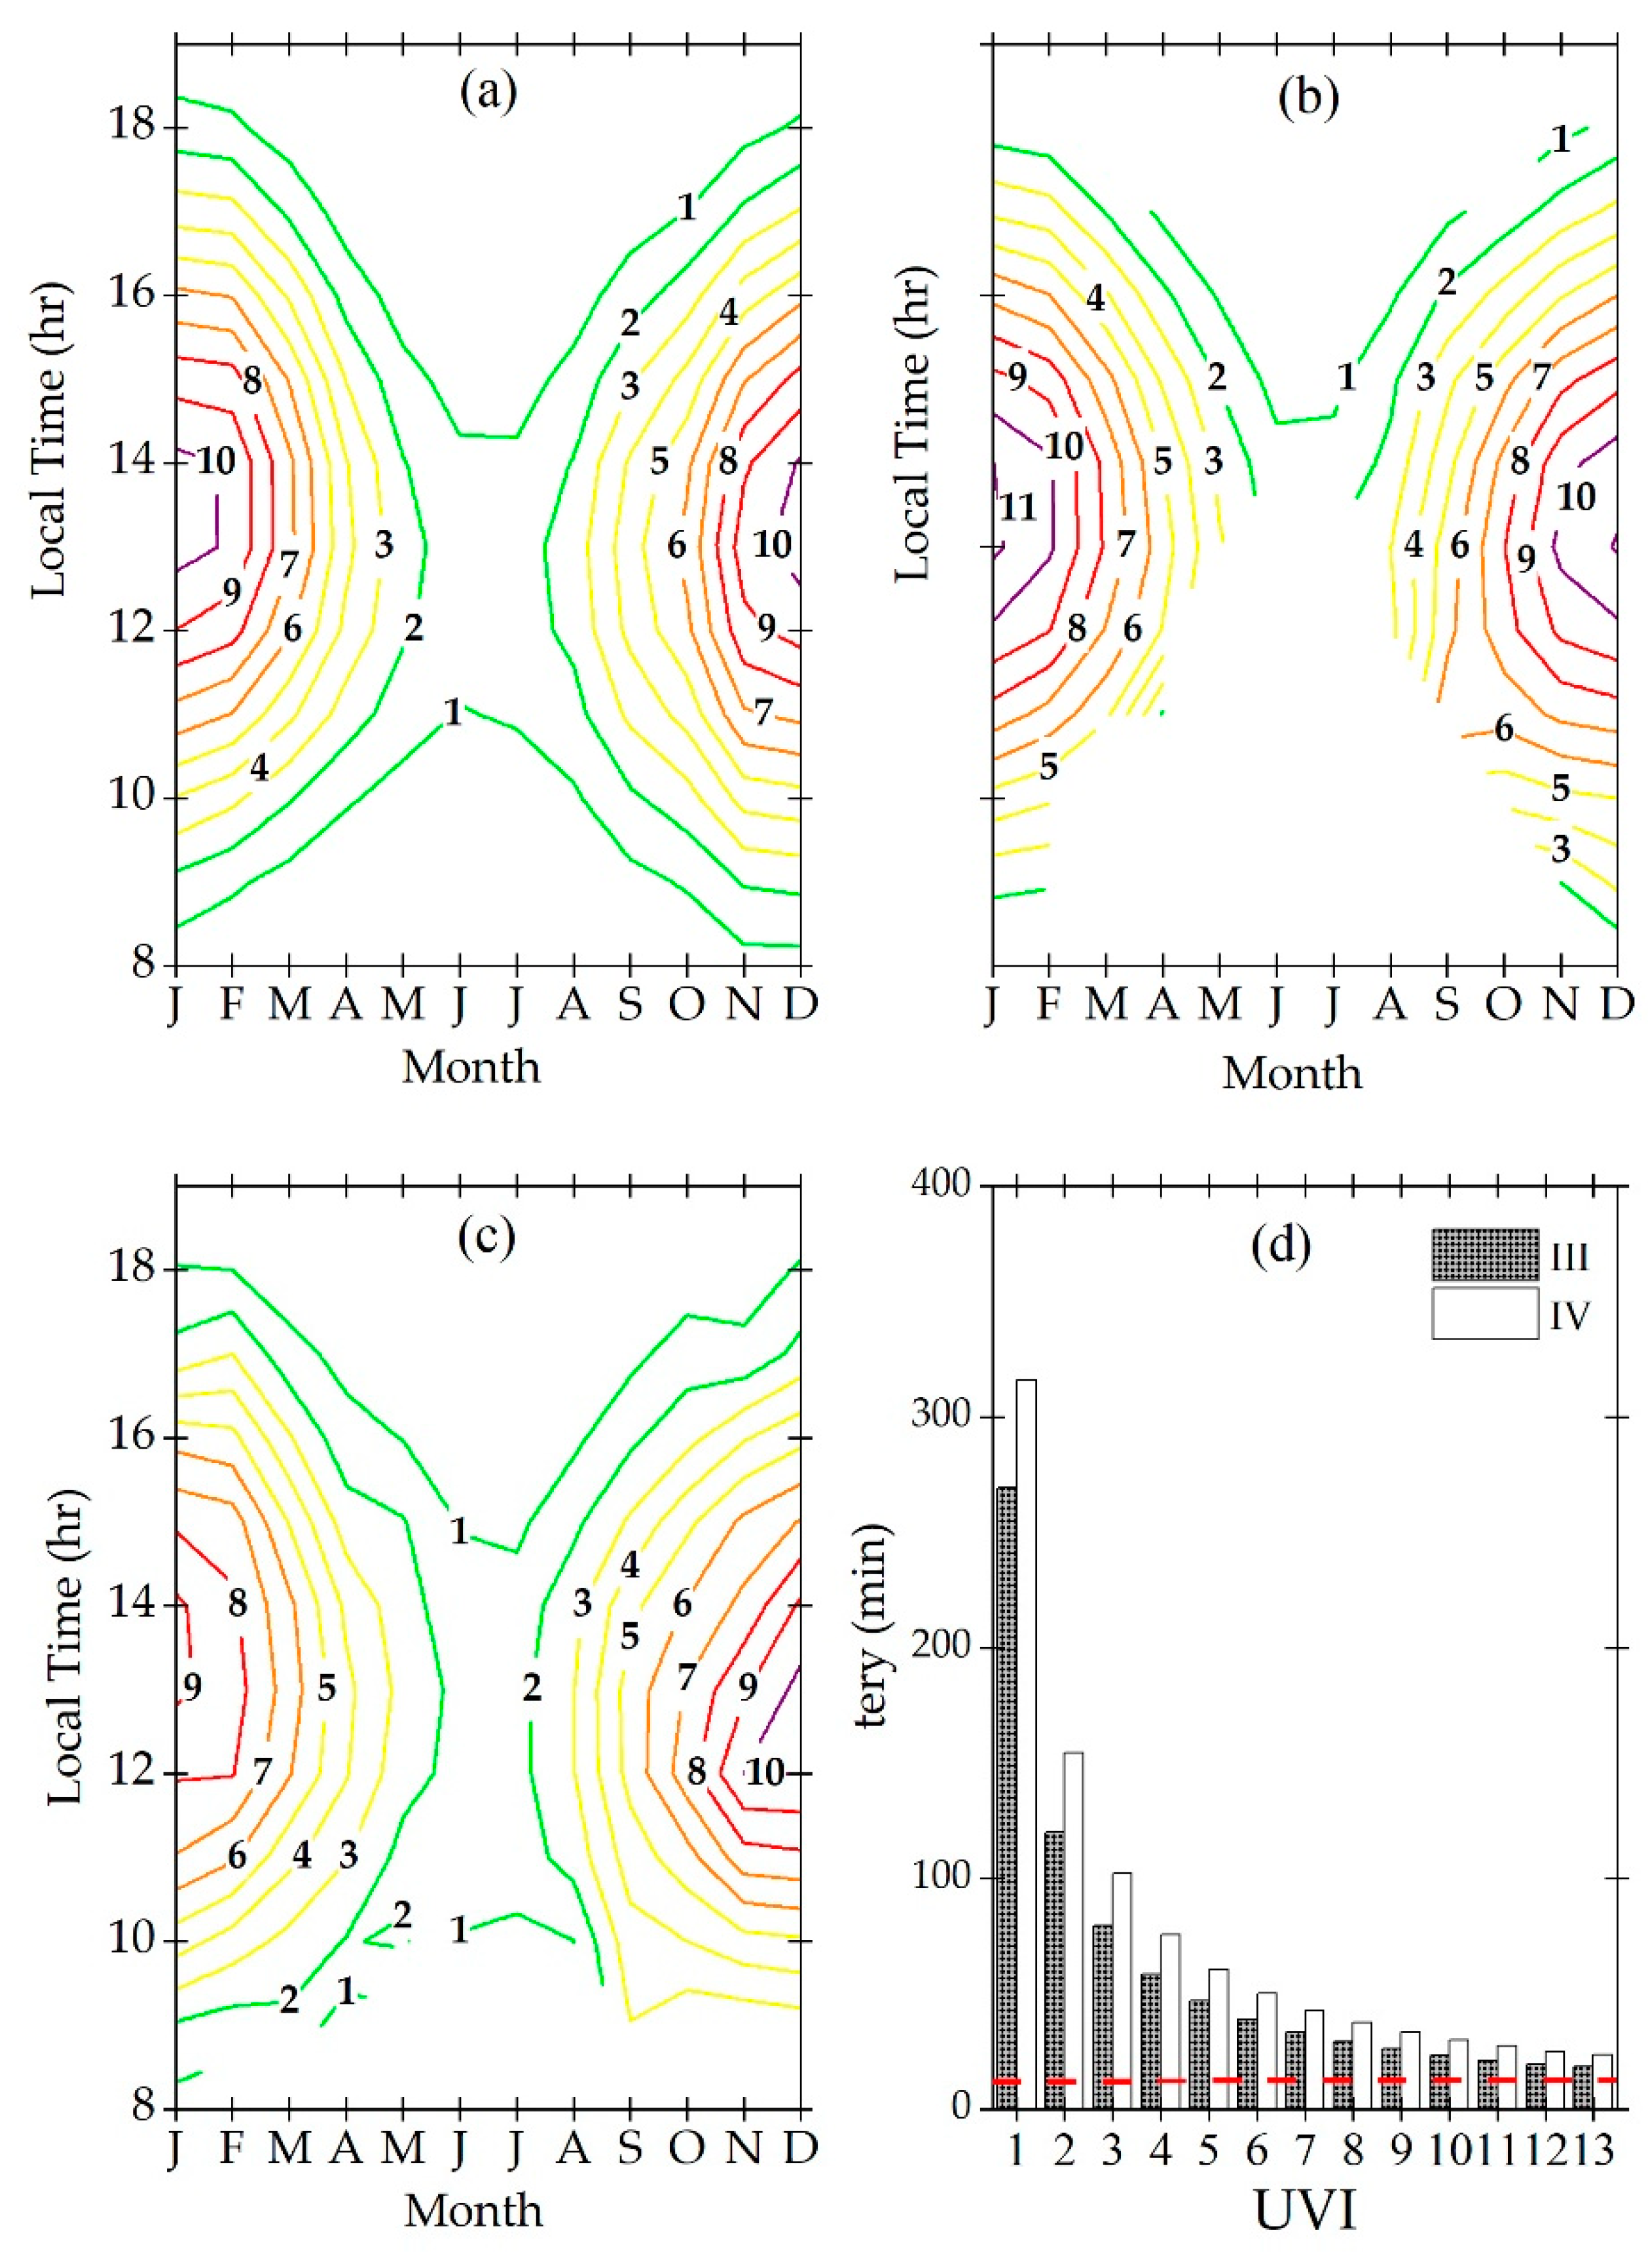
3.2.1. UVI and Sun Exposure Time

Observations during the period 2015–2019 indicate that in Santiago, extreme UV values (UVI ≥11) occur on 26% of the days, while by including high and very high UVI values, the percentage rises to 54%. In summer months, under all-sky conditions, the UVI at solar noon reaches an average of 10 (Figure 4a), coinciding with the UVI measurement reported previously by [53]. Compared to all-sky conditions, the monthly average hourly UVI value increases (decrease) by 1 if the sky condition is clear (partially clear) (Figure 4b,c).
The analysis of monthly average hourly values indicates the presence of UVI equal to 13 at solar noon in January under clear sky conditions (not shown), which is considered as “extreme” according to the World Health Organisation (WHO) [20]. As indicated in Figure 4d (red line), under these extreme conditions, sunburn appears in 10 min for phototypes III and IV [56]. When UVI reaches values of UVI ≥ 10, skin-type III and IV persons suffer sunburn between 18–23 and 24–30 min, respectively. Now, when UVI values are between 3 and 4, a skin-type III person takes 60 min to suffer sunburn. Therefore, the population with skin types III and IV, which is predominant in Chile, is chronically exposed to high UV radiation levels without warnings of the consequences.
In the spring months, 26% of the UVI values are greater than 6. This fraction of UVI values increases to 54% when the lower threshold drops to 4. In autumn, 44% of the UVI values are less than 3 (medium), and the average value is 4. During the winter months, the UVI reaches values of 1 and 2, which are known as harmless for people. However, recent studies by [57,58] showed that even a UVI of less than 2 can cause damaging sunburns to fair skin with prolonged exposure time.
Considering these reasons, the UVI is a valuable tool for measuring health-safe sun exposure, but the exposure time is similarly important and must be considered. Ou-Yang and co-workers [59] showed that a beach umbrella alone does not provide sufficient protection for long UV exposure. Hence, this information could be used for alerting people when practising recreational outdoor activities, such as snowboarding, soccer, or beach events, as well as for outdoor workers [60].

3.2.2. Erythemal Doses (SED and MED)

As indicated in Figure 5a–d, the accumulated hourly values of UVER are related to the standard and minimal erythemal doses—SEDs and MEDs, respectively. A non-linear growth was always observed during the day.
Considering the period from 8:00 to 17:00 LT, it is observed that the accumulated UVER varies from 3.31 kJm−2 for clear skies to 2.75 kJm−2 for cloudy skies (Figure 5a), corresponding to SED variation from 33.14 and 28.04 (Figure 5b). Under partially clear and partially cloudy skies, the maximum accumulated values of UVER decrease to 0.15 and 0.32 kJm−2, respectively. Consequently, SEDs maintain high values of up to 29.98, and therefore, the presence of clouds associated with partially clear and cloudy sky conditions does not provide an effective filter for protection against UV rays.
In Santiago, when exposed to the direct sunlight between 8:00 to 17:00 LT, people with skin phototype III will receive an average of 9–10 times the minimum dose needed to cause sunburn, while a person with skin phototype IV receives seven times the dose to cause the same damage in clear conditions and six times when cloudy skies are present. The MED III and MED IV for partially clear and partially cloudy conditions were found between seven and six times, indicating that cloudy skies can minimize the UVER reaching the Earth’s surface. However, cumulative doses can exceed recommended levels even in individuals with resistant skin types or melano-protection (III and IV).
Simply by exposing themselves to the sun from 11:00 to 13:00 LT under clear conditions in December, skin phototype III (IV) persons receive, on average, 11 (9) times more than the minimum amount of radiation to cause erythema. Even in July, they are exposed to the amount corresponding to 1 MED.
Under clear and partially clear sky conditions before 11:00 LT, accumulated daily doses of up to 1.28 kJm−2 were observed in Santiago (Figure 5a). Considering the MEDs for skin phototypes III and IV, an individual exposed before 11:00 LT could receive approximately three or two times the minimum amount of radiation to develop erythema, respectively (Figure 5c,d). Therefore, because the safe amounts of erythemal UV doses are even exceeded during the safe hours (before 11:00 LT), it is recommended to implement sun protection as part of everyday life.

3.3. Development of Hourly and Daily Models

Observations have confirmed that UV and IG radiation are well correlated [30,61,62]. This property stems from the fact that the UV radiation component responds to atmospheric attenuation similarly to the entire solar radiation spectrum, allowing us to model the relationship between both variables by fitting simple polynomial functions through the cloud of points in a dispersion diagram of UVER versus IG. The polynomial degree (model type) depends on the shape of the experimental points’ distribution in the UVER–IG dispersion diagram. For Santiago, dispersion diagrams based on hourly (Figure 6a,b) and daily (Figure 6c,d) values of UVER indicate that the best fits are given by a second-degree polynomial. Earlier studies provided similar results [35,63,64]. This occurs because UVER responds to the scattering processes differently when the intensity of solar radiation is small [34,64,65]. For instance, when zenith angles are large—mainly close to sunrise and sunset or during the winter months—the reduction in UVER is disproportionately larger than in IG due to the high optical depths produced by ozone absorption and Rayleigh scattering effects.
A visual inspection of Figure 6 indicates that the best fitting is yielded by the quadratic model UVER= a IG2 + b IG + c. The coefficient c is set equal to zero to ensure that UVER = 0 since IG = 0. Table 3 shows the model coefficients (a, b) and the number of hourly and daily values of UVER. This modelling takes major features of local climate into consideration by explicitly considering the individual effects of seasons and sky conditions, as well as their combination (interactions).

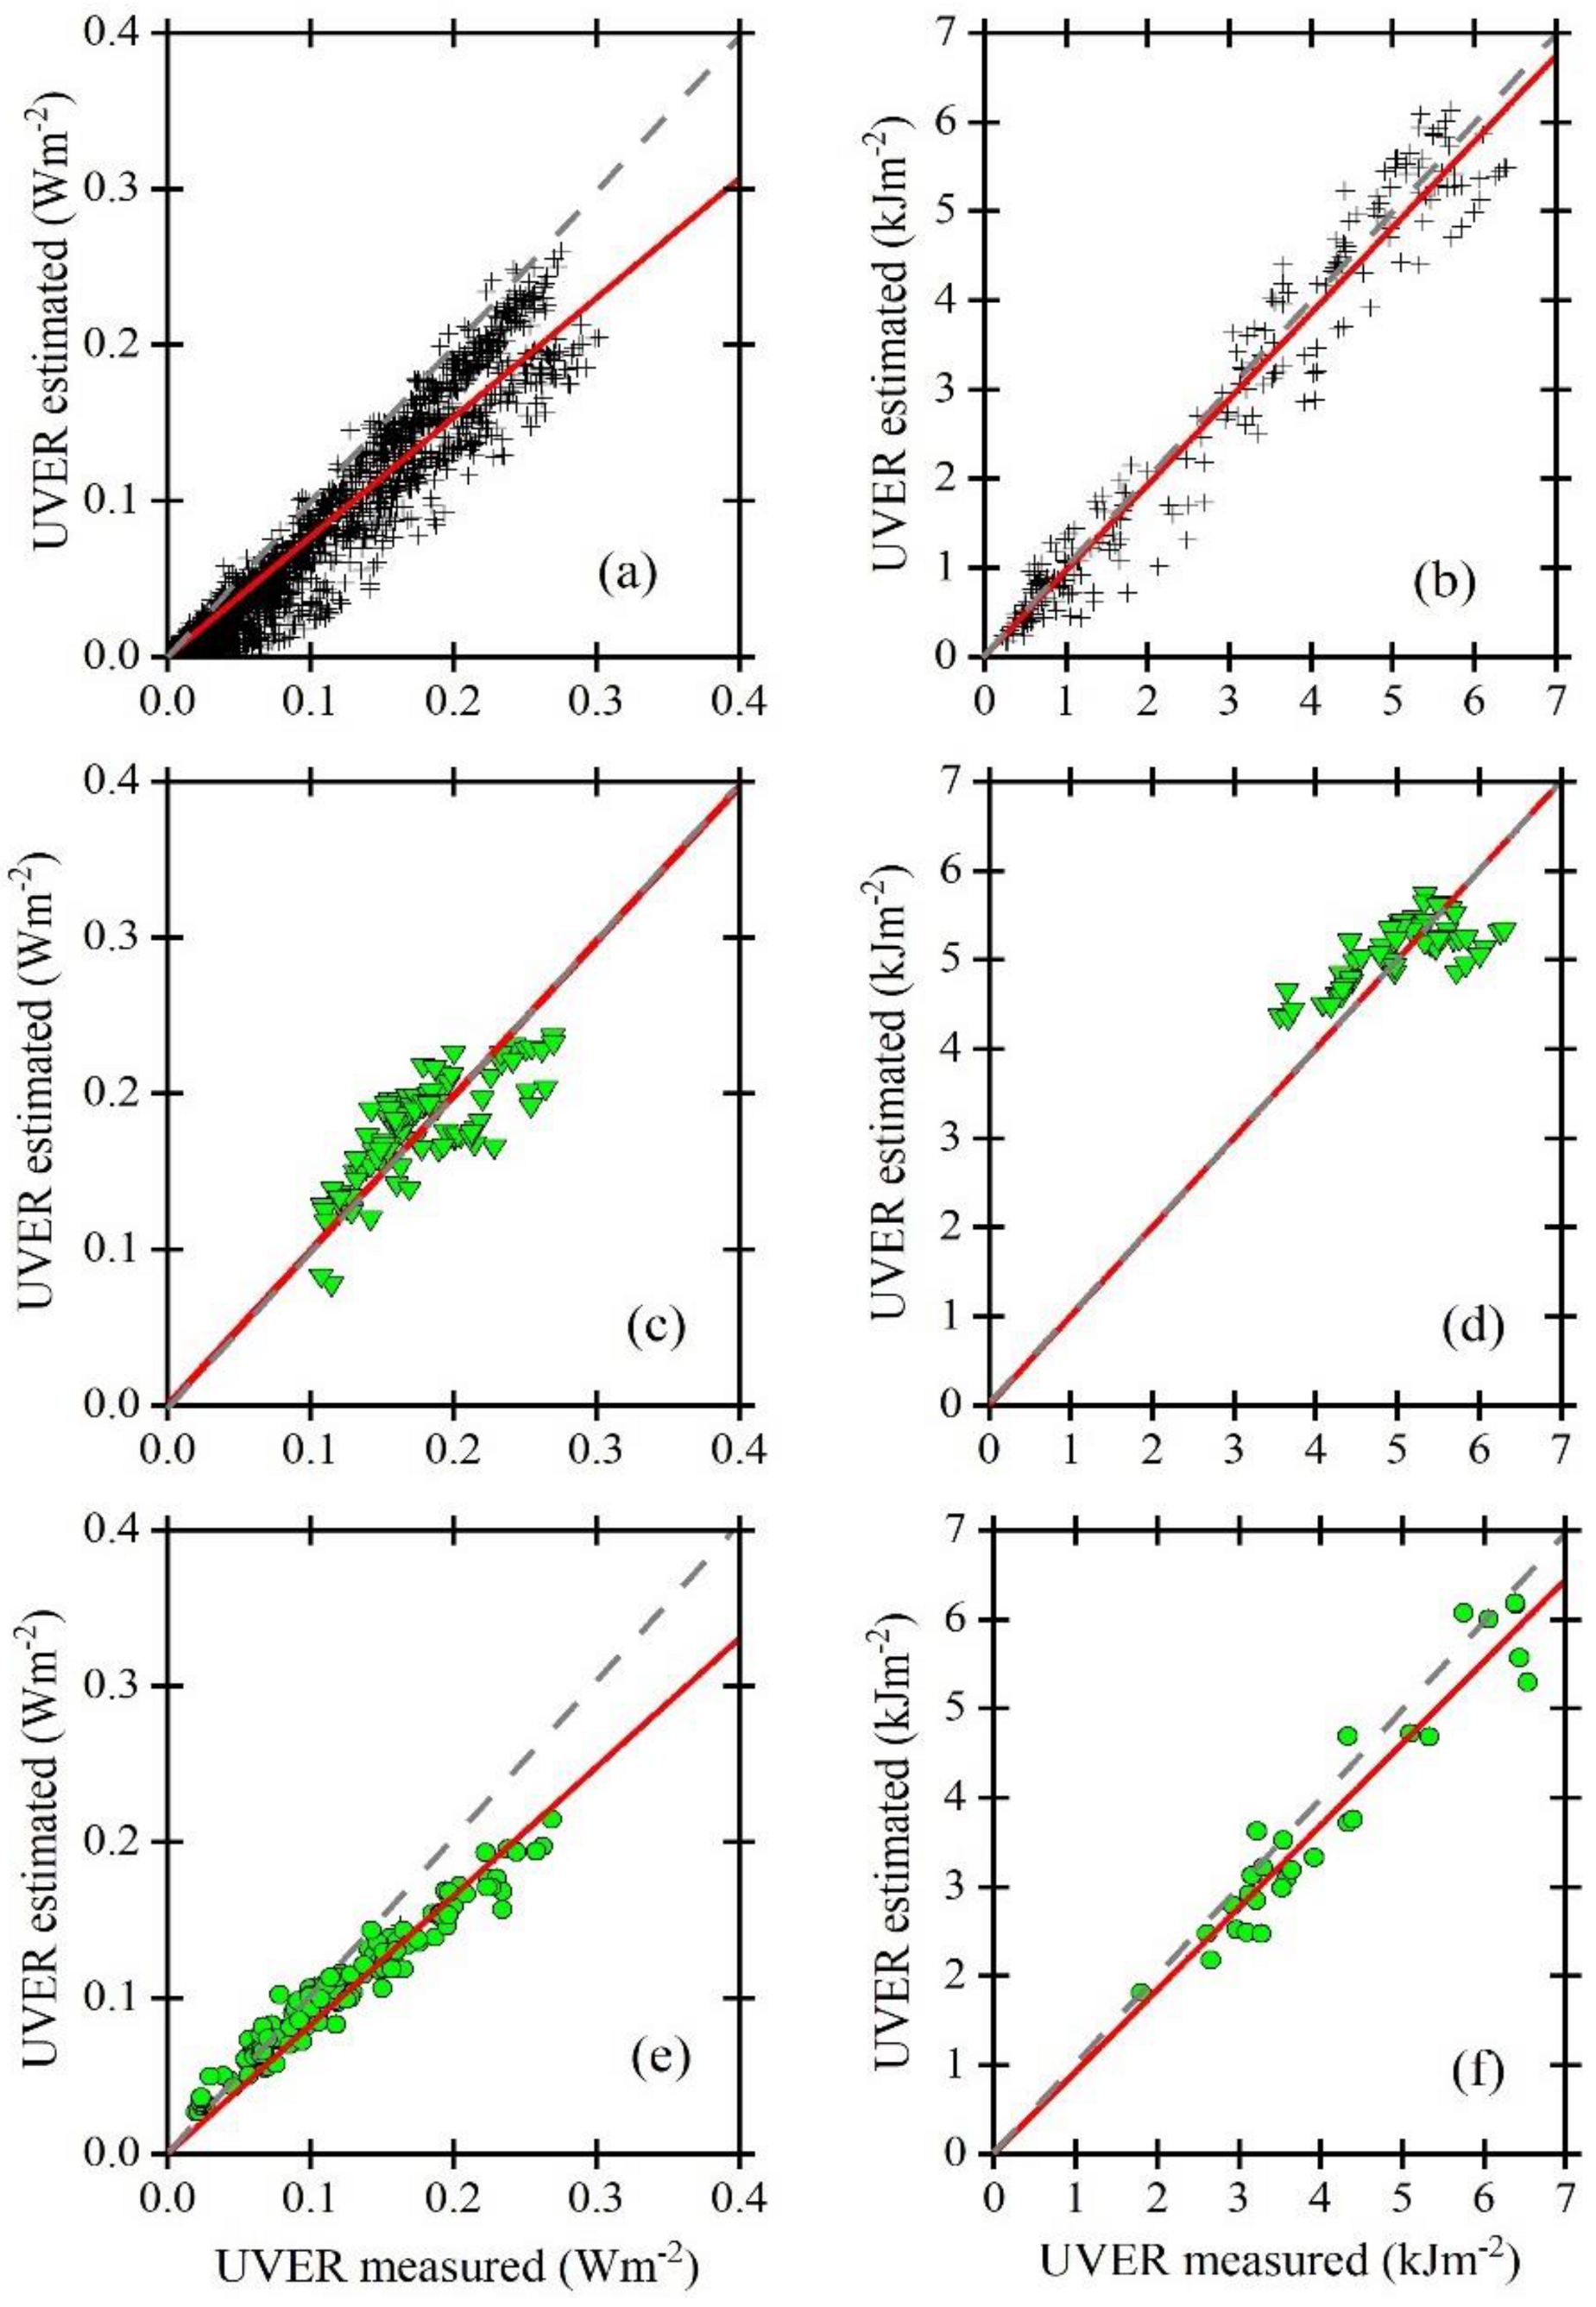
3.4. Model Validation

The performance of the models developed in the previous section for Santiago is investigated in this section by using the measurements of UVER and IG carried out in 2019 as a validation dataset. The accuracy and precision of the models are assessed using MBE, RMSE, NRMSE, MAPE, and IA, as described in Section 2.6. The results are shown in Table 4 and Table 5. When the statistical parameters MBE, RMSE, NRMSE, and MAPE are simultaneously small, they indicate a good agreement between model results and in situ measurements. Negative (Positive) MBE indicates that the model results underestimate (super-estimate) measurements. On the other hand, IA = 1 indicates a perfect model score.

3.4.1. Hourly Values

Among the hourly models (Table 4), the MBE, RMSE, NRMSE, IA, and MAPE values vary between −0.041 and 0.018 Wm−2, 0.006 and 0.046 Wm−2, 13.2% and 80.1%, 0.72 and 0.98, and 12.82% and 59.58%.
The low MBE is displayed by the hourly model for autumn. The other minimal values of statistical indicators are: RMSE = 0.006 Wm−2 for the model Winter + Cloudy, NRMSE = 13.2% for the model Summer + Clear, and MAPE = 12.82% for the model Summer + Partially clear. Most of the models yield IA values above 0.90, which indicates a good score for all hourly models, with exceptions of Winter + Partially clear (IA = 0.72), Winter + Partially cloudy (IA = 0.89), Winter + Cloudy (IA = 0.86), and the Spring + Clear daily model (IA = 0.83). This latter model exhibits the largest MBE (−0.041 Wm−2), indicating that, for clear skies during spring, the modelled hourly values for UVER significantly underestimate the observations. In addition, the Spring + Clear and Autumn + Cloudy models show low performance according to the RMSE (0.046 Wm−2) and NRMSE (80.1%) indicators, respectively. Based on the MAPE indicator, the worst results with significantly different values from their measured counterparts were presented by the Spring model.

3.4.2. Daily Values

In the case of the daily models (Table 5), the MBE, RMSE, NRMSE, IA, and MAPE values vary between −0.423 and 0.360 kJm−2, 0.164 and 0.738 kJm−2, 10.0% and 37.4%, 0.73 and 0.99, and 8.48% and 26.21%, respectively.
Unlike hourly models, daily models underestimate observation during Autumn (MBE = −0.016 kJm−2), Winter (MBE = −0.099 kJm−2), and Spring (MBE = −0.423 kJm−2), by far the largest discrepancy. The lowest MBE is displayed by the Cloudy model with −0.015 kJm−2. The Summer + Partially clear model presented the lowest NRMSE and MAPE with an error below 10.0%, while the Winter + Cloudy model indicated the lowest RMSE (0.164 kJm2). The best agreement was presented by the Autumn model (IA = 0.99), followed by the General model (IA=0.98). The worst IAs were presented by the Summer + Partially clear (IA = 0.73) and Winter + Partially cloudy (IA = 0.77) models. When the validation dataset size was smaller than 10 days, the model validation is not performed (Table 5).
One can notice that some models with similar or slightly similar performances improve them when seasonal and sky conditions are simultaneously considered. For example, for daily values (Table 5), the Summer + Partially clear model displays MBE = −0.060 kJm−2, MAPE = 8.48%, RMSE = 0.505 kJm−2, and NRMSE = 10.0%, which is more accurate than the Summer (MBE = 0.360 kJm−2, MAPE = 14.06%, RMSE = 0.651 kJm−2, and NRMSE = 13.2%) or Partially clear (MBE = 0.095 kJm−2, MAPE = 10.57%, RMSE = 0.586 kJm−2, and NRMSE = 12.8%) models. The only indicator that is not improved is the IA, possibly due to the lack of data. Similar behaviour is presented by hourly values, mainly for the models: Summer + Partially clear (MBE = 0.002 kJm−2, MAPE= 12.82%, RMSE = 0.025 Wm−2, and NRMSE = 14.6%) and Autumn + Partially clear (MBE= −0.001 kJm−2, MAPE= 14.46%, RMSE = 0.013 Wm−2, and NRMSE = 17.4%), as displayed in Table 4. Although for these cases, the IA indicates an ideal model score, to confirm this improvement, a much longer time series must be considered in both cases (hourly and daily interaction models).
Figure 7 shows comparison examples between modelled and measured hourly (left) and daily (right) values of UVER. In most of the cases, point clusters are distributed around the diagonal line (red), and R2 ≥ 0.91 in all cases (Figure 7a–f). The exception is for daily values of UVER diagnosticated by the Summer + Partially clear model (Figure 7d), with R2 equal to 0.73. This values of R2 are comparable to those reported in previous studies by [34,64,65].
Table 6 shows the percentage (%) difference between the estimated and measured hourly and daily UVER values using the General models. The largest difference for hourly and daily models was found in Spring (−56.9–3.1%), while the lowest was found in Winter (−1.0–0.5%). The daily models showed a deviation of 15% in the Autumn and 57% in the Spring. This could be due to the combination of a low observation frequency (minimum in Autumn and Spring) and the difference between the behaviour of the atmosphere in these periods during the year used for the validation (2019) and those used for the construction of models (2015–2018). The relative difference between the estimated and measured UVER suggests that the general model for hourly values of UVER performs better than that for the daily values. The main reason for this is that the models for hourly values were built and tested using a larger and more representative dataset compared to the model for daily values.

3.5. Comparison with Other Sites

The General models developed for Santiago display a performance similar (Table 7) to that of models developed by [35] for Cyprus. The hourly and daily models presented slightly higher R2 (0.97 and 0.98) than the Cyprus models (0.95 and 0.96). Even though the model coefficients (a, b) differ, this behaviour is an indication that climate and environmental features combined affect the behaviour of UVER similarly in both places. Indeed, the climates of Santiago and Cyprus are quite similar, with rainy winters and dry summers, as well as variations in the ozone whose effect on UV irradiance at the surface is most pronounced at high latitudes rather than at middle latitudes [66]. The empirical models can be applied to obtain and assess the UVER exposure of populations in other areas with climates similar to that of Santiago de Chile.

4. Conclusions

This study is the first to address long-term in situ measurements of UVER in Santiago de Chile, Chile’s most populated city, to assess the risk of the population to suffering skin damage by using four erythema indices: UVI, SED, MEDs, and tery.
Based on the analysis performed here, which takes into consideration the effect of climate features—mainly sky conditions—on the seasonal variation of UVER in an urban area, it was concluded that the population is exposed to a high risk of developing sunburn and/or other sun-related skin damage in 46% of days with UVI ≤ 5. This occurs under cloudy conditions and before 11:00 LT during spring, summer, and fall, when the SEDs, MEDs, and tery indicate that UVER values are high enough to cause sunburn, even though the UVI indicates that it is safe.
When UVI levels are low, melano-protected individuals (skin types III and IV) can be exposed to the sun for a more prolonged exposure time (two or three hours, respectively). However, recent studies by [52,53] showed that even a UVI of less than 2 can cause damaging sunburns. Indeed, the present study indicates that cloudy skies minimize the UVER intensity at the surface, but cumulative doses exceed recommended levels. Therefore, as part of a broader and integrated strategy for sun protection in Santiago is commended to include, additionally to UVI, the erythemal indexes tery, SED and MEDs, regardless sky condition and season of the year.
For urban areas not covered by the Chilean solar network, hourly and daily values of UVER can be estimated by empirical models. The empirical models developed in this work, which estimate hourly and daily values of UVER in terms of IG by taking sky conditions into consideration, display a very good performance for the climate conditions of Santiago de Chile. Thus, these models can be used as part of a strategy to extend the analysis carried out in Santiago for other sites or years depending on the availability of IG observations, as long as the climate is similar. In this sense, the expansion of hourly and daily UVER values to other sites would be beneficial for improving the understanding of solar climatology, photobiology, biophysical studies, and material degradation, as well as in other scientific fields, such as water treatment in solar disinfection, areas where Chile is most in need.

Author Contributions

Conceptualization, L.G.-R. and L.R.-L.; methodology, L.G.-R., L.R.-L., J.R. and A.P.d.O.; formal analysis, L.G.-R., L.R.-L., A.C.B., D.C. and A.P.d.O.; investigation, L.G.-R., A.C.B. and L.R.-L.; resources, L.G.-R.; data curation, L.G.-R. and J.R.; software, L.G.-R.; validation, L.G.-R., L.R.-L., J.R. and A.P.d.O.; writing—original draft preparation, L.G.-R., A.C.B., D.C.; writing—review and editing, L.G.-R., L.R.-L. and A.P.d.O.; supervision, A.P.d.O.; funding acquisition, L.G.-R. All authors have read and agreed to the published version of the manuscript.

Funding

This research was funded by “Agencia Nacional de Investigación y Desarrollo de Chile”. (ANID) grant number [21170226] And the APC was funded by ANID.

Institutional Review Board Statement

Not applicable.

Informed Consent Statement

Not applicable.

Data Availability Statement

Derived data supporting the findings of this study are available from the corresponding author on request.

Acknowledgments

The authors thank Ernesto Gramsch for the effort to keep the UV radiation monitoring site online. L.G.-R. wishes to thank the Chilean National Development and Innovation Agency (ANID), Chile for the Ph. D. Grants (21170226), the faculty and staff members of the University of Concepcion, Micrometeorology Laboratory of IAG-USP, and Yailen García and Iongel Durán, who helped with the development of this project. The second author acknowledges the scholarship provided by CNPq (Grant number 304786/2018-7).

Conflicts of Interest

The authors declare no conflict of interest.

References

  1. Diffey, B.L. Solar ultraviolet radiation effects on biological systems. Phys. Med. Biol. 1991, 36, 299–328. [Google Scholar] [CrossRef]
  2. Andrady, A.; Hamid, S.; Hu, X.; Torikai, A. Effects of increased solar ultraviolet radiation on materials. J. Photochem. Photobiol. B Biol. 1998, 46, 96–103. [Google Scholar] [CrossRef]
  3. Caldwell, M.M.; Björn, L.; Bornman, J.F.; Flint, S.; Kulandaivelu, G.; Teramura, A.; Tevini, M. Effects of increased solar ultraviolet radiation on terrestrial ecosystems. J. Photochem. Photobiol. B Biol. 1998, 46, 40–52. [Google Scholar] [CrossRef]
  4. Ichihashi, M.; Ueda, M.; Budiyanto, A.; Bito, T.; Oka, M.; Fukunaga, M.; Tsuru, K.; Horikawa, T. UV-induced skin damage. Toxicology 2003, 189, 21–39. [Google Scholar] [CrossRef]
  5. Lucas, R.; McMichael, T.; Smith, W.; Armstrong, B. Solar Ultraviolet Radiation: Global Burden of Disease from Solar Ultraviolet Radiation; Annette Prüss-Üstün, H.Z., Colin Mathers, M.R., Eds.; World Health Organization: Geneva, Switzerland, 2006; Volume 55, ISBN 924 159440 3. [Google Scholar]
  6. Häder, D.-P.; Kumar, H.D.; Smith, R.C.; Worrest, R.C. Effects of solar UV radiation on aquatic ecosystems and interactions with climate change. Photochem. Photobiol. Sci. 2007, 6, 267–285. [Google Scholar] [CrossRef]
  7. Orient, J.M. Radiation and Human Health. JAMA 1982, 248, 1179–1180. [Google Scholar] [CrossRef]
  8. Häder, D.-P.; Williamson, C.E.; Wängberg, S.-Å.; Rautio, M.; Rose, K.C.; Gao, K.; Helbling, E.W.; Sinha, R.P.; Worrest, R. Effects of UV radiation on aquatic ecosystems and interactions with other environmental factors. Photochem. Photobiol. Sci. 2014, 14, 108–126. [Google Scholar] [CrossRef] [Green Version]
  9. Rivas, M.; Rojas, E.E.; Méndez, C.J.; Contreras, A.G. Dosis Eritémicas, Sobrexposición a la Radiación Solar Ultravioleta y Su Relación Con el Cáncer de Piel en Arica, Chile. Interciencia 2014, 39, 506–510. [Google Scholar]
  10. Correa, M.D.P.; Godin-Beekmann, S.; Haeffelin, M.; Bekki, S.; Saiag, P.; Badosa, J.; Jégou, F.; Pazmiño, A.; Mahé, E. Projected changes in clear-sky erythemal and vitamin D effective UV doses for Europe over the period 2006 to 2100. Photochem. Photobiol. Sci. 2013, 12, 1053. [Google Scholar] [CrossRef]
  11. Rivas, M.; Rojas, E.; Araya, M.C.; Calaf, G.M. Ultraviolet light exposure, skin cancer risk and vitamin D production. Oncol. Lett. 2015, 10, 2259–2264. [Google Scholar] [CrossRef] [Green Version]
  12. Correa, M.D.P.; Yamamoto, A.L.C.; Moraes, G.R.; Godin-Beekmann, S.; Mahé, E. Changes in the total ozone content over the period 2006 to 2100 and the effects on the erythemal and vitamin D effective UV doses for South America and Antarctica. Photochem. Photobiol. Sci. 2019, 18, 2931–2941. [Google Scholar] [CrossRef] [PubMed]
  13. Delcourt, C.; Boniol, M.; Carrière, I.; Delyfer, M.; Rougier, M.-B.; Le Goff, M.; Dartigues, J.-F.; Barberger-Gateau, P.; Korobelnik, J.-F.; Cougnard-Grégroire, A.; et al. Lifetime Exposure to Ambient Ultraviolet Radiation and the Risk for Cataract Extraction and Age-Related Macular Degeneration: The Alienor Study. Investig. Opthalmol. Vis. Sci. 2014, 55, 7619–7627. [Google Scholar] [CrossRef] [Green Version]
  14. Narayanan, D.L.; Saladi, R.N.; Fox, J.L. Review: Ultraviolet radiation and skin cancer. Int. J. Dermatol. 2010, 49, 978–986. [Google Scholar] [CrossRef] [PubMed]
  15. Rivas, M.; Rojas, E.; Calaf, G.M. Skin cancer risk affected by ultraviolet solar irradiance in Arica, Chile. Oncol. Lett. 2014, 7, 483–486. [Google Scholar] [CrossRef] [PubMed] [Green Version]
  16. McKinlay, A.F.; Diffey, B.L. A Reference Action Spectrum for Ultraviolet Induced Erythema in Human Skin. CIE J. 1987, 6, 17–22. [Google Scholar]
  17. Solano, F. Photoprotection and Skin Pigmentation: Melanin-Related Molecules and Some Other New Agents Obtained from Natural Sources. Molecules 2020, 25, 1537. [Google Scholar] [CrossRef] [Green Version]
  18. Brenner, M.; Hearing, V.J. The Protective Role of Melanin Against UV Damage in Human Skin. Photochem. Photobiol. 2007, 84, 539–549. [Google Scholar] [CrossRef] [Green Version]
  19. Fitzpatrick, T.B. The Validity and Practicality of Sun-Reactive Skin Types I Through VI. Arch. Dermatol. 1988, 124, 869–871. [Google Scholar] [CrossRef]
  20. World Health Organization; World Meteorological Organization. United Nations Environment Programm; International Commission on Non-Ionizing Radiation Protectio. Global Solar UV Index: A practical Guide. 2002, Volume 32. Available online: https://apps.who.int/iris/handle/10665/42459 (accessed on 1 March 2020).
  21. Utrillas, M.; Marín, M.J.; Esteve, A.; Salazar, G.; Suarez, H.; Castillo, J.; Martínez-Lozano, J. UVER and UV index at high altitude in Northwestern Argentina. J. Photochem. Photobiol. B Biol. 2016, 163, 290–295. [Google Scholar] [CrossRef]
  22. Sabatini-Ugarte, N.; Molgó, M.; Vial, G. Melanoma en Chile ¿Cuál es nuestra realidad? Rev. Med. Clin. Condes 2018, 29, 468–476. [Google Scholar] [CrossRef]
  23. Calaf, G.M.; Rivas, M.; Araya, M.C.; Caba, F.; Rojas, E. Ultraviolet light exposure influences skin cancer in association with latitude. Oncol. Rep. 2011, 25, 1153–1159. [Google Scholar] [CrossRef] [PubMed]
  24. Rivas, M.; Rojas, E.; Calaf, G.M.; Barberán, M.; Liberman, C.; Correa, M.D.P. Association between non-melanoma and melanoma skin cancer rates, vitamin D and latitude. Oncol. Lett. 2017, 13, 3787–3792. [Google Scholar] [CrossRef] [PubMed]
  25. Rivas, M.; Calaf, G.M.; Laroze, D.; Rojas, E.; Mendez, J.; Honeyman, J.; Araya, M.C. Solar ultraviolet A radiation and nonmelanoma skin cancer in Arica, Chile. J. Photochem. Photobiol. B Biol. 2020, 212, 112047. [Google Scholar] [CrossRef] [PubMed]
  26. Ministerio de Energía “Solar explorer”. Available online: http://solar.minenergia.cl/espectros (accessed on 1 January 2020).
  27. Dirección Metorológica de Chile, DMC. Available online: https://climatologia.meteochile.gob.cl/ (accessed on 1 January 2020).
  28. Universidad de Santiago de Chile, USACH. Available online: http://ambiente.usach.cl/uv/index.html (accessed on 1 January 2020).
  29. Zemelman, V.; Beck, V.; Petra, A.; Orlando, A.; Valenzuela, C.Y. Dimorfismo sexual en la pigmentación de la piel, color de ojos y pelo y presencia de pecas en adolescentes chilenos en dos estratos socioeconómicos. Rev. Med. Chile 2002, 130, 879–884. [Google Scholar] [CrossRef] [PubMed]
  30. Escobedo, J.F.; Gomes, E.N.; Oliveira, A.P.; Soares, J. Modeling hourly and daily fractions of UV, PAR and NIR to global solar radiation under various sky conditions at Botucatu, Brazil. Appl. Energy 2009, 86, 299–309. [Google Scholar] [CrossRef]
  31. Escobedo, J.F.; Gomes, E.N.; Oliveira, A.P.; Soares, J. Ratios of UV, PAR and NIR components to global solar radiation measured at Botucatu site in Brazil. Renew. Energy 2011, 36, 169–178. [Google Scholar] [CrossRef]
  32. Tereszchuk, K.A.; Rochon, Y.J.; McLinden, C.A.; Vaillancourt, P.A. Optimizing UV Index determination from broadband irradiances. Geosci. Model Dev. 2018, 11, 1093–1113. [Google Scholar] [CrossRef] [Green Version]
  33. Robaa, S.M. On the estimation of UV-B radiation over Egypt. Idojaras 2008, 112, 45–60. [Google Scholar]
  34. Kudish, A.; Evseev, E. Statistical relationships between solar UVB and UVA radiation and global radiation measurements at two sites in Israel. Int. J. Clim. 2000, 20, 759–770. [Google Scholar] [CrossRef]
  35. Kalogirou, S.; Pashiardis, S.; Pashiardi, A. Statistical analysis and inter-comparison of erythemal solar radiation for Athalassa and Larnaca, Cyprus. Renew. Energy 2017, 111, 580–597. [Google Scholar] [CrossRef]
  36. Utrillas, M.P.; Marín, M.J.; Esteve, A.R.; Salazar, G.A.; Suárez, H.; Gandía, S.; Lozano, J.A.M. Relationship between erythemal UV and broadband solar irradiation at high altitude in Northwestern Argentina. Energy 2018, 162, 136–147. [Google Scholar] [CrossRef]
  37. González-Rodríguez, L.; Rosas, J.; de Oliveira, A.P.; Rodríguez, L.; Contreras, D.; Baeza, C. Modeling of hourly and daily values of erythemal ultraviolet radiation in Santiago de Chile City. In Proceedings of the ISES Solar World Congress 2019 and IEA SHC International Conference on Solar Heating and Cooling for Buildings and Industry 2019, Santiago, Chile, 4–7 November 2019; pp. 2213–2222. [Google Scholar]
  38. Instituto Nacional de Estadísticas, INE. Available online: http://www.ine.cl (accessed on 15 January 2020).
  39. Gramsch, E.; Reyes, F.; Vásquez, Y.; Oyola, P.; Rubio, M.A. Prevalence of Freshly Generated Particles during Pollution Episodes in Santiago de Chile. Aerosol Air Qual. Res. 2016, 16, 2172–2185. [Google Scholar] [CrossRef] [Green Version]
  40. Rappenglück, B.; Oyola, P.; Olaeta, I.; Fabian, P. The Evolution of Photochemical Smog in the Metropolitan Area of Santiago de Chile. J. Appl. Meteorol. 2000, 39, 275–290. [Google Scholar] [CrossRef]
  41. Falvey, M.; Garreaud, R.D. Wintertime Precipitation Episodes in Central Chile: Associated Meteorological Conditions and Orographic Influences. J. Hydrometeorol. 2007, 8, 171–193. [Google Scholar] [CrossRef]
  42. Ministerio de Bienes Nacionales IDE Chile. infraestructura de datos Geoespaciales. Available online: http://www.ide.cl/ (accessed on 29 February 2020).
  43. Liu, B.Y.; Jordan, R.C. The interrelationship and characteristic distribution of direct, diffuse and total solar radiation. Sol. Energy 1960, 4, 1–19. [Google Scholar] [CrossRef]
  44. Reda, I.; Andreas, A. Solar position algorithm for solar radiation applications. Sol. Energy 2004, 76, 577–589. [Google Scholar] [CrossRef]
  45. Iqbal, M. An Introduction to Solar Radiation; Academic Press: Cambridge, MA, USA, 1983. [Google Scholar]
  46. Udo, S. Sky conditions at Ilorin as characterized by clearness index and relative sunshine. Sol. Energy 2000, 69, 45–53. [Google Scholar] [CrossRef]
  47. CIE; WMO. Rationalizing Nomenclature for UV Doses and Effects on Humans; CIE: Vienna, Austria, 2014; Available online: http://cie.co.at/publications/rationalizing-nomenclature-uv-doses-and-effects-humans (accessed on 2 March 2020).
  48. Fioletov, V.E.; Kerr, J.B.; Fergusson, A. The UV Index: Definition, Distribution and Factors Affecting It. Can. J. Public Health 2010, 101, I5–I9. [Google Scholar] [CrossRef]
  49. Zemelman, V.; Alvarado, C.; Valenzuela, V.B.P. Assessment of skin type, eye and hair color, freckles tendency in Chilean adolescents. J. Eur. Acad. Dermatol. Venereol. 1990, 12, 321. [Google Scholar]
  50. Furlan, C.; De Oliveira, A.P.; Soares, J.; Codato, G.; Escobedo, J.F. The role of clouds in improving the regression model for hourly values of diffuse solar radiation. Appl. Energy 2012, 92, 240–254. [Google Scholar] [CrossRef]
  51. Sharma, B.K. Environmental Chemistry; Publisher Krishna Prakashan Media: Delhi, India, 2014; ISBN 8182831199. [Google Scholar]
  52. Cordero, R.; Seckmeyer, G.; Damiani, A.; Jorquera, J.; Carrasco, J.F.; Muñoz, R.C.; Da Silva, L.; Labbé, F.; Laroze, D. Aerosol effects on the UV irradiance in Santiago de Chile. Atmospheric Res. 2014, 149, 282–291. [Google Scholar] [CrossRef]
  53. Silva, S.C.; Ipiña, A.; Damiani, A.; Cordero, R.R.; Piacentini, R.D. UV index values and trends in Santiago, Chile (33.5°S) based on ground and satellite data. J. Photochem. Photobiol. B Biol. 2012, 115, 73–84. [Google Scholar]
  54. Damiani, A.; Cabrera, S.; Muñoz, R.C.; Cordero, R.; Labbé, F. Satellite-derived UV irradiance for a region with complex morphology and meteorology: Comparison against ground measurements in Santiago de Chile. Int. J. Remote. Sens. 2013, 34, 5812–5833. [Google Scholar] [CrossRef]
  55. Rivas, M.; Rojas, E.; Cortés, J.; Santander, E. Efecto de la altura en la radiación solar ultravioleta en Arica norte de Chile. Revista Facultad de Ingeniería-Universidad de Tarapacá 2002, 10, 59–62. [Google Scholar]
  56. McKenzie, R.; Liley, B.; Björn, L.O. UV Radiation: Balancing Risks and Benefits. Photochem. Photobiol. 2009, 85, 88–98. [Google Scholar] [CrossRef] [PubMed]
  57. McKenzie, R.; Lucas, R.M. Reassessing Impacts of Extended Daily Exposure to Low Level Solar UV Radiation. Sci. Rep. 2018, 8, 1–5. [Google Scholar] [CrossRef] [PubMed]
  58. Lehmann, M.; Pfahlberg, A.B.; Sandmann, H.; Uter, W.; Gefeller, O. Public Health Messages Associated with Low UV Index Values Need Reconsideration. Int. J. Environ. Res. Public Health 2019, 16, 2067. [Google Scholar] [CrossRef] [Green Version]
  59. Ou-Yang, H.; Jiang, L.I.; Meyer, K.; Wang, S.Q.; Farberg, A.S.; Rigel, D.S. Sun Protection by Beach Umbrella vs Sunscreen With a High Sun Protection Factor: A Randomized Clinical Trial. JAMA Dermatol. 2017, 153, 304–308. [Google Scholar] [CrossRef]
  60. Vimercati, L.; De Maria, L.; Caputi, A.; Cannone, E.S.S.; Mansi, F.; Cavone, D.; Romita, P.; Argenziano, G.; Di Stefani, A.; Parodi, A.; et al. Non-Melanoma Skin Cancer in Outdoor Workers: A Study on Actinic Keratosis in Italian Navy Personnel. Int. J. Environ. Res. Public Health 2020, 17, 2321. [Google Scholar] [CrossRef] [Green Version]
  61. Cañada, J.; Pedros, G.; Bosca, J. Relationships between UV (0.290–0.385 μm) and broad band solar radiation hourly values in Valencia and Córdoba, Spain. Energy 2003, 28, 199–217. [Google Scholar] [CrossRef]
  62. Gandia, S.; Utrillas, M.P.; Gómez-Amo, J.L.; Esteve, A.R.; Estellés, V.; Pedrós, R.; Nuñez, J.A.; Lozano, J.A.M. Relationship between UVB and broadband solar radiation in Spain. Int. J. Clim. 2014, 35, 1761–1771. [Google Scholar] [CrossRef]
  63. Adam, M.E.-N. Determination of daily total ultraviolet-B in a subtropical region (Upper Egypt): An empirical approach. Atmos. Res. 2015, 153, 1–9. [Google Scholar] [CrossRef]
  64. Jacovides, C.; Tymvios, F.; Asimakopoulos, D.; Kaltsounides, N.; Theoharatos, G.; Tsitouri, M. Solar global UVB (280–315nm) and UVA (315–380 nm) radiant fluxes and their relationships with broadband global radiant flux at an eastern Mediterranean site. Agric. For. Meteorol. 2009, 149, 1188–1200. [Google Scholar] [CrossRef]
  65. Foyo-Moreno, I.; Alados, I.; Alados-Arboledas, L. Adaptation of an empirical model for erythemal ultraviolet irradiance. Ann. Geophys. 2007, 25, 1499–1508. [Google Scholar] [CrossRef]
  66. U.N.E.P. Environmental Effects and Interactions of Stratospheric Ozone Depletion, UV Radiation, and Climate Change. 2018. Available online: https://ozone.unep.org/science/assessment/eeap (accessed on 8 August 2020).
Figure 1. Geographic position of Chile in South-American (a) and topography of the city of Santiago de Chile (b). The elevation and distribution of municipalities in (b,c) were created using an ArcGIS analysis of a shapefile. The shapefiles of the metropolitan region and profile elevation were obtained from IDE [42].
Energies 14 00368 g001
Figure 2. Seasonal distribution of monthly average daily values of UVER for all-sky, clear, partially clear, partially cloudy, and cloudy conditions observed during 2015–2019 in Santiago.
Energies 14 00368 g002
Figure 3. Contour plot of the monthly average hourly values of UVER for (a) all-sky, (b) clear, (c) partially clear, (d) partially cloudy, and (e) cloudy conditions observed during 2015–2019 in Santiago.
Energies 14 00368 g003
Figure 4. Contour plot of monthly average hourly values of the UV index (UVI) in Santiago for (a) all-sky, (b) clear, and (c) partially clear conditions, as well as (d) sunburn times in minutes for skin types III and IV, calculated during 2015–2019. The red dashed line in (d) represents tery = 10 min. The colour scales (Violet ≥ 10; 8 ≤ red < 10, 6 < orange ≤ 7; 3 < yellow ≤ 5; green ≤ 2) in (a)–(c) correspond to the World Health Organisation (WHO) colour pattern [20].
Energies 14 00368 g004
Figure 5. Accumulated hourly values of (a) UVER, (b) standard erythemal dose (SED), (c) minimum erythemal dose (MED) III, and (d) MED IV between 8:00 and 17:00 local time (LT) for all-sky, clear, partially clear, partially cloudy, and cloudy conditions observed in Santiago from 2015 to 2019.
Energies 14 00368 g005
Figure 6. Dispersion diagrams of UVER versus global irradiance (IG) as a function of seasons and sky conditions for (a,b) hourly and (c,d) daily values observed in Santiago from 2015 to 2018. Second-degree polynomials obtained from least-squares fitting are indicated by dashed and continuous lines. The triangle denotes the summer, the diamond is autumn, the star represents winter, and the circle is the spring season.
Energies 14 00368 g006
Figure 7. Comparison of the UVER estimated and measured for (left) hourly and (right) daily data in Santiago using the following models: General (a,b), Summer + Partially clear (c,d), and Spring + Partially clear (e,f). The dashed grey line indicates the 1:1 line. Red lines indicate the fitting using the least-squares regression method.
Energies 14 00368 g007
Table 1. Dataset description.
MeasurementYearTotal
20152016201720182019
Hourly2593302226312533246113,011
Daily3333463393282281574
Freq. Obs. (%) #91.294.592.989.962.586.2
# Daily distribution.
Table 2. Monthly average daily values (standard error) of ultraviolet erythemal radiation (UVER)and related variables under all-sky conditions from 2015 to 2019 for Santiago.
MonthUVER
(kJm−2)
KTUVERIG
(MJm−2)
KTCC A (%)TOC (DU)Day Length
(h)
IGTOA
(MJ m−2)
J5.56 ± 0.090.0204 ± 0.000325.30 ± 0.400.628 ± 0.00952.4 ± 1.2272.9 ± 0.813.724± 0.01242.46 ± 0.05
F5.07 ± 0.080.0201 ± 0.000323.93 ± 0.250.629 ± 0.00651.0 ± 1.2268.1 ± 0.913.055± 0.01939.08 ± 0.11
M3.48 ± 0.070.0162 ± 0.000319.69 ± 0.320.613 ± 0.00952.6 ± 1.2266.1 ± 1.112.159 ±0.02333.29 ± 0.11
A1.86 ± 0.070.0114 ± 0.000412.95 ± 0.400.515 ± 0.01662.4 ± 1.6264.8 ± 1.511.220± 0.02126.38 ± 0.16
M0.82 ± 0.030.0065 ± 0.00027.88 ± 0.250.410 ± 0.01473.0 ± 1.4271.4 ± 1.810.455± 0.01420.81 ± 0.10
J0.52 ± 0.020.0049 ± 0.00027.05 ± 0.220.424 ± 0.01478.4 ± 1.2281.9 ± 2.110.078± 0.00318.25 ± 0.02
J0.56 ± 0.020.0049 ± 0.00027.02 ± 0.220.411 ± 0.01477.5 ± 1.1286.8 ± 2.110.240± 0.01019.28 ± 0.07
A0.96 ± 0.040.0065 ± 0.00029.34 ± 0.290.420 ± 0.01477.3 ± 1.2293.8 ± 1.910.877± 0.01923.62 ± 0.13
S1.90 ± 0.070.0099 ± 0.000312.79 ± 0.400.434 ± 0.01677.2 ± 0.9310.7 ± 1.811.756± 0.02229.82 ± 0.15
O2.98 ± 0.090.0130 ± 0.000416.18 ± 0.490.462 ± 0.01673.4 ± 1.2309.2 ± 1.512.695± 0.02236.02 ± 0.13
N4.90 ± 0.090.0184 ± 0.000324.00 ± 0.480.601 ± 0.01465.1 ± 1.3298.4 ± 1.613.503± 0.01540.63 ± 0.08
D5.59 ± 0.090.0202 ± 0.000325.80 ± 0.360.619 ± 0.01057.7 ± 1.2281.0 ± 1.113.914± 0.00442.89 ± 0.02
mean2.84 ± 0.210.0127 ± 0.000115.99 ± 1.120.514 ± 0.03865.9 ± 3.3283.6 ± 4.811.973 ±0.40531.04 ± 2.67
A 1983–2015.
Table 3. Model coefficients (a, b) for hourly and daily values of UVER for Santiago considering observations carried out from 2015 to 2018.
ModelsHourlyDaily
a (10−7) W−1m2b (10−5)Number of Hoursa (10−3) MJ−1m2b (10−2)Number of Days
Season
Summer2.82.13860−1.024344
Autumn2.81.223075.56338
Winter1.92.915473.05322
Spring2.16.030652.513342
Sky condition
Cloudy7.4−0.7202314.03.9231
Partially cloudy5.1−6.3251310.80.3417
Partially clear3.8−4.818808.40.1386
Clear3.0−2.343635.26.9312
Interactions (Season + Sky condition)
Summer + Cloudy8.1−2.8473---
Summer + Partially cloudy5.0−6.2707−1.42537
Summer + Partially clear3.7−3.95960.519101
Summer + Clear3.2−1.22084−2.528200
Autumn + Cloudy6.4−0.93827.1860
Autumn + Partially cloudy4.5−4.15036.3693
Autumn + Partially clear3.7−4.14448.8−1.5135
Autumn + Clear3.1−0.69788.3753
Winter + Cloudy2.84.14386.55.5101
Winter + Partially cloudy3.2−0.55369.00.1165
Winter + Partially clear3.2−4.23545.01.958
Winter + Clear2.4−3.7219---
Spring + Cloudy8.1−0.27303.31469
Spring + Partially cloudy5.1−6.27677.47.4114
Spring + Partially clear2.90.54869.4−1.577
Spring + Clear3.2−3.710828.1−0.883
General
All sky conditions2.5−2.010,7795.271346
Table 4. Statistical parameters of the models for hourly values of UVER in Santiago, Chile using observations carried out in 2019.
ModelsMBE (Wm−2)RMSE (Wm−2)NRMSE (%)IAMAPE (%)Number of Hours
Season
Summer0.0010.02415.80.9814.07622
Autumn0.0000.01430.10.9830.39379
Winter0.0060.01155.80.9236.51787
Spring0.0160.03036.70.9559.60
Sky conditions694
Clear0.0010.02514.10.9613.67457
Partially clear0.0080.02117.60.9713.48443
Partially cloudy0.0020.01934.60.9524.83631
Cloudy0.0020.01074.60.9441.86
Interactions (Season + Sky conditions)951
Summer + Clear0.0180.02313.20.9715.78320
Summer + Partially clear0.0020.02514.60.9212.82110
Summer + Partially cloudy0.0060.02326.90.9118.99131
Summer + Cloudy0.0010.01663.20.9149.4672
Autumn + Clear0.0160.02221.50.9334.8371
Autumn + Partially clear−0.0010.01317.40.9814.4685
Autumn + Partially cloudy−0.0020.01437.20.9526.9179
Autumn + Cloudy−0.0010.00880.10.9042.61144
Winter + Clear------
Winter + Partially clear−0.0150.01831.50.7224.4692
Winter + Partially cloudy−0.0070.01235.60.8925.51228
Winter + Cloudy−0.0020.00679.30.8638.14456
Spring + Clear−0.0410.04625.70.8322.90118
Spring + Partially clear−0.0170.02923.30.9215.29156
Spring + Partially cloudy−0.0100.02235.00.9426.20152
Spring + Cloudy−0.0020.01152.60.9640.84
General259
All sky conditions−0.0210.03242.90.9541.182482
Table 5. Same as Table 4, but for daily values.
ConditionsMBE (kJm−2)RMSE (kJm−2)NRMSE
(%)
IAMAPE (%)Number of Days
Season
Summer0.3600.65113.20.8914.0673
Autumn−0.0160.18510.90.9916.8327
Winter−0.0990.21017.20.9221.7265
Spring−0.4230.73822.70.9317.3163
Sky condition
Clear0.0971.02417.70.2013.158
Partially clear0.0950.58612.80.9410.5795
Partially cloudy−0.0310.43223.40.9718.8576
Cloudy−0.0150.33437.40.9223.2149
Interactions (Season + Sky condition)
Summer + Clear−0.4230.5489.70.148.657
Summer + Partially clear−0.0600.50510.00.738.4857
Summer + Partially cloudy−0.5210.96924.40.7937.237
Summer + Cloudy-----2
Autumn + Clear------
Autumn + Partially clear−0.1000.2728.60.967.4410
Autumn + Partially cloudy−0.1460.20919.60.9318.569
Autumn + Cloudy0.0100.11018.40.9114.238
Winter + Clear------
Winter + Partially clear------
Winter + Partially cloudy0.2530.33032.20.7726.2140
Winter + Cloudy0.1190.16431.30.8123.2825
Spring + Clear-----1
Spring + Partially clear0.3320.49812.20.9711.6828
Spring + Partially cloudy−0.0410.46514.90.9415.4620
Spring + Cloudy0.2820.43928.20.8822.4214
General
All sky conditions−0.1360.53918.50.9816.74228
Table 6. Season average of the relative difference between observed ( O i ) and modelled (Pi) values.
Season
1 N 1 N O i P i O i × 100 %
HourlyDaily
Summer−2.81.2
Autumn−1.114.7
Winter−1.00.5
Spring−3.1−56.8
Annual−2.0−13.6
N is the number of observed and modelled values in each season.
Table 7. Regression equation, coefficients, and R2 for annual empirical models of hourly and daily values. Observations were carried out in Santiago during 2015–2018.
SiteLatitude, LongitudeLand UseAltitude
(m asl)
ModelCoefficientsR2
ab
Santiago, Chile33°30′ S, 70°42′ Wurban520Hourly2.5 × 10−7−2.0 × 10−50.97
Daily5.2 × 10−37.0 × 10−20.98
Larnaca, Cyprus #34°87′ N, 33°63′ Erural1Hourly1.0 × 10−717.0 × 10−50.96
Daily2.6 × 10−35.9 × 10−20.96
Athalasa, Cyprus #35°15′ N, 33°40′ Esemi-rural165Hourly0.1 × 10−71.6 × 10−50.95
Daily3.6 × 10−38.3 × 10−20.96
# Ref. [32]; a (10−7) in W−1m2; b (10−3) in MJ−1m2.
Publisher’s Note: MDPI stays neutral with regard to jurisdictional claims in published maps and institutional affiliations.

