Abstract
A sorption-enhanced water-gas shift (SEWGS) system providing CO2-free synthesis gas (CO + H2) for jet fuel production from pure CO was studied. The water-gas shift (WGS) reaction was catalyzed by a commercial Cu/ZnO/Al2O3 catalyst and carried out with in-situ CO2 removal on a 20 wt% potassium-promoted hydrotalcite-derived sorbent. Catalyst activity was investigated in a fixed bed tubular reactor. Different sorbent materials and treatments were characterized by CO2 chemisorption among other analysis methods to choose a suitable sorbent. Cyclic breakthrough tests in an isothermal packed bed microchannel reactor (PBMR) were performed at significantly lower modified residence times than those reported in literature. A parameter study gave an insight into the effect of pressure, adsorption feed composition, desorption conditions, as well as reactor configuration on breakthrough delay and adsorbed amount of CO2. Special attention was paid to the steam content. The significance of water during adsorption as well as desorption confirmed the existence of different adsorption sites. Various reactor packing concepts showed that the interaction of relatively fast reaction and relatively slow adsorption kinetics plays a key role in the SEWGS process design at low residence time conditions.
1. Introduction
The mitigation of anthropogenic climate change is a key challenge of today’s society. CO2 emissions contribute significantly to the atmospheric greenhouse effect and need to be reduced drastically to constrain global average temperature rise well below 2 °C [1]. The transport sector causes one quarter of Europe’s greenhouse gas emissions and relies significantly on fossil fuels [2]. Sustainable alternatives, such as mobility based on electrochemical storage or hydrogen from renewable sources, can be employed to defossilize the transport sector. However, not all means of transport, such as aviation, marine or long-haul truck transport can rely on those technologies due to volumetric and gravimetric restrictions. For such applications, CO2 neutral synthetic fuels produced via Power-to-Liquid (PtL) processes are promising [2].
The Kerogreen project aims to investigate an advanced PtL conversion route from water and captured CO2 to carbon neutral jet fuel powered by renewable energy sources [3]. In this project, the crucial step of CO2 activation is tackled by means of CO2 plasma splitting into CO and O2 [4,5]. To circumvent product recombination, O2 is separated by a solid oxide electrolyte cell. The remaining reaction mixture is fed into a pressure swing adsorption unit to remove unreacted CO2. The purified CO is then partly converted with steam to produce hydrogen via the water-gas shift reaction (WGS). After the removal of formed CO2, the synthesis gas (CO + H2) reacts in the subsequent Fischer-Tropsch (FT) reactor to hydrocarbons with a wide chain length distribution. The kerosene yield is increased in a hydrocracking unit, where hydrocarbons greater C14 are cracked down to the kerosene range [6,7].
In the WGS (Equation (1)) step, two main targets are pursued: First, providing synthesis gas with a H2/CO ratio of approximately 2 for the subsequent FT synthesis and, secondly, removing the byproduct CO2 in order to recycle it to the plasma unit. Both requirements can be realized in a single unit operation: a sorption-enhanced water-gas shift (SEWGS) system. Here, the heterogeneously catalyzed WGS reaction is carried out simultaneously with in-situ CO2 adsorption on a highly selective sorbent. This promising CO2 capture technology is proposed in the literature for high purity hydrogen production from synthesis gas of reformers [8,9]. Thermodynamic limitations are overcome by an equilibrium shift towards the product side resulting in near full CO conversion and, consequently, near fuel cell grade H2. However, in the Kerogreen process, near pure CO is fed to the process and CO2 removal, rather than full CO conversion, is envisaged.
From a thermodynamic point of view, the moderately exothermic WGS reaction favors low temperatures, whereas higher temperatures are desired for kinetic reasons at initial reaction conditions. Equilibrium conversion is not dependent on pressure and can be calculated based on the equilibrium constant reported by Moe (Equation (2), [10]).
Cu/ZnO/Al2O3 catalysts are commonly used for low temperature WGS (200 °C–300 °C) [11,12]. Pressure dependent side reactions, such as methanol synthesis, are not expected in a mild pressure range of up to 15 bar from thermodynamic calculations. Although the WGS reaction mechanism is not yet clearly revealed, an appropriate empirical rate expression proposed by Choi et al. (Equation (S1)) could be applied [13].
Various materials are suggested as CO2 sorbents, namely calcium oxide [14], magnesium oxide [15], lithium zirconate [16], lithium silicate [17], activated carbon [18], molecular sieves [19], zeolites [20] and metal organic frameworks [21]. The use of these materials in this SEWGS study is discarded due to, for example, low thermal stability, low CO2 sorption capacity at WGS conditions, poor performance in the presence of water, high temperatures required for regeneration or low cyclic working capacity.
Apart from these sorbents, layered double hydroxides, so-called hydrotalcite materials (HTCs), are identified as suitable CO2 sorbents under WGS conditions [22,23]. Their chemical composition can be described with Equation (3) [24]. HTCs change their structure during thermal treatment and reveal basic sites, which are required for CO2 adsorption in their mixed oxide form (hydrotalcite-derived compounds, HTdcs) [25]. Positively charged brucite-like layers are compensated with counter-anions (CO32−) and water in the interlayer region. HTdcs exhibit good cyclic, mechanical, and thermal stability, as well as relatively fast adsorption and desorption kinetics. They can be regenerated with low energy input [8,26]. Thanks to their low costs, nearly infinite selectivity for CO2 and acceptable adsorption capacity (typically lower than 1 mmol/g), HTdcs are preferred candidates for SEWGS [27]. Impregnation with alkali metal ions, usually potassium, enhances their sorption capacity [28,29].
In this work, the experimental results for a laboratory scale SEWGS reaction concept using a Cu/ZnO/Al2O3 catalyst and a potassium-impregnated HTC as sorbent are presented. Initially, the catalyst and sorbent characteristics are determined. Then, the combination of catalyst and sorbent in five reactor configurations with different packing concepts is tested in automated cyclic breakthrough experiments. A slit-like packed bed microchannel reactor (PBMR) first applied in methanation studies is used in the detailed SEWGS parameter study [30]. In this reactor, plug flow performance and good heat transfer characteristics are expected. Thus, temperature gradients observed at certain conditions in a tubular reactor for catalyst performance studies are absent. The influence of various adsorption parameters, namely pressure and feed composition, as well as the effect of desorption time and feed on the subsequent adsorption phase is shown. The importance of the steam content in the adsorption and the desorption phase is investigated in detail. Such detailed analysis is missing in the literature to design a full-scale system in the framework of the Kerogreen project. The parameter study is conducted at significantly lower modified residence times than those previously reported in the literature [31,32,33].
2. Materials and Methods
2.1. Materials
2.1.1. Catalyst and Sorbent Preparation
Commercial Cu/ZnO/Al2O3 pellets were used as the WGS catalyst. The pellets were crushed and sieved in order to obtain particles in the range of 100 μm to 300 μm. Catalyst reduction was carried out in-situ for the catalyst performance investigations and the SEWGS breakthrough measurements. The catalyst was reduced while heating up to 240 °C in 3% H2 flow (balanced in N2), then the flow was switched to pure H2 and the temperature further increased to 250 °C.
A commercially available HTC from Sasol GmbH (PURAL MG70, herein called MG70) with Al2O3:MgO = 30:70 was treated with different calcination and impregnation procedures to obtain hydrotalcite-derived mixed oxides as CO2 sorbents. MG70 powder was calcined ex-situ in N2 atmosphere for 10 h at 250 °C, 400 °C and 500 °C, respectively. Incipient wetness impregnation with potassium carbonate (K2CO3, ≥ 99%, Sigma-Aldrich) was applied to achieve a potassium loading of 20 wt% on MG70. This value was reported in the literature for reaching a maximum CO2 adsorption capacity [34,35,36]. Impregnated samples were either calcined before, after, or before and after impregnation. All HTdc samples listed in Table 1 were characterized by various methods (see Section 2.1.3). Sample MG70-K-400 revealed the most promising results, thus particles in the range of 100 μm to 300 μm of this material were used in the SEWGS breakthrough measurements.

Table 1.
Hydrotalcite-derived compounds (HTdcs) samples with optional calcination before and/or after impregnation.
2.1.2. Catalyst Performance Measurements
Catalyst activity tests were performed in a tubular stainless-steel reactor (TR, 8 mm inner diameter, 30 mm length). Nearly isothermal conditions (gradients ±2 K) could be achieved by a programmable tubular furnace and were controlled by an axially moveable K-type thermocouple in the sufficiently diluted catalyst bed. The catalyst loading was 1 g, the reaction pressure is 5 bar, and the steam-to-gas (S/G) ratio in the feed gas was kept constant at 1 (Equation (4)). The reaction tests were performed at temperatures between 225 °C and 300 °C. The modified residence times at reaction conditions were set between 1.3 × 10⁻⁵ g∙h/mL and 2.2 × 10⁻⁵ g∙h/mL (Equation (5)). Feed and product gas composition were analyzed in a gas chromatograph (GC, Agilent 7890) equipped with two columns (HP-Plot/Q and Molsieve 5Å) and two detectors (TCD and FID). Argon was used as carrier gas and N2 as internal standard. Carbon balances for all results reported in this work were within 3% of closure. Blank activity was evaluated before the experiments with inert filling. No byproduct formation was observed. The steady-state conversion was determined according to Equation (6).
2.1.3. Sorbent Characterization and Sorption Capacity Measurements
The crystalline structures of all HTdcs were studied by powder X-ray diffraction (XRD) in a D8 Advance (Bruker AXS) diffractometer with Cu Kα1,2 radiation (0.154060 nm and 0.154440 nm, respectively) operating in a 2θ range of 5–85° with a step width of 0.019° 2θ. The total counting time per step was 288 s. The raw data was evaluated with the software DIFFRAC.EVA Version 5.1 (zero shift correction and mineral phases identification).
The thermal decomposition of two samples (MG70 and MG70-K-400) was investigated by thermogravimetric analysis (TGA) in a STA 449 F3 Jupiter (Netzsch). The samples were heated with a heating rate of max. 10 K/min up to 1000 °C under N2 atmosphere.
Textural properties of three samples (MG70-400, MG70-K-400 and MG70-400-K-400) were determined by N2 physisorption at −196 °C in a 3Flex Surface Characterization instrument (Micromeritics). Adsorption and desorption isotherms were recorded after degassing the samples in vacuum (<1 mmHg) at 400 °C for 3 h. Surface area was calculated according to the BET method. Average pore width and total pore volume, corresponding to the cumulative pore volumes between 17 and 3000 Å, were determined from the adsorption branch using the BJH method.
Electron probe micro analysis (EPMA) was performed for various samples on a JXA 8530F (Jeol) coupled with energy dispersive spectroscopy (EDS) to investigate the sample composition at fixed probe positions and to compare the sample surface (SE and BSE images). Pressed powder (0.2 g, 30 kN for 30 s) tablets with a plane surface were used for EDS analysis.
CO2 chemisorption uptake measurements were also performed in the above mentioned 3Flex Surface Characterization instrument (Micromeritics). Samples were pretreated in situ at the respective calcination temperature in N2 flow for 3 h and outgassed in vacuum (<5 × 10⁻³ mmHg) at analysis temperature (250 °C) for 2 h. During the measurement, the samples (~0.5 g) were flushed stepwise with CO2 until equilibrium was reached. Pressure increments were 10 mmHg from 0 to 50 mmHg, 25 to 100 mmHg and 50 to 760 mmHg.
2.2. SEWGS Breakthrough Experiments
As the highest and most reproducible sorption capacity was obtained for MG70-K-400 (see Section 3.2), all SEWGS tests were conducted with this sorbent. CO2 breakthrough experiments were carried out in a two-slit packed PBMR in the experimental setup shown in Figure 1 [30]. Both reaction slits (2 × 5 × 10 mm3) were filled with catalyst and sorbent particles. Five programmable heating cartridges controlled by K-type thermocouples were placed along the bed ensure isothermal reaction conditions together with a microchannel air-cooling system. An additional thermocouple was placed inside the fixed bed. Constant and precise water dosage was enabled by a liquid flow controller (LFC, Brooks) and pulsation-free evaporation by an inhouse-manufactured micro nozzle. N2 and CO were fed with mass flow controllers (MFC, Brooks). The pressure in the system was adjusted by an automated regulating valve (Flowserve).
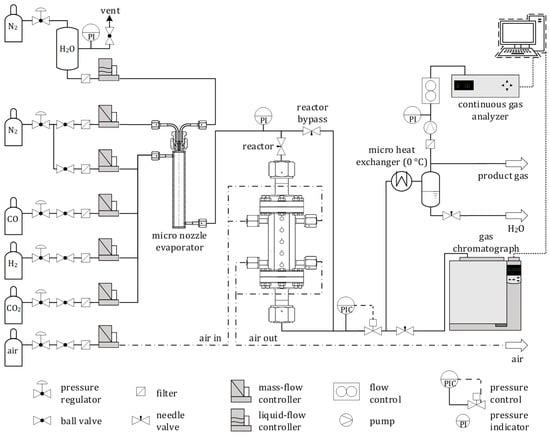
Figure 1.
Schematic drawing of experimental sorption-enhanced water-gas shift(SEWGS) setup.
The composition of the wet product gas was analyzed by a GC (see Section 2.1.2) to detect possible byproduct formation. The volume fractions of CO, CO2 and H2 in the dry effluent were continuously monitored in a process gas analyzer (PGA, X-STREAM Enhanced, Emerson).
CO and CO2 fractions were recorded by nondispersive infrared detectors (NDIR), and H2 by a TCD. Prior to the PGA, H2O was condensed in a micro heat exchanger with cooling liquid kept at about 0 °C.
Preliminary tests without catalyst (sorbent only) ensured that the sorbent was not catalytically active for the WGS reaction at 250 °C, as neither products nor byproducts of any kind were found in the effluent. The measurement systems, GC and PGA, operated within 1% of accuracy between each other. Therefore, comparability was confirmed and only PGA breakthrough curves were discussed in this work to monitor the time-resolved evolution of the gases in the SEWGS breakthrough experiments.
In all breakthrough experiments, at least five adsorption and reaction (herein only called adsorption) and desorption cycles were conducted. Prior to the first adsorption, a 90 min desorption step was carried out (40% H2O in N2, 1000 mL/min, 1 bar). After the last desorption step of an experiment, the bed was purged with N2 for 12 h overnight (1000 mL/min, 1 bar). This procedure was proven to deliver good regeneration of the sorbent in preliminary trials with pure HTdc in the fixed bed. In the adsorption experiments, adsorption temperature, total adsorption flow rate, and adsorption time as well as all desorption parameters were kept constant, whereas adsorption feed composition (balanced in N2) and adsorption pressure were varied. In the desorption experiments, desorption temperature, desorption pressure as well as all adsorption parameters were kept constant. The varied desorption parameters were time and H2O volume fraction (balanced in N2). An overview of all parameters is given in Table 2.
Table 2.
Adsorption and desorption parameters used in the SEWGS breakthrough experiments.
Five fixed bed configurations were investigated in this work (Figure 2). Mode A consisted of a homogeneous mixture of catalyst and sorbent with a total catalyst weight fraction of 0.05 in both slits of the PBMR (Equation (7)). In mode B, the fixed bed in both channels was divided into two almost equally long zones: half of the sorbent mass was mixed with the same total catalyst amount as in mode A in the first zone (corresponding zone weight fraction is 0.10), and the other half of the sorbent mass was loaded into the second zone. In mode C, the bed was also divided into two zones. The first zone contained one quarter of the total sorbent mass and the same total catalyst amount as used in mode A and B, yielding a zone weight fraction of 0.17. The second zone was loaded with the remaining sorbent. Experimental catalyst and sorbent mass are listed in Table 3. Variations in sorbent mass and the non-precise doubling of the weight fraction arose from changes in the bulk density of different sorbent batches and the stepwise manual filling process. In mode D and E, the total amount of catalyst was doubled to achieve a total catalyst weight fraction of 0.11. Zone distribution in mode D equaled mode B, where the second zone (half of the length) was filled with pure sorbent. Mode E consisted of four equally distributed zones which were alternately filled with mixed sorbent and catalyst and pure sorbent.
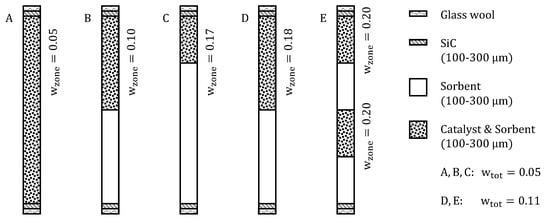
Figure 2.
Investigated SEWGS reactor configurations.
Table 3.
Experimental catalyst and sorbent mass for different reactor configurations.
The CO conversion was calculated from PGA data according to Equation (8), whereas the dry volume flow and the dry N2 volume fraction was obtained by Equations (9) and (10), respectively. CO2 breakthrough delay compared to H2 was evaluated with Equation (11). As H2 was not adsorbed, the H2 content in the effluent showed the residence time behavior in the setup from feed dosage until the PGA measurement. Due to measurement reasons, the H2 signal in the PGA was retarded and needed to be shifted in absolute time before determining the CO2 breakthrough delay. The amount of adsorbed CO2 until 0.2% CO2 was detected in the dry effluent was determined using Equation (12). Note that this value (herein called CO2 adsorbed) does not represent the full adsorption capacity of the sorbent. It rather refers to a sorption time limit for allowed CO2 breakthrough which is influenced by the sorption kinetics and was used as reference for internal comparison of the experiments. The value of 0.2% CO2 as reference point for both breakthrough delay and adsorbed amount of CO2 was chosen based on a first assumption of the tolerable amount of CO2 in the feed for the FT reactor in the Kerogreen process.
3. Results and Discussion
3.1. Catalyst Performance
Catalyst activity tests in the TR revealed that no byproducts, e.g., methane, were formed. The reaction was rather limited kinetically than thermodynamically within the studied parameter range, as CO conversion increased with temperature and approached equilibrium only at 300 °C (Figure 3a). Assuming complete CO2 removal, the reaction rate could be shifted from 0.21 mol/(g∙h) to 0.43 mol/(g∙h) at 60% CO conversion (and a temperature of 250 °C) according to the rate expression from Choi et al. (Equation (S1)) [13]. The temperature of 250 °C was chosen for the SEWGS experiments as Cu catalysts tend to sinter at temperatures above 300 °C. Figure 3b shows that CO conversion slightly increased with modified residence time but was still far away from thermodynamic equilibrium. This suggests that kinetic constraints prevailed under the given reaction conditions. Therefore, SEWGS experiments were carried out at modified residence times of about 2 × 10⁻⁵ g∙h/mL.
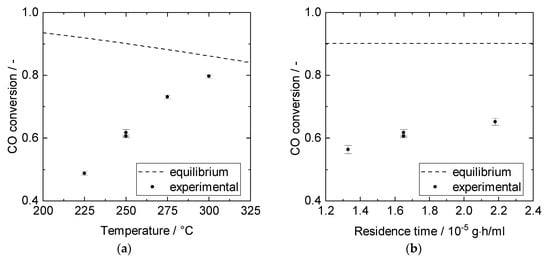
Figure 3.
Cu/ZnO/Al2O3 catalyst performance in experiments (1 g catalyst TR, 5 bar, 10% CO, S/G = 1). (a) CO conversion over temperature for modified residence time of 1.66 × 10⁻⁵ g∙h/mL. (b) CO conversion over modified residence time at 250 °C.
3.2. Structural Properties and CO2 Capture Performance of Sorbent
XRD patterns of all samples are depicted in Figure 4. Untreated MG70 showed the typical diffractogram of HTC compared to HTC reference from powder diffraction file (PDF) 35-0965. Sharp and intense peaks at ~11°, 23°, 35°, and 60° corresponding to the (003), (006), (012) and (110) planes indicated a well-formed crystalline layered structure with a rhombohedral symmetry. The patterns of the calcined samples revealed that the layered structure was destroyed after heat treatment (Figure 4a). For MG70-250, mainly weak and broad peaks corresponding to the amorphous phase were observed. MG70-400 and MG70-500 showed broad but more intensive and distinguishable reflections at ~43° and 62°, which represent the diffraction by the (200) and (220) planes of periclase (see MgO, PDF 65-0476). Aluminum compounds were assumed to be well-dispersed or formed an amorphous phase [37]. These results indicated that full transition from layered double hydroxide to layered double oxide was obtained through the applied calcination treatment at 400 °C and 500 °C, whereas calcination at SEWGS reaction temperature (250 °C) was not sufficient. According to literature, calcination at 400 °C leads to the best CO2 uptake properties [38,39]. In diffractograms of various impregnation—calcination procedures, typical K2CO3 reflections were identified in all impregnated samples (PDF 49-1093) (Figure 4b). Therefore, the applied impregnation treatment seemed to be applicable. The different impregnation—calcination procedures did not seem to influence the crystalline structure observed in the XRD patterns.
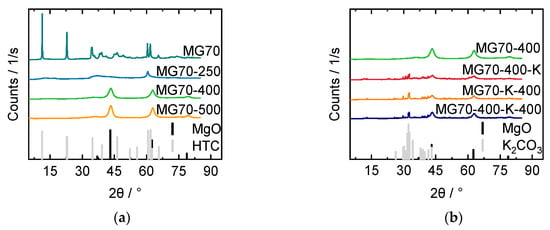
Figure 4.
X Ray diffraction (XRD) patterns for (a) samples with varied calcination temperatures (250, 400 and, 500 °C) compared with untreated sample (MG70) and (b) varied calcination—impregnation procedure: calcined—impregnated sample (MG70-400-K), impregnated—calcined sample (MG70-K-400), and calcined—impregnated—calcined sample (MG70-400-K-400) compared with nonimpregnated (but calcined) sample (MG70-400).
TGA was performed to study the thermal decomposition up to 1000 °C of untreated MG70 and of impregnated—calcined MG70-K-400. For MG70, a total mass loss of 43% was found. Three material changes could be observed (Figure 5a): removal of surface and interlayer water (80–120 °C), hydroxyl groups as water vapor (~200 °C), and further hydroxyl groups and carbonate anions (~400 °C). These expected findings are discussed in detail elsewhere [24,40,41]. The impregnated and calcined sample MG70-K-400 exhibited a marginal weight loss up to ~100 °C, which was mainly attributed to surface water adsorbed during storage. Reddy et al. suggested to perform in situ calcination to avoid this effect [38]. For SEWGS, in situ calcination at 400 °C prior operation and catalyst in situ reduction could be feasible, but it can be definitely excluded as a sorbent regeneration procedure. Such regeneration is not feasible due to the instability of the admixed Cu/ZnO/Al2O3 catalyst. As this catalyst is prone to oxidation, it would require re-reduction after that kind of sorbent regeneration. In this work, initial sorbent calcination was performed ex situ to avoid cross contamination between catalyst and sorbent. Water adsorption was minimized by keeping storage time after calcination as short as possible prior to the SEWGS experiments. Nonetheless, TGA as well as XRD results showed that the applied calcination treatment at 400 °C ensured the removal of all unwanted compounds and led to the desired mixed oxide structure.
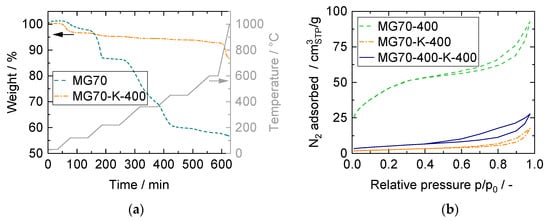
Figure 5.
(a) Thermogravimetric analysis (TGA) results. Sample weight and temperature over time for untreated sample (MG70) and impregnated—calcined sample (MG70-K-400). (b) N2 physisorption isotherms at −196 °C for calcined sample (MG70-400), impregnated—calcined sample (MG70-K-400), and calcined—impregnated—calcined sample (MG70-400-K-400).
The morphological characteristics of the samples calcined at 400 °C (as last step) were investigated by N2 physisorption at −196 °C. The adsorption and desorption isotherms (Figure 5b) corresponded to mesoporous solids with pore diameters between 2 nm and 50 nm (type IV, IUPAC [42]). Hysteresis loops did not exhibit any limiting adsorption at high relative pressure, which is typical for type H3 hysteresis loops [42]. Such curve shape gives rise to the assumption of open large pores corresponding to aggregates of platelike particles that form slit-shaped pores [25,27]. The impregnated samples exhibited a more pronounced difference between adsorption and desorption branch, possibly due to enlarged pore networks caused by pore blocking during impregnation. Textural properties were within the range of values reported in literature and are summarized in Table S1 [25,41,43,44]. The specific surface area decreased significantly, as expected, due to potassium impregnation. All pore diameters were above 2 nm; hence, gas molecule diffusion did not limit CO2 adsorption.
EPMA results showed that the shapes of untreated and impregnated samples were not regular or defined, as can be seen in SE images (Figure S1). Neither needle-like nor flat structures were detected. In images employing back-scattered electrons (BSE, Figure S2), brighter zones were visible that indicated the presence of heavier components. Although incipient wetness impregnation is known to result in good material distribution, a clear preference of potassium to deposit on certain phases of the support was visible. This preference of inhomogeneous distribution was further validated by EDS analysis performed at various probe positions (Table S2, Figure S3) and was also observed by others [45,46,47]. EDS measurements further revealed Mg/Al ratios close to the expected value of 3.
CO2 chemisorption isotherms obtained for dry conditions at SEWGS temperature (250 °C) are depicted in Figure 6. All curves exhibit the typically fast initial rise followed by a less pronounced increase of CO2 uptake as function of the CO2 pressure, as reported in the literature [48]. This behavior can be fairly described by means of the Freundlich model [22,49]. The optimized Freundlich parameters (Equation (S2)) used for data fitting in Figure 6 are listed in Table S3 and are comparable to other works [43,50,51]. As CO2 equilibrium sorption measurements in this work were only performed up to 1 bar and for dry conditions, the given values are valuable information for the comparison of the different samples, but they do not represent SEWGS conditions.
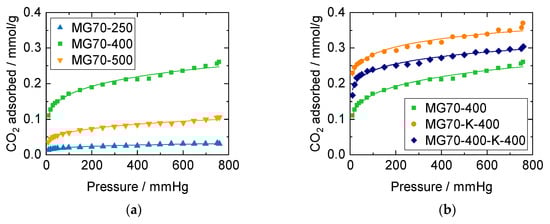
Figure 6.
CO2 chemisorption isotherms at 250 °C for (a) samples with varied calcination temperatures (250, 400 and 500 °C), and (b) varied calcination—impregnation procedures: calcined (MG70-400), impregnated—calcined (MG70-K-400), and calcined—impregnated—calcined (MG70-400-K-400). Straight lines: data fitted according to the Freundlich model (Table S3).
The highest sorption capacity in Figure 6a was reached for the sample calcined at 400 °C, compared to those calcined at 250 °C and 500 °C, respectively. This behavior can be explained by the above-mentioned findings: XRD patterns revealed that calcination at 250 °C did not lead to the desired mixed oxide with basic sites for CO2 adsorption. Additionally, according to TGA measurements, further material decomposition started at 500 °C.
In Figure 6b, isotherms of samples with and without potassium impregnation are shown. It is well-known that CO2 sorption on HTdcs can be improved by alkaline modification, and especially with potassium promising results were obtained [28,50,52,53]. Meis et al. attributed this enhancement to an increase in low-coordinated oxygen sites through alkali metal incorporation, and Rocha et al. assumed K to act as a chemical promoter [43,54]. Interestingly, CO2 equilibrium isotherms in Figure 6b suggest that the procedure, in which the sample was calcined before, and once again after impregnation (MG70-400-K-400, was not beneficial compared to the procedure in which the sample was calcined only after impregnation (MG70-K-400). The difference in adsorption capacity was more pronounced for higher pressures and might be due to an incomplete reconstruction (based on the so-called memory effect during incipient wetness impregnation) from the mixed oxide (after the first calcination) back to the layered double hydroxide in the case of twofold calcination. This decrease in adsorption sites was not correlated with surface area and pore volume. Therefore, sorption properties were more related to the chemical structure of the surface than the accessible surface area or pore volume, as indicated elsewhere [25,47,55]. As MG70-K-400 exhibited the best CO2 adsorption characteristics, this material was selected for the following SEWGS experiments.
3.3. SEWGS Performance
The following section summarizes the results of an extensive SEWGS parameter study in the PBMR. First, the stability and the influence of various process conditions are demonstrated for selected examples of different reactor configurations. Finally, all investigated reactor modes are compared under otherwise identical process conditions.
In Figure 7a, a typical SEWGS breakthrough curve is shown. Three process stages can be distinguished as: (1) pre-breakthrough, where pure H2 is obtained and CO2 is adsorbed completely, (2) breakthrough stage, where CO2 breakthrough begins, and (3) post-breakthrough, where CO2 has reached steady-state concentration (equal to H2 due to equimolar WGS reaction). A graphical illustration of data evaluation according to Equations (11) and (12) is depicted in Figure 7b.
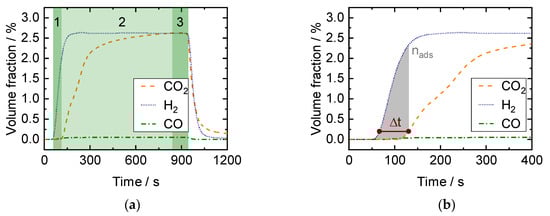
Figure 7.
Measurement in the packed bed microchannel reactor (PBMR): (a) Exemplary CO, CO2, and H2 breakthrough curves for an adsorption step starting at t = 0 s measured in the PGA with (1) pre-breakthrough, (2) breakthrough, and (3) post-breakthrough stage. (b) Determination of CO2 breakthrough time (Equation (11)) and adsorbed amount of CO2 (Equation (12)).
3.3.1. Cyclic Stability
In the twelve-cycle run in Figure 8a, the steady-state conversion remains constant, whereas the adsorbed amount of CO2 drops by 58% after the first cycle (Figure 8b). The steady-state conversion was measured after reaching the post-breakthrough phase and confirmed that no catalyst deactivation took place, neither due to the conditions nor by adding the sorbent.
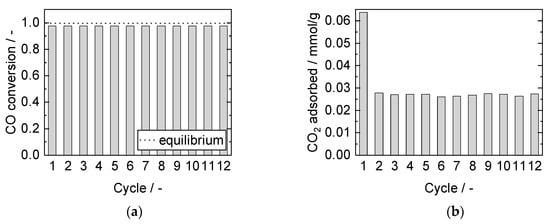
Figure 8.
(a) CO conversion and (b) adsorbed amount of CO2 for 12 adsorption cycles. Adsorption: 15 min, 8 bar, 2000 mL/min, 2.5% CO, S/G = 4. Desorption: 40 min, 1 bar, 1000 mL/min, 40% H2O. PBMR, Mode C, 250 °C.
All performed cyclic adsorption and desorption experiments exhibited a remarkable decrease of CO2 adsorption capacity from the first to the second adsorption phase but stayed almost stable in subsequent cycles. The initial loss of available sorption capacity was mainly attributed to incomplete regeneration during the comparatively short desorption phase, as the adsorption kinetics were known to be ten times faster than desorption [27,56]. Furthermore, irreversible bulk polydentate carbonate formation took place, leading to a decrease of adsorption sites [29]. Nevertheless, even the initial amount adsorbed was already lower than the expected full adsorption capacity due to the limited adsorption kinetics. The resulting cyclic working capacity, herein denoted as “cycle average” of all follow-up cycles, is more relevant to industrial applications than the initial capacity. Therefore, this value is provided in further figures of this work.
3.3.2. Reproducibility
Reproducibility of the measured sorption capacities was proven to be difficult, as the conditions a sorbent has seen, its history, have a remarkable influence on the adsorption characteristics [51,57]. For that reason, only experiments with similar history (e.g., no changes in desorption water content between the experiments) are compared with one another in this work. More information concerning this issue is given in (Figures S4 and S5).
3.3.3. Variation of Adsorption Parameters
Influence of Total Pressure
Results obtained in SEWGS experiments at different pressures are presented in Figure S6. Steady-state conversion approached equilibrium with increasing pressure due to faster adsorption kinetics (Equation (S1)). Breakthrough time, as well as adsorbed amount of CO2, increased with pressure as the sorption equilibrium shifted to higher loadings and the reaction rate increased. This observation is in line with other works on CO2 uptake on HTdcs at higher pressures [8,58,59]. Pressures above 8 bar were not assessed as no significant enhancement was expected, according to Zhu et al. [27].
Influence of CO Partial Pressure at Constant H2O Partial Pressure
The impact resulting from an increase of the CO fraction (2.5% to 20%, constant H2O fraction of 10%) in the feed is presented in Figure 9. Equilibrium conversion in steady-state was achieved for S/G ratios greater than 1 in the feed (2.5% and 5% CO), see Figure 9a. The CO2 breakthrough time decreased with increasing CO fraction, and the amount of adsorbed CO2 was significantly higher for 2.5% CO than for the other feeds (Figure 9b,c). Here, several influences overlap: sorbent saturation depends on CO2 production rate during reaction (which is probably lowest for 2.5% CO), the resulting driving force (partial pressure of CO2), the overall amount of CO2 produced (highest at 10% and 20% CO) and the mean steam content over the bed length. It has been widely shown that the presence of steam during CO2 adsorption enhances the adsorption capacity of HTdcs [44,60].
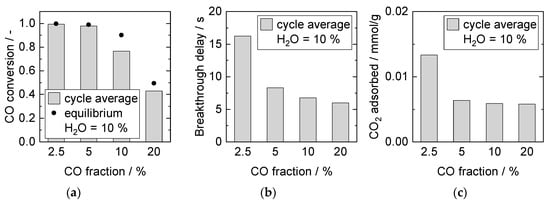
Figure 9.
Adsorption cycle average (a) CO conversion, (b) breakthrough delay, and (c) adsorbed amount of CO2. Adsorption: 15 min, 8 bar, 2000 mL/min, 10% H2O. Desorption: 40 min, 1 bar, 1000 mL/min, 40% H2O. PBMR, Mode D, 250 °C.
This steam effect appeared to dominate for lower CO2 partial pressures, as the adsorbed amount was higher for 2.5% CO. Furthermore, steam also influenced the SEWGS reaction, as enough steam leading to a faster CO2 production rate was only present for S/G ratios above or equal 1. However, at overall higher CO2 fluxes caused by higher CO concentrations (more than factor 3 from 5% CO to 20% CO), the capacity of the sorbent was earlier at breakthrough.
Influence of H2O Partial Pressure at Constant CO Partial Pressure
The influence of steam on the adsorption capacity was further investigated by keeping the CO fraction constant at 10%, whilst increasing the H2O fraction above the required S/G ratio of 1. The results of these experiments are shown in Figure 10. Equilibrium conversion in steady-state increased with S/G ratio and was nearly reached for S/G ratios greater than 1. Longer breakthrough times and higher amounts of adsorbed CO2 were detected in the presence of excess steam during the adsorption process at 20% H2O. With 40% steam, the breakthrough time did not diminish compared to 20%. However, the amount of CO2 adsorbed decreased by this further steam addition.
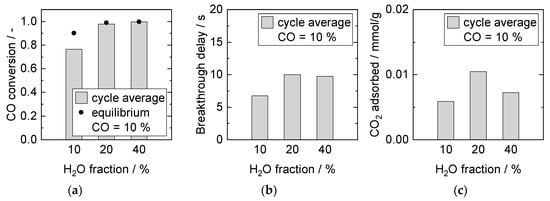
Figure 10.
Adsorption cycle average (a) CO conversion, (b) breakthrough delay, and (c) adsorbed amount of CO2. Adsorption: 15 min, 8 bar, 2000 mL/min, 10% CO. Desorption: 40 min, 1 bar, 1000 mL/min, 40% H2O. PBMR, Mode D, 250 °C.
Such observations were in line with investigations on pure sorbent conducted by Soria et al. [8]. They reported a positive effect on sorption capacity up to 15% H2O, but no further improvement with increasing H2O volume fraction up to 25% (with 15% CO2 in the feed). A potential reason might be found in competing adsorption on adsorption sites that can be occupied by either H2O or CO2, depending on the respective partial pressure of these compounds. For specific sites, steam was required to remove CO2, see Section 3.3.4.
Influence of CO and H2O Partial Pressure at Constant S/G Ratio
Figure 11 displays the results for experiments with constant S/G ratio of 4 and simultaneously increasing CO and H2O fraction. In all cases, equilibrium conversion was reached at steady-state conditions. With increasing reactants concentration, breakthrough time decreased. The amount of CO2 adsorbed rose (2.5% to 5% CO), and then dropped significantly (5% to 10% CO). Multiple related impact factors overlapped again in these experiments. The following three parameters increased with increasing feed gas concentration: (1) total amount of produced CO2, (2) CO2 production rate, thus higher driving force for CO2 adsorption, and (3) mean amount of steam present in the gas phase. The amount of produced CO2 depended primarily on the CO concentration and conversion. It affected the breakthrough delay inversely. Even though a higher CO2 partial pressure leading to a sorption equilibrium shift was obtained for 10% CO, the reaction rate increase was followed by slower adsorption kinetics, resulting in less CO2 adsorbed. Therefore, kinetic constraints arising from relatively slow adsorption kinetics might become prevalent for high CO2 production rates. As discussed above, the positive influence of steam seemed to be limited up to 40% H2O in these experiments, which was reached at 10% CO for S/G = 4 and added to the effect of the kinetics gap.
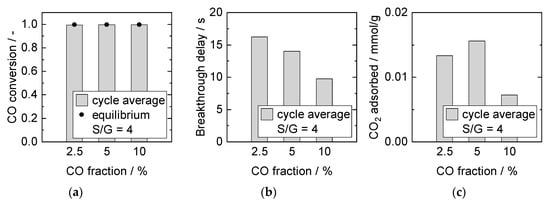
Figure 11.
Adsorption cycle average (a) CO conversion, (b) breakthrough delay, and (c) adsorbed amount of CO2. Adsorption: 15 min, 8 bar, 2000 mL/min, S/G = 4. Desorption: 40 min, 1 bar, 1000 mL/min, 40% H2O. PBMR, Mode D, 250 °C.
3.3.4. Variation of Desorption Parameters
Influence of H2O Partial Pressure during Desorption
In previous studies, Soria et al. reported significant process improvement with 15% H2O (balanced in N2) in the desorption flow compared to pure N2 [61]. The results depicted in Figure 12 demonstrate further the influence of the H2O fraction during sorbent regeneration on the adsorption properties in the subsequent adsorption cycles. Breakthrough time as well as amount of CO2 adsorbed increased with increasing H2O fraction. These experimental results can be explained with the HTdc sorption model developed by Coenen et al. [51,57,62,63]. They distinguished three different adsorption sites: (A) H2O adsorption only, (B) CO2 adsorption only (mainly on basic sites caused by MgO), and (C) competitive adsorption of H2O and CO2 (mainly due to K-promotion). Sites A and B were regenerated with N2, whereas steam was needed to desorb CO2 from site C (and vice versa). Hence, sorbent activation (of site C) and regeneration could be enhanced with steam.
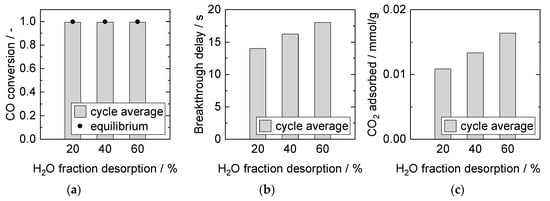
Figure 12.
Adsorption cycle average (a) CO conversion, (b) breakthrough delay, and (c) adsorbed amount of CO2. Adsorption: 15 min, 8 bar, 2000 mL/min, 2.5% CO, S/G = 4. Desorption: 40 min, 1 bar, 1000 mL/min. PBMR, Mode D, 250 °C.
Influence of Desorption Time
An increase in desorption time in SEWGS experiments resulted in longer breakthrough delays and higher amounts of CO2 adsorbed in the subsequent adsorption cycles (Figure 13). This outcome indicates that desorption equilibrium was not reached. It is in line with literature data for sorption on HTdc, as desorption kinetics are reported to be slow [22,27,56]. The literature also suggests that a temperature increase during desorption further enhances the sorbent regeneration and enables shorter desorption times [57,64]. Changing the temperature during desorption was not straightforward in the SEWGS system, first because the applied Cu/ZnO/Al2O3 catalyst tended to lose activity due to sintering at temperatures above 300 °C, and second because of energy losses in a temperature swing process.
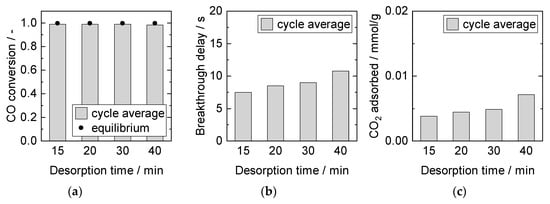
Figure 13.
Adsorption cycle average (a) CO conversion, (b) breakthrough delay, and (c) adsorbed amount of CO2. Adsorption: 15 min, 8 bar, 2000 mL/min, 2.5% CO, S/G = 4. Desorption: 1 bar, 1000 mL/min, 40% H2O. PBMR, Mode E, 250 °C.
3.3.5. Variation of Reactor Configuration
Different reactor configurations based on the multi-section column packing concept introduced by Jang et al. were tested in the PBMR. Jang et al. concluded in a numerical study that the SEWGS process could be enhanced by loading a catalyst and sorbent mixture with higher catalyst weight ratio in the first section of a column reactor than in the second section [65].
Here, in this work, both slits of the PBMR were equally divided in multiple sections (2 and 4) and packed identically (see Figure 2). In contrast to previous studies [31,32,33], significantly lower modified residence times (~factor 10) were studied. Hence, kinetic influences were allowed and the results are quantified with respect to the desired process conditions. Figure 14 shows the achieved steady-state CO conversion and the adsorbed amount of CO2 for all configurations investigated.
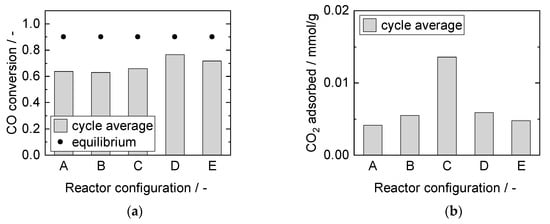
Figure 14.
Adsorption cycle average (a) CO conversion, and (b) adsorbed amount of CO2. Adsorption: 15 min, 8 bar, 2000 mL/min, 10% CO, S/G = 1. Desorption: 40 min, 1 bar, 1000 mL/min, 40% H2O. PBMR, 250 °C.
For modes A, B and C, comparable steady-state CO conversions well below thermodynamic equilibrium were reached. A decrease in the catalyst containing zone length led to an increase in sorption capacity. Long catalyst-free zones at the outlet increased the breakthrough time, as the adsorption kinetics appeared to be considerably slower than the reaction kinetics. This conclusion is in line with the results from the operational parameter variation (see Section 3.3.2). Mode D exhibited higher CO conversion compared to mode B, owing to the doubled amount of catalyst. The adsorbed amount of CO2, however, was within the same range for both modes, attributable to the identical zone length. The total CO2 flux led to equally lower breakthrough times in consequence (not shown). Alternating zones in mode E did not improve the capacity in comparison with mode D. In this case, the limitation from the sorption kinetics outweighed the potential effect of thermodynamic reaction equilibrium shift in the second catalyst zone in unsteady-state conditions; the amount of CO2 adsorbed dropped slightly. Also, slightly lower steady-state conversion was reached in mode E, possibly caused by better heat distribution. It appears that for the investigated packing concepts under the observed process conditions, the zone length of pure sorbent at the outlet was decisive. The main influencing factor on sorption characteristics with regard to reactor configurations was the difference in adsorption and reaction rate.
Experimental results for a S/G ratio of 2 are depicted in Figure S7. In this case, steady-state CO conversion reaches equilibrium for mode D and E and similar trends regarding CO2 adsorption were observed.
4. Conclusions
A SEWGS system providing CO2-free synthesis gas for the production of carbon neutral jet fuel in a PtL process starting from CO2 splitting into CO and O2 in a plasma source was investigated. The SEWGS fixed bed reactor contained a mixture of catalyst and sorbent particles to carry out WGS reaction and CO2 adsorption simultaneously. This experimental study provided catalyst and sorbent characteristics, insight into the influence of various SEWGS operation conditions, and results on the CO2 uptake of five different reactor configurations.
Activity tests with a commercial Cu/ZnO/Al2O3 catalyst, a reaction temperature of 250 °C and modified residence times around 2 × 10⁻⁵ g∙h/mL were set. The HTdc sample calcined only once after 20 wt% potassium impregnation (MG70-K-400) from HTC starting material possessed the best sorption capacity and was chosen for the SEWGS parameter study.
In automated cyclic adsorption and desorption breakthrough experiments in the isothermal PBMR, the influence of adsorption pressure, adsorption feed composition, desorption conditions and reactor configuration on breakthrough delay and adsorbed amount of CO2 was studied. A constant cyclic working capacity was reached after an initial drop between the first and the second adsorption cycle. This effect was mainly attributed to bulk carbonate formation and incomplete sorbent regeneration due to much slower desorption kinetics.
In accordance to the proposed adsorption isotherm models [58], an increase in pressure led to higher amounts of adsorbed CO2. The amount of water available during the adsorption phase was found to be crucial. Up to around 20% steam content in the feed, the sorption properties were enhanced. At 40% steam, a contradictory effect was observed, which was related to H2O and CO2 competing for adsorption sites. A total increase in CO2 flux reduced the breakthrough time at certain conditions but the right choice of some excess steam could counteract this effect or at least increase the amount of CO2 adsorbed. Variations in desorption conditions revealed that the desorption process exhibited low sorption kinetics and could also be improved with steam. High feed loading with steam in the desorption process and long desorption times helped to increase the amount of CO2 adsorbed during the following adsorption phase. The significance of water during adsorption, as well as desorption, confirmed the existence of different adsorption sites.
Several catalyst and sorbent packing concepts with varying catalyst weight fraction and zone distribution suggested that the length of the catalyst-free zone at the outlet was a main influencing factor on the cyclic sorption capacity. As the SEWGS tests were performed at significantly lower modified residence times than those previously reported [31,32,33], it was shown for the first time that the interaction of relatively fast reaction and relatively slow adsorption kinetics seem to play a key role in the SEWGS process design.
In general, the results suggest that the investigated SEWGS concept is a promising option to provide synthesis gas for carbon neutral jet fuel production in the Kerogreen process. Improving the sorption capacity of HTdcs would result in longer breakthrough times, so this is recommended for further study.
Supplementary Materials
The following are available online at https://www.mdpi.com/1996-1073/14/2/355/s1. Figure S1. SE image of (a) untreated sample (MG70) (×100), (b) impregnated—calcined sample (MG70-K-400) (×100), (c) untreated sample (MG70) (×1000), and (d) impregnated—calcined sample (MG70-K-400) (×1000). Figure S2. BSE image (x500) of pressed powder (a) calcined—impregnated sample (MG70-400-K), (b) impregnated—calcined sample (MG70-K-400), and (c) calcined—impregnated—calcined sample (MG70-400-K-400). Figure S3. Probe positions marked for EDS analysis of pressed powder (a) untreated sample (MG70), (b) calcined sample (MG70-400), (c) impregnated—calcined sample (MG70-K-400), (d) calcined—impregnated sample (MG70-400-K), and (e) calcined—impregnated—calcined sample (MG70-400-K-400). Results are listed in Table S2. Figure S4. Adsorption cycle average (a) CO conversion, (b) breakthrough delay, and (c) adsorbed amount of CO2 for reproduced experiments after different sorbent histories. Adsorption: 15 min, 8 bar, 2000 mL/min, 2.5% CO, S/G = 4. Desorption: 40 min, 1 bar, 1000 mL/min, 40% H2O. PBMR, Mode B, 250 °C. Figure S5. Adsorption cycle average (a) CO conversion, (b) breakthrough delay, and (c) adsorbed amount of CO2 for reproduced experiments after comparable sorbent histories. Adsorption: 15 min, 8 bar, 2000 mL/min, 2.5% CO, S/G = 4. Desorption: 40 min, 1 bar, 1000 mL/min, 40% H2O. PBMR, Mode C, 250 °C. Figure S6. Adsorption cycle average (a) CO conversion, (b) breakthrough delay, and (c) adsorbed amount of CO2. Adsorption: 15 min, 2000 mL/min, 2.5% CO, S/G = 4. Desorption: 40 min, 1 bar, 1000 mL/min, 40% H2O. PBMR, Mode C, 250 °C. Figure S7. Adsorption cycle average (a) CO conversion, and (b) adsorbed amount of CO2. Adsorption: 15 min, 8 bar, 2000 mL/min, 10% CO, S/G = 2. Desorption: 40 min, 1 bar, 1000 mL/min, 40% H2O. PBMR, 250 °C. Table S1. BET surface area, BJH average pore width and cumulative pore volume. Table S2. EDS results: Mg/Al ratio (average) and potassium content (probe positions in Figure S3). Table S3. Freundlich equation (Equation (S2)) parameters kF and n, and fitting parameter R2.
Author Contributions
Conceptualization, T.J.S. and P.P.; methodology, T.J.S.; software, T.J.S.; validation, T.J.S. and P.P.; formal analysis, P.B., J.K., R.S., T.K., and T.J.S.; investigation, P.B., J.K., R.S., T.K., and T.J.S.; resources, T.J.S. and P.P.; data curation, T.J.S.; writing—original draft preparation, T.J.S.; writing—review and editing, J.K., and P.P.; visualization, T.J.S.; supervision, P.P.; project administration, P.P.; funding acquisition, P.P. All authors have read and agreed to the published version of the manuscript.
Funding
The work presented in this paper is part of the European project Kerogreen, which has received funding from the European Union’s Horizon 2020 research and innovation programme under grant agreement no. 763909.
Institutional Review Board Statement
Not applicable.
Informed Consent Statement
Not applicable.
Data Availability Statement
Not applicable.
Acknowledgments
The authors gratefully acknowledge the donation of sorbent material from Sasol GmbH. The authors acknowledge support by the KIT-Publication Fund of the Karlsruhe Institute of Technology. The authors would like to thank Uta Gerhards and Florian Messerschmidt (KIT, IMVT) for EPMA, Christina Odemer (KIT, IAM) for TGA, and Peter G. Weidler (KIT, IFG) for XRD analysis. The authors kindly acknowledge the experimental support of Adrian da Silva Moreira and Jan Speck. Many thanks go to our colleagues Cornelia Schorle (technical support) and Paul Kant (electrical support).
Conflicts of Interest
The authors declare no conflict of interest.
List of Abbreviations
| BET | Brunauer-Emmett-Teller |
| BJH | Barrett-Joyner-Halenda |
| BSE | Back-scattered electrons |
| EDS | Energy dispersive spectroscopy |
| EPMA | Electron probe micro analysis |
| Eq. | Equation |
| FID | Flame ionization detector |
| FT | Fischer-Tropsch |
| GC | Gas chromatograph |
| HTC | Hydrotalcite |
| HTdc | Hydrotalcite-derived compounds |
| LFC | Liquid flow controller |
| MFC | Mass flow controller |
| NDIR | Nondispersive infrared detector |
| PBMR | Packed bed microchannel reactor |
| Powder diffraction file | |
| PGA | Process gas analyzer |
| PtL | Power-to-Liquid |
| S/G | Steam-to-gas ratio |
| SE | Secondary electrons |
| SEWGS | Sorption-enhaned water-gas shift |
| TCD | Thermal conductivity detector |
| TGA | Thermogravimetric analysis |
| TR | Tubular reactor |
| WGS | Water-gas shift |
| XRD | X-ray diffraction |
List of Symbols
| Reaction enthalpy | kJ/mol | |
| Equilibrium constant | - | |
| Freundlich constant | mmol/g∙bar1/n | |
| Mass | g | |
| Specific amount of CO2 adsorbed | mmol/g | |
| Molar flow | mol/s | |
| Adsorption intensity | - | |
| Pressure | bar | |
| Ideal gas constant | J/mol∙K | |
| Reaction rate | mol/g∙h | |
| Modified residence time | g∙h/mL | |
| Temperature | K | |
| Time | s | |
| Volume flow | mL/min | |
| Weight fraction | - | |
| CO conversion | - | |
| Volume fraction | - |
List of Indices
| Feed | |
| Adsorption/adsorbed | |
| Catalyst | |
| Desorption | |
| After condensation | |
| Sorbent |
References
- United Nations. Paris Agreement. Available online: https://unfccc.int/process-and-meetings (accessed on 17 November 2020).
- European Commission. A European Strategy for Low-Emission Mobility. Available online: https://eur-lex.europa.eu/legal-content/en/TXT/?uri=CELEX:52016DC0501 (accessed on 17 November 2020).
- Goede, A.P.H. CO2 neutral fuels. EPJ Web Conf. 2018, 189, 10. [Google Scholar] [CrossRef]
- Viegas, P.; Vialetto, L.; Wolf, A.J.; Peeters, F.J.J.; Groen, P.W.C.; Righart, T.W.H.; Bongers, W.A.; van de Sanden, M.C.M.; Diomede, P. Insight into contraction dynamics of microwave plasmas for CO2 conversion from plasma chemistry modelling. Plasma Sources Sci. Technol. 2020, 29, 105014. [Google Scholar] [CrossRef]
- Soldatov, S.; Link, G.; Silberer, L.; Schmedt, C.M.; Carbone, E.; D’Isa, F.; Jelonnek, J.; Dittmeyer, R.; Navarrete, A. Time-Resolved Optical Emission Spectroscopy Reveals Nonequilibrium Conditions for CO2 Splitting in Atmospheric Plasma Sustained with Ultrafast Microwave Pulsation. ACS Energy Lett. 2020, 11, 124–130. [Google Scholar] [CrossRef]
- Kirsch, H.; Brübach, L.; Loewert, M.; Riedinger, M.; Gräfenhahn, A.; Böltken, T.; Klumpp, M.; Pfeifer, P.; Dittmeyer, R. CO2-neutrale Fischer-Tropsch-Kraftstoffe aus dezentralen modularen Anlagen: Status und Perspektiven. Chem. Ing. Tech. 2020, 92, 91–99. [Google Scholar] [CrossRef]
- Ramirez, A.; Sarathy, S.M.; Gascon, J. CO2 Derived E-Fuels: Research Trends, Misconceptions, and Future Directions. Trends Chem. 2020, 2, 785–795. [Google Scholar] [CrossRef]
- Soria, M.A.; Tosti, S.; Mendes, A.; Madeira, L.M. Enhancing the low temperature water–gas shift reaction through a hybrid sorption-enhanced membrane reactor for high-purity hydrogen production. Fuel 2015, 159, 854–863. [Google Scholar] [CrossRef]
- Jang, H.M.; Lee, K.B.; Caram, H.S.; Sircar, S. High-purity hydrogen production through sorption enhanced water gas shift reaction using K2CO3-promoted hydrotalcite. Chem. Eng. Sci. 2012, 73, 431–438. [Google Scholar] [CrossRef]
- Moe, J.M. Design of water-gas shift reactors. Chem. Eng. Prog. 1962, 58, 3. [Google Scholar]
- Mendes, D.; Mendes, A.; Madeira, L.M.; Iulianelli, A.; Sousa, J.M.; Basile, A. The water-gas shift reaction: From conventional catalytic systems to Pd-based membrane reactors—A review. Asia Pac. J. Chem. Eng. 2010, 5, 111–137. [Google Scholar] [CrossRef]
- Smith, R.J.B.; Loganathan, M.; Shantha, M.S. A Review of the Water Gas Shift Reaction Kinetics. Int. J. Chem. React. Eng. 2010, 8, 8. [Google Scholar] [CrossRef]
- Choi, Y.; Stenger, H.G. Water gas shift reaction kinetics and reactor modeling for fuel cell grade hydrogen. J. Power Sources 2003, 124, 432–439. [Google Scholar] [CrossRef]
- Wang, S.; Shen, H.; Fan, S.; Zhao, Y.; Ma, X.; Gong, J. Enhanced CO2 adsorption capacity and stability using CaO-based adsorbents treated by hydration. AIChE J. 2013, 59, 3586–3593. [Google Scholar] [CrossRef]
- Bhagiyalakshmi, M.; Lee, J.Y.; Jang, H.T. Synthesis of mesoporous magnesium oxide: Its application to CO2 chemisorption. Int. J. Greenh. Gas Control 2010, 4, 51–56. [Google Scholar] [CrossRef]
- Iwan, A.; Stephenson, H.; Ketchie, W.C.; Lapkin, A.A. High temperature sequestration of CO2 using lithium zirconates. Chem. Eng. J. 2009, 146, 249–258. [Google Scholar] [CrossRef]
- Hu, Y.; Liu, W.; Yang, Y.; Qu, M.; Li, H. CO2 capture by Li4SiO4 sorbents and their applications: Current developments and new trends. Chem. Eng. J. 2019, 359, 604–625. [Google Scholar] [CrossRef]
- Yin, G.; Liu, Z.; Liu, Q.; Wu, W. The role of different properties of activated carbon in CO2 adsorption. Chem. Eng. J. 2013, 230, 133–140. [Google Scholar] [CrossRef]
- Siriwardane, R.V.; Shen, M.-S.; Fisher, E.P.; Poston, J.A. Adsorption of CO2 on Molecular Sieves and Activated Carbon. Energy Fuels 2001, 15, 279–284. [Google Scholar] [CrossRef]
- Mulloth, L.M.; Finn, J.E. Carbon Dioxide Adsorption on a 5A Zeolite Designed for CO2 Removal in Spacecraft Cabins; NASA/TM-1998-208752; NASA: Washington, DC, USA, 1998.
- Millward, A.R.; Yaghi, O.M. Metal-organic frameworks with exceptionally high capacity for storage of carbon dioxide at room temperature. J. Am. Chem. Soc. 2005, 127, 17998–17999. [Google Scholar] [CrossRef]
- Reijers, H.T.J.; Boon, J.; Elzinga, G.D.; Cobden, P.D.; Haije, W.G.; van den Brink, R.W. Modeling Study of the Sorption-Enhanced Reaction Process for CO2 Capture. I. Model Development and Validation. Ind. Eng. Chem. Res. 2009, 48, 6966–6974. [Google Scholar] [CrossRef]
- Van Selow, E.R.; Cobden, P.D.; Wright, A.D.; van den Brink, R.W.; Jansen, D. Improved sorbent for the sorption-enhanced water-gas shift process. Energy Procedia 2011, 4, 1090–1095. [Google Scholar] [CrossRef][Green Version]
- Rives, V. Characterisation of layered double hydroxides and their decomposition products. Mater. Chem. Phys. 2002, 75, 19–25. [Google Scholar] [CrossRef]
- León, M.; Díaz, E.; Bennici, S.; Vega, A.; Ordóñez, S.; Auroux, A. Adsorption of CO2 on Hydrotalcite-Derived Mixed Oxides: Sorption Mechanisms and Consequences for Adsorption Irreversibility. Ind. Eng. Chem. Res. 2010, 49, 3663–3671. [Google Scholar] [CrossRef]
- Yong, Z.; Mata, A.V.; Rodrigues, A.E. Adsorption of Carbon Dioxide onto Hydrotalcite-like Compounds (HTlcs) at High Temperatures. Ind. Eng. Chem. Res. 2001, 40, 204–209. [Google Scholar] [CrossRef]
- Zhu, X.; Shi, Y.; Cai, N. High-pressure carbon dioxide adsorption kinetics of potassium-modified hydrotalcite at elevated temperature. Fuel 2017, 207, 579–590. [Google Scholar] [CrossRef]
- Lee, J.M.; Min, Y.J.; Lee, K.B.; Jeon, S.G.; Na, J.G.; Ryu, H.J. Enhancement of CO2 sorption uptake on hydrotalcite by impregnation with K2CO3. Langmuir 2010, 26, 18788–18797. [Google Scholar] [CrossRef] [PubMed]
- Du, H.; Williams, C.T.; Ebner, A.D.; Ritter, J.A. In Situ FTIR Spectroscopic Analysis of Carbonate Transformations during Adsorption and Desorption of CO2 in K-Promoted HTlc. Chem. Mater. 2010, 22, 3519–3526. [Google Scholar] [CrossRef]
- Belimov, M.; Metzger, D.; Pfeifer, P. On the temperature control in a microstructured packed bed reactor for methanation of CO/CO2 mixtures. AIChE J. 2017, 63, 120–129. [Google Scholar] [CrossRef]
- Lee, C.H.; Lee, K.B. Application of one-body hybrid solid pellets to sorption-enhanced water gas shift reaction for high-purity hydrogen production. Int. J. Hydrog. Energy 2014, 39, 18128–18134. [Google Scholar] [CrossRef]
- Lee, C.H.; Lee, K.B. Sorption-enhanced water gas shift reaction for high-purity hydrogen production: Application of a Na-Mg double salt-based sorbent and the divided section packing concept. Appl. Energy 2017, 205, 316–322. [Google Scholar] [CrossRef]
- Hu, Y.; Cui, H.; Cheng, Z.; Zhou, Z. Sorption-enhanced water gas shift reaction by in situ CO2 capture on an alkali metal salt-promoted MgO-CaCO3 sorbent. Chem. Eng. J. 2019, 377, 119823. [Google Scholar] [CrossRef]
- Othman, M.R.; Helwani, Z.; Martunus; Fernando, W.J.N. Synthetic hydrotalcites from different routes and their application as catalysts and gas adsorbents: A review. Appl. Organometal. Chem. 2009, 23, 335–346. [Google Scholar] [CrossRef]
- Reijers, H.T.J.; Valster-Schiermeier, S.E.A.; Cobden, P.D.; van den Brink, R.W. Hydrotalcite as CO2 Sorbent for Sorption-Enhanced Steam Reforming of Methane. Ind. Eng. Chem. Res. 2006, 45, 2522–2530. [Google Scholar] [CrossRef]
- Yang, J.-I.; Kim, J.-N. Hydrotalcites for adsorption of CO2 at high temperature. Korean J. Chem. Eng. 2006, 23, 77–80. [Google Scholar] [CrossRef]
- Carriazo, D.; del Arco, M.; Martín, C.; Rives, V. A comparative study between chloride and calcined carbonate hydrotalcites as adsorbents for Cr(VI). Appl. Clay Sci. 2007, 37, 231–239. [Google Scholar] [CrossRef]
- Ram Reddy, M.K.; Xu, Z.P.; Lu, G.Q.; da Costa, J.C.D. Layered Double Hydroxides for CO2 Capture: Structure Evolution and Regeneration. Ind. Eng. Chem. Res. 2006, 45, 7504–7509. [Google Scholar] [CrossRef]
- Pérez-Ramírez, J.; Abelló, S.; van der Pers, N.M. Memory effect of activated Mg-Al hydrotalcite: In situ XRD studies during decomposition and gas-phase reconstruction. Chemistry 2007, 13, 870–878. [Google Scholar] [CrossRef]
- Yang, W.; Kim, Y.; Liu, P.K.; Sahimi, M.; Tsotsis, T.T. A study by in situ techniques of the thermal evolution of the structure of a Mg–Al–CO3 layered double hydroxide. Chem. Eng. Sci. 2002, 57, 2945–2953. [Google Scholar] [CrossRef]
- Iruretagoyena Ferrer, D. Supported Layered Double Hydroxides as CO2 Adsorbents for Sorption-Enhanced H2 Production; Springer International Publishing: Cham, Switzerland, 2016; ISBN 9783319412764. [Google Scholar]
- Thommes, M.; Kaneko, K.; Neimark, A.V.; Olivier, J.P.; Rodriguez-Reinoso, F.; Rouquerol, J.; Sing, K.S. Physisorption of gases, with special reference to the evaluation of surface area and pore size distribution (IUPAC Technical Report). Pure Appl. Chem. 2015, 87, 1051–1069. [Google Scholar] [CrossRef]
- Rocha, C.; Soria, M.A.; Madeira, L.M. Doping of hydrotalcite-based sorbents with different interlayer anions for CO2 capture. Sep. Purif. Technol. 2020, 235, 116140. [Google Scholar] [CrossRef]
- Halabi, M.H.; de Croon, M.; van der Schaaf, J.; Cobden, P.D.; Schouten, J.C. High capacity potassium-promoted hydrotalcite for CO2 capture in H2 production. Int. J. Hydrogen Energy 2012, 37, 4516–4525. [Google Scholar] [CrossRef]
- Hanif, A.; Dasgupta, S.; Divekar, S.; Arya, A.; Garg, M.O.; Nanoti, A. A study on high temperature CO2 capture by improved hydrotalcite sorbents. Chem. Eng. J. 2014, 236, 91–99. [Google Scholar] [CrossRef]
- Oliveira, E.L.; Grande, C.A.; Rodrigues, A.E. CO2 sorption on hydrotalcite and alkali-modified (K and Cs) hydrotalcites at high temperatures. Sep. Purif. Technol. 2008, 62, 137–147. [Google Scholar] [CrossRef]
- Miguel, C.V.; Trujillano, R.; Rives, V.; Vicente, M.A.; Ferreira, A.; Rodrigues, A.E.; Mendes, A.; Madeira, L.M. High temperature CO2 sorption with gallium-substituted and promoted hydrotalcites. Sep. Purif. Technol. 2014, 127, 202–211. [Google Scholar] [CrossRef]
- Ebner, A.D.; Reynolds, S.P.; Ritter, J.A. Understanding the Adsorption and Desorption Behavior of CO2 on a K-Promoted Hydrotalcite-like Compound (HTlc) through Nonequilibrium Dynamic Isotherms. Ind. Eng. Chem. Res. 2006, 45, 6387–6392. [Google Scholar] [CrossRef]
- Soares, J.; Casarin, G.L.; José, H.J.; Moreira, R.D.F.P.M.; Rodrigues, A.E. Experimental and Theoretical Analysis for the CO2 Adsorption on Hydrotalcite. Adsorption 2005, 11, 237–241. [Google Scholar] [CrossRef]
- Silva, J.M.; Trujillano, R.; Rives, V.; Soria, M.A.; Madeira, L.M. High temperature CO2 sorption over modified hydrotalcites. Chem. Eng. J. 2017, 325, 25–34. [Google Scholar] [CrossRef]
- Coenen, K.; Gallucci, F.; Hensen, E.; van Sint Annaland, M. Kinetic model for adsorption and desorption of H2O and CO2 on hydrotalcite-based adsorbents. Chem. Eng. J. 2019, 355, 520–531. [Google Scholar] [CrossRef]
- Walspurger, S.; Boels, L.; Cobden, P.D.; Elzinga, G.D.; Haije, W.G.; van den Brink, R.W. The crucial role of the K+-aluminium oxide interaction in K+-promoted alumina- and hydrotalcite-based materials for CO2 sorption at high temperatures. ChemSusChem 2008, 1, 643–650. [Google Scholar] [CrossRef]
- Walspurger, S.; Cobden, P.D.; Safonova, O.V.; Wu, Y.; Anthony, E.J. High CO2 storage capacity in alkali-promoted hydrotalcite-based material: In situ detection of reversible formation of magnesium carbonate. Chemistry 2010, 16, 12694–12700. [Google Scholar] [CrossRef]
- Meis, N.N.A.H.; Bitter, J.H.; de Jong, K.P. On the Influence and Role of Alkali Metals on Supported and Unsupported Activated Hydrotalcites for CO2 Sorption. Ind. Eng. Chem. Res. 2010, 49, 8086–8093. [Google Scholar] [CrossRef]
- Hutson, N.D.; Attwood, B.C. High temperature adsorption of CO2 on various hydrotalcite-like compounds. Adsorption 2008, 14, 781–789. [Google Scholar] [CrossRef]
- Ebner, A.D.; Reynolds, S.P.; Ritter, J.A. Nonequilibrium Kinetic Model That Describes the Reversible Adsorption and Desorption Behavior of CO2 in a K-Promoted Hydrotalcite-like Compound. Ind. Eng. Chem. Res. 2007, 46, 1737–1744. [Google Scholar] [CrossRef]
- Coenen, K.; Gallucci, F.; Cobden, P.; van Dijk, E.; Hensen, E.; van Sint Annaland, M. Chemisorption working capacity and kinetics of CO2 and H2O of hydrotalcite-based adsorbents for sorption-enhanced water-gas-shift applications. Chem. Eng. J. 2016, 293, 9–23. [Google Scholar] [CrossRef]
- Boon, J.; Cobden, P.D.; van Dijk, H.; Hoogland, C.; van Selow, E.R.; van Sint Annaland, M. Isotherm model for high-temperature, high-pressure adsorption of and on K-promoted hydrotalcite. Chem. Eng. J. 2014, 248, 406–414. [Google Scholar] [CrossRef]
- Lee, K.B.; Verdooren, A.; Caram, H.S.; Sircar, S. Chemisorption of carbon dioxide on potassium-carbonate-promoted hydrotalcite. J. Colloid Interface Sci. 2007, 308, 30–39. [Google Scholar] [CrossRef]
- Ram Reddy, M.K.; Xu, Z.P.; Diniz da Costa, J.C. Influence of Water on High-Temperature CO2 Capture Using Layered Double Hydroxide Derivatives. Ind. Eng. Chem. Res. 2008, 47, 2630–2635. [Google Scholar] [CrossRef]
- Soria, M.A.; Rocha, C.; Tosti, S.; Mendes, A.; Madeira, L.M. COx free hydrogen production through water-gas shift reaction in different hybrid multifunctional reactors. Chem. Eng. J. 2019, 356, 727–736. [Google Scholar] [CrossRef]
- Coenen, K.; Gallucci, F.; Pio, G.; Cobden, P.; van Dijk, E.; Hensen, E.; van Sint Annaland, M. On the influence of steam on the CO2 chemisorption capacity of a hydrotalcite-based adsorbent for SEWGS applications. Chem. Eng. J. 2017, 314, 554–569. [Google Scholar] [CrossRef]
- Coenen, K.; Gallucci, F.; Hensen, E.; van Sint Annaland, M. CO2 and H2O chemisorption mechanism on different potassium-promoted sorbents for SEWGS processes. J. CO2 Util. 2018, 25, 180–193. [Google Scholar] [CrossRef]
- Wu, Y.-J.; Li, P.; Yu, J.-G.; Cunha, A.F.; Rodrigues, A.E. K-Promoted Hydrotalcites for CO2 Capture in Sorption Enhanced Reactions. Chem. Eng. Technol. 2013, 36, 567–574. [Google Scholar] [CrossRef]
- Jang, H.M.; Kang, W.R.; Lee, K.B. Sorption-enhanced water gas shift reaction using multi-section column for high-purity hydrogen production. Int. J. Hydrog. Energy 2013, 38, 6065–6071. [Google Scholar] [CrossRef]
Publisher’s Note: MDPI stays neutral with regard to jurisdictional claims in published maps and institutional affiliations. |
© 2021 by the authors. Licensee MDPI, Basel, Switzerland. This article is an open access article distributed under the terms and conditions of the Creative Commons Attribution (CC BY) license (http://creativecommons.org/licenses/by/4.0/).