Article

A Novel Algorithm for Fast DC Electric Arc Detection

by
Michał Dołęgowski
and
Mirosław Szmajda
*
Faculty of Electrical Engineering, Automatic Control and Informatics, Opole University of Technology, Prószkowska 76, 45-758 Opole, Poland
*
Author to whom correspondence should be addressed.
Energies 2021, 14(2), 288; https://doi.org/10.3390/en14020288
Submission received: 7 December 2020 / Revised: 28 December 2020 / Accepted: 2 January 2021 / Published: 7 January 2021

Abstract

:
Electric arcing is a common problem in DC power systems. To overcome this problem, the electric arc detection algorithm has been developed as a faster alternative to existing algorithms. The following issues are addressed in this paper: The calculation of the proposed algorithm of incremental decomposition of the signal over time; the computational complexity of Fast Fourier Transform (FFT) and the incremental decomposition; the test bench used to measure electric arcs at given parameters; the analysis of measurements using FFT; and the analysis of measurements using incremental decomposition. The parameters are the DC voltage, electric load, and width of the gap between electrodes. The results showed that the proposed algorithm allows for a faster calculation—about seven times faster than FFT—and cheaper implementation in electric arc detection devices than FFT.

Graphical Abstract

1. Introduction

Arc faults are a common problem in the power industry, starting with high [1] and medium [2,3,4,5] voltage transmission lines. Fallen trees can cause a high or medium voltage to arc over and cause intermittent earth leakage. Continuing on to the low voltage systems, arc fault detection is a hot topic in household mains [6,7,8,9,10,11,12,13,14,15] protection, photovoltaic arrays, and DC microgrids [16,17,18,19,20,21,22,23,24,25,26,27,28,29,30,31]. To ensure safety in that regard, several standards have been developed, including UL 1699 for household mains arc fault detection devices and UL 1699B for DC arc detection in photovoltaic systems [32]. Arcs are often caused by corroded or loose screw terminals and damaged insulation of the wires. Arcing problems also occur on wind farms [33] or in nuclear power systems [34]. In terms of powering moving objects, railway traction [35,36,37,38,39], automotive [40,41], ship [42], and aircraft [43,44] power systems also suffer from this problem. Railway traction is especially interesting in this regard, because arcs also occur during a normal operation in the pantograph-catenary contact area, what is important from a power quality point of view [37].
Electric arcs, in both AC and DC power systems, can lead to damage of the switchgear and wiring infrastructure or even fires, if not detected and extinguished quickly enough. Electric arcs generate noises at very different frequencies, which can be detected by various sensors [45]. If the place of the arc presence is known, magnetic sensors [23], radio antennas [24,25], IR, visual light, or UV [36,44,46,47] sensors can be used; otherwise, the current and voltage in the protected system can be measured. Then, the measured data need to be processed. Various tests have been conducted to select the most efficient algorithm and descriptor for the detection of arcs in household mains [48,49,50,51,52] and photovoltaic installations [53,54,55,56,57]. For both AC and DC systems, among others, the following signal processing algorithms have been taken into consideration: Wavelet transform and Fast Fourier Transform (FFT) [1,3,4,5,28,29,58,59]; Short-Time Fourier Transform (STFT) [38,42,48]; Finite Impulse Response (FIR) filtration and derivative [51,60,61,62]; Wigner–Ville Distribution (WVD) [11]; Signal-to-Noise Ratio (SNR) [27]; statistics [26]; and mathematical morphology [30]. Neural networks/machine learning have been used to extract the arc features [12,13,14,15,41,49,63], as well as image processing algorithms [64,65].
The signal processing methods mentioned above are able to distinguish between waveforms with and without an arc very efficiently, but they also have the drawback of a high computational complexity or the need to learn and thus long calculation times. The aim of the arc detection algorithm proposed in this paper is not strictly to provide a high accuracy, but also a low computational complexity, in order to detect the arc as quickly as possible, regardless of the DC power system, and allow the use of low-cost microcontrollers. The algorithm of incremental decomposition of the signal over time works in the time domain and has been proposed as a less computationally complex and time consuming alternative to the frequency or time–frequency analyses mentioned at the beginning of this paper. The proposed algorithm has been preliminarily tested for arc recognition at a low voltage of 150 V DC and at a low sampling frequency of 250 kS/s [66]. In this study, it was tested at different and higher voltages, for different values of current and various distances between the electrodes of the spark gap. The sampling frequency was also increased to 500 MS/s (signal measured by the oscilloscope) to record faster current spikes and the number of samples was varied to observe for how long the data have to be acquired for the accurate detection of arcs. The current measurement was chosen as it represents the most popular decision in the mentioned literature and the authors want the algorithm to be universal.
The second chapter presents the calculation method commonly used in the arc detection frequency spectrum and proposed algorithm of incremental decomposition of the current over time. Then, the computational complexity of both algorithms and the exact structure of the measurement system are provided. The data acquired form this system are then presented in the third chapter using both algorithms, which are then analysed in the fourth chapter and summed up in the fifth chapter.

2. Arc Detection Algorithms and Measurement Setup

For arc detection in this study, the authors used the proposed algorithm of incremental decomposition and spectrum analysis, using FFT as the reference.

2.1. Spectrum Analysis in Electric Arc Detection

To obtain the frequency spectrum of the measured signal, a popular algorithm that can be used is Discrete Fourier Transform (DFT). The DFT calculation can be performed using the following equation:
X ( m ) = n = 0 N 1 x ( n ) [ c o s ( 2 π n m N ) j s i n ( 2 π n m N ) ]   ,
where
X(m)—mth sample of the output signal vector,
m—frequency domain output vector sample index,
x(n)—nth sample of the input signal vector,
n—time domain input vector sample index, and
N—window width/sample count.
Then, to calculate the exact frequency magnitudes in the spectrum, the absolute values of the output vector complex numbers can be calculated using the following equation:
X m a g ( m ) = | X ( m ) | = X r e a l 2 ( m ) + X i m a g 2 ( m )   ,
where
Xmag(m)—mth output spectrum frequency harmonic,
Xreal(m)—real part of the mth complex number, and
Ximag(m)—imaginary part of the mth complex number.
The exact values of frequency harmonics in terms of FFT are calculated in the same way, since the FFT gives the same result as DFT [67], but the algorithm employed for its calculation was optimized by Cooley and Tukey in 1965. That optimization made the calculation of the frequency spectrum much faster, but it still requires a lot of computational effort, hence the use of complex numbers. The computational complexity of both algorithms and the one proposed by the author is presented in Section 2.3.
Frequency analysis is a method used, among the others mentioned, in DC arc detection in the photovoltaic industry [68]. The key to detecting an arc efficiently is to define the following parameters of FFT: The sampling frequency, length, and shape of the measuring window. Moreover, on the basis of the FFT results, it is crucial to select the bandwidth, as the area within the arc introduces the most harmonics in reference to the background noise present there all the time [66], and this also applies to AC arc detection devices [69].

2.2. Proposed Algorithm of Incremental Decomposition of the Signal over Time

An algorithm of incremental decomposition constructs a spectrum of increments in the given signal. An increment is understood as how much the voltage, current, resistance, or whatever the measured waveform represents, has changed its value (absolute value according to the last sample) in the given amount of time. The calculated chart shows how many increments of particular values have occurred in the order from the lowest in value to the highest. The algorithm of the incremental decomposition calculation is shown in Figure 1.
The variable i (Iteration) represents the loop iteration and index of the sample in the vector of the input signal named s (Signal). The variable d (Difference) is the temporary value of the increment calculated and the index of the increment repetition count in the resulting vector of the decomposition calculation named o (Output). All calculations are performed in a single loop. For each iteration, a value of the increment is calculated by the absolute value of subtracting two samples next to each other. Then, the repetition count of a given increment and the sample number are both increased by one. Such operations are performed for the number of samples in the signal minus one.
As mentioned in Section 1, the requirement is that the arc detection algorithm is not computationally complex. The given algorithm is performed in a single loop and works on data directly acquired from the analog-to-digital converter, such as integer numbers. Furthermore, the only mathematical operations performed in the calculation of the incremental decomposition are subtraction and addition. Since no floating-point numbers are used and no multiplication or division operations are performed during calculations, the algorithm can be implemented in low-cost microcontrollers and be calculated in real-time. The final criterion of arc detection is the shape of the decomposition spectrum, and this can be checked by a comparison of two values, if they fit into certain intervals.
In this study, measurements were acquired from the oscilloscope, not directly from an analog-to-digital converter, so additional signal pre-processing had to be conducted compared with [66]. All samples had to be divided by the value of the least significant bit of the oscilloscope’s ADC, which was 0.12 mV. This is a part of the algorithm, but the case of an oscilloscope is unusual and the pre-processing division has not been taken into account in Figure 1, since raw data from the ADC in a custom arc detection device are always available.

2.3. Computational Complexity of FFT and Incremental Decomposition

Table 1 shows the computational complexity of Discrete Fourier Transform (DFT), Fast Fourier Transform (FFT) [67], and incremental decomposition, with regard to the types of mathematical operations performed during the calculation. N is the number of samples in the input signal.
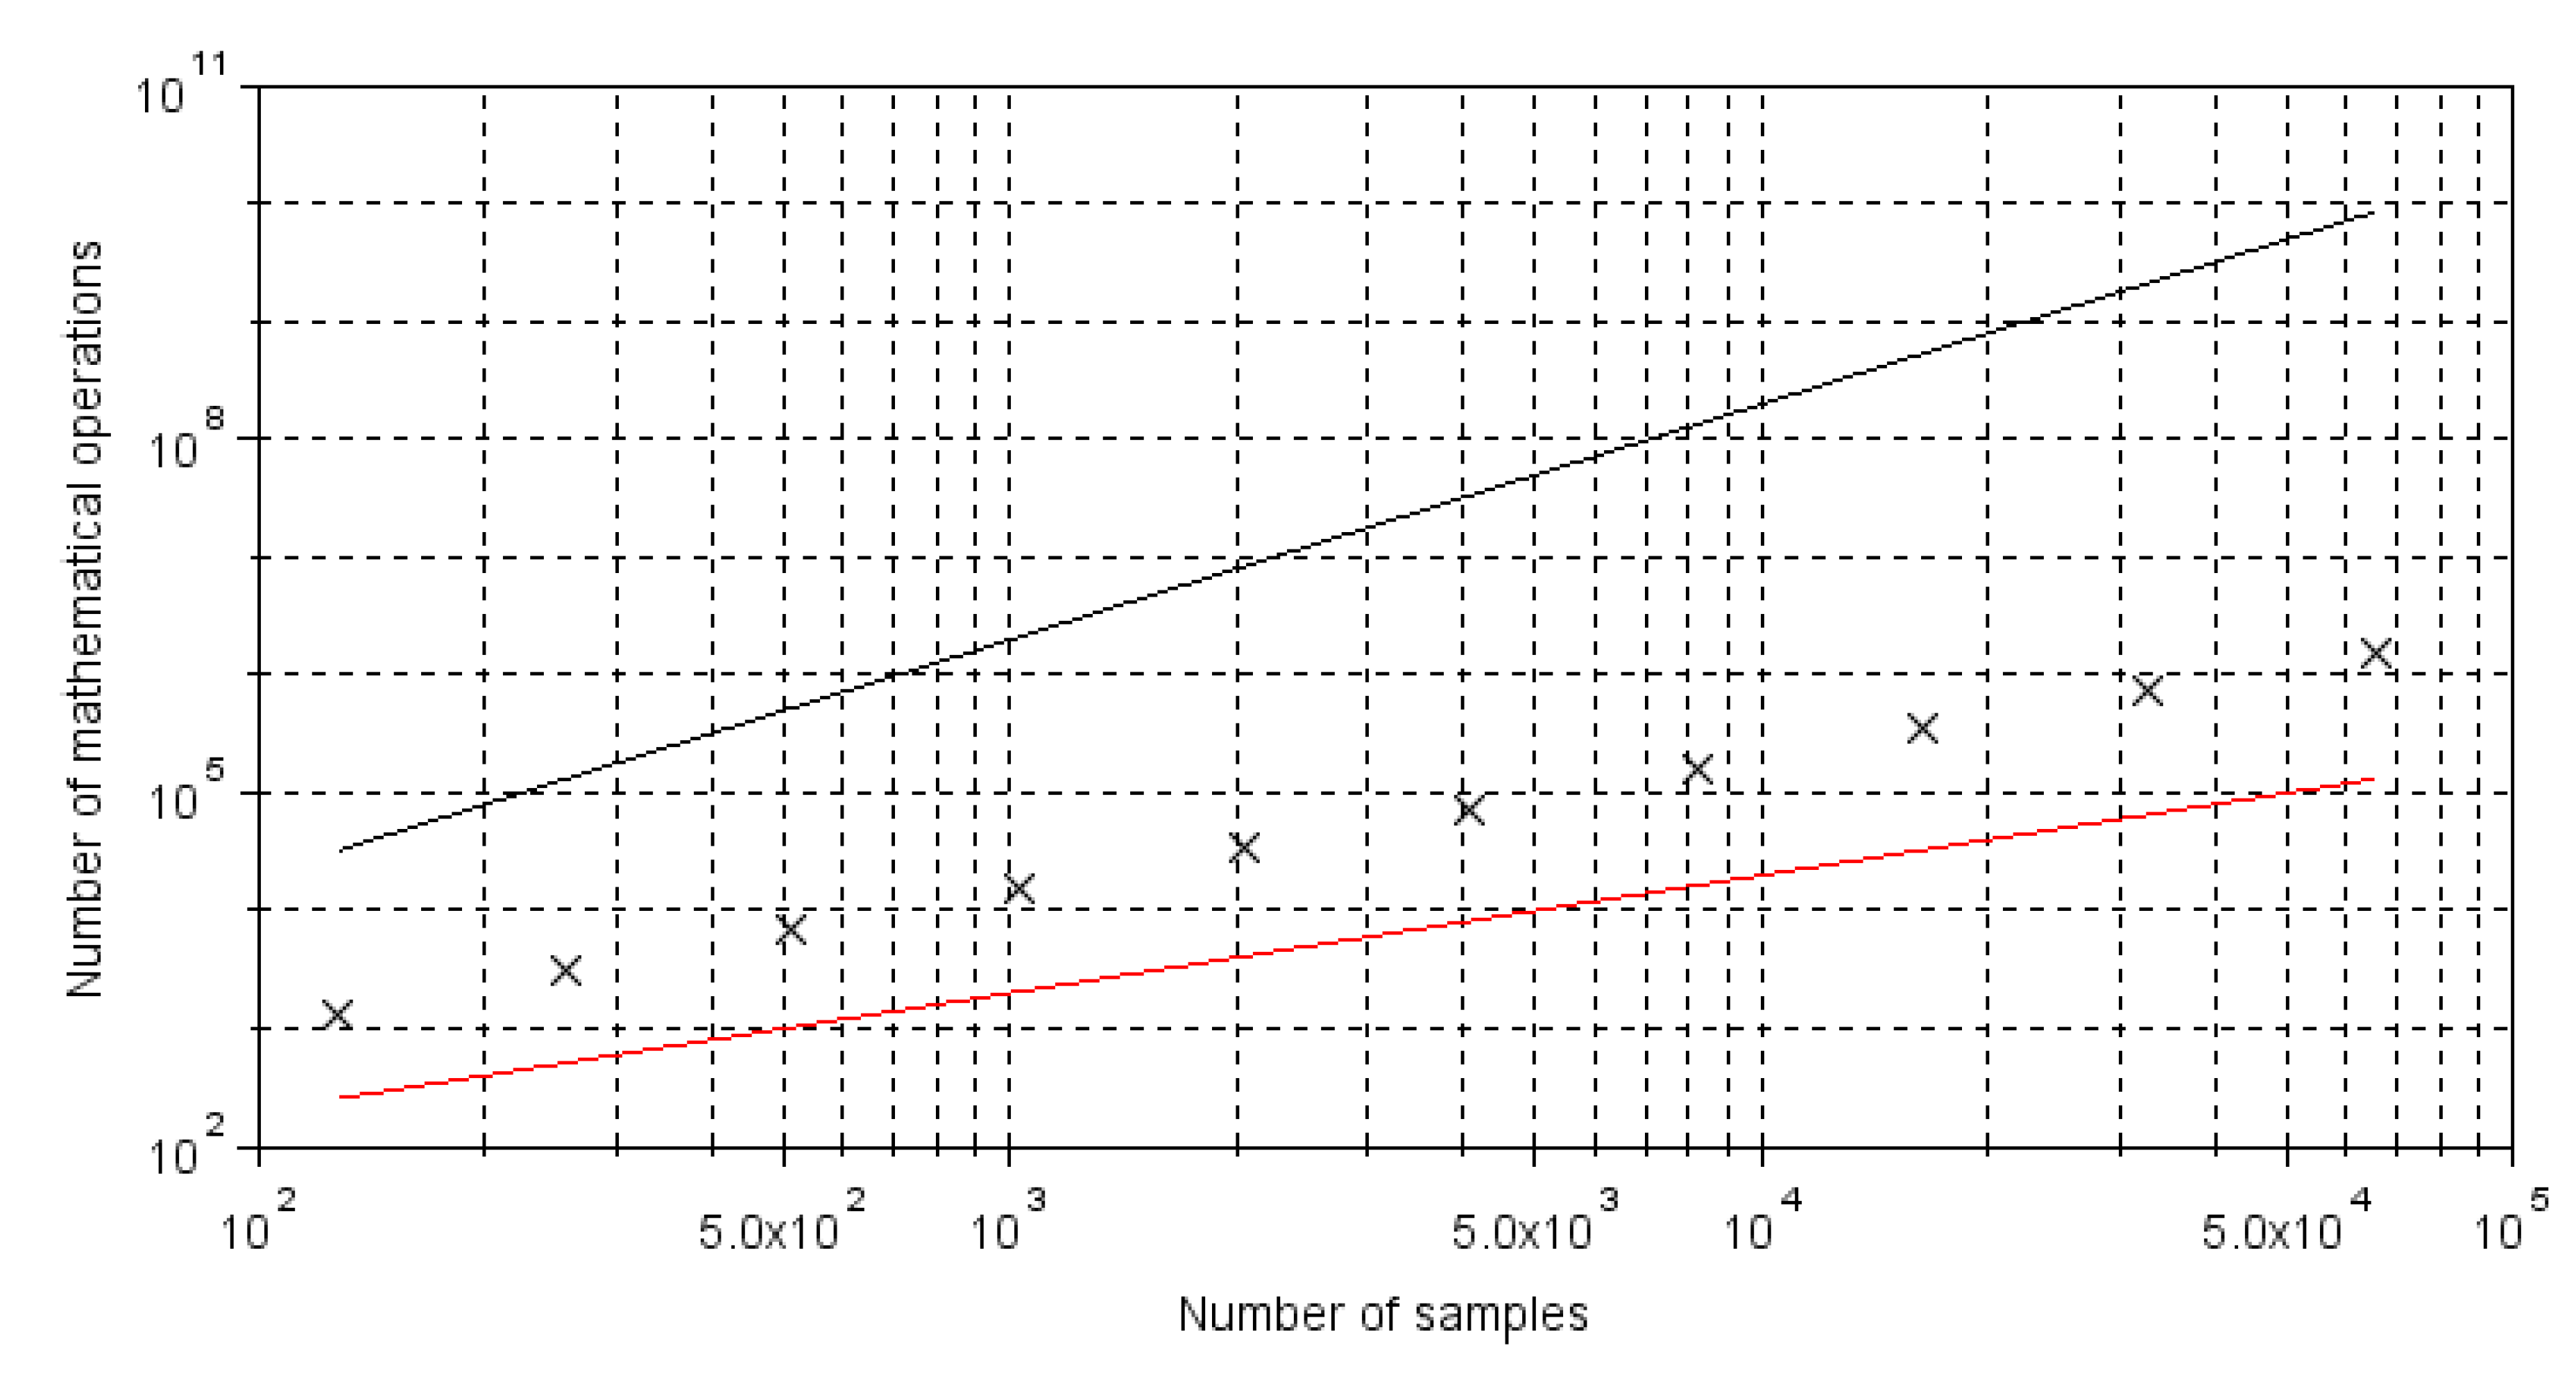
Figure 2 shows a graph of the total number of mathematical operations performed in the mentioned algorithms versus the sample count. These functions are marked as follows: DFT—black line; FFT—crosses (for the radix-2 algorithm, data points are only for numbers of samples, being the power of 2); and incremental decomposition—red line.
As shown in Figure 2, incremental decomposition is less computationally complex than DFT and FFT in terms of the total number of mathematical operations performed, no matter what the sample count is. Fourier transforms works with complex, floating point numbers and incremental decomposition works with real, integer numbers. What is more, the calculation of DFT and FFT requires multiplication, while the calculation of incremental decomposition only requires subtraction and addition, which are faster to execute with low-cost microcontrollers than multiplication and division. The number of samples for incremental decomposition is insignificant, opposite to the FFT, where it must be the power of 2 when using the most popular radix-2 algorithm.

2.4. Test Bench Used to Measure Electric Arcs at Given Parameters

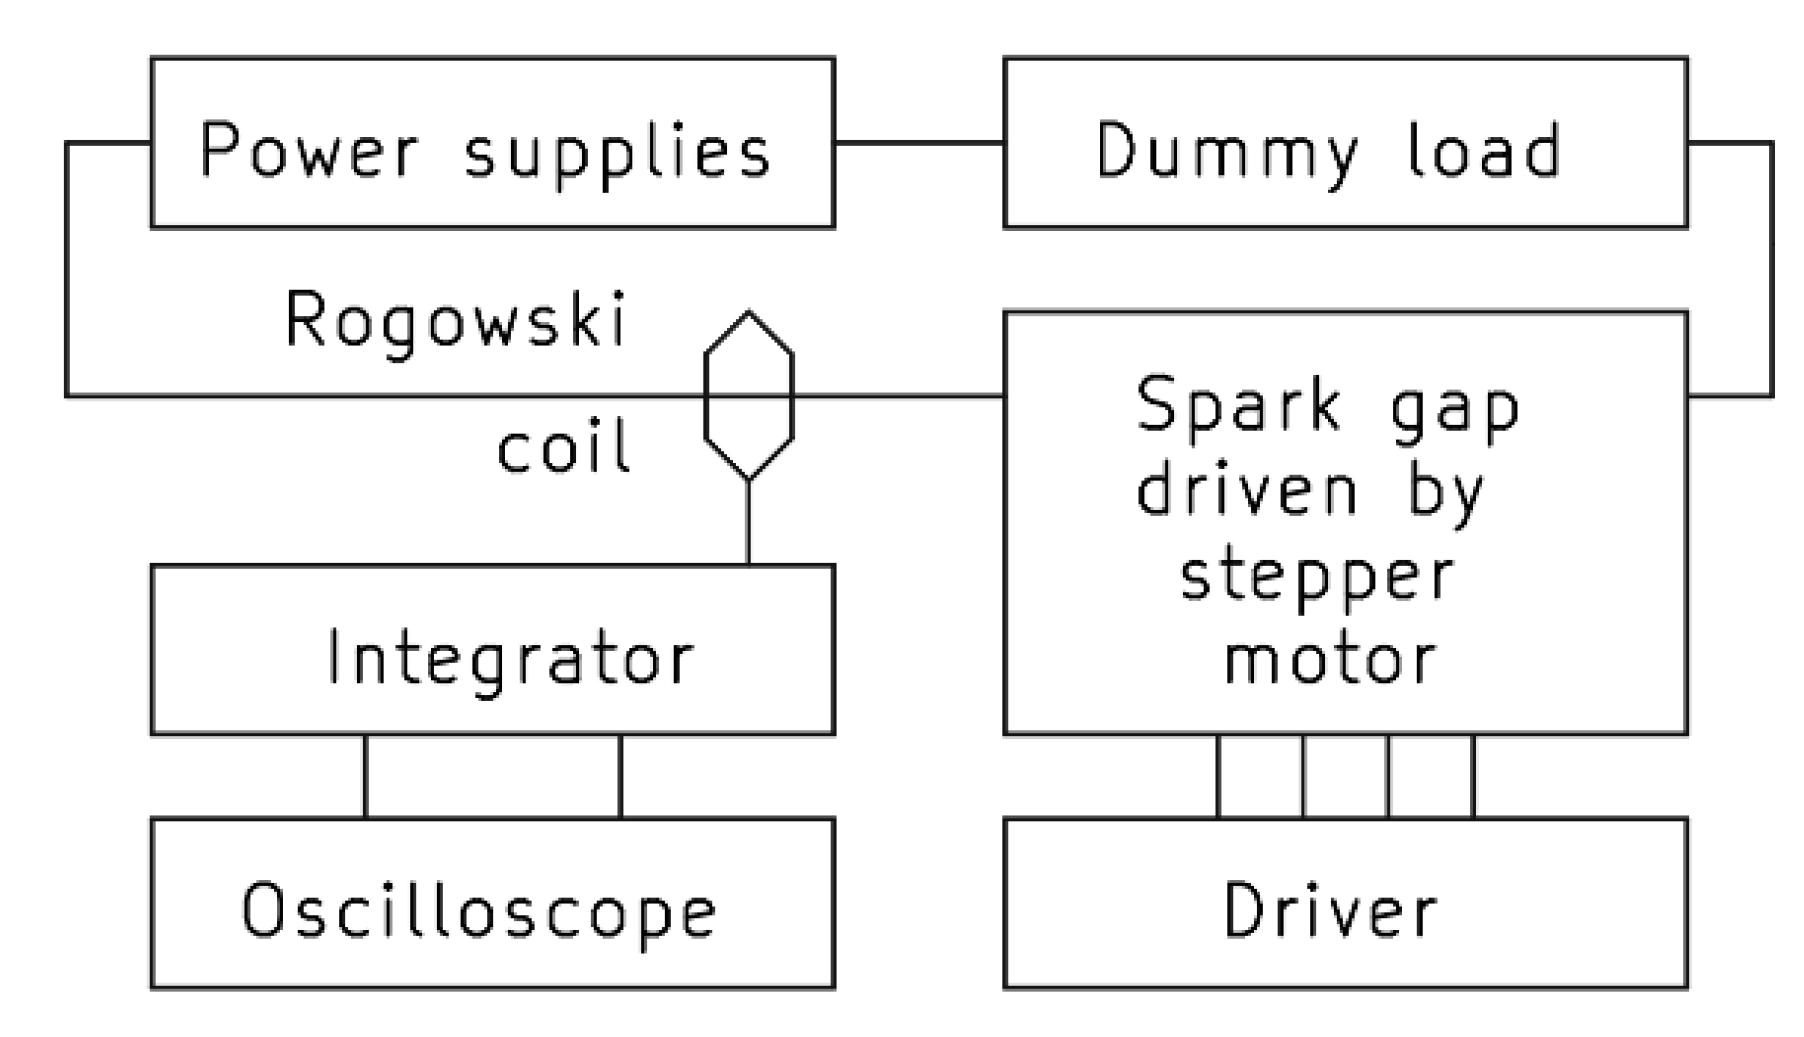
The measurement system can be divided into two subsystems: A first for arc generation and second for acquiring data. Both of them were galvanically separated from each other for safety and noise performance reasons. The first subsystem consisted of power supplies, the dummy load, and a spark gap driven by a stepper motor. The second subsystem included a Rogowski coil with an integrator and an oscilloscope. A block diagram of the whole system is shown in Figure 3 and in a photo in Figure 4.
The power source contained 10 supplies, each with an output voltage of 160 V DC and the maximum current of 1 A, connected in series. Each supply could work as an active power source or as a short, so there was no need to reconfigure any connections to regulate the output voltage. All power supplies were linear, since switched ones may add switching frequency harmonics to the measured spectrum of the arc. The output of the power source included an artificial load connected in series with a spark gap. The artificial load was resistive and contained a reconfigurable circuit of 16 resistors on heatsinks, 100 Ω, 100 W each. The spark gap had two electrodes: One moving and one fixed. The moving electrode was driven by a stepper motor to ensure an accurate distance setting. The available distance was provided in the interval from 0 to 10 mm, with an accuracy of 0.05 mm. The moving electrode was also needed to shorten the circuit and ignite the arc. This ensured the safety of the approach while making measurements, owing to the fact that the spark gap was controlled from the distance to the circuit at a high voltage. The current in the measured circuit was sensed by the Rogowski coil model CWTUM/015/B/1/80 manufactured by PEM. This coil is able to measure signals at frequencies of up to 30 MHz. This high bandwidth was important due to the nature of the electric arc, whose bandwidth is easier to distinguish from the background noise at higher frequencies. The oscilloscope used to capture waveforms from the integrator of the coil covers a much higher bandwidth and has the memory depth of 40 Mpts.
All measurements were taken at different parameters of the arc. One measurement is defined as a continuous signal covering 100,000 samples from the oscilloscope at the sampling rate of 500 MS/s. Measurements were divided into four series:
  • Ten control measurements without an arc (conditions: shorted spark gap and current of 500 mA DC at each measurement);
  • Ten measurements at different voltages regulated in steps from 160 V to 1.6 kV DC (conditions: 1 mm gap between electrodes and current of 900 mA DC at each measurement);
  • Ten measurements at different loads regulated in steps from 700 Ω to 1.6 kΩ (conditions: 1 mm gap between electrodes and voltage of 800 V DC at each measurement);
  • Ten measurements at different gaps between electrodes regulated in steps from 1 mm to 1 cm (conditions: voltage of 1.6 kV DC and current of 1 A DC at each measurement).
All of the measurements in each of the series were repeated ten or more times to check whether they were repeatable. Next, one of the measurements for each of the conditions was selected randomly and taken into consideration as the final tens in each of the series. The results were not averaged in any way. A boxcar window was used for all of the measurements, as it does not require any additional processing of data (multiplying by the window), so it is the best solution for the fastest arc detection algorithm.

3. Results

All analyses in this chapter for both FFT and incremental decomposition were performed using the same sets of data, described in Section 2.4, for an exact comparison of the two algorithms. All of the charts in this chapter were generated using Scilab.

3.1. Analyses of Measurements Using FFT

3.1.1. Analysis of Measurements at the Window Width of 100 kpts

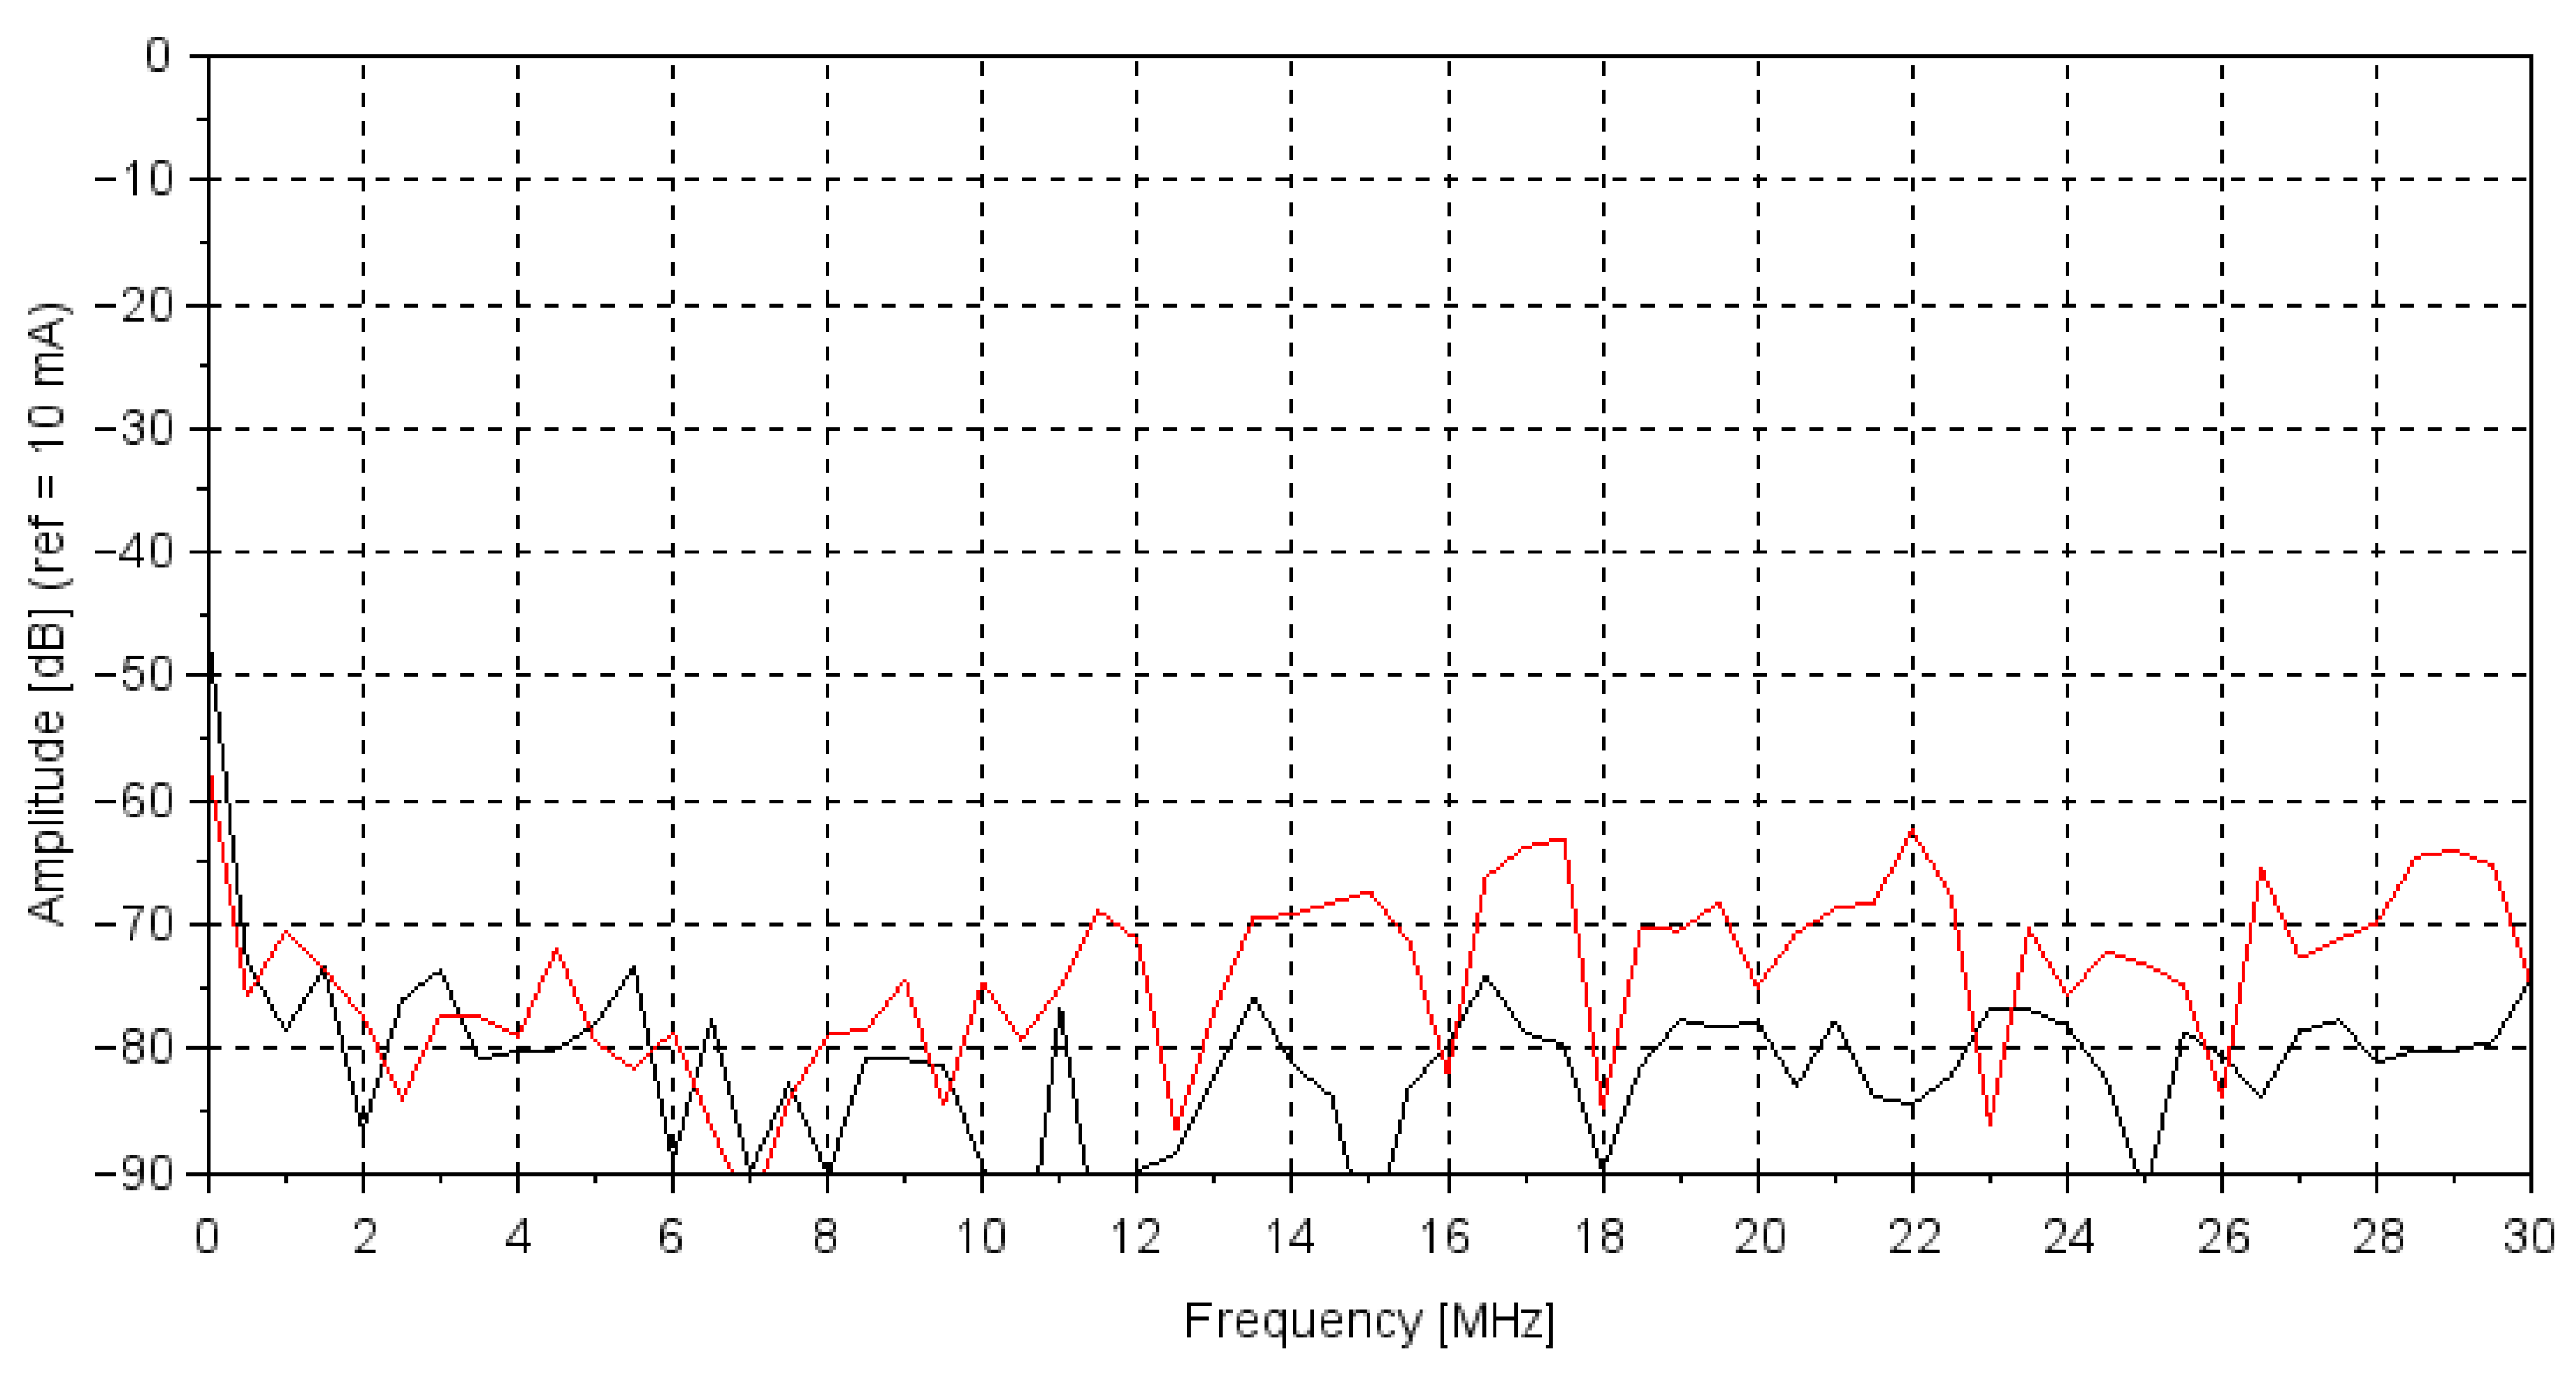
Frequency spectra of all measurements mentioned in Section 2.4 were calculated using FFT (500 MS/s, boxcar window). The obtained frequency spectra showed that there are no differences between their shapes at various voltages, various loads, or various distances between electrodes. The shape of the spectrum only changes when there is no arc and while arcing, so it is possible to detect whether the arc has occurred using FFT. Figure 5 shows two frequency spectra. The first, marked in black, was taken while there was no arc in the circuit, and the second, marked in red, was taken with arcing present in the circuit.

3.1.2. Analysis of Measurements at the Window Width of 1 kpts

The spectra obtained at the window width of 1 kpts (500 MS/s, boxcar window) also showed that differences between signals can only occur during arcing and when there is no arcing. The voltage, load, or length of the arc has no impact. Figure 6 shows two frequency spectra. The one marked in black was taken while there was no arcing, and the one marked in red was taken while there was arcing. Since the window width was only 1 kpts, the frequency resolution of FFT dropped from 5 to 500 kHz.

3.2. Analyses of Measurements Using Incremental Decomposition

As opposed to the FFT, which is a type of frequency-domain analysis, incremental decomposition might be considered as a time-domain analysis. This eliminates the problem of choosing an appropriate frequency spectrum, where the arc introduces the most harmonics with reference to the noise, which is normally present there. The FFT also has one huge drawback, i.e., random spikes in the signal pull the whole spectrum up in amplitude. In incremental decomposition, it will only show up as one high value increment, without disturbing the rest of the decomposition. All incremental decompositions presented in this chapter were calculated using the measurements mentioned in Section 2.4.

3.2.1. Analysis of Measurements at the Window Width of 100 kpts

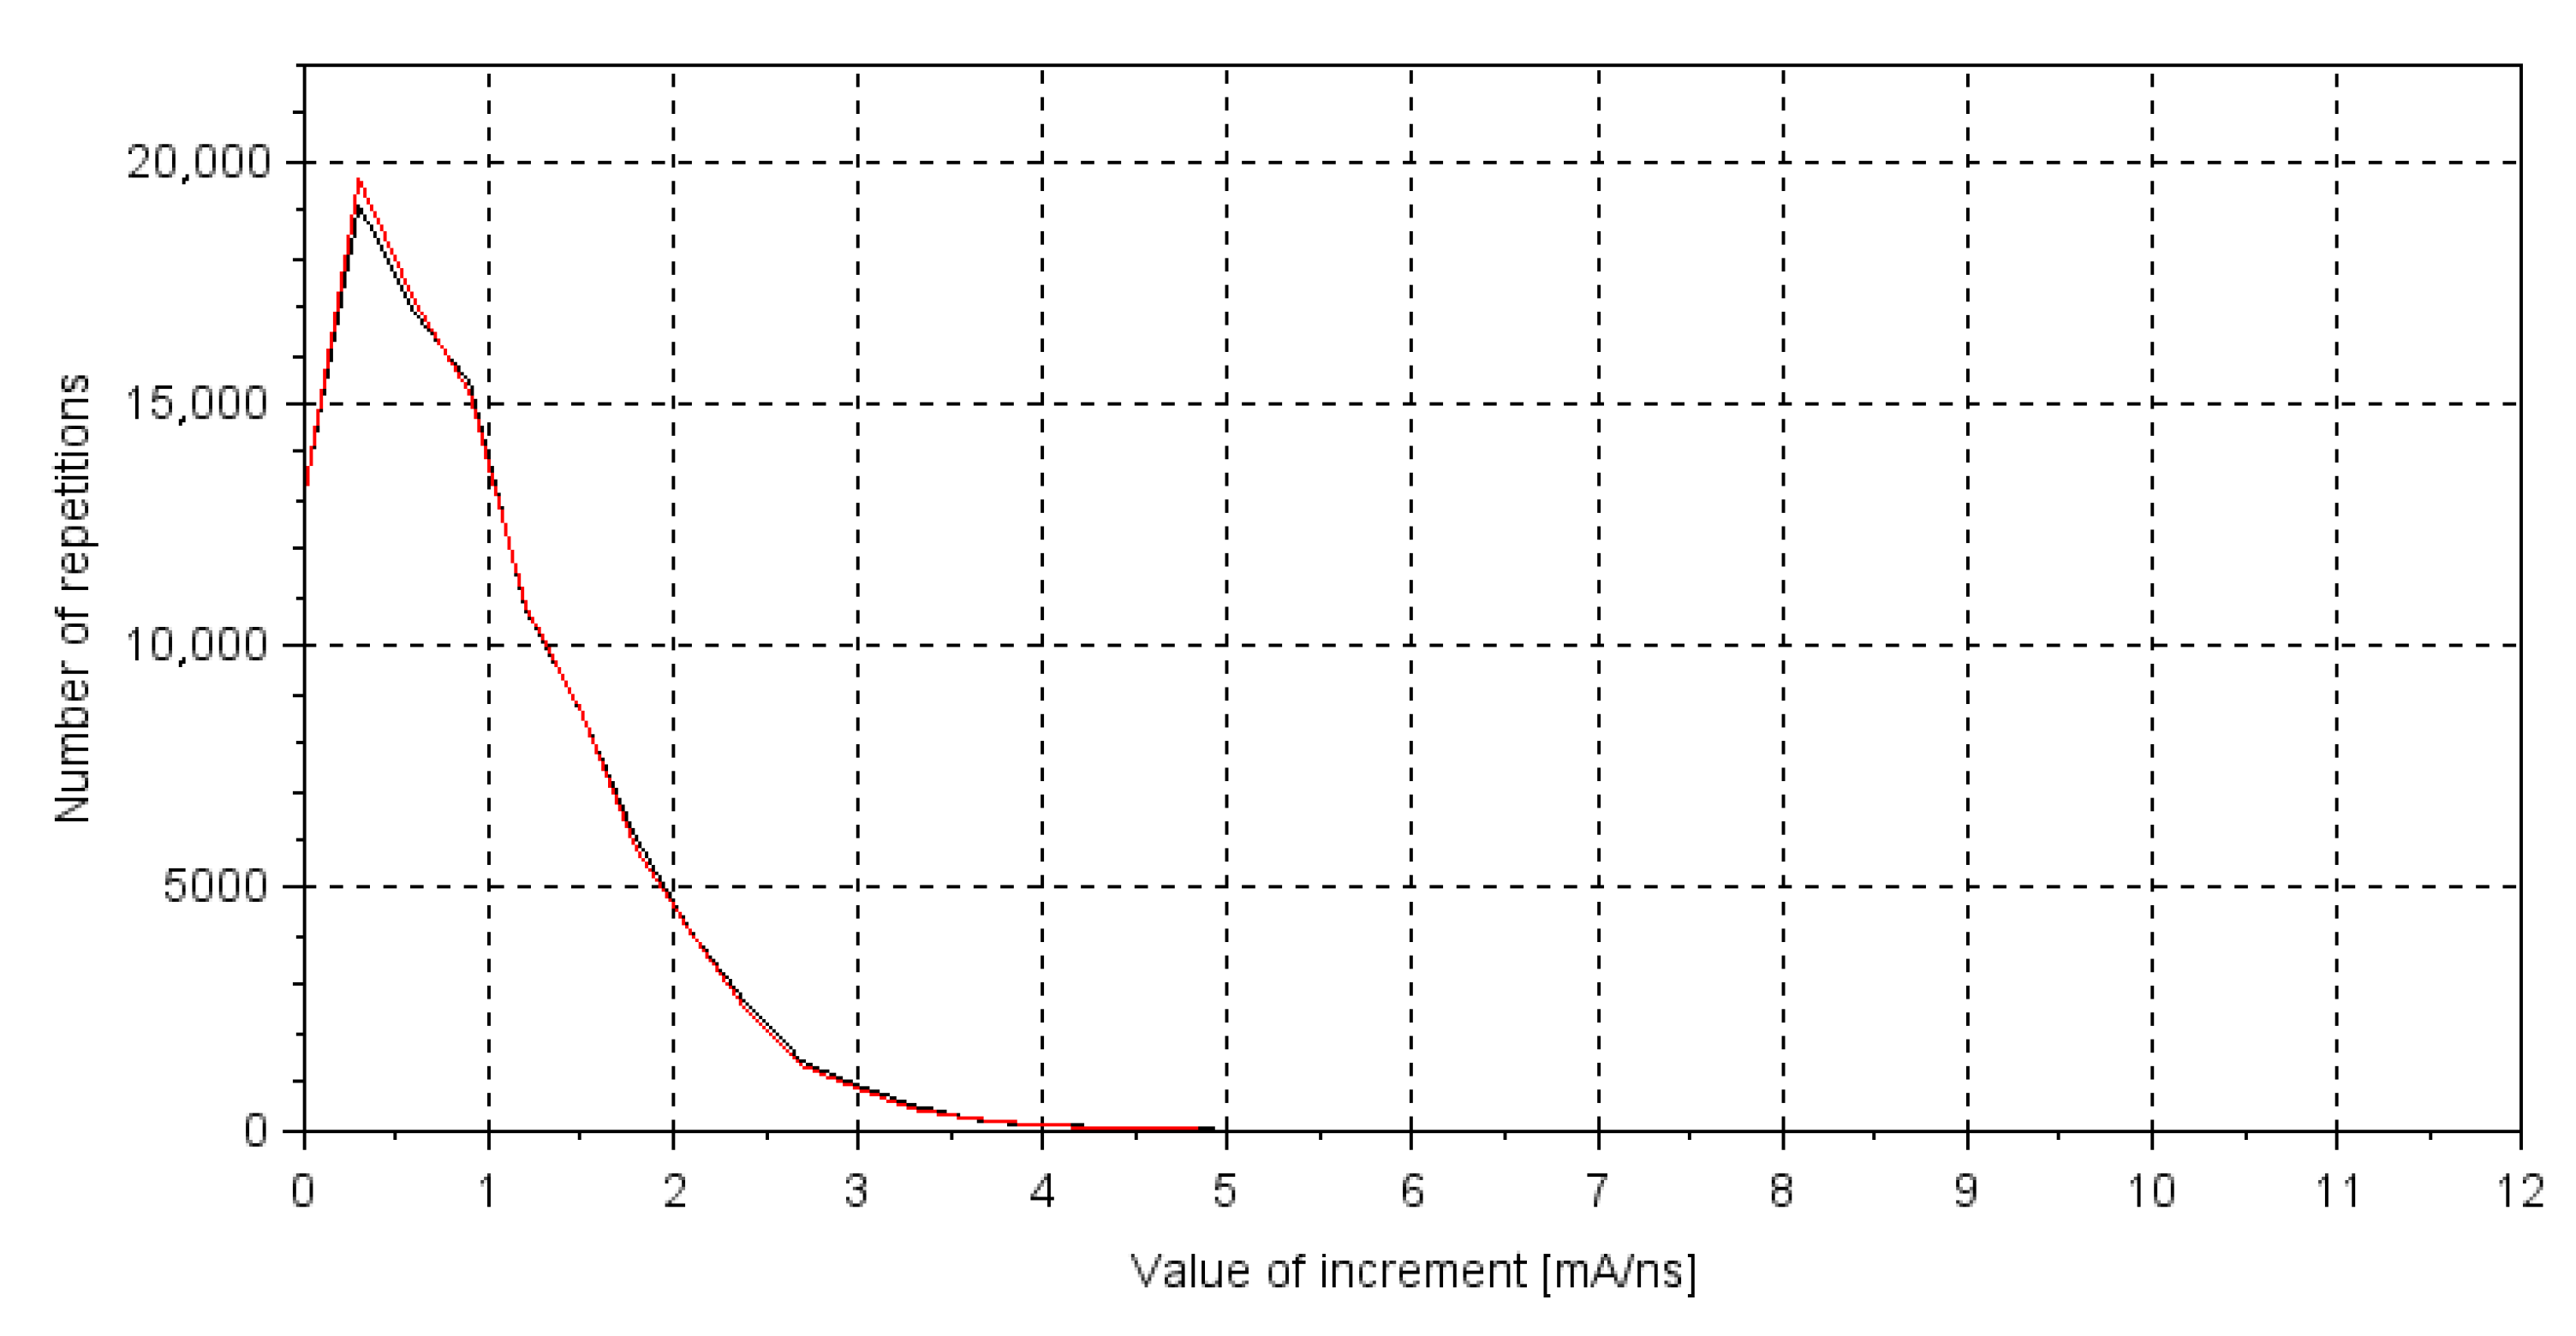
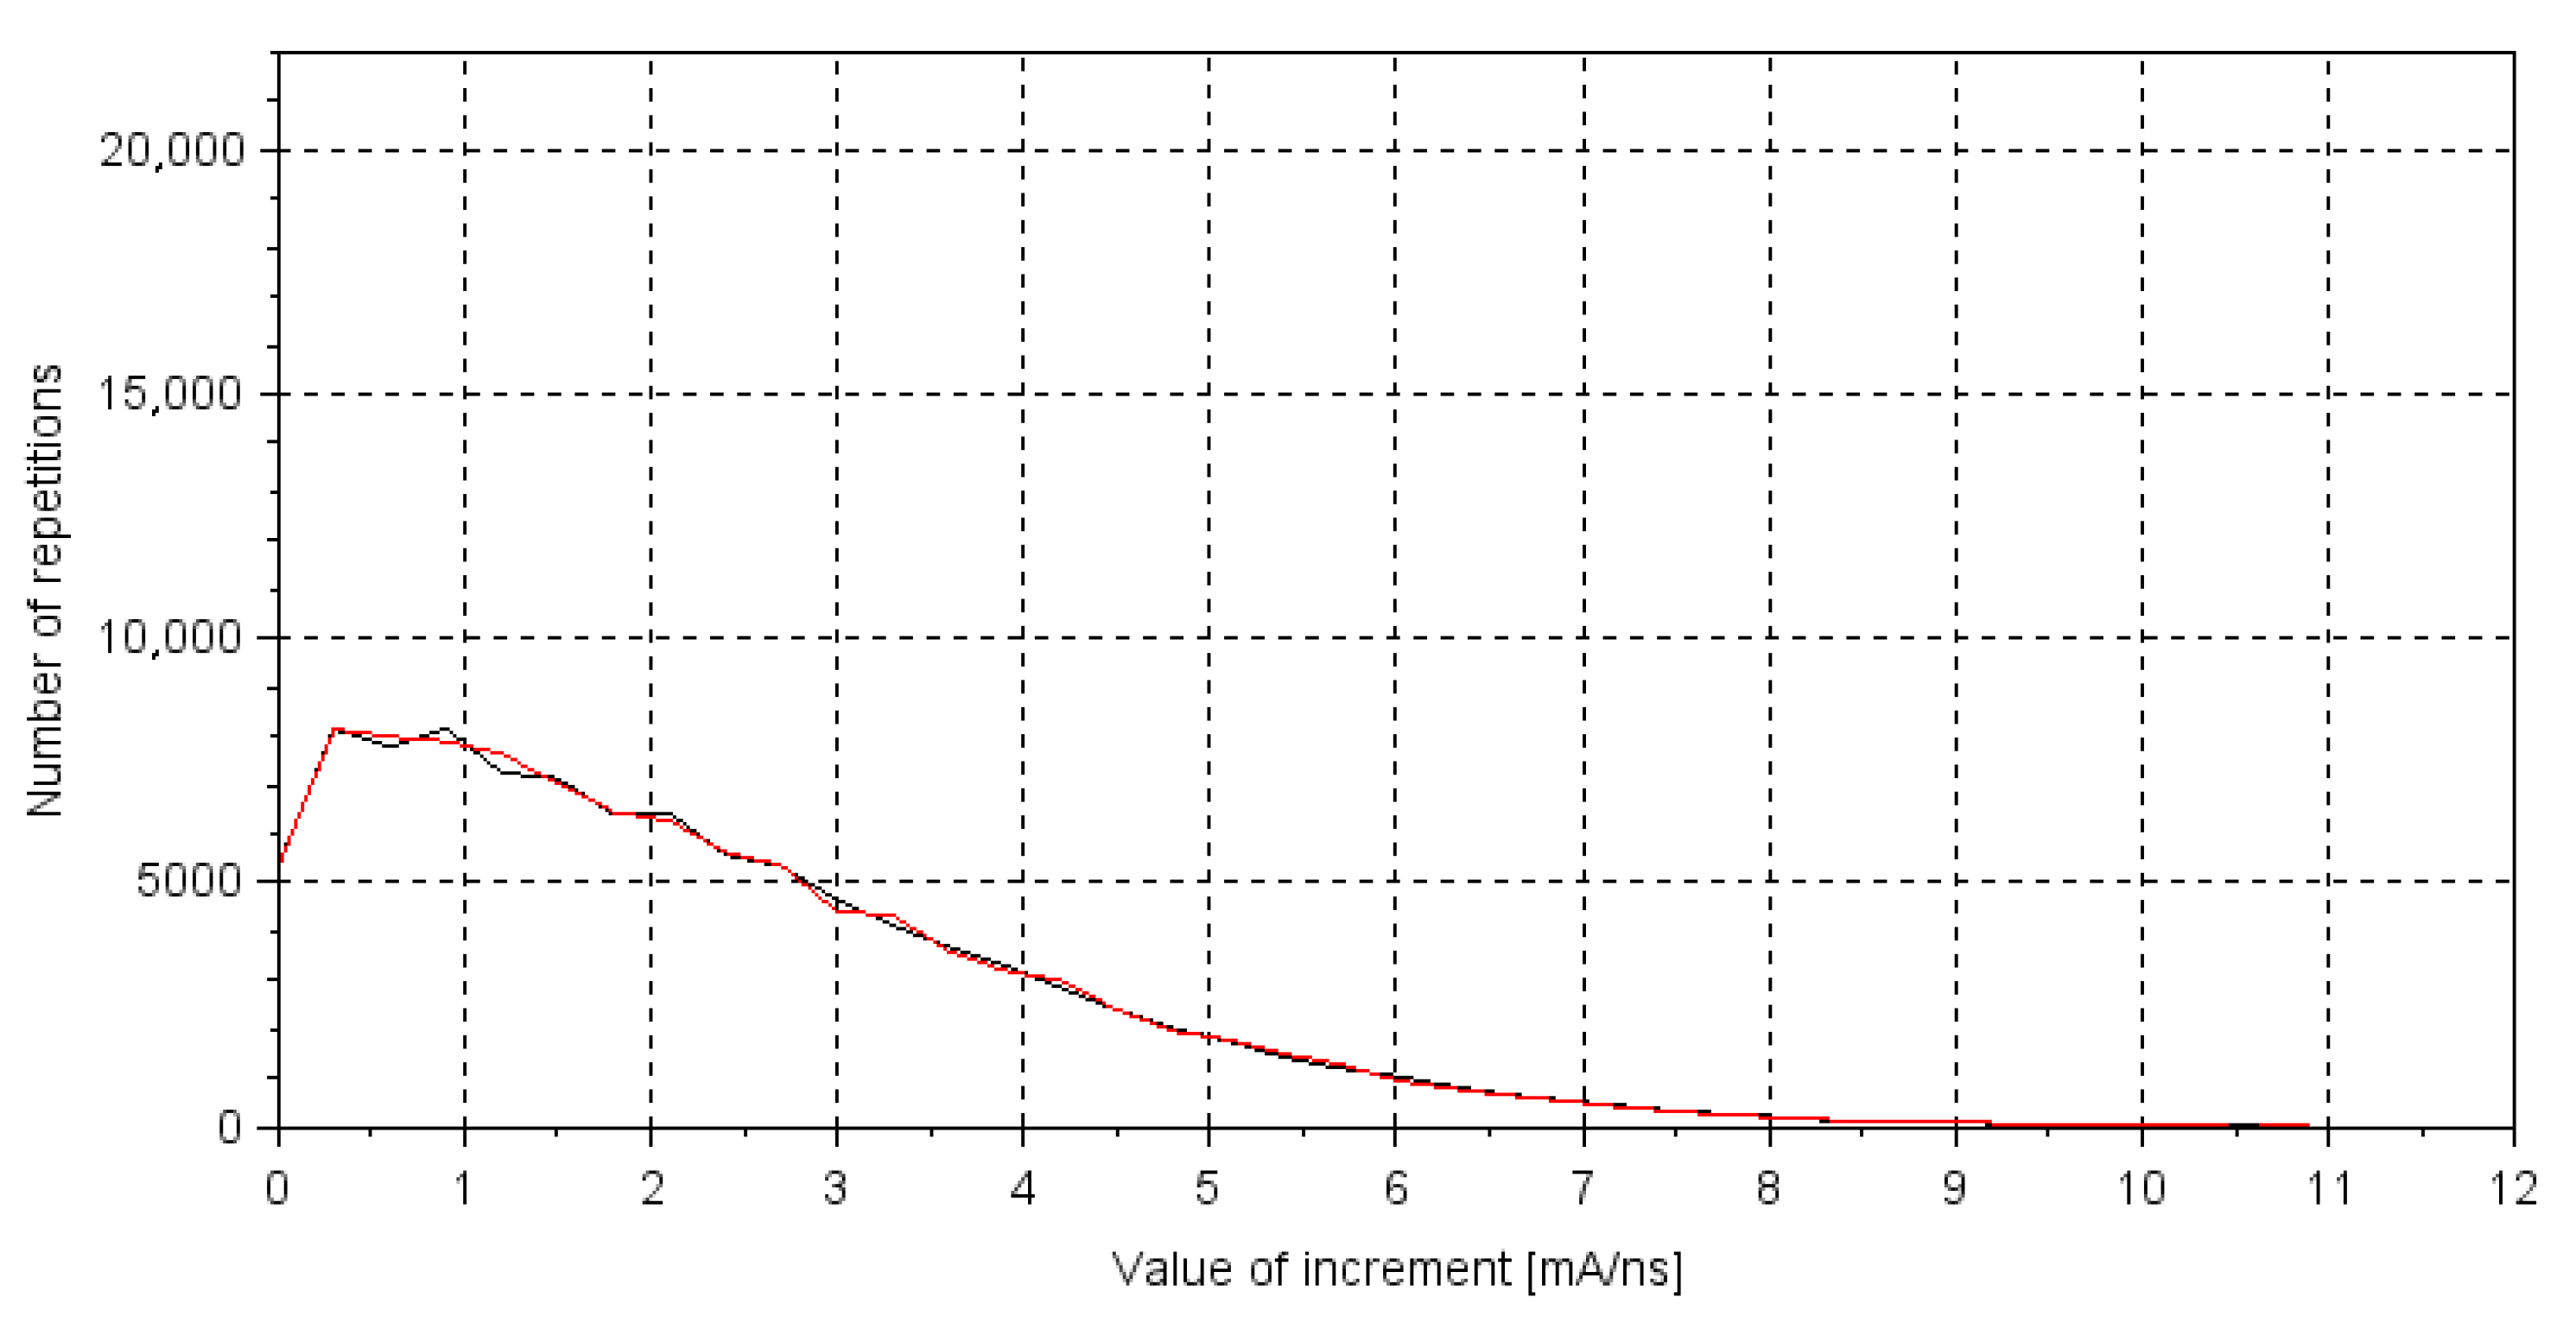
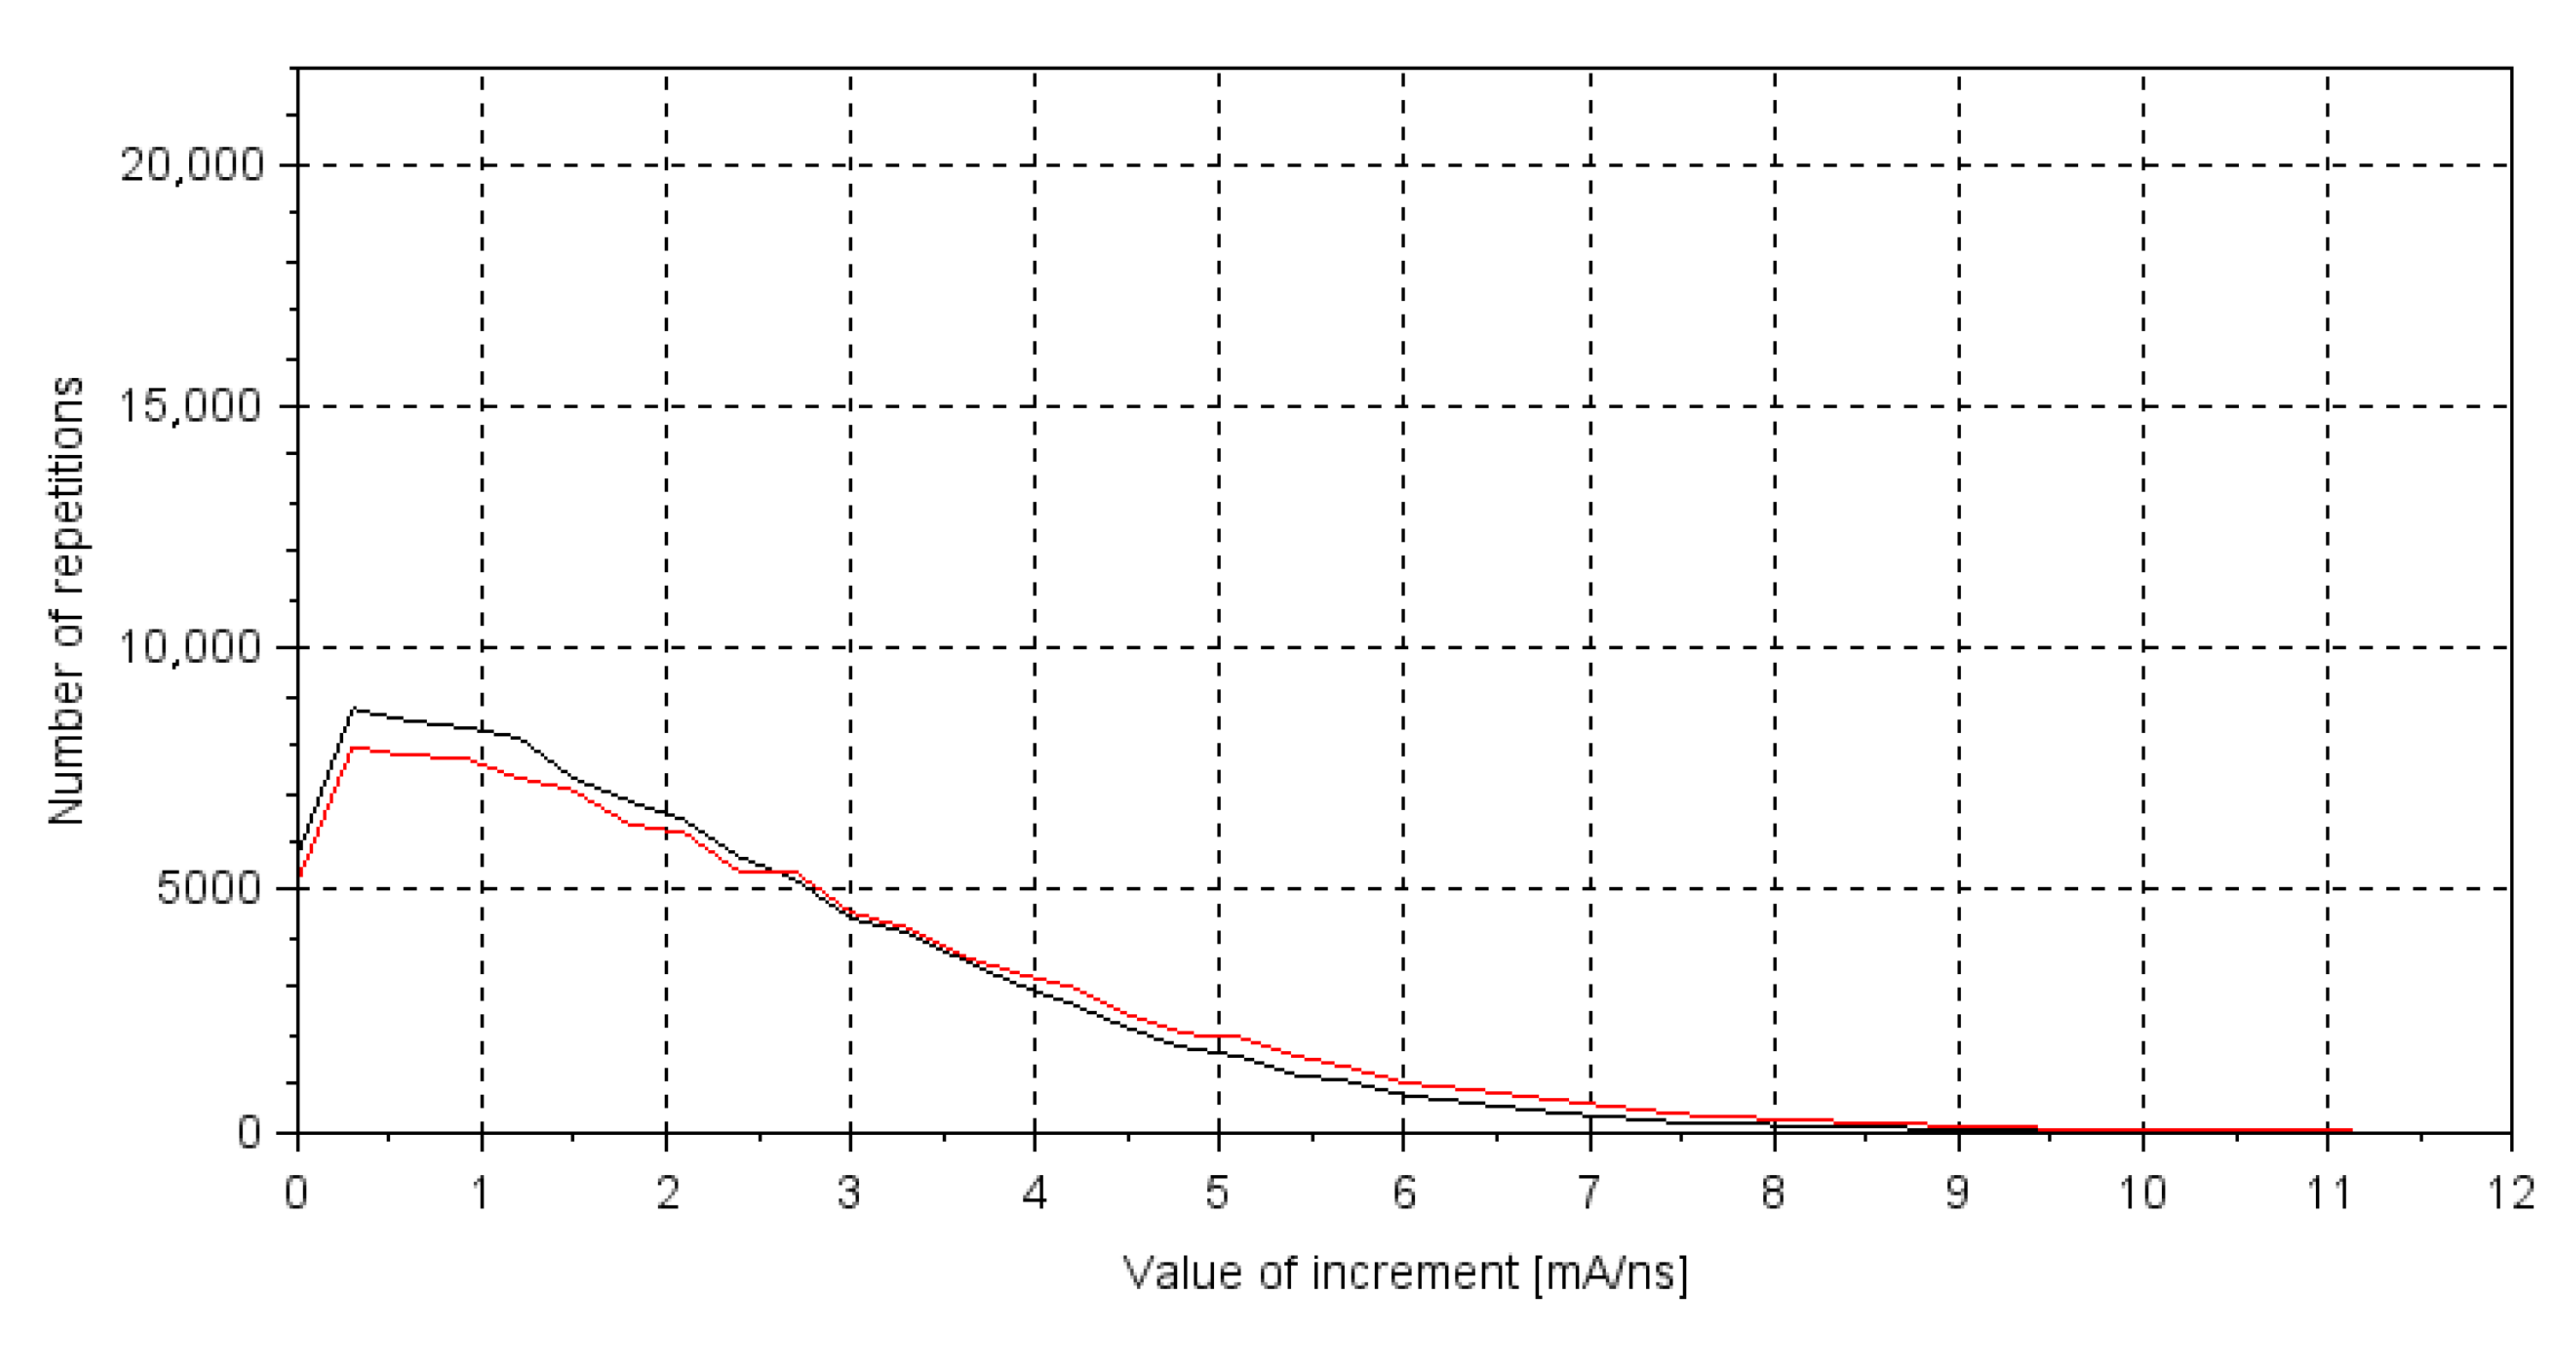
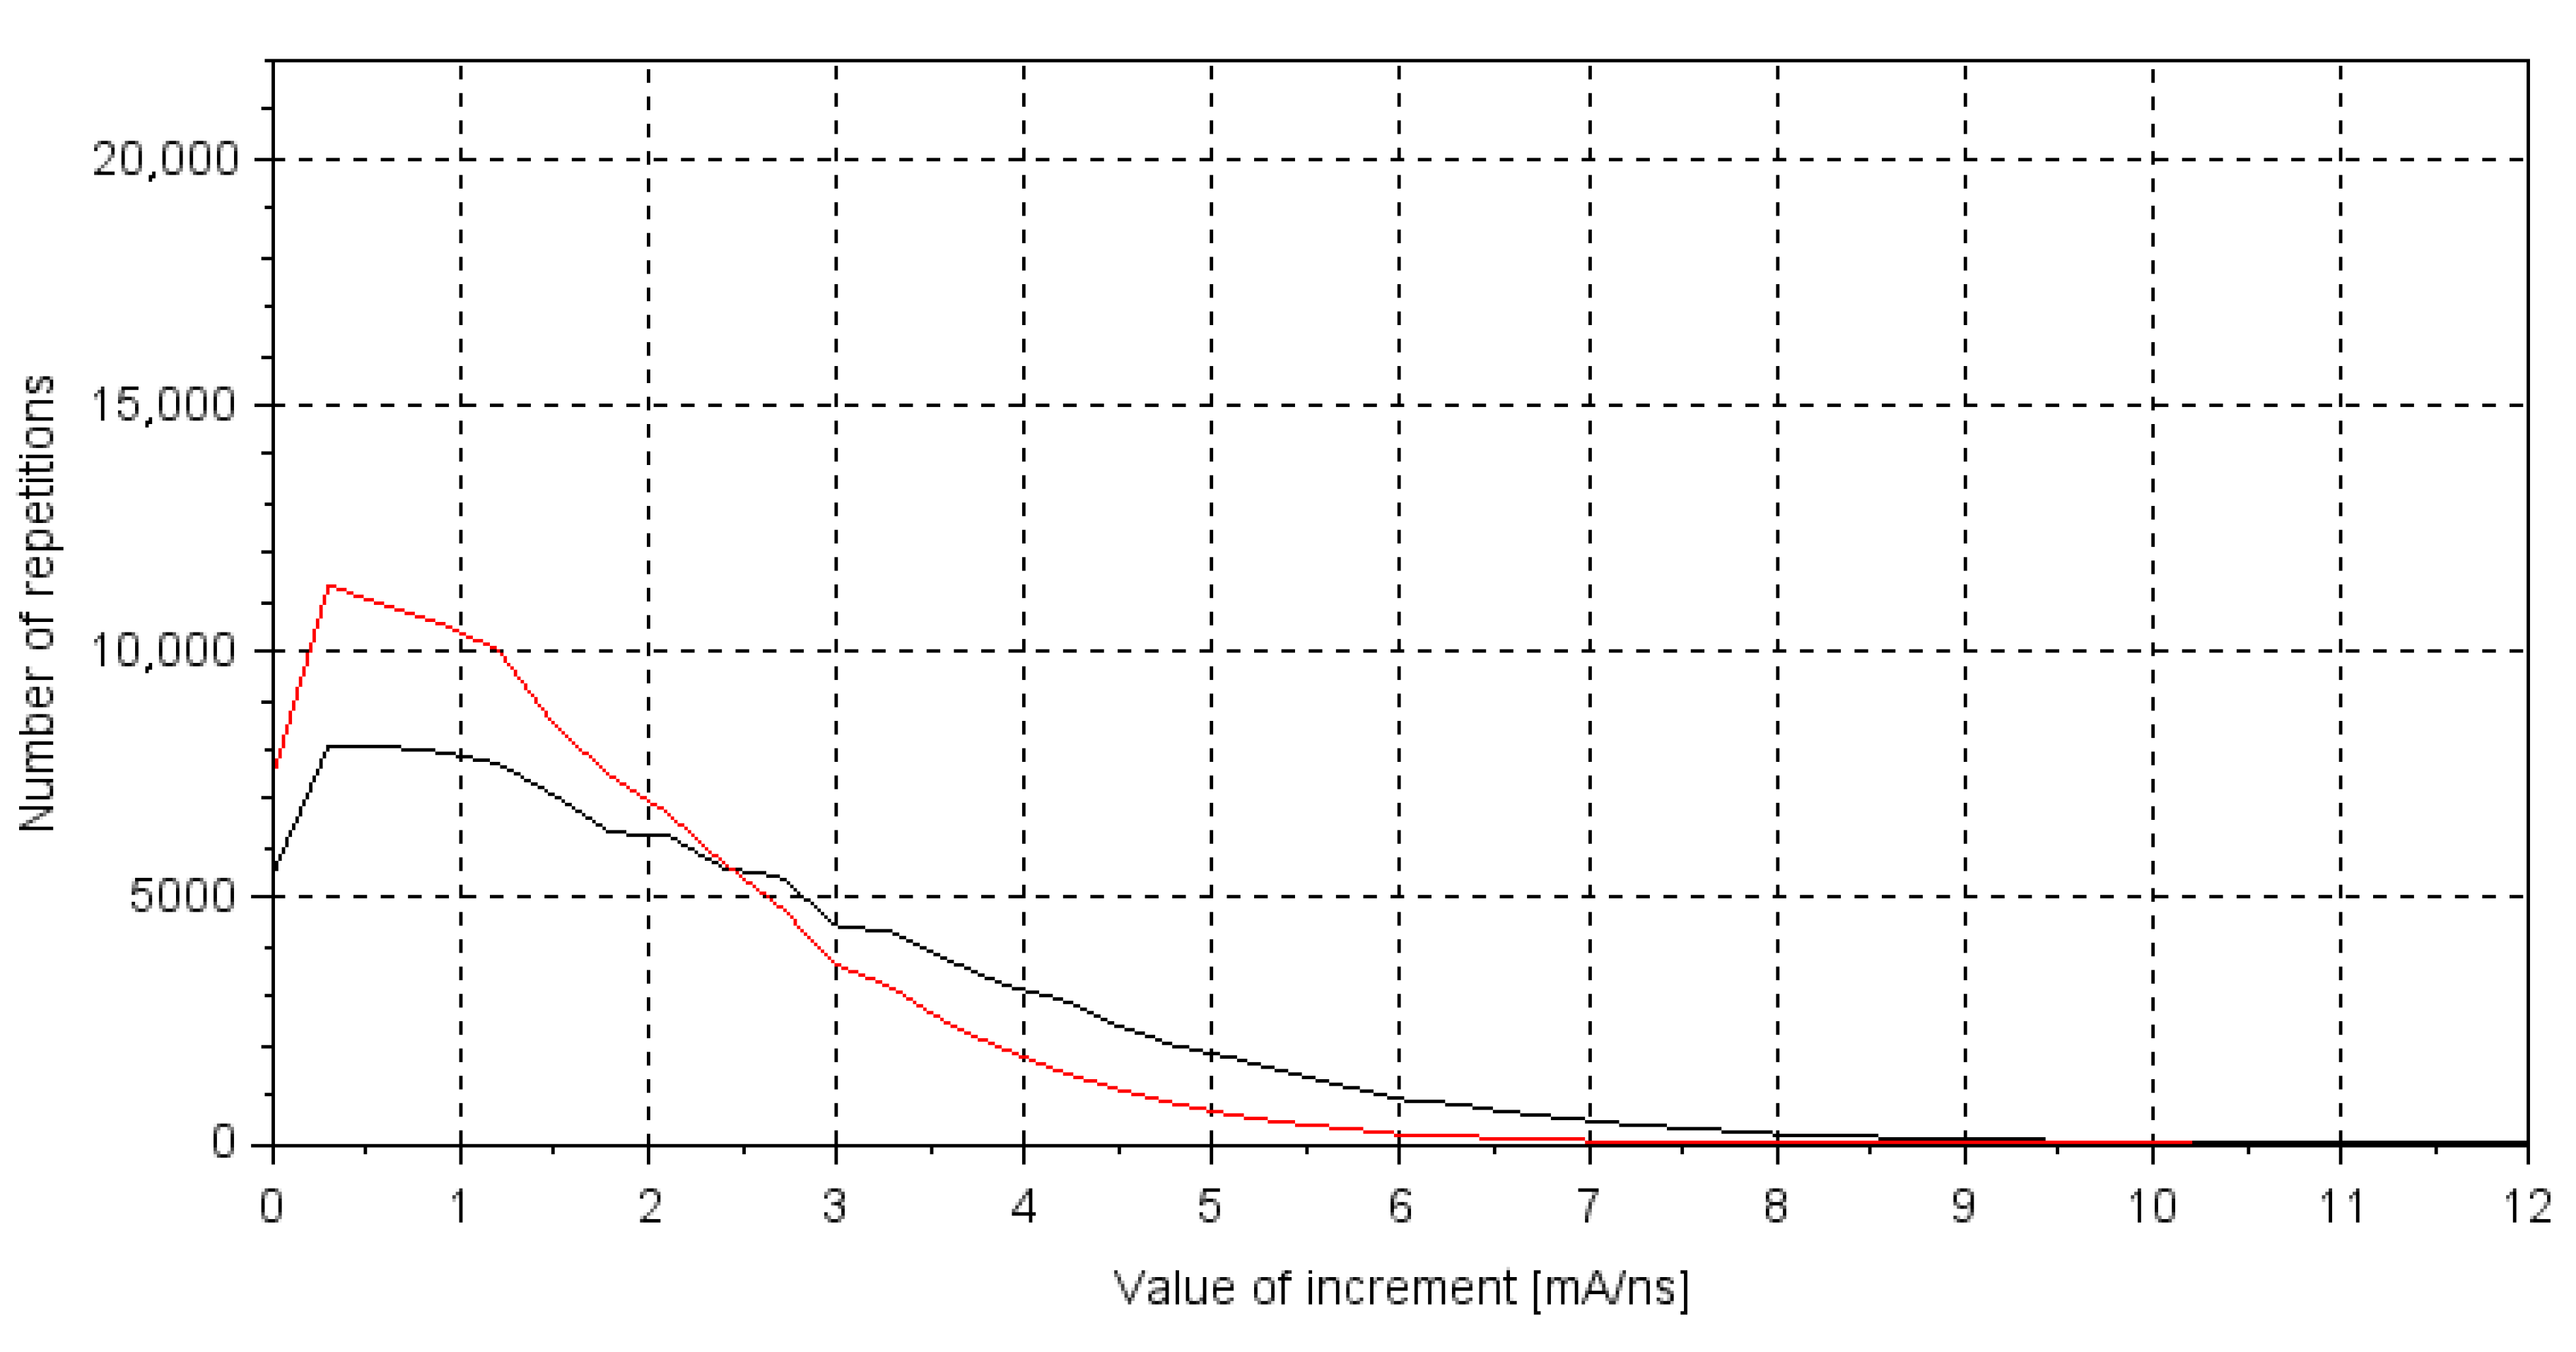
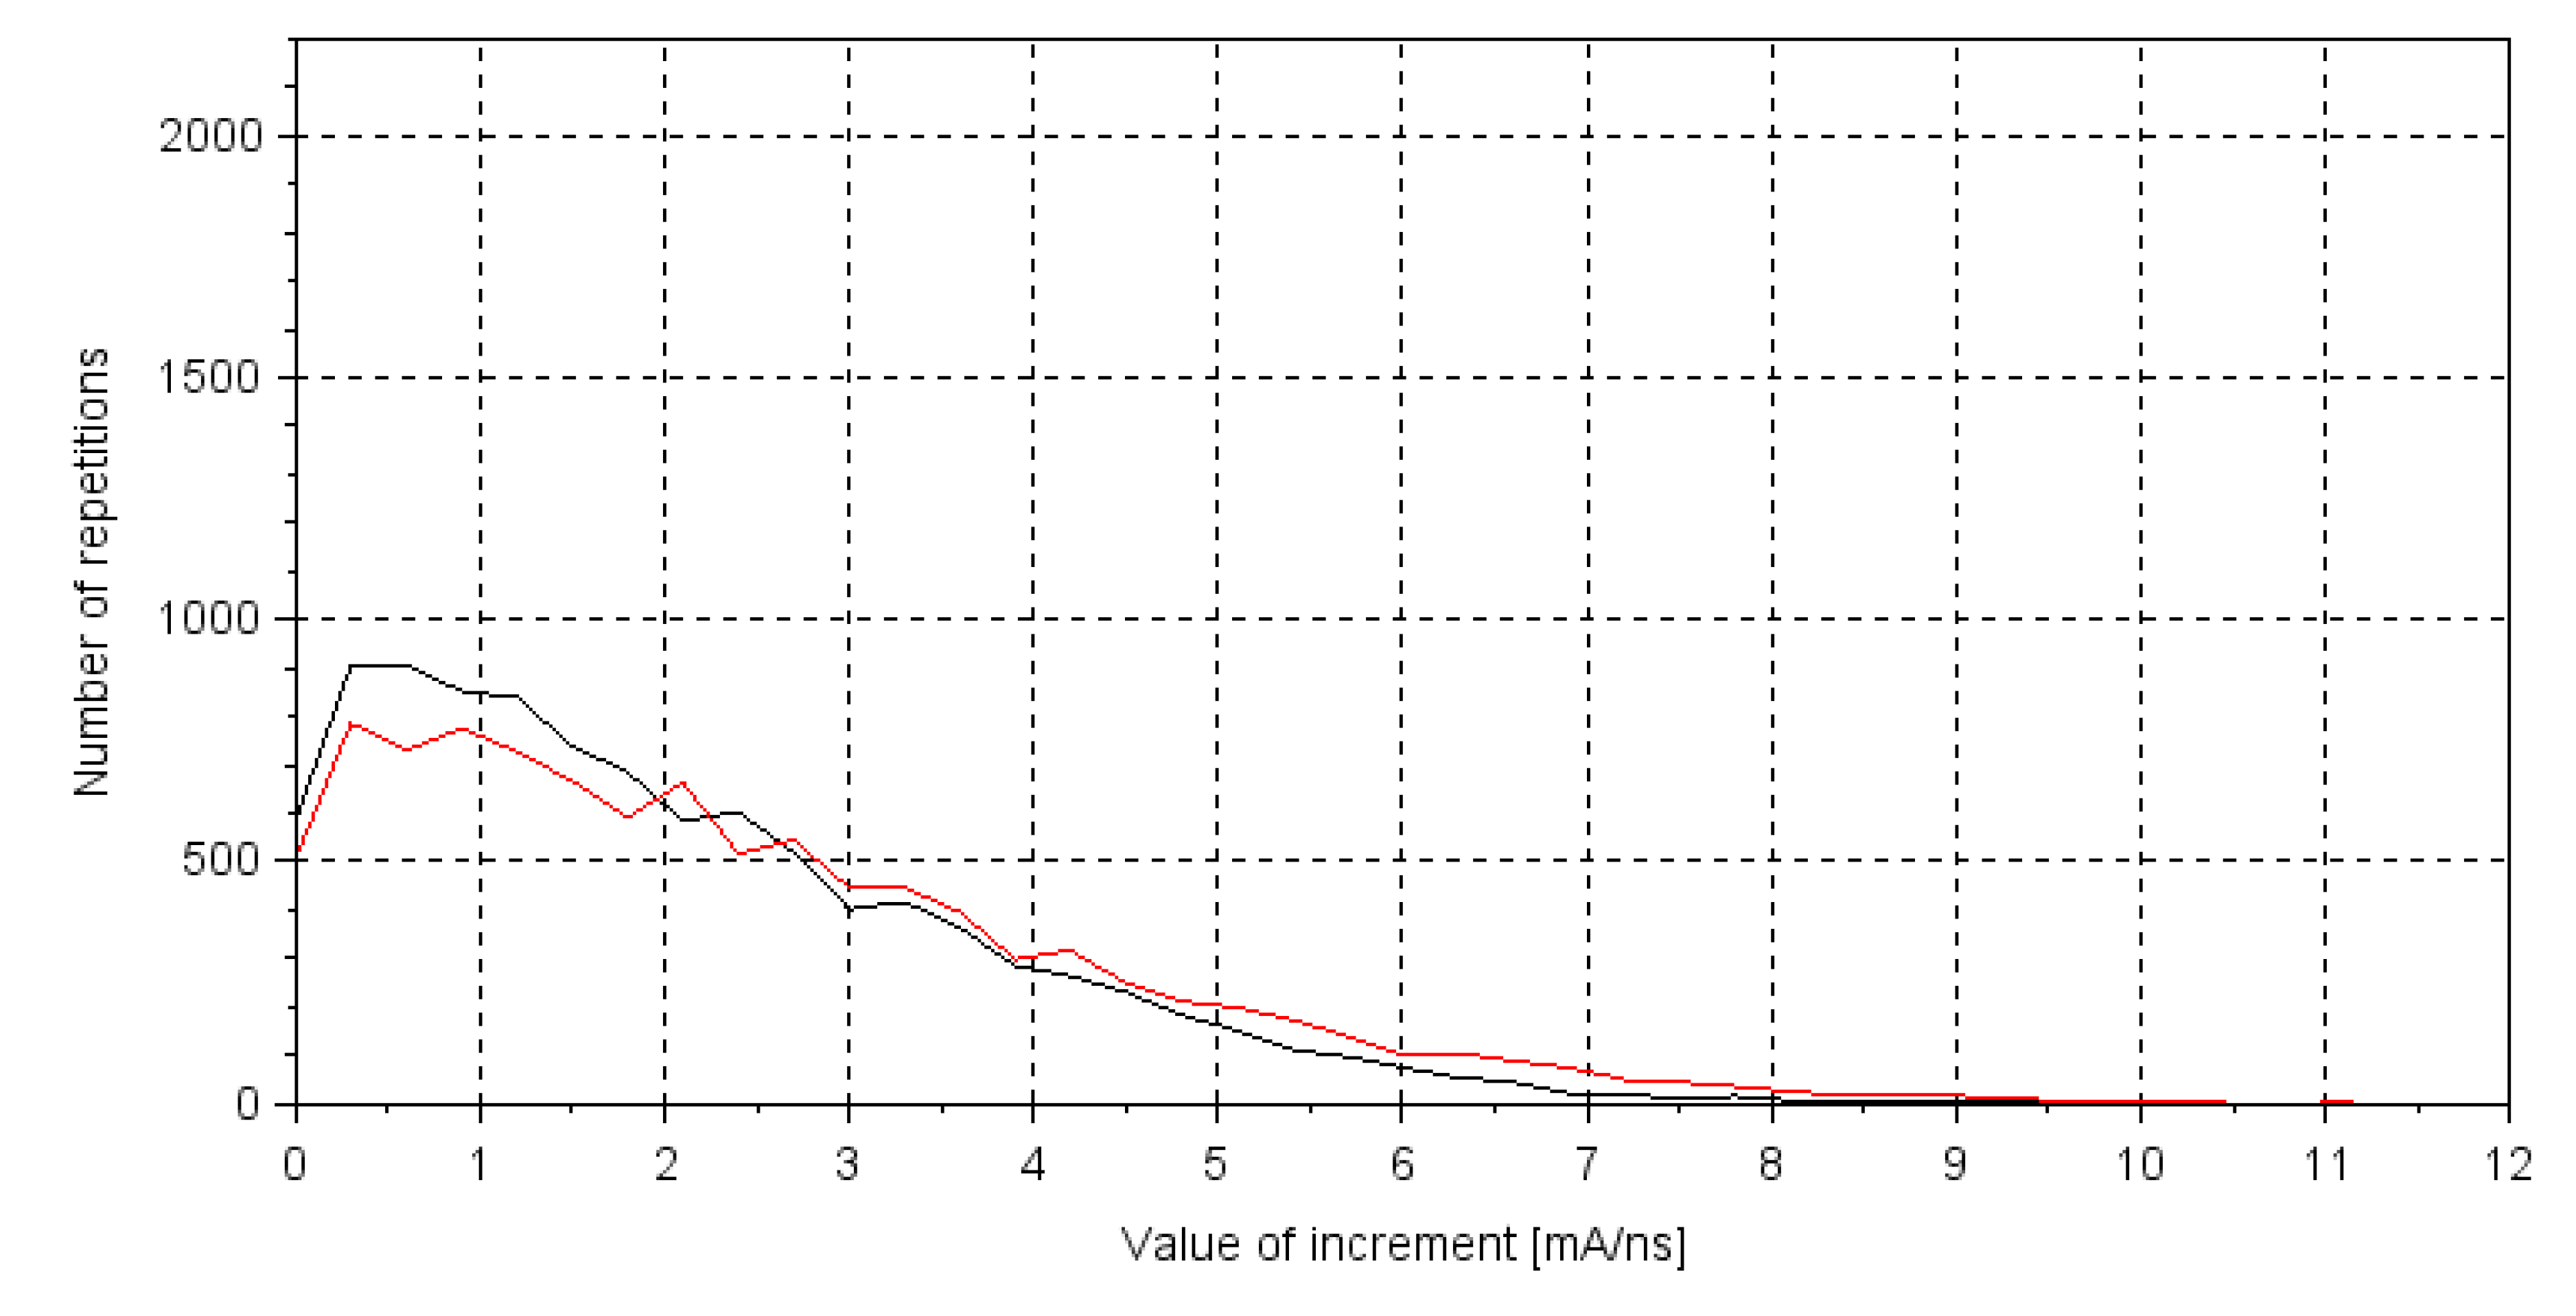
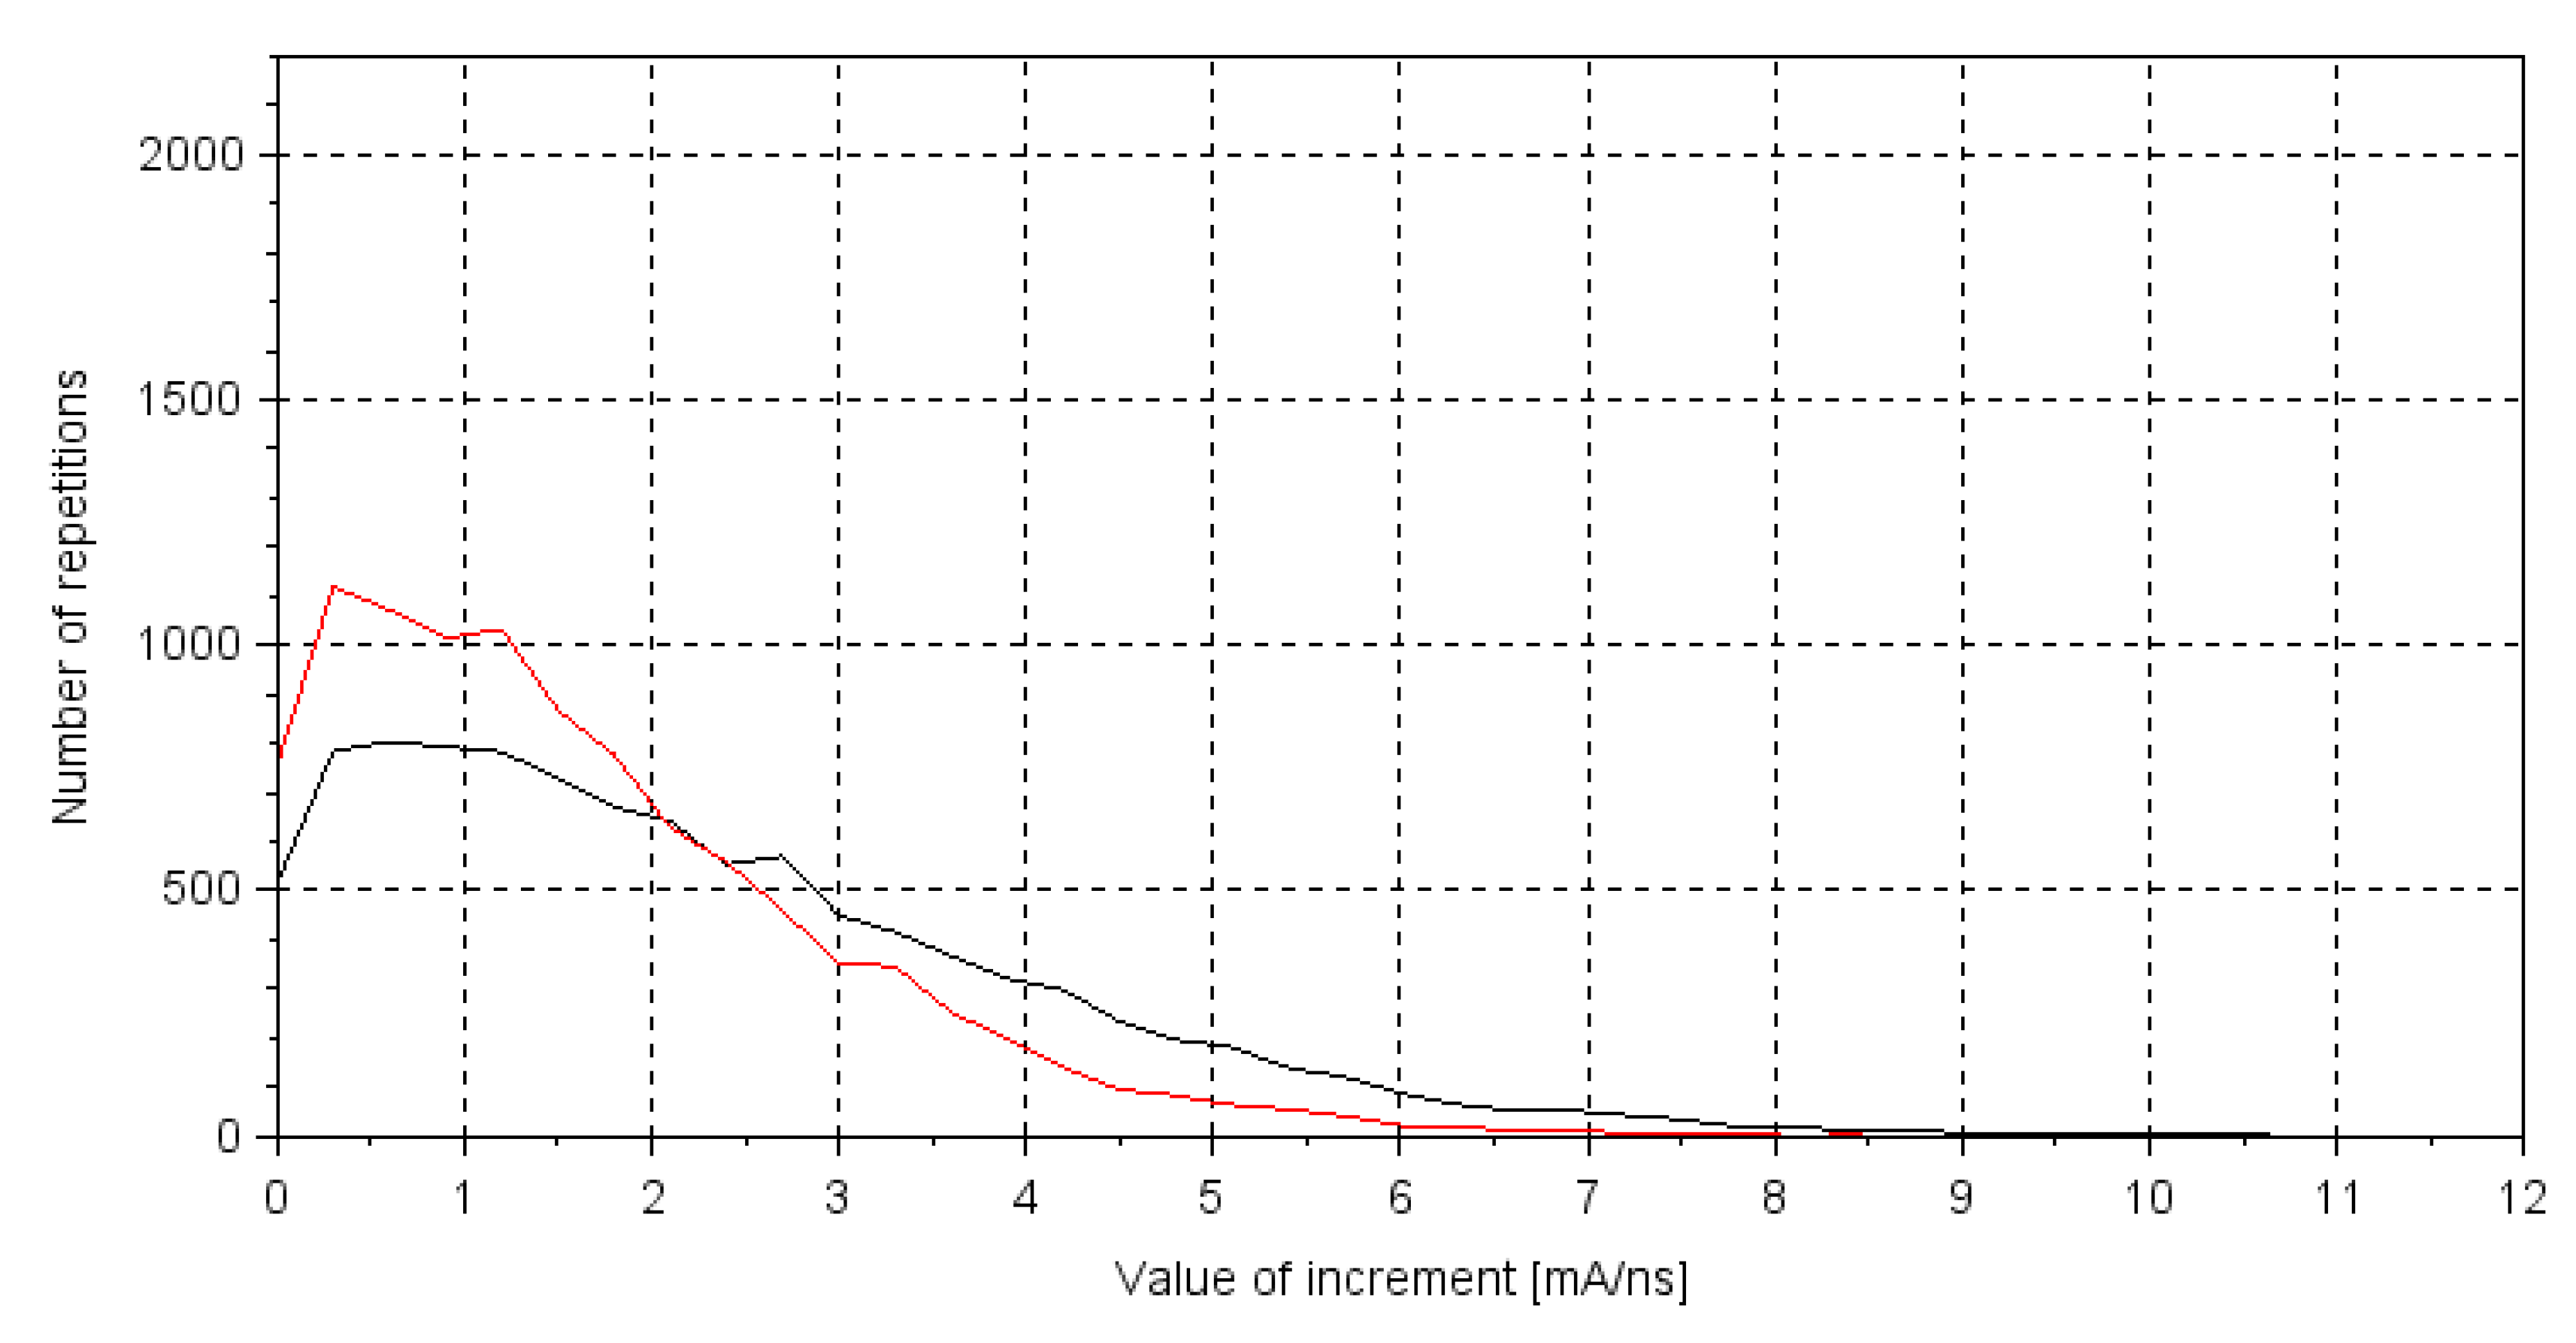
Figure 7 shows incremental decompositions of two random measurements of the signal, without an arc present in the circuit. Figure 8, Figure 9 and Figure 10 show decompositions of signals during arcing at various parameters. Figure 8 shows two decompositions taken at different voltages, with the black line representing 160 V and the red line representing 1.6 kV. Figure 9 shows two decompositions recorded at different loads, where the black line representing 700 Ω and the red line representing 1.6 kΩ. Finally, Figure 10 shows two decompositions taken at different distances between the electrodes of the spark gap, with the black line representing 1 mm and the red line representing 1 cm. Ten measurements were taken for researching each parameter of the arc, but only two extremes are presented in the figures, in order to clearly show the tendencies.

3.2.2. Analysis of Measurements at the Window Width of 10 kpts

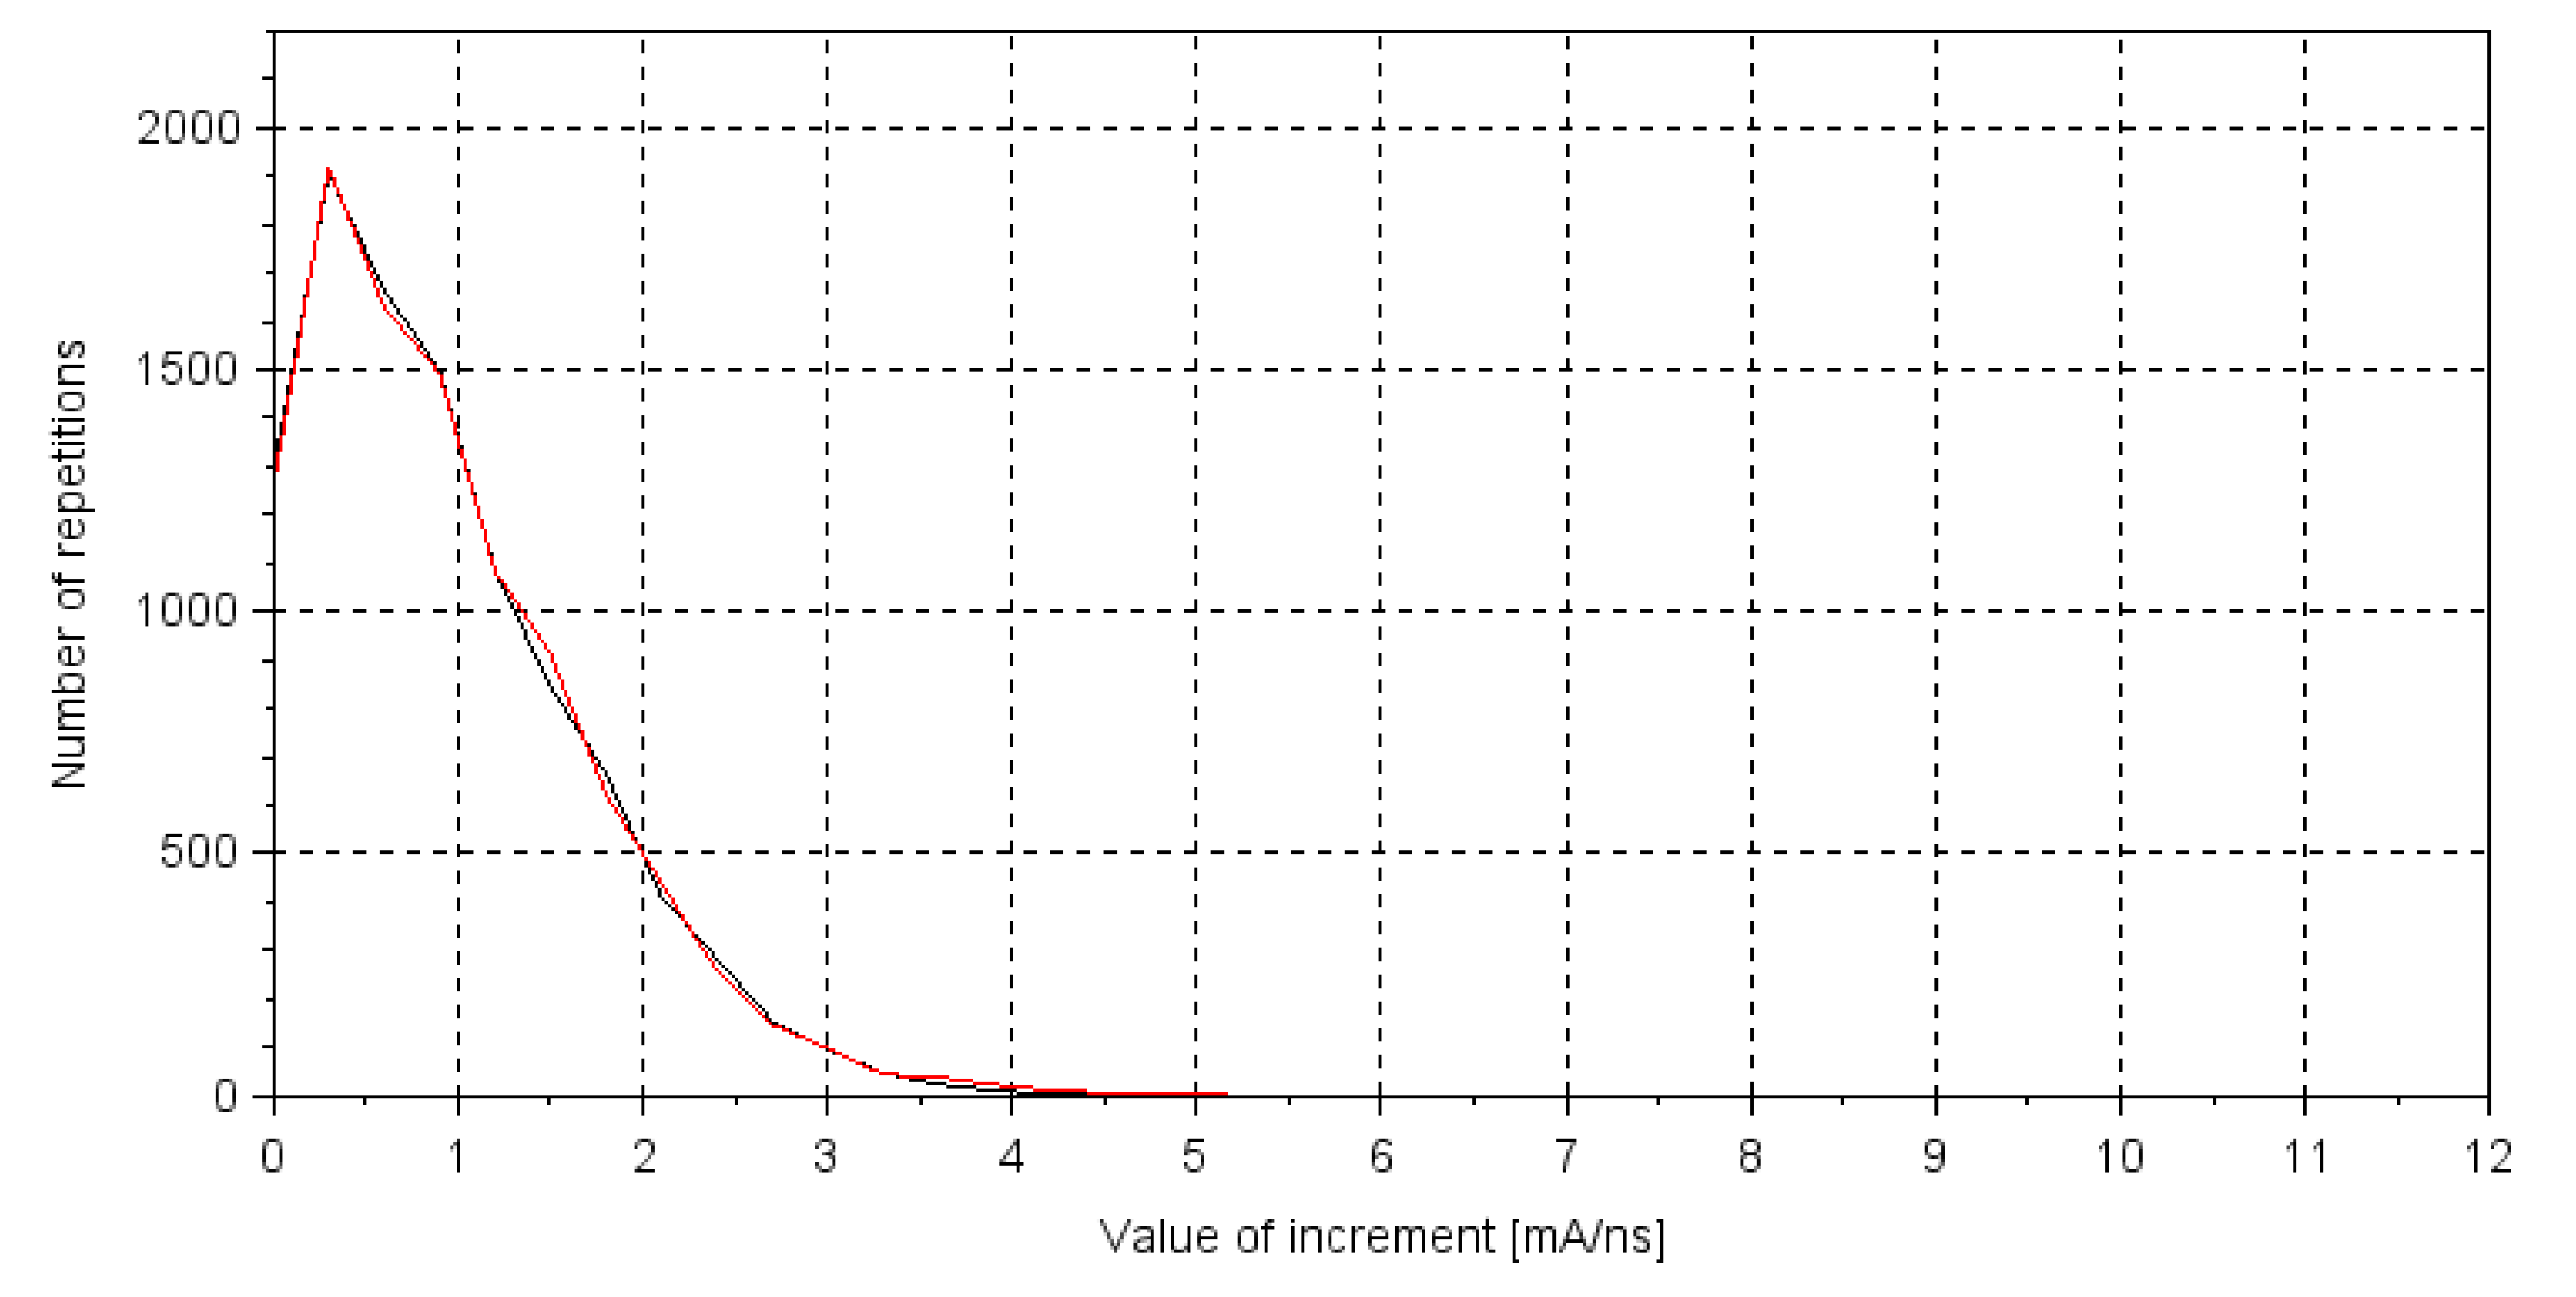
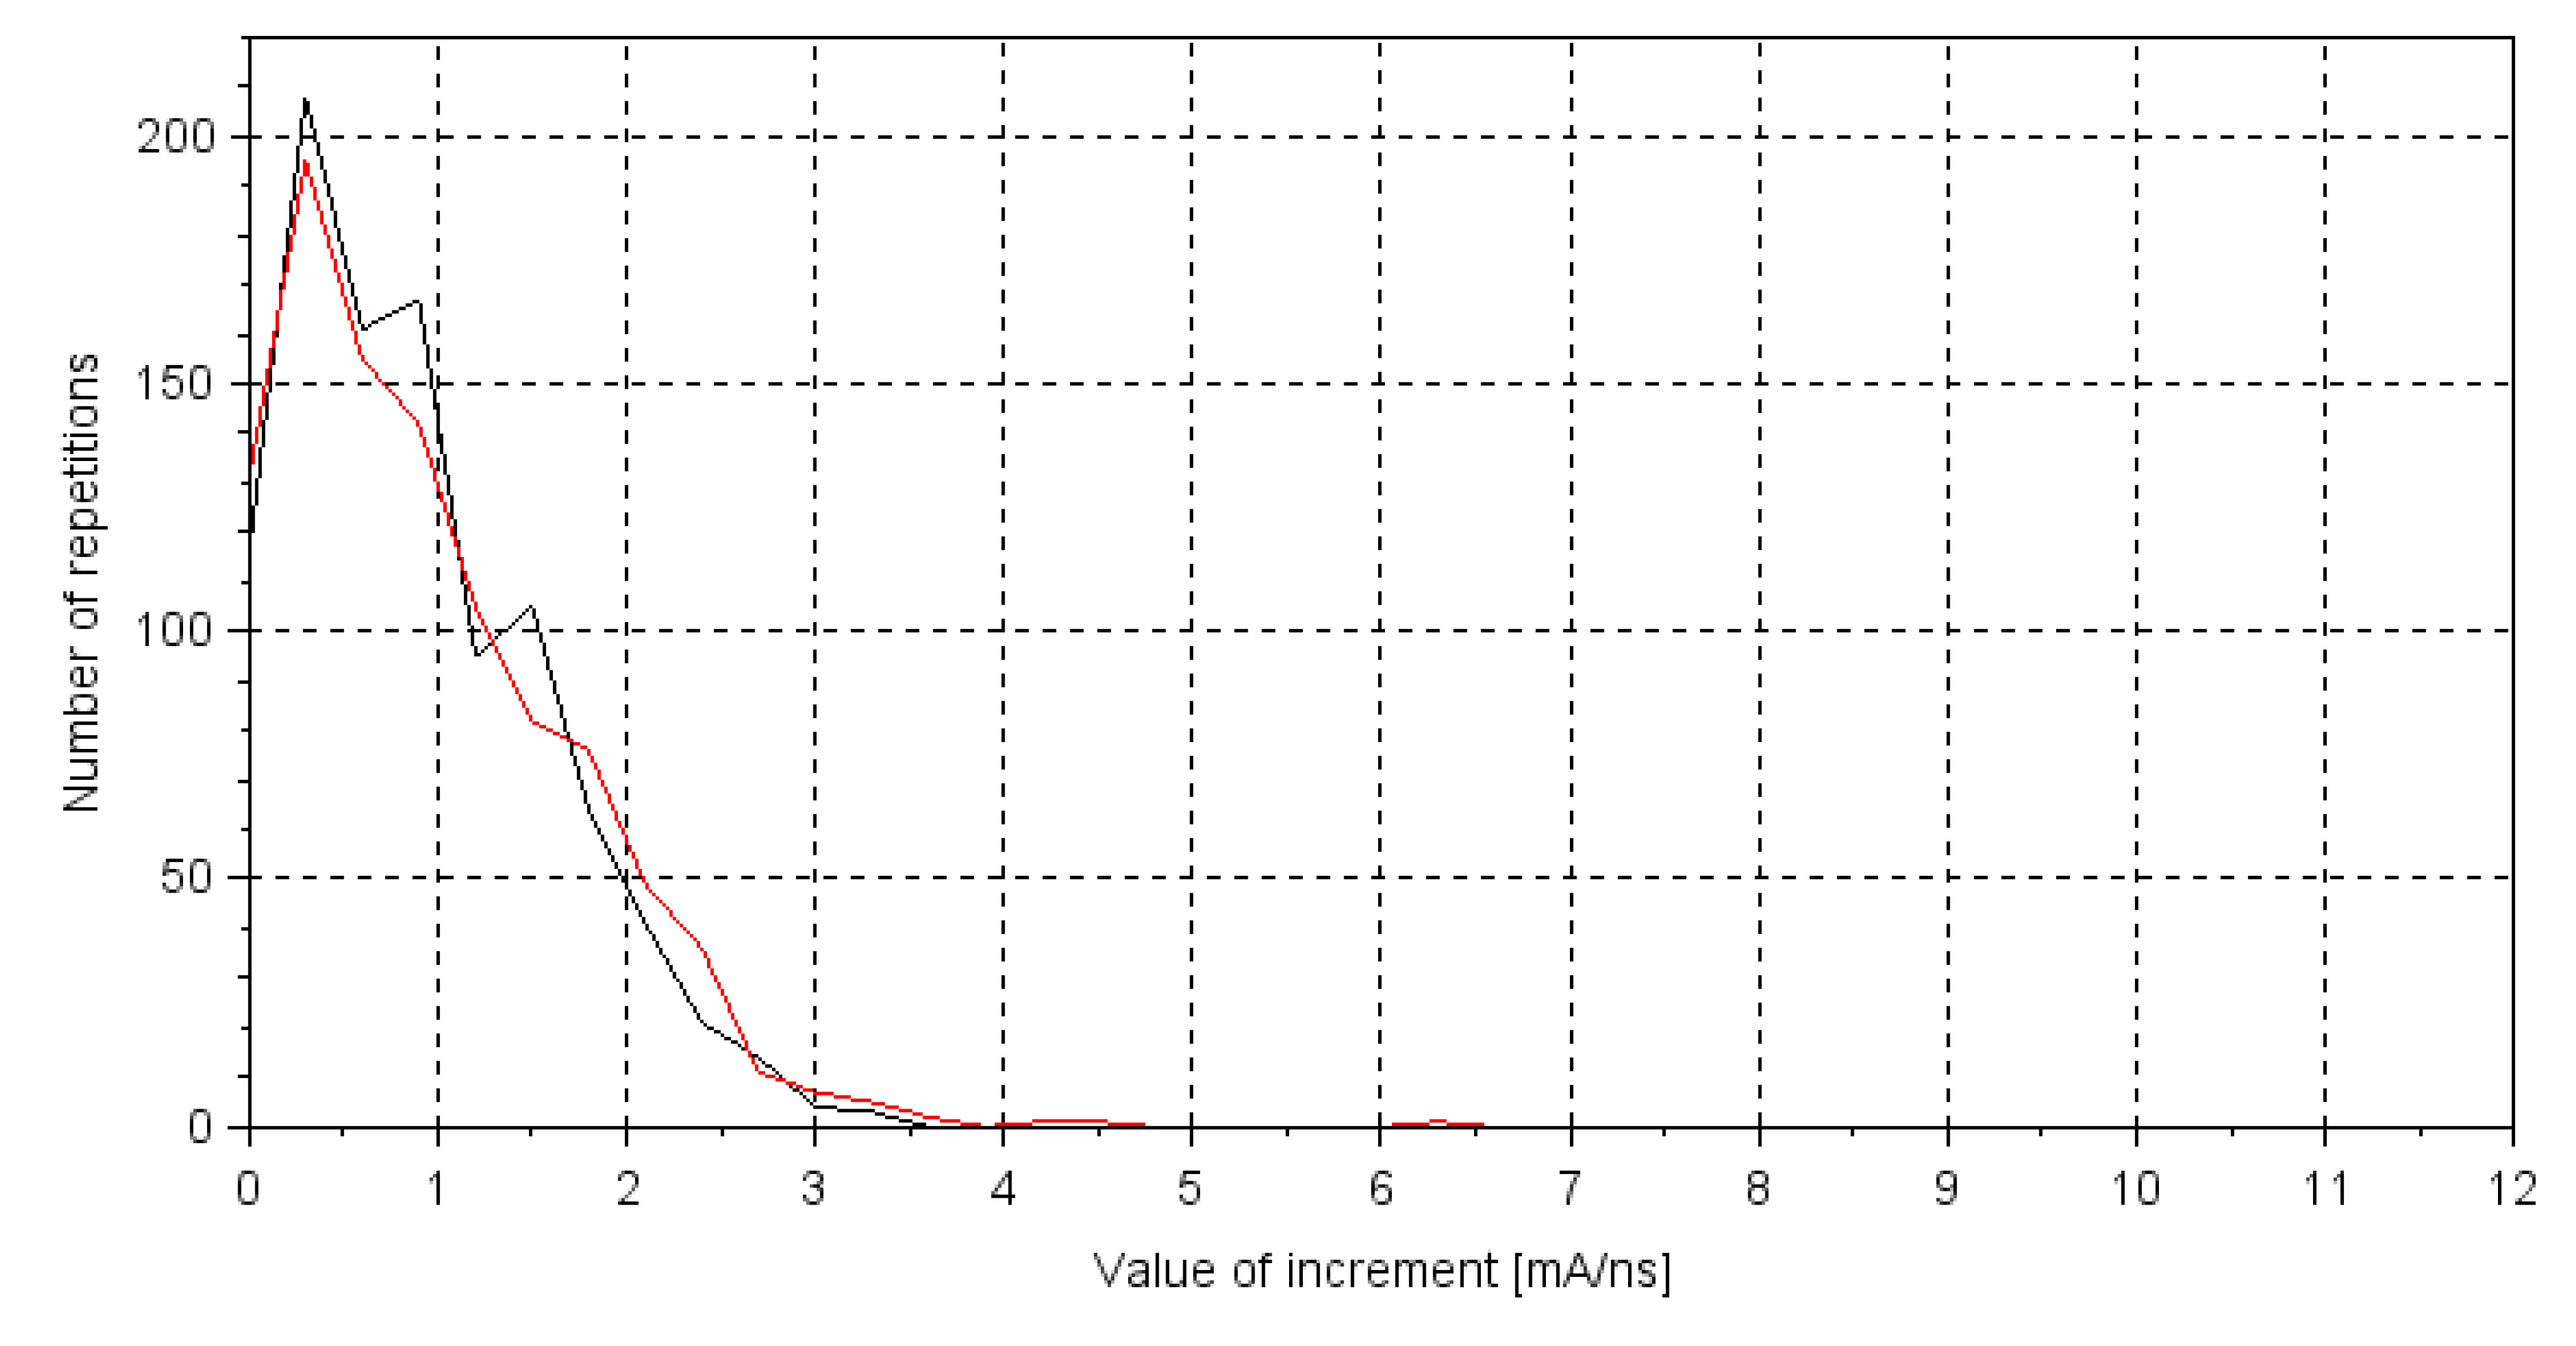
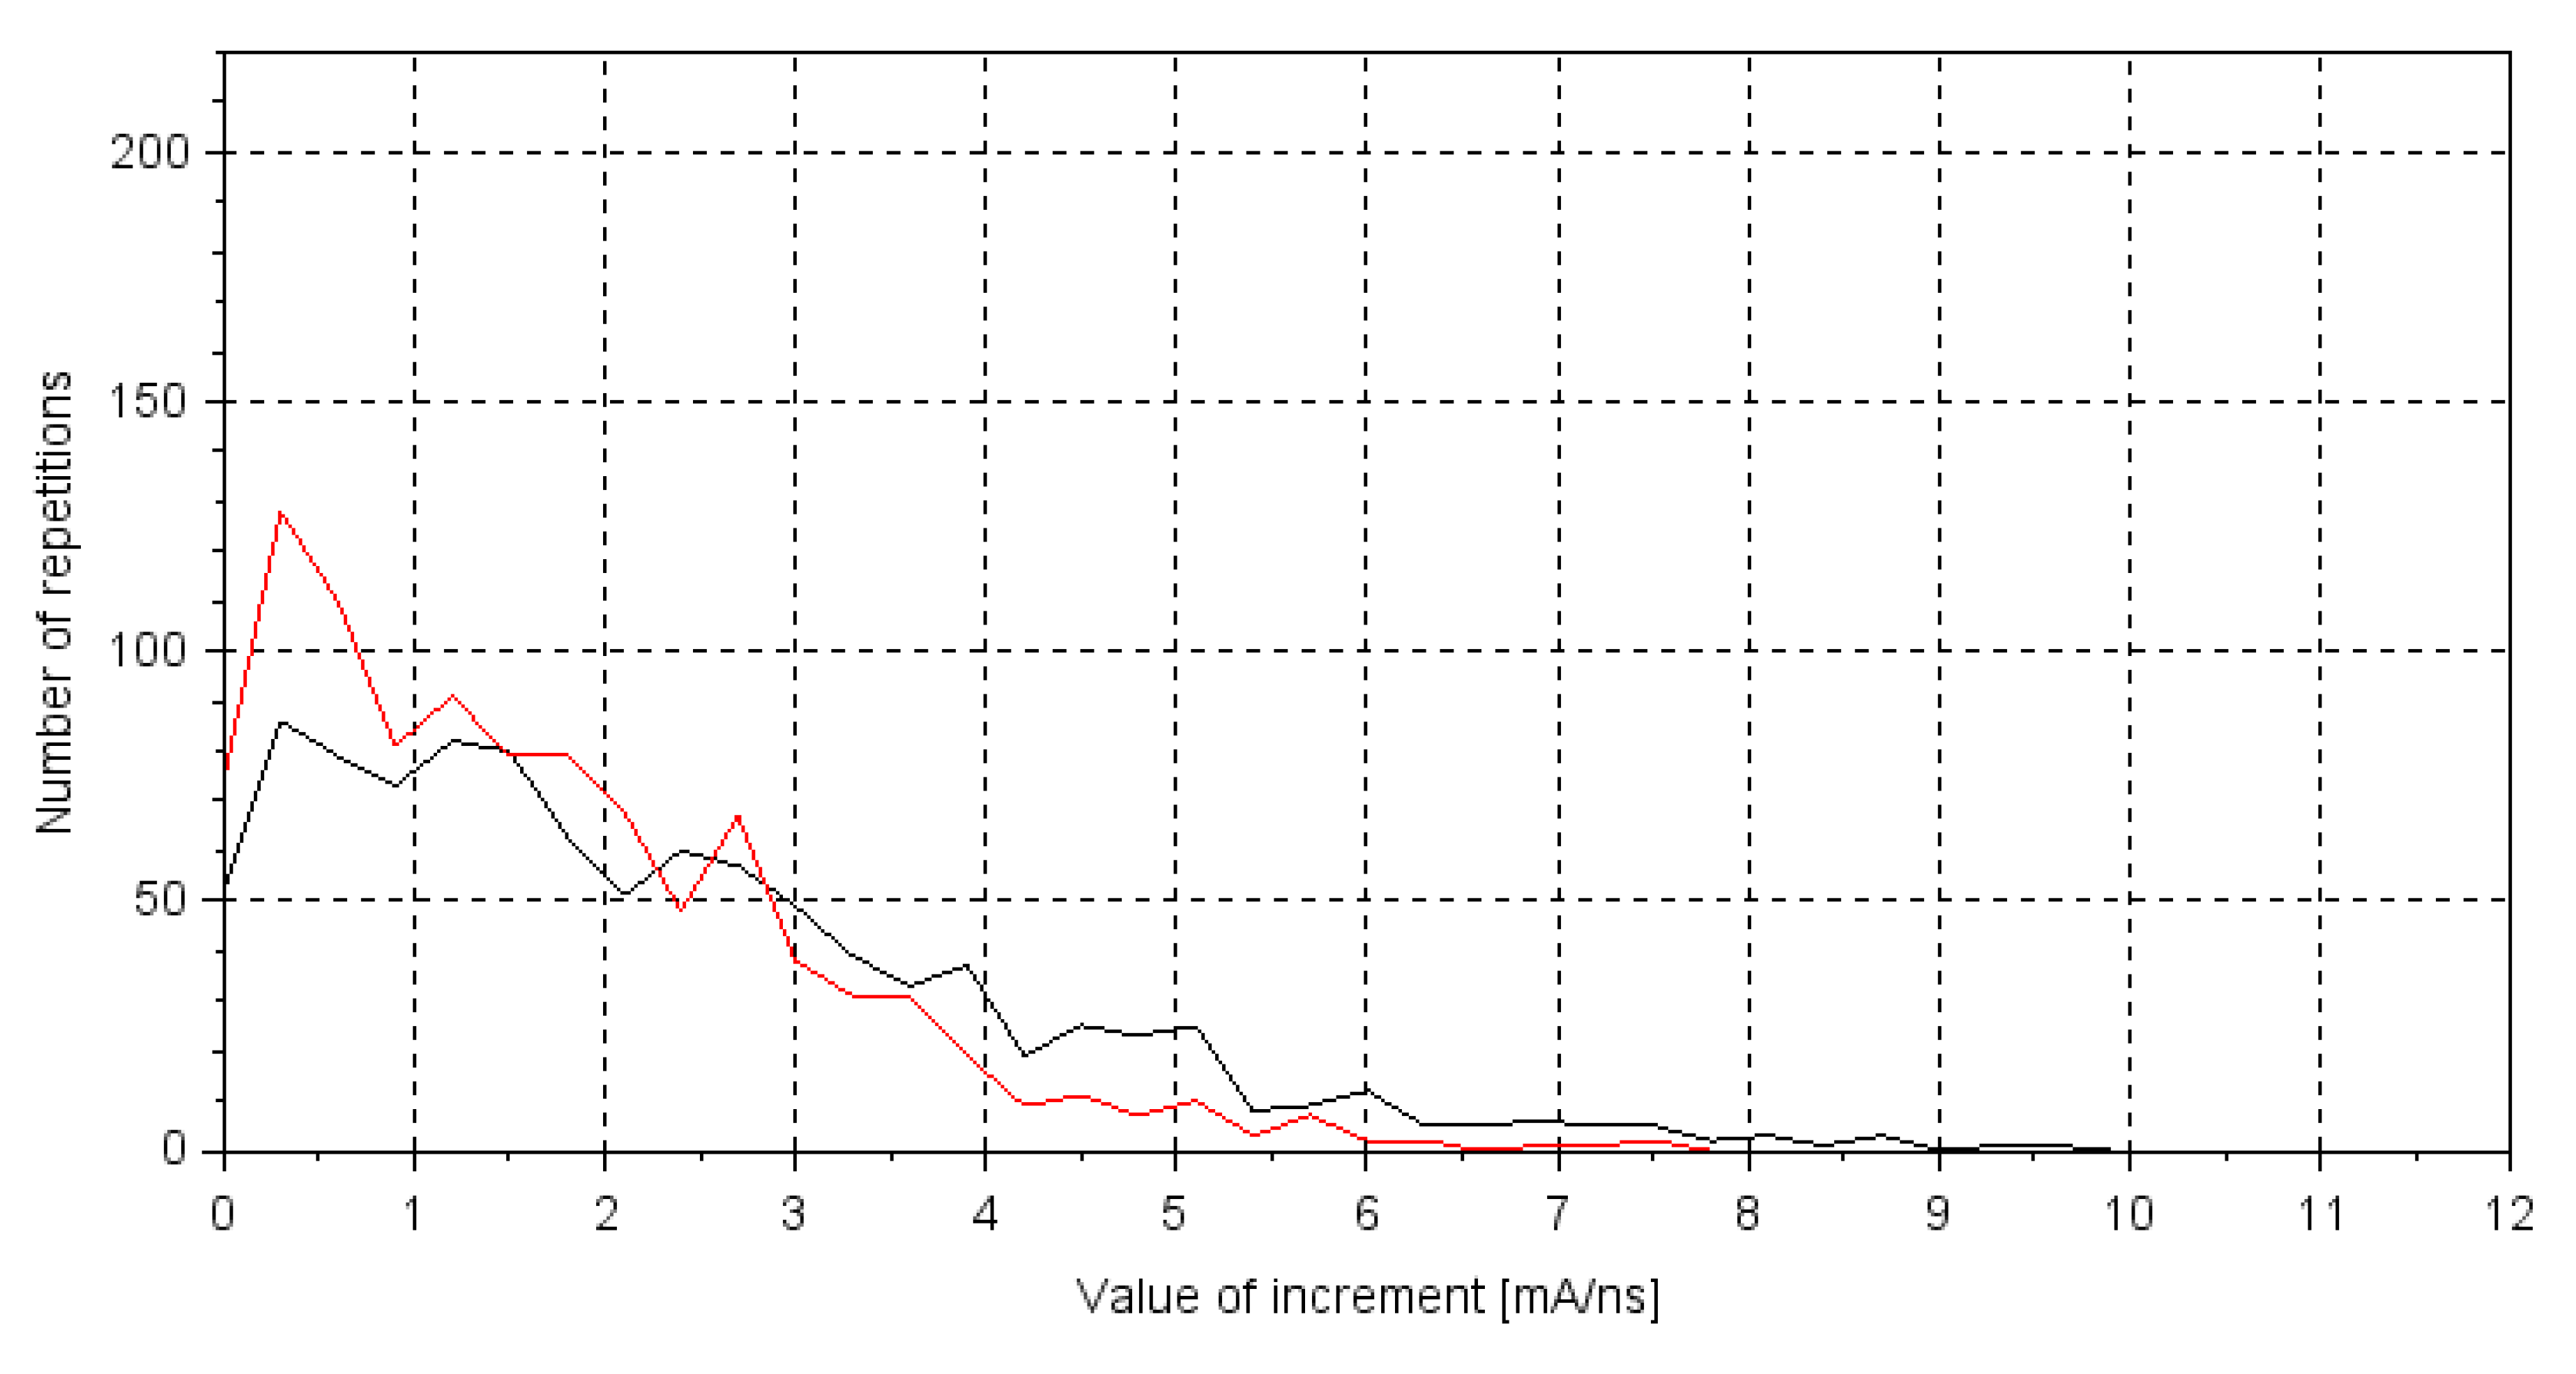
Figure 11 shows decompositions of two measurements of the signal without an arc. Figure 12 and Figure 13 show decompositions of signals while arcing occurred at different loads and distances of electrodes, respectively. In Figure 12, decompositions are marked as follows: 700 Ω—black line and 1.6 kΩ—red line. Additionally, in Figure 13, 1 mm gap—black line and 1 cm gap—red line.

3.2.3. Analysis of Measurements at the Window Width of 1 kpts

Incremental decompositions of signals without an arc are shown in Figure 14. Figure 15 shows two decompositions recorded at different distances between the electrodes of the spark gap, where the black line marks decomposition at 1 mm and the red line marks that at 1 cm.

4. Discussion

4.1. Analyses of Measurements Using FFT

As shown in Figure 5, the spectrum where the arc introduces the most harmonics starts at 20 MHz, which also applies to AC arc, since the author of the Siemens 5SM6 arc fault detection unit has selected the bandwidth from 22 to 24 MHz to be measured by the high frequency sensor in this device [69]. The bandwidth up to 8 MHz reveals no noticeable difference between the shapes of the spectra during arcing or where there is no arcing.
The spectrum shown in Figure 6 proves that low resolution arc detection is possible by measuring the average level of all harmonics in the bandwidth from 8 to 30 MHz, and not by checking the specified shape of the spectrum, since that shape is more random. The measurements also show that an arc generates harmonics in the low frequency region, from 10 to 400 kHz, but at a lower level. A circuit measuring at this bandwidth has been developed by Texas Instruments as an evaluation board for arc detection in photovoltaics, named RD-195 [70]. This board filters frequencies from 40 to 120 kHz and then checks, using FFT, whether the spectrum has the same shape as the input filter response. Although this method works, it has the disadvantage of false triggering during the appearance of any disturbances at low frequencies (e.g., DC-DC converters). In the higher frequency region, it is least certain that a load introduces its harmonics to the waveform of the current [69]. Generally speaking, it is possible to identify arcing using FFT; however, the microcontroller that needs to be implemented in the measurement system must have a relatively high computational power.

4.2. Analyses of Measurements Using Incremental Decomposition

In the case of 100 kpts analysis, according to Figure 7, incremental decompositions of signals with no arc in the circuit cover each other, so they are repeatable. The same situation is present in Figure 8, but for different voltages, so the voltage has no effect on the shape of decomposition (measurements for different voltages were taken at a constant current by varying the load). The situation is different in Figure 9, where the count of repetitions of increments to 2.5 mA/ns decreases, and from 2.5 mA/ns, increases when stepping up the load and therefore stepping down the current. The distance between the electrodes of the spark gap has the largest influence on the shape of the decomposition, as shown in Figure 10. When stepping up the distance, the count of repetitions of increments to 2.5 mA/ns increases and from 2.5 mA/ns, decreases.
Incremental decompositions for 10 kpts were calculated for measurements at a sampling rate of 500 MS/s with a reduced window width from 100 to 10 kpts. A chart with decompositions at various voltages has been omitted here, since no tendency was observed with fewer samples. In terms of decompositions at different loads, shown in Figure 12, fewer samples effaced the tendency shown before. The difference between the repetition count of the 0.5 mA/ns increment dropped from 1000 to 200 for two extreme loads. The tendency with different distances between the electrodes of the spark gap is shown in Figure 13, and it is the same as that displayed in Figure 9. However, the difference between the repetition count of the 0.5 mA/ns increment dropped from 3000 to 300 for two extreme distances between electrodes.
In the last case, for 1 kpts, the window width was reduced again from 10 to 1 kpts. As shown in Figure 14, measurements with no arc were still repeatable. Figure 15 shows that at a low sample count, the last tendency with the distance of electrodes was also effaced compared to Figure 13. However, decompositions of signals during arcing and with no arcing were still easy to distinguish and arc detection was possible, since the difference between the repetition count of the 0.5 mA/ns increment was approx. 70 when comparing the worst cases of Figure 14 and Figure 15.
With a high number of samples, the shape of the decomposition changes with the current of arc and gap between electrodes. At a low sample count, these parameters are less significant for the decomposition’s shape (less repetition count difference for the extreme parameters of the arc), but arc detection itself is still easily possible (the worst case of 70 repetition count difference between arcing and non-arcing). Therefore, the algorithm is demonstrated to have fulfilled the expectations, and can now be implemented in the embedded system and tested for calculation times and arc detection under various loads. The requirements for such a system are a 100 MHz clock and 32 kB program memory microcontroller with an external 5 MS/s sampling rate and 8-bit resolution ADC. Apart from its use in electric arc detection, incremental decomposition has found an application in medicine [71].

5. Conclusions

This article presents the results of research on the FFT frequency method and incremental decomposition of the current over time in DC electric arc detection. The test bench was built in order to carry out the research, which allowed us to generate arcs at three variable parameters of the voltage, load, and distance between the electrodes of the spark gap. As a result of the tests, waveforms of different durations and numbers of samples from 1 to 100 kpts were recorded.
The first method was proposed as a reference method and requires the use of the FFT algorithm to transform the tested waveform into the frequency domain, which involves a large computational effort, thus prolonging the response time for electric arc detection. The second method, which is currently being developed by the authors, allows for arc detection in about a seven times shorter period for 1024 samples due to its low computational complexity. As a result of the research, it has been determined that, by analyzing the characteristics resulting from incremental decomposition, it is possible to detect an arc. The shape of the characteristics is primarily influenced by the distance of the electrodes between which an electric arc occurs. This relation is valid for all tested sample numbers, as well as for the lowest tested in the article, i.e., 1 kpts.

Author Contributions

Conceptualization, M.D. and M.S.; methodology, M.D. and M.S.; software, M.D.; validation, M.D.; formal analysis, M.D. and M.S.; investigation, M.D. and M.S.; resources, M.D. and M.S.; data curation, M.D.; writing—original draft preparation, M.D. and M.S.; writing—review and editing, M.D. and M.S.; visualization, M.D. and M.S.; supervision, M.S.; project administration, M.S.; funding acquisition, M.S. All authors have read and agreed to the published version of the manuscript.

Funding

This research received no external funding.

Institutional Review Board Statement

Not applicable.

Informed Consent Statement

Not applicable.

Data Availability Statement

Data and Scilab scripts available on request from the corresponding author.

Conflicts of Interest

The authors declare no conflict of interest.

References

  1. Kim, C.; Kim, H.; Ko, Y.; Byun, S.; Aggarwal, R.; Johns, A. A novel fault-detection technique of high-impedance arcing faults in transmission lines using the wavelet transform. IEEE Trans. Power Deliv. 2002, 17, 921–929. [Google Scholar] [CrossRef]
  2. Zhang, W.; Jing, Y.; Xiao, X. Model-Based General Arcing Fault Detection in Medium-Voltage Distribution Lines. IEEE Trans. Power Deliv. 2016, 31, 2231–2241. [Google Scholar] [CrossRef]
  3. Lai, T.; Snider, L.; Lo, E.; Sutanto, D. High-impedance fault detection using discrete wavelet transform and frequency range and RMS conversion. IEEE Trans. Power Deliv. 2005, 20, 397–407. [Google Scholar] [CrossRef]
  4. Elkalashy, N.; Lehtonen, M.; Darwish, H.; Izzularab, M.; Taalab, A. Modeling and experimental verification of high impedance arcing fault in medium voltage networks. IEEE Trans. Dielectr. Electr. Insul. 2007, 14, 375–383. [Google Scholar] [CrossRef]
  5. Wei, M.; Shi, F.; Zhang, H.; Jin, Z.; Terzija, V.; Zhou, J.; Bao, H. High Impedance Arc Fault Detection Based on the Harmonic Randomness and Waveform Distortion in the Distribution System. IEEE Trans. Power Deliv. 2020, 35, 837–850. [Google Scholar] [CrossRef]
  6. Artale, G.; Cataliotti, A.; Cosentino, V.; Di Cara, D.; Nuccio, S.; Tine, G. Arc Fault Detection Method Based on CZT Low-Frequency Harmonic Current Analysis. IEEE Trans. Instrum. Meas. 2017, 66, 888–896. [Google Scholar] [CrossRef]
  7. Qu, N.; Wang, J.; Liu, J. An Arc Fault Detection Method Based on Current Amplitude Spectrum and Sparse Representation. IEEE Trans. Instrum. Meas. 2019, 68, 3785–3792. [Google Scholar] [CrossRef]
  8. Bao, G.; Jiang, R.; Liu, D. Research on Series Arc Fault Detection Based on Higher-Order Cumulants. IEEE Access 2019, 7, 4586–4597. [Google Scholar] [CrossRef]
  9. Jiang, J.; Wen, Z.; Zhao, M.; Bie, Y.; Li, C.; Tan, M.; Zhang, C. Series Arc Detection and Complex Load Recognition Based on Principal Component Analysis and Support Vector Machine. IEEE Access 2019, 7, 47221–47229. [Google Scholar] [CrossRef]
  10. Bao, G.; Jiang, R.; Gao, X. Novel Series Arc Fault Detector Using High-Frequency Coupling Analysis and Multi-Indicator Algorithm. IEEE Access 2019, 7, 92161–92170. [Google Scholar] [CrossRef]
  11. Guo, F.; Gao, H.; Wang, Z.; You, J.; Tang, A.; Zhang, Y. Detection and Line Selection of Series Arc Fault in Multi-Load Circuit. IEEE Trans. Plasma Sci. 2019, 47, 5089–5098. [Google Scholar] [CrossRef]
  12. Wang, Y.; Zhang, F.; Zhang, S. A New Methodology for Identifying Arc Fault by Sparse Representation and Neural Network. IEEE Trans. Instrum. Meas. 2018, 67, 2526–2537. [Google Scholar] [CrossRef]
  13. Wang, Y.; Zhang, F.; Zhang, X.; Zhang, S. Series AC Arc Fault Detection Method Based on Hybrid Time and Frequency Analysis and Fully Connected Neural Network. IEEE Trans. Ind. Inform. 2019, 15, 6210–6219. [Google Scholar] [CrossRef]
  14. Qu, N.; Zuo, J.; Chen, J.; Li, Z. Series Arc Fault Detection of Indoor Power Distribution System Based on LVQ-NN and PSO-SVM. IEEE Access 2019, 7, 184020–184028. [Google Scholar] [CrossRef]
  15. Li, W.; Liu, Y.; Li, Y.; Guo, F. Series Arc Fault Diagnosis and Line Selection Method Based on Recurrent Neural Network. IEEE Access 2020, 8, 177815–177822. [Google Scholar] [CrossRef]
  16. Georgijevic, N.; Jankovic, M.; Srdic, S.; Radakovic, Z. The Detection of Series Arc Fault in Photovoltaic Systems Based on the Arc Current Entropy. IEEE Trans. Power Electron. 2016, 31, 5917–5930. [Google Scholar] [CrossRef]
  17. Chen, S.; Li, X.; Xiong, J. Series Arc Fault Identification for Photovoltaic System Based on Time-Domain and Time-Frequency-Domain Analysis. IEEE J. Photovolt. 2017, 7, 1105–1114. [Google Scholar] [CrossRef]
  18. Lu, S.; Sirojan, T.; Phung, B.; Zhang, D.; Ambikairajah, E. DA-DCGAN: An Effective Methodology for DC Series Arc Fault Diagnosis in Photovoltaic Systems. IEEE Access 2019, 7, 45831–45840. [Google Scholar] [CrossRef]
  19. Chen, S.; Li, X.; Xie, Z.; Meng, Y. Time-Frequency Distribution Characteristic and Model Simulation of Photovoltaic Series Arc Fault with Power Electronic Equipment. IEEE J. Photovolt. 2019, 9, 1128–1137. [Google Scholar] [CrossRef]
  20. Ahmadi, M.; Samet, H.; Ghanbari, T. A New Method for Detecting Series Arc Fault in Photovoltaic Systems Based on the Blind-Source Separation. IEEE Trans. Ind. Electron. 2020, 67, 5041–5049. [Google Scholar] [CrossRef]
  21. Liu, S.; Dong, L.; Liao, X.; Cao, X.; Wang, X.; Wang, B. Application of the Variational Mode Decomposition-Based Time and Time-Frequency Domain Analysis on Series DC Arc Fault Detection of Photovoltaic Arrays. IEEE Access 2019, 7, 126177–126190. [Google Scholar] [CrossRef]
  22. Park, H.; Chae, S. DC Series Arc Fault Detection Algorithm for Distributed Energy Resources Using Arc Fault Impedance Modeling. IEEE Access 2020, 8, 179039–179046. [Google Scholar] [CrossRef]
  23. Miao, W.; Liu, X.; Lam, K.; Pong, P. Arc-Faults Detection in PV Systems by Measuring Pink Noise with Magnetic Sensors. IEEE Trans. Magn. 2019, 55, 1–6. [Google Scholar] [CrossRef]
  24. Xiong, Q.; Ji, S.; Zhu, L.; Zhong, L.; Liu, Y. A Novel DC Arc Fault Detection Method Based on Electromagnetic Radiation Signal. IEEE Trans. Plasma Sci. 2017, 45, 472–478. [Google Scholar] [CrossRef]
  25. Zhao, S.; Wang, Y.; Niu, F.; Zhu, C.; Xu, Y.; Li, K. A Series DC Arc Fault Detection Method Based on Steady Pattern of High-Frequency Electromagnetic Radiation. IEEE Trans. Plasma Sci. 2019, 47, 4370–4377. [Google Scholar] [CrossRef]
  26. Lu, Q.; Ye, Z.; Su, M.; Li, Y.; Sun, Y.; Huang, H. A DC Series Arc Fault Detection Method Using Line Current and Supply Voltage. IEEE Access 2020, 8, 10134–10146. [Google Scholar] [CrossRef]
  27. Ahmadi, M.; Samet, H.; Ghanbari, T. Series Arc Fault Detection in Photovoltaic Systems Based on Signal-to-Noise Ratio Characteristics Using Cross-Correlation Function. IEEE Trans. Ind. Inform. 2020, 16, 3198–3209. [Google Scholar] [CrossRef]
  28. Gu, J.; Lai, D.; Huang, J.; Yang, M. Design of a DC series arc fault detector for photovoltaic systems protection. In Proceedings of the 2018 54th IEEE/IAS Industrial and Commercial Power Systems Technical Conference, Niagara Falls, ON, USA, 7–10 May 2018. [Google Scholar]
  29. He, C.; Mu, L.; Wang, Y. The Detection of Parallel Arc Fault in Photovoltaic Systems Based on a Mixed Criterion. IEEE J. Photovolt. 2017, 7, 1717–1724. [Google Scholar] [CrossRef]
  30. Kavi, M.; Mishra, Y.; Vilathgamuwa, M. DC Arc Fault Detection for Grid-Connected Large-Scale Photovoltaic Systems. IEEE J. Photovolt. 2020, 10, 1489–1502. [Google Scholar] [CrossRef]
  31. Chae, S.; Park, J.; Oh, S. Series DC Arc Fault Detection Algorithm for DC Microgrids Using Relative Magnitude Comparison. IEEE J. Emerg. Sel. Top. Power Electron. 2016, 4, 1270–1278. [Google Scholar] [CrossRef]
  32. Underwriters Laboratories Inc. UL Standard for Safety for Arc-Fault Circuit-Interrupters, 3rd ed.; Underwriters Laboratories Inc.: New York, NY, USA, 2017. [Google Scholar]
  33. Wang, B.; Ni, J.; Geng, J.; Lu, Y.; Dong, X. Arc flash fault detection in wind farm collection feeders based on current waveform analysis. J. Mod. Power Syst. Clean Energy 2017, 5, 211–219. [Google Scholar] [CrossRef] [Green Version]
  34. Land, H.; Eddins, C.; Gauthier, L.; Klimek, J. Design of a sensor to predict arcing faults in nuclear switchgear. IEEE Trans. Nucl. Sci. 2003, 50, 1161–1165. [Google Scholar] [CrossRef]
  35. Li, B.; Luo, C.; Wang, Z. Application of GWO-SVM Algorithm in Arc Detection of Pantograph. IEEE Access 2020, 8, 173865–173873. [Google Scholar] [CrossRef]
  36. Yu, X.; Su, H. Pantograph Arc Detection of Urban Rail Based on Photoelectric Conversion Mechanism. IEEE Access 2020, 8, 14489–14499. [Google Scholar] [CrossRef]
  37. Kaleybar, H.J.; Brenna, M.; Foiadelli, F.; Fazel, S.S.; Zaninelli, D. Power Quality Phenomena in Electric Railway Power Supply Systems: An Exhaustive Framework and Classification. Energies 2020, 13, 6662. [Google Scholar] [CrossRef]
  38. Gao, G.; Yan, X.; Yang, Z.; Wei, W.; Hu, Y.; Wu, G. Pantograph–Catenary Arcing Detection Based on Electromagnetic Radiation. IEEE Trans. Electromagn. Compat. 2019, 61, 983–989. [Google Scholar] [CrossRef]
  39. Li, J.; Kohler, J. New insight into the detection of high-impedance arcing faults on DC trolley systems. IEEE Trans. Ind. Appl. 1999, 35, 1169–1173. [Google Scholar]
  40. Abdullah, Y.; Shaffer, J.; Hu, B.; Hall, B.; Wang, J.; Emrani, A.; Arfaei, B. Hurst-Exponent-Based Detection of High-Impedance DC Arc Events for 48 V Systems in Vehicles. IEEE Trans. Power Electron. 2020, 36, 3803–3813. [Google Scholar] [CrossRef]
  41. Xia, K.; Liu, B.; Fu, X.; Guo, H.; He, S.; Yu, W.; Xu, J.; Dong, H. Wavelet entropy analysis and machine learning classification model of DC serial arc fault in electric vehicle power system. IET Power Electron. 2019, 12, 3998–4004. [Google Scholar] [CrossRef]
  42. Maqsood, A.; Oslebo, D.; Corzine, K.; Parsa, L.; Ma, Y. STFT Cluster Analysis for DC Pulsed Load Monitoring and Fault Detection on Naval Shipboard Power Systems. IEEE Trans. Transp. Electrif. 2020, 6, 821–831. [Google Scholar] [CrossRef]
  43. Yaramasu, A.; Cao, Y.; Liu, G.; Wu, B. Aircraft electric system intermittent arc fault detection and location. IEEE Trans. Aerosp. Electron. Syst. 2015, 51, 40–51. [Google Scholar] [CrossRef]
  44. Jiang, J.; Zhao, M.; Wen, Z.; Zhang, C.; Albarracin, R. Detection of DC series arc in more electric aircraft power system based on optical spectrometry. High. Volt. 2020, 5, 24–29. [Google Scholar] [CrossRef]
  45. Li, W.; He, K.; Liu, W.; Zhang, X.; Dong, Y. A fast arc fault detection method for AC solid state power controllers in MEA. Chin. J. Aeronaut. 2018, 31, 1119–1129. [Google Scholar] [CrossRef]
  46. Nagi, Ł.; Kozioł, M.; Zygarlicki, J. Optical radiation from an electric arc at different frequencies. Energies 2020, 13, 1676. [Google Scholar] [CrossRef] [Green Version]
  47. Nagi, Ł.; Kozioł, M.; Zygarlicki, J. Comparative analysis of optical radiation emitted by electric arc generated at AC and DC voltage. Energies 2020, 13, 5137. [Google Scholar] [CrossRef]
  48. Yang, K.; Zhang, R.; Yang, J.; Liu, C.; Chen, S.; Zhang, F. A novel arc fault detector for early detection of electrical fires. Sensors 2016, 16, 500. [Google Scholar] [CrossRef]
  49. Yang, K.; Chu, R.; Zhang, R.; Xiao, J.; Tu, R. A novel methodology for series arc fault detection by temporal domain visualization and convolutional neural network. Sensors 2020, 20, 162. [Google Scholar] [CrossRef] [Green Version]
  50. Bao, G.; Gao, X.; Jiang, R.; Huang, K. A novel differential high-frequency current transformer sensor for series arc fault detection. Sensors 2019, 19, 3649. [Google Scholar] [CrossRef] [Green Version]
  51. Tisserand, E.; Lezama, J.; Schweitzer, P.; Berviller, Y. Series arcing detection by algebraic derivative of the current. Electr. Power Syst. Res. 2015, 119, 91–99. [Google Scholar] [CrossRef]
  52. Restrepo, C. Arc fault detection and discrimination methods. In Proceedings of the 2007 53rd IEEE Holm Conference on Electrical Contacts, Pittsburgh, PA, USA, 16–19 September 2007. [Google Scholar]
  53. Erhard, F.; Schaller, B.; Berger, F. Field test results of serial DC arc fault investigations on real photovoltaic systems. In Proceedings of the 2014 49th International Universities Power Engineering Conference (UPEC), Cluj-Napoca, Romania, 2–5 September 2014. [Google Scholar]
  54. Khorshed Alam, M.; Khan, F.; Johnson, J.; Flicker, J. PV arc-fault detection using spread spectrum time domain reflectometry (SSTDR). In Proceedings of the 2014 IEEE Energy Conversion Congress and Exposition (ECCE), Pittsburgh, PA, USA, 14–18 September 2014. [Google Scholar]
  55. Digulescu, A.; Candel, I.; Dahmani, J.; Deacu, D.; Ioana, C.; Gabriel, V. Electric arc locator in photovoltaic power systems using advanced signal processing techniques. In Proceedings of the ELMAR-2013 55th International Symposium, Zadar, Croatia, 25–27 September 2013. [Google Scholar]
  56. Luebke, C.; Pier, T.; Pahl, B.; Breig, D.; Zuercher, J. Field test results of DC arc fault detection on residential and utility scale PV arrays. In Proceedings of the 2011 37th IEEE Photovoltaic Specialists Conference, Seattle, WA, USA, 19–24 June 2011. [Google Scholar]
  57. Strobl, C.; Meckler, P. Arc Faults in Photovoltaic Systems. In Proceedings of the 2010 56th IEEE Holm Conference on Electrical Contacts, Charleston, SC, USA, 4–7 October 2010. [Google Scholar]
  58. Duc Vu, H.; Calderon, E.; Schweitzer, P.; Weber, S.; Britsch, N. Multi criteria series arc fault detection based on supervised feature selection. Int. J. Electr. Power Energy Syst. 2019, 113, 23–34. [Google Scholar]
  59. Augeard, A.; Singo, T.; Desprez, P.; Abbaoui, M. Numerical methods for detecting DC arc fault in lithium-ion batteries. In Proceedings of the 2015 61st IEEE Holm Conference on Electrical Contacts, San Diego, CA, USA, 11–14 October 2015. [Google Scholar]
  60. Leprettre, B.; Rebiere, Y. Detection of electrical series arcs using time-frequency analysis and mathematical morphology. In Proceedings of the 2001 6th International Symposium on Signal Processing and its Applications (ISSPA), Kuala Lumpur, Malaysia, 13–16 August 2001. [Google Scholar]
  61. Cho, Y.; Lim, J.; Seo, H.; Bang, S.; Choe, G. A series arc fault detection strategy for single-phase boost PFC rectifiers. J. Power Electron. 2015, 15, 1664–1672. [Google Scholar] [CrossRef] [Green Version]
  62. Lezama Calvo, J.; Schweitzer, P.; Tisserand, E.; Humbert, J.; Weber, S.; Joyeux, P. An embedded system for AC series arc detection by inter-period correlations of current. Electr. Power Syst. Res. 2015, 129, 227–234. [Google Scholar] [CrossRef]
  63. Barmada, S.; Raugi, M.; Tucci, M.; Romano, F. Arc detection in pantograph-catenary systems by the use of support vector machines-based classification. IET Electr. Syst. Transp. 2014, 4, 45–52. [Google Scholar] [CrossRef] [Green Version]
  64. Yaman, O.; Karakose, M.; Aydin, I.; Akin, E. Image processing and model based arc detection in pantograph catenary systems. In Proceedings of the 2014 22nd Signal Processing and Communications Applications Conference (SIU), Trabzon, Turkey, 23–25 April 2014. [Google Scholar]
  65. Aydin, I.; Yaman, O.; Karakose, M.; Celebi, B. Particle swarm based arc detection on time series in pantograph-catenary system. In Proceedings of the 2014 IEEE International Symposium on Innovations in Intelligent Systems and Applications (INISTA), Alberobello, Italy, 23–25 June 2014; pp. 344–349. [Google Scholar]
  66. Dołęgowski, M.; Szmajda, M. Mechanisms of electric arc detection based on current waveform spectrum and incremental decomposition analysis. Przegląd Elektrotechniczny 2016, 92, 59–62. [Google Scholar]
  67. Matusiak, R. Implementing Fast Fourier Transform Algorithms of Real-Valued Sequences with the TMS320 DSP Platform; Texas Instruments Application Report SPRA291; Texas Instruments: Dallas, TX, USA, 2001. [Google Scholar]
  68. Siemens AG. 5SM Arc Fault Detection Unit for Photovoltaics; Siemens AG: Regensburg, Germany, 2015. [Google Scholar]
  69. Siemens AG. 5SM6 Arc Fault Detection Unit; Siemens AG: Regensburg, Germany, 2012. [Google Scholar]
  70. Texas Instruments. AN-2154: RD-195 DC Arc Detection Evaluation Board; Texas Instruments: Dallas, TX, USA, 2012. [Google Scholar]
  71. Dołęgowski, M.; Szmajda, M.; Bączkowicz, D. Use of incremental decomposition and spectrogram in vibroacoustic signal analysis in knee joint disease examination. Przegląd Elektrotechniczny 2018, 94, 162–166. [Google Scholar]
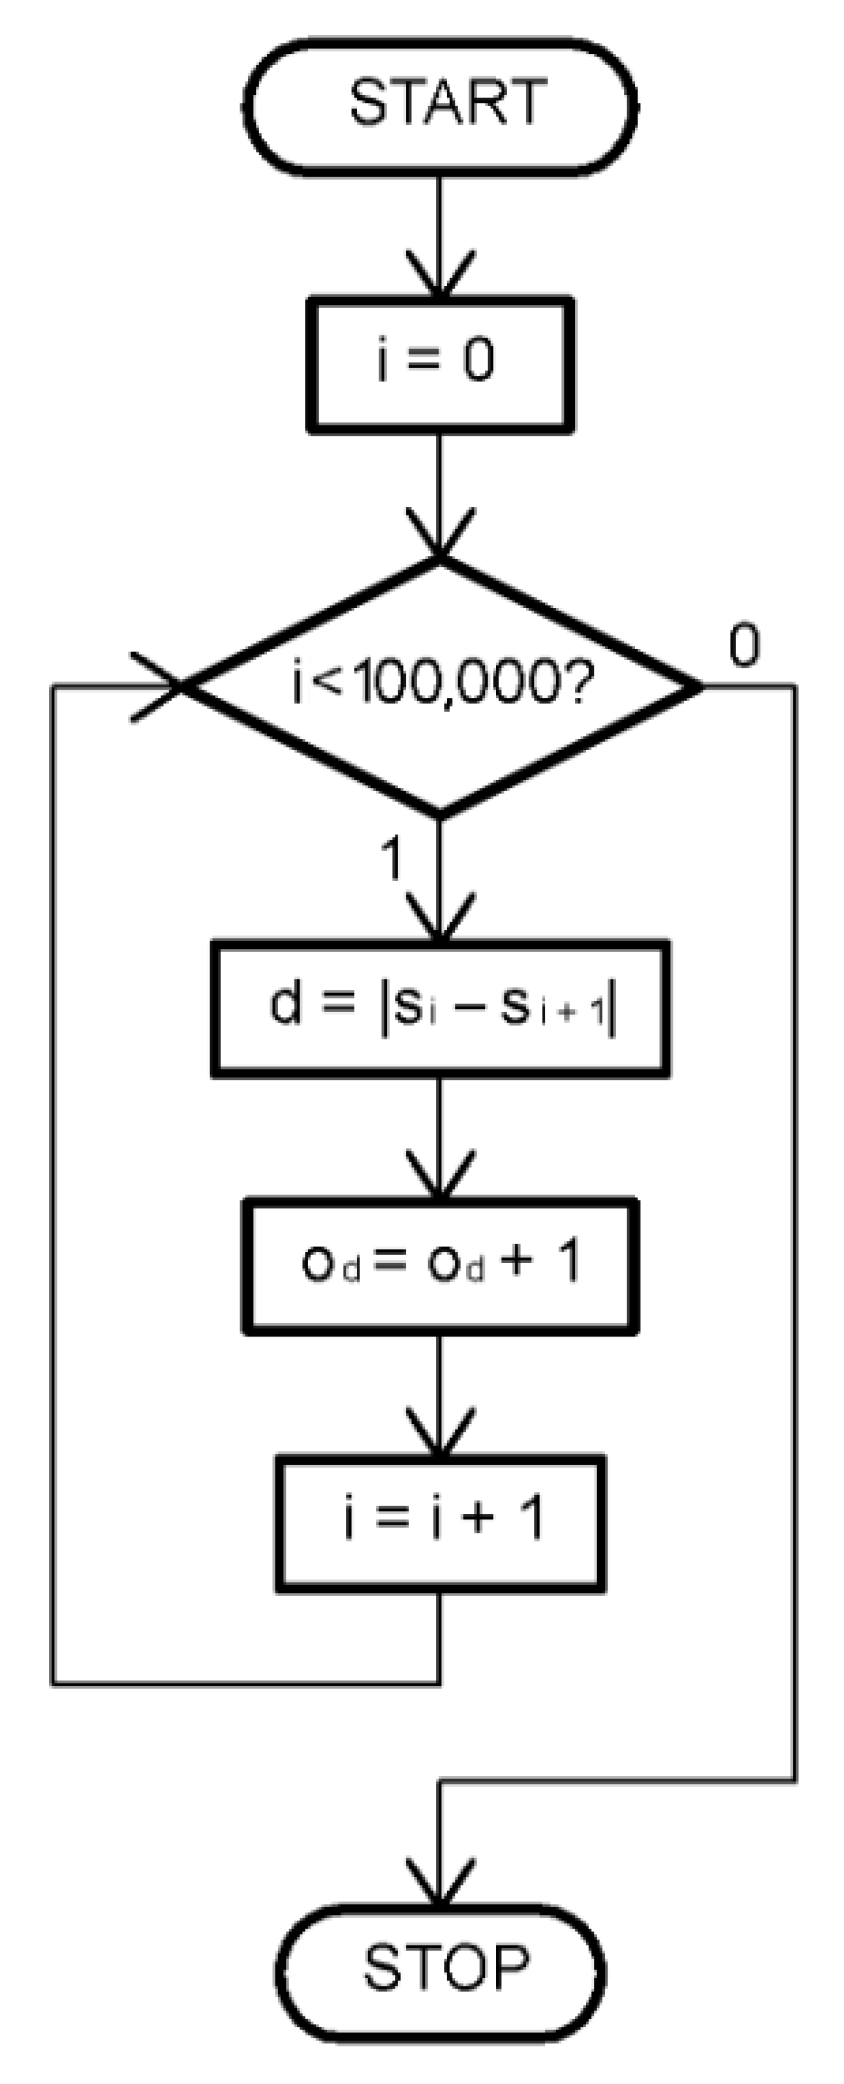
Figure 1. An algorithm of the incremental decomposition calculation [66].
Energies 14 00288 g001
Figure 2. Computational complexity of DFT (black), FFT (crosses), and incremental decomposition (red).
Energies 14 00288 g002
Figure 3. Block diagram of the measurement system.
Energies 14 00288 g003
Figure 4. Photo of the measurement system.
Energies 14 00288 g004
Figure 5. Figure showing the 100 kpts frequency spectra of signals with no arc (black) and with the arc (red).
Energies 14 00288 g005
Figure 6. Figure showing the 1 kpts frequency spectra of signals with no arc (black) and with the arc (red).
Energies 14 00288 g006
Figure 7. Figure showing 100 kpts decompositions of signals with no arc (conditions: shorted spark gap and current of 500 mA DC at each measurement).
Energies 14 00288 g007
Figure 8. Figure showing 100 kpts decompositions of signals at different voltages, with 160 V (black) and 1.6 kV (red) (conditions: 1 mm gap between electrodes and current of 900 mA DC at each measurement).
Energies 14 00288 g008
Figure 9. Figure showing 100 kpts decompositions of signals at different loads, with 700 Ω (black) and 1.6 kΩ (red) (conditions: 1 mm gap between electrodes and voltage of 800 V DC at each measurement).
Energies 14 00288 g009
Figure 10. Figure showing 100 kpts decompositions of signals at different distances of electrodes, with 1 mm (black) and 1 cm (red) (conditions: voltage of 1.6 kV DC and current of 1 A DC at each measurement).
Energies 14 00288 g010
Figure 11. Figure showing 10 kpts decompositions of signals with no arc (conditions: shorted spark gap and current of 500 mA DC at each measurement).
Energies 14 00288 g011
Figure 12. Figure showing 10 kpts decompositions of signals at different loads, with 700 Ω (black) and 1.6 kΩ (red) (conditions: 1 mm gap between electrodes and voltage of 800 V DC at each measurement).
Energies 14 00288 g012
Figure 13. Figure showing 10 kpts decompositions of signals at different distances of electrodes, with 1 mm (black) and 1 cm (red) (conditions: voltage of 1.6 kV DC and current of 1 A DC at each measurement).
Energies 14 00288 g013
Figure 14. Figure showing 1 kpts decompositions of signals with no arc (conditions: shorted spark gap and current of 500 mA DC at each measurement).
Energies 14 00288 g014
Figure 15. Figure showing 1 kpts decompositions of signals at different distances of electrodes, with 1 mm (black) and 1 cm (red) (conditions: voltage of 1.6 kV DC and current of 1 A DC at each measurement).
Energies 14 00288 g015
Table 1. Computational complexity of Discrete Fourier Transform (DFT), Fast Fourier Transform (FFT), and incremental decomposition.
OperationDFTFFT (Radix-2)Incremental Decomposition
Complex multiplicationN2(N/2)log2N
Complex additionN(N − 1)Nlog2N
Real subtraction N − 1
Real addition N − 1
Total2N2 − N(3/2N)log2N2N − 2
Publisher’s Note: MDPI stays neutral with regard to jurisdictional claims in published maps and institutional affiliations.