Article

Phasor Estimation for Grid Power Monitoring: Least Square vs. Linear Kalman Filter

1
Institut de Recherche Dupuy de Lôme (UMR CNRS 6027 IRDL), ISEN Yncréa Ouest, 29200 Brest, France
2
AKKA Technologies Group, 75008 Paris, France
3
School of Mechanical, Aerospace and Automotive Engineering, Coventry University, Coventry CV1 5FB, UK
4
Institut de Recherche Dupuy de Lôme (UMR CNRS 6027 IRDL), University of Brest, 29238 Brest, France
5
Logistics Engineering College, Shanghai Maritime University, Shanghai 201306, China
*
Author to whom correspondence should be addressed.
Energies 2020, 13(10), 2456; https://doi.org/10.3390/en13102456
Submission received: 22 April 2020 / Revised: 28 April 2020 / Accepted: 4 May 2020 / Published: 13 May 2020

Abstract

:
This paper deals with a comparative study of two phasor estimators based on the least square (LS) and the linear Kalman filter (KF) methods, while assuming that the fundamental frequency is unknown. To solve this issue, the maximum likelihood technique is used with an iterative Newton–Raphson-based algorithm that allows minimizing the likelihood function. Both least square (LSE) and Kalman filter estimators (KFE) are evaluated using simulated and real power system events data. The obtained results clearly show that the LS-based technique yields the highest statistical performance and has a lower computation complexity.

1. Introduction

The concept of smart grids has become a focal point by introducing new requirements in distribution networks, power quality, communications technologies, and power electronic technologies, and this is due to the expansion and deployment of a high rate of renewable energies (REs) penetration [1,2,3,4]. In fact, the non-predictable, non-dispatchable, and intermittent natures of RES could have a substantial impact on the power balance [5,6]. Consequently, power quality (PQ) has become more challenging and is considered as a major issue to realize the envisioned smart grid [7,8,9,10,11,12]. Therefore, the smart grid should use an efficient way to continuously monitor the power system to ensure the balance between power production and consumption [1,3,6,13,14], and to allow power quality state estimation.The task of PQ disturbance consists of two classes: the first class concerns the variation that is a steady-state disturbance, characterized by a small deviation from its nominal value (cf. EN 50160), whereas the second class concerns events with a large deviation from its nominal value [15,16,17], such as supply interruption or outage, voltage sag, and swell. Plethora of literature indexes the electrical phasor as short path to the extraction of relevant disturbances parameters [18,19,20], and the phasor estimation is indexed as the main important step to assess the power quality disturbances, and it is clear that a fast, robust, and accurate estimator is required in [21]. For this purpose, phasor measurement units (PMUs) are used to estimate power system parameters, such as frequency, phasor, synchrophasor, and positive sequence voltages and currents [22,23,24], and can also provide trustworthy information on the distribution grid [25]. The international standard IEEE C37.118.1 [26] and IEEE C37.118.1a [27] define the synchrophasor and frequency requirements under steady-state and dynamic conditions in order to ensure reliability and interoperability among PMUs. In this standard, frequency error (FE) and total vector error ( T V E ) are the criterion used to assess the estimation performances of the frequency and the phasor under steady-state and dynamic conditions [28,29,30]. Moreover, two performance classes are defined in this standard:
  • P-class that deals with the measurement applications and it is applied for fast and dynamic events.
  • M-class refers to the applications that require a high estimation performances and requires a FE and T V E smaller than 5 mHz and 1 % , respectively.
In this paper, we will focus on the M-class. For this purpose, and in order to meet the estimation requirements provided in this standard, many techniques and methods have been studied according to the application [31] and according to the characterization of the studied disturbance, which can be an event or a transient. A survey and state of the art on signal processing techniques and methods were presented in [32], where the FFT and the RMS methodes are indexed as the widely used techniques to estimate the fundamental harmonic the amplitude of the phasor for steady state signals, and fail to estimate transient and extract instantaneous information [33,34]. It was also highlighted that the complexity and uncertainty associated with power quality requires investigation with advanced signal processing techniques [35,36,37]. The main purpose of this work is to present a comparative study of synchrophasor estimators obtained with the least square method and the Kalman filter in terms of T V E defined in the PMU standard [35,38,39,40,41]. Moreover, a simulation, real data-based validation, and comparison of both techniques using time-varying real power system signals were carried out. However, the authors of [35] have shown the usefulness of the above-cited synchrophasor estimators in a power quality context, this work provides a deeper study with further investigations to evaluate both estimation methods performance according to standard C37.118.2014 requirements.
This paper is organized as follows. Section 2 provides the characterization of the power quality disturbances. Section 3 presents the estimation method of the frequency and phasor and Section 4 focuses on simulation and real data-based performance evaluations.

2. Power Quality Disturbances Characterization

This section presents the characterization of power quality (PQ) disturbances, which is one of the most important PQ monitoring issue. The disturbances are characterized by international standard [15,16,17] and they depend on different parameters, i.e., frequency, amplitude, and initial phase, so the disturbance parameters estimation is of great important in the PQ disturbance characterization. For power quality disturbances characterization, some indices are reported in [35,42]. These indices and severity parameters depend on the type of the disturbance:
  • For individual events, magnitude and duration are investigated.
  • For steady-state disturbances, only are magnitude.
  • For intermittent disturbances, the frequency of occurrence is used as severity indices.
It will be noted that most PQ disturbances cause changes in the voltage waveforms, which is why PQ indices are developed for voltage waveforms that present a wide variety of characteristics.
In the next section, we present the three-phase and phasor models used for signal parameters estimation.

2.1. Three-Phase Signal Model

In this study, it is assumed that the three-phase system is working under noisy conditions and it does not contain any harmonics (A low pass-filter can be used to filter all harmonic components). For electric power system, the three-phase signals can be expressed as follows.
v a ( t ) = a a cos ( w t + α a ) + b a ( t ) , v b ( t ) = a b cos ( w t + α b ) + b b ( t ) , v c ( t ) = a c cos ( w t + α c ) + b c ( t ) ,
The nominal three-phase signal for phase m { a , b , c } is given in a general form by [43]
x m [ n ] = a m cos n ω 0 + φ m + b m [ n ] ,
where ω 0 refers to the normalized angular frequency, a m is the maximum amplitude, and φ m corresponds to the phase angle for phase m. b m [ n ] correspond to the additive Gaussian noise.

2.2. Phasor Model

In analytic representation, the signal model given in (2) can be related to a phasor concept that is a complex number representing the sinusoidal function. This representation allows analyzing linear power system under steady-state conditions. For phase m, the complex phasor is mathematically defined as
V m = a m e j φ m .
It should be mentioned that under steady-state conditions, the fundamental frequency ( f 0 ) is equal to the nominal value ( f n = 50/60 Hz) and the amplitudes ( a m ) are equal to 1 pu with a phase shift between phases equal to 120 [44,45]. In real power system, the signal parameters ( f 0 , a m , φ m ) deviate significantly from their nominal values. In this context, frequency and phasor estimation techniques are required in order to determine the parameters of PQ disturbance.

3. Frequency and Phasor Estimation Methods

This section presents frequency and phasor estimators based on advance signal processing methods. This estimation method can be divided into two steps: (1) we estimate the fundamental frequency from X, and (2) then, the phasors’ (amplitudes and initial phases) estimation can be obtained once the fundamental frequency is estimated. In the following subsections, we describe these two steps.

3.1. Frequency Estimator

Herein, we present a frequency estimation technique-based on maximum Likelihood technique. This technique uses the Newton–Raphson algorithm to optimize the likelihood function, this algorithm is presented in [29] where its straightforward implementation is described step by step. This frequency estimator has a high estimation performances for a small signal length [46]. In practice, we use the recorded data (N) from three-phase voltage to estimate the frequency of power system. Let consider that the signal sensors record N consecutive samples ( n = 0 , 1 , , N 1 ). By using the matrix form, the signal model defined in (2) can be described as [47]
X = A ( ω 0 ) C + B ,
where
  • X is a N × 3 matrix containing the three-phase recorded data and is given by
    X = x a [ 0 ] x b [ 0 ] x c [ 0 ] x a [ N 1 ] x b [ N 1 ] x c [ N 1 ] ,
  • B is N × 3 a that containing the noise samples and is defined as
    B = b a [ 0 ] b b [ 0 ] b c [ 0 ] b a [ N 1 ] b b [ N 1 ] b c [ N 1 ] ,
  • A is a N × 2 real-valued matrix and it is defined as
    A = 1 0 cos ( ω 0 ) sin ( ω 0 ) cos ( ω 0 ( N 1 ) ) sin ( ω 0 ( N 1 ) ) ,
  • C is a 2 × 3 real-valued matrix relying on the unknown phasors V m and it is defined as
    C = ( c a ) ( c b ) ( c c ) ( c a ) ( c b ) ( c c ) ,
where c m = a m exp ( j φ m ) , m a , b , c .
Under white Gaussian noise, the estimation of f can be obtained by minimizing the following cost function [46],
{ f ^ 0 , C ^ } = arg min f , C X A ( f ) C F 2 ,
where . F 2 corresponds to the Frobenius norm.
It will be noted that the cost function optimization in 7-dimensional space as expressed by Equation (9) is a challenging task in term of the frequency estimation. However, as the phasors C are linearly separable, the frequency and C estimations can be decoupled into two steps [46].
  • First, the f 0 estimation can be obtained by maximizing a 1-dimensional function.
  • Second, the C estimation can be obtained by replacing f 0 with its estimate f ^ 0 .
An iterative algorithm-based on Newton–Raphson method is used to maximizing the cost function. The estimation of the fundamental frequency is given by
f ^ 0 = arg max f J ( f ) ,
where the cost function J ( w ) is defined as
J ( w ) T r [ X T A ( w ) ( A T ( w ) A ( w ) ) 1 A T ( w ) X ] ,
where ( . ) 1 and ( . ) T are the matrix inverse and matrix transpose, respectively. T r [ . ] corresponds to the trace of an N-by-N square matrix, which is equal to the sum of the elements on the main diagonal.
In the forthcoming subsections, two techniques for phasor estimation are presented.

3.2. Phasor Estimation

This section presents two phasor estimators-based on advances signal processing methods, called least square and Kalman filter estimators.

Phasor Estimator-Based on Least Square Technique

After the estimation of the fundamental frequency ( f ^ 0 ), the estimate of the phasor matrix, C, is given by
C ^ = A T ( f ^ 0 ) A ( f ^ 0 ) 1 A T ( f ^ 0 ) ,
where f ^ 0 is the estimated value of the fundamental frequency by LSE presented in Equation (10). Using the definition C in Equation (8), the LS estimator of the phasor is therefore given by
V ^ a , V ^ b , V ^ c = 1 , j C ^ .

3.3. Phasor Estimator-Based on Kalman Filter Technique

Kalman filters are considered as a useful tools in power system applications. It is widely used for PQ disturbance estimation, such as transient, and for real-time tacking harmonics in power system protection [35,48]. In this study, Kalman filter is used to estimate the three-phase signal parameters. It can be described by the following state equation,
y [ n + 1 ] = D [ n ] y [ n ] + w [ n + 1 ] ,
where y[n + 1] is the state variables vector that has the unknown parameters to be estimated at instant n + 1 . D[n] corresponds to transition matrix and w[n + 1] refers to the additive noise vector. In this study, the additive noise, as an approximation, is supposed to be a white Gaussian noise with zero mean and variance σ 2 . The three-phase signals, under harmonic environment, on phase m can be rewritten as
V m [ n ] = h = 1 H S m , k c o s [ n ] + w m [ n ] ,
where H is the total number of harmonic in the three-phase system. S m , k c o s refers to kth harmonic component, k { 1 , , H } , and it is expressed as
S m , k c o s = a m , k cos ( n ω k + φ m , k ) .
Let consider the state variables S m , k [ n + 1 ] at instant n + 1 . Using trigonometric formulas, we obtain
S m , k [ n + 1 ] = a m , k cos ( ( n + 1 ) ω k + φ m , k )
= S m , k c o s [ n ] cos ( ω k ) S m , k s i n sin ( ω k ) .
One should note that the parameters a m , k , ω m , k , and φ m , k are constant in the interval [ n n + 1 ] . The three-phase signals do not contain any harmonic component, then the state transition matrix D is expressed as
D = cos ( ω 1 ) sin ( ω 1 ) sin ( ω 1 ) cos ( ω 1 )
The estimator-based on Kalman filter allows estimation of amplitudes and initial phases using the recorded data. The amplitude estimate is given by
S ^ m , k [ n ] = S m , k cos n 2 + S m , k sin [ n ] 2 ,
and the phase estimate is given by
φ ^ m , k [ n ] = arctan S m , k sin [ n ] S m , k cos [ n ] k ω k ,
For the fundamental frequency, k = 1 , the phasor estimate can be obtained by
V ^ m [ n ] = S ^ m [ n ] e ( j φ ^ m [ n ] ) .

4. Simulation and Real Data-Based Validation

The performances of least square estimator (LSE), provided in Equation (13), and those of the Kalman filter estimator (KFE), provided in Equation (22), are compared. The estimated frequency is the value that is maximizing the cost function, provided in Equation (10). This estimation is performed using the Newton–Raphson-based optimization algorithm proposed in [29] and it is resolved for four iterations.

4.1. Simulation Results

The IEEE has released a phasor PMU standard to assess the estimator performances. The standard C37.118.2014 defines the total vector error ( T V E ) to evaluate the performance of the phasors estimators. Monte Carlo simulations are carried out to evaluate the performances of the estimators in term of T V E . Under noiseless conditions, we present the mean value of the T V E criterion for M c = 1000 Monte Carlo trials by generating the input signal according to the model of signal in (2). The used parameters of three-phase signal are given in Table 1. Then, the mean of the T V E is defined as
T V E m , m e a n = 1 M c m c = 1 M c | V ^ m V m | | V m | ,
where V ^ m and V m correspond to the estimated phasor and real phasor, respectively, for the nth Monte Carlo trial.
The sampling frequency F s is set to F s = 48 × f n , where f n refers to the nominal frequency.
The objective of the next subsections is to show the effect of off-nominal frequency deviation, length signal, signal-to-noise ration ( S N R ) on the performance of estimators. The S N R can be expressed, in term of noise variance σ 2 and amplitudes a k where k { 0 , 1 , 2 } , as
S N R d B = 1 2 σ 2 k = 0 2 a k 2 .

4.1.1. Off-Nominal Frequency Effect on the Phasor Estimators Performance

In practical cases, the nominal frequency may deviate from its nominal value, i.e., f n = 50/60 Hz. In this section, we evaluate the influence of the frequency deviation on the performance of the phasor estimators. First, the angular frequency ω is set to ω 0 = ω n + δ , δ refers to the angular frequency deviation and ω n = 2 f n π F s . The frequency is estimated using the LS-based on Newton–Raphson (LS-NR) algorithm. The phasor estimation uses the estimated angular frequency, ω = ω ^ .
Figure 1 shows the T V E m e a n of least square and Kalman filter estimators. The number of samples, N, and the S N R are set to N = 144 samples and S N R = 100 dB, respectively. It can be clearly observed that the T V E m e a n of least square has a highest estimation performances ever under frequency deviation. The T V E m e a n of Kalman filter increases steadily when the frequency deviation is increasing. Under nominal conditions, the KF estimate is caused by the additive noise. These simulations highlight the influence of frequency deviation on the performances of the KF estimator.

4.1.2. Number of Samples Effect on the Phasor Estimators Performance

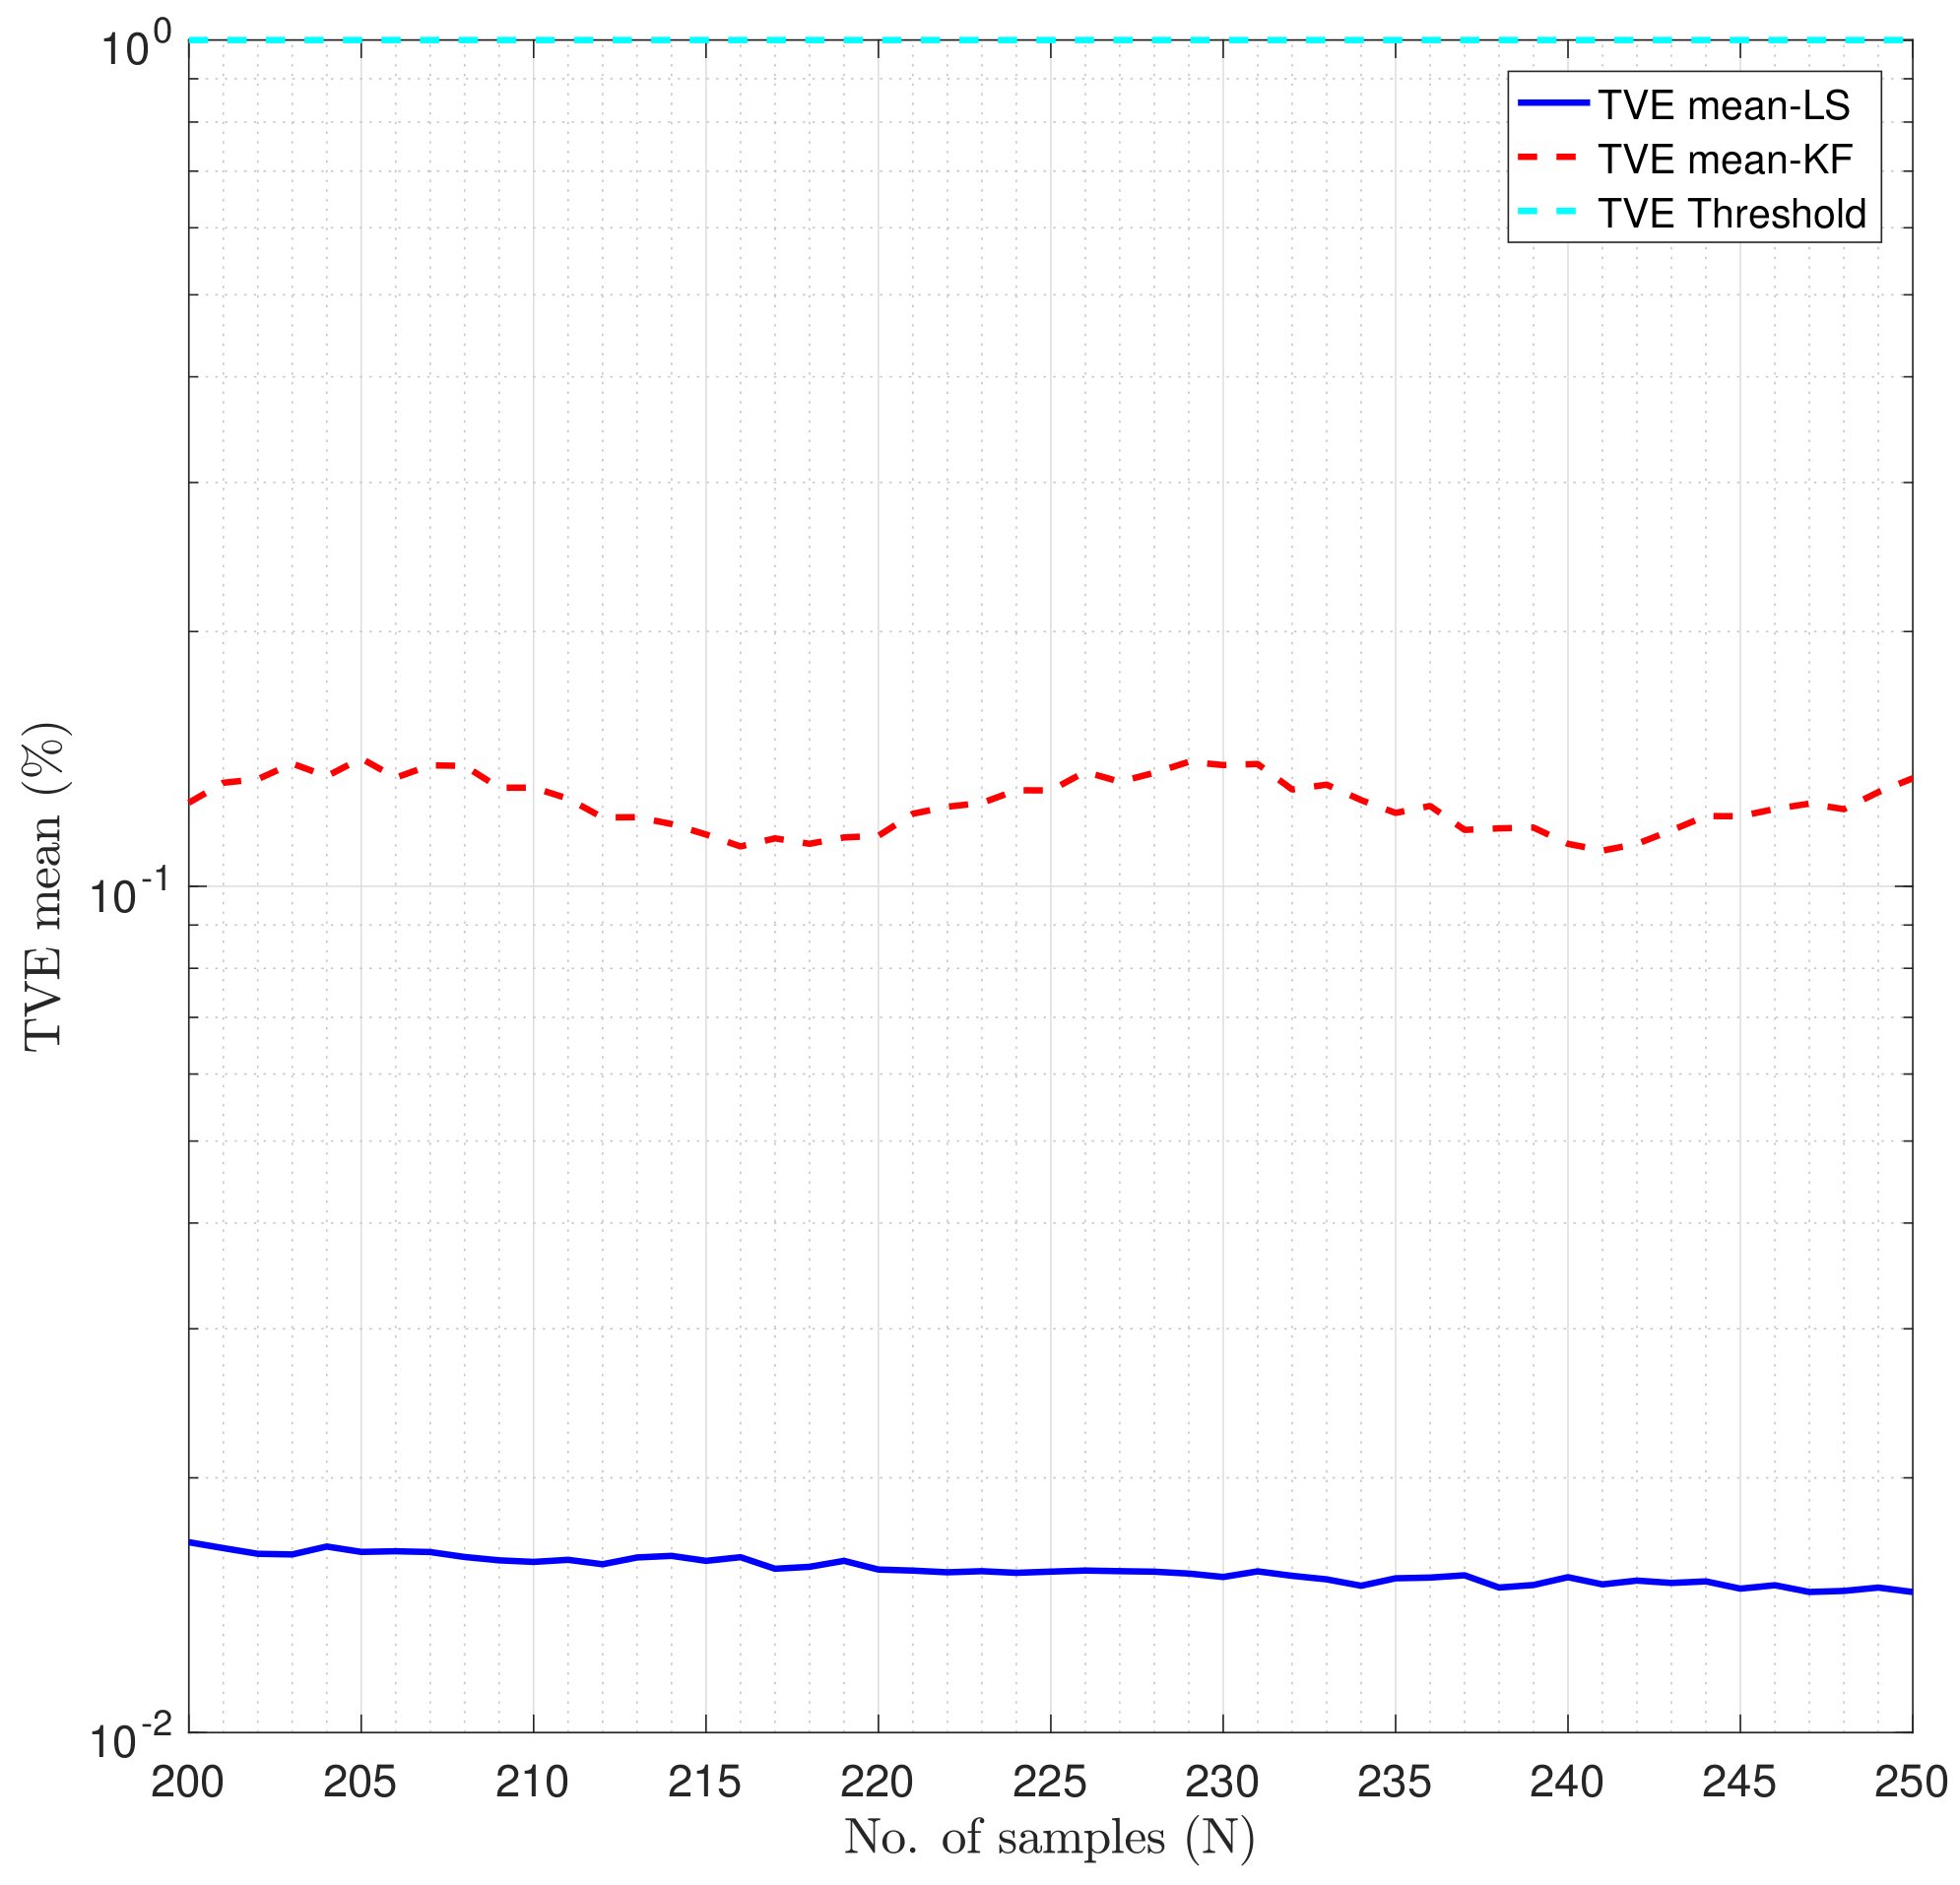
Figure 2 shows the T V E m e a n of LS-NR and KF-NR estimators versus number of samples, N. These simulations show that the LS-NR estimator outperforms the KF-NR estimator. Moreover, both estimators, LS-NR and KF-NR, are meeting the accuracy limit defined by the IEEE standard, that is, T V E < 1 % .

4.1.3. Noise Effect on the Phasor Estimators Performance

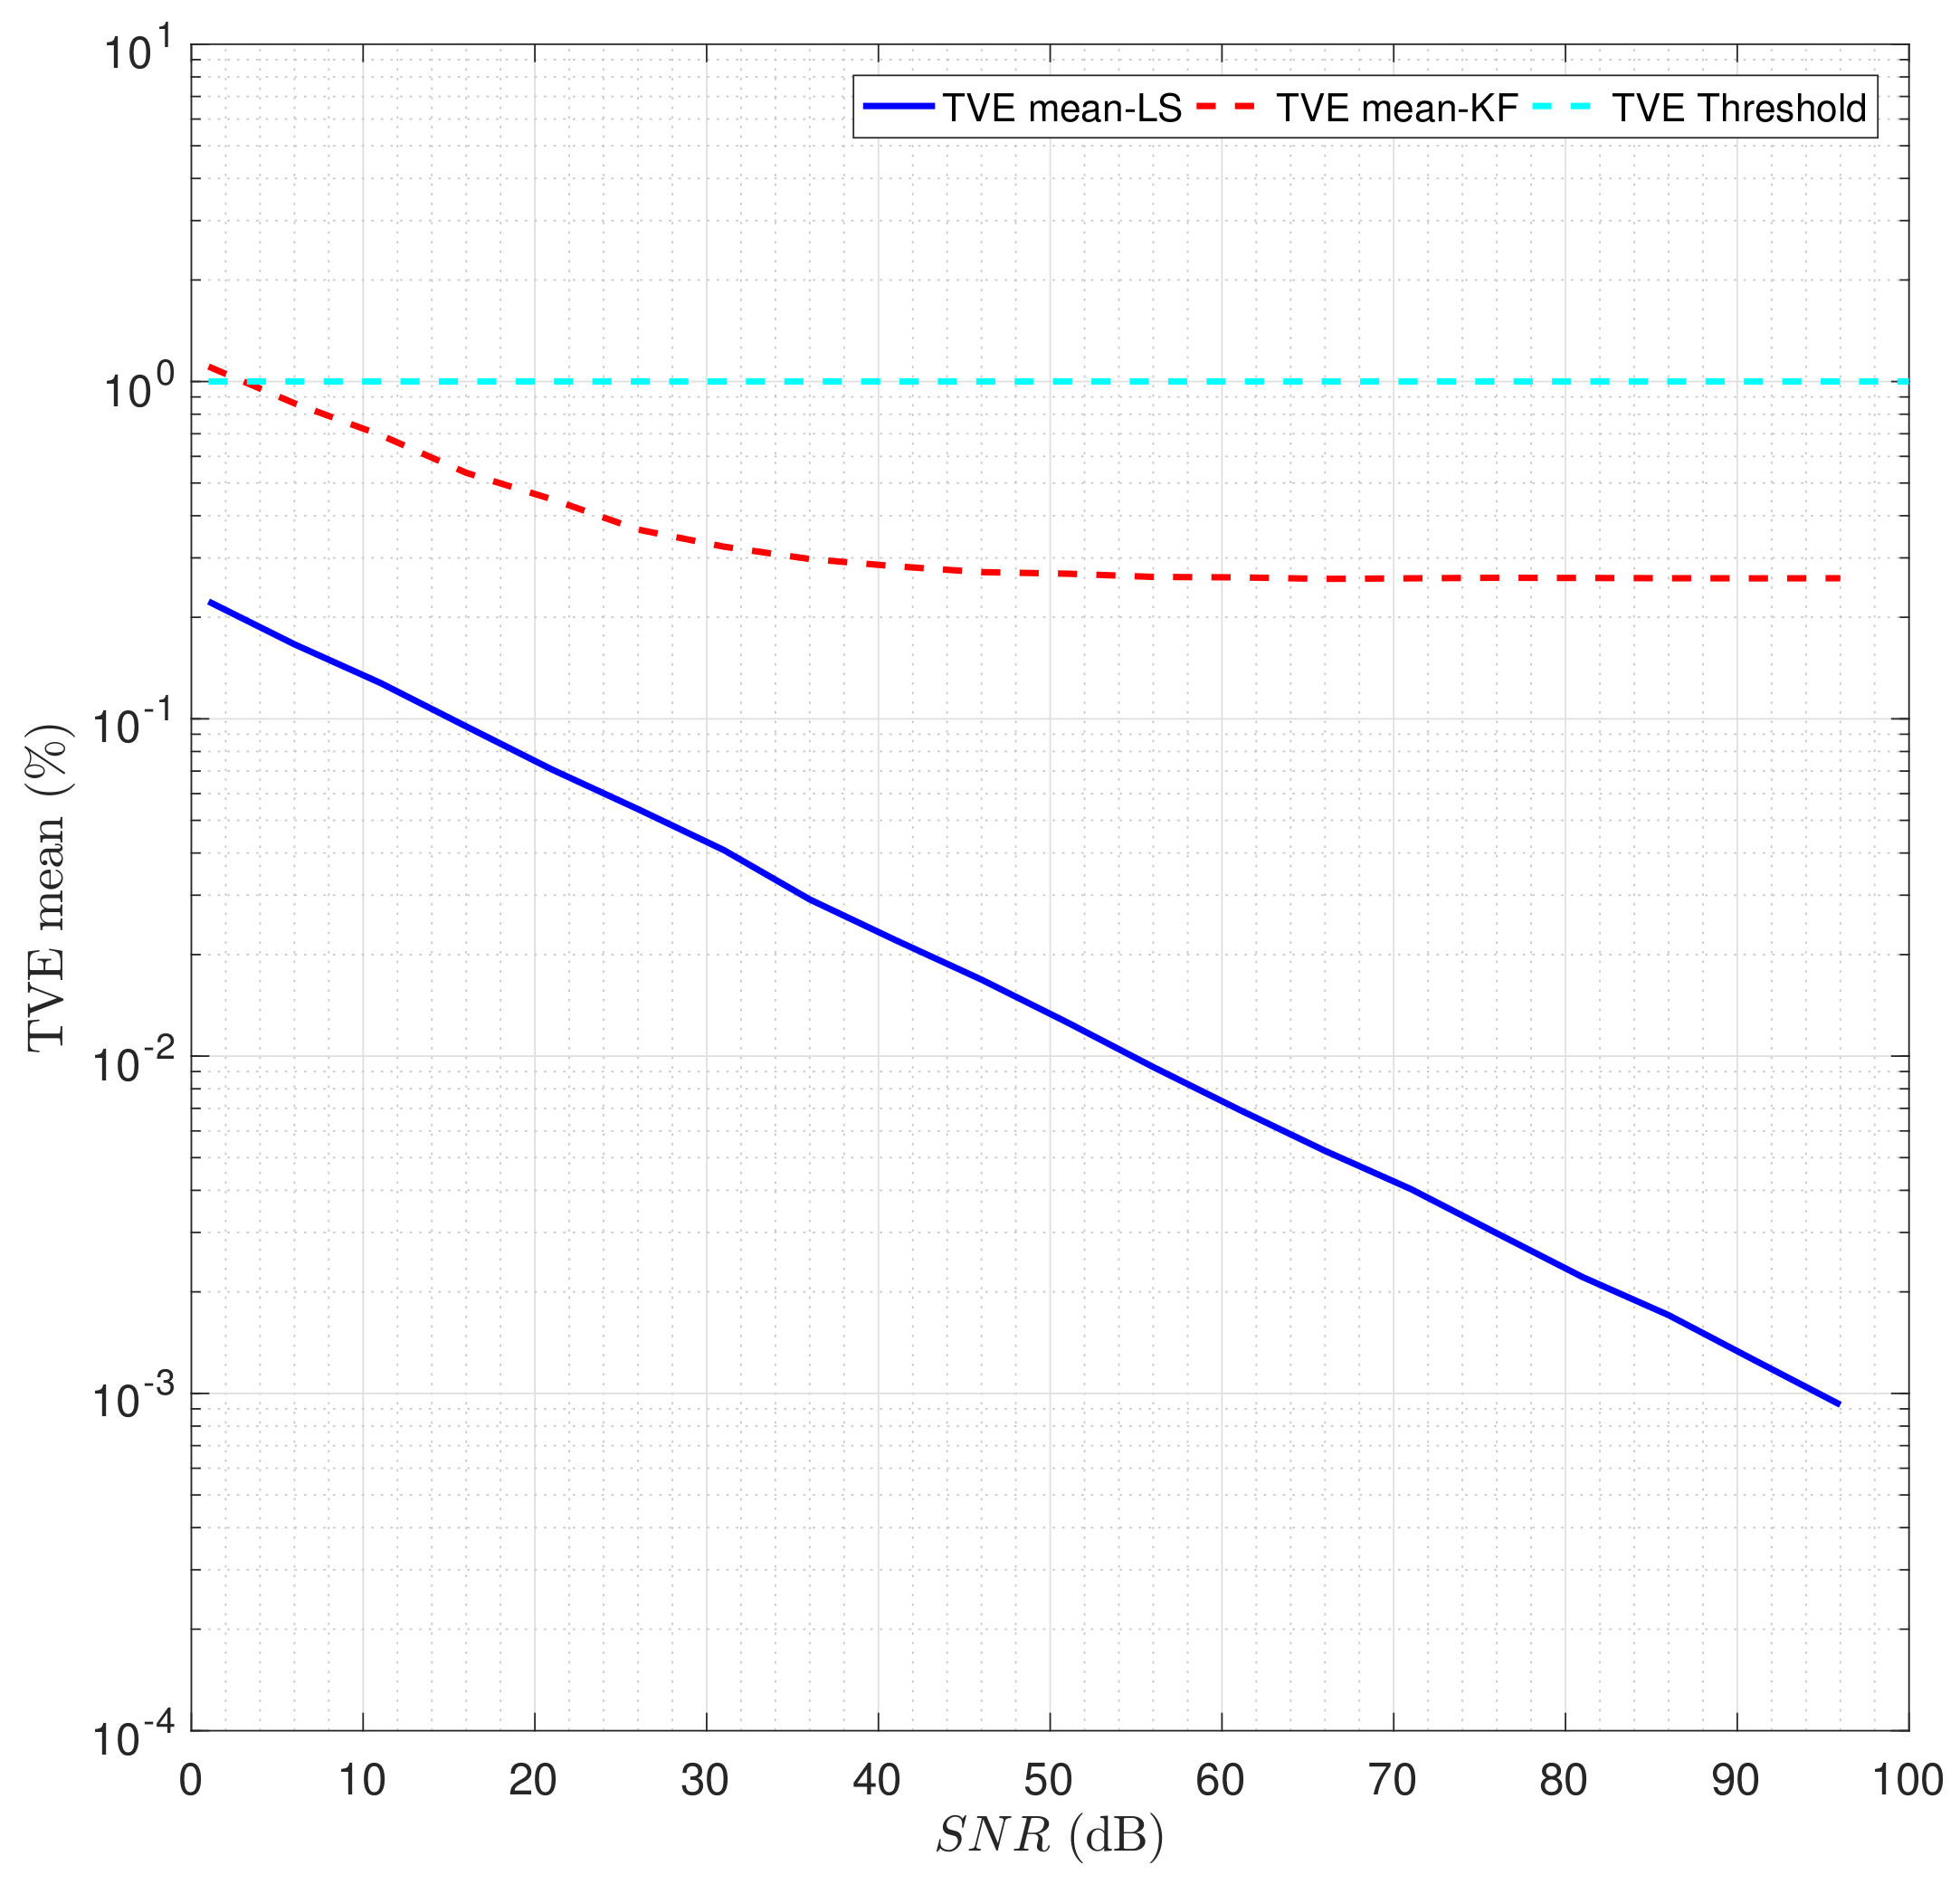
Figure 3 shows the T V E m e a n of LS-NR and KF-NR estimators versus noise, S N R , for N = 144 samples. The obtained results shows that the LS-NR estimator outperform the KF-NR estimator even for high value of the noise. For S N R levels > 4 dB, the KF-NR estimator can meet the requirement defined by the IEEE standard, whereas the KF-NR estimator can only meet this requirement for S N R > 8 dB. Additionally, both estimators cannot meet the IEEE requirement when the S N R is greater that 4 dB.

4.1.4. Harmonic Components Effect on the Phasor Estimators Performance

In real power system, the behaviour of nonlinear loads and electronics converters introduce harmonic components, this is an issue that should be taken in consideration [49]. Let us consider the signal model in (2), by adding harmonic components and we obtain
x m [ n ] = a m cos ( n ω 0 + φ ) + α h = 2 , 3 , 4 , 50 a m h cos ( h n ω 0 + φ m h ) + b m [ n ] ,
where a m h is the amplitude of the hth order harmonic and φ m h is the initial phase of the hth order harmonic. By varying the criterion α , we can vary the total harmonic distortion ( T H D ) of the signal. Then, the T H D is defined by the IEC standard 61000-4-7 as follows.
T H D F ( % ) = 100 α h = 2 a m h 2 2 a m
IEEE C37.118.2014 recommends adding to the fundamental signal each harmonic component up to 50th. Their amplitudes of harmonic components are set to a m h = 10 % pu and F s = 144 × 60 Hz.
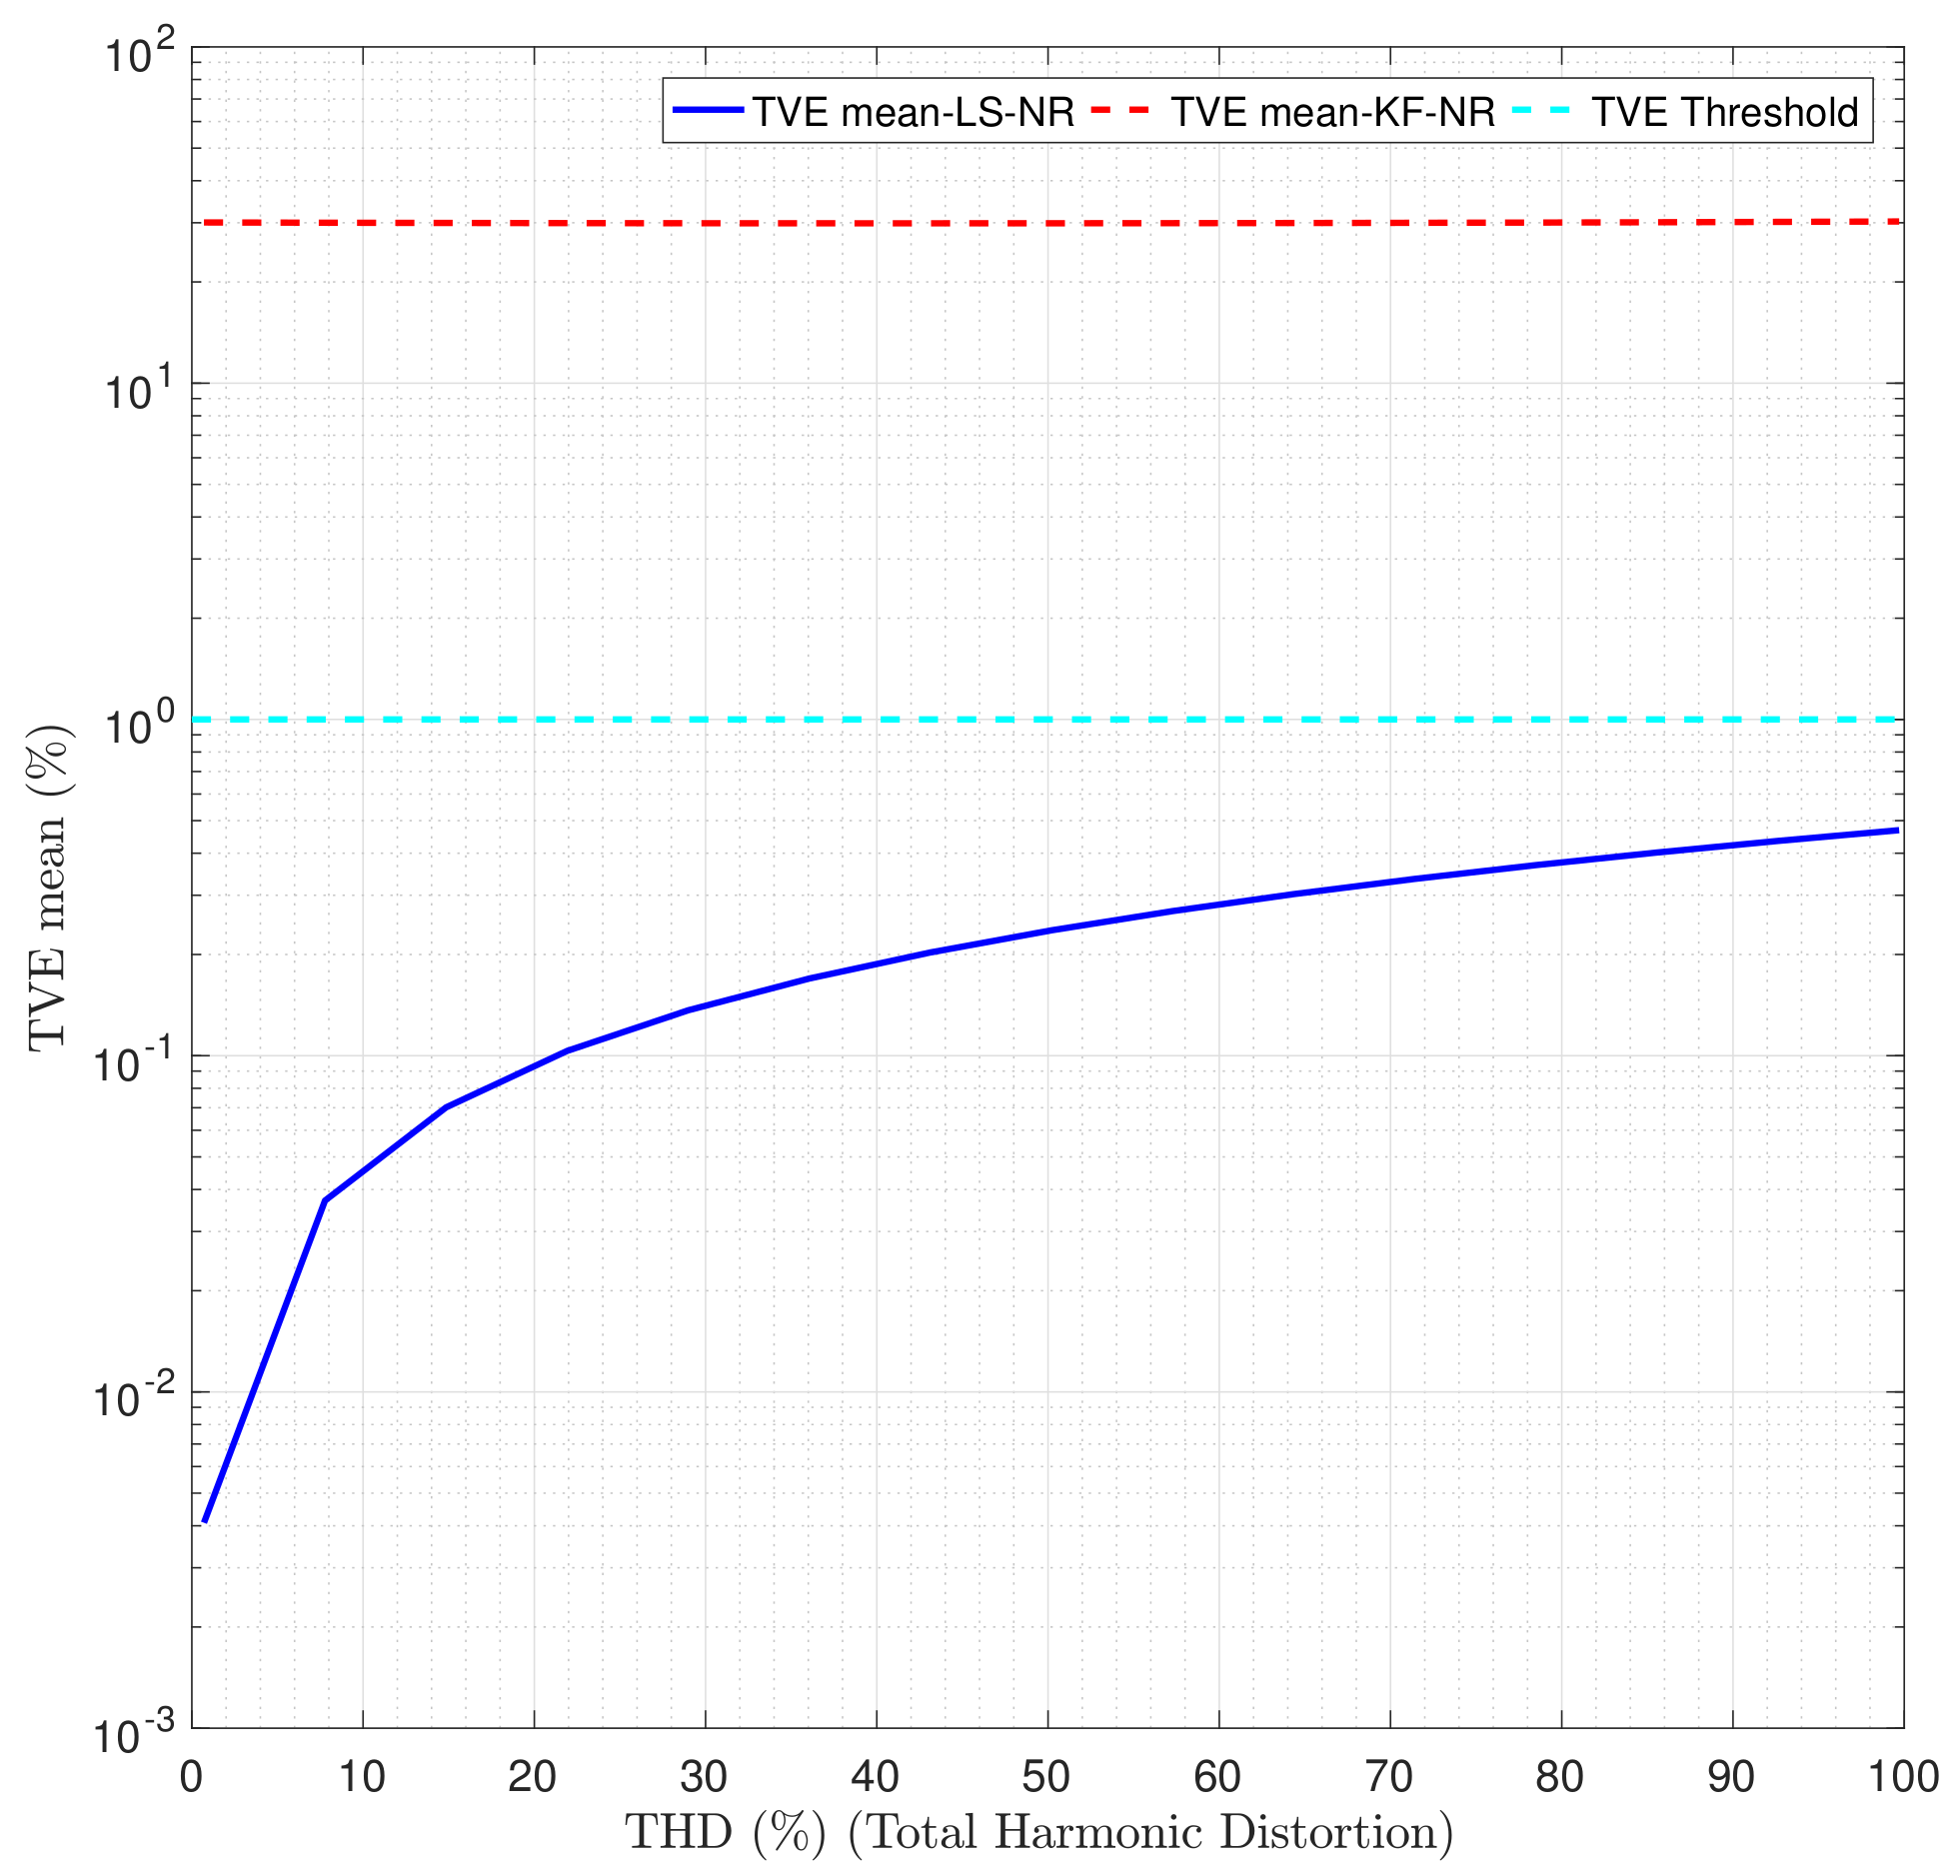
Figure 4 presents the T V E m e a n versus T H D . The obtained results show clearly that the harmonic components have a negative impact on the performances of LS-NR and KF-NR estimators. The estimation error of both estimators is increasing when the T H D f is increasing. This is caused by the reality of mismatch. Moreover, the LS-NR estimator has a better performances compared to those of the KF-NR estimator whatever the T H D F value is. The LS-NR estimator seems meeting on an average the standard limit, while the KF-NR estimator does not meet this requirement.
On the other hand, we have added two inter-harmonic components to analyze their effect on the phasor estimator performances. Their amplitudes and frequencies are set to a i h = 5 % pu and f i h 1 = 30 Hz f i h 1 = 85 Hz, respectively. Table 2 shows the T V E m e a n of the phasor estimators for N = 192 samples with noiseless signals. It can be seen in this Table that the estimations of LS-NR technique outperforms those obtained by KF-NR technique. The LS-NR estimator is only meeting the requirement of phasor estimation defined in the IEEE standard.

4.2. Performance Evaluation on Real World Data

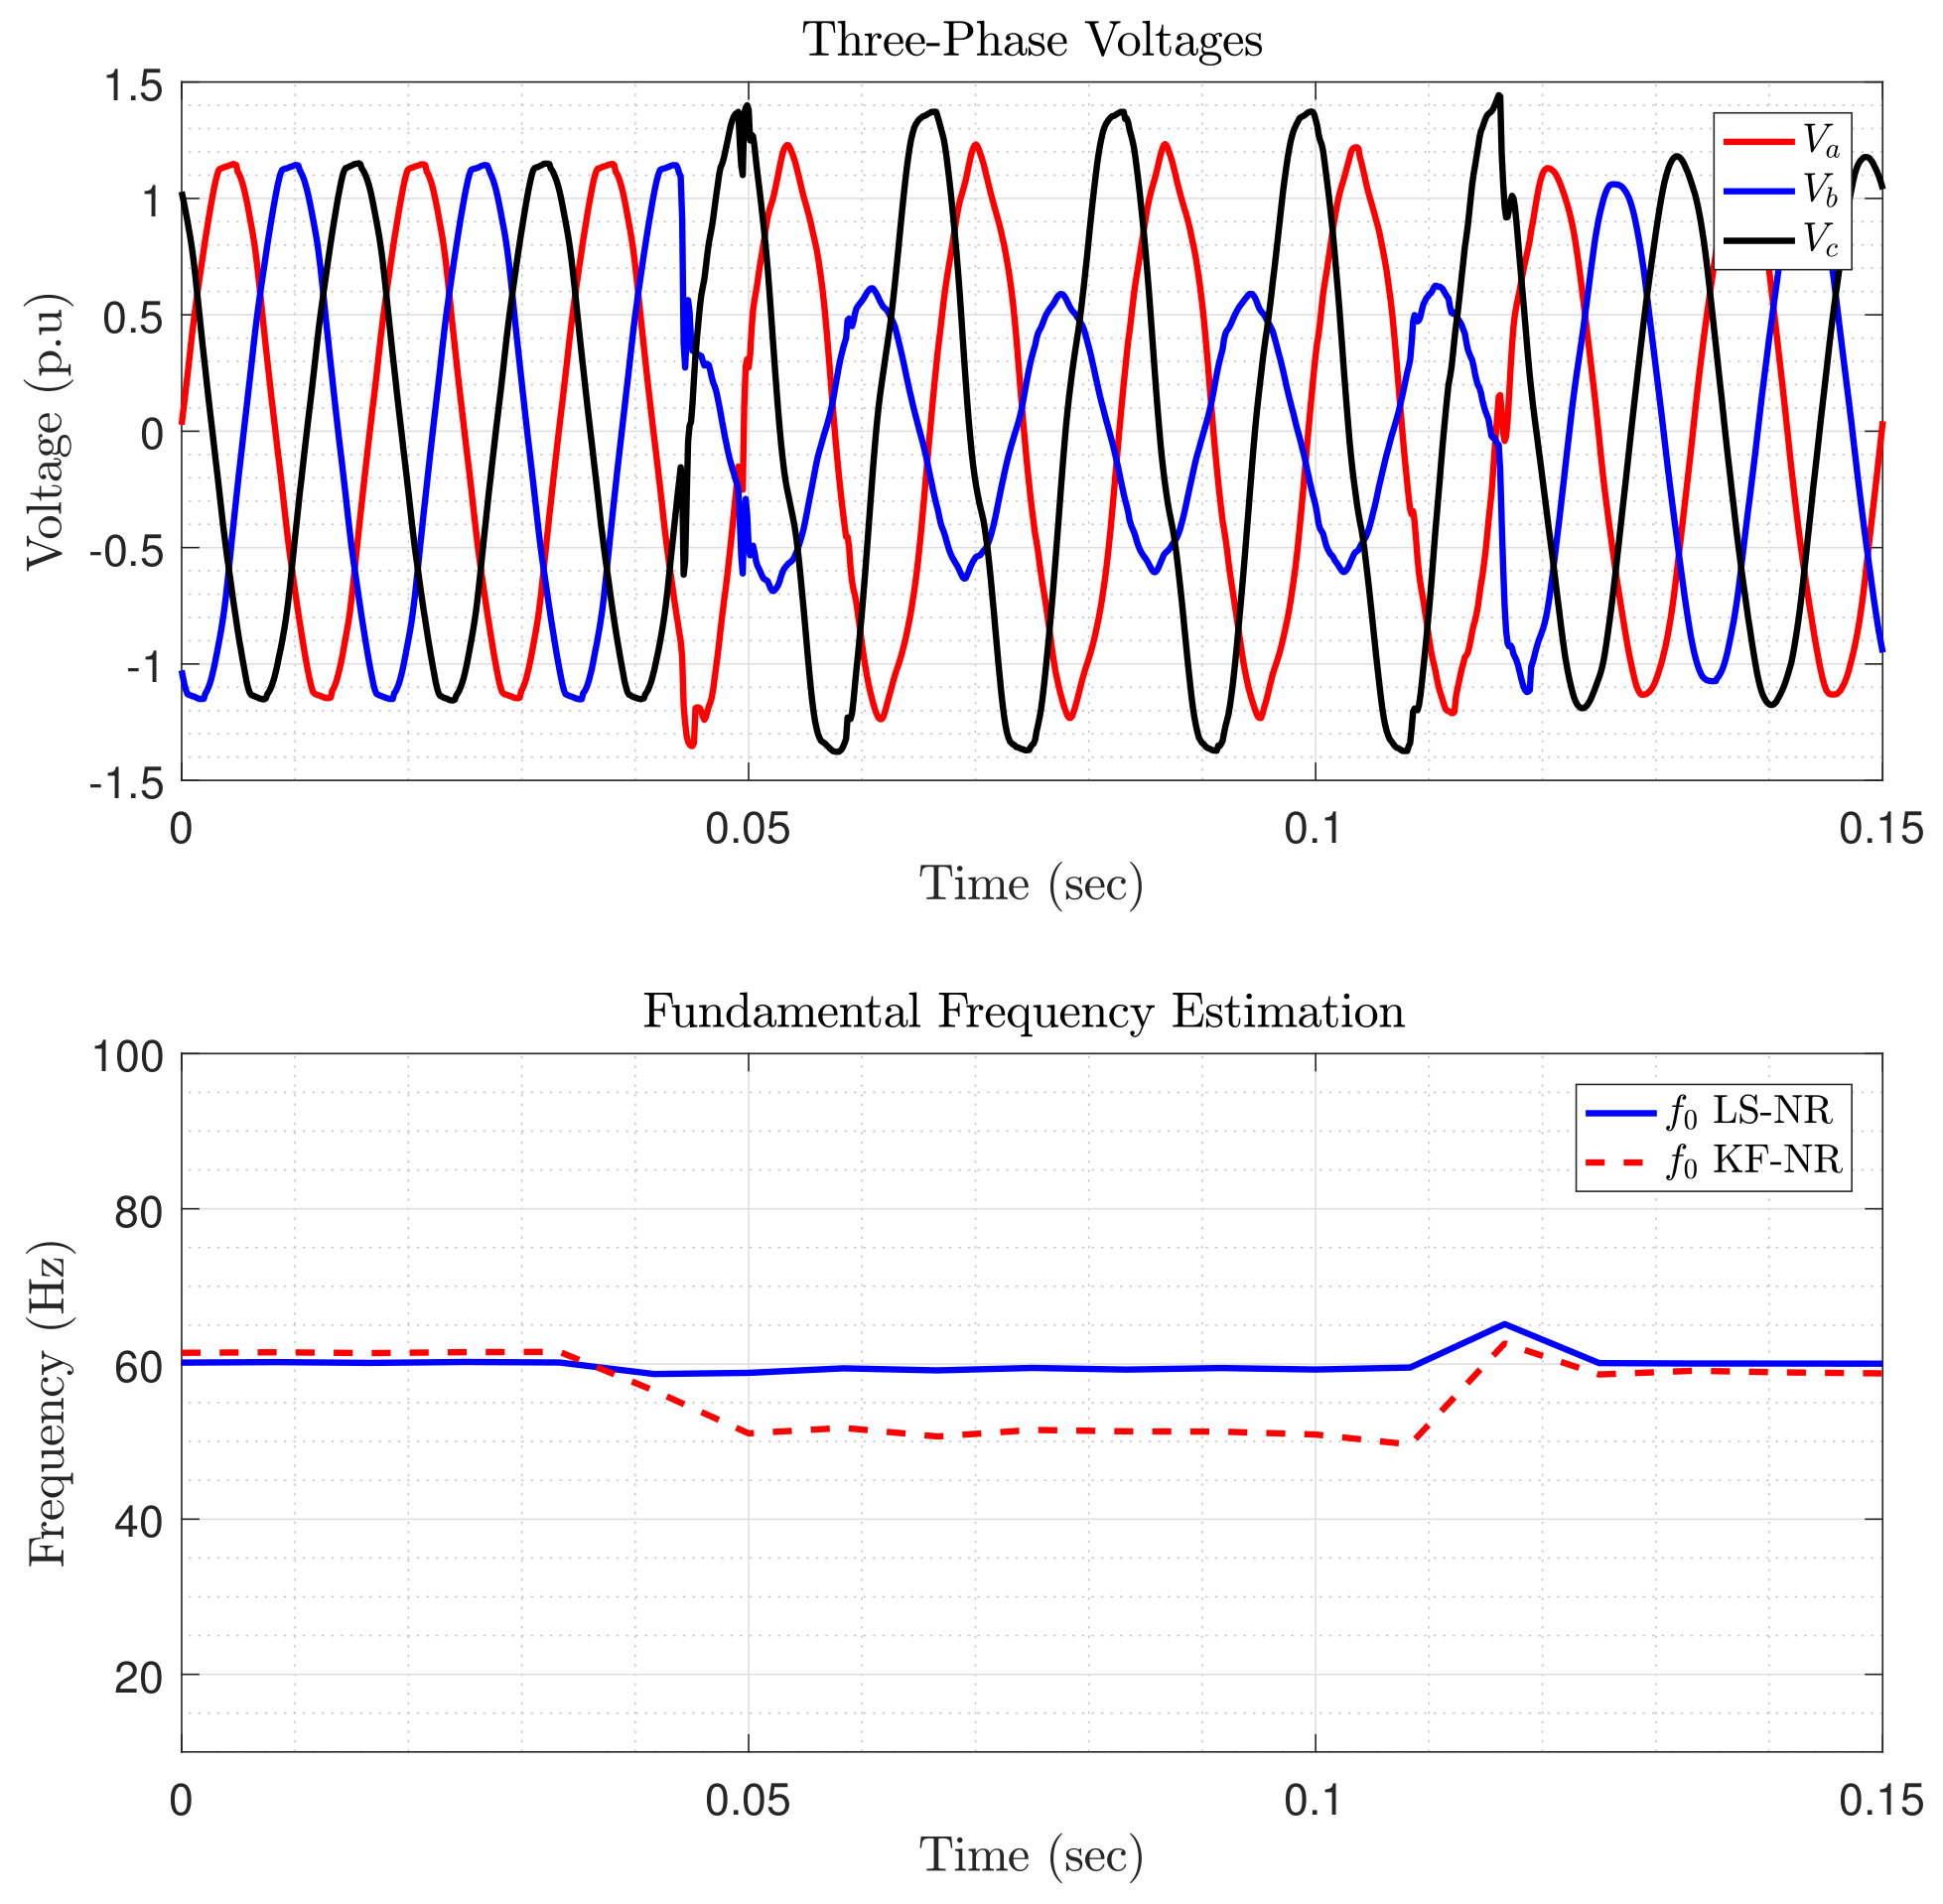
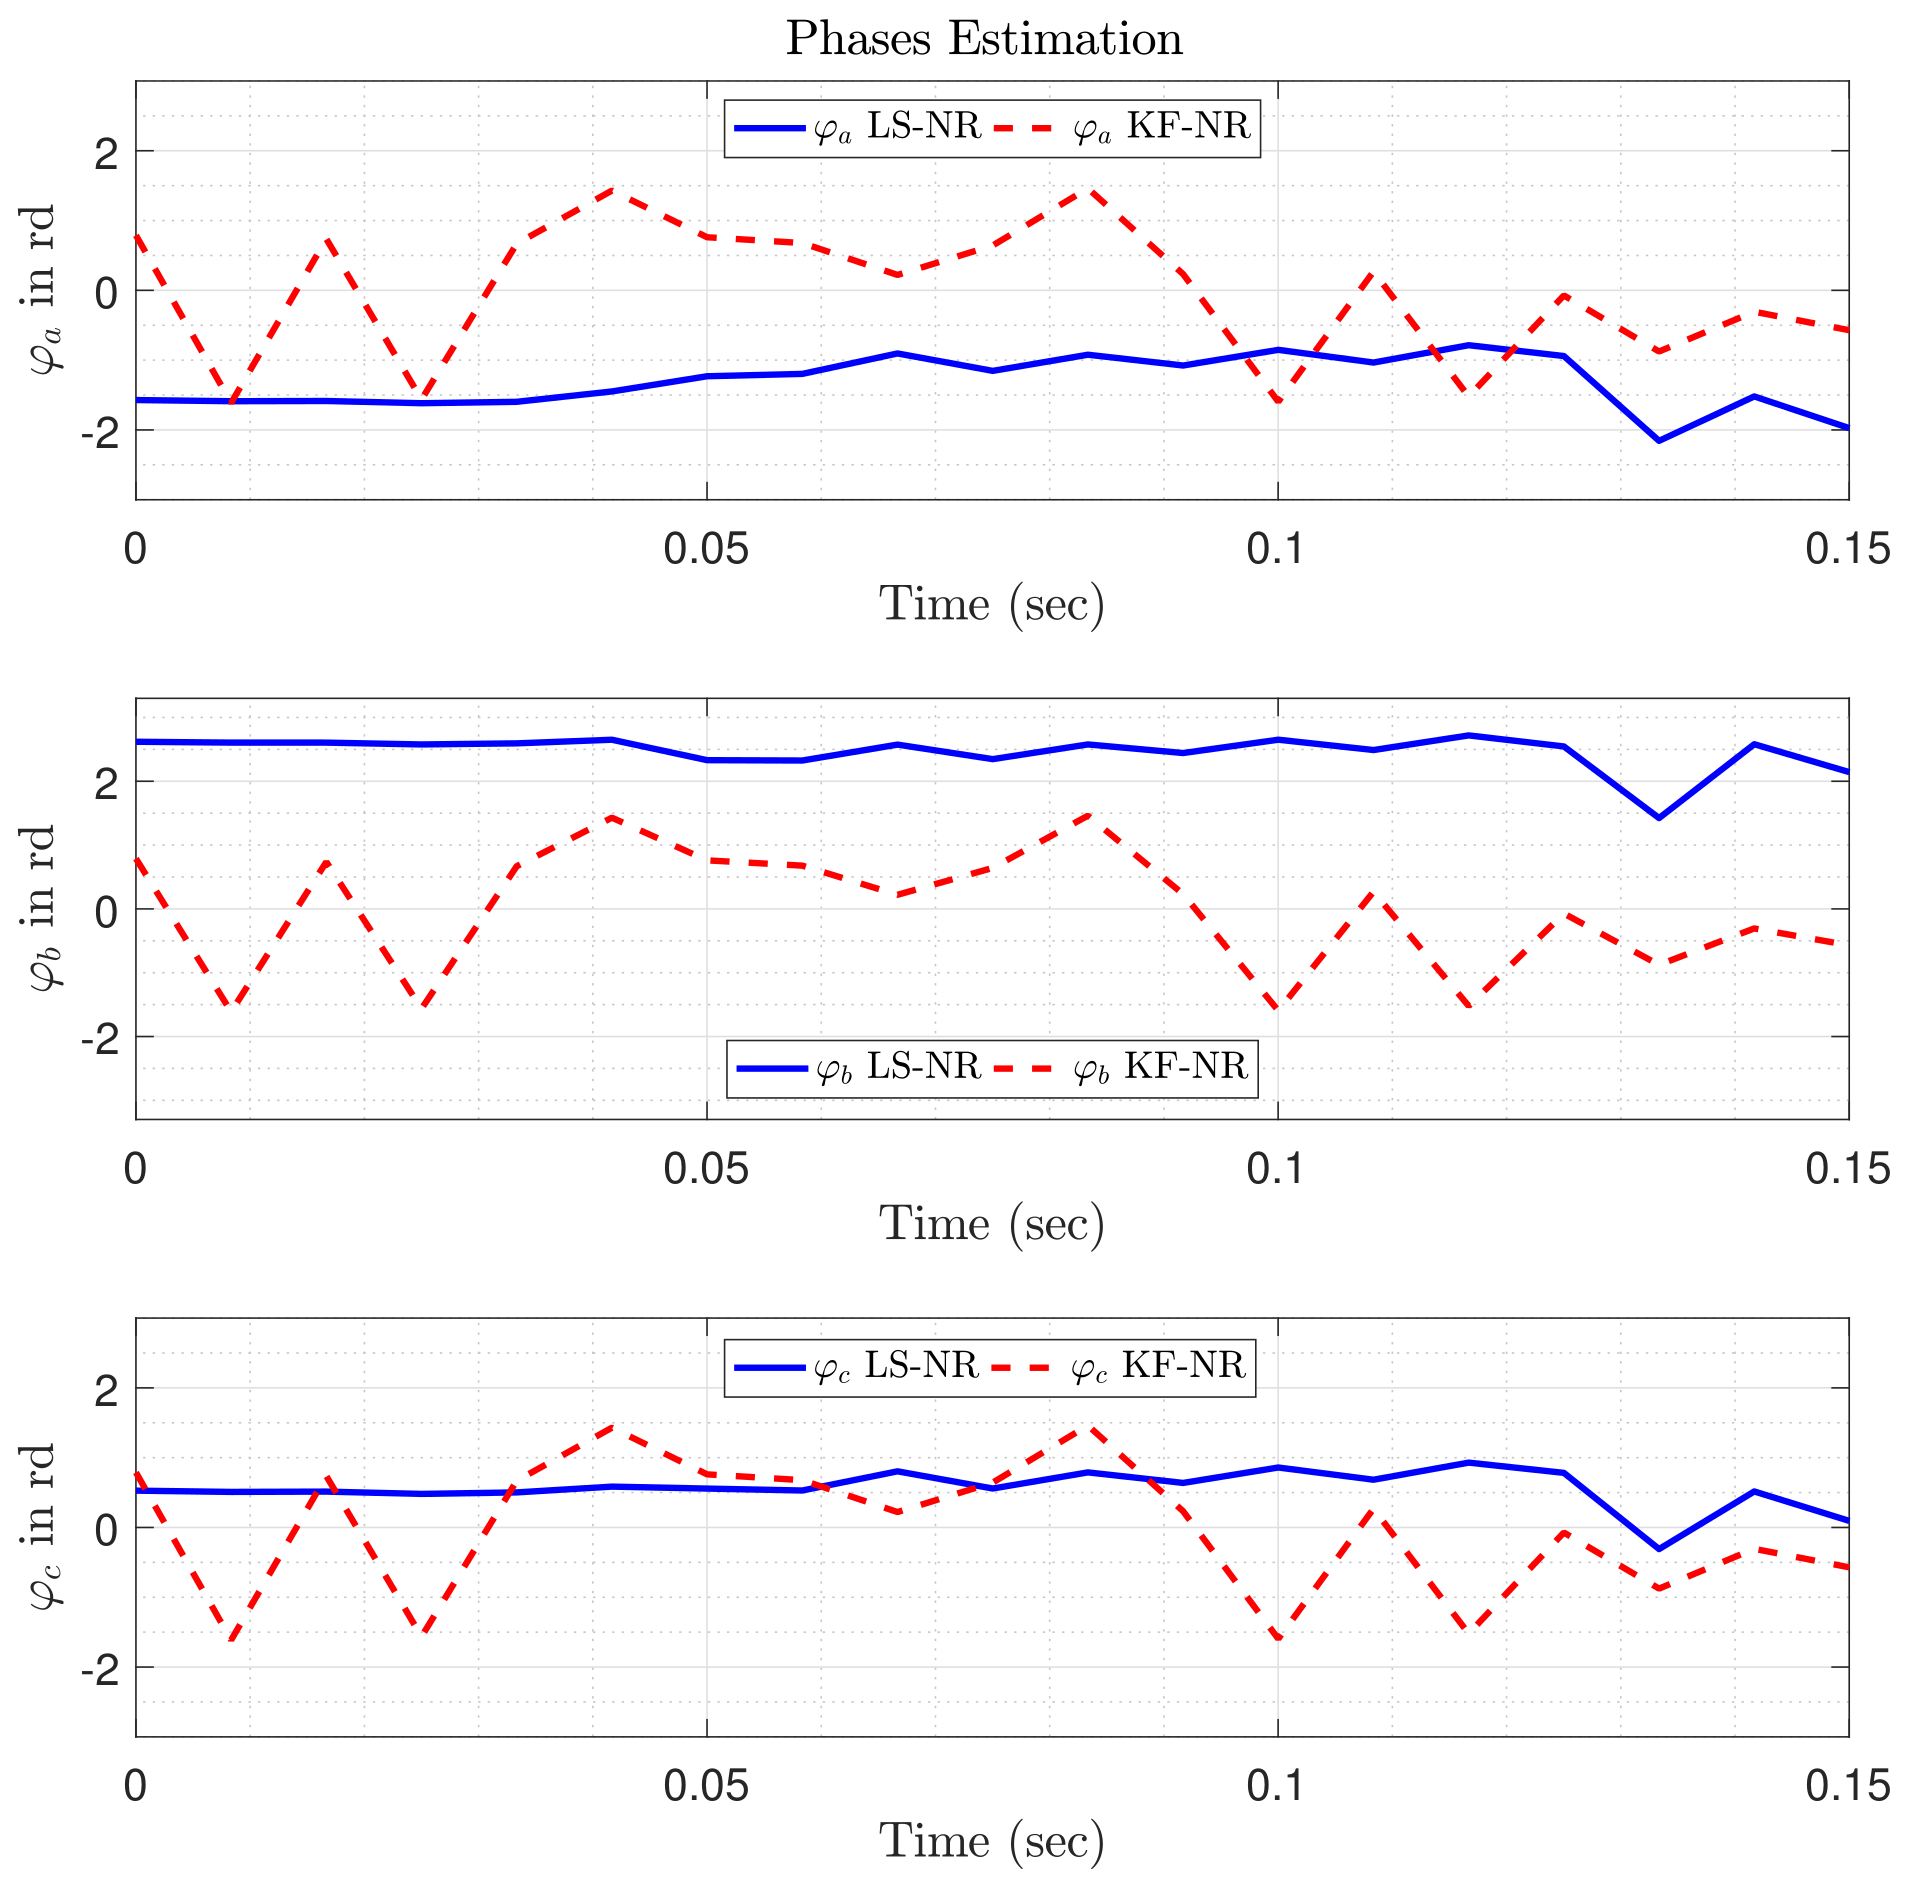
In this section, we evaluate the performance of LS-NR and KF-NR estimators using real power system data. These are obtained form DOE/EPRI National Database of Power System Events [50]. for the evaluation test, two events coded 2911 and 2912 in the database are investigated, they include balanced system, voltage sag, and swell caused by a fault on the transmission power system. Regarding the window length, N, we have used a N = 64 samples that allows the KF-NR estimate working under favorable conditions. Figure 5, Figure 6 and Figure 7 show the estimated frequency and phasor parameters for event 2911. It can be seen that LS-NR and KF-NR estimators lead to different results under balanced conditions, when 0 s < t < 0.04 s & 0.12 s < t < 0.16 s, and under unbalanced condition, when 0.04 s < t < 0.012 s. During the balanced conditions (0 s < t < 0.04 s). After 0.12 s (post-fault), the LS-NR estimators quickly converge to the nominal value with high estimation performance compared to the KF-NR estimator.
Figure 8, Figure 9 and Figure 10 present the estimated frequency and phasor parameters for event 2912. It can be seen that during balancing conditions, 0 s < t ≤ 0.04 s and 0.14 s < t ≤ 0.16 s, the LS-NR and KF-NR estimators converge quickly to the nominal value. However, the LS-NR estimator seems having a higher estimation compared to those of KF-NR estimator. After 0.04 s, the KF-NR estimator seems underestimating the voltage of phase a.

5. Conclusions

In this paper, a comparative study between the least square and Kalman filter estimators has been performed. This phasor estimation can be used and applied in PQ monitoring for a reliable operation of smart grid. For the frequency estimation, an optimization algorithm based on the Newton–Raphson method with four iterations has been used. According to IEEE standard C37.118, several simulation tests have been carried out and analyzed in order to evaluate and compare the performances of both techniques. The obtained simulation results show that the least square estimator clearly outperforms the Kalman filter estimator in term of T V E whatever the number of samples, noise, harmonics and interhamonics, and for off-nominal deviation. The simulation results have shown that the least square technique fulfills the requirements of the M-class in terms of T V E . Finally, the achieved results have clearly shown that under different disturbances environment and during frequency variation, the LS-NR estimator has a higher accuracy and speed performances than KF-NR estimator.

Author Contributions

Conceptualization, Y.A. and Z.O.; methodology, Y.A. and Z.O.; software, Y.A., Z.O.; validation, Y.A., Z.O. and M.B.; formal analysis, Y.A., Z.O. and M.B.; writing—original draft preparation, Y.A. and Z.O.; writing—review and editing, Y.A., Z.O., H.A., M.B. and T.W. All authors have read and agreed to the published version of the manuscript.

Funding

This research received no external funding.

Conflicts of Interest

The authors declare no conflicts of interest.

References

  1. McBee, K.D.; Simoes, M.G. Utilizing a smart grid monitoring system to improve voltage quality of customers. IEEE Trans. Smart Grid 2012, 3, 738–743. [Google Scholar] [CrossRef]
  2. Banerjee, P.; Srivastava, S. An Effective Dynamic Current Phasor Estimator for Synchrophasor Measurements. IEEE Trans. Instrum. Meas. 2015, 64, 625–637. [Google Scholar] [CrossRef]
  3. Amin, S.; Wollenberg, B. Toward a smart grid: Power delivery for the 21st century. IEEE Power Energy Mag. 2005, 3, 34–41. [Google Scholar] [CrossRef]
  4. Amirat, Y.; Oubrahim, Z.; Benbouzid, M.E.H. On phasor estimation for voltage sags detection in a smart grid context. In Proceedings of the 2015 IEEE ISIE, Buzios-Rio de Janiero, Brazil, 3–5 June 2015; pp. 1351–1356. [Google Scholar]
  5. Hu, J.; Zhu, J.; Platt, G. Smart grid the next generation electricity grid with power flow optimization and high power quality. In Proceedings of the 2011 IEEE ICEMS, Beijing, China, 20–23 August 2011; pp. 1–6. [Google Scholar]
  6. Farhangi, H. The path of the smart grid. IEEE Power Energy Mag. 2010, 8, 18–28. [Google Scholar] [CrossRef]
  7. Brown, M.A.; Zhou, S. Smart grid policies: An international review. Wiley Interdiscip. Rev. Energy Environ. 2013, 2, 121–139. [Google Scholar] [CrossRef]
  8. Bollen, M.H.; Gu, I. Signal Processing of Power Quality Disturbances; John Wiley & Sons: Hoboken, NJ, USA, 2006; Volume 30. [Google Scholar]
  9. Khokhar, S.; Zin, A.A.B.M.; Mokhtar, A.S.B.; Pesaran, M. A comprehensive overview on signal processing and artificial intelligence techniques applications in classification of power quality disturbances. Renew. Sustain. Energy Rev. 2015, 51, 1650–1663. [Google Scholar] [CrossRef]
  10. Bollen, M.H.; Bahramirad, S.; Khodaei, A. Is there a place for power quality in the smart grid? In Proceedings of the 16th International Conference on Harmonics and Quality of Power (ICHQP), Bucharest, Romania, 25–28 May 2014; pp. 713–717. [Google Scholar]
  11. Ghanavati, A.; Lev-Ari, H.; Stanković, A.M. A Sub-Cycle Approach to Dynamic Phasors With Application to Dynamic Power Quality Metrics. IEEE Trans. Power Deliv. 2018, 33, 2217–2225. [Google Scholar] [CrossRef]
  12. Ahmed, H.; Bierhoff, M.; Benbouzid, M.E.H. Multiple Nonlinear Harmonic Oscillator-Based Frequency Estimation for Distorted Grid Voltage. IEEE Trans. Instrum. Meas. 2019. [Google Scholar] [CrossRef] [Green Version]
  13. Bergen, A.R. Power Systems Analysis; Pearson Education India: Bengaluru, India, 2000. [Google Scholar]
  14. Fang, X.; Misra, S.; Xue, G.; Yang, D. Smart grid The new and improved power grid: A survey. IEEE Commun. Surv. Tutor. 2012, 14, 944–980. [Google Scholar] [CrossRef]
  15. Smith, J.C.; Hensley, G.; Ray, L. IEEE Recommended Practice for Monitoring Electric Power Quality. Revis. IEEE 2009. [Google Scholar] [CrossRef]
  16. Testing and Measurement Techniques–Power Quality Measurement Methods. In International Electrotechnical Commission Standard 61000-4-30; IEC: Geneva, Switzerland, 2015.
  17. Standard EN 50160. Voltage Characteristics of Electricity Supplied by Public Distribution Systems; Standard EN: Brussels, Belgium, 2002. [Google Scholar]
  18. Ribeiro, P.F.; Duque, C.A.; Ribeiro, P.M.; Cerqueira, A.S. Power Systems Signal Processing for Smart Grids; John Wiley & Sons: Hoboken, NJ, USA, 2013. [Google Scholar]
  19. Bollen, M.H.J.; Gu, I.Y.H.; Santoso, S.; Mcgranaghan, M.F.; Crossley, P.A.; Ribeiro, M.V.; Ribeiro, P.F. Bridging the gap between signal and power. IEEE Signal Process. Mag. 2009, 26, 12–31. [Google Scholar] [CrossRef]
  20. Achlerkar, P.D.; Samantaray, S.; Manikandan, M.S. Variational mode decomposition and decision tree based detection and classification of power quality disturbances in grid-connected distributed generation system. IEEE Trans. Smart Grid 2016, 9, 3122–3132. [Google Scholar] [CrossRef]
  21. Ahmed, H.; Benbouzid, M.; Ahsan, M.; Albarbar, A.; Shahjalal, M. Frequency Adaptive Parameter Estimation of Unbalanced and Distorted Power Grid. IEEE Access 2020, 8, 8512–8519. [Google Scholar] [CrossRef]
  22. Zhang, L.; Bose, A.; Jampala, A.; Madani, V.; Giri, J. Design, testing, and implementation of a linear state estimator in a real power system. IEEE Trans. Smart Grid 2016, 8, 1782–1789. [Google Scholar] [CrossRef]
  23. Jain, S.K.; Jain, P.; Singh, S.N. A fast harmonic phasor measurement method for smart grid applications. IEEE Trans. Smart Grid 2016, 8, 493–502. [Google Scholar] [CrossRef]
  24. Zhou, M.; Wang, Y.; Srivastava, A.K.; Wu, Y.; Banerjee, P. Ensemble-Based Algorithm for Synchrophasor Data Anomaly Detection. IEEE Trans. Smart Grid 2018, 10, 2979–2988. [Google Scholar] [CrossRef]
  25. Castello, P.; Muscas, C.; Pegoraro, P.; Sulis, S. PMU’s Behavior with Flicker-Generating Voltage Fluctuations: An Experimental Analysis. Energies 2019, 12, 3355. [Google Scholar] [CrossRef] [Green Version]
  26. IEEE Standard for Synchrophasor Measurements for Power Systems. In IEEE Standard C37.118.1-2011 (Revision IEEE Standard C37.118-2005); IEEE: Piscataway, NJ, USA, 2011.
  27. IEEE Standard for Synchrophasor Measurements for Power Systems Amendment 1: Modification of Selected Performance Requirements. In IEEE Standard C37.118.1a-2014 (Amendment to IEEE Standard C37.118.1-2011); IEEE: Piscataway, NJ, USA, 2014.
  28. Oubrahim, Z.; Choqueuse, V.; Amirat, Y.; Benbouzid, M.E.H. Disturbances Classification Based on a Model Order Selection Method for Power Quality Monitoring. IEEE Trans. Ind. Electron. 2017, 64, 9421–9432. [Google Scholar] [CrossRef] [Green Version]
  29. Oubrahim, Z.; Choqueuse, V.; Amirat, Y.; Benbouzid, M.E.H. Maximum-Likelihood Frequency and Phasor Estimations for Electric Power Grid Monitoring. IEEE Trans. Ind. Inf. 2018, 14, 167–177. [Google Scholar] [CrossRef]
  30. Rouhani, A.; Abur, A. Linear phasor estimator assisted dynamic state estimation. IEEE Trans. Smart Grid 2016, 9, 211–219. [Google Scholar] [CrossRef]
  31. Phadke, A.G.; Thorp, J.S. Synchronized Phasor Measurements and Their Application; Springer: Berlin, Germany, 2008. [Google Scholar]
  32. Oubrahim, Z. On Electric Grid Power Quality Monitoring Using Parametric Signal Processing Techniques. Ph.D. Thesis, Université de Bretagne Occidentale, Brest, France, 2017. [Google Scholar]
  33. Fitzer, C.; Barns, M.; Green, P. Voltage sag detection technique for a dynamic voltage restorer. IEEE Trans. Ind. Appl. 2004, 40, 203–212. [Google Scholar] [CrossRef]
  34. De Carvalho, J.; Duque, C. A PLL-Based Multirate Structure for Time-Varying Power Systems Harmonic/Interharmonic Estimation. IEEE Trans. Power Deliv. 2009, 24, 1789–1800. [Google Scholar] [CrossRef] [Green Version]
  35. Amirat, Y.; Oubrahim, Z.; Feld, G.; Benbouzid, M.E.H. Phasor estimation for power quality monitoring: Least square versus Kalman filter. In Proceedings of the IECON 2017 43rd Annual Conference of the IEEE Industrial Electronics Society, Beijing, China, 29 October–1 November 2017; pp. 4339–4343. [Google Scholar] [CrossRef]
  36. Ahmed, H.; Pay, M.L.; Benbouzid, M.; Amirat, Y.; Elbouchikhi, E. Hybrid estimator-based harmonic robust grid synchronization technique. Electr. Power Syst. Res. 2019, 177, 106013. [Google Scholar] [CrossRef]
  37. Ahmed, H.; Pay, M.L.; Benbouzid, M.; Amirat, Y.; Elbouchikhi, E. Gain normalized adaptive observer for three-phase system. Int. J. Electr. Power Energy Syst. 2020, 118, 105821. [Google Scholar] [CrossRef]
  38. Qi, J.; Taha, A.F.; Wang, J. Comparing Kalman filters and observers for power system dynamic state estimation with model uncertainty and malicious cyber attacks. IEEE Access 2018, 6, 77155–77168. [Google Scholar] [CrossRef]
  39. Zhao, J.; Mili, L. A robust generalized-maximum likelihood unscented Kalman filter for power system dynamic state estimation. IEEE J. Sel. Top. Signal Process. 2018, 12, 578–592. [Google Scholar] [CrossRef]
  40. Zhao, J.; Mili, L. A theoretical framework of robust H-infinity unscented Kalman filter and its application to power system dynamic state estimation. IEEE Trans. Signal Process. 2019, 67, 2734–2746. [Google Scholar] [CrossRef]
  41. Carquex, C.; Rosenberg, C.; Bhattacharya, K. State Estimation in Power Distribution Systems Based on Ensemble Kalman Filtering. IEEE Trans. Power Syst. 2018, 33, 6600–6610. [Google Scholar] [CrossRef] [Green Version]
  42. IEEE Working Group on Power Quality Data Analytics. Electrical Signatures Of Power Equipement Failures; Technical Report PES-TR73; IEEE Power & Energy Society: Piscataway, NJ, USA, 2009. [Google Scholar]
  43. IEEE. IEEE Standard Definitions for the Measurement of Electric Power Quantities Under Sinusoidal, Nonsinusoidal, Balanced, or Unbalanced Conditions; IEEE Press: Piscataway, NJ, USA, 2010; pp. 1–50. [Google Scholar]
  44. Laughton, M. Analysis of Unbalanced Polyphase Networks by the Method of Phase Co-ordinates. Part 2: Fault Analysis. Proc. Inst. Electr. Eng. 1969, 116, 857–865. [Google Scholar] [CrossRef]
  45. Bollen, M.H.J. Understanding Power Quality Problems; IEEE Press: New York, NY, USA, 1999; Volume 3. [Google Scholar]
  46. Kay, S.M. Fundamentals of Statistical Signal Processing, Volume I: Estimation Theory; Signal Processing; Prentice Hall: Upper Saddle River, NJ, USA, 1993. [Google Scholar]
  47. Gradshteyn, I.S.; Ryzhik, I.M. Table of Integrals, Series, and Products; Academic Press: Cambridge, MA, USA, 2014. [Google Scholar]
  48. De Apráiz, M.; Diego, R.; Barros, J. An Extended Kalman Filter Approach for Accurate Instantaneous Dynamic Phasor Estimation. Energies 2018, 11, 2918. [Google Scholar] [CrossRef] [Green Version]
  49. Begovic, M.M.; Djuric, P.M.; Dunlap, S.; Phadke, A.G. Frequency tracking in power networks in the presence of harmonics. IEEE Trans. Power Deliv. 1993, 8, 480–486. [Google Scholar] [CrossRef] [Green Version]
  50. DOE/EPRI National Database Repository of Power System Events: Online. 2016. Available online: http://pqmon.epri.com/disturbance_library/ (accessed on 18 December 2016).
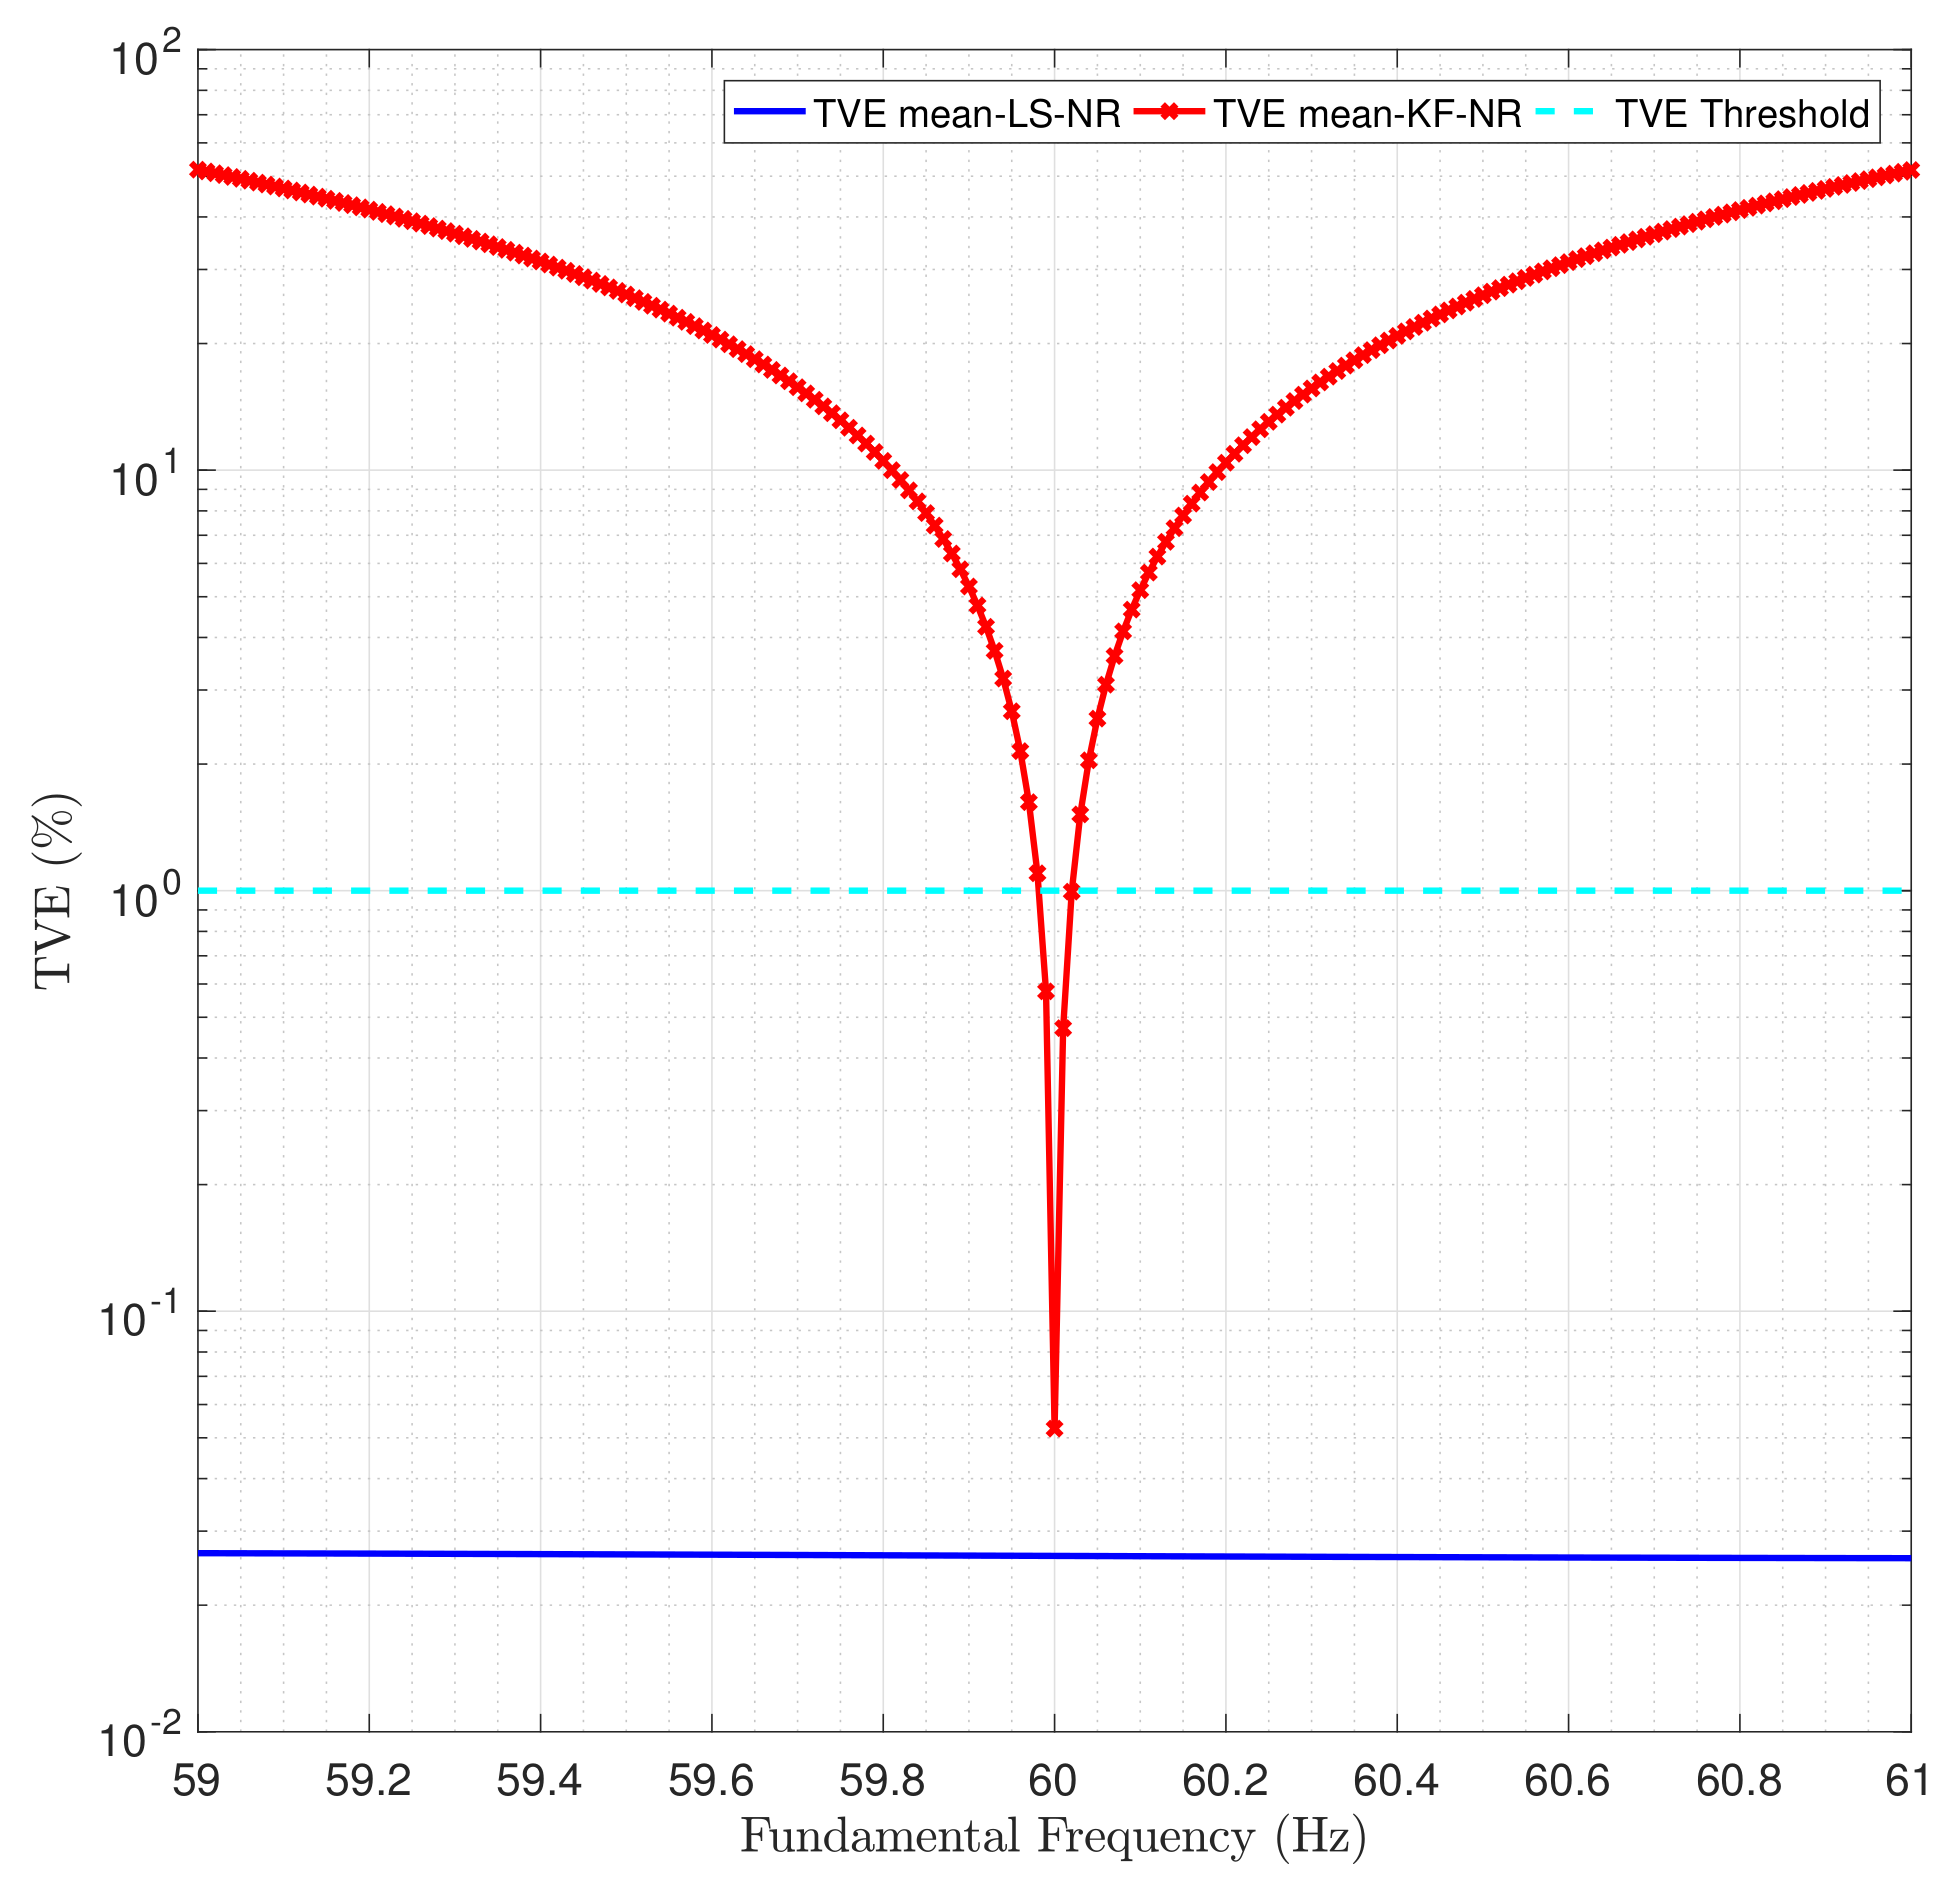
Figure 1. Mean T V E versus frequency deviation.
Energies 13 02456 g001
Figure 2. Mean total vector error ( T V E ) versus number of samples.
Energies 13 02456 g002
Figure 3. Mean T V E versus noise.
Energies 13 02456 g003
Figure 4. Mean T V E versus total harmonic distortion ( T H D ).
Energies 13 02456 g004
Figure 5. Three-phase voltages and estimated frequency (event 2911).
Energies 13 02456 g005
Figure 6. Amplitude variation of phasors: Comparison between least square (LS) and Kalman filter (KF) using NRA estimations (event 2911).
Energies 13 02456 g006
Figure 7. Phases variation of phasors: comparison between LS and KF using NRA estimations (event 2911).
Energies 13 02456 g007
Figure 8. Three-phase voltages and estimated frequency (event 2912).
Energies 13 02456 g008
Figure 9. Amplitude variation of phasors: Comparison between LS and KF using NRA estimations (event 2912).
Energies 13 02456 g009
Figure 10. Phases variation of phasors: comparison between LS and KF using NRA estimations (event 2912).
Energies 13 02456 g010
Table 1. Three-phase signal parameters.
a a a b a c φ a φ b φ c f n F s
1 pu1 pu1 pu 0 120 240 602880
Table 2. T V E versus interhamonic components for N = 144 samples & S N R = 150 dB.
LSEKFE
f i h 1 = 33 Hz0.731.45
f i h 2 = 93 Hz0.583.45
f i h 3 = 153 Hz0.222.23