Article

Sliding Mean Value Subtraction-Based DC Drift Correction of B-H Curve for 3D-Printed Magnetic Materials

1
Department of Electrical Power Engineering and Mechatronics, Tallinn University of Technology, 19086 Tallinn, Estonia
2
Department of Electrical Engineering and Automation, Aalto University, FI-00076 Espoo, Finland
3
Department of Electrical Machine and Apparatus, Riga Technical University, LV-1658 Riga, Latvia
*
Author to whom correspondence should be addressed.
Energies 2021, 14(2), 284; https://doi.org/10.3390/en14020284
Submission received: 3 December 2020 / Revised: 30 December 2020 / Accepted: 4 January 2021 / Published: 6 January 2021
(This article belongs to the Special Issue Magnetic Material Modelling of Electrical Machines)

Abstract

:
This paper presents an algorithm to remove the DC drift from the B-H curve of an additively manufactured soft ferromagnetic material. The removal of DC drift from the magnetization curve is crucial for the accurate estimation of iron losses. The algorithm is based on the sliding mean value subtraction from each cycle of calculated magnetic flux density (B) signal. The sliding mean values (SMVs) are calculated using the convolution theorem, where a DC kernel with a length equal to the size of one cycle is convolved with B to recover the drifting signal. The results are based on the toroid measurements made by selective laser melting (SLM)-based 3D printing mechanism. The measurements taken at different flux density values show the effectiveness of the method.

1. Introduction

Unlike subtractive and injection molding-based manufacturing techniques, additive manufacturing (AM) is gaining heightened popularity. It is also known as 3D printing, where any object can be built layer upon layer using any AM technique. The most common AM techniques include powder bed fusion (PBF), bed jetting (BJ), direct energy deposition (DED), material extrusion (ME), material jetting (MJ), sheet lamination (SL), vat polymerization (VP), etc. However, in electrical machines, direct laser melting (DLM) (a subcategory of PBF) has proven its effectiveness. Various materials such as metals, thermoplastics, ceramics, and biochemicals can be handled through AM techniques. The capability to design complex geometries, to create relatively lightweight products, to perform rapid prototyping, and to save time, as well as the lack of need for fixtures or dies, are the prominent advantages of this technology.
The growing AM-related technological advancements and complex geometries of electrical machines are persuading researchers to test 3D printing in this field. Electrical machines contain various materials such as copper, silicon steel (SiFe), insulation materials, etc. Although the printing of a complete machine in one set has not been achieved so far, the production of separate portions and their assembly afterward is used for various machines. The printing and assembly of motor parts, such as soft magnetic rotors [1,2], stators [3,4], electrical windings [5,6], bearings [7], heat exchangers [8,9], and insulations [5], can lead toward the production of any electrical machine.
Electrical machines are a combination of non-magnetic, with high electric conductivity, magnetic, with low electric conductivity, and dielectric materials, with no electric conductivity. These materials make the coils, cores, and insulation parts of electrical machines. The selection of any appropriate composite material with fixed proportions of different elements is essential for better electrical machine performance. The composition of different materials can have a prominent effect on the core’s magnetic properties, which can change the iron losses. The printing of several different materials using selective laser melting (SLM) is available in the literature. The SLM fabrication of conductive (Cu [10], AISi10MG [11]) and soft ferromagnetic (FeSi6.7 [12], FeSi6.9 [13], FeSi3 [14], Fe-Co-V [15], Fe-Ni-Si [16]) materials are well explained in the literature.
A slight variation in the proportion of the materials can produce dramatic changes in their magnetic characteristics. This makes the investigation of the B-H curve of the design material very important. The most common way to characterize any magnetic material is through its hysteresis loop measurement. Commercial hysteresis loop tracers are designed for traditional hard magnetic materials. For soft magnetic materials, custom measurement setups, designed according to the sample’s particularities and the measurement objectives, are used. Unlike planar samples, closed circuits (e.g., toroid) are good choices to determine the material’s magnetic characteristics. The toroidal structure is preferred because it has the least demagnetizing effects. Furthermore, they can be used to obtain magnetic anisotropy by torque magnetometry.
The biggest challenge in the measurement of an accurate hysteresis loop is the integrator DC drift. The leading causes of this drift include data acquisition setup offset values, thermal shift of parameters, impedance mismatch among various components of the measurement setup, and additive white gaussian noise (AWGN). This drift becomes very significant when many cycles need to be measured, such as toroidal samples where the maximum magnetic flux density is much larger in value than the coercivity [17]. The coercivity and remanence measurement depends upon the points where the hysteresis loop cut the B and H axis. Hence those points should be in a narrow range. Commercial integrators give a correction range up to 2 μWb/min [18], which is not enough for signals with a long measurement time. Some solutions to remove the DC drift are proposed in the literature, but they possess drawbacks, such as the following:
(1)
The constant drift assumption [19,20,21] does not remain valid when the measurement time is extended. This is due to the presence of switching frequency-based noise in the digital data acquisition setup, which worsens the problem.
(2)
The removal of DC drift by subtracting an approximate polynomial data fitting function from the signal [17] does not consider all cycles separately. It can give good results when the number of measured cycles is high enough, which is difficult to obtain under low-frequency measurements—furthermore, the presence of switching noise increases approximation.
This work presents an algorithm to effectively remove the drift due to the DC offset of the data acquisition setup. This technique has not been previously presented in literature to the best of the authors’ knowledge. Unlike constant and approximate polynomial data fitting functions, the proposed algorithm detects the drift at each sample, making it independent of signal length. For this purpose, the measured signals are convolved with a kernel function to get a sliding mean value function (SMVF). The subtraction of SMVF from corresponding measured signals reduces the DC drift significantly. Additionally, the high-frequency switching noise is reduced using infinite impulse response (IIR) low pass filters [22,23]. For the validation, a 3D-printed toroid is tested under different values of maximum flux density.

2. The Proposed Algorithm

A flowchart diagram of the proposed algorithm is presented in Figure 1. A detailed explanation of all steps is provided below.

2.1. Data Acquisition and Initial Processing

  • Measure the input primary current I [n] and output secondary voltage V [n] with reasonable sampling frequency Fs. If spectrum analysis is also required along with the B-H curve, the minimum sampling frequency should follow the Nyquist criterion.
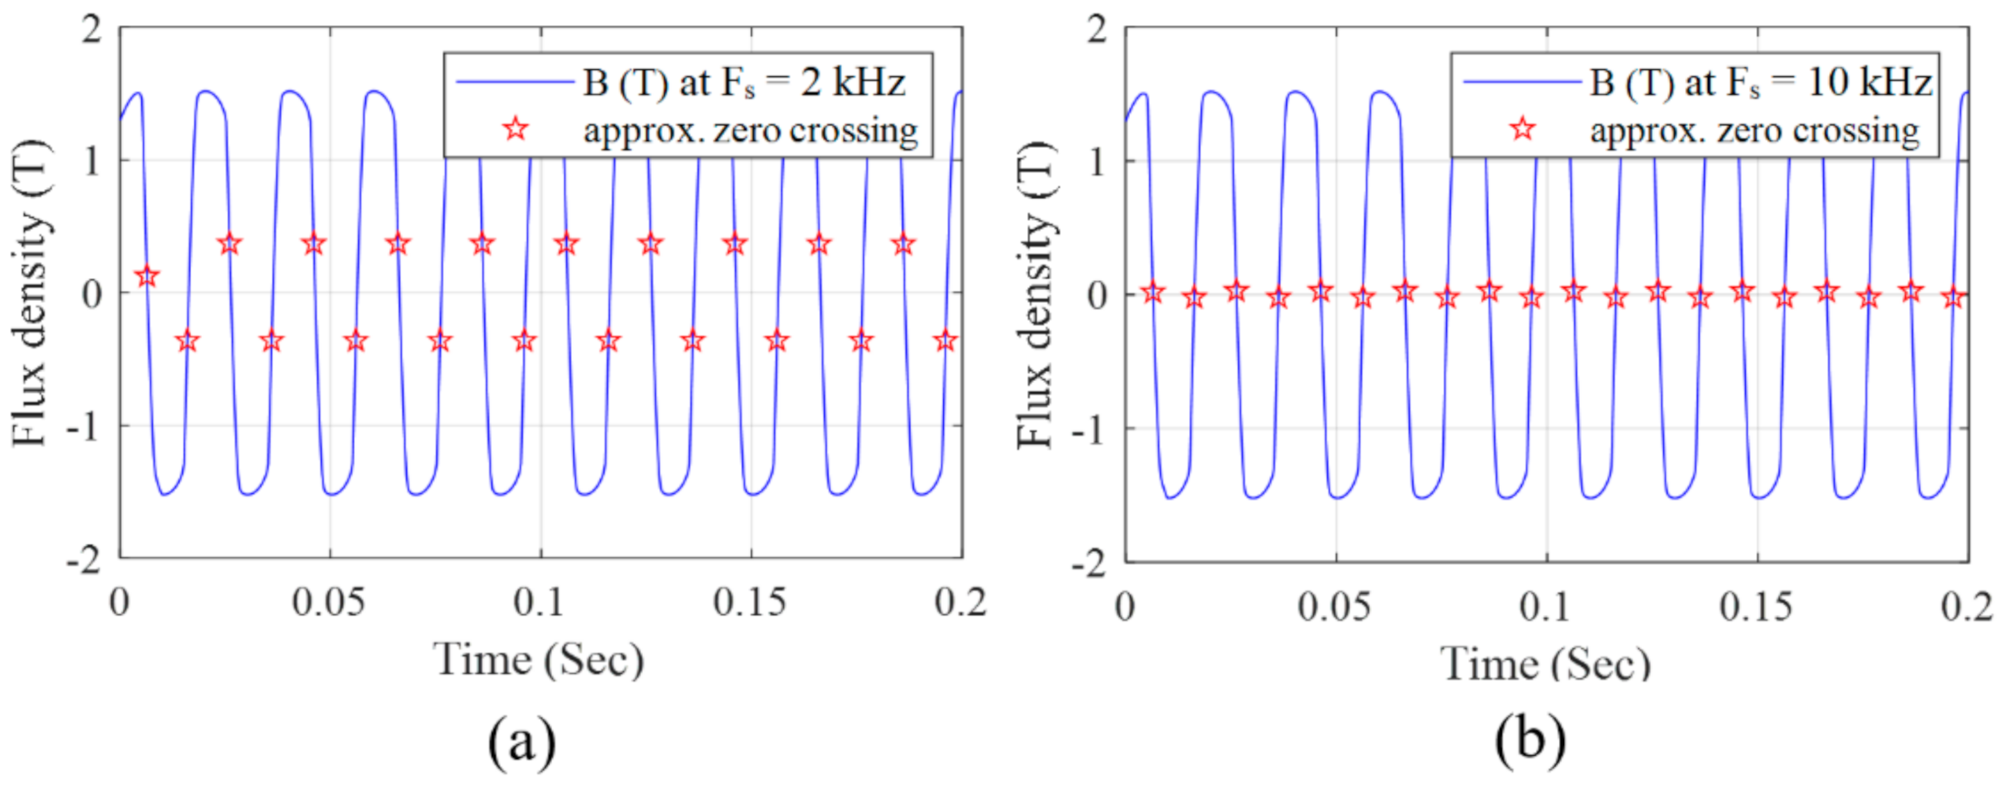
  • The sampling frequency can be improved by data interpolation. Linear interpolation to increase sampling frequency from Fs to kFs can have less impact on the signal’s shape. An increase in the sampling frequency is necessary to recover zero crossings in the signal. If the sampling rate is not good enough, the approximate zero-crossings would be away from the actual zero line, as shown in Figure 2. This may lead to signal processing-related problems, such as spectral leakage or increased ripples due to bandpass filters. However, very powerful data acquisition devices are available these days, and data interpolation can make the algorithm suitable for implementation in on-board processors.
  • Random noise, such as additive white gaussian noise (AWGN), is inevitable in homemade B-H tracers. This is because of the high frequency switching noise if digital signal generators and power supplies are used. Moreover, this noise also occurs because of the mismatched impedances between various components of the experimental setup. Although AWGN noise does not significantly contribute to the DC drift, it causes random movement of the B and H intercept points, mainly if the signal to noise ratio (SNR) is low. Being random, AWGN noise cannot be eliminated completely; however, its impact can be minimized by attenuating the high-frequency noise components using an IIR low pass filter. IIR filters are the right choice because of their narrow transition band and fewer passband ripples.
  • The magnetic field strength (H(t)) and magnetic field density (B(t)) can be calculated using the following formulas.
    H t = N 1 i 1 t l
    B t = 1 N 2 A c t i t f v 2 t d t
    where N1 and N2 are the number of primary and secondary turns, respectively, i1(t) is the current in the primary winding, l is the average length of the toroid taken at the center, Ac is the core cross-sectional area, v2(t) is the secondary induced voltage, and ti and tf represent the measurement interval and signal length, respectively. It is important to know that the measured induced voltage contains the drift signal acting as a constant of integration.
The number of samples per cycle (SPC) is vital to define the length of the kernel function. For the known values of sampling (Fs) and supply frequency (fs), the size of the one cycle of B or H can be calculated as follows:
S P C = F s f s

2.2. Defining Kernel Function and the Removal of the DC Drift

Convolution is a potent tool in signal processing, where two functions generate a third function that describes how the shape of one signal is modified by the other. In digital signal processing, the convolution of two functions f and g can be defined as follows:
f g n = m = M M f m g n m
where f is the input vector, which is B[n] in our case, and g is the kernel vector defined by (5), which acts as a filter. The size and shape of the kernel is the most significant part in signal processing. Since our goal is to find out the signal’s envelope pattern, a constant kernel vector of size equal to one cycle of the input signal can be the right choice. Furthermore, to eliminate the effect of the kernel itself, the sum of its elements should be equal to unity, as shown below.
k n = o n e s S P C , 1 S P C
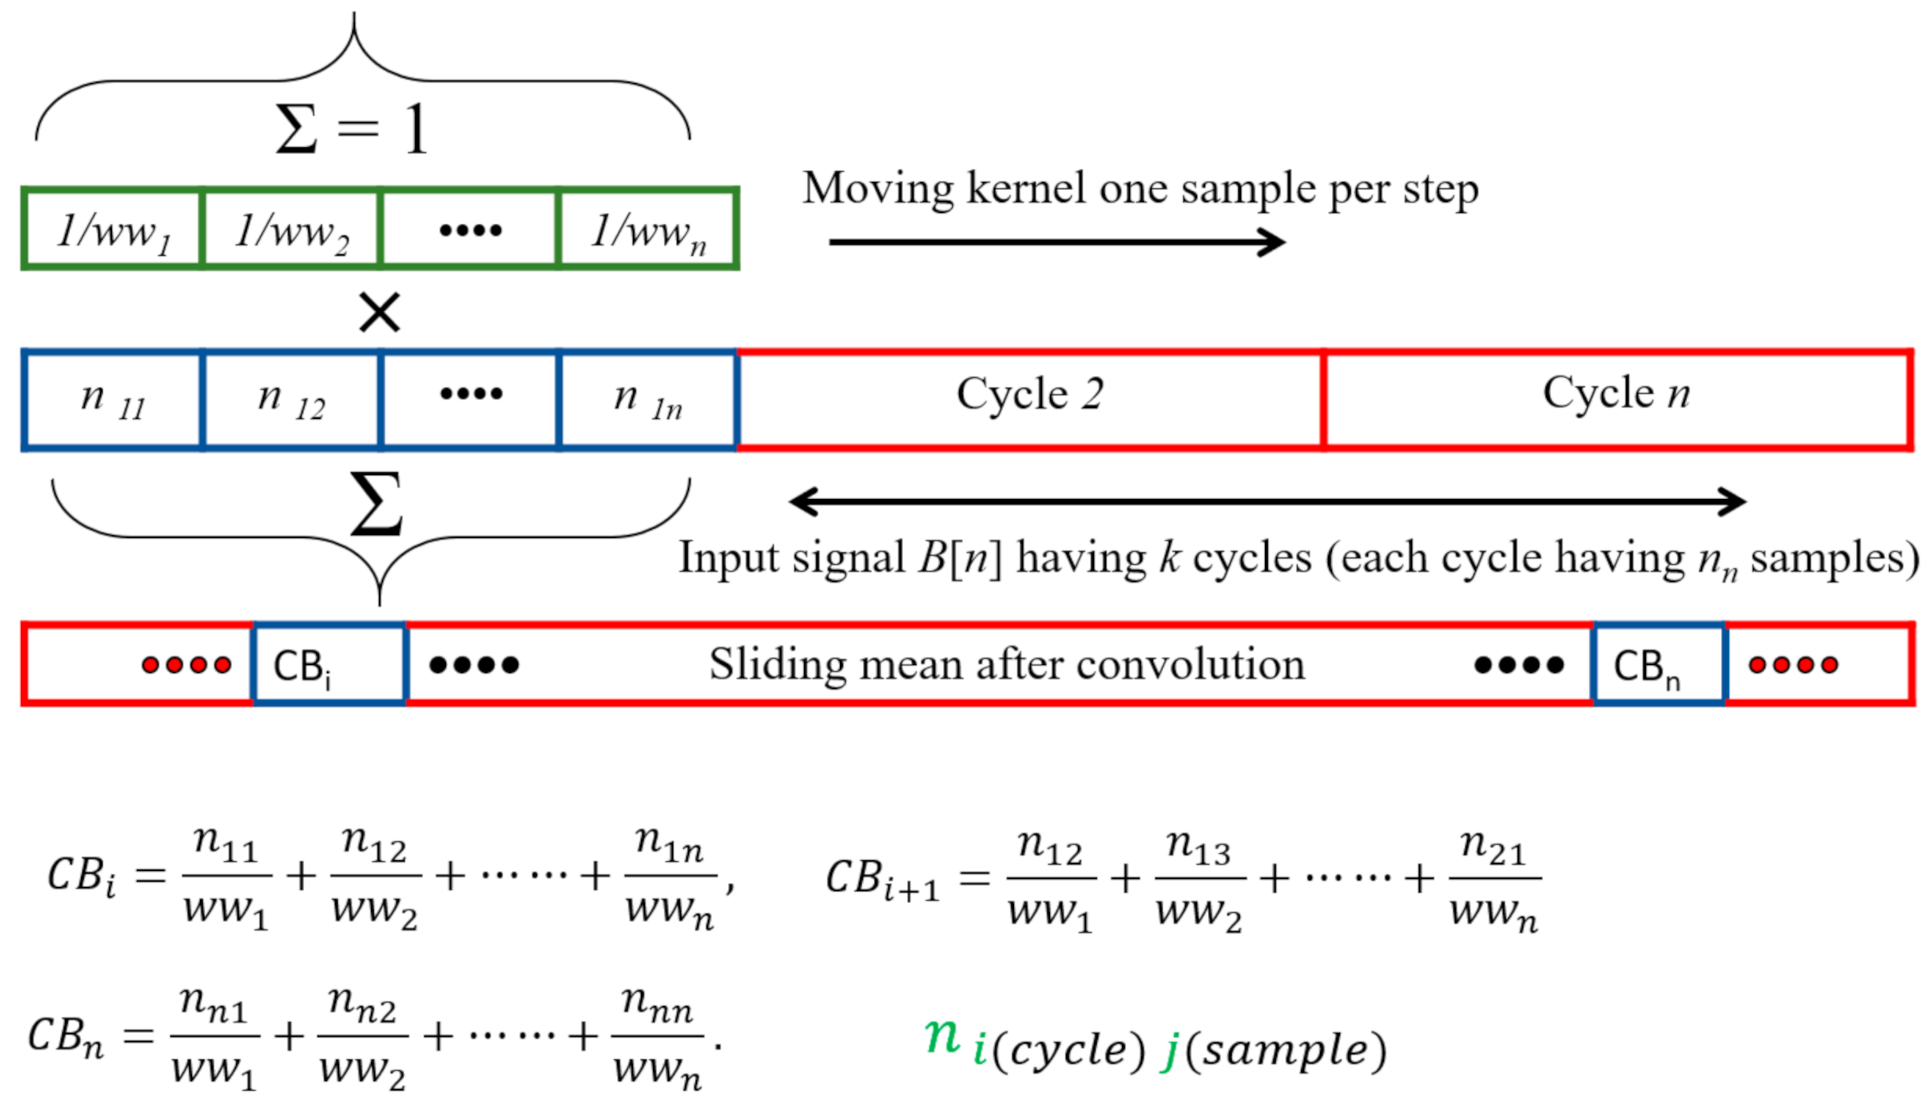
The convolution will give the moving mean value function across the entire input signal by making the kernel size equal to one cycle’s length. A detailed description of the proposed convolution is presented in Figure 3. Figure 4 shows the rising trend of the envelope of B, which is recovered by convolving the flux density function (B[n]) with the proposed kernel function k[n]. The trend curve is brought to the signal’s surface for ease of understanding, although it remains in the center of the signal as a mean value function. Subtracting the recovered mean value function from the original signal (B) removes the DC drift.
It is essential to know that when the kernel’s overlapping size is not equal to the signal’s cycle length, the non-overlapping elements of kernel functions are considered zero during the starting and ending intervals. This leads to the transient interval during the resultant signal’s starting and ending points, represented by red dots in Figure 3. Since the length of those intervals is equal to one cycle’s size, the mean value signal should be saved from CBi to CBn. The initial and last cycles can be discarded using zero-crossing detection.

2.3. Zero-Crossing Detection

Almost all filters have transient and steady-state intervals. The transient interval appears at the beginning and the end of the signal. The duration of the transient interval depends upon the type of the filter and the windowing function. Since in the proposed algorithm, two filters, lowpass IIR and convolution, are used, the transient interval is very narrow. The resultant signal can be saved from the second zero crossing to the third last zero crossings to achieve the steady-state interval. The resultant acquired signal in the steady-state interval can have an integral or fractional number of cycles. Although the number of cycles does not significantly impact the B-H curve, they can affect the frequency resolution of fast Fourier transform (FFT) or other spectrum analysis-based signal processing techniques. Since each sinusoidal signal has three zero crossings, the integral number of cycles would have an odd number of zero crossings. This fact is used to save the signal in such a way that if the number of zero crossings is odd, then the signal is ready for further analysis; otherwise, the signal can be saved from first zero crossings until second last. Due to the ease in detecting the starting and ending fractional cycles, the method of zero-crossing detection for counting the integral number of cycles is preferred over the conventional approach where sampling frequency and the measurement length of the signal can be used for the same purpose.

3. Measurement Setup

The experimental setup consists of two parts: printing and measurement. The sample toroid is prepared from Fe-Si powder with powder bed fusion printer Realizer SLM-50 (Germany). Laser re-melting strategy (each printed layer is scanned twice before applying the next layer of powder) is utilized for reducing the irregularities in the solidified part. The laser beam power was chosen as 50 W (1 m/s) for the primary and 75 W (0.75 m/s) for the secondary scan. The printed toroidal sample exhibited a 5 mm × 5 mm rectangular cross-section and a 60 mm outer diameter. The toroid was post-processed in a vacuum furnace for internal stress normalization and structure recrystallization. The toroid was heated 300 K/h up to the temperature of 1150 °C and was annealed in a vacuum chamber at 1150 °C for one hour and then furnace cooled. Q detailed description of the printing procedure is presented in [24,25].
The printed toroid was wound with primary (inner, magnetizing) and secondary coils (outer, measuring) with 150 (N1) and 50 (N2) turns. All the measurements were conducted per European standards EN 60404-4 and EN 60404-6 [26,27]. The primary coil was supplied with a sinusoidal current with different peak values to maintain flux density in the range of 0.5–1.6 T. The sinusoidal current was generated using an Omicron power amplifier CMS 356 (Austria), which was fed with a sinusoidal reference signal coming from a digital function generator, as shown in Figure 5. The current was measured using a precision resistor 75 mV/15 A connected in series with the primary winding. This current calculates magnetic field strength (H(t)) as in (1), while magnetic flux density (B(t)) is calculated from the output voltage across the secondary winding using (2). All these measurements were taken with a considerably high sampling frequency of 10 kHz using data acquisition setup Dewetron DEWE2-M (Austria). However, the measurements can be artificially improved using data interpolation, as discussed earlier.

4. Results and Discussion

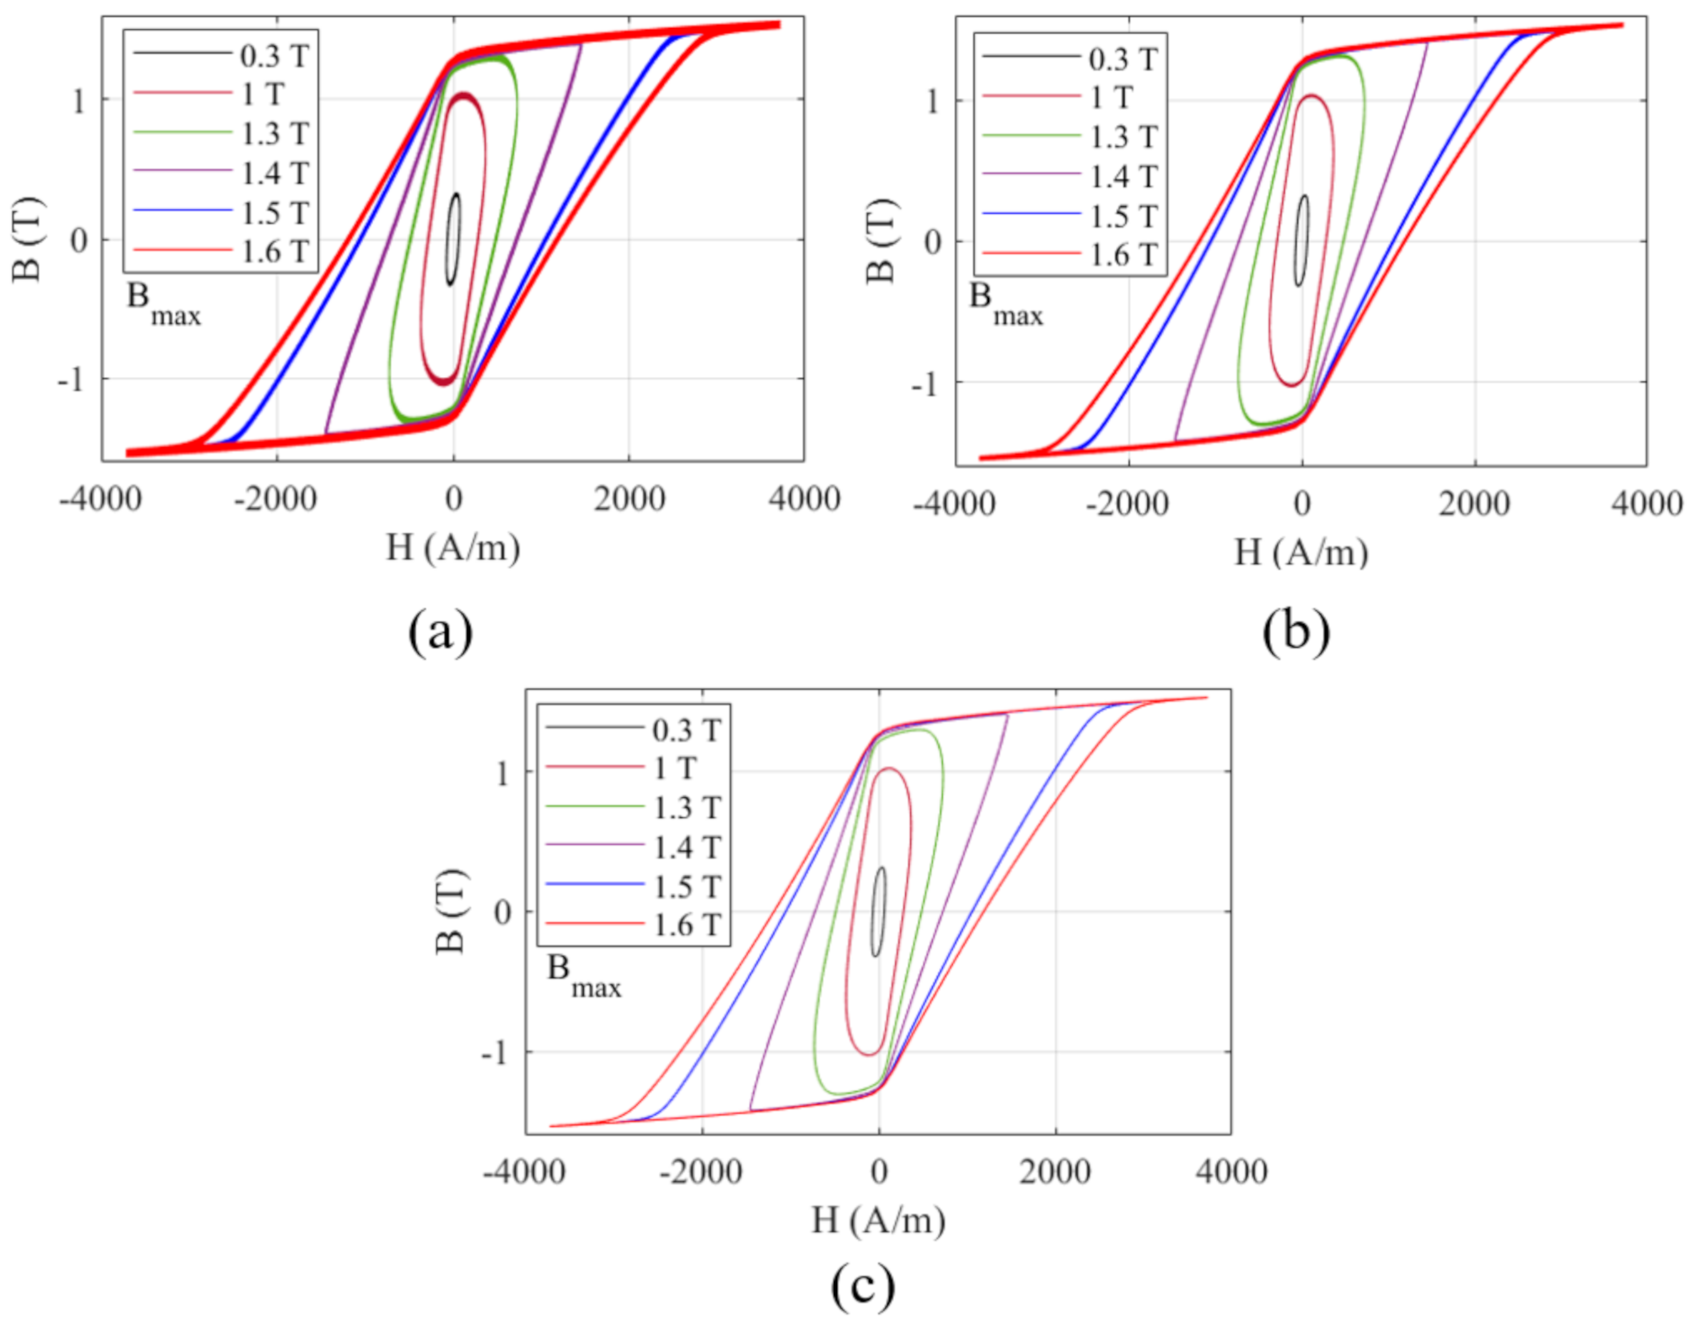
The measured hysteresis loop with different maximum flux densities (Bmax) is shown in Figure 6. Figure 6a shows the results without any significant signal processing. As discussed earlier, the flux density and field strength vectors are calculated from the measured voltage and currents. Only the B vector is normalized across the zero line by subtracting it with its mean value. This is important; otherwise, different loops will have other locations due to significant DC shifts. The B and H intercept drift is visible by the lines’ thickness as the drift due to DC offset is still there. Figure 6b shows the recovered loops after removing DC drift using 3rd-degree polynomial function. The polynomial function creates an approximate fitting function at the center of the vector. Hence, the drift can be removed by subtracting the B(t) from the polynomial. The drift is somewhat reduced, but still, the line widths are considerable. This is because of the approximation considered by the polynomial function. This problem worsens if the number of measurement cycles is less in number. Figure 6c shows the recovered hysteresis loops using the proposed algorithm. As compared to Figure 6a,b, the drift is considerably reduced in Figure 6c. Moreover, the proposed algorithm does not depend upon the number of cycles under consideration because it considers every cycle independently.
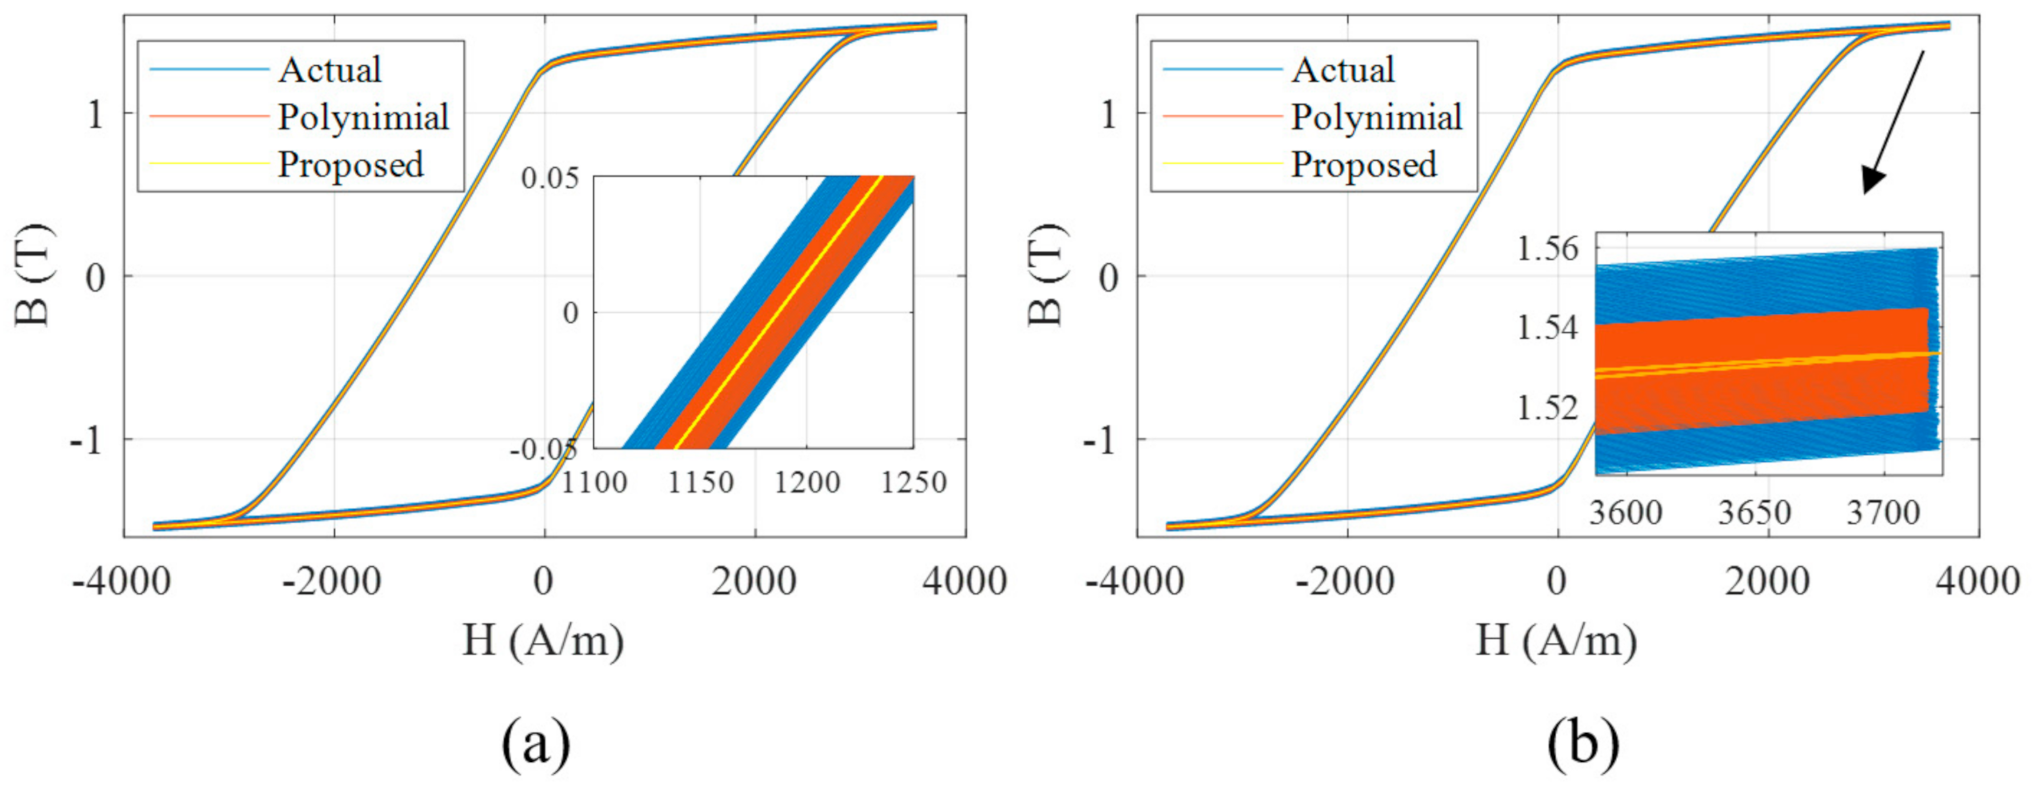
Figure 7 compares recovered loops using the conventional polynomial fitting function with ones obtained using the proposed algorithm. The zoomed windows in Figure 7a,b depict the B-H curve’s sharpening using the proposed algorithm.
The approximate errors using different techniques are given in Table 1. This error is calculated by subtracting the higher (B+h) and lower intercept (B+l) values on the B axis at zero H. The error is considerably reduced from 0.05 T (intercept width) to 0.0002 T using the proposed algorithm.

5. Conclusions

Advancements in SLM-based AM techniques have opened a broad domain of intricate electrical machine designs. This complexity can be in the form of optimized complex mechanical geometry or the selection of different types of composite material for efficiency improvement. The selection of composite material to be used for fabrication purposes depends upon its magnetic properties, which directly influence efficiency. Hence, before the final selection of machine-fabricated material, an evaluation of its characteristics is mandatory. The percentage content of different elements in the fabricating power can be optimized based on evaluations of those characteristic. In electrical machines, the material’s magnetic characteristics are the most crucial parameter among several others. For this purpose, an algorithm was proposed in this paper, which was shown to produce the B-H curve of the 3D printed sample with less error. The proposed model was shown to have the following benefits:
  • The proposed algorithm can work on the least number of measured current or voltage cycles compared to the corresponding data fitting-based correction algorithm.
  • The higher-order noise components because of switching frequency, AWGN, and the impedance mismatch are effectively removed using the IIR low-pass filter. However, it can be avoided if the signal has a high signal to noise ratio (SNR).
  • The increase in the sampling rate using data interpolation makes the algorithm suitable to plot good magnetic characteristics from the data measured at a low sampling frequency. This makes algorithms convenient, even if the data acquisition devices are not very powerful.
  • The zero-crossing detection helps to count the integral number of cycles and removes the filter-based transient intervals. The removal of the transient interval is very crucial to getting a smooth B-H curve. Additionally, it reduces the spectral leakage if the frequency spectrum analysis is required.
  • The proposed algorithm gives a very narrow band intercept across the B and H axis, which reduces the error considerably.

Author Contributions

Conceptualization: B.A., H.T., T.V., and A.B.; methodology: B.A., H.T., T.V., and A.B.; validation: A.K., A.R., and A.B.; data curation: B.A. and H.T.; writing—original draft preparation: B.A.; writing—review and editing: B.A., H.T., and A.R.; visualization: T.V. and P.S.G.; supervision: T.V., A.K., and A.B. All authors have read and agreed to the published version of the manuscript.

Funding

This research work has been supported by Estonian Ministry of Education and Research (Project PSG137).

Conflicts of Interest

The authors declare no conflict of interest.

References

  1. Lammers, S.; Adam, G.; Schmid, H.J.; Mrozek, R.; Oberacker, R.; Hoffmann, M.J.; Quattrone, F.; Ponick, B. Additive Manufacturing of a lightweight rotor for a permanent magnet synchronous machine. In Proceedings of the 2016 6th International Electric Drives Production Conference, EDPC 2016-Proceedings, Nuremberg, Germany, 30 November–1 December 2016; pp. 41–45. [Google Scholar] [CrossRef]
  2. Garibaldi, M.; Gerada, C.; Ashcroft, I.; Hague, R. Free-Form Design of Electrical Machine Rotor Cores for Production Using Additive Manufacturing. J. Mech. Des. 2019, 141, 1–27. [Google Scholar] [CrossRef]
  3. Metsä-Kortelainen, S.; Lindroos, T.; Savolainen, M.; Jokinen, A.; Revuelta, A.; Pasanen, A.; Ruusuvuori, K.; Pippuri, J. Manufacturing of topology optimized soft magnetic core through 3D printing. In Proceedings of the NAFEMS Exploring the Design Freedom of Additive Manufacturing through Simulation, Helsinki, Finland, 22–23 November 2016. [Google Scholar]
  4. Garibaldi, M. Laser additive Manufacturing of Soft Magnetic Cores for rotating Electrical Machinery: Materials Development and Part Design. Ph.D. Thesis, University of Nottingham, Nottingham, UK, 2018. [Google Scholar]
  5. Lorenz, F.; Rudolph, J.; Wemer, R. Design of 3D Printed High Performance Windings for Switched Reluctance Machines. In Proceedings of the 23rd International Conference on Electrical Machines, ICEM 2018, Alexandroupoli, Greece, 3–6 September 2018; pp. 2451–2457. [Google Scholar] [CrossRef]
  6. Simpson, N.; Mellor, P.H. Additive manufacturing of shaped profile windings for minimal AC loss in gapped inductors. In Proceedings of the 2017 IEEE International Electric Machines and Drives Conference (IEMDC), Miami, FL, USA, 21–24 May 2017; pp. 1–7. [Google Scholar] [CrossRef] [Green Version]
  7. Richardson, B.; Love, L.; Tate, J.G. Additive Manufacturing for Low Volume Bearings. 2017. Available online: http://www.osti.gov/scitech/ (accessed on 24 November 2020).
  8. Wrobel, R.; Hussein, A. Design Considerations of Heat Guides Fabricated Using Additive Manufacturing for Enhanced Heat Transfer in Electrical Machines. In Proceedings of the 2018 IEEE Energy Conversion Congress and Exposition, ECCE 2018, Portland, OR, USA, 23–27 September 2018; pp. 6506–6513. [Google Scholar] [CrossRef] [Green Version]
  9. Sixel, W.; Liu, M.; Nellis, G.; Sarlioglu, B. Cooling of Windings in Electric Machines via 3D Printed Heat Exchanger. In Proceedings of the 2018 IEEE Energy Conversion Congress and Exposition, ECCE 2018, Portland, OR, USA, 23–27 September 2018; pp. 229–235. [Google Scholar] [CrossRef]
  10. Silbernagel, C.; Gargalis, L.; Ashcroft, I.; Hague, R.; Galea, M.; Dickens, P. Electrical resistivity of pure copper processed by medium-powered laser powder bed fusion additive manufacturing for use in electromagnetic applications. Addit. Manuf. 2019, 29, 100831. [Google Scholar] [CrossRef]
  11. Silbernagel, C.; Ashcroft, I.; Dickens, P.; Galea, M. Electrical resistivity of additively manufactured AlSi10Mg for use in electric motors. Addit. Manuf. 2018, 21, 395–403. [Google Scholar] [CrossRef]
  12. Goll, D.; Schuller, D.; Martinek, G.; Kunert, T.; Schurr, J.; Sinz, C.; Schubert, T.; Bernthaler, T.; Riegel, H.; Schneider, G. Additive manufacturing of soft magnetic materials and components. Addit. Manuf. 2019, 27, 428–439. [Google Scholar] [CrossRef]
  13. Garibaldi, M.; Ashcroft, I.; Lemke, J.; Simonelli, M.; Hague, R. Effect of annealing on the microstructure and magnetic properties of soft magnetic Fe-Si produced via laser additive manufacturing. Scr. Mater. 2018, 142, 121–125. [Google Scholar] [CrossRef]
  14. Plotkowski, A.; Pries, J.; List, F.; Nandwana, P.; Stump, B.; Carver, K.; Dehoff, R. Influence of scan pattern and geometry on the microstructure and soft-magnetic performance of additively manufactured Fe-Si. Addit. Manuf. 2019, 29, 100781. [Google Scholar] [CrossRef]
  15. Riipinen, T.; Metsä-Kortelainen, S.; Lindroos, T.; Keränen, J.S.; Manninen, A.; Pippuri-Mäkeläinen, J. Properties of soft magnetic Fe-Co-V alloy produced by laser powder bed fusion. Rapid Prototyp. J. 2019, 25, 699–707. [Google Scholar] [CrossRef]
  16. Kang, N.; El Mansori, M.; Guittonneau, F.; Liao, H.; Fu, Y.; Aubry, E. Controllable mesostructure, magnetic properties of soft magnetic Fe-Ni-Si by using selective laser melting from nickel coated high silicon steel powder. Appl. Surf. Sci. 2018, 455, 736–741. [Google Scholar] [CrossRef] [Green Version]
  17. Garcia, J.; Rivas, M. A quasi-static magnetic hysteresis loop measurement system with drift correction. IEEE Trans. Magn. 2006, 42, 15–17. [Google Scholar] [CrossRef]
  18. Horn, J.L.; Grimes, C.A. A 0.1–500 Hz analog thin film BH hysteresis loop tracer with automatic Y-axis drift correction. Rev. Sci. Instrum. 1997, 68, 1346–1347. [Google Scholar] [CrossRef]
  19. Franco, V.; Ramos-Martos, J.; Conde, A. Autocalibrating quasistatic M-H hysteresis loop tracer with negligible drift. Rev. Sci. Instrum. 1996, 67, 4167–4170. [Google Scholar] [CrossRef] [Green Version]
  20. Krings, A.; Soulard, J.; Wallmark, O. PWM Influence on the Iron Losses and Characteristics of a Slotless Permanent-Magnet Motor with SiFe and NiFe Stator Cores. IEEE Trans. Ind. Appl. 2015, 51, 1475–1484. [Google Scholar] [CrossRef]
  21. Krings, A.; Nategh, S.; Wallmark, O.; Soulard, J. Influence of the Welding Process on the Performance of Slotless PM Motors With SiFe and NiFe Stator Laminations. IEEE Trans. Ind. Appl. 2014, 50, 296–306. [Google Scholar] [CrossRef]
  22. Asad, B.; Vaimann, T.; Belahcen, A.; Kallaste, A.; Rassõlkin, A.; Iqbal, M.N. Broken rotor bar fault detection of the grid and inverter-fed induction motor by effective attenuation of the fundamental component. IET Electr. Power Appl. 2019, 13, 2005–2014. [Google Scholar] [CrossRef]
  23. Asad, B.; Vaimann, T.; Kallaste, A.; Rassõlkin, A.; Belahcen, A.; Iqbal, M.N. Improving Legibility of Motor Current Spectrum for Broken Rotor Bars Fault Diagnostics. Electr. Control. Commun. Eng. 2019, 15, 1–8. [Google Scholar] [CrossRef] [Green Version]
  24. Tiismus, H.; Kallaste, A.; Belahcen, A.; Vaimann, T.; Rassõlkin, A.; Lukichev, D.V. Hysteresis measurements and numerical losses segregation of additively manufactured silicon steel for 3d printing electrical machines. Appl. Sci. 2020, 10, 6515. [Google Scholar] [CrossRef]
  25. Tiismus, H.; Kallaste, A.; Belahcen, A.; Rassolkin, A.; Vaimann, T. Hysteresis Loss Evaluation of Additively Manufactured Soft Magnetic Core. In Proceedings of the 2020 International Conference on Electrical Machines (ICEM), Kärdla, Estonia, 12–15 June 2019; pp. 1657–1661. [Google Scholar] [CrossRef]
  26. EN IEC 60404-6:2018-Magnetic Materials-Part 6: Methods of Measurement of the Magnetic Properties of Magnetically Soft Metallic and Powder Materials at Frequencies in the Range 20 Hz to 100 kHz by the Use of Ring Specimens. Available online: https://standards.iteh.ai/catalog/standards/clc/0f265b9d-6454-4597-aa62-9290d0e03700/en-iec-60404-6-2018 (accessed on 27 November 2020).
  27. EN 60404-4:1997-Magnetic Materials-Part 4: Methods of Measurement of d.c. Magnetic Properties of Magnetically Soft Materials. Available online: https://standards.iteh.ai/catalog/standards/clc/a53d9e5b-537f-4e4d-87d2-a4fceadb1534/en-60404-4-1997 (accessed on 27 November 2020).
Figure 1. The algorithm flowchart.
Energies 14 00284 g001
Figure 2. The impact of sampling frequency on zero-crossing detection of flux density B measured at 50 Hz: (a) at a low sampling frequency (2 kHz), (b) at an improved sampling frequency (10 kHz).
Energies 14 00284 g002
Figure 3. Description of the moving mean value technique.
Energies 14 00284 g003
Figure 4. The envelope of the flux density B(t) (a) with DC drift, shown by brown line recovered by the proposed algorithm; (b) the corrected signal after removing DC drift.
Energies 14 00284 g004
Figure 5. Experimental setup of (a) the printing of the sample and (b) the measurement schematic diagram.
Energies 14 00284 g005
Figure 6. The measured B-H curves at different maximum flux densities Bmax (a) without DC drift correction; (b) DC drift correction using the polynomial fitting function as in [17]; (c) the corrected B-H curves using the proposed algorithm.
Energies 14 00284 g006
Figure 7. A comparison of the different approaches, (a) with zoomed window near zero crossing of the B axis, (b) with zoomed window at the peak value.
Energies 14 00284 g007
Table 1. The comparison of different drift removal techniques in terms of B intercept width.
Sr. No.TechniqueB-Axis Intercept Range at H = 0 (Error) Δ B = B + h B + l
1Measured0.05 T (5%)
2Polynomial adjustment based0.02 T (2%)
3Proposed0.0002 T (0.02%)
Publisher’s Note: MDPI stays neutral with regard to jurisdictional claims in published maps and institutional affiliations.