Article

Micro-Raman Spectroscopy of Selected Macerals of the Huminite Group: An Example from the Szczerców Lignite Deposit (Central Poland)

1
Faculty of Geology, Geophysics and Environment Protection, AGH University of Science and Technology, Al. Mickiewicza 30, 30-059 Kraków, Poland
2
Institute of Applied Geology, Silesian University of Technology, Akademicka 2, 44-100 Gliwice, Poland
*
Author to whom correspondence should be addressed.
Energies 2021, 14(2), 281; https://doi.org/10.3390/en14020281
Submission received: 29 November 2020 / Revised: 29 December 2020 / Accepted: 31 December 2020 / Published: 6 January 2021

Abstract

:
Lignite (ulminite reflectance Rr = 0.27%) from the Szczerców deposit (Central Poland) is dominated by huminite group macerals, containing a high proportion of attrinite and densinite. Densinite and ulminite are more abundant in small aromatic units than attrinite, which may result from their stronger gelification. The differences in Raman spectral characteristics between attrinite and ulminite are more pronounced than between attrinite and densinite. Fusinite, in comparison with the huminite group macerals, is composed of larger, more varied aromatic systems. The D4 (1190–1200 cm−1) and D5 bands (1280–1290 cm−1), most likely, correspond to different chemical structures, and their origin should be further investigated.

1. Introduction

Lignite is an important energy carrier in many countries. Its chemical and technological features, which depend to a large extent on the petrographic composition, have been intensively studied for many years [1,2,3,4]. However, the microstructure of lignite macerals is still poorly known. So far, Raman spectroscopy studies aimed at understanding brown coal’s microstructure have been conducted almost exclusively on bulk samples [5,6,7,8,9,10,11].
The purpose of this work was to reveal, for the first time, and compare the microstructural features of attrinite, densinite, ulminite, and, additionally, fusinite, based on the example of the Szczerców deposit. It is one of two deposits currently exploited by the Polska Grupa Energetczna (PGE) open-pit mine Bełchatów—the largest lignite mine in Europe.

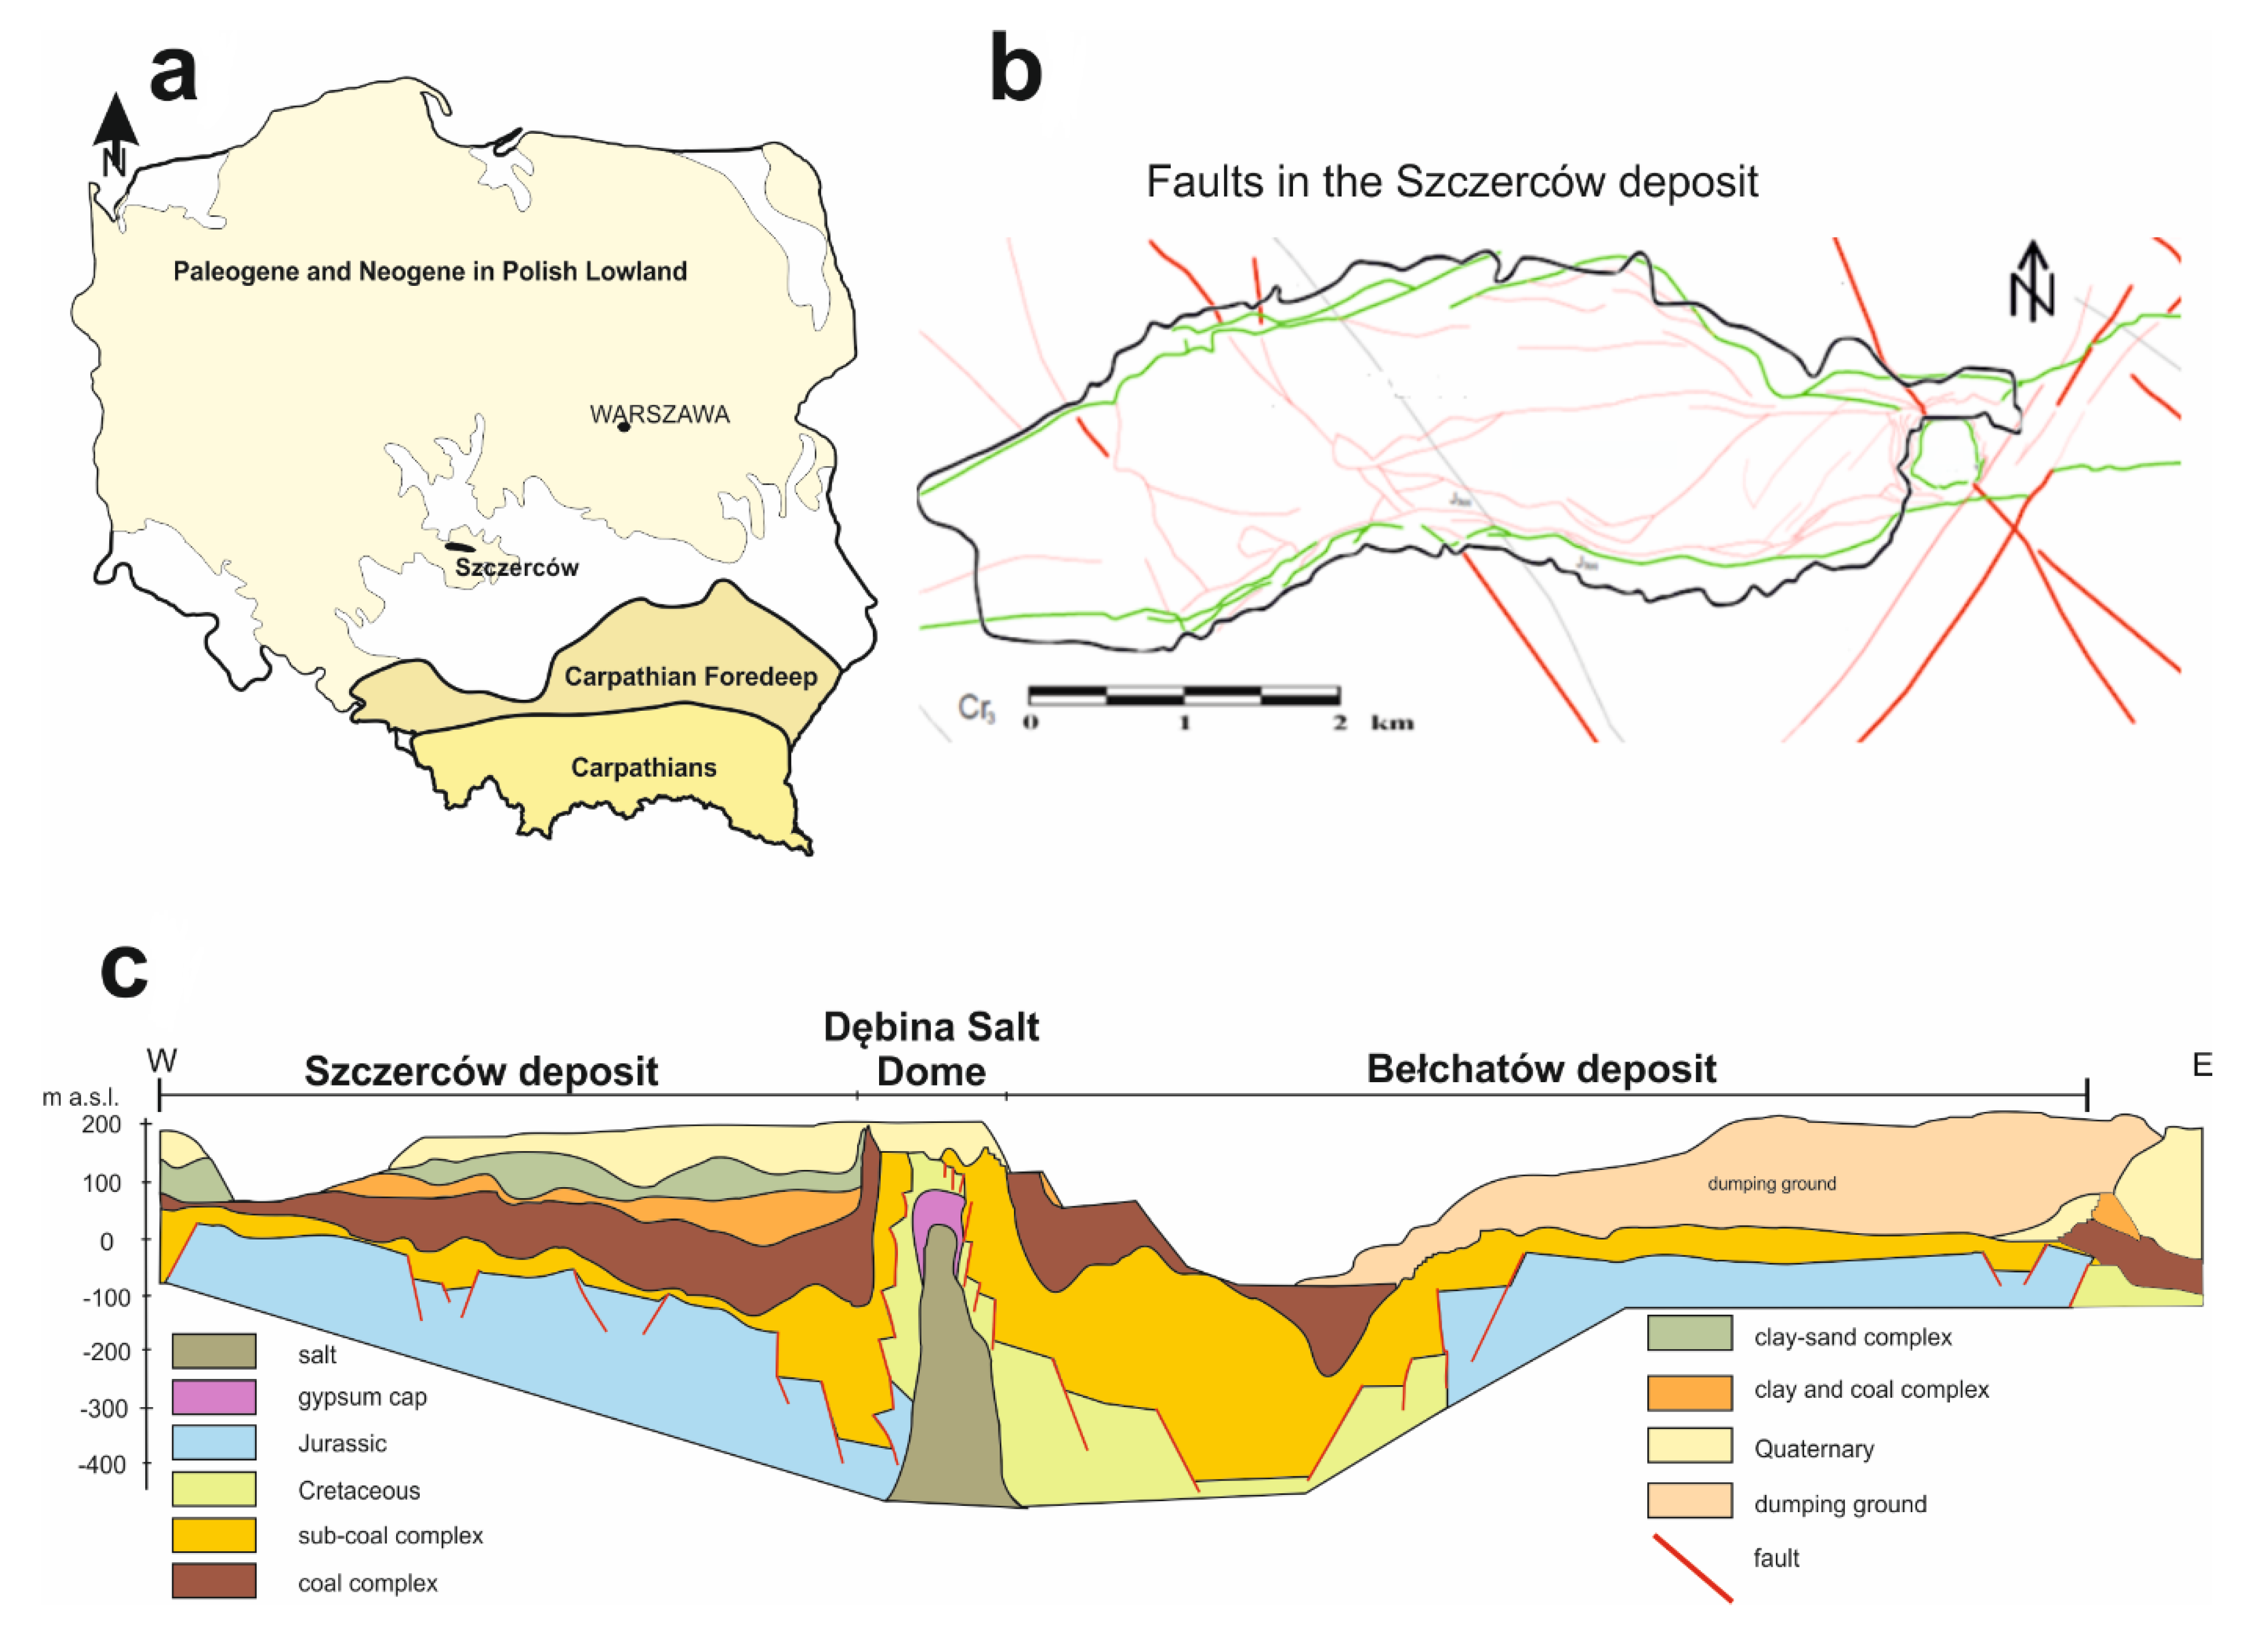
2. Geological Setting

The Szczerców lignite deposit is located in the Szczecin–Łódź–Miechów synclinorium, which is located in the western part of the Kleszczów Graben [12] (Figure 1). The Szczerców deposit is approximately 7 km long and 1.5 to 3 km wide [13]. From the east, it is adjacent to the Bełchatów lignite deposit. They are separated by the Dębina salt dome [13]. The Szczerców lignite overlies Upper Jurassic, Upper Cretaceous, and, locally, Paleogene sediments. The coal-bearing sediment is divided into [13]: a sub-coal complex, a coal complex, a clay and coal complex, and a clay–sand complex (Figure 1). The thickness of the coal complex reaches up to 100 m in the central part of the deposit; the average thickness is approximately 30–40 m [14,15].
The main seam consists of detritic and xylodetritic coal. The average content of xylites is approximately 20%. Occasionally, paratonstein (clay kaolinite) interbeddings are observed [14]. The lower part of the seam is of Lower Miocene age. Stratigraphically, it is part of the lowest part of the Ścinawa Formation [16]. The hanging wall part of the seam is of Middle Miocene age [17]. Quaternary deposits are glacial, interglacial, and sandy sediments with lenses of gravels and glacial clays [13,18].

3. Methods

The sample for microscopic and Raman spectroscopic investigation was collected as a representative channel sample from the seam in the western part of the Szczerców deposit. Two polished sections—one for each type of examination—were prepared according to the ISO 7404-2:2009 standard [20]. Petrographic analysis was conducted under incident white light and blue light excitation (i.e., fluorescence mode) using a Zeiss Axioplan polarizing microscope.
The random reflectance of ulminite B and other macerals was determined using monochromatic light with a wavelength of 546 nm and immersion oil (n = 1.518), and a Zeiss MPM-400 reflectometer according to the ISO 7404-5:2009 standard [21]. The petrographic composition of coal was determined according to ICCP guidelines [22,23,24]. The analysis was performed in accordance with the ISO 7404-3:2009 standard [25].
In addition, proximate and ultimate analyses were performed in an accredited laboratory in accordance with applicable standards for total moisture [26], ash content [27], volatile matter content [28], sulfur content [29], gross calorific value [30], and carbon and hydrogen content [31].
Raman spectroscopy of attrinite, densinite, ulminite, and fusinite macerals was performed in 27 to 30 randomly chosen points for each maceral. It should be noted that Raman spectra measurements were made on pure macerals. The selected measurement points are shown in the photographs in Appendix A (Figure A1, Figure A2, Figure A3 and Figure A4). The spectra were recorded with a Thermo Scientific DXR Raman (Faculty of Geology, Geophysics and Environment Protection, AGH University of Science and Technology, Kraków, Poland) microscope with a 900 grooves/mm grating and a Charge Coupled Device (CCD) detector. The Olympus 10× (NA 0.25) objectives (spot sizes 2.1 μm and 1.1 μm, respectively) were used. Excitation was activated with a 532 nm diode laser with a maximum power of 10 mW. Measurements were performed in a spectral range of 400–3500 cm−1, at a spectral resolution of 1 cm−1, and an area of 1 μm2. The laser power was set at 1–2 mW. The spectrometer was calibrated using a polystyrene standard. The accumulated measurement time was 30 s for each spectrum. Peak-fitting was conducted in the range of 1000–1800 cm−1 by GRAMS32, based on the earlier Raman studies of low-rank coal (brown coals) [6,7,8,9,10,11]). The second derivative of the spectra was also considered to find the initial positions of the Raman bands. Lorentzian curves were applied. The goodness of fit was checked by the χ2 test. The ID1/IG ratio was determined from the D1 and G band intensities. Furthermore, the AD3 + AD6/AALL, AD4/AALL, and AD5/AALL ratios were calculated from the band areas, where “AALL” denotes the sum of all band areas in a given spectrum. Raman band separation (RBS)—i.e., the distance between the G and D1 peak—was also determined.
The nomenclature of the bands was taken from Henry et al. [32]. The additional band D7 (~1095 cm−1), which was earlier found by Li et al. [6] and labeled as SR, was introduced.
The results of attrinite examinations were compared with those of densinite, ulminite, and fusinite using Student’s t-test with a significance level of α = 0.05. This was preceded by the Shapiro–Wilk test to check the normality of distribution, and the Fisher–Snedecor test to assess the equality of variances.

4. Results and Discussion

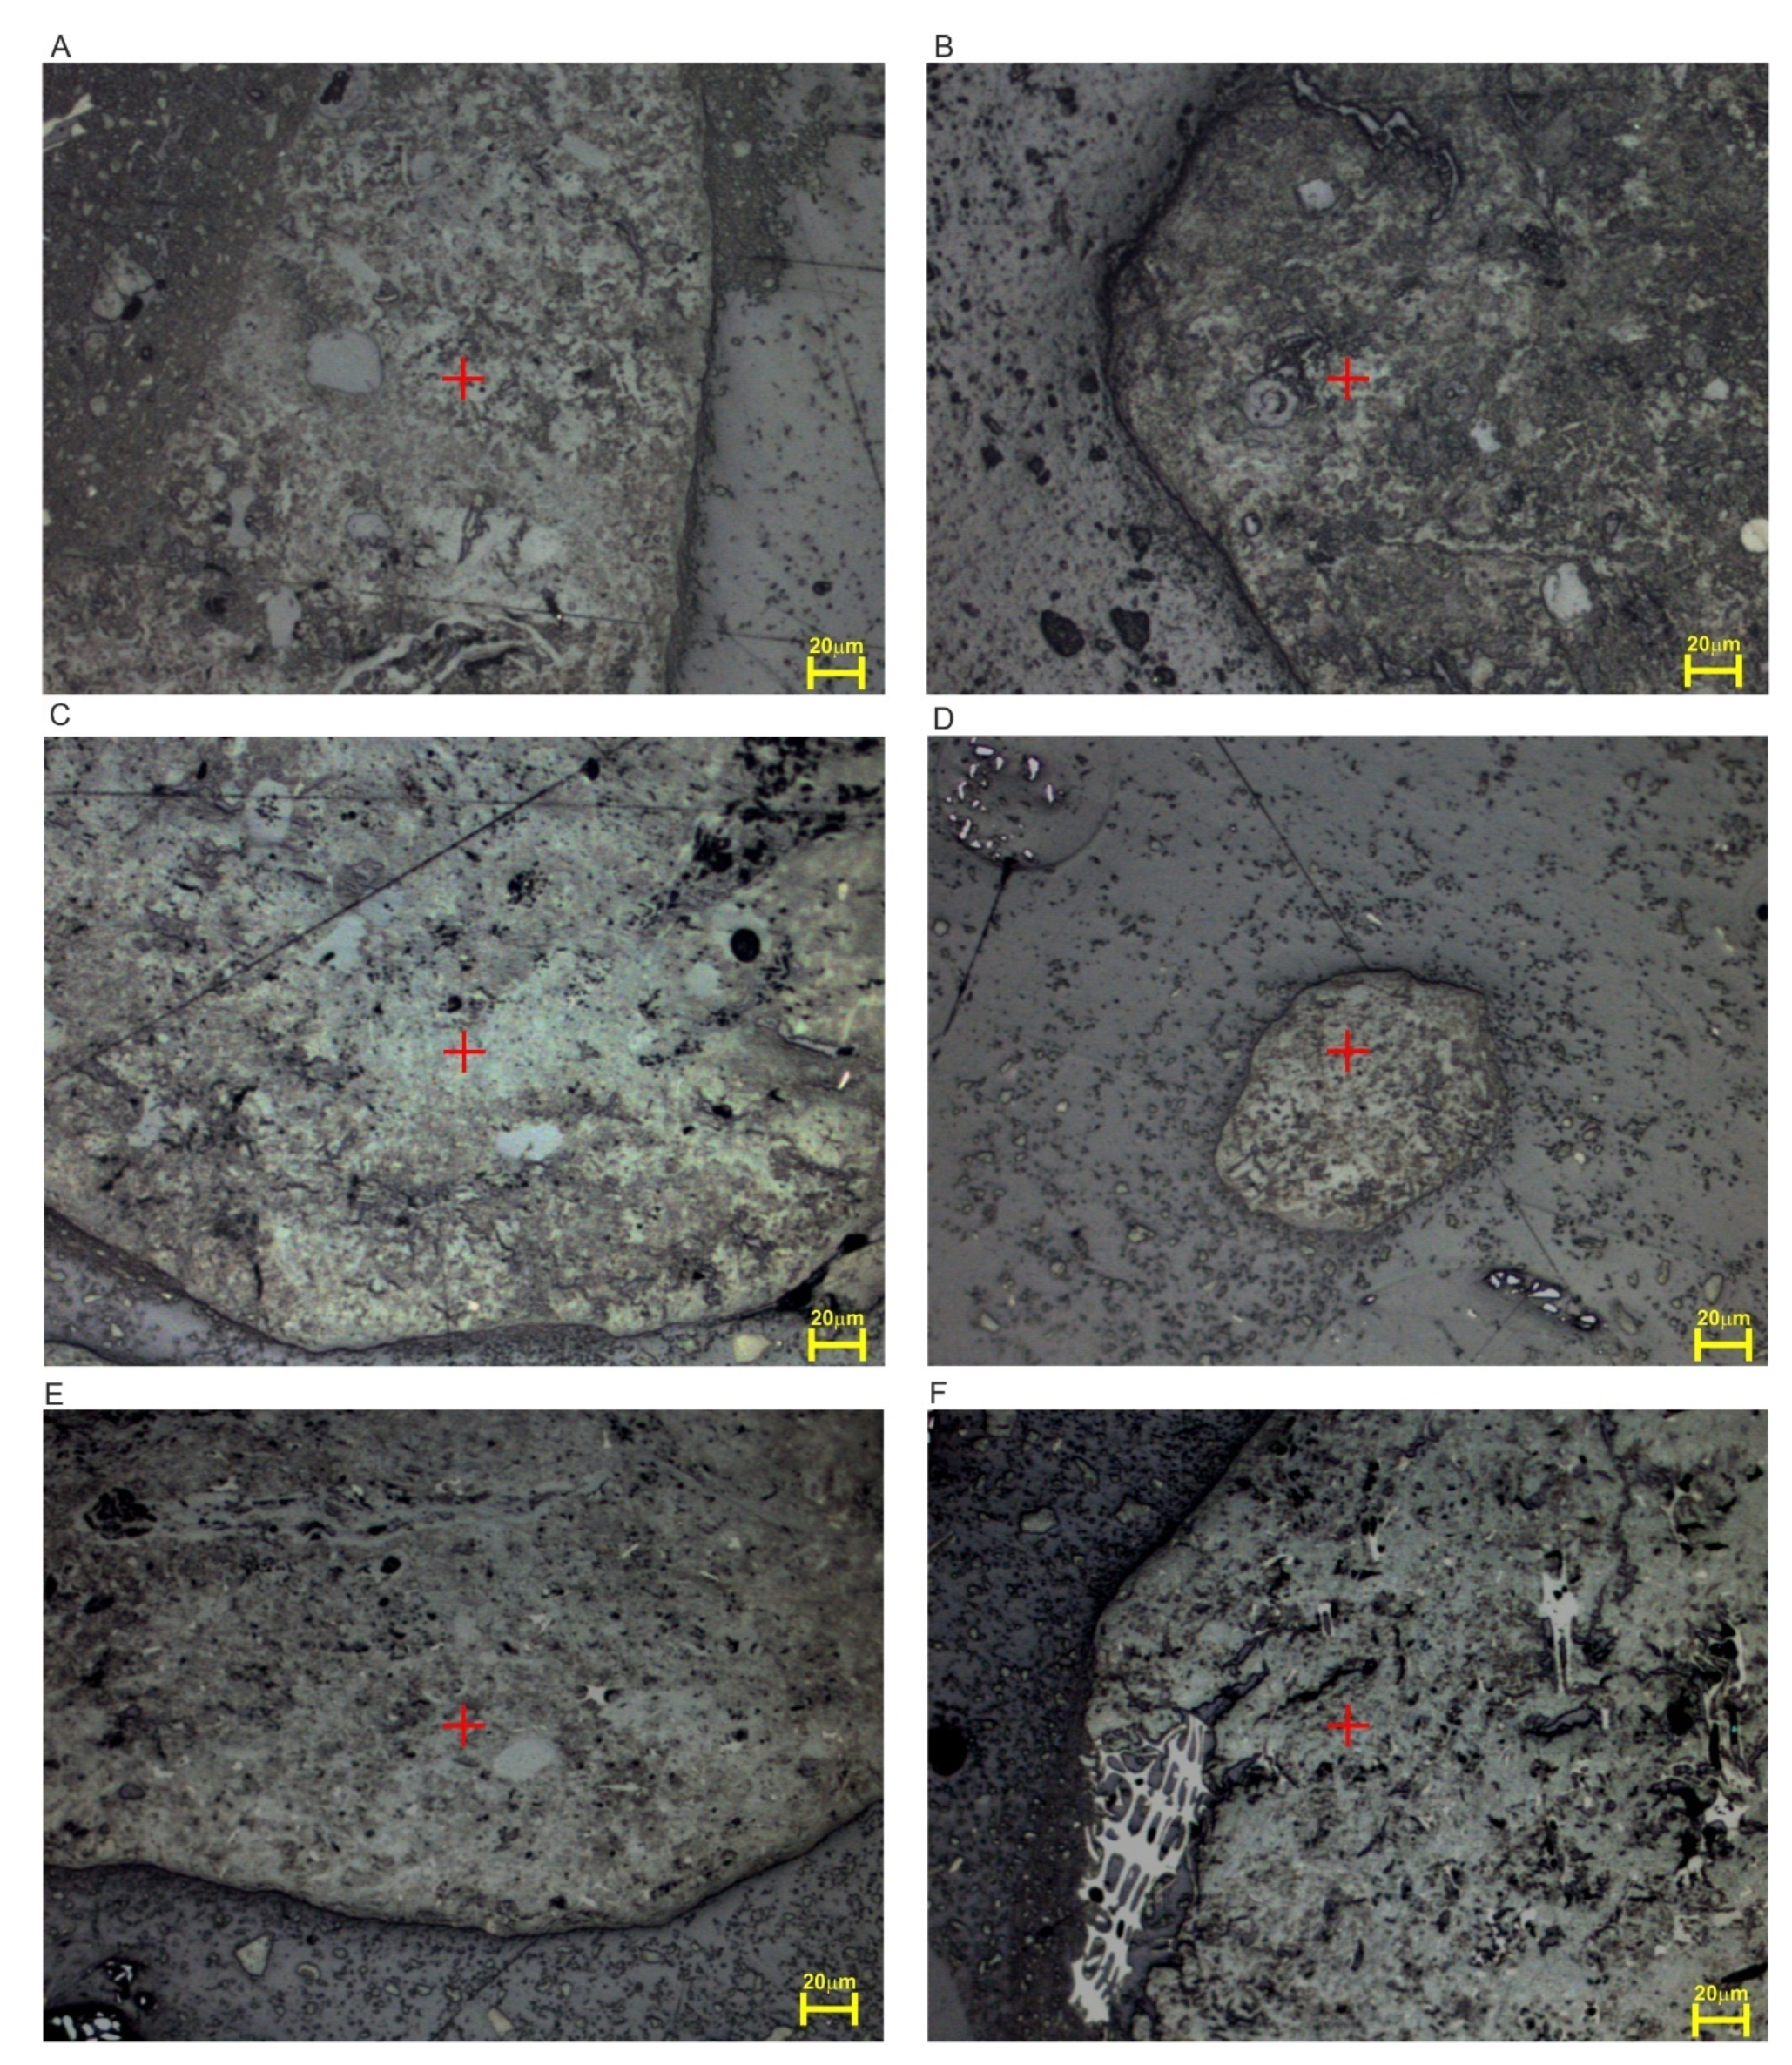
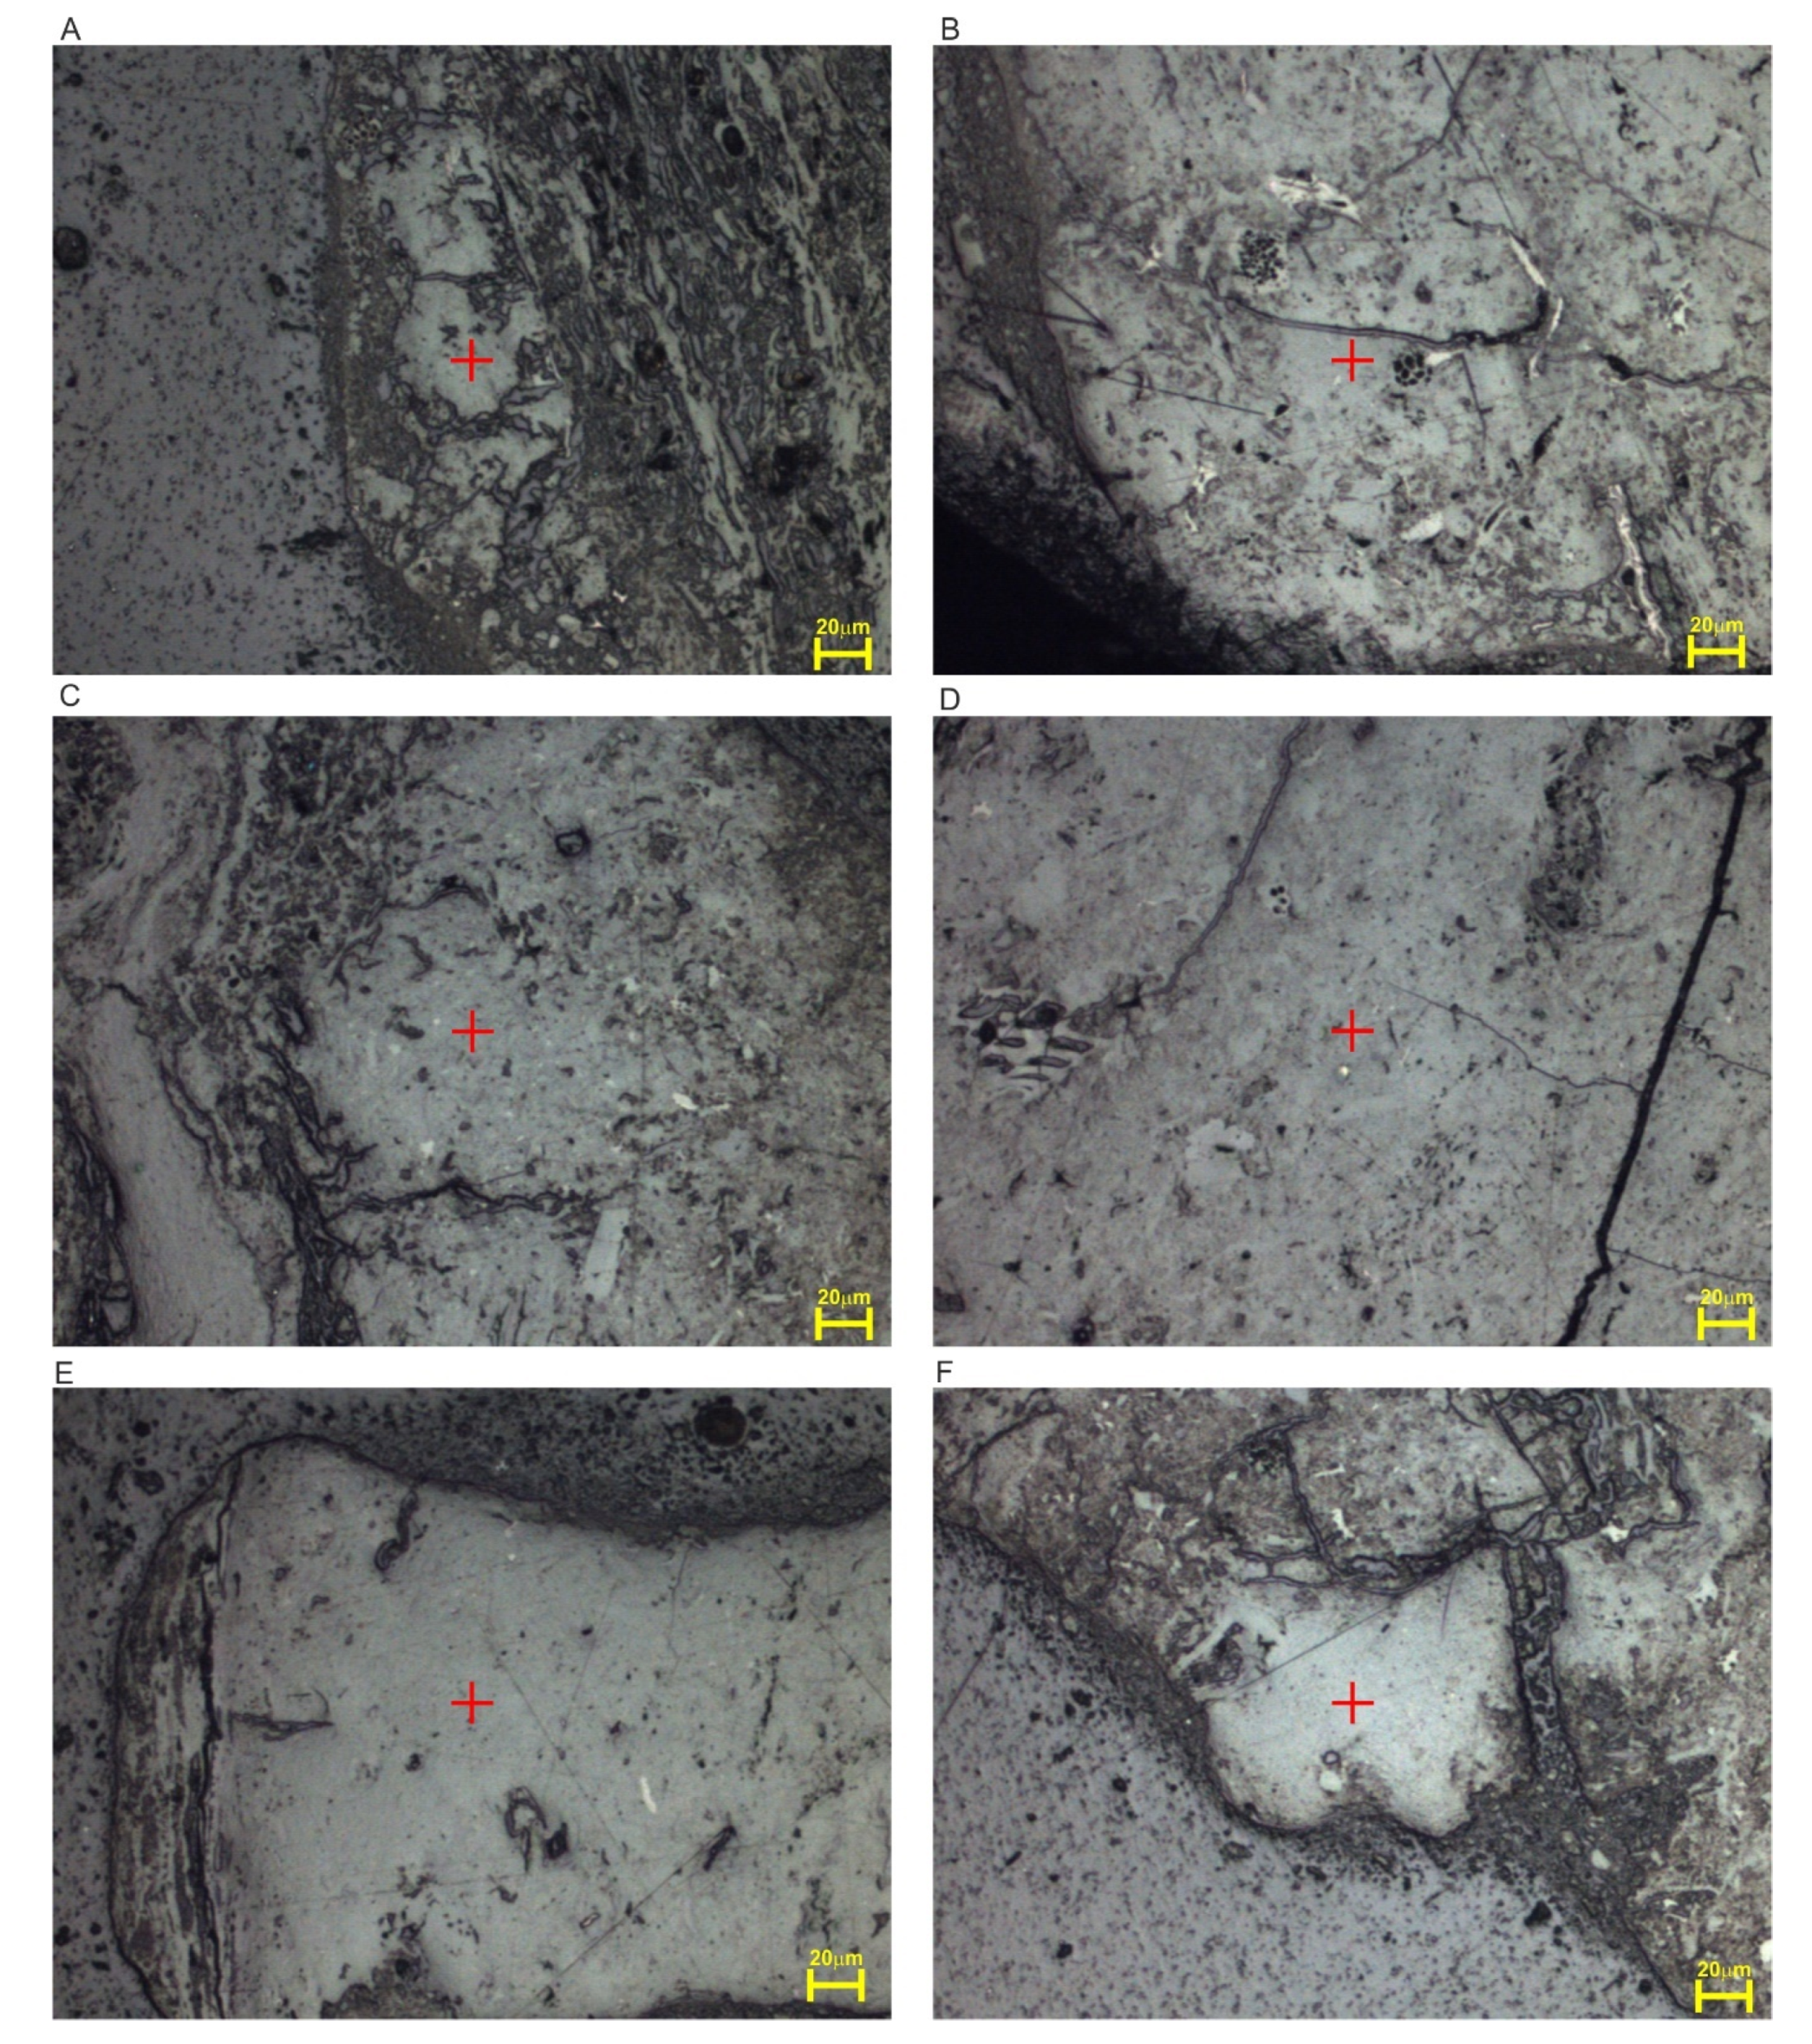
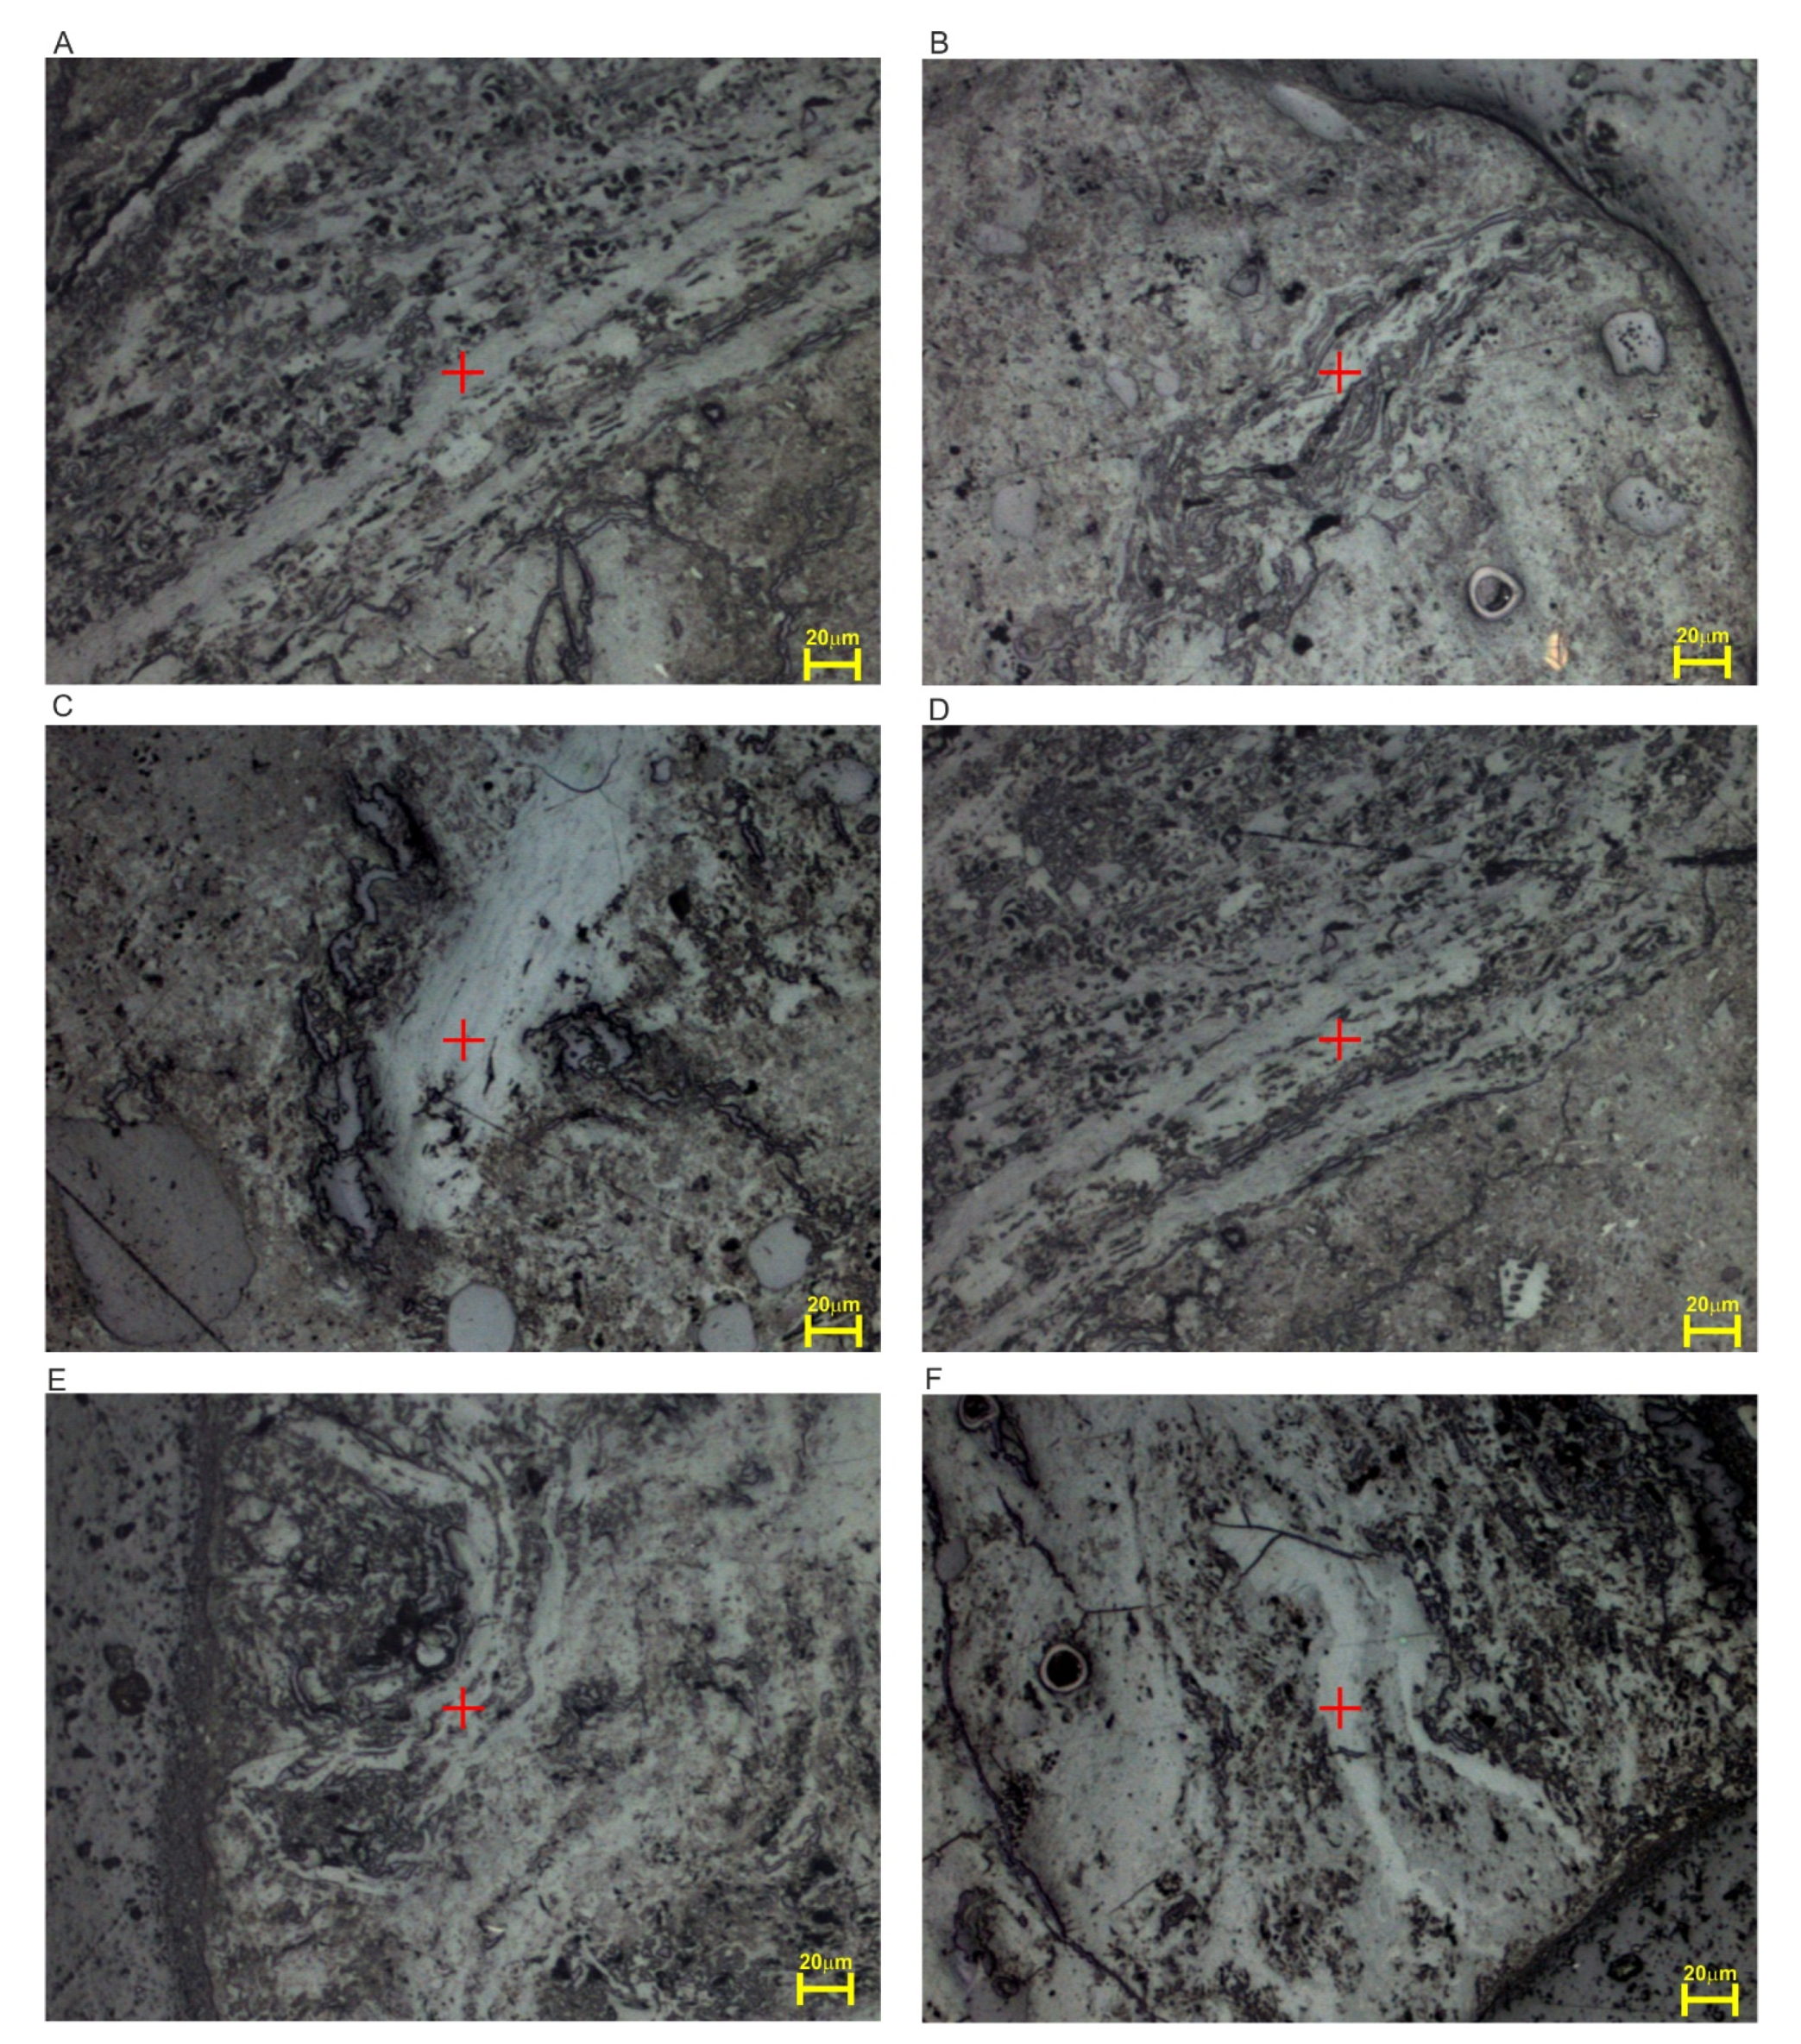
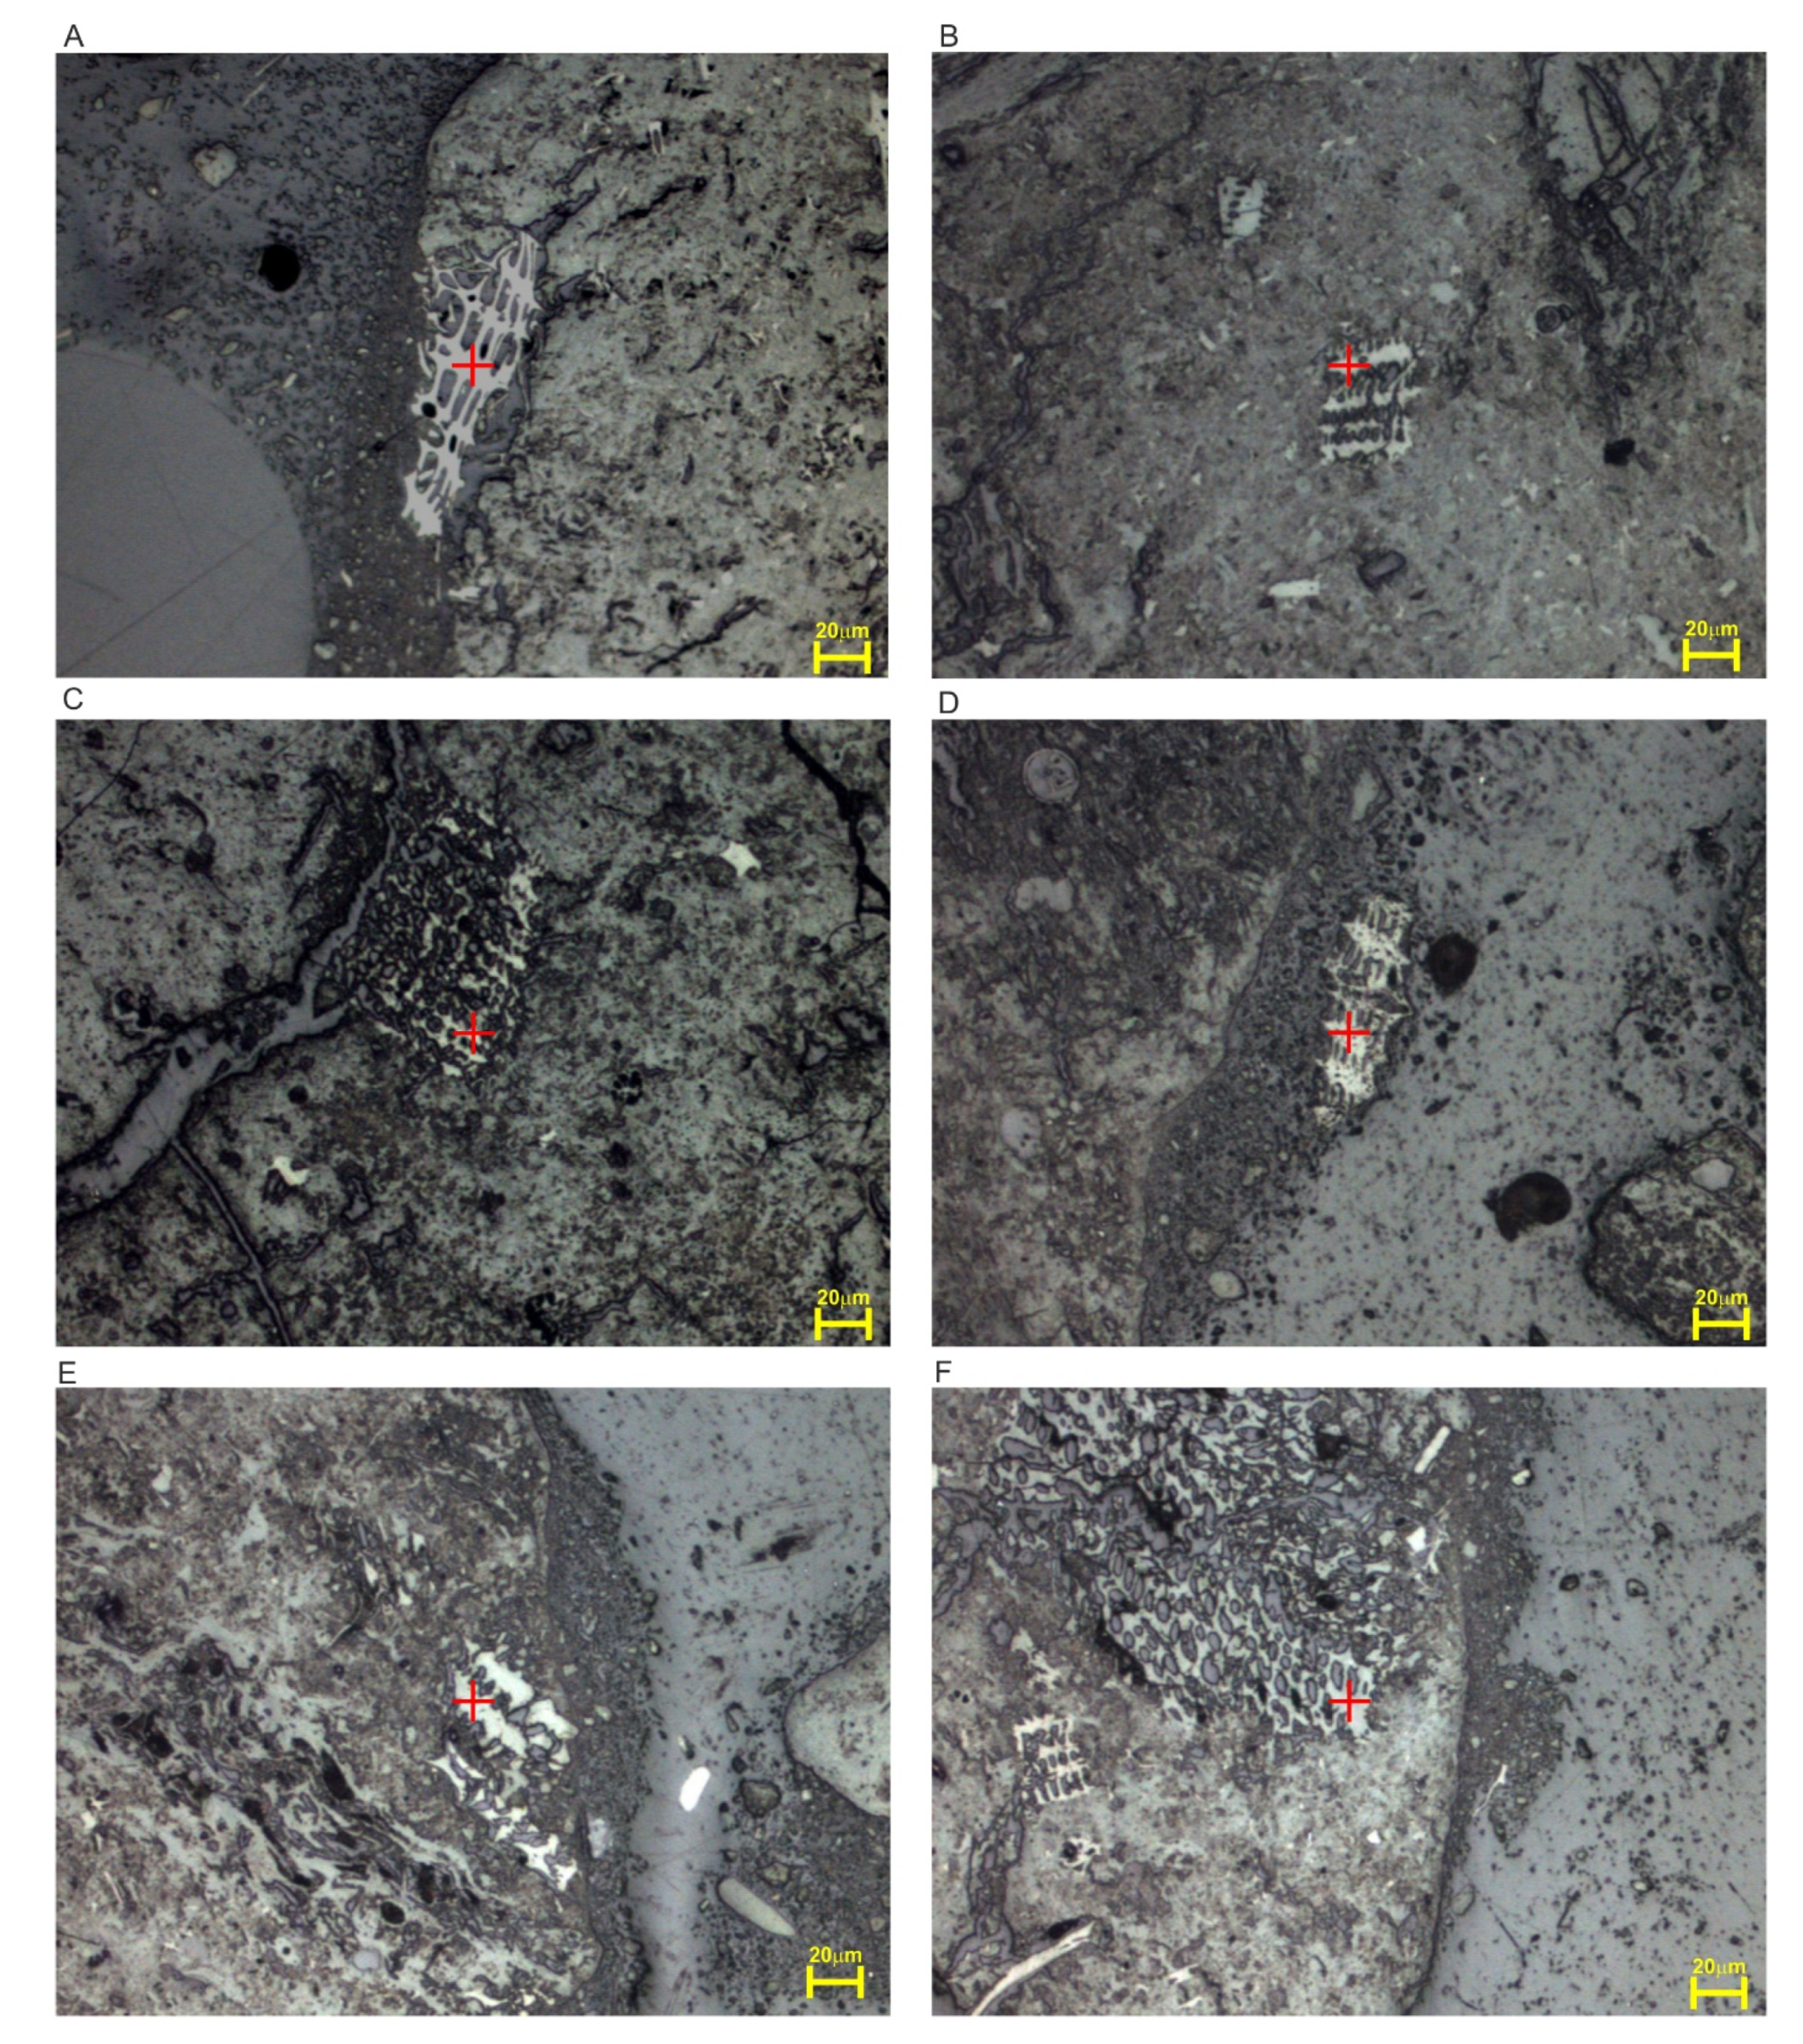
4.1. Petrographic Composition

Based on the macroscopic analysis (Table 1), the tested coal is xylodetritic coal with a xylite content of 22%.
The coal from the Szczerców deposit is dominated by macerals of the huminite group (80.7% vol.). The huminite macerals are dominated by attrinite (29.9% vol.) and densinite (23.9% vol.). The sum of these macerals indicates the dominant share of the detritic component in coal. Petrographic components of woody remnants, namely textinite (11.7% vol.) and ulminite (12.1% vol.), were observed. The huminite components of the tested coal also include gelinite and corpohuminite (1.5 and 1.6% vol., respectively) (Table 1).
The content of liptinite macerals is low (on average 5.7% vol.). The most commonly observed component of this group is liptodetrinite (3.6% vol.). Terpene resinite (on average 1.1% vol.) is mainly an impregnation of sapropelic xylites occurring in a subordinate amount. The content of sporinite is 0.6% vol. The content of cutinite (0.1% vol.), alginite (0.1% vol.), and suberinite (0.2% vol.) is very low.
The content of inertinite macerals is 3.1% vol. The most abundant component in this maceral group is inertodetrinite (1.8% vol.), randomly dispersed in attrinite and densinite. Less-abundant elements of this group include fusinite (1.0% vol.) semifusinite (0.2% vol.), and funginite (0.1% vol.).
The mineral matter content of the examined coal is 10.5% vol. (dry basis. The most commonly observed minerals are clay and quartz, which are dispersed among attrinite and densinite. The content of these minerals is 9.2% by volume. Pyrite, which accounts for 0.8% by volume, is less abundant, and is most commonly found in the form of framboidal pyrite. The presence of carbonates, which are associated with lake chalk, is typical for coal from the Szczerców deposit [14]. The mineral matter is dispersed in the macerals and locally impregnates intracellular spaces. Dispersed clay minerals are most commonly observed in attrinite.

4.2. Random Reflectance and Proximate and Ultimate Parameters of Lignite from the Szczerców Deposit

The random reflectance was measured on five macerals according to the ISO 7404-5 standard [21]. The measurements on huminite macerals were made on textinite, ulminite, attrinite, and densinite. In the case of macerals of the inertinite group, the random reflectance was measured on fusinite (Table 2). The obtained results correspond well with the results obtained by Sýkorová et al. (2005). The huminite macerals textinite (0.2%) and densinite (0.31%) have the lowest and highest random reflectance, respectively. Ulminite B’s random reflectance is 0.27%.
According to the ISO 11760:2005 [33] standard and in-seam coal classification [34], the investigated lignite was low-rank coal (lignite C)—as the average reflectance of ulminite B is less than 0.40% (Rr = 0.27%), the total moisture of the coal is >35% (51.3%), and the ash-free moisture is less than 75% (43.8%). The results obtained are consistent with other chemical measures of the rank of coal (Cdaf = 67.39%) and the gross calorific value (as received) (GCVmaf = 13.9 KJ/kg) (Table 3), which classifies the examined coal as ortholignite.

4.3. Micro-Raman Spectroscopy

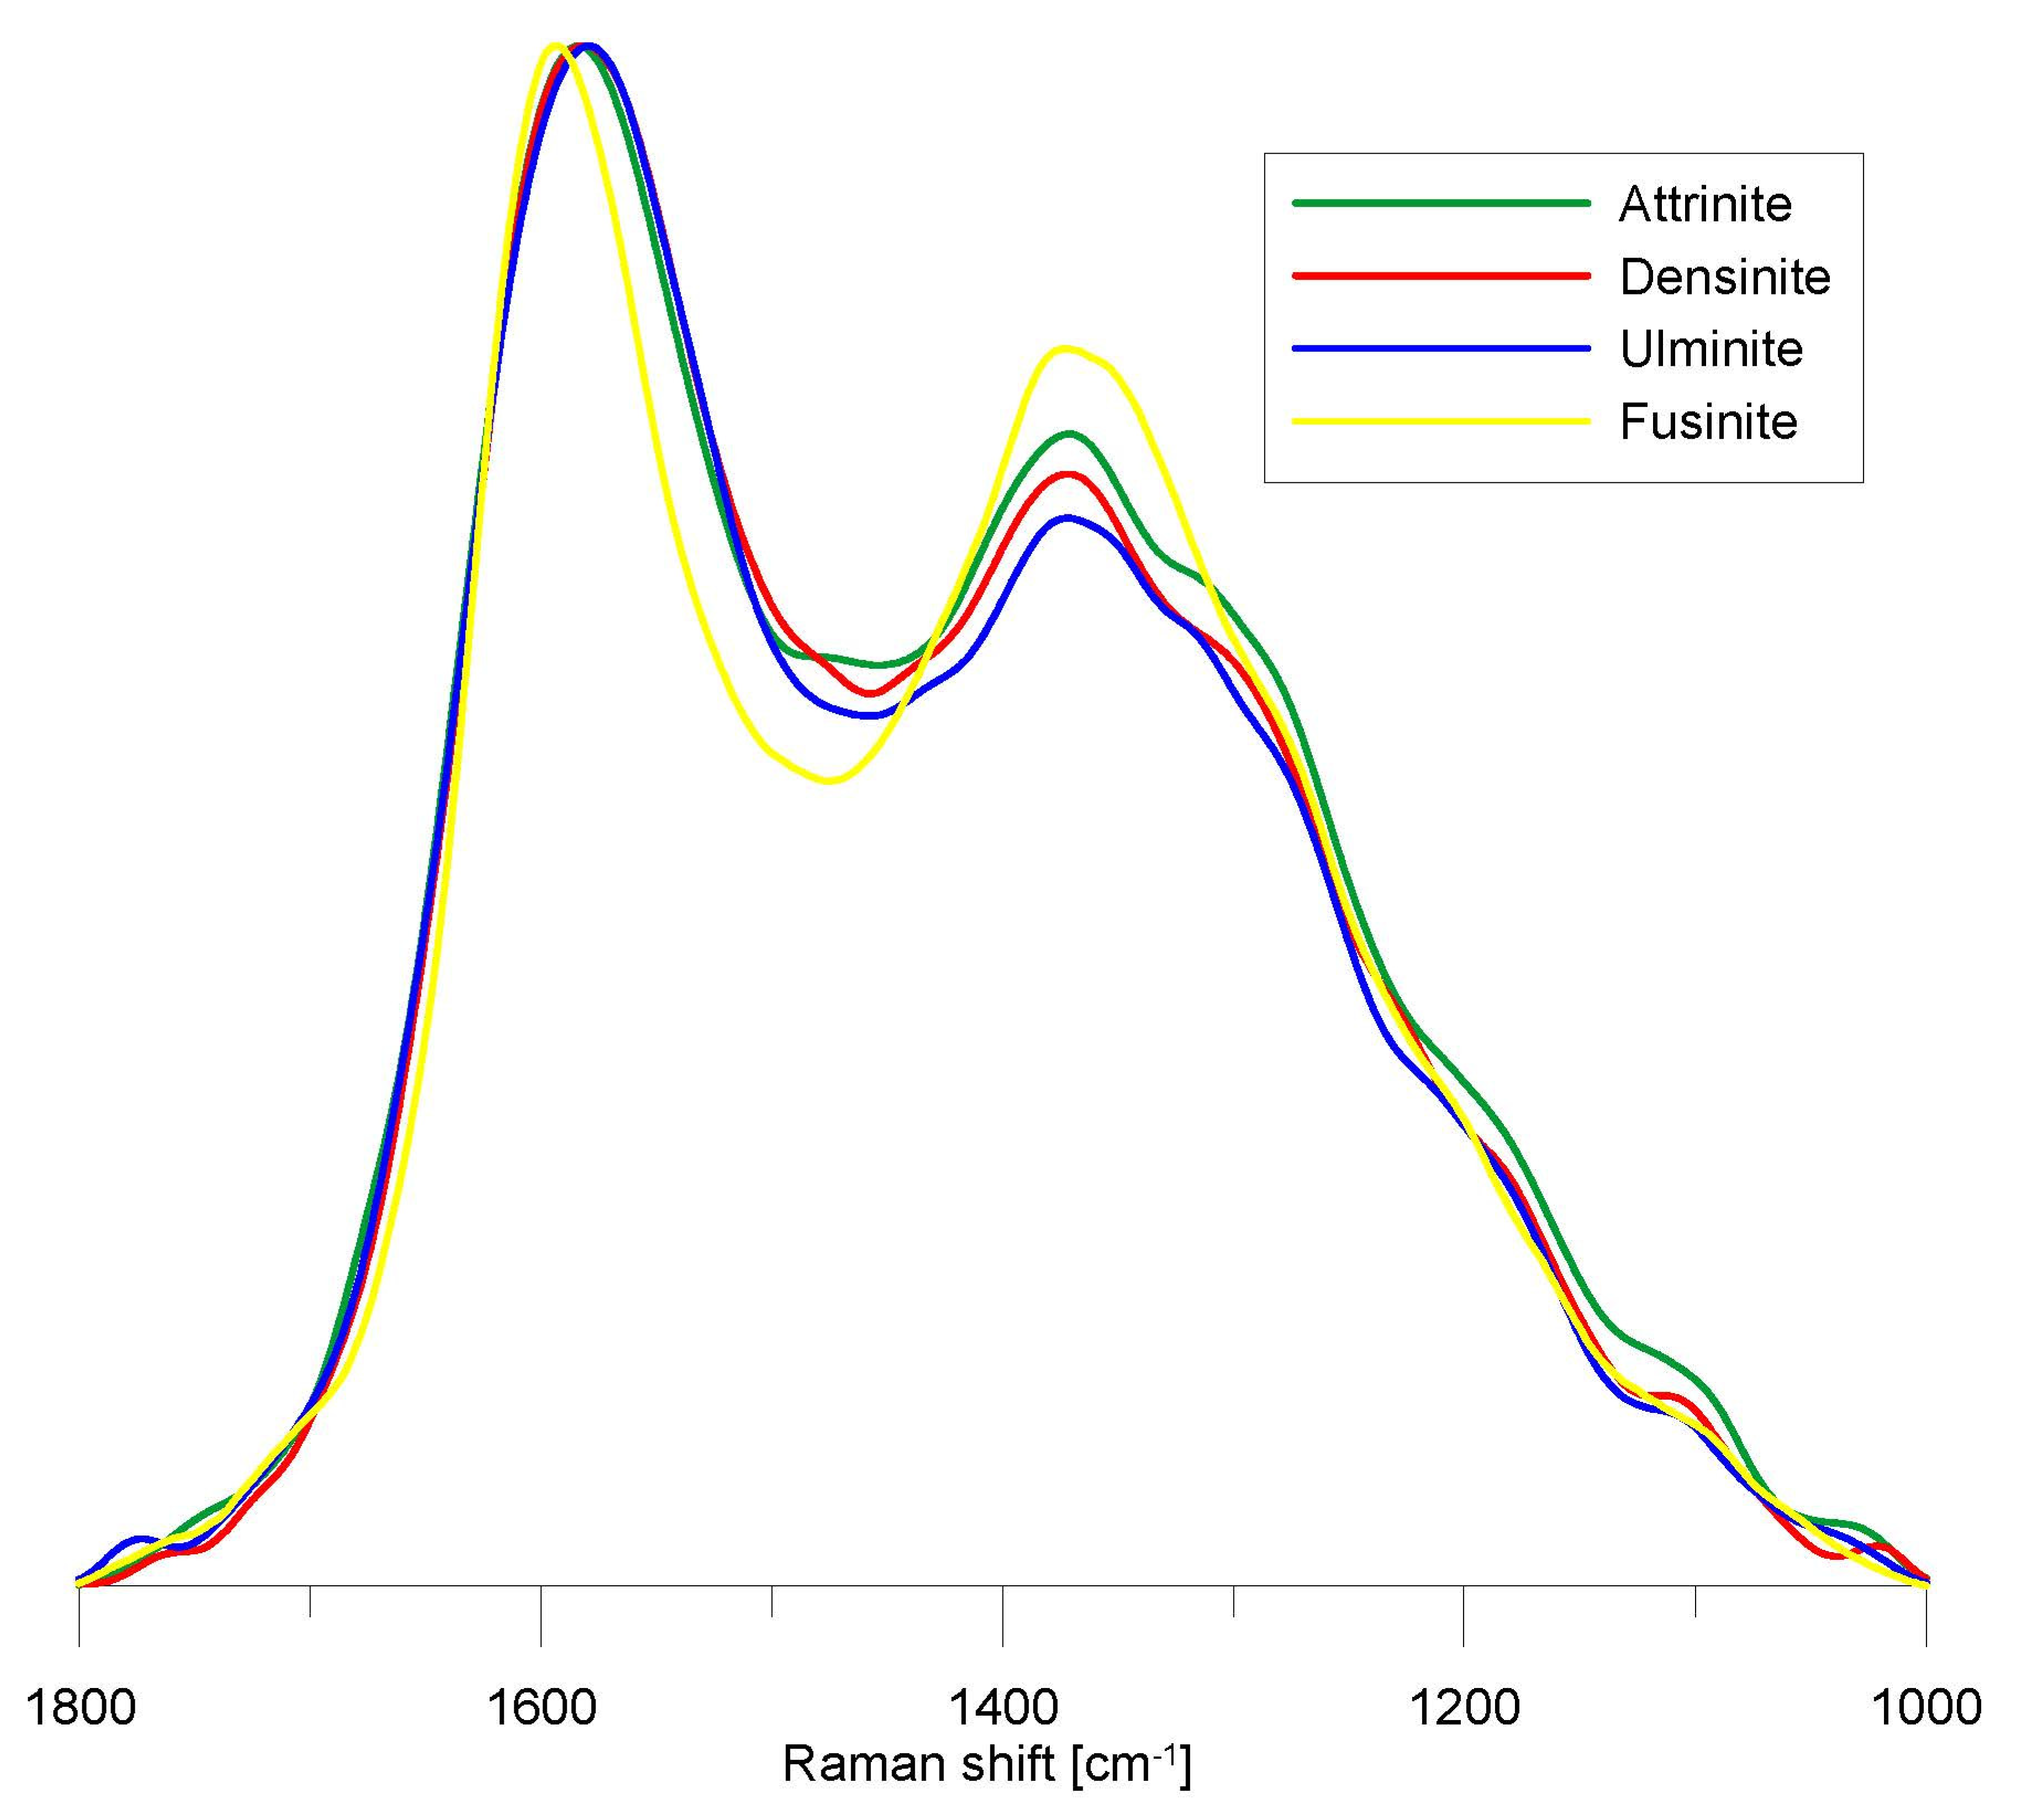
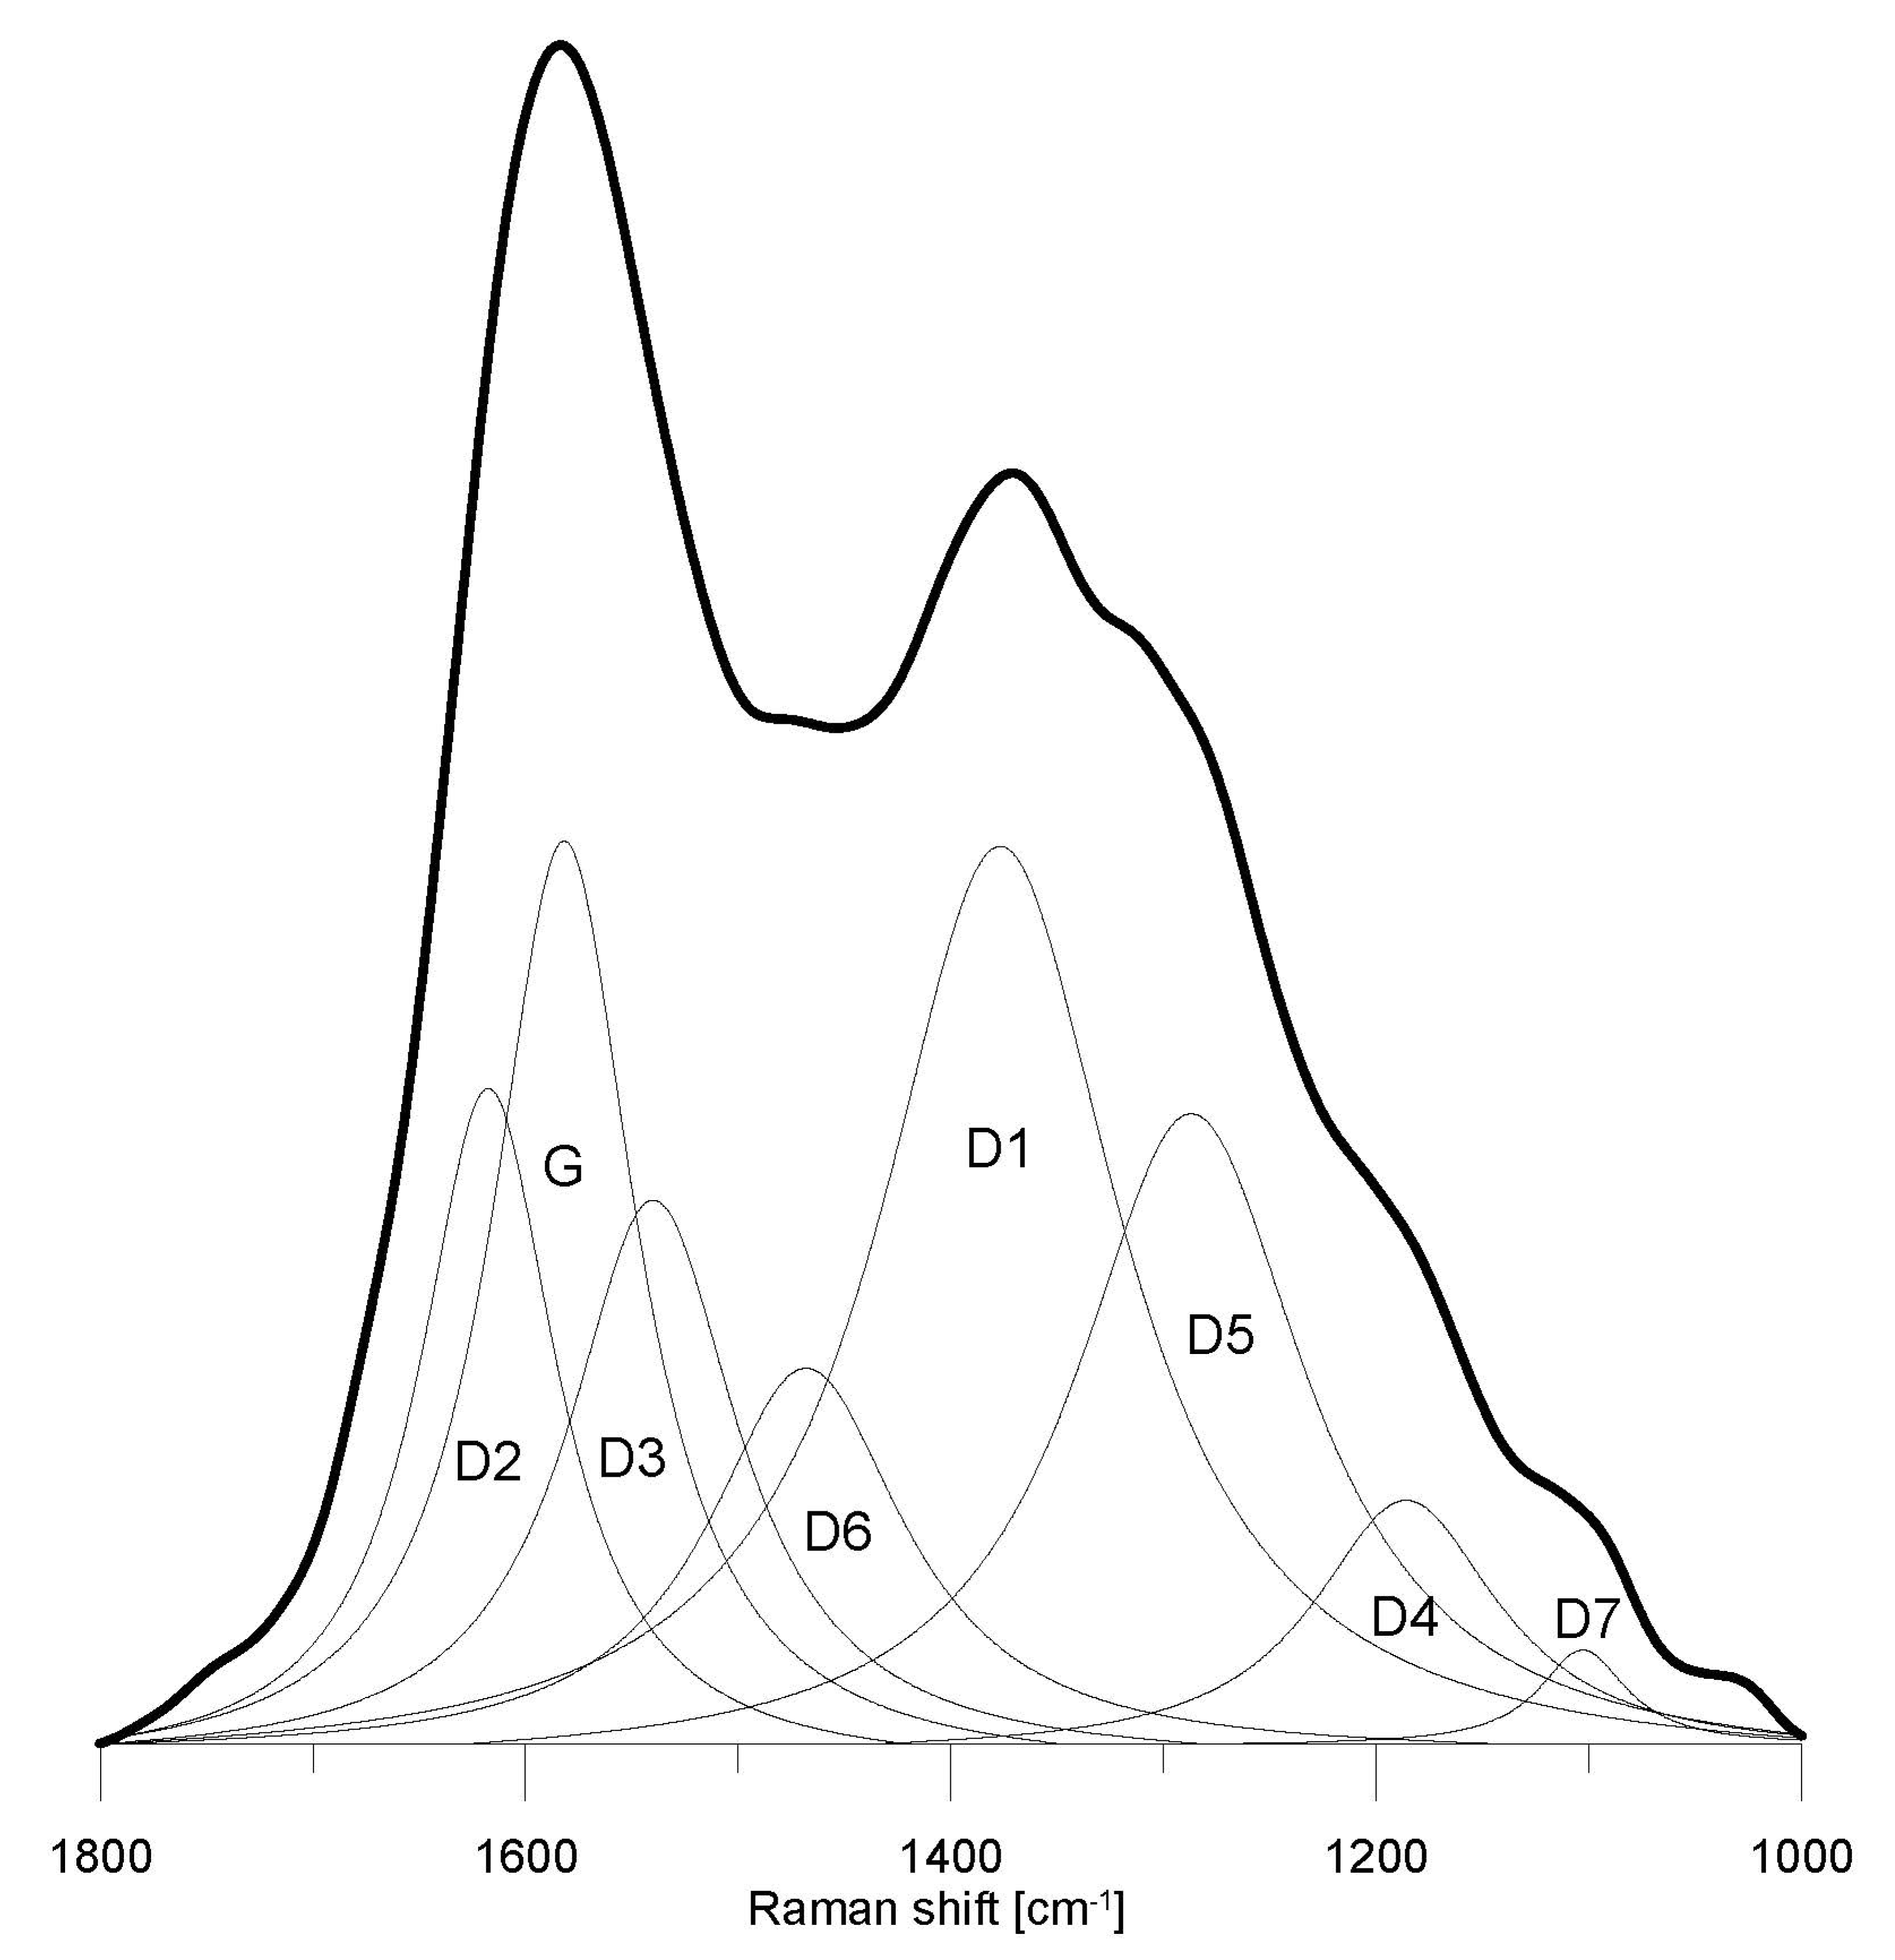
4.3.1. General Characteristics of the Raman Spectra

Representative Raman spectra of attrinite, densinite, ulminite, and fusinite from the studied coal are given in Figure 2. Eight bands of absorption are usually identified (Figure 3). The G band (~1580 cm−1) is typically assigned to a graphitic lattice mode E2g [35,36].
However, in the case of lignite, it is mainly related to aromatic ring breathing (Li et al., 2006). The D2 band (~1615 cm−1) makes a shoulder on the G band, being also attributed to the graphitic E2g mode [37,38]. It always occurs when the D1 band is present [39]. The D3 band (~1540 cm−1), also referred to as GR (Li et al., 2006), originates from out-of-plane vibration due to structural defects and heteroatoms [40,41]. It is assigned to aromatic systems (composed of three to five rings) and amorphous carbon [6,37,42,43].
The D6 band (~1465 cm−1), also denoted as VL [6], is related to methyl or methylene, small aromatic systems, and amorphous carbon [6]. The D1 band (~1285 cm−1) is assigned to in-plane defects or occurrence of heteroatoms and is associated with the breathing mode (A1g) of sp2 atoms in aromatic rings [35,38,41]. The origin of the D5 band (~1285 cm−1) or SL band [6] is not fully understood. It is believed to represent aryl–alkyl ethers [6] or CH in aliphatic chains [44]. The D4 band (~1195 cm−1) (S band—in Li et al., 2006) is attributed mainly to the occurrence of sp3-rich or sp3sp2 carbon structures, alkyl–aryl groups, aliphatic (or aromatic) ethers, as well as CH in aliphatic chains or on aromatic rings [6,43,44,45]. Frequently, especially in bituminous coals and cokes, only one band in the 1200–1240 cm−1 region, named D4, is indicated [43,46,47,48,49]. A very weak D7 band at ~1095 cm−1, marked SR by Li et al. [6], is found in most of the spectra. It is assigned to C-H on aromatic rings [6]. Additionally, a very weak band at ~1700 cm−1, related to the carbonyl group (C=O) vibration, was also observed in some of the spectra (not used in the curve-fitting procedure).
Similar Raman bands were observed in the earlier Raman investigations of low-rank coal (lignite and sub-bituminous coal) [6,7,8,10,11,44]. However, the VR band at ~1380 cm−1 indicated by Li et al. [6] and Xu et al. [11] was not found.
The G band in the attrinite spectra appears at ~1579 cm−1, whereas the D1 band appears at ~1376 cm−1 (Table 4). The full width at half maximum (FWHM) of these bands is ~79 cm−1 and ~138 cm−1, respectively. The Raman Band Separation (RBS) value is ~203 cm−1 (Table 5).
In the case of densinite, the G band is found at ~1580 cm−1, and the D1 band at ~1374 cm−1. The FWHM of these bands is ~78 cm−1 and ~140 cm−1, respectively (Table 4). The RBS reaches a value of ~206 cm−1 (Table 5).
The G band in the ulminite spectra occurs at ~1581 cm−1, while the D1 band occurs at ~1369 cm−1, with FWHM values of ~80 cm−1 and ~147 cm−1, respectively (Table 4). The RBS value is ~213 cm−1 (Table 5).
Considering fusinite spectra, the G band position is ~1584 cm−1, whereas the D1 band position is ~1367 cm−1; the FWHM of these bands is ~73 cm−1 and ~151 cm−1, respectively (Table 4). The RBS reaches ~217 cm−1 (Table 5). The G band FWHM is higher and the RBS lower than those determined for fusinite and semifusinite in bituminous (hard) coals [47,50]. Fusinite spectra have a weak or absent D7 band at ~1095 cm−1.
The values of other spectral parameters are summarized in Table 4 and Table 5.
The sum of the AD4/AALL + AD5/AALL ratio calculated herein is similar to the value of the AD4/AALL ratio (derived from a typical five-band curve fitting method) obtained for semifusinite, but lower than that of fusinite in bituminous coals [47,50]. Furthermore, the sum of the AD3/AALL + AD6/AALL ratios determined in this study corresponds well to the value of the AD3/AALL ratio (one band was indicated in the valley between the D1 and G bands) in the spectra of semifusinite from bituminous coals [47,50].

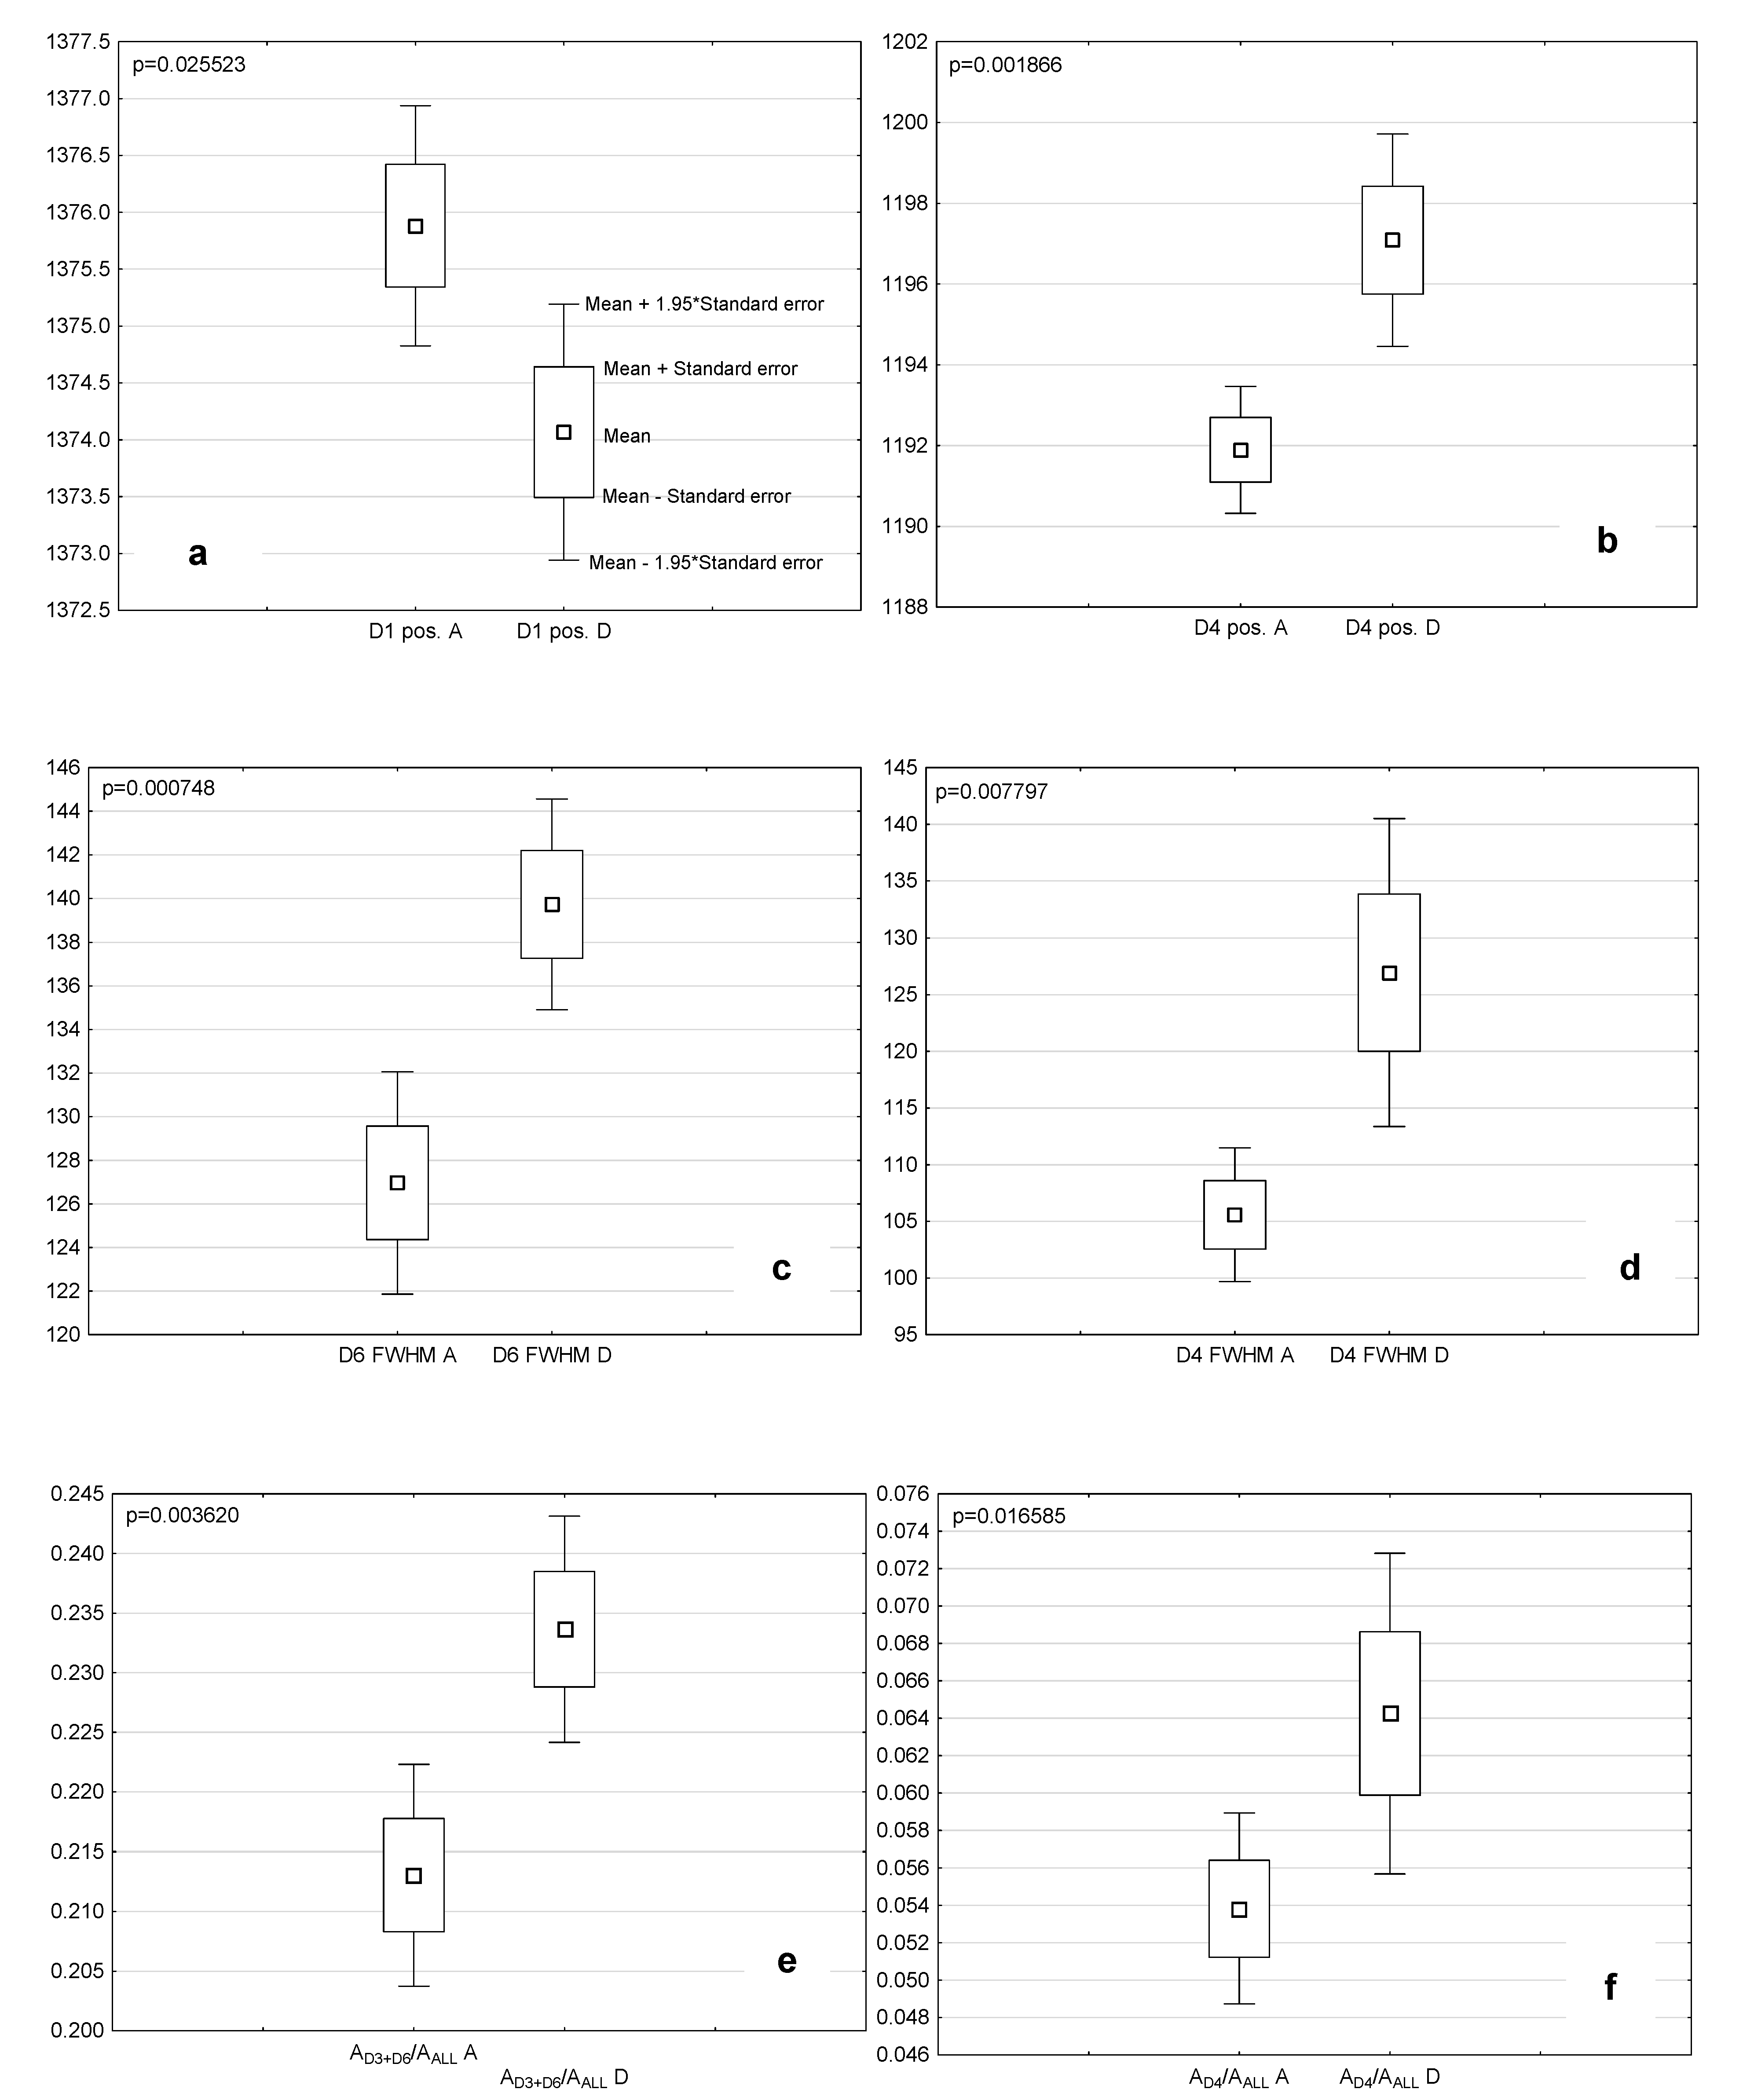
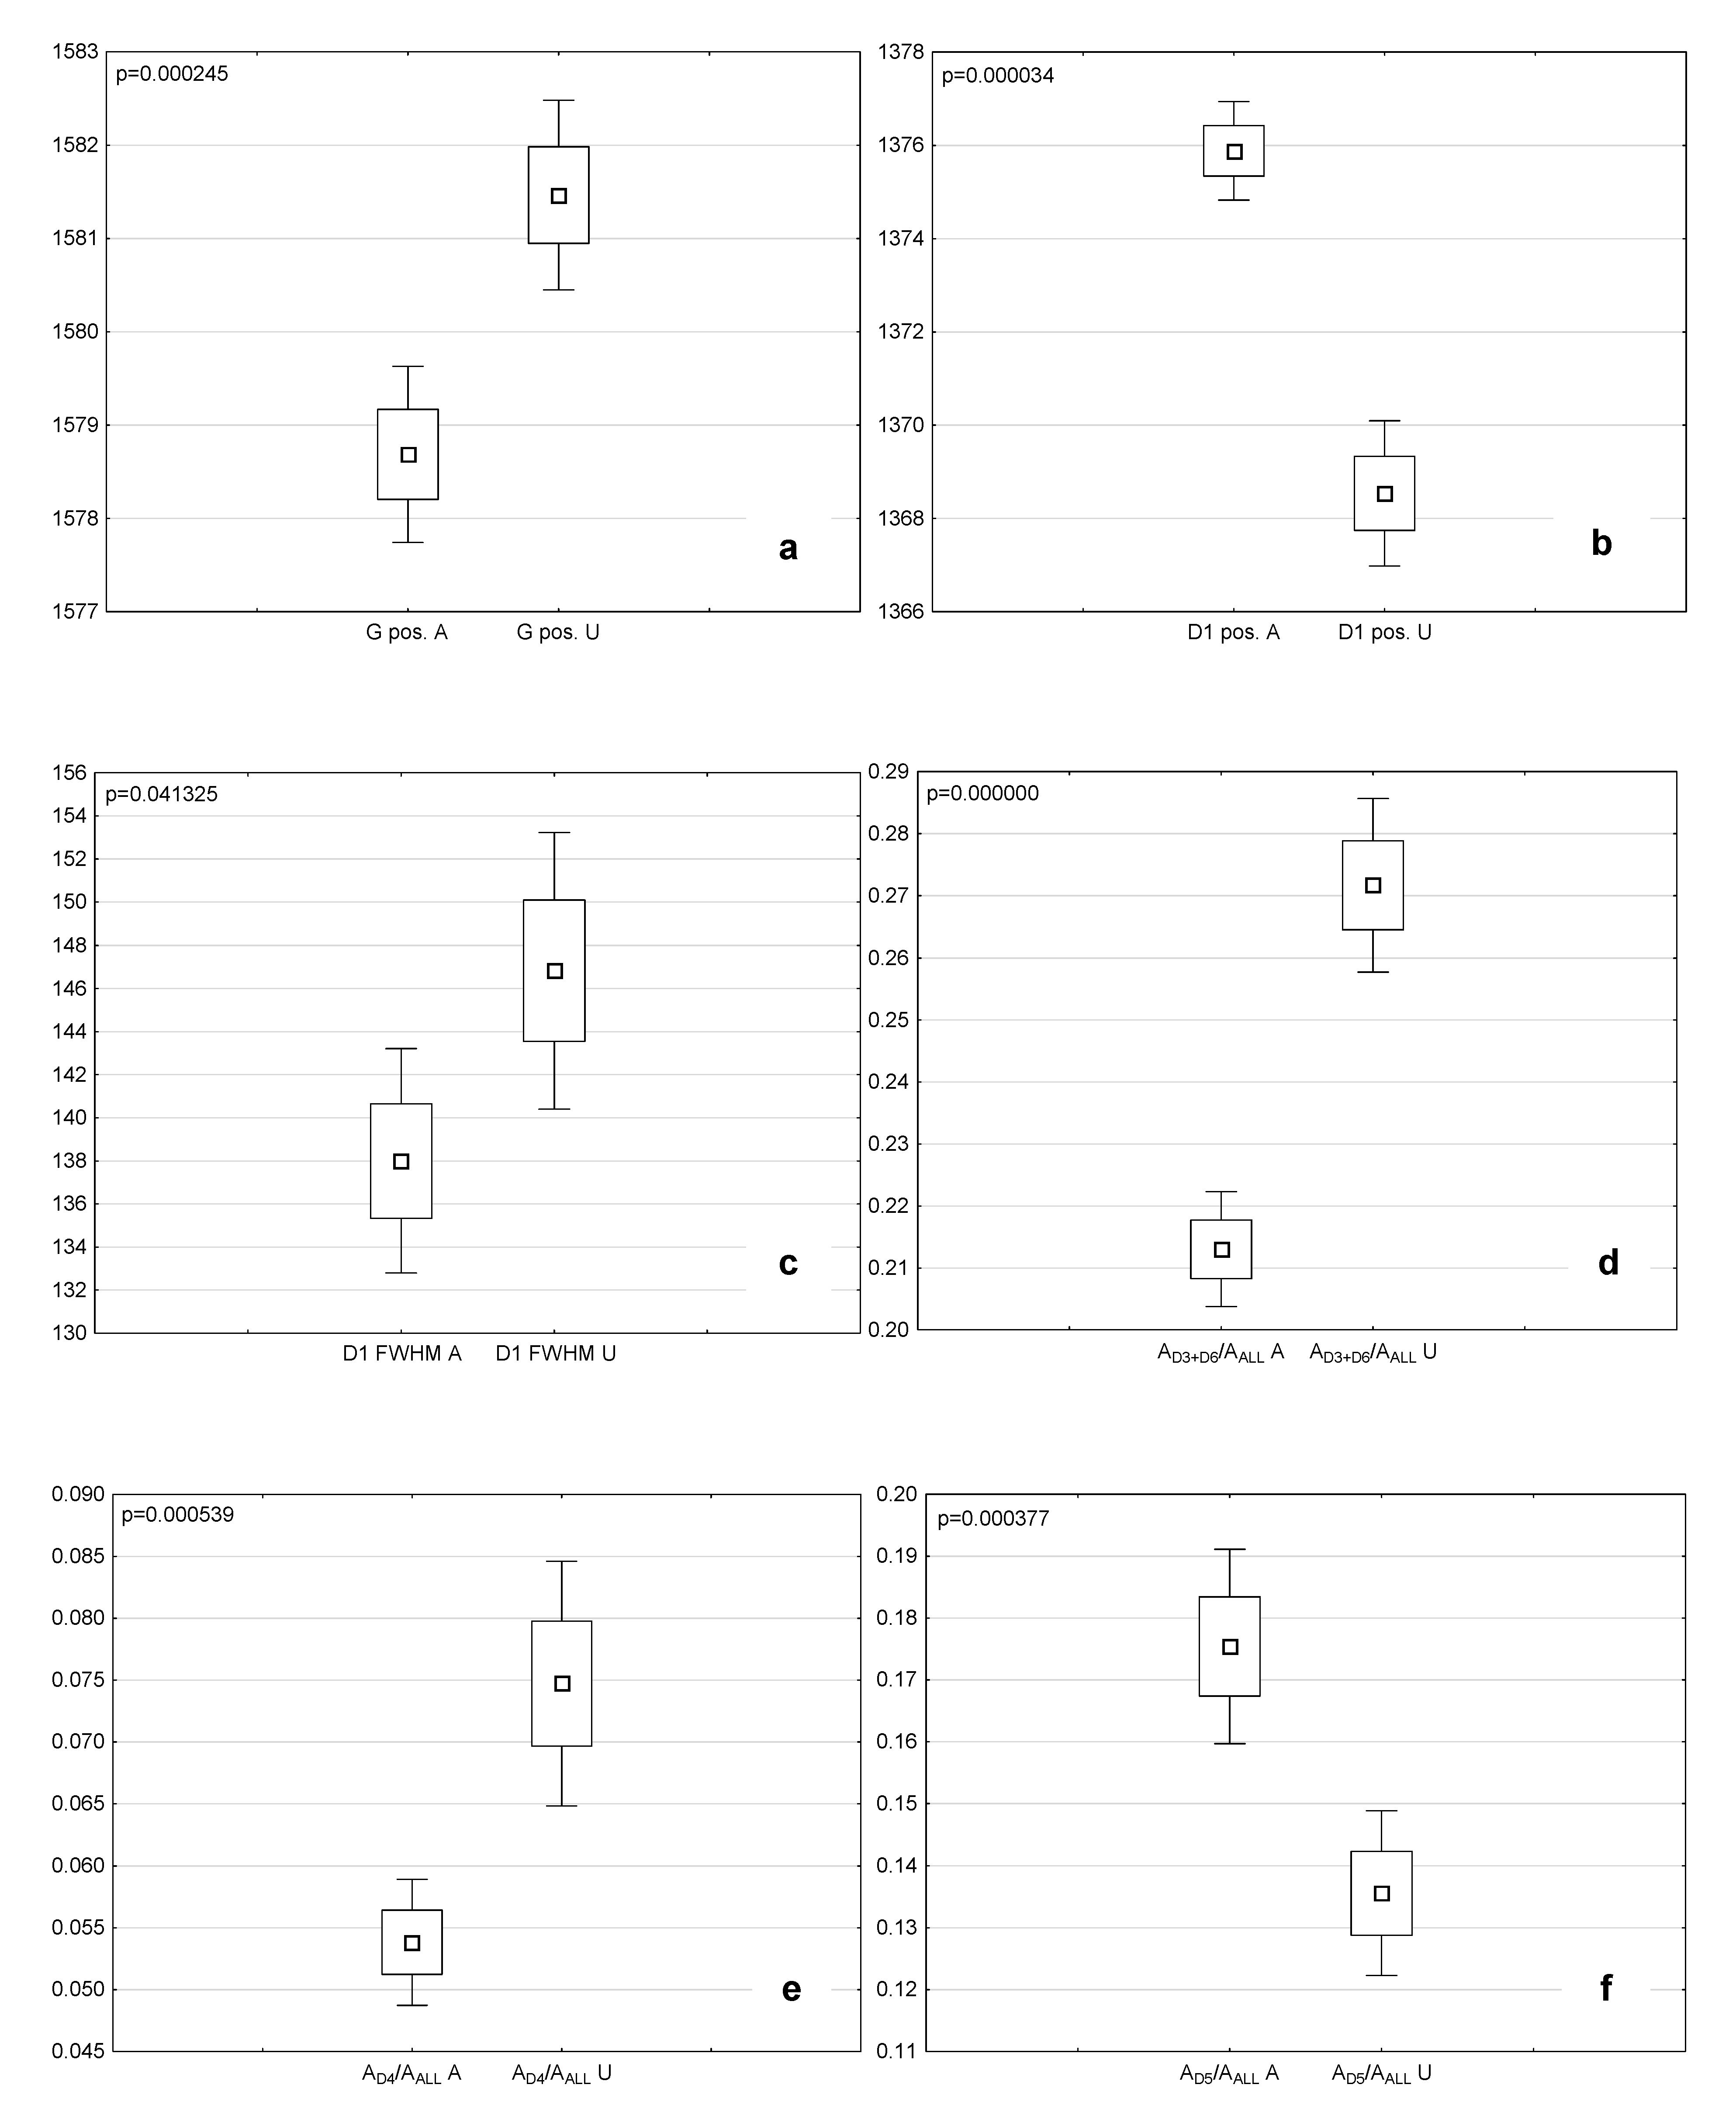
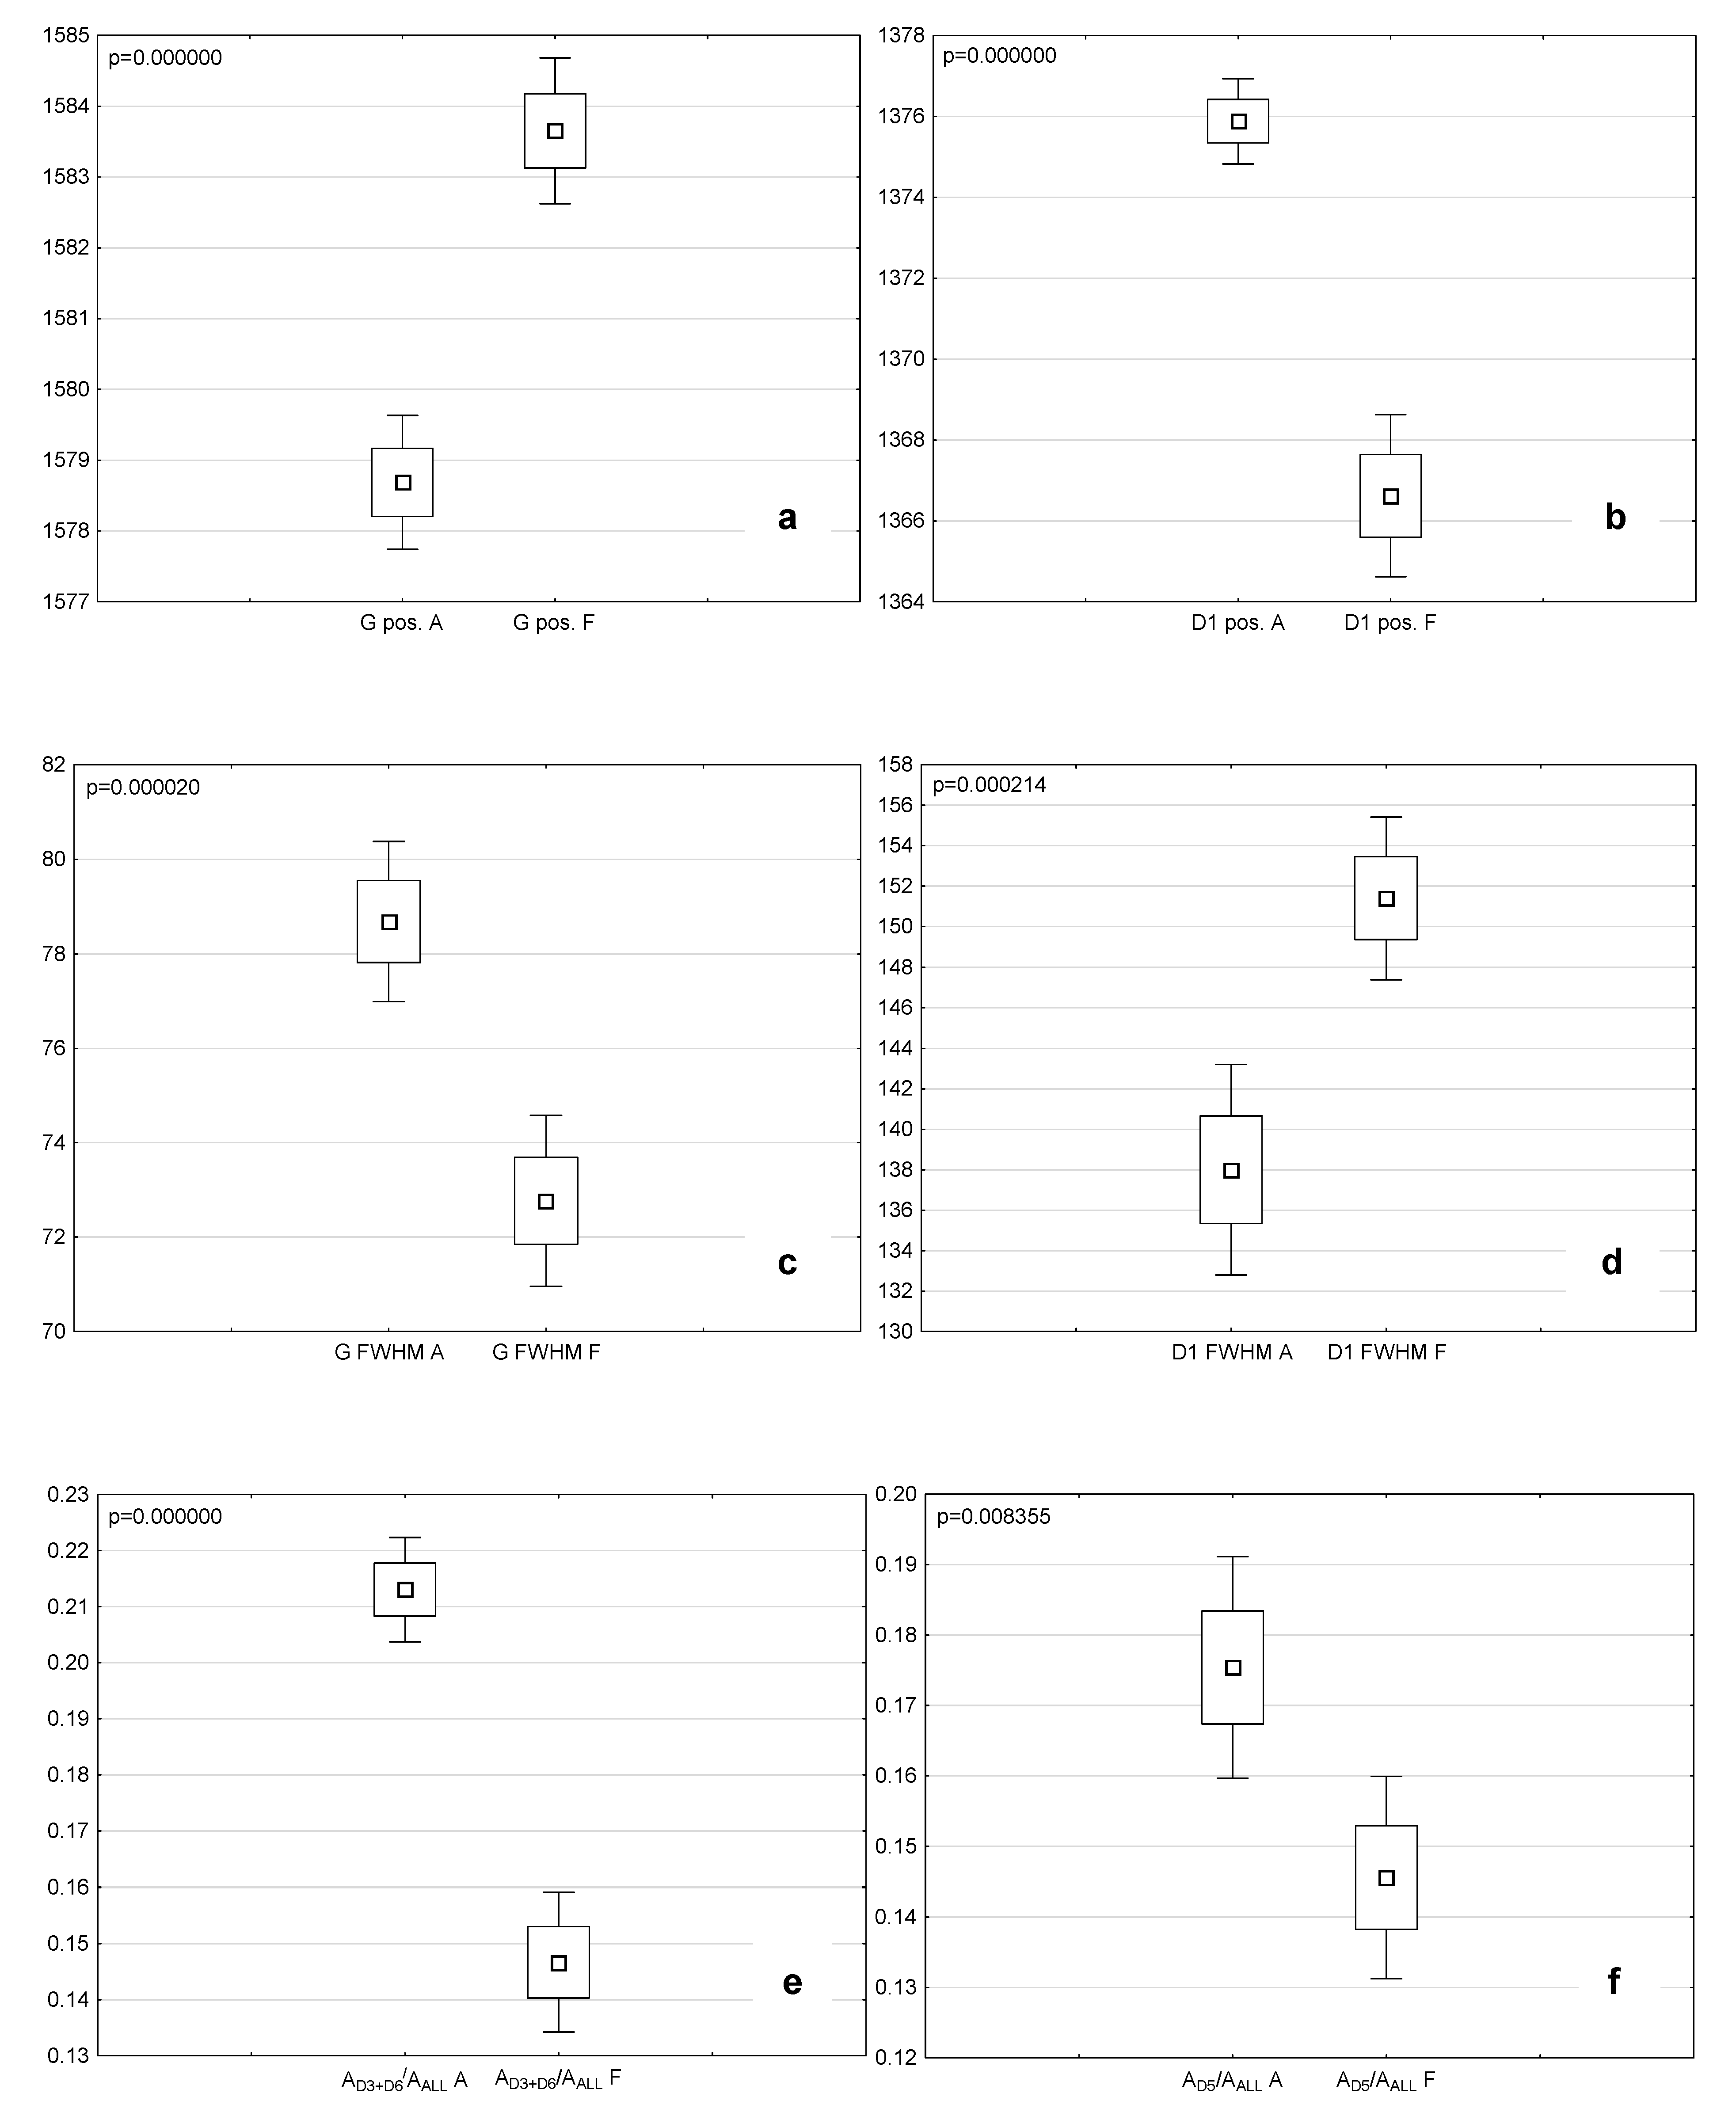
4.3.2. Comparison of the Microstructural and Chemical Properties of the Analyzed Macerals

Comparisons were performed for the following pairs of macerals: attrinite–densinite, attrinite–ulminite, and attrinite–fusinite. To find out if the differences in spectral parameters between the macerals were statistically valid, the Shapiro–Wilk, Fisher–Snedecor, and, finally, Student’s t-test were performed.
The Shapiro–Wilk test shows that all data sets of individual Raman-derived spectral parameters obtained from the curve fitting procedure have normal or close to normal distribution. The Fisher–Snedecor test demonstrates that variances are equal in all analyzed pairs of spectral parameters.
Considering this, Student’s t-test was conducted for all parameters. Each time that the difference in spectral parameters is mentioned in the text, it is statistically significant, as inferred from the t-test (p value < 0.05).
Attrinite and densinite show the highest similarity of microstructural properties among all of the analyzed macerals, which is in line with the results of the FTIR investigations revealing that the chemical composition of detrohuminite subgroup macerals is largely independent of its degree of gelification [51]. However, there are some statistically significant (p < 0.05) differences between their spectral parameters. This applies to the position of the D1 band, which appears at lower wavenumbers in the densinite spectra, whereas the D4 band falls at higher wavenumbers (Figure 4a,b). The densinite spectra also reveal higher D6 and D4 band FWHMs and higher AD3+D6/AALL and AD4/AALL ratios (Figure 4c–f). This reflects higher amounts of small aromatic units and alkyl–aryl and CH groups in the chemical structure of densinite compared with attrinite [6,43,44,45], probably resulting from stronger gelification of densinite. An increase in aromaticity of the huminite group macerals with increasing gelification was earlier reported, based on the FTIR examination [5,52,53,54]. This is also in line with the difference in Rr value between densinite (0.31%) and attrinite (0.26%). Similarly, the difference in D1 band position observed herein corresponds with a shift of the D1 band to lower wavelengths with increasing reflectance, as reported by Kelemen and Fang [55] and Guedes et al. [8]. The RBS value, which correlates well with the Rr value [32,55,56,57,58,59], is higher for densinite, which also corresponds with higher reflectance values of this maceral (Table 2 and Table 5). Where detrohuminite’s microstructure is concerned, it should be remembered that the primary plant material and the initial peat-forming conditions have a great impact on the features of macerals belonging to this subgroup.
Statistical analysis shows that the microstructural features of attrinite and ulminite differ significantly. The position of some of the Raman bands (D2, G, and D4) in ulminite spectra is moved to higher wavenumbers, whereas the D6, D1, and D7 bands fall at lower ones (Figure 5a,b; Table 4). Ulminite exhibits a higher FWHM of the D3, D6, D1, and D4 bands and higher AD3+D6/AALL and AD4/AALL ratios in comparison with attrinite (Figure 5c–e; Table 4 and Table 5). On the other hand, the AD5/AALL ratio is lower in ulminite than in attrinite (Figure 5f). Taking the origin of the D3, D4, and D6 bands [6,43,44,45], the differences in the values of the spectral ratios imply that the chemical structure of ulminite is more abundant in small aromatic systems composed of three to five rings, Caromatic–Calkyl systems, and CH groups. This may be due to gelification of ulminite, as aromaticity increases with increasing gelification [5,52,53,54]. Ulminite spectra also exhibit higher Raman band separation (RBS) values (Table 5) than those of attrinite. The differences observed may also result from different origins of starting materials; attrinite may come from the soft, cellulose-rich tissues of plants, and ulminite may come from lignin-rich xylem. Lignin remnants may affect the aromaticity of lignite at the early stage of coalification [60].
As should be expected, there are major differences in microstructure between attrinite and fusinite. Most of the Raman bands occur at lower wavenumbers when fusinite is considered, but the position of the G band moves to higher wavenumbers (Figure 6a,b; Table 4). Fusinite spectra also have lower FWHM values of the D2 and G bands and a higher FWHM of the D3, D1, D5, and D7 bands in comparison with attrinite (Figure 6c,d; Table 4). However, the D3, D6, and D5 bands reveal low height; thereby, the AD3+D6/AALL and AD5/AALL ratios are lower for fusinite (Figure 6e,f; Table 5). The RBS value determined for fusinite is also higher (Table 5). The lower G band FWHM indicates better organization of the fusinite microstructure in relation to the attrinite microstructure [8,32,39,47,48,55,61,62]. The higher D1 band FWHM in the fusinite spectra reveals that aromatic clusters in fusinite are more varied in terms of their order and dimensions [63]. The higher RBS value determined for fusinite corresponds with the higher mean random reflectance (Rr) of this maceral (Table 2 and Table 5) [32,55,56,57,58,59]. The lower AD3/AALL, AD6/AALL and AD5/AALL ratio values determined for fusinite (when compared with attrinite) are a consequence of the lower content of smaller aromatic systems—aliphatics as well as mixed structures and alkyl–aryl groups [6,37,42,43,44]. Instead, larger aromatic ring systems dominate the chemical structure of fusinite.
Ferralis et al. [44] found a linear relationship between the (ID4+ID5)/(IG+ID2) Raman band area ratio (Symbols taken from Ferralis et al. [44]) and the elemental H:C ratio. Considering the above, a similar calculation of the (ID4 + ID5)/(IG + ID2) ratio was performed here, which shows much lower values obtained for fusinite (0.26) than for attrinite (0.37), densinite (0.46), or ulminite (0.50). This reflects the much lower hydrogen content in the chemical structure of fusinite in comparison with other examined macerals. However, no positive correlation between the AD4/AALL and AD5/AALL ratios is observed—which should be expected if the D4 and D5 bands are related to the same chemical structures in coal. This may suggest that the origin of the D4 and D5 bands is different.

5. Conclusions

Lignite (ulminite reflectance Rro = 0.27%) from the Szczerców deposit (Central Poland) was subjected to micro-Raman spectroscopy examination. The study revealed differences in the microstructure of the huminite group macerals (attrinite, densinite, and ulminite). Densinite and ulminite are more abundant in small aromatic units than attrinite, which may result from their gelification or the kind of starting material. The differences in the Raman spectral characteristics between attrinite and ulminite are more pronounced than between attrinite and densinite. As expected, fusinite, in comparison with the huminite group macerals, is composed of larger, more varied aromatic systems. Similarities to semifusinite’s microstructure in bituminous coals are observed. The D4 band (1190–1200 cm−1) and D5 band (1280–1290 cm−1) most likely correspond to different chemical structures, and their origin should be further investigated.
On the basis of petrographic analysis, the directions of use and the best ways of exploitation can also be determined. The presence of fibrous xylites is particularly unfavorable during mining and grinding. Therefore, in practice, the best solution is to determine the xylite content as early as possible, even at the stage of deposit exploration. The petrographic composition of coal has a direct impact on its suitability for the gasification process, where the degree of coal gelification and the concentration of carbonate and quartz minerals are of particular importance.

Author Contributions

Conceptualization, B.B. and R.M.; methodology, B.B. and R.M.; formal analysis, B.B. and R.M.; writing—original draft preparation, B.B. and R.M.; writing—review and editing, B.B. and R.M.; visualization, B.B. and R.M. All authors have read and agreed to the published version of the manuscript.

Funding

This research was funded by the Ministry of Science and Higher Education (subsidy no. 16.16.140.315).

Institutional Review Board Statement

Not applicable.

Informed Consent Statement

Not applicable.

Data Availability Statement

Data is contained within the article.

Conflicts of Interest

The authors declare no conflict of interest.

Appendix A

Figure A1. Selected measurement points (+) on attrinite (AF).
Energies 14 00281 g0a1
Figure A2. Selected measurement points (+) on densinite (AF).
Energies 14 00281 g0a2
Figure A3. Selected measurement points (+) on ulminite (AF).
Energies 14 00281 g0a3
Figure A4. Selected measurement points (+) on fusinite (AF).
Energies 14 00281 g0a4

References

  1. Suárez-Ruiz, I.; Crelling, J. Applied Coal Petrology; Elsevier Ltd.: Amsterdam, The Netherlands, 2008; ISBN 9780080450513. [Google Scholar]
  2. Suárez-Ruiz, I.; Rubiera, F.; Diez, M. New Trends in Coal Conversion: Combustion, Gasification, Emissions, and Coking; Woodhead Publishing: Cambridge, UK, 2018. [Google Scholar]
  3. Roberts, M.J.; Everson, R.C.; Neomagus, H.W.J.P.; Van Niekerk, D.; Mathews, J.P.; Branken, D.J. Influence of maceral composition on the structure, properties and behaviour of chars derived from South African coals. Fuel 2015, 142, 9–20. [Google Scholar] [CrossRef]
  4. Bielowicz, B.; Baran, P. CO2 sorption properties of selected lithotypes of lignite from Polish deposits. Geol. Q. 2019, 63, 786–800. [Google Scholar] [CrossRef]
  5. Wagner, M. The character of the IR absorption in the spectral rang 1700–1500 cm−1 of some macerals of the huminite group of brown coal. Bull. L’Acad. Pol. Sci. 1981, 29, 321–330. [Google Scholar]
  6. Li, X.; Hamashi, J.I.; Li, C.Z.; Hayaschi, J.; Li, C.Z. FT-Raman spectroscopic study of the evolution of char structure during the pyrolysis of a Victorian brown coal. Fuel 2006, 85, 1700–1707. [Google Scholar] [CrossRef]
  7. Liu, X.; You, J.; Wang, Y.; Lu, L.; Xie, Y.; Yu, I.; Fu, Q. Raman spectroscopic study on the pyrolysis of Australian bituminous coal. J. Fuel Chem. Technol. 2014, 42, 270–276. [Google Scholar] [CrossRef]
  8. Guedes, A.; Valentim, B.; Prieto, A.C.; Rodrigues, S.; Noronha, F. Micro-Raman spectroscopy of collotelinite, fusinite and macrinite. Int. J. Coal Geol. 2010, 83, 415–422. [Google Scholar] [CrossRef]
  9. Baysal, M.; Yürüm, A.; Yıldız, B.; Yürüm, Y. Structure of some western Anatolia coals investigated by FTIR, Raman, 13C solid state NMR spectroscopy and X-ray diffraction. Int. J. Coal Geol. 2016, 163, 166–176. [Google Scholar] [CrossRef]
  10. He, X.; Liu, X.; Nie, B.; Song, D. FTIR and Raman spectroscopy characterization of functional groups in various rank coals. Fuel 2017, 206, 555–563. [Google Scholar] [CrossRef]
  11. Xu, J.; Tang, H.; Su, S.; Liu, J.; Xu, K.; Qian, K.; Wang, Y.; Zhou, Y.; Hu, S.; Zhang, A.; et al. A study of the relationships between coal structures and combustion characteristics: The insights from micro-Raman spectroscopy based on 32 kinds of Chinese coals. Appl. Energy 2018, 212, 46–56. [Google Scholar] [CrossRef]
  12. Kasiński, J.; Piwocki, M.; Sadowska, E.; Ziembińska-Tworzydło, M. Lignite of the Polish Lowlands Miocene: Characteristics on a base of selected profiles. Biul. Państw. Inst. Geol. 2010, 439, 99–154. [Google Scholar]
  13. Czarnecki, L.; Frankowski, R.; Ślusarczyk, G. Syntetyczny profil litostratygraficzny rejonu złoża Bełchatów dla potrzeb Bazy Danych Geologicznych. Gór. Odkryw. 1992, 3, 12–22. [Google Scholar]
  14. Wagner, M. Zmienność Petrologiczno-Sedymentologiczna i Własności Technologiczne Kredy Jeziornej w Osadach Neogenu Typu Wapiennego Zapadliska Tektonicznego na Przykładzie Zloża Węgla Brunatnego “Szczerców” (Petrological and Sedimentological Variability and Tech; AGH Uczelniane Wydawn. Naukowo-Dydaktyczne: Kraków, Poland, 2007; ISBN 9788374641289. [Google Scholar]
  15. Wagner, M.; Matl, K. Stratygrafia Kredy Jeziornej ze Złoża Węgla Brunatnego “Szczerców”. (Stratigraphy of Lacustrine Chalk from the “Szczerców” Lignite Deposit); Wydawnictwa AGH: Kraków, Poland, 2007; Volume 33. [Google Scholar]
  16. Piwocki, M.; Ziembińska-Tworzydło, M. Neogene of the polish lowlands—Lithostratigraphy and pollen-spore zones. Kwart. Geol. 1997, 41, 21–40. [Google Scholar]
  17. Widera, M. An overview of lithotype associations of Miocene lignite seams exploited in Poland. Geologos 2016, 22, 213–225. [Google Scholar] [CrossRef] [Green Version]
  18. Słomka, T.; Wagner, M. Charakter Petrograficzny I Warunki Sedymentacji Wybranych Kompleksów Litologicznych Z Profilu Miocenu W złożu węGla Brunatnego Bełchatów (Petrological Studies and Sedimentological Conditions of Select Lithologic Series in Miocene from Bełcható W Lign. Prace Geol. PAN 2000, 147. Available online: https://integro.ciniba.edu.pl/integro/191800753249/ksiazka/charakter-petrograficzny-i-warunki-sedymentacji-wybranych-kompleksow-litologicznych-z-profilu-miocenu?autor=ksika&ln=gb&_lang=en (accessed on 24 December 2020).
  19. Kasiński, J.R.; Piwocki, M. Low-rank coals in Poland: Prospection—Mining—Progress. Pol. Geol. Inst. Spec. Pap. 2002, 7, 17–30. [Google Scholar]
  20. ISO 7404-2. Methods for the Petrographic Analysis of Coals—Part 2: Methods of Preparing Coal Samples; ISO: Geneva, Switzerland, 2009. [Google Scholar]
  21. ISO 7404-5. Methods for the Petrographic Analysis of Coals—Part 5: Method of Determining Microscopically the Reflectance of Vitrinite; ISO: Geneva, Switzerland, 2009. [Google Scholar]
  22. ICCP. The new inertinite classification (ICCP System 1994). Fuel 2001, 80, 459–471. [Google Scholar] [CrossRef]
  23. Pickel, W.; Kus, J.; Flores, D.; Kalaitzidis, S.; Christanis, K.; Cardott, B.J.; Misz-Kennan, M.; Rodrigues, S.; Hentschel, A.; Hamor-Vido, M.; et al. Classification of liptinite—ICCP System 1994. Int. J. Coal Geol. 2017, 169, 40–61. [Google Scholar] [CrossRef] [Green Version]
  24. Sýkorová, I.; Pickel, W.; Christanis, K.; Wolf, M.; Taylor, G.H.; Flores, D. Classification of huminite—ICCP System 1994. Int. J. Coal Geol. 2005, 62, 85–106. [Google Scholar] [CrossRef]
  25. ISO 7404-3. Methods for the Petrographic Analysis of Coals—Part 3: Method of Determining Maceral Group Composition; ISO: Geneva, Switzerland, 2009. [Google Scholar]
  26. ISO 579. Coke—Determination of Total Moisture; ISO: Geneva, Switzerland, 2013. [Google Scholar]
  27. ISO 1171. Solid Mineral Fuels—Determination of Ash; ISO: Geneva, Switzerland, 2010. [Google Scholar]
  28. ISO 562. Hard Coal and Coke—Determination of Volatile Matter; ISO: Geneva, Switzerland, 2010. [Google Scholar]
  29. ISO 351. Solid Mineral Fuels—Determination of Total Sulfur—High Temperature Combustion Method; ISO: Geneva, Switzerland, 1996. [Google Scholar]
  30. ISO 1928. Solid Mineral Fuels—Determination of Gross Calorific Value by the Bomb Calorimetric Method and Calculation of Net Calorific Value; ISO: Geneva, Switzerland, 2009. [Google Scholar]
  31. ISO 609. Solid Mineral Fuels—Determination of Carbon and Hydrogen—High Temperature Combustion Method; ISO: Geneva, Switzerland, 1996. [Google Scholar]
  32. Henry, D.G.; Jarvis, I.; Gillmore, G.; Stephenson, M. Raman spectroscopy as a tool to determine the thermal maturity of organic matter: Application to sedimentary, metamorphic and structural geology. Earth Sci. Rev. 2019, 198, 102936. [Google Scholar] [CrossRef]
  33. ISO 11760. Classification of Coals; ISO: Geneva, Switzerland, 2005. [Google Scholar]
  34. UN ECE. International Classification of in-Seam Coals; UN ECE: Geneva, Switzerland, 1998. [Google Scholar]
  35. Tuinstra, F.; Koenig, J.L. Raman Spectrum of Graphite. J. Chem. Phys. 1970, 53, 1126–1130. [Google Scholar] [CrossRef] [Green Version]
  36. Nemanich, R.J.; Solin, S.A. First- and second-order Raman scattering from finite-size crystals of graphite. Phys. Rev. B 1979, 20, 392–401. [Google Scholar] [CrossRef]
  37. Cuesta, A.; Dhamelincourt, P.; Laureyns, J.; Martínez-Alonso, A.; Tascón, J.M.D. Raman microprobe studies on carbon materials. Carbon 1994, 32, 1523–1532. [Google Scholar] [CrossRef]
  38. Green, P.D.; Johnson, C.A.; Thomas, K.M. Applications of laser Raman microprobe spectroscopy to the characterization of coals and cokes. Fuel 1983, 62, 1013–1023. [Google Scholar] [CrossRef]
  39. Beyssac, O.; Goffé, B.; Petitet, J.P.; Froigneux, E.; Moreau, M.; Rouzaud, J.N. On the characterization of disordered and heterogeneous carbonaceous materials by Raman spectroscopy. In Spectrochimica Acta—Part A: Molecular and Biomolecular Spectroscopy; Elsevier: Amsterdam, The Netherlands, 2003; Volume 59, pp. 2267–2276. [Google Scholar]
  40. Rouzaud, J.N.; Oberlin, A.; Beny-Bassez, C. Carbon films: Structure and microtexture (optical and electron microscopy, Raman spectroscopy). Thin Solid Film. 1983, 105, 75–96. [Google Scholar] [CrossRef]
  41. Beny-Bassez, C.; Rouzaud, J.N. Characterization of carbonaceous materials by correlated electron and optical microscopy and Raman microspectrometry. Scanning Electron Microsc. 1985, 1, 119–132. [Google Scholar]
  42. Jawhari, T.; Roid, A.; Casado, J. Raman spectroscopic characterization of some commercially available carbon black materials. Carbon 1995, 33, 1561–1565. [Google Scholar] [CrossRef]
  43. Sadezky, A.; Muckenhuber, H.; Grothe, H.; Niessner, R.; Pöschl, U. Raman microspectroscopy of soot and related carbonaceous materials: Spectral analysis and structural information. Carbon 2005, 43, 1731–1742. [Google Scholar] [CrossRef]
  44. Ferralis, N.; Matys, E.D.; Knoll, A.H.; Hallmann, C.; Summons, R.E. Rapid, direct and non-destructive assessment of fossil organic matter via microRaman spectroscopy. Carbon 2016, 108, 440–449. [Google Scholar] [CrossRef] [Green Version]
  45. Schwan, J.; Ulrich, S.; Batori, V.; Ehrhardt, H.; Silva, S.R.P. Raman spectroscopy on amorphous carbon films. J. Appl. Phys. 1996, 80, 440–447. [Google Scholar] [CrossRef] [Green Version]
  46. Chabalala, V.P.; Wagner, N.; Potgieter-Vermaak, S. Investigation into the evolution of char structure using Raman spectroscopy in conjunction with coal petrography; Part 1. Fuel Process. Technol. 2011, 92, 750–756. [Google Scholar] [CrossRef]
  47. Morga, R. Reactivity of semifusinite and fusinite in the view of micro-Raman spectroscopy examination. Int. J. Coal Geol. 2011. [Google Scholar] [CrossRef]
  48. Morga, R.; Jelonek, I.; Kruszewska, K. Relationship between coking coal quality and its micro-Raman spectral characteristics. Int. J. Coal Geol. 2014, 134–135, 17–23. [Google Scholar] [CrossRef]
  49. Ulyanova, E.V.V.; Molchanov, A.N.N.; Prokhorov, I.Y.Y.; Grinyov, V.G.G. Fine structure of Raman spectra in coals of different rank. Int. J. Coal Geol. 2014, 121, 37–43. [Google Scholar] [CrossRef]
  50. Morga, R. Changes of Semifusinite and Fusinite Microstructure during Carbonization Inferred from the Raman Spectroscopy Examination (Monograph. In Polish, English Abstract); Silesian University of Technology Publishing House: Gliwice, Poland, 2013. [Google Scholar]
  51. Gaines, A.F.; Özyildiz, G.; Wolf, M. Infrared spectra of humodetrinite from the Fortuna-Garsdorf mine. Fuel 1981, 60, 615–618. [Google Scholar] [CrossRef]
  52. Russell, N.J. Gelification of Victorian tertiary soft brown coal wood. I. Relationship between chemical composition and microscopic appearance and variation in the degree of gelification. Int. J. Coal Geol. 1984, 4, 99–118. [Google Scholar] [CrossRef]
  53. Drobniak, A.; Mastalerz, M. Chemical evolution of Miocene wood: Example from the Belchatow brown coal deposit, central Poland. Int. J. Coal Geol. 2006, 66, 157–178. [Google Scholar] [CrossRef]
  54. Mastalerz, M.; Hower, J.C.; Taulbee, D.N. Variations in chemistry of macerals as refl ected by micro-scale analysis of a Spanish coal. Geol. Acta 2013, 11, 483–493. [Google Scholar] [CrossRef]
  55. Kelemen, S.R.; Fang, H.L. Maturity trends in Raman spectra from kerogen and coal. Energy Fuels 2001, 15, 653–658. [Google Scholar] [CrossRef]
  56. Liu, D.H.; Xiao, X.M.; Tian, H.; Min, Y.S.; Zhou, Q.; Cheng, P.; Shen, J.G. Sample maturation calculated using Raman spectroscopic parameters for solid organics: Methodology and geological applications. Chin. Sci. Bull. 2013, 58, 1285–1298. [Google Scholar] [CrossRef] [Green Version]
  57. Sauerer, B.; Craddock, P.R.; AlJohani, M.D.; Alsamadony, K.L.; Abdallah, W. Fast and accurate shale maturity determination by Raman spectroscopy measurement with minimal sample preparation. Int. J. Coal Geol. 2017, 173, 150–157. [Google Scholar] [CrossRef]
  58. Luo, Q.; Fariborz, G.; Zhong, N.; Wang, Y.; Qiu, N.; Skovsted, C.B.; Suchý, V.; Hemmingsen Schovsbo, N.; Morga, R.; Xu, Y.; et al. Graptolites as fossil geo-thermometers and source material of hydrocarbons: An overview of four decades of progress. Earth Sci. Rev. 2020, 200, 103000. [Google Scholar] [CrossRef]
  59. Lupoi, J.S.; Fritz, L.P.; Parris, T.M.; Hackley, P.C.; Solotky, L.; Eble, C.F.; Schlaegle, S. Assessment of thermal maturity trends in devonian–mississippian source rocks using raman spectroscopy: Limitations of peak-fitting method. Front. Energy Res. 2017, 5, 27. [Google Scholar] [CrossRef] [Green Version]
  60. Kalaitzidis, S.; Georgakopoulos, A.; Christanis, K.; Iordanidis, A. Early coalification features as approached by solid state 13C CP/MAS NMR spectroscopy. Geochim. Cosmochim. Acta 2006, 70, 947–959. [Google Scholar] [CrossRef]
  61. Quirico, E.; Rouzaud, J.N.; Bonal, L.; Montagnac, G. Maturation grade of coals as revealed by Raman spectroscopy: Progress and problems. In Spectrochimica Acta—Part A: Molecular and Biomolecular Spectroscopy; Elsevier: Amsterdam, The Netherlands, 2005. [Google Scholar]
  62. Hinrichs, R.; Brown, M.T.; Vasconcellos, M.A.Z.Z.; Abrashev, M.V.; Kalkreuth, W. Simple procedure for an estimation of the coal rank using micro-Raman spectroscopy. Int. J. Coal Geol. 2014, 136, 52–58. [Google Scholar] [CrossRef]
  63. Ferrari, A.; Robertson, J. Interpretation of Raman spectra of disordered and amorphous carbon. Phys. Rev. B Condens. Matter Mater. Phys. 2000, 61, 14095–14107. [Google Scholar] [CrossRef] [Green Version]
Figure 1. Location of Szczerców deposits (a), tectonic map of the deposit (b), and geological cross-sections (c) according to Czarnecki et al. [13] and Kasiński et al. [19]; modified.
Energies 14 00281 g001
Figure 2. Representative micro-Raman spectra of the investigated macerals.
Energies 14 00281 g002
Figure 3. Curve-fitting of a representative attrinite spectrum.
Energies 14 00281 g003
Figure 4. Comparison of Raman spectral parameters obtained for attrinite and densinite: D1 band position (a), the D4 band position (b), the D6 band FWHM (c), the D4 band FWHM (d) the AD3+D6/AALL ratio (e) and AD4/AALL ratio (f). Explanation: pos.—position; A—attrinite; D—densinite.
Energies 14 00281 g004
Figure 5. Comparison of Raman spectral parameters obtained for attrinite and ulminite: G band position (a), the D1 band position (b), the D1 band FWHM (c), the AD3+D6/AALL ratio (d), AD4/AALL ratio (e) and the AD5/AALL ratio (f). Explanation: pos.—position; A—attrinite; U—ulminite.
Energies 14 00281 g005
Figure 6. Comparison of Raman spectral parameters obtained for attrinite and fusinite: G band position (a), the D1 band position (b), the G band FWHM (c), the D1 band FWHM (d), the AD3+D6/AALL ratio (e), and the AD5/AALL ratio (f). Explanation: pos.—position; A—attrinite; F—fusinite.
Energies 14 00281 g006
Table 1. Petrographic composition of lignite from the Szczerców deposit.
ComponentContent (%)
MaceralsHuminiteTextinite11.7
Ulminite12.1
Attrinite29.9
Densinite23.9
Corpohuminite1.6
Gelinite1.5
LiptiniteSporinite0.6
Cutinite0.1
Resinite1.1
Suberinite0.2
Alginite0.1
Liptodetrinite3.6
InertiniteFusinite1
Semifusinite0.2
Funginite0.1
Micrinite0.0
Inertodetrinite1.8
Minerals Pyrite0.8
Carbonates0.5
Quartz + Clays9.2
Table 2. Random reflectance of selected macerals in lignite from the Szczerców deposit.
Maceral Random ReflectanceStandard Deviation
(%](%]
Textinite0.200.034
Ulminite0.270.056
Attrinite0.260.039
Densinite0.310.060
Fusinite0.950.067
Table 3. Proximate and ultimate analysis of lignite from the Szczerców deposit.
Proximate Analysis
Total moisture, as received basis, Mt ar(%)51.3
Total moisture, moisture, ash free basis of Mt maf(%)43.8
Ash, dry basis A db(%)18.6
Total sulphur, dry basis, St db(%)3.89
Gross calorific value, moisture, ash free basis GCV mafKJ/kg13.9
Gross calorific value, dry, ash free basis GCV dafKJ/kg24.70
Volatile matter, dry, ash free basis V daf(%)49.37
Ultimate analysis of lignite
Carbon content, dry, ash free basis C daf(%)67.39
Hydrogen content, dry, ash free basis H daf(%)5.18
Nitrogen content, dry, ash free basis N daf(%)0.89
Oxygen content, dry, ash free basis O daf(%)21.47
db—dry basis; maf- moisture, ash free basi; as- as received basis; daf- dry, ash free basis.
Table 4. Band positions and full width at half maximum (FWHM) in the spectra of the studied macerals.
MaceralD2
pos.
cm−1
D2
FWHM
cm−1
G
pos.
cm−1
G
FWHM
cm−1
D3
pos.
cm−1
D3
FWHM
cm−1
D6
pos.
cm−1
D6
FWHM
cm−1
D1
pos.
cm−1
D1
FWHM
cm−1
D5
pos.
cm−1
D5
FWHM
cm−1
D4
pos.
cm−1
D4
FWHM
cm−1
D7
pos.
cm−1
D7
FWHM
cm−1
Attrinite1613.376.31578.778.71541.193.31471.5127.01375.9138.01287.7137.51191.9105.61101.774.7
n = 282.35.02.64.64.210.66.613.82.914.14.818.24.215.96.325.00
Densinite1614.674.01579.777.81541.695.81468.1139.71374.1140.71289.9138.01197.1126.91098.8105.0
n = 302.44.32.94.03.910.58.513.53.216.35.020.57.337.98.377.3
Ulminite1616.873.61581.579.71539.2103.31461.4142.11368.5146.81289.4131.91199.0134.61094.687.1
n = 283.05.22.74.53.16.97.0014.44.217.35.817.17.634.511.137.8
Fusinite1612.052.91583.772.81538.4123.81458.4132.81366.6151.41278.5153.61189.2124.51088.4108.0
n = 272.26.52.74.85.715.410.926.75.310.68.723.89.331.88.829.5
Explanation: n—number of measurements; the standard deviation of the measurements is given in italics.
Table 5. Spectral ratios and Raman Band Separation (RBS) derived from the curve fitting procedure.
MaceralID1/IGAD3+D6/AALLAD5/AALLAD4/AALLRBS
cm1
Attrinite1.050.210.180.05202.8
n = 280.080.030.040.014.2
Densinite1.040.230.160.06205.6
n = 300.140.030.040.024.1
Ulminite0.950.270.140.07212.9
n = 280.120.040.040.035.4
Fusinite1.090.150.150.05217.0
n = 270.160.030.040.026.6
Explanation: n—number of measurements; the standard deviation of the measurements is given in italics.
Publisher’s Note: MDPI stays neutral with regard to jurisdictional claims in published maps and institutional affiliations.

