Article

An Integrated Comparative Assessment of Coal-Based Carbon Capture and Storage (CCS) Vis-à-Vis Renewable Energies in India’s Low Carbon Electricity Transition Scenarios

1
Wuppertal Institute for Climate, Environment and Energy, Döppersberg 19, 42103 Wuppertal, Germany
2
Center for Sustainability, Policy & Technology Management (SusPoT), 387, 14th B Cross, Yelahanka New Town, Bengaluru 560064, India
*
Authors to whom correspondence should be addressed.
Energies 2021, 14(2), 262; https://doi.org/10.3390/en14020262
Submission received: 22 November 2020 / Revised: 18 December 2020 / Accepted: 30 December 2020 / Published: 6 January 2021
(This article belongs to the Section A: Sustainable Energy)

Abstract

:
Roadmaps for India’s energy future foresee that coal power will continue to play a considerable role until the middle of the 21st century. Among other options, carbon capture and storage (CCS) is being considered as a potential technology for decarbonising the power sector. Consequently, it is important to quantify the relative benefits and trade-offs of coal-CCS in comparison to its competing renewable power sources from multiple sustainability perspectives. In this paper, we assess coal-CCS pathways in India up to 2050 and compare coal-CCS with conventional coal, solar PV and wind power sources through an integrated assessment approach coupled with a nexus perspective (energy-cost-climate-water nexus). Our levelized costs assessment reveals that coal-CCS is expensive and significant cost reductions would be needed for CCS to compete in the Indian power market. In addition, although carbon pricing could make coal-CCS competitive in relation to conventional coal power plants, it cannot influence the lack of competitiveness of coal-CCS with respect to renewables. From a climate perspective, CCS can significantly reduce the life cycle GHG emissions of conventional coal power plants, but renewables are better positioned than coal-CCS if the goal is ambitious climate change mitigation. Our water footprint assessment reveals that coal-CCS consumes an enormous volume of water resources in comparison to conventional coal and, in particular, to renewables. To conclude, our findings highlight that coal-CCS not only suffers from typical new technology development related challenges—such as a lack of technical potential assessments and necessary support infrastructure, and high costs—but also from severe resource constraints (especially water) in an era of global warming and the competition from outperforming renewable power sources. Our study, therefore, adds a considerable level of techno-economic and environmental nexus specificity to the current debate about coal-based large-scale CCS and the low carbon energy transition in emerging and developing economies in the Global South.

1. Introduction

The rise in global coal demand since the turn of the century has been driven predominantly by Asia, particularly China and India [1]. The demand for electricity in emerging and developing Asian countries is steadily increasing and coal remains by far the principal source of electricity generation in Asia. It is projected that the major share of international coal demand in future years will come from India and by the mid-2020s the country could become the world’s biggest coal importer, overtaking China [1]. India’s power generation capacity is expected to quadruple by 2040 to keep up with the steadily rising demand, which is growing at a rate of almost 5% per annum [2]. At present, more than 72% of India’s electricity generation comes from coal power, with a cumulative installed capacity of almost 200 GW [3]. Largely as a consequence of economic development driven by fossil fuel use—with coal-based energy sources at its core—India’s share of global annual greenhouse gas emissions (GHGs) is rising steadily; India currently ranks third after China and the USA for annual GHG emissions [4,5] (Nevertheless, it should be noted that India has GHG emissions of around 2.4 tCO2-eq/capita, which is far below the world average (6.8 tCO2-eq/capita) [4,5]). Based on the current economic growth trajectories, it is anticipated that India’s GHG emissions will continue to rise substantially until 2050 [6]. Given the developing status of its economy, India does, however, have the option to consciously choose developmental pathways that can lead to self-sufficiency and sustainable growth with minimal impact on the climate and the environment. The Indian government has already introduced a series of initiatives and national taskforces to tackle climate change and decouple economic growth from GHG emissions [7]. For instance, at the 2015 UN climate change conference (COP21) India pledged to reduce its GDP emission intensity by 33 to 35% by 2030 (in comparison to 2005 levels) [8,9]. Although one major pillar of the climate change mitigation strategy is to meet the country’s power demand via non-fossil fuel sources—especially solar and wind renewable energy sources—more radical interventions may be needed for deep decarbonisation of the power sector [10,11].
Among other options, carbon capture and storage (CCS) is being considered as a potential technology to decarbonise the Indian coal fleet and hence the power sector at large. Some researchers have even argued that it will not be possible to meet the 2 °C target without the effective implementation of carbon control technologies such as CCS [12,13,14], especially in the Indian context where coal is expected to retain a substantial share in the country’s future energy mix [11,15,16,17,18,19,20]. It should be emphasised that India’s coal power plants account for a considerable share of overall GHG emissions not only in India, but also globally. For instance, in 2016 India’s coal power fleet produced nearly the same amount of GHG emissions as the whole of Brazil—and Brazil is ranked 6th highest globally in terms of annual GHG emissions [5]. Even if we only consider the GHG emissions from coal power plants that are already operating, are under-construction or have been granted planning permission in India, their cumulative emissions could be as high as 54 Gt within the time period 2016–2065 [21]. Hence, given India’s central position in the current and future global coal market, the future development of coal-CCS in India could have a significant influence on the international large-scale CCS market. This is particularly relevant for the heavily coal-dependent emerging and developing economies in the Global South that share similar sustainability challenges with respect to the deployment of low carbon energy technologies, such as the need for low-cost electricity generation and ambitious but climate-friendly economic development with scarce water resources.
Only a limited number of studies have explored the prospects for the future adoption of coal-based CCS in India. Vishwanathan et al. [15] analysed alternative energy futures for India based on a bottom-up model and identified that renewable energies, lifestyle changes and CCS will all play a critical role in India’s efforts towards limiting global warming to 2 °C or lower, especially under stringent climate mitigation regimes. Kumar et al. [22] and Sharma [23] conducted literature reviews and assessed the potential scope of CCS in India’s coal-dominated future scenarios from multiple perspectives. Viebahn et al. [24] carried out an integrated assessment of coal-CCS from techno-economic, ecological and stakeholder perspectives, and explored the potential role of CCS in the future Indian power sector. Garg et al. [17] performed source-sink mapping between existing energy-intensive sources, including coal power plants, and potential geological CO2 storage sites to develop a cost-effective CCS grid plan for India. Singh et al. [25] analysed the economic implications and Sharma and Mahapatra [26] investigated the water use implications of CCS on coal power plants in India.
Although many future roadmaps foresee coal power playing a significant role in the Indian power sector up to 2040/2050 [1,2,11,15,16,17,27,28], the proponents of renewable energies have called for strategies focused on a complete coal exit [29,30] or for coal phase-out strategies that include very high shares of renewables in the future power system [1,31,32,33]. This is primarily because of the phenomenal rates of technological learning of renewable energies and the corresponding cost reductions in recent years. Consequently, the time is right for a consistent comparative levelized costs assessment of coal-CCS vis-à-vis renewables in India’s future power system and under India’s market conditions. Ram et al. [34] compared the electricity generation costs of renewables and conventional power sources, including coal-CCS, in G20 countries. However, their study had broader scope and, therefore, did not focus on the detailed comparative cost assessment of coal-CCS and renewables in the Indian context. Their study also limited its assessment of the levelized costs to the time period from 2015 to 2030. Further, none of the existing studies have systematically compared coal-CCS with its competing renewable power sources in the Indian context from multiple sustainability perspectives.
In addition to global warming, India is simultaneously facing other prominent environmental and resource issues. These include water scarcity [35], air and water pollution [36,37], and land and ecosystem degradation [38,39]. Therefore, an integrated approach to concurrently assess and combat multiple sustainability challenges is required [38,40]. This is particularly relevant in relation to the promotion and deployment of low carbon technologies. Various sustainability approaches have been suggested in the literature to capture the multi-dimensional aspects and challenges of low carbon technology development pathways [40,41,42,43,44,45,46,47]. For instance, Viebahn et al. [24,48,49,50] proposed an integrated assessment methodology to capture the techno-economic and climate mitigation aspects of coal-CCS development pathways in Germany, China, India and South Africa. The “nexus” approach has been developed in recent years to investigate the inter-linkages between the energy technologies and their use of natural resources; for example, an energy-water nexus [51,52,53], energy-climate-water nexus [54,55], energy-food-water nexus [56,57] and energy-land-water nexus [58,59]. However, the nexus perspective has been very limited in its application in the context of coal-CCS [45]. Although there has been significant interest in large-scale CCS at international level in recent years [60], the majority of policy-oriented studies mainly deal with the prospects of CCS in different countries from techno-economic and carbon emissions perspectives [24,49,50,61,62,63]. Few researchers have conducted a comparative technology assessment of coal-CCS and renewables from a single or dual indicator perspective; e.g., costs [34,48], GHG emissions [48,64] and water footprint [65,66]. To our knowledge, there are no studies that compare coal-CCS with renewables from an energy-cost-climate-water nexus perspective within a single framework. Consequently, it may not be methodologically veracious to draw insights from different studies with diverse boundary conditions to comprehensively capture the multi-dimensional aspects of energy technologies, particularly across the different sustainability dimensions of cost, climate and water [67].
Therefore, the objective of this paper is to harmonize the literature data and quantify the relative benefits and trade-offs of coal-CCS vis-à-vis already successful renewables (i.e., solar PV and wind) from multiple sustainability perspectives within a single methodological framework. This paper makes three principal contributions: (1) the integrated assessment methodology introduced by [24,48] is further developed through incorporating an energy-cost-climate-water “nexus” approach; (2) coal-based CCS is systematically compared with conventional coal and renewable power sources (solar PV and wind) through an integrated assessment approach (coupled with a nexus perspective) in the context of heavily coal-dependent emerging economies in the Global South—taking India as a case study; and (3) coal-CCS pathways are assessed up to 2050 in India, and the literature is updated through a detailed, transparent, India-specific futuristic levelized costs assessment of coal-CCS and renewables up to 2050 using a learning curve approach. Our work thus adds a considerable level of techno-economic and environmental nexus specificity to the current debate on coal-based large-scale CCS and the low carbon energy transition in emerging and developing economies in the Global South. The results of our study can: (1) guide the international CCS and coal industry by identifying the key challenges and benefits of coal-based carbon capture and storage in India in future; and (2) assist India’s decision makers to promote low carbon energy technologies as a basis for India’s future energy system with a comprehensive understanding of their pros and cons from multiple sustainability perspectives.
The next section of the paper (Section 2) details our overall integrated assessment methodology with its individual assessment dimensions, together with the methods and materials used to investigate different dimensions. Section 3 presents the indicator-wise assessments and their outcomes, while the overall integrated comparative assessment results are presented and discussed in Section 4. Finally, Section 5 draws the overarching inferences and provides concluding remarks.

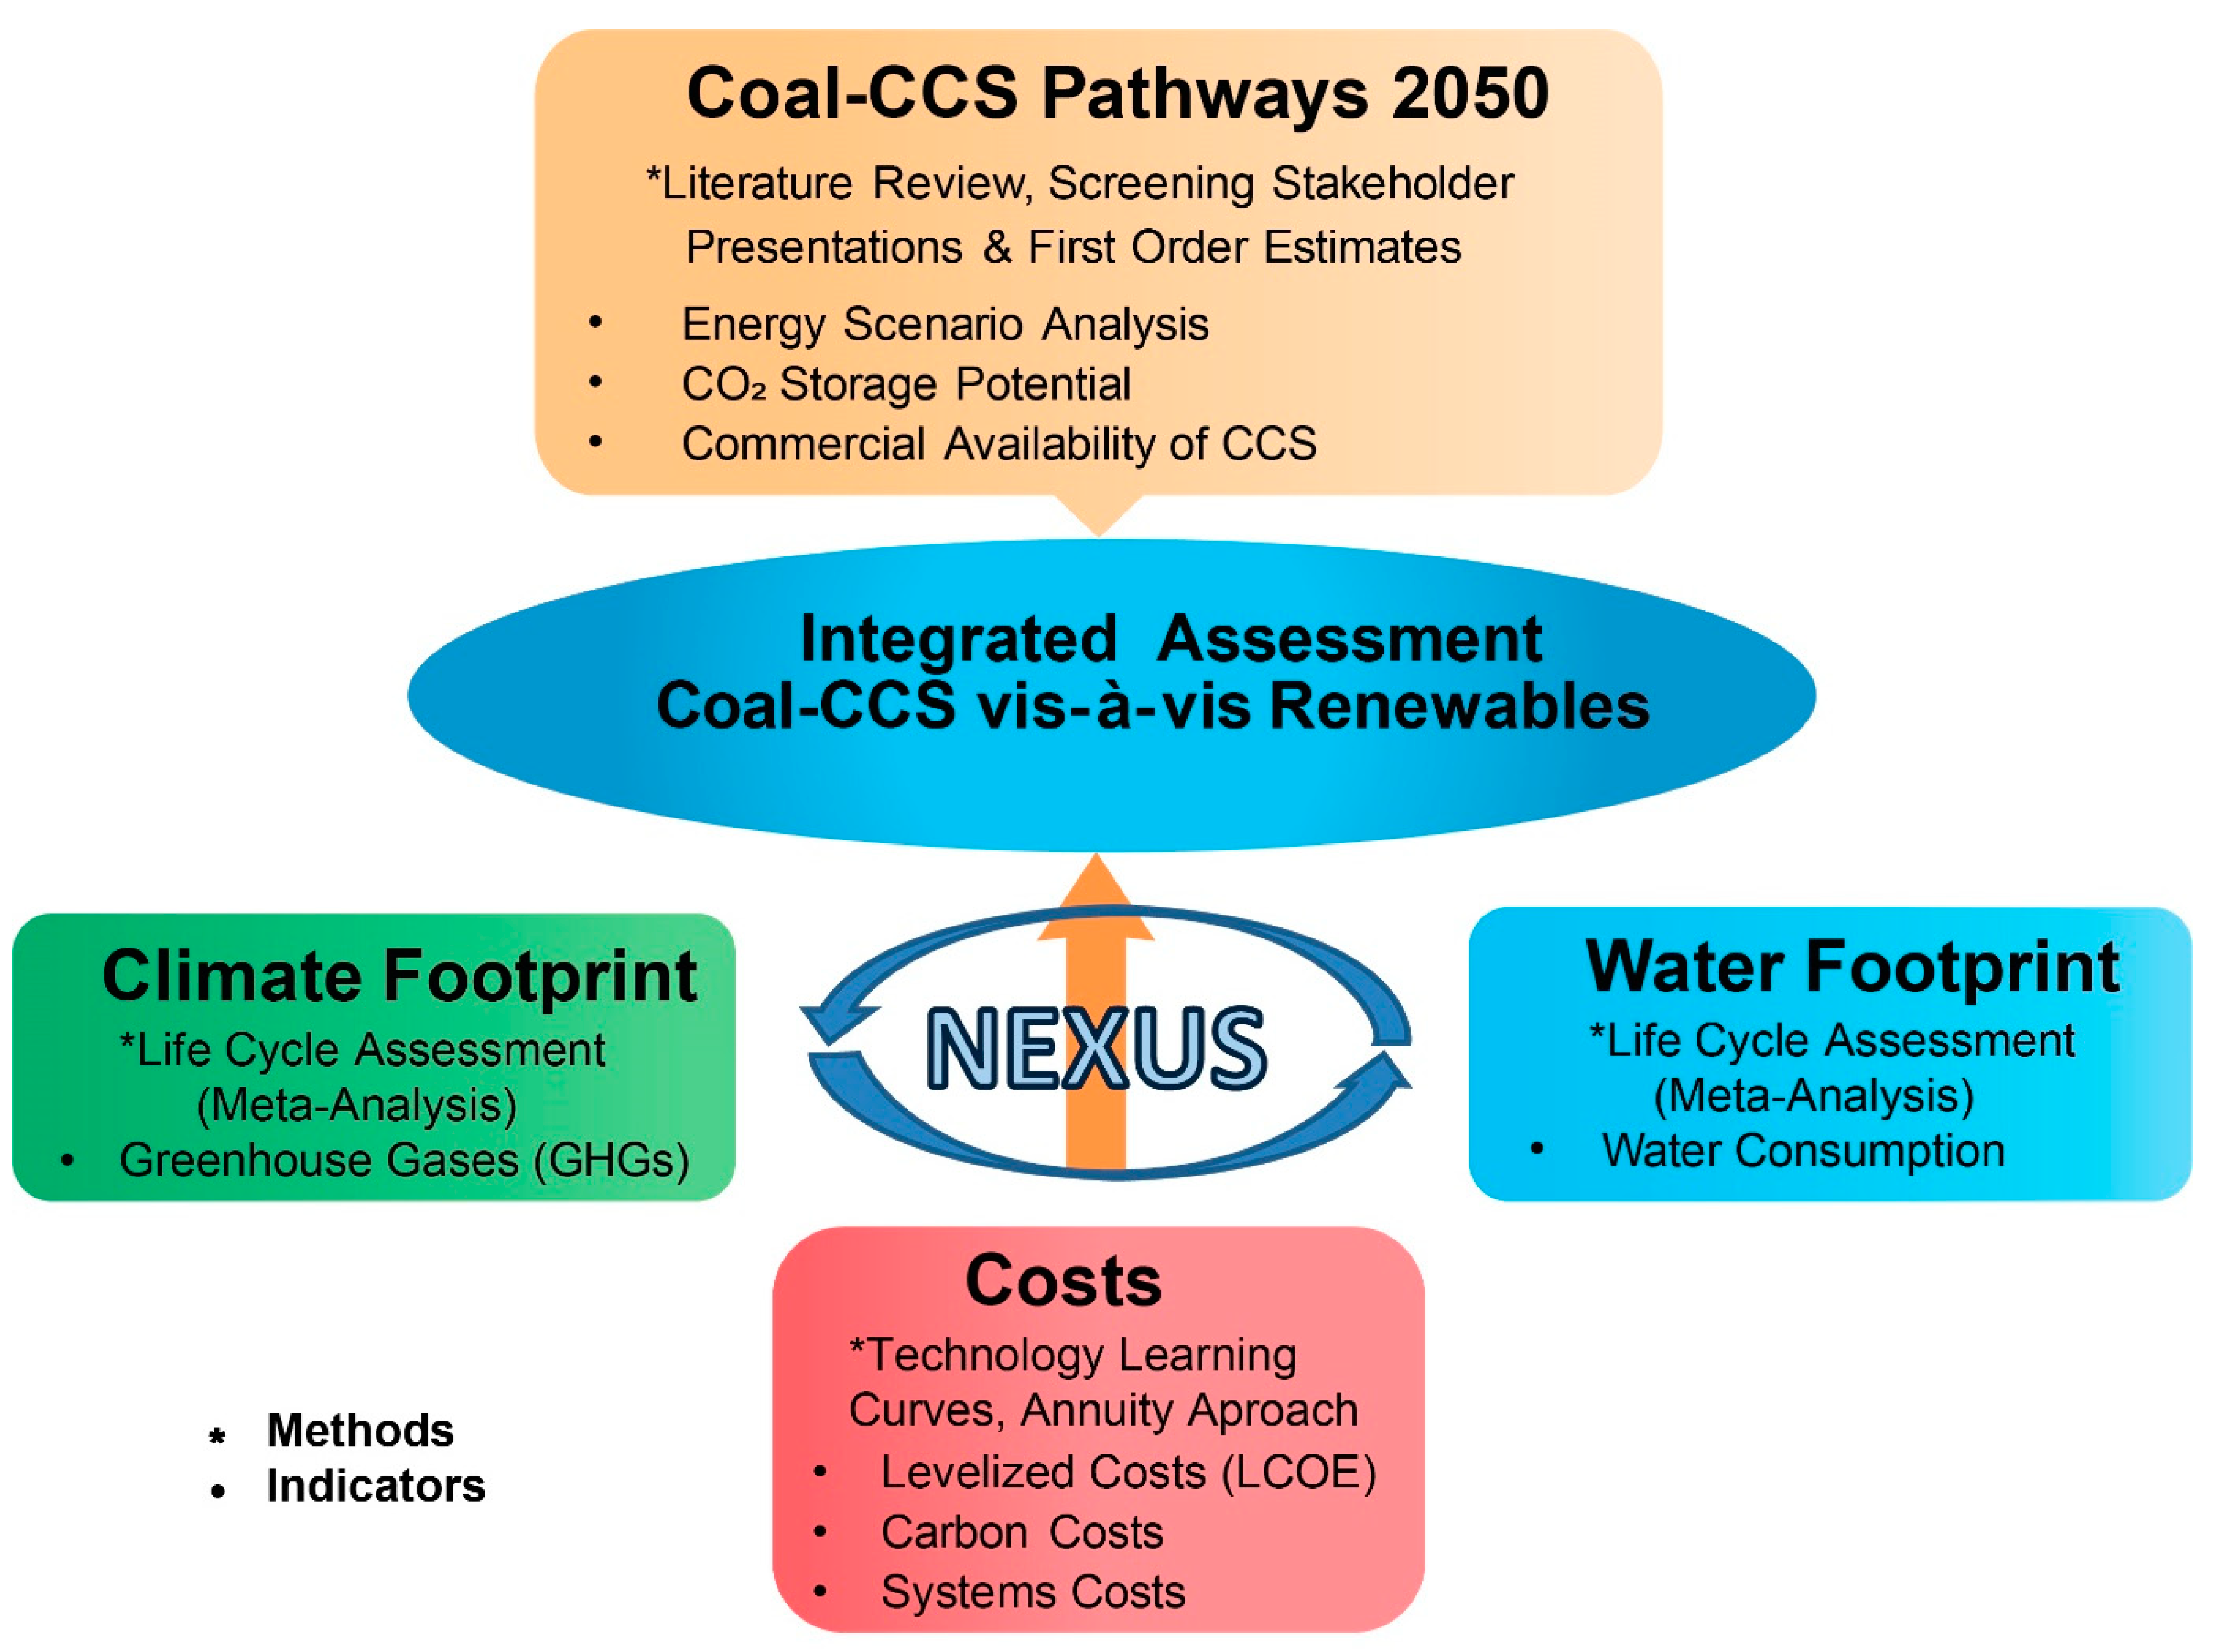
2. Materials and Methods

Figure 1 shows our integrated assessment methodology encompassing multiple energy sustainability assessment dimensions, including the methods and indicators used in this study. We first conducted an extensive literature review to summarise the future projections for coal-CCS capacity additions, estimations of the CO2 storage potential and the commercial availability of CCS in future in India. We then compared coal-CCS with solar PV and wind in three assessment dimensions—different cost indicators in the economic dimension, the global warming potential (greenhouse gases) in the environmental dimension, and life cycle water consumption in the ecological dimension—in order to obtain detailed indicator-specific insights into the performance of these power sources. Finally, we made an overall comparison between coal, coal-CCS, solar PV and wind power sources using an integrated assessment approach (Figure 1) and the nexus perspective (energy-cost-climate-water nexus). We used different methods to assess different dimensions. The methods and materials used to investigate the different dimensions are briefly described below.

2.1. Coal-CCS Pathways 2050

Firstly, to explore the possible role of coal-CCS in the future Indian power sector, we extensively evaluated available energy scenarios for India up to 2050—focusing on coal and coal-based CCS options—and came up with three end points as the likely range of the deployment status of coal-CCS capacity in India by 2050. Secondly, we reviewed and summarised the literature on the CO2 storage potential in India and then estimated the capacity demand for CO2 storage to sequester the carbon emissions from coal-CCS plants installed up to 2050. Finally, we studied the current international CCS landscape and the predictions for commercial availability of coal-CCS in India by screening the existing literature and stakeholder presentations. It should be noted that where data is presented in figures and explicit data tables were not available in the studies to which we referred, the required data points (rounded off) were extracted through the WebPlotDigitizer tool (version 4.2, Pacifica, CA, USA) [68].

2.2. Costs

The levelized costs of the electricity generation options (LCOE) are estimated via an annuity approach using the Equations (1) and (2) (adapted from [24,34]). For better comparison and adaptability with the existing literature, we provide our LCOE results in two steps: (1) Simple LCOE via Equation (1), representing the prevalent methodology used in the literature; (2) Advanced LCOE via Equation (2), wherein the carbon and systems costs are added to simple LCOE results. In addition, we used the learning curve approach to predict the development of the capital costs and, therefore, the levelized costs over time (up to 2050). The detailed data tables and assumptions used in estimating the LCOE results are provided in the Supplementary Materials (Tables S2.1–S2.4).
L C O E   ( $ M W h ) = ( C a p e x R e a l × c r f + O p e x F i x e d ) × 1000 F L H + O p e x V a r i a b l e + F u e l   C o s t s + { C C S   C o s t s }
a L C O E   ( $ M W h ) = L C O E + C a r b o n   C o s t s + S y s t e m s   C o s t s
where: CapexReal ($/kW) is the total capital expenditure representing the sum of overnight capital expenses (Capex-Overnight) and the cost overruns. Power plant construction and project financing can take significant time before the plant becomes operational and hence the total capital expenditure may differ from the originally budgeted overnight capital costs. Therefore, we include the additional investment overruns in our LCOE calculations as these costs can be significant, depending on the type of power plant and its construction time [34]. Furthermore, we use technology learning rates to predict the capital costs of different power plants in future decades.
crf (%/annum)—the capital recovery factor allocates the total capital expenditure incurred at the beginning of power plant operation to individual years across the depreciation period (N) considered for the power plants and is calculated from Equation (3); WACC (weighted average cost of capital) is the discount rate.
c r f = W A C C × ( 1 + W A C C ) N ( 1 + W A C C ) N 1
OpexFixed ($/kW-annum) are the fixed yearly operation and maintenance costs of power plants.
OpexVariable ($/MWh) are the variable costs that depend on the operational hours of power plants.
Fuel costs ($/MWh) are applicable only to coal-fired power plants and are estimated based on domestic and imported hard coal prices, net calorific values and the price escalation rate per annum.
FLH (hours/annum)—full load hours reflect the capacity utilisation of power plants per annum (Capacity Utilisation Factor (CUF) × 8760 h/annum).
CCS costs ($/MWh) are applicable only to coal-CCS power plants and include the costs of CO2 capture, storage and transportation. We assume that coal-CCS plants can capture 90% of their CO2 emissions, and the captured CO2 is transported across a distance of 350 to 500 km via pipeline to their storage sites. Note that the nominal capture rate (90%) is applied throughout this study; however, the net capture rate will be lower than the nominal rate due to the penalty associated with adding a CCS system to a coal power plant.
Carbon costs ($/MWh)—here we account for the social costs of carbon, indicating the climate damage associated with every additional tonne of carbon dioxide emitted into the atmosphere (see [69] for details). Note that these costs are independent of carbon market prices, their future fluctuations and carbon penalties introduced by governmental regulations.
Systems costs ($/MWh) are the additional costs incurred due to the integration of a particular type of power plant in the overall electricity system; here we account for the grid extension/reinforcement costs and balancing costs incurred to maintain and operate reserves to tackle short-term electricity fluctuations.

2.3. Climate Footprint

We account for the life cycle GHG emissions of power sources as an indicator to measure their climate footprints. We conducted extensive secondary research to estimate the India-specific life cycle GHG emissions for coal power generation and used international data for solar PV and wind power plants due to their global nature. This was followed by a meta-analysis to estimate the percentage decrease in the life cycle GHG emissions of conventional coal power plants when equipped with post-combustion CCS technologies. Based on this, we finally estimated the possible minimum/mean/maximum values of life cycle GHG emissions for future Indian coal-CCS power plants.

2.4. Water Footprint

Water is used throughout the life cycle of the power plants, from mining raw materials to fuel processing to power plant manufacturing, operations and disposal. We account for the life cycle water consumption of power plants—that is, the portion of water withdrawn from a source (ground/surface) and not returned to the “immediate water environment” [65]—as an indicator to measure their water footprints. We conducted extensive secondary research to estimate the India-specific life cycle water consumption values for the power sources; the whole life cycle chain of the power generation was divided into three stages: power plant life cycle (construction, component manufacturing and decommissioning), power plant operations, and fuel cycle (extraction, processing and transportation of coal fuel). In addition, for coal-CCS, a meta-analysis was carried out to estimate the percentage increase in operational water consumption with respect to conventional coal power plants. Finally, we customised the international data to reflect the Indian context wherever necessary and estimated minimum/mean/maximum values for the four power plant types.

3. Indicator-Wise Assessments and Results

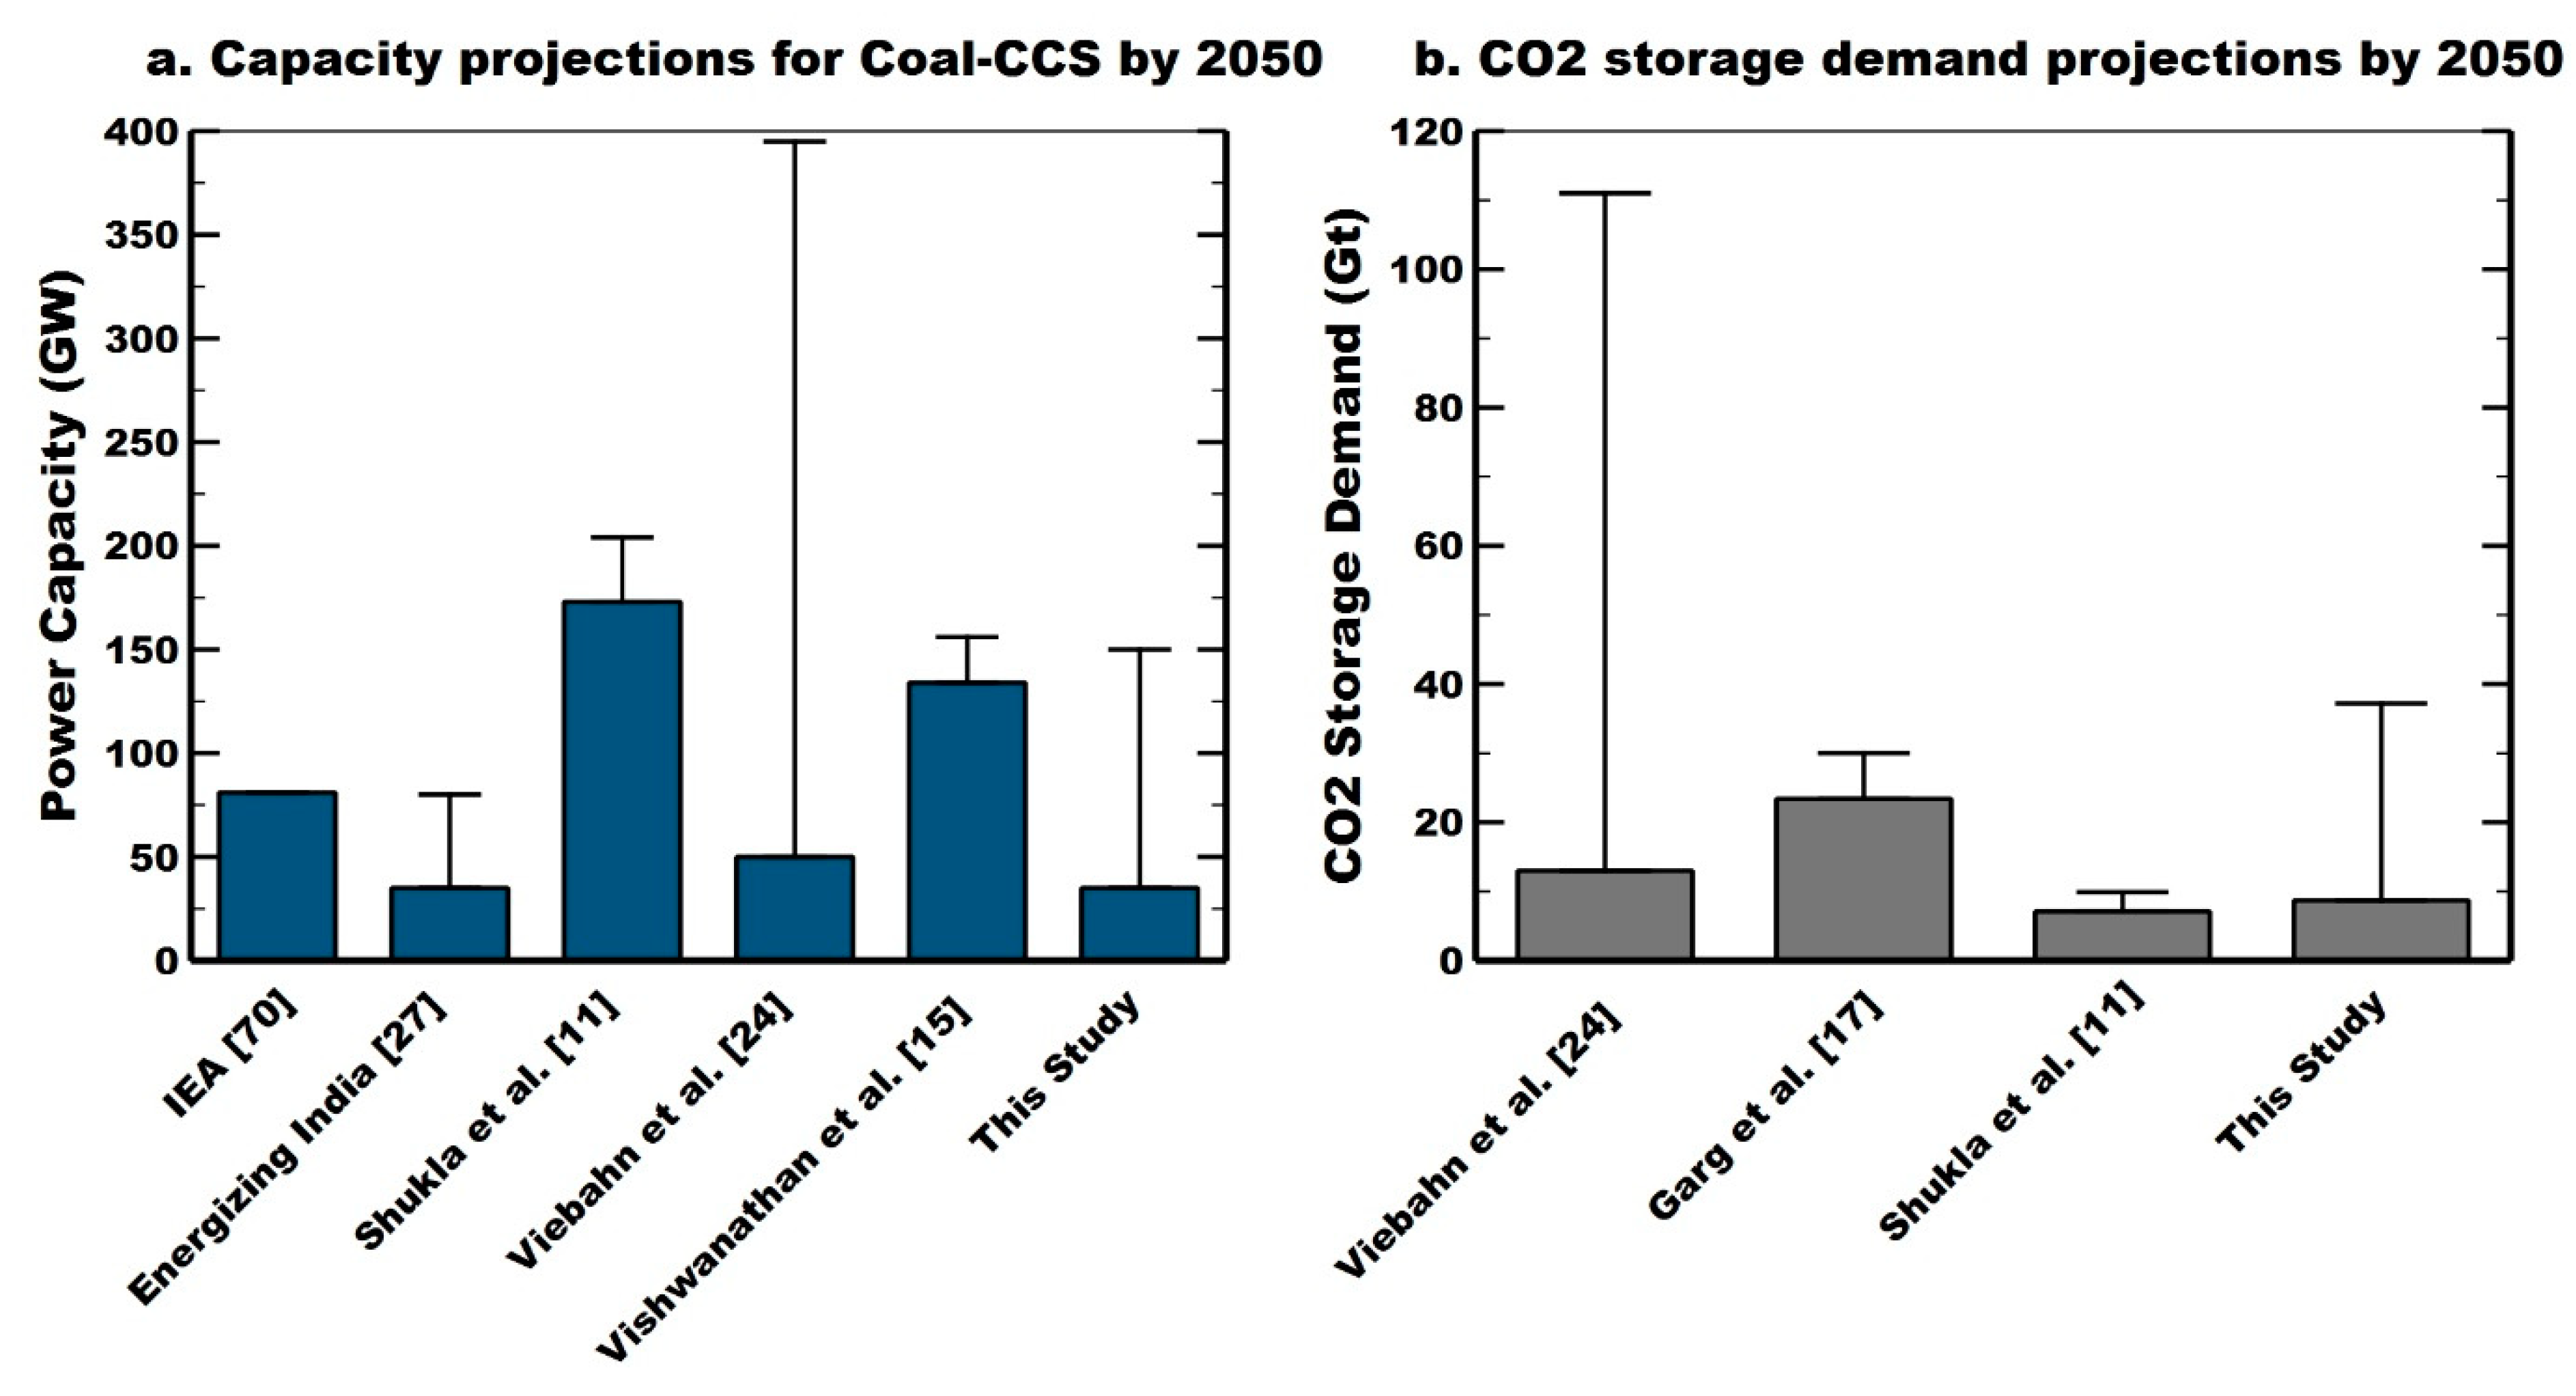
3.1. Coal-CCS Pathways 2050

3.1.1. Energy Scenario Analysis

We explored the long-term energy scenarios developed by various organisations and researchers to understand the possible future roles of coal and coal-CCS in India from a quantitative perspective. In its Energizing India report [27], the Indian government think-tank Niti Aayog emphasised the fact that coal will remain a mainstay in India’s primary energy mix until 2047, retaining a share of between 42% and 50%. The study projected that the installed capacities of coal-based power plants and carbon capture storage (CCS) plants could vary between 333 GW to 459 GW and from 35 GW to 80 GW respectively in business-as-usual and ambitious energy scenarios [27]. Similarly, in its India Energy Outlook [2], the International Energy Agency (IEA) predicted that India’s share in world coal consumption would rise to nearly 60% by 2040, and coal power generation could retain a share of between 54% and 57% in India’s electricity mix by 2040. However, in their 2019 World Energy Outlook [1] report, the IEA provides a huge range for the likely contribution of coal power by 2040—from 7% in the Sustainable Development Scenario to 58% in the Current Policies Scenario. It should be noted though that the IEA does not account for the development of CCS in India-specific scenarios in its Energy Outlook reports series and highlights that the use of CCS in India largely depends on global support and the worldwide success of CCS technology in the coming years. Nevertheless, in its earlier technology roadmap report on CCS [70], the IEA estimated that coal-CCS installations in India could have capacities of up to 81 GW by 2050. Furthermore, Viebahn et al. [24] estimated a huge range of theoretical potential for possible coal-CCS deployment pathways in India (from 50 GW to 395 GW), considering best and worst case projected coal development scenarios up to 2050. Shukla et al. [11] suggested that nearly all coal power plants in India should be equipped with CCS by 2050 (around 175 GW to 205 GW) in order to achieve deep decarbonisation of the energy sector. Vishwanathan et al. [15] asserted that the deployment of CCS is critical if coal is to retain its significant share in India’s future electricity mix, and predicted that the installed capacity of coal-CCS could be around 135 GW to 155 GW by 2050, depending on whether India adopts 1.5 °C or 2 °C compatible climate mitigation pathways. On the other hand, in its energy [r]evolution scenarios for India [30] and the world [29], Greenpeace made a strong case for coal exit by 2050 rather than deploying CCS to continue burning fossil fuels. Furthermore, the majority of studies projecting future electricity scenarios for India [1,2,71,72,73,74,75,76,77] completely ignore the coal-CCS option in their predictions, even though they assume that coal power will make a considerable contribution until 2050. In a nutshell, although most future scenarios predict that coal power will still make a significant contribution in India by 2050, the projections for coal-CCS have either been very conservative or largely ignored, even by the studies that predict ambitious coal development pathways. Finally, based on the consistency and transparency of the above studies, we assume three end points as the likely range representing the deployment status of coal-CCS in India by 2050 (see Figure 2a): low (35 GW), mean (80 GW) and high (150 GW) [15,27,70].

3.1.2. CO2 Storage Potential and Demand

India is a diverse geological area with three basic tectonic divisions—the Peninsula consisting of ancient crystalline rocks, the Extra-Peninsula consisting of western Himalayan sedimentary beds, and the Indo-Gangetic alluvial plains consisting of deep layers of sand, clay and organic debris from the Ganges and Indus rivers [78]. The actual CO2 storage potential in the Indian sub-continent is still unclear, and to date very few CO2 storage assessment studies have been conducted [17]. Dooley et al. [79] conducted a global first order assessment based on an integrated model and estimated a theoretical potential of 105 Gt of CO2 storage for India. Singh et al. [80] estimated a total CO2 storage potential of 572 Gt for India—with 360 Gt in deep saline aquifers, 200 Gt in basalt formations, 7 Gt in oil and gas fields and 5 Gt in coal seams. However, both studies only model aggregate potential at national level for India and do not provide details about the locations of potential CO2 sinks in the country. Holloway et al. [81] conducted by far the most comprehensive study and adopted a cautious approach by classifying the deep saline aquifer storage capacities as being of good, fair and limited quality for the individual basins under consideration. Viebahn et al. [24] took this study as the basis for suggesting CO2 storage potential scenarios for India with a value range of 45 Gt (good quality) to 143 Gt (good + fair + limited quality), including small volumes of oil and gas fields. Based on these studies [24,81], the Global CCS Institute [82] suggests CO2 storage capacity estimates of between 47 Gt and 63 Gt for India—but highlights that there is very low confidence in the data.
On the other hand, only a handful of studies have attempted to estimate the possible demand for CO2 storage in India by 2050. In a clustering exercise carried out by Garg et al. [17] to develop a cost-effective infrastructure for sequestering CO2 from 649 large point sources—including all major power, steel, cement, refinery and fertiliser plants in India—the authors found that more than 90% of the sequestered emissions after clustering came from the power sector. They estimated that India could capture and store 23 Gt to 30 Gt CO2 over a period of 30 years starting from 2020. Shukla et al. [11] projected that 7 Gt to 10 Gt cumulative CO2 storage capacity would be needed to sequester carbon emissions from power generation and steel plants in India by 2050. Viebahn et al. [24] estimated along different scenarios that all newly constructed coal power plants up to 2050 in India could cumulatively emit 13 Gt to 111 Gt CO2 across their lifetimes. They further analysed—after conducting theoretical source-sink matching for these power plants—that only 5 Gt to 75 Gt CO2 of the overall emissions could be sequestered. In our study, based on the three end point scenarios previously outlined (Section 3.1.1.), we estimate that approximately 9 Gt to 37 Gt could be a possible range for CO2 storage demand from coal-based CCS power plants installed up to 2050 in India (see Figure 2b; calculation assumptions are provided in Section S1). This range is well within the lower end of the good quality data estimate (45 Gt) provided by [81] for CO2 storage potential in India. However, there could also be simultaneous demands for CO2 storage from non-power sources; for example, the heavy metal and fertiliser industries. Such additional demands are not accounted for in our estimates as that is beyond the scope of this work.

3.1.3. Commercial Availability

India will only start the commercial deployment of coal-CCS once the technology has been successfully demonstrated and commercially deployed in industrialised countries [24]. Therefore, the point in time when the technology will be commercially available worldwide is of utmost interest. It is important to emphasise that the criteria for considering CCS as being commercially available is when (a) large-scale CCS projects become commercially viable and (b) the necessary supply chain and supporting infrastructure is put in place, including carbon storage and transportation. At present, there are only two small (115 MW and 240 MW) coal-fired power plants retrofitted with post-combustion capture systems in commercial operation around the world. These capture a total of 2.4 Mt CO2/year, mainly for use in enhanced oil recovery. Most of the CCS facilities in operation today are in the industrial sector (17 out of 19) and these are mainly in natural gas processing applications. Around 10–12 large-scale CCS facilities for power generation plants are in the developmental stage and are expected to be commissioned in the 2020s [82]. Therefore, we optimistically assume commercial availability between 2025 and 2030 in industrialised countries.
Table 1 provides a review summary of the expected year of commercial availability of coal-CCS in the Indian context as suggested by different studies. It is evident that most studies do not provide a clear picture of when coal-CCS will become commercially available, although some studies hint at a likely year for implementing CCS projects in India [11,15,25,27,28,70]. Others, however, assume that coal-CCS technology will not be practically feasible in the Indian context before 2040 or 2050 [1,2,29,30]. Following our assumption for global development of the technology, in this study we take 2030 as the earliest possible year for commercial availability of CCS in India.

3.2. Costs

In this section, we first present our assessment on the simple levelized costs of electricity generation (LCOE) for coal-based power plants—with and without carbon capture and storage (CCS)—and renewable power plants. Then we extend the simple LCOE results to advanced LCOE (aLCOE) by adding systems costs and carbon costs and show the impact of accounting for these additional costs on the relative positioning of coal, coal-CCS and renewable power plants.

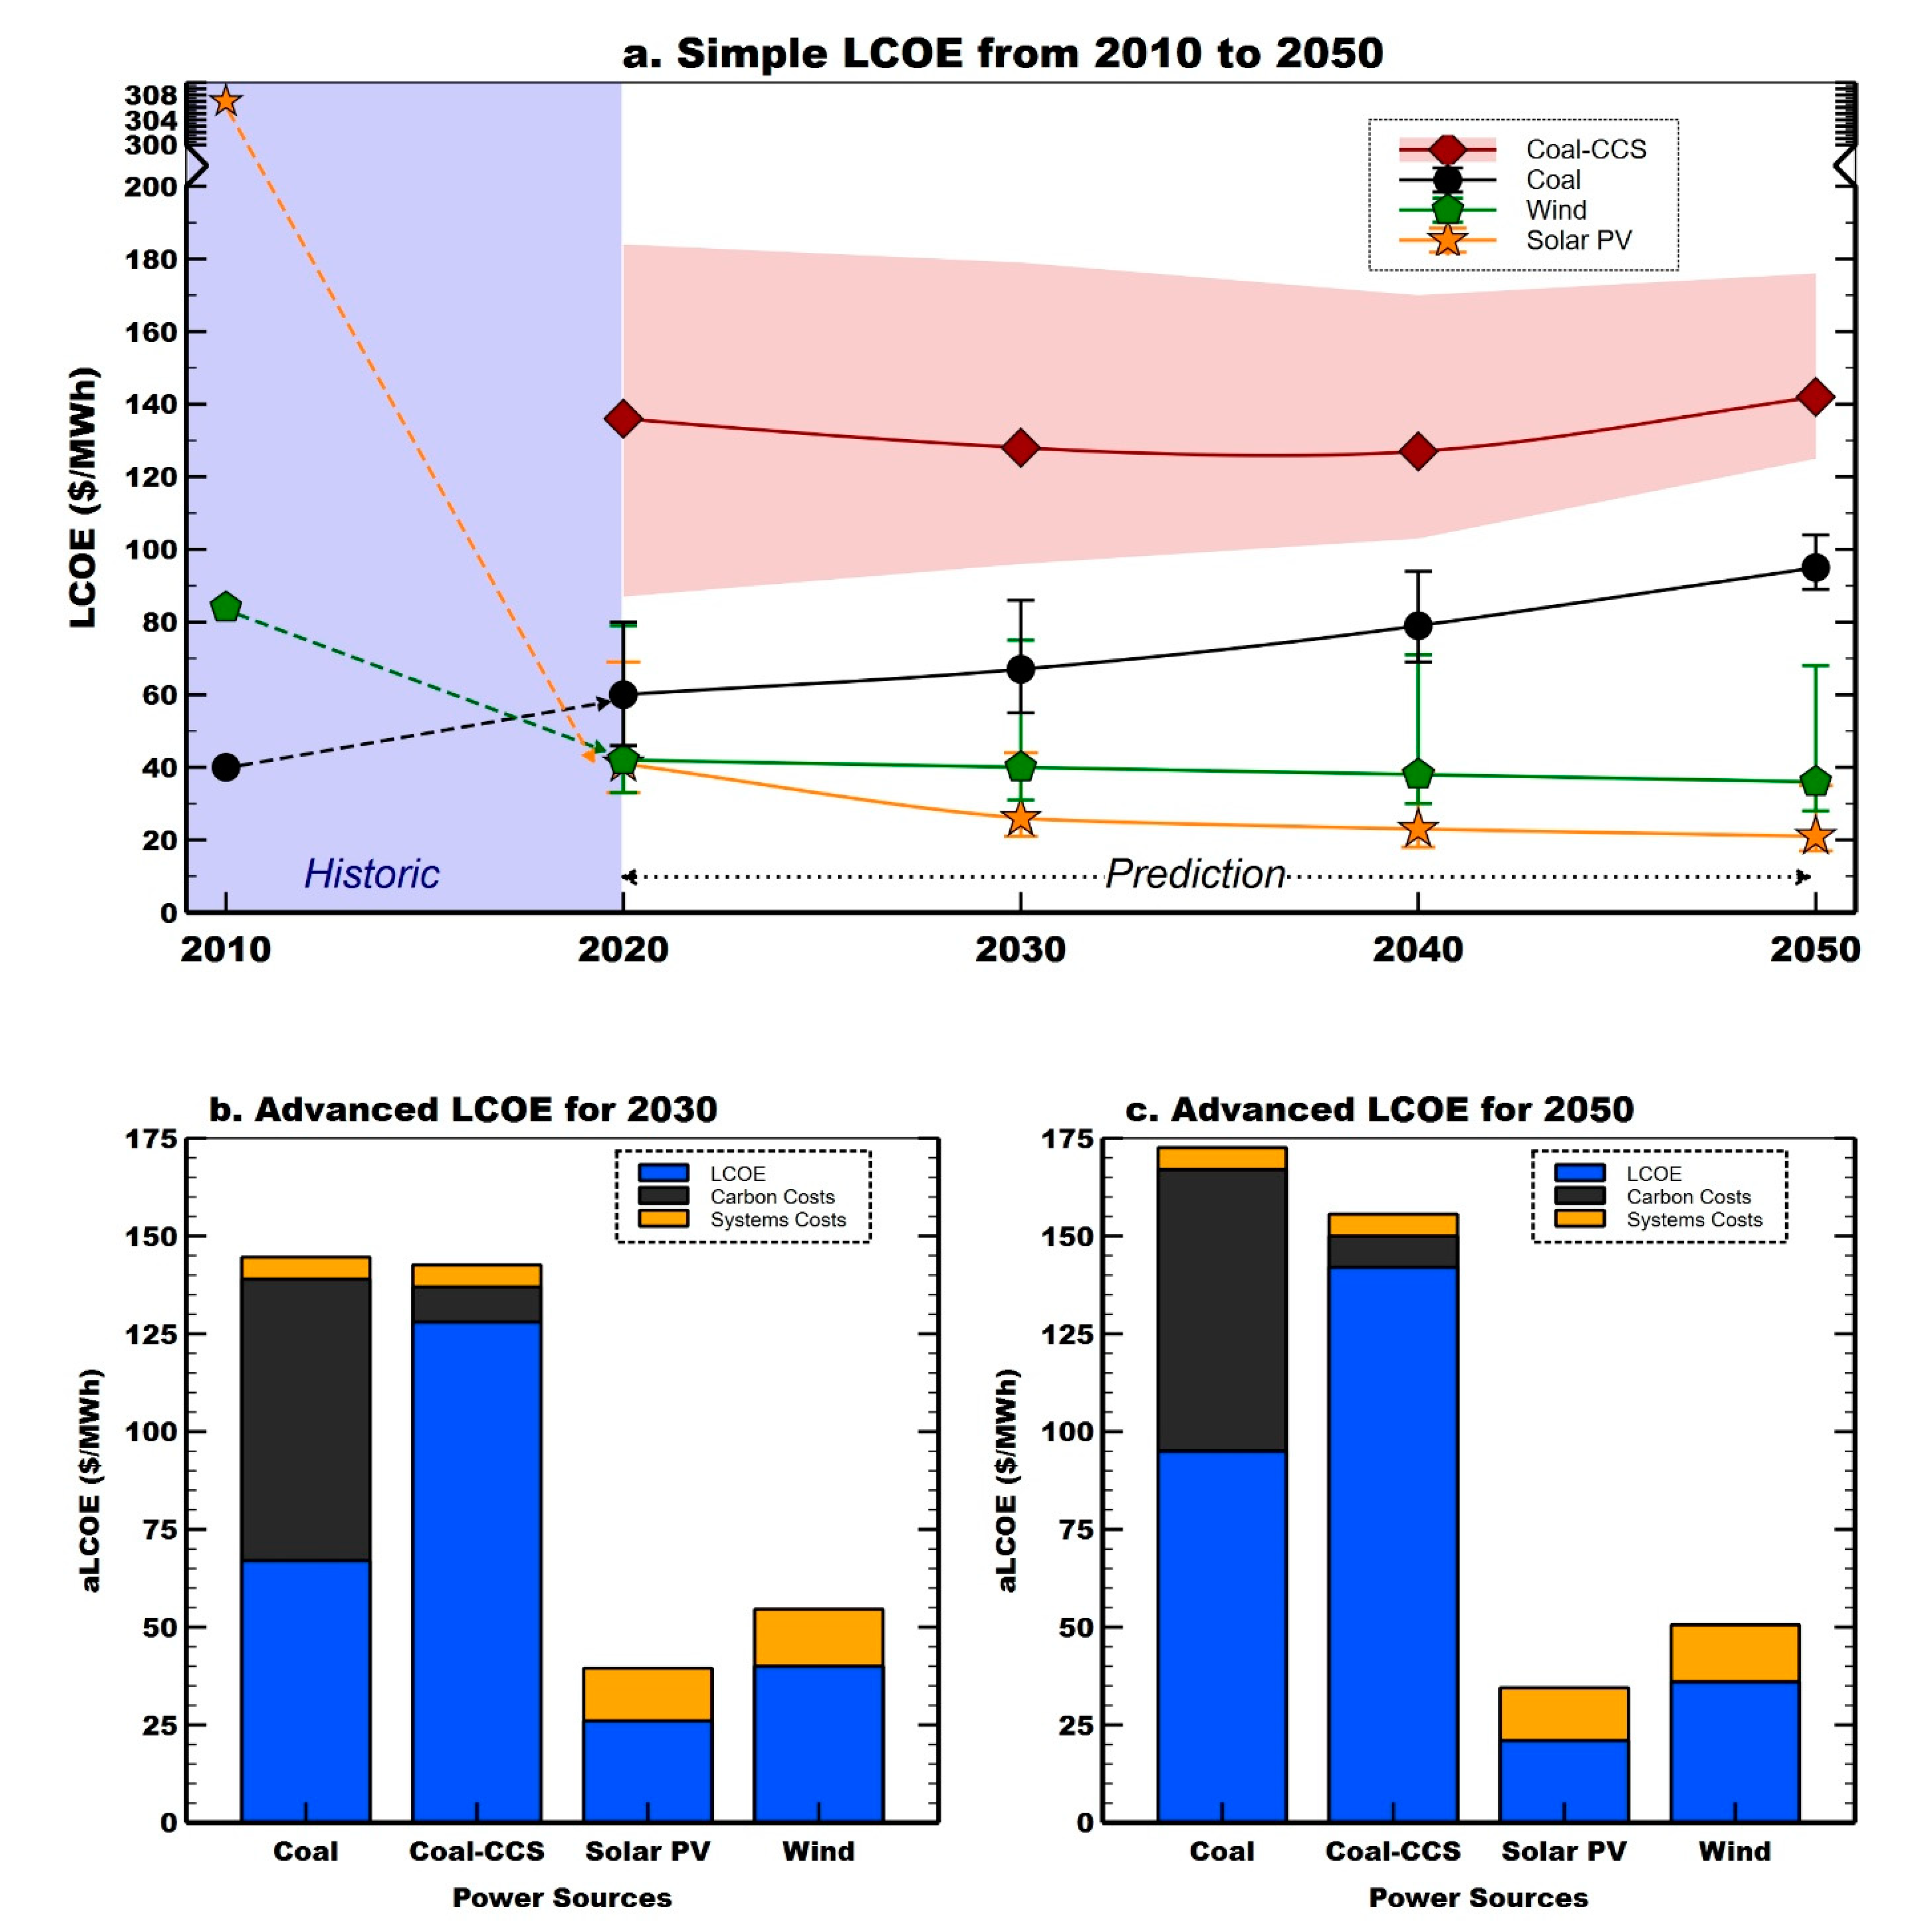
3.2.1. LCOE for Coal-Based Power Plants

Our investigation focuses on supercritical, pulverised coal power plants as these plants are expected to dominate the future coal power generation scenarios in India until 2050 [83,84]. The capital expenditure (Capex; $/kW) of conventional coal power plants is kept constant during the analysis time period (2020–2050) because supercritical coal technologies are already mature, and we anticipate that the increasing environmental norms will nullify any eventual future cost reductions achieved from coal technology’s learning rate. We assume optimistic thermal efficiencies of 39% to 41% for newly built plants in 2020. We escalate this by 1% in 2030 to reach the maximum achievable efficiency of 42% in Indian climatic conditions [24]. The capacity utilisation factor (CUF) of coal power plants in the country has decreased steadily in recent years; for instance, the yearly average CUF for thermal power plants has decreased from 77.5% in 2009–2010 to 59.7% in 2017–2018 [85]. Moreover, the National Electricity Plan [83] anticipates that the overall CUF for coal power plants in India could possibly reduce to 56.5% by 2021–2022 due to the effects of additional renewable capacity. However, although a reasonable CUF in the future might be (well) below 60%, we assume 60–80% CUF [24,83,86] to get a better idea of the lower range of future conventional coal power costs in India. Further, coal imports have been rising steadily in recent years due to the availability of higher quality and lower emission-intensity coal on the international market [2]. Therefore, in our fuel cost estimations we assume a 70/30 mix of domestic/imported hard coal for mean value.
For coal-CCS plants, we apply a uniform average learning rate of 3.9% for capital costs and 5.8% for operational expenditure [24,87], with the number of doublings dependent on the three coal-CCS deployment end-point scenarios in future in India (150 GW/80 GW/35 GW by 2050 as estimated in Section 3.1.1). All scenarios start with an installation capacity of 1 GW in 2030. We assume that the integration of the post-combustion capture unit will reduce the thermal efficiencies of supercritical coal power plants by 8.5% (points) in 2020 and the penalty will decrease to 5% (points) by 2050 (based on [24]); for retrofits, we assume an additional efficiency penalty of 1.5% (points). In addition, we anticipate that coal-CCS plants will be used more effectively compared to conventional coal power plants and consequently assume optimistic capacity utilisation factors of 72–80% per annum [24]. It is anticipated that 90% of the CO2 emissions from coal-CCS plants will be captured (the nominal capture rate) and then transported across a distance of between 350 km and 500 km via pipelines to CO2 storage sinks [24]. However, we do not account for the costs associated with any possible leakages of CO2 during transportation or from the storage sites in our assessment. See Tables S2.1 and S2.2 for detailed information on all the parameters and the assumptions used in estimating the LCOE for coal and coal-CCS power plants in India [2,17,24,34,69,83,84,85,86,87,88,89,90,91,92,93,94,95].

3.2.2. LCOE for Renewable Power Plants

We consider solar PV and onshore wind as the representative successful renewable energy technologies competing with coal-CCS. In part due to aggressive bidding and reverse auctioning of solar and wind power purchase agreements (PPAs) in recent years, the costs associated with these power plants have reduced dramatically (particularly in India). For solar PV, we apply differential technology learning rates: 20% from 2020 to 2030 and 12% from 2030 to 2050 (based on [96]), because we anticipate that solar PV technology starts to become established by 2030 and, as a result, shows a different learning trend from 2030 onwards. For wind, we use a uniform learning rate of 5% throughout the time period of the analysis [96]. We also estimate that the average operation and maintenance costs for solar PV and wind, escalated over 25 years, are around 3% and 2–3% of capital expenditure respectively [97,98,99,100]. Regarding discount rates, we observe lower WACC (9–12%) for renewable power options [91,97,98,99,100,101,102] compared to coal-based power plants (11–14%) [24,86,91]. This is due to lower perceived investment risks by financial institutions and government support for renewables in recent years [91]. Lastly, renewable power plants have lower capacity utilisation rates, around 19% (16–22%) for solar PV [98,99] and 29% (20–32%) for wind [97,100,103], compared to their coal-powered counterparts (60–80%), because of their intermittent nature and dependency on diurnal cycles. The power plant parameters and assumptions used in estimating the LCOE for renewables are provided in Tables S2.3–S2.4 [96,97,98,99,100,101,102,103].

3.2.3. LCOE Results and Analysis

The simple LCOE results are plotted in Figure 3a. The LCOE for coal-CCS plants start from $136 per MWh (low–high: $88–$185) in 2020 and reach $142 per MWh ($125–$175) by 2050; whereas the LCOE for coal power plants range from $60 per MWh ($46–$80 per MWh) in 2020 to $95 per MWh ($89–$104) in 2050. In contrast to coal power, the mean LCOE trend for coal-CCS power reduces slightly from 2020 to 2040 due to its technology learning curve; however, the impact of increasing coal prices outweighs this influence significantly post-2040 and hence its LCOE start rising steadily. On the other hand, the LCOE for solar power plants decrease from $41 per MWh ($33–$69) in 2020 to $21 per MWh ($16–$34) by 2050, and the LCOE for wind power plants decrease from $42 per MWh ($33–$79) in 2020 to $36 per MWh ($28–$68) by 2050. We highlight the typical contrasting characteristic features of conventional and renewable power sources—an increasing LCOE trend over time for coal-based power sources due to the utilisation of limited coal fuel supplies, in contrast to a decreasing LCOE trend for renewable power sources due to impacts from economies of scale and higher technology learning rates. Note the steep decrease in the LCOE costs of solar PV, especially in the first decade (in Figure 3a), because of its higher technology learning rates in comparison to other power sources. When we compare only the mean values, the differences between the LCOE for coal-CCS plants and for coal, solar PV and wind power plants vary respectively from $61, $102 and $88 per MWh in 2030 to $46, $121 and $105 per MWh in 2050. This demonstrates that the mean LCOE for coal-CCS power plants is 5 and 3 times higher in 2030, increasing to 7 and 4 times higher by 2050 with respect to solar PV and wind power plants. On the other hand, when comparing the lower end of the LCOE estimations (for coal-CCS these represent the costs of retrofitting the Indian supercritical coal power plants combined with best operating performance assumptions across the LCOE parameters), the cost differences between the LCOE for coal-CCS and for coal, solar PV and wind power plants decrease respectively to $42, $75 and $65 per MWh in 2030. The cost multiplication ratios, however, remain almost identical to the mean value comparison for 2030.
To estimate the advanced LCOE, we add systems costs and carbon costs to the simple LCOE estimates. For coal and coal-CCS plants, we assume additional systems costs of $5.6 per MWh [90]; these costs are for grid extension and reinforcement resulting from the installations of these power plants. For solar PV and wind power plants, we assume the systems costs to be around $13.5 and $14.6 per MWh [90] respectively—these are primarily grid extension and reinforcement costs, as well as balancing costs arising from maintenance and operation of reserves to tackle short-term fluctuations and the intermittency of renewable power sources. We also account for the India-specific social cost of carbon emissions in our advanced LCOE calculations: based on the work of [69], we take the range of $49–$157 per tCO2 as the minimum/maximum and $86 per tCO2 as the mean value along the entire timescale of our analysis (2020 to 2050). Figure 3b,c show the mean values of aLCOE results for 2030 and 2050, respectively—providing breakdowns for simple LCOE, carbon costs and systems costs. The mean aLCOE for coal, coal-CCS, solar PV and wind power plants vary from $145, $143, $40 and $55 per MWh in 2030 to $173, $155, $34 and $51 per MWh by 2050, respectively. The inclusion of carbon costs in the levelized costs impacts significantly on the relative ranking of coal-CCS and coal; coal-CCS becomes competitive as 90% of the carbon emissions are avoided via carbon capture and storage systems. For instance, from the aLCOE perspective, the levelized costs of coal power rise by more than 100%, while coal-CCS costs increased by only 11% in comparison to their simple LCOE results in 2030. However, the relative differences between the levelized costs of coal-CCS and solar PV/wind remain almost the same in both LCOE and aLCOE estimations; this is because the increase in the levelized costs of renewables in aLCOE estimations, due to their higher systems costs, is partly compensated for by the proportionate increase in the coal-CCS levelized costs due to carbon costing.

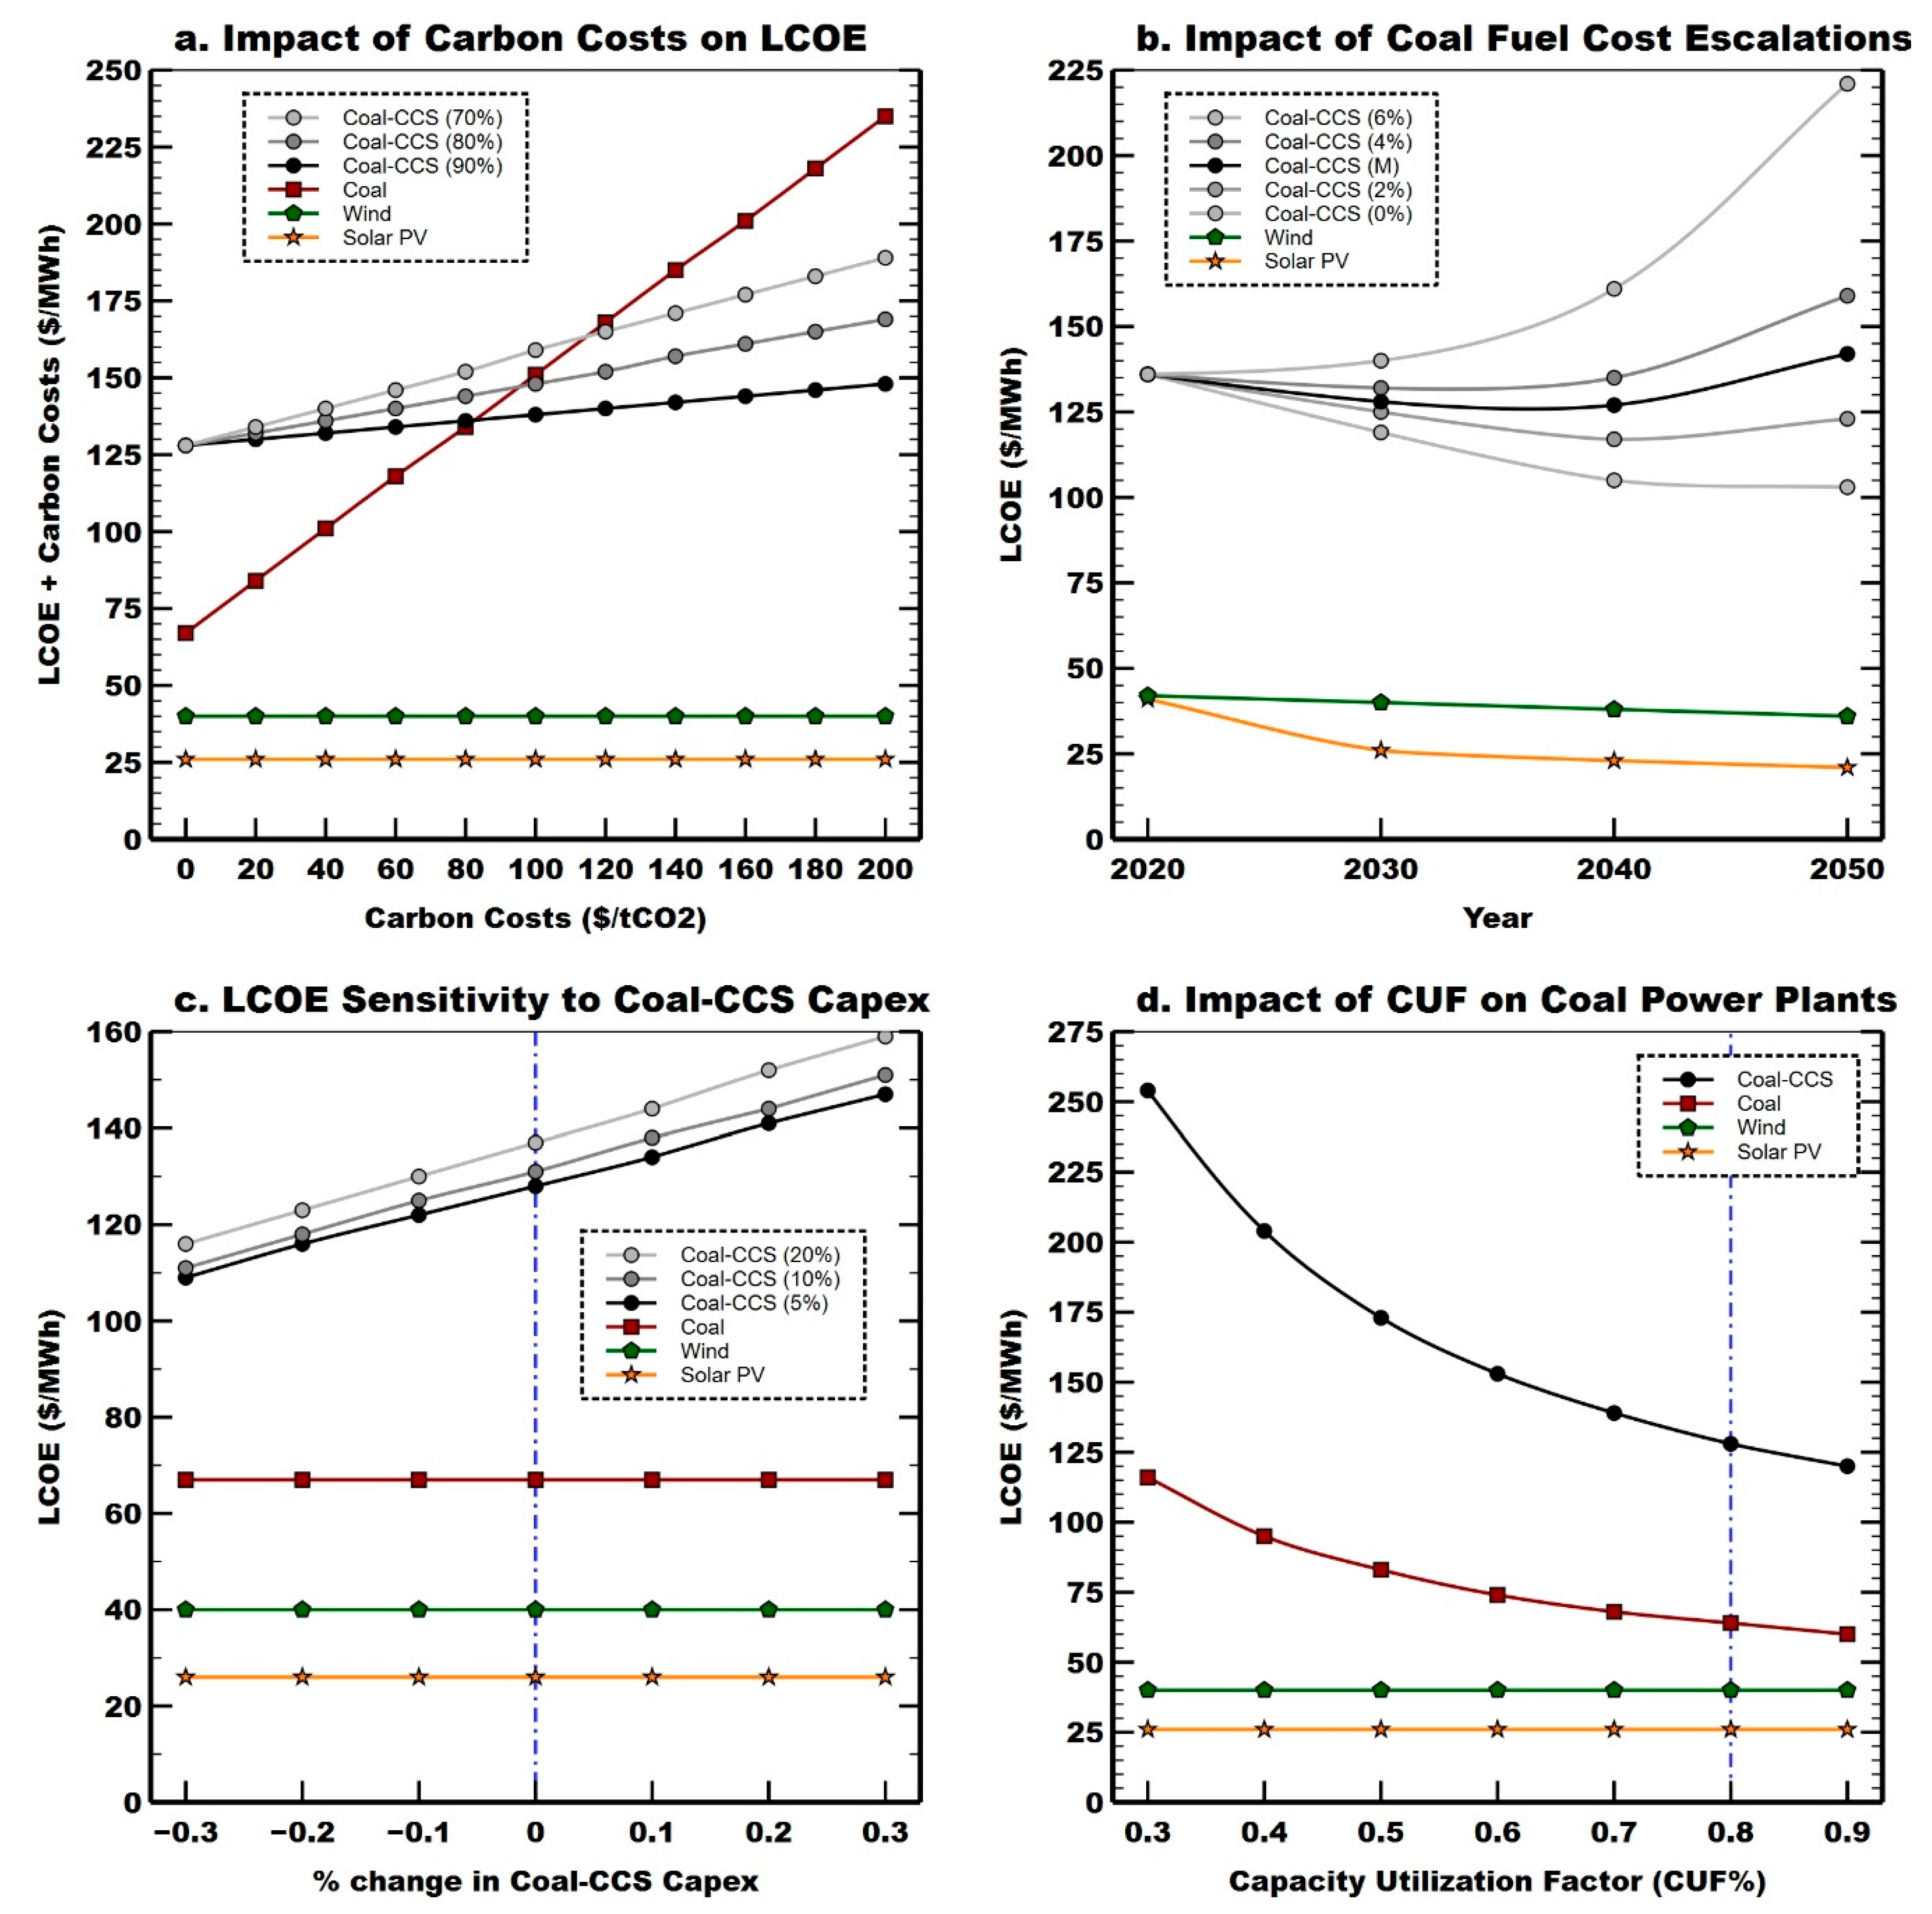
3.2.4. Sensitivity Analyses

The base year chosen for the sensitivity analyses is 2030, as we assume the commercialisation of coal-CCS in India to start by 2030.

(a) Impact of Carbon Costs on LCOE

Figure 4a shows the sensitivity of the mean levelized costs of coal and coal-CCS to the variations in carbon costs. At zero carbon costs, the levelized costs of the power sources equate to the simple LCOE for the year 2030. The following observations can be made. Firstly, the levelized costs of coal show a strong linear dependency and increase proportionately with increasing carbon costs. Secondly, it is clear that the carbon capture rate of coal-CCS plants is a decisive factor in determining how quickly the levelized costs of coal-CCS can become competitive with conventional coal power plants when faced with rising carbon costs. For instance, coal-CCS becomes competitive with respect to conventional coal plants when the carbon costs rise to (approximately) $83 per tCO2 in the case of a 90% capture rate (default value assumed in this study), $96 per tCO2 in the case of an 80% capture rate, and $114 per tCO2 in the case of a 70% capture rate. Thirdly, the increasing carbon costs not only make coal-CCS competitive with respect to conventional coal power plants but simultaneously increase the gap between the levelized costs of renewables and coal-CCS power plants—depending on the capture rate of CCS systems. For instance, the differences in the levelized costs of coal-CCS and solar PV increase from $102 per MWh at zero carbon costs to $110 per MWh at $83 per tCO2 costs (cross-over point for coal-CCS at 90% capture rate) and to $136 per MWh at $114 per tCO2 costs (cross-over point for coal-CCS at 70% capture rate).

(b) Impact of Coal Fuel Cost Escalation Rates

Figure 4b shows the impact of coal fuel cost escalation rates on the LCOE results of coal-CCS. The escalation rates strongly dictate the future growth of coal fuel prices and, therefore, influence the LCOE of coal-CCS exponentially. However, we emphasise that the escalation rates can significantly boost the existing differences between the LCOE of coal-CCS and renewable power plants but cannot diminish it substantially unless the coal fuel prices start dropping from the current market rates. For instance, compare the trajectories of coal-CCS and solar PV in different escalation scenarios from 2030 to 2050. In this study, the price of domestic hard coal escalates by 4%/year [92] from 2020 to 2050 (starting from 36$/ton in 2020; [85]), while imported coal price escalates at 2%/year (starting from 80$/ton in 2020; [84]).

(c) LCOE Sensitivity to Coal-CCS Capex

Figure 4c shows that the overnight capital costs of coal-CCS strongly influence the LCOE results. The LCOE values increase proportionately with rising overnight costs—for instance, a 30% reduction in capex (overnight) leads to a 15% reduction in the LCOE for coal-CCS and a 30% increase leads to a 15% increase in the LCOE at 5% cost overruns. In this study, we assume 5% cost overruns for low and mean estimations [34] and 20% for high estimations [86]. It can be observed that an increase in cost overruns can boost the impact of overnight costs on LCOE results, especially at higher capital expenditures. Furthermore, our analysis shows that even a 30% reduction in capex (overnight) from the mean value in 2030 does not impact on the relative ranking of coal-CCS and renewables. For instance, the difference between the LCOE for coal-CCS after 30% reductions in capex (overnight) at 5% overruns and solar PV is still $83 per MWh in 2030.

(d) Impact of CUF on Coal Power Plants

Figure 4d shows the impact of operating coal-CCS and conventional coal power plants at different capacity utilization factors (CUF) on their LCOE. It can be observed that the CUFs of coal-based power plants can significantly influence their LCOE. Hence, if the CUFs of coal power plants decrease in the future due to higher penetration of renewables, then their LCOE can significantly increase from the mean estimates presented in this study. For instance, the mean LCOE of coal-CCS (in 2030) could increase from $128 to $173 per MWh if operated at 50% CUF instead of 80% (assumed in this study); the LCOE could further increase to $254 per MWh if operated at 30% CUF. However, we highlight that the optimistic CUFs of 80% (for coal-CCS) and 72% (for conventional coal) were assumed in estimating our mean LCOE results so as to compare the economics of coal and renewable based power plants under best operating typical conditions in Indian context.

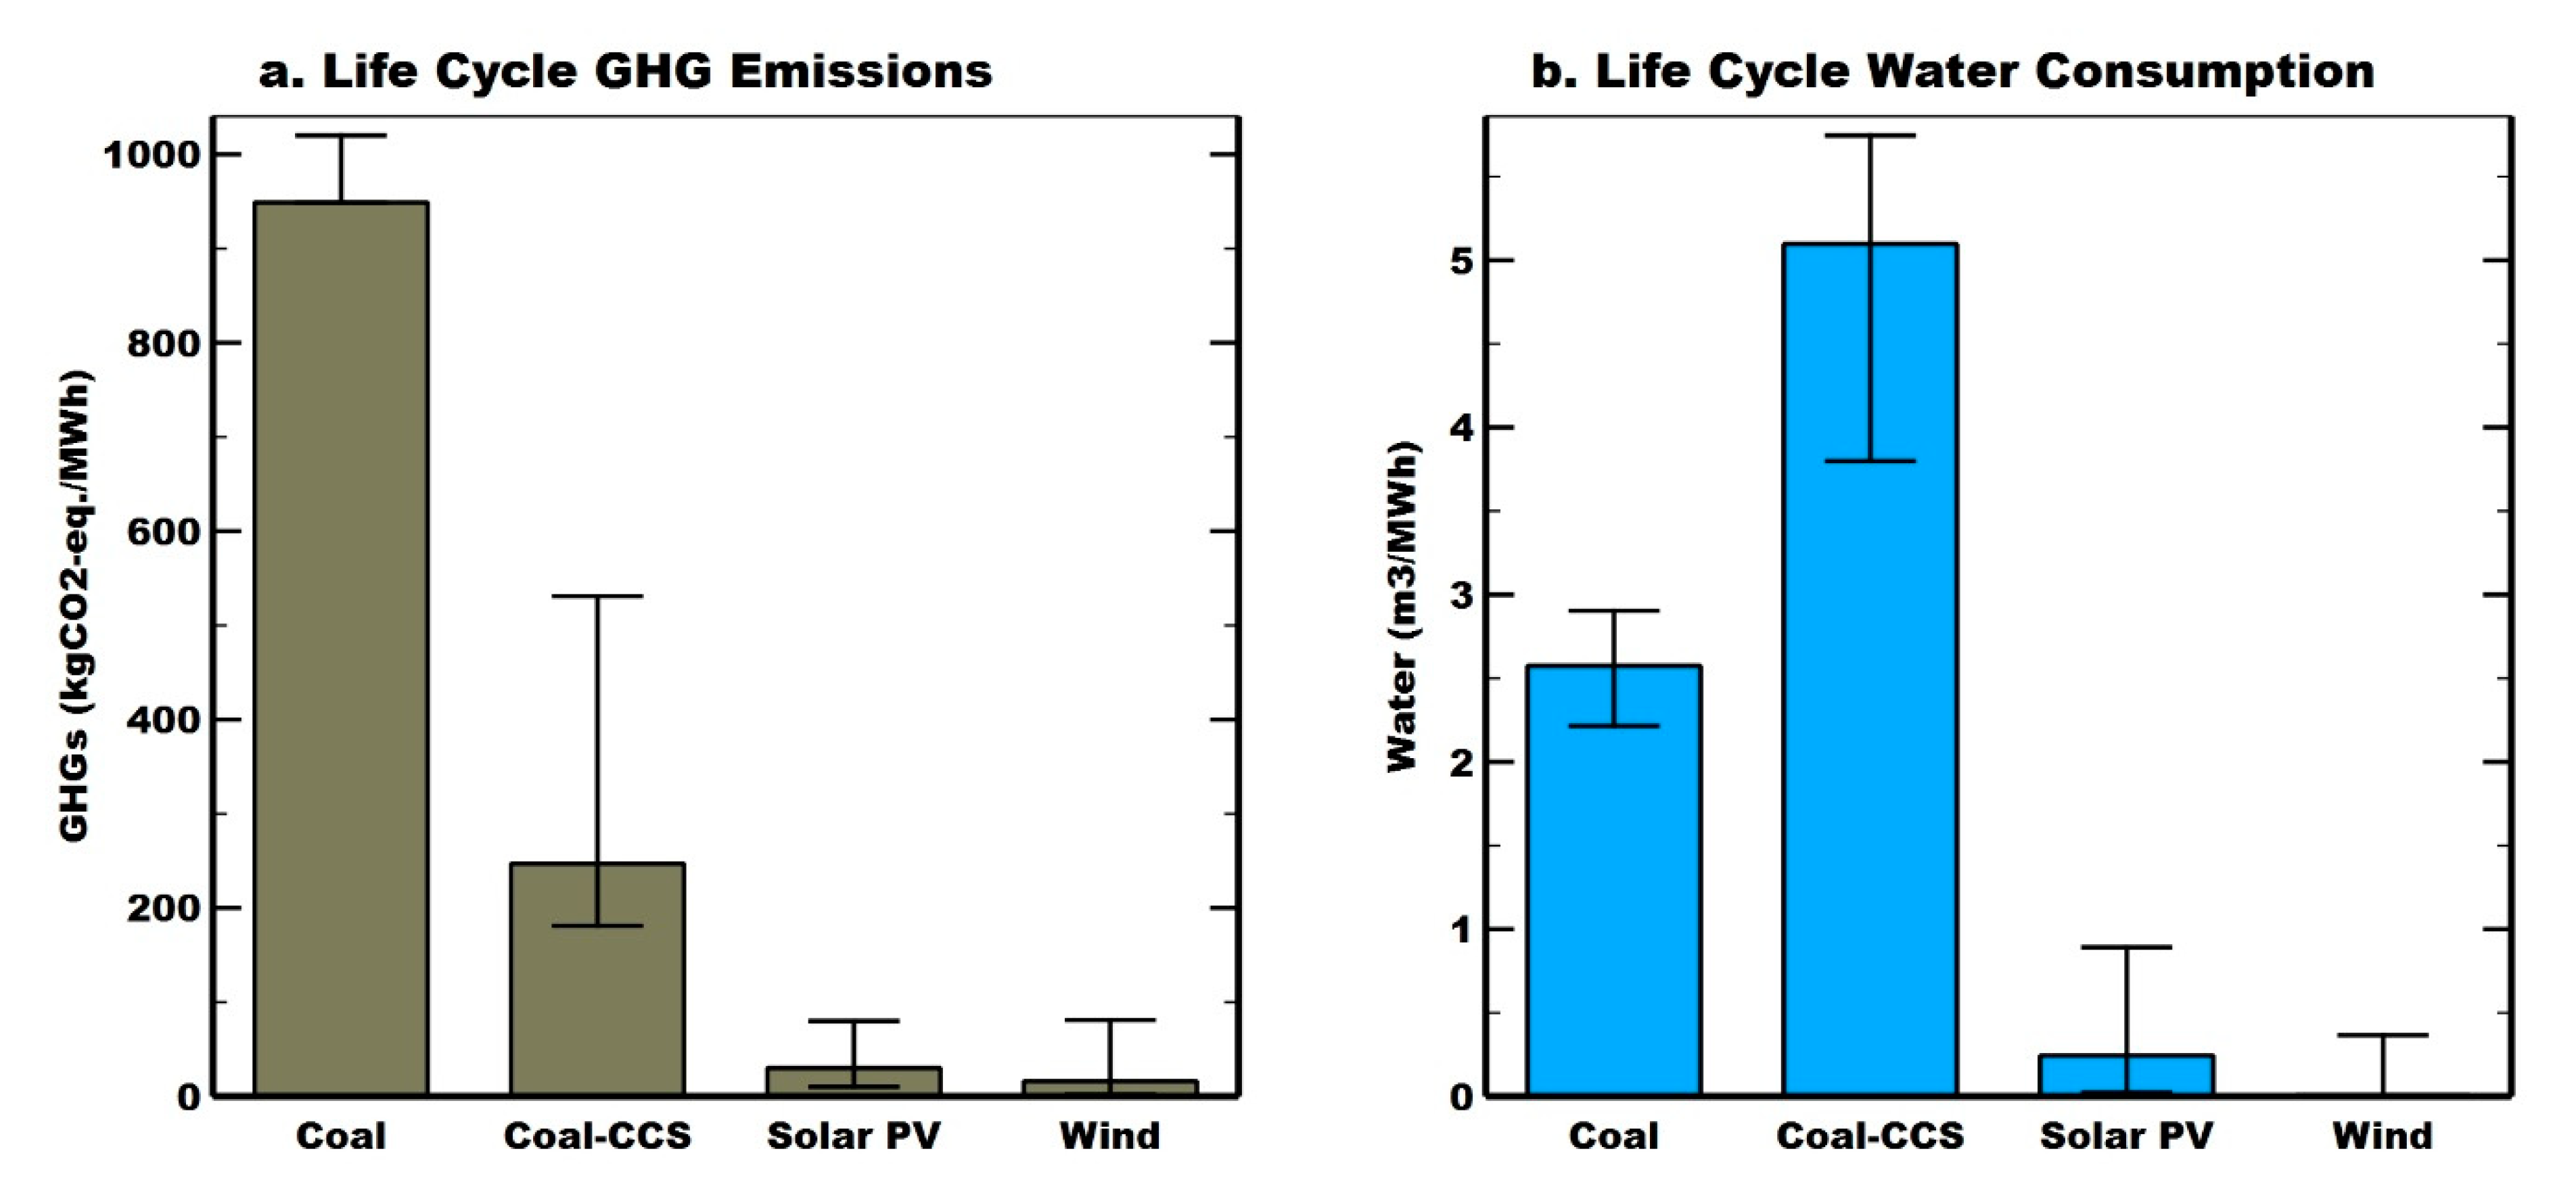
3.3. Climate Footprint

Nearly 70% of India’s emissions come from the energy sector. Consequently, decarbonising this sector is one of the top priorities under India’s national climate change action plan [7]. Mallapragada et al. [10] conducted an extensive life cycle assessment of the Indian coal power plant fleet and estimated that the life cycle GHG emissions range from 949 to 1368 gCO2eq./kWh (from the 10th to the 90th percentile). We assume the top quintile power plants from this study represent the performance of India’s newly built supercritical coal power plants. We conducted a meta-analysis to estimate the percentage decrease in the life cycle GHG emissions of coal power plants when equipped with post-combustion CCS technologies [24,64,104,105,106,107,108,109,110,111] (see Tables S3.1 and S3.2 for details). We came across a broad range of values: studies suggest from a 48–59% [105] to a 75–81% [104] reduction in GHG emissions. We take the minimum/maximum (48%/81%) percentage decrease in life cycle GHG emissions from the above two studies, and the mean value (74%) from [24], in which the authors conducted an India-specific life cycle assessment for coal power plants with and without CCS. The net GHG reduction rates for coal-CCS are lower than expected at a nominal capture rate of 90%. This is because, from a life cycle perspective, the additional fuel consumption caused by the energy penalty and GHG emissions released during the upstream and downstream parts of the whole life cycle value chain (e.g., CO2 emissions caused by transportation and storage of CO2, the production of the solvents, methane emissions caused by mining the additional coal needed due to the penalty) must be taken into account [24]. The life cycle GHG emissions data for solar PV and wind power plants (mostly caused during the production processes) are taken from [112,113] respectively. Figure 5a shows the life cycle GHG emissions for coal, coal-CCS, solar PV and wind power plants to generate 1 MWh of electricity. The mean values show that although the life cycle GHG emissions of coal power plants decrease by 74% when equipped with CCS, coal-CCS still emits 8 times and 15 times more GHG emissions than solar PV and wind power plants, respectively.

3.4. Water Footprint

India has scarce freshwater resources, with 70% of these resources located in hard-to-access geographical areas. Moreover, nearly 50% of India’s population already tussles with acute water scarcity issues and water demand is expected to exceed supply by at least 50% by 2030 [114,115]. Hence, it is utmost necessary to account for water-energy nexus in new energy policies [116], especially for new cleaner technology deployment initiatives [35]. In this study, we account for water use during the fuel cycle (extraction, processing and transportation), power plant life cycle (construction, component manufacturing and decommissioning) and power plant operations. We use data from [65] for water use during the coal fuel cycle and power plant life cycle, and customise it to the Indian context. For the coal fuel cycle, we use opencast mining data as more than 93% of Indian coal mining falls within this category [117]. The power plant operational water use data is taken from [118] and [119]. As nearly 90% of Indian coal power plants use recirculating cooling tower systems [119], we base our assessment on the water footprint of this cooling technology. For coal-CCS, we conducted a meta-analysis to estimate the percentage increase in the life cycle water consumption of coal power plants when equipped with post-combustion CCS technologies [26,65,66,120,121]; see Tables S4.1 and S4.2 for details. We estimate a 31% increase in water use during the coal fuel cycle and power plant life cycle stages [65], and the water use almost doubles (minimum/mean/maximum: 72%/100%/106%) [26,120,121] during power plant operations for coal-CCS in comparison to conventional coal plants because of efficiency penalties and water demand for additional processes due to the integration of CCS technologies. The life cycle water consumption data for solar PV and wind are taken from [65]. The mean value for solar PV is estimated based on the average of crystalline-silicon and thin-films technologies for the power plant life cycle [65], together with India-specific operational water use data from [119]. Figure 5b shows the life cycle water consumption estimates for coal, coal-CCS, solar PV and wind power plants to generate 1 MWh of electricity. Comparing the mean values, it is clear that coal-CCS consumes 2 times, 20 times and 900 times more water than coal, solar PV and wind power plants, respectively.

4. Integrated Comparative Assessment: Results and Discussion

Our future coal-CCS pathways assessment for India up to 2050 allows us to make several observations. Firstly, most energy modellers and policy researchers in India perceive coal-CCS to be of limited relevance until 2040 or 2050, even though a majority of the studies that we analysed agree that coal power will make a significant contribution to the electricity generation mix until 2050. However, based on the limited number of studies that predict coal-CCS pathways for India (Section 3.1.1), we adopt three end point scenarios (35 GW/80 GW/150 GW) as the likely range of total capacity of coal-CCS by 2050. Secondly, the CO2 storage potential estimates for India range from 45 Gt to 572 Gt in the literature, with a very low confidence level. As a result, the available data should be treated with caution [24,82]. We note that the CO2 storage potential assessment studies for India carried out to date are preliminary in nature; therefore, there is a clear need for the systematic quantification and assessment of potential CO2 storage capacity available across geological reservoirs in the Indian subcontinent, taking into account reductions in the theoretical storage potential due to technical, economic and social implications [17,24]. It will only then be possible to develop strategic long-term CCS roadmaps for the country. Moreover, a systematic potential storage capacity assessment is a prerequisite for investors and the industry to enter the Indian CCS market on a large scale, if feasible. Thirdly, our cumulative CO2 storage demand estimates for the three end point coal-CCS scenarios up to 2050 indicate that the range (9–37 Gt) is well within the lower bound of the good quality estimate for India’s potential storage capacity (45 Gt) provided by [81]. However, we underline that our demand estimations are based on conservative coal-CCS capacity projections and do not take into account the storage demands from large industrial CCS applications, among others. Lastly, after assessing the current coal-CCS landscape across the world and screening the relevant India-specific literature and some stakeholder presentations (Section 3.1.3), we believe it is still too early to predict the commercial availability of large-scale CCS for India’s coal power sector, despite optimistically assuming 2030 as the base year in our assessment. This is because the prerequisites for the commercial availability predictions have not yet been met in the Indian context—for example, high confidence data on the CO2 storage capacity in Indian geological reservoirs is not yet available—and the coal-CCS landscape is still nascent, even in industrialised countries. Furthermore, we also assert that commercial availability will heavily depend on the political will and backing of the Indian government towards developing CCS support infrastructure in the country in the coming years.

4.1. Energy-Cost-Climate-Water Nexus

Our cost estimations reveal that the integration of CCS with coal power doubles its LCOE, and the mean LCOE of coal-CCS plants are 5 times and 3 times higher than solar PV and wind power plants in 2030; this difference increases steadily until 2050 due to the escalation in coal fuel prices and the relatively higher learning rates of renewables in comparison with coal-CCS. Furthermore, we note that the inclusion of carbon costs and systems costs in the aLCOE scenario does not considerably affect the relative cost differences between coal-CCS and renewables, since the increase in the levelized costs of renewables (due to their higher systems costs) is partly compensated for by the proportionate increase in coal-CCS levelized costs (due to carbon costing). However, in the aLCOE scenario, coal-CCS does compete in terms of costs in comparison to conventional coal power plants. Furthermore, the sensitivity analyses indicate that the impact of carbon costing on the levelized costs of coal-CCS can increase considerably with a decreasing carbon capture rate; the capture rate is the decisive parameter that determines how quickly the break-even point for cost competitiveness of coal-CCS over conventional coal power plants is reached in the face of rising carbon costs (Figure 4a). In our estimate, this break-even point for mean values is $83 per tCO2 (carbon costs) at 90% carbon capture rate; the break-even point would be higher at lower capture rates. Moreover, it is observed that the future growth of levelized costs of coal-CCS strongly depends on the learning curve of overnight capital costs and coal fuel price escalations. The assumed coal fuel price escalations only boost the already existing price gap in the levelized costs of coal-CCS and renewables, and lower coal fuel price assumptions would not substantially reduce the price gap (Figure 4b). On the other hand, even the 30% reduction in the estimated mean overnight capital costs of coal-CCS or the comparison between low LCOE values (representing CCS retrofits) in 2030 does not significantly impact on the relative differences between the LCOE of coal-CCS and renewables (Figure 3a and Figure 4c). Lastly, the mean LCOE estimates for coal-CCS presented in this study consider optimistic operational conditions in the Indian context at 80% CUF, but the higher penetration of renewables in the future can significantly decrease the CUFs of coal-CCS plants, as already seen in the context of conventional coal power plants in India [83,122]. In this case, the price gap between coal-CCS and renewables could increase further from the mean values presented in our study (Figure 4d). In summary, we underscore that the inferences drawn from the comparative levelized costs assessment in our study generally remain effective under the extremities tested in our analyses.
Our climate footprint assessment suggests that coal-CCS plants could make a significant contribution to the decarbonisation of India’s coal power fleet, as CCS technologies could potentially lower the coal-based GHG emissions in the country by almost 74% (Figure 5a). However, although favourable compared to conventional coal plants, coal-CCS life cycle GHG emissions are still 8 to 15 times higher in comparison to renewables. In addition, our water footprint assessment reveals that the life cycle water consumption of Indian coal power plants doubles when equipped with CCS technologies and coal-CCS consumes huge volumes of water resources during its life cycle in comparison to renewables: over 20 times more than solar PV and 900 times more than wind power plants. We underscore here that coal power plants already consume significant freshwater resources in the country; for instance, it is estimated that nearly 88% of industrial water demand in India comes from thermal power plants. Furthermore, more than 44% of India’s existing coal power plants and 45% of newly-proposed plants are sited in high to extremely high water-scarce regions and the establishment of coal power plants is often the primary cause of water stress in the regions of their placement [123]. This shows that the conventional coal power plants are already competing with water demands from other essential services in India; for example, for agricultural and domestic use [35], among others. Furthermore, climate change impacts are expected to exacerbate the water issues in the country [116,124] and this issue, combined with exponentially rising water demands [114,115], will mean that the availability of water resources in India will have a strong influence on the fate of water-intensive coal-CCS technologies during an era of global warming and freshwater scarcity.
In summary, we note that coal-CCS underperforms considerably in comparison to renewables from a cost-climate-water nexus perspective (see Figure 6a). A simple first order estimate shows that 150 GW of coal-CCS cumulatively emits 10 Gt of GHG emissions and consumes 214 billion cubic metres of water throughout its life cycle over a period of 40 years. If the same amount of electricity is generated from a 70/30 mix of solar PV/wind power, 9 Gt of GHG emissions can be avoided (roughly equivalent to the total GHG emissions for three years for the whole of India [4]) and 207 billion cubic metres of water can be conserved (roughly equivalent to the total domestic water demand for four years for the whole of India [125]) (see Section S5 for assumptions). However, it should be noted here that the additional impacts of energy storage and ancillary power sources necessary to sustain the high renewable scenarios are not taken into account in the above simplistic comparison. Although we accounted for systems costs in our aLCOE estimates—including grid integration and reinforcement costs plus balancing costs to operate short-term reserves—we did not account for all the costs that arise from the operation of energy storage units and ancillary services across the main grid system to maintain a high penetration of renewables in future energy scenarios. Consequently, further research in this direction is recommended. Lastly, although it is fairly apparent that coal-CCS could make a significant contribution to reducing GHG emissions if India follows a coal-dominant future energy pathway [17], the major drawbacks are that coal-CCS consumes nearly twice the water resources and costs twice as much as conventional coal power. Given that climate change impacts are likely to intensify water and environmental issues significantly in India in the coming decades [126], we envisage strong positive feedback loops between global warming, water scarcity issues and stricter environmental norms that, in turn, impact negatively on the levelized costs of coal-CCS—making its practical feasibility tremendously challenging. Therefore, it is crucial that climate-friendly technologies must have low water footprints and be cost competitive in order to become sustainable and effective large-scale solutions for energy generation in India in an era of global warming and resource scarcity.

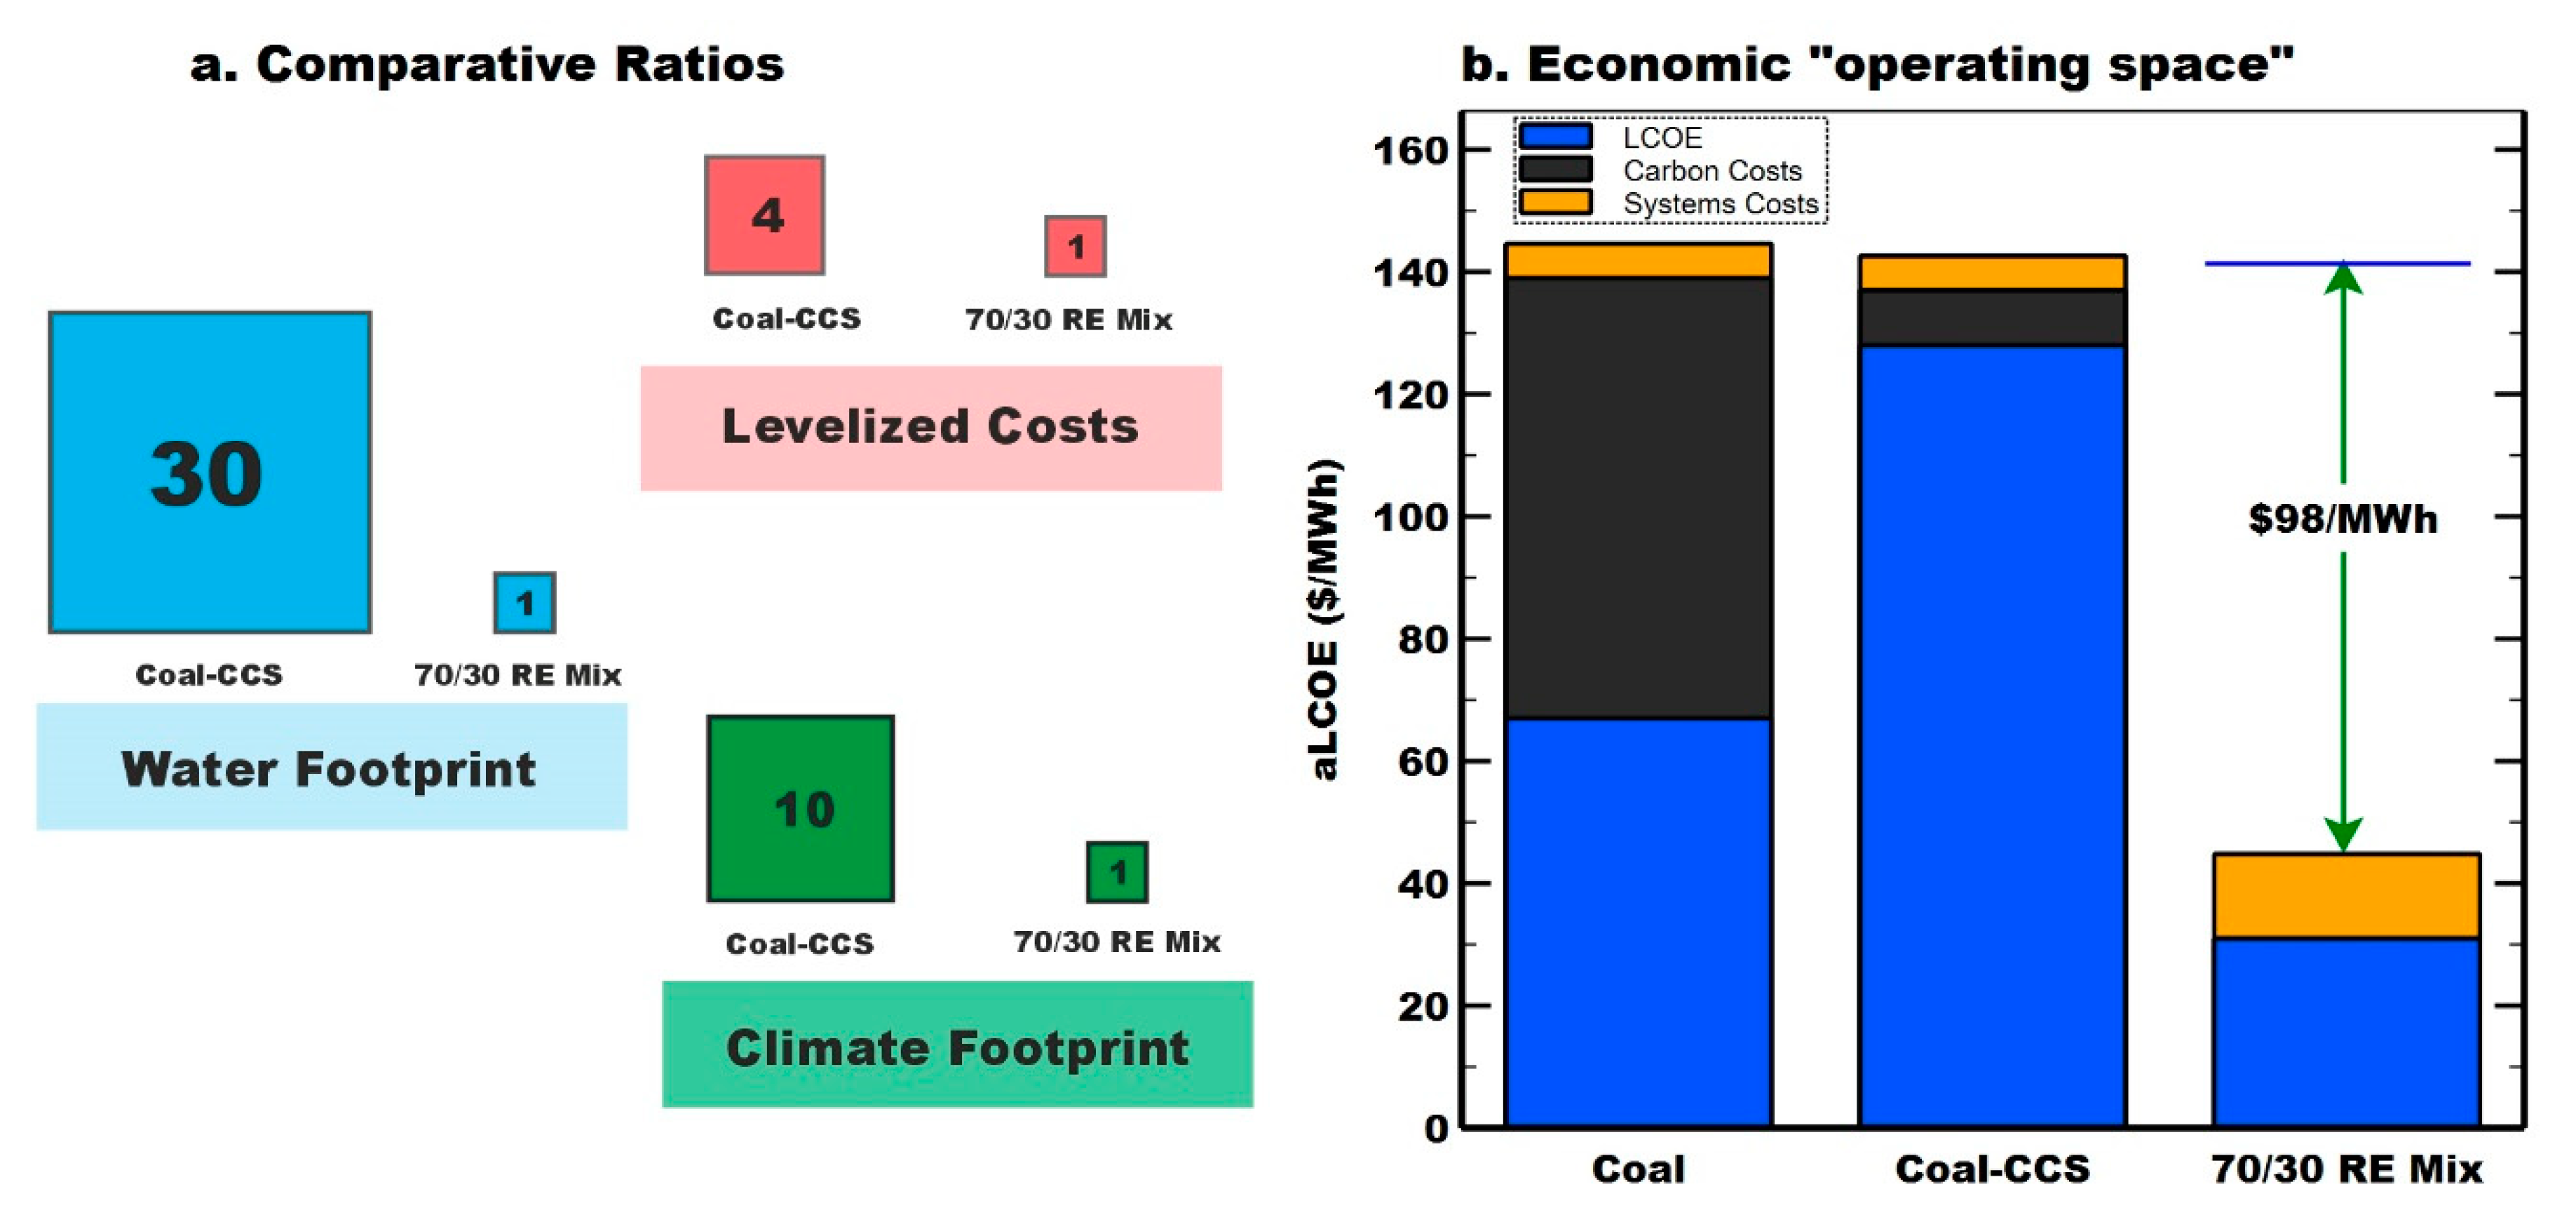
4.2. Economic “Operating Space” for Additional Energy Storage by 2030

Generally, studies on future prospects of coal-CCS argue that carbon pricing favours the deployment of coal-CCS in India in the future [11,15,16,17,18]. Although this seems evident in comparison to conventional coal power plants, we argue that carbon pricing will not reduce the levelized costs of coal-CCS but will instead make conventional coal power furthermore expensive—and conventional coal power is already expensive when compared to successful renewables. The obvious lack of competitiveness of conventional coal power plants in future energy markets (with carbon pricing) should not be interpreted as a favourable sign for coal-CCS, especially when there are other promising competitors in the market. We emphasise the possibility that carbon pricing might also strongly favour the deployment of storage technologies and, therefore, support a much stronger setup of renewables-based energy system, since there is a large “operating space” in the difference of $98 per MWh between the mean aLCOE estimates for coal-CCS and a 70/30 RE mix (solar PV/wind) by 2030 (Figure 6b). While the complete costs resulting from a high penetration of renewables in future are yet to be estimated for India, the cost difference estimate from this study ($98/MWh) can give a rule of thumb for the upper cap of energy storage and ancillary service costs to maintain a high penetration of renewables in the future grid; so that the overall costs of renewables, storage and ancillary services will still be competitive in relation to coal-CCS in 2030. In addition, we note that the gap between the levelized costs of coal-CCS and renewables might further widen depending on rising carbon prices and coal fuel prices post 2030 (see Figure 3 and Figure 4). Moreover, the capacity utilisation (CUF) of coal-CCS plants could decrease significantly in the future (compared to the optimistic 80% CUF assumed in our study) due to the higher penetration of renewables, which would significantly increase the LCOE for coal-CCS (see Figure 4d). These possible future scenarios could further increase the competitiveness of high renewables-storage integrated future energy systems. In addition, the small-scale nature of renewables and many storage systems makes it more likely that a large-scale expansion could be achieved in a relatively short timeframe compared to the large-scale and infrastructure-heavy nature of coal-CCS. In a nutshell, our findings show that the cost reductions of storage technologies up to 2030, given coal-CCS is expected to become commercially available only after 2030 even in the best-case scenario, strongly determine the practical relevance of coal-CCS in future Indian power market.

4.3. Benchmarking with Other Studies

To our knowledge, this is the first integrated comparative assessment of coal-CCS and renewables coupled with a nexus perspective. Our simple LCOE estimates for India in 2030 are comparable with Ram et al. [34], with coal-CCS projections a bit higher ($128/MWh versus $117/MWh) and renewables projections a bit lower (e.g., $26/MWh versus $36/MWh for solar PV). This is because we assume India specific WACC in our study (e.g., 13% versus 10% in [34] for coal-CCS) and also due to significant cost reductions for renewables in the last couple of years. When compared to Viebahn et al. [24], our LCOE estimates for coal-CCS are higher because of higher coal-CCS capex assumptions (updated from recent literature, specifically [34,88]) and the inclusion of additional cost parameters (e.g., cost overruns). Further, our generic conclusions about the competitiveness of renewables in comparison to coal-CCS with respect to costs and life cycle GHG emissions, and the future energy scenarios analyses for coal-CCS pathways in India till 2050 echo and enhance the earlier findings from [24,34,48] to today’s context. However, our mean estimate for life cycle water consumption for coal-CCS (5098 L/MWh) is higher than Meldrum et al. [65] and Jin et al. [66] (approx. 4000 L/MWh) because we note that the Indian coal power plants have lower water coefficients on ground at the operation end (when compared to international standards) [35] and hence we assume that the water consumption for power plant operations will nearly double, when equipped with post-combustion CCS technologies, based on the argumentation of [26,121]. Nevertheless, our lower estimate for life cycle water consumption for coal-CCS (3799 L/MWh) intends to accommodate future technology learning with respect to operational water consumption in India’s coal-based power plants. Lastly, our arguments about the water-intensive nature of coal-CCS and their implications on the regional water crisis have recently been echoed by Yang et al. [127] in the context of China.

4.4. Limitations and Further Research

In this work, we used and further developed the integrated assessment approach by coupling it with a nexus perspective, which helped us to identify the benefits and trade-offs of coal-CCS vis-à-vis renewables from multiple sustainability perspectives. However, as is always the case with such prospective integrated assessments, the uncertainties about the assumed future data—be it the development of coal fuel prices, the application of CCS in power plants worldwide (and thus the possible learning rate), or the potential availability of CO2 storage sites—still remain and further research in these areas could improve the robustness of the results obtained from integrated assessments like the one at hand. Additionally, we suggest adding other sustainability indicators (such as employment potential, health impacts and land footprint) into the integrated assessment framework in future studies. Further, although we accounted for India specific cost estimates for CO2 storage and transport in our assessment, any additional costs incurred due to leakage of CO2 during transportation and at storage sites (if any) are not considered in our levelized costs estimates. This is because of the current lack of knowledge and data on how significant such leakages might be in the future and the possibility that any such leakage will not have to be paid for by investors (for the most part at least), but more likely by society. In addition, the long-term environmental, economic and social implications of CO2 storage are not explored in this study. Premature CCS technologies and water efficient dry cooling towers are likewise not accounted for in our assessments, because of their expensive cost dynamics and also because we believe it is too early to comment on their future technology learning rates, especially in Indian context. Consequently, we recommend further research in these directions. Furthermore, our climate footprint, water footprint and CO2 storage demand estimations should be considered as preliminary assessments to guide further in-depth research in the coming years. Lastly, due to data availability issues, we could not include various socio-environmental external costs of power generation options or systems costs arising from the large-scale integration of storage technologies and other ancillary services necessary to sustain a very high penetration of renewables in the future Indian power grid. We strongly recommend India-specific detailed research on these aspects going forward.

5. Conclusions

A comprehensive overview of our integrated assessment results with respect to the seven chosen indicators is provided in Table 2. Firstly, our scrutiny of India’s future energy scenarios indicates that most energy scenario studies either ignore the CCS option or call for a complete coal-exit, except for a few that provide conservative estimates for coal-CCS capacity projections. Secondly, we note that the CO2 storage potential in India has not yet been quantified systematically and there is low confidence in the available data. As a result, we highlight that the systematic quantification and in-depth assessment of potential CO2 storage capacity available across geological reservoirs in the Indian subcontinent—accounting for reductions in the theoretical storage potential due to technical, economic and social implications—is a prerequisite for charting long-term strategic CCS roadmaps for the country. Furthermore, although our cumulative CO2 storage demand estimates for coal-CCS scenarios up to 2050 (9 Gt/20 Gt/37 Gt) fall within the good quality storage potential estimate (45 Gt) provided by [81], we underline that our demand estimations are based on conservative coal-CCS capacity projections and do not take into account the storage demands from large-scale industrial CCS applications, among others. Therefore, these estimates should be treated with caution and further research in this direction is certainly recommended. Thirdly, we see clear signs in the literature and stakeholder presentations that the adoption of coal-CCS in India depends on how fast CCS technologies mature and are implemented at scale in industrial countries. This leads us to believe that it is too early to predict the year of commercial availability of large-scale CCS for India’s coal power sector (although we optimistically assume 2030 as the base year in our assessment). Fourth, our levelized costs assessment points out that coal-CCS is very expensive in comparison to conventional coal power plants and successful renewables; hence, significant enhancement in its technology learning rate is crucial if CCS is to enter the Indian power market in future. Fifth, even though carbon pricing makes coal-CCS competitive in relation to conventional coal power plants by nearly doubling the levelized costs of the latter in 2030, it does not influence the lack of competitiveness of coal-CCS with respect to renewables. For instance, there is still a price gap of $98 per MWh between aLCOE/LCOE for coal-CCS and a 70/30 solar PV/wind mix in 2030. However, the full impact of external costs, storage and ancillary services costs on the relative competitiveness of these power sources needs to be evaluated in future studies. Sixth, from a climate change mitigation perspective, we agree that coal-CCS could eventually act as a technology intervention to decarbonise the power sector if India follows a coal-dominant future pathway, as CCS technologies can significantly reduce the life cycle GHG emissions of conventional coal power plants (by about 74%). However, we note that renewables are better positioned than coal-CCS if the goal is ambitious climate change mitigation and long-term sustainable development. (Coal-)CCS should, however, be further developed as a backstop technology because, even if it is not available on a large scale until 2030 in India, it could be used later to retrofit existing coal power plants and could also become integrated with energy-intensive industries where there are often no alternative low-carbon options. Seventh, our water footprint assessment reveals that coal-CCS is a water-intensive technology and consumes twice as much water as conventional coal plants. India may well struggle to retain its conventional coal power plants over the next decades because of their large water footprints, which raises doubt about the potential acceptance in India of the introduction of additional water-intensive technologies such as coal-CCS—especially when extremely water-efficient renewables are available with water consumption rates nearly 30 times (70/30 solar PV/wind mix) lower than coal-CCS. To conclude, our study indicates that coal-CCS suffers not only from typical new technology development related challenges—such as the lack of technical potential assessments and necessary support infrastructure, and high costs—but also from severe resource constraints (especially water resources) in an era of global warming and the competition from outperforming renewable power sources. We predict that these challenges would have to be comprehensively addressed for coal-CCS to play a significant role in low carbon electricity transition not only in India, but in the Global South in general.

Supplementary Materials

https://www.mdpi.com/1996-1073/14/2/262/s1. The following supplementary materials are available online. Section S1: Assumptions for estimating the CO2 storage demand from all the coal-CCS plants built until 2050, Section S2: Levelized Costs: Table S2.1: Data and assumptions used for estimating the levelized costs of future coal power generation in India, Table S2.2: Data and assumptions used for estimating the levelized costs of future coal-CCS power generation in India, Table S2.3: Data and assumptions used for estimating the levelized costs of future solar PV power generation in India, Table S2.4: Data and assumptions used for estimating the levelized costs of future wind power generation in India, Table S2.5: Data summary of Levelized Costs of Electricity Generation (LCOE) results, Section S3: Climate Footprint: Table S3.1: Data and assumptions used for estimating Life Cycle GHG emissions, Table S3.2: Meta-analysis on the percentage decrease in the GHG emissions of coal power plants after integrating with CCS, Section S4: Water Footprint: Table S4.1: Data and assumptions used for estimating Life Cycle Water Consumption, Table S4.2: Meta-analysis on the percentage increase in the operational water consumption of coal power plants after integrating with CCS, Section S5: What it takes to run 150 GW of coal-CCS for 40 years (assumptions and first order estimates).

Author Contributions

Conceptualization, M.H. and P.V.; data curation, M.H., P.V. and S.S.; formal analysis, M.H.; investigation, M.H.; methodology, M.H. and P.V.; supervision, P.V.; validation, P.V. and S.S.; writing—original draft, M.H.; writing—review and editing, P.V. and S.S. All authors have read and agreed to the published version of the manuscript.

Funding

This research was funded by Alexander von Humboldt Foundation and the APC was funded by Wuppertal Institute for Climate, Environment and Energy.

Institutional Review Board Statement

Not applicable.

Informed Consent Statement

Not applicable.

Data Availability Statement

The data presented in this study are available in www.mdpi.com/xxx/s1.

Acknowledgments

We thank Alexander von Humboldt Foundation for funding this study. We acknowledge financial support by Wuppertal Institute for Climate, Environment and Energy within the funding programme Open Access Publishing to cover publication costs. We also thank Shruthi Hiremath for her assistance in designing the figures for this study and Katherine Penker for proofreading the manuscript.

Conflicts of Interest

The authors declare no conflict of interest.

Abbreviations

Coal / conventional coalconventional supercritical coal power plants (without CCS)
Coal-CCSCCS-equipped supercritical coal power plants
Solar PVutility-scale solar photovoltaic power plants
Windlarge onshore wind power plants
GHGsgreenhouse gases
LCOElevelized cost of electricity generation
aLCOEadvanced levelized cost of electricity generation
PPAspower purchase agreements
Capexcapital expenditure
Opexoperation and maintenance expenditure (annual)
CUFcapacity utilisation factor

References

  1. IEA. World Energy Outlook; International Energy Agency: Paris, France, 2019. [Google Scholar]
  2. IEA. WEO-2015 Special Report: India Energy Outlook; International Energy Agency: Paris, France, 2015. [Google Scholar]
  3. CEA. Annual Report 2018–2019; Central Electricity Authority, Ministry of Power, Government of India: New Delhi, India, 2019. [Google Scholar]
  4. World Resources Institute, W.R.I. ClimateWatch: Global Historical Emissions. 2016. Available online: https://www.climatewatchdata.org/ghg-emissions (accessed on 3 June 2020).
  5. World Resources Institute, W.R.I. 4 Charts Explain Greenhouse Gas Emissions by Countries and Sectors. 2020. Available online: https://www.wri.org/blog/2020/02/greenhouse-gas-emissions-by-country-sector (accessed on 3 June 2020).
  6. Jiang, J.; Ye, B.; Liu, J. Research on the peak of CO2 emissions in the developing world: Current progress and future prospect. Appl. Energy 2019, 235, 186–203. [Google Scholar] [CrossRef]
  7. MOEFCC. India’s Second Biennial Update Report to the United Nations Framework Convention on Climate Change; Ministry of Environment, Forest and Climate Change, Government of India: New Delhi, India, 2018. [Google Scholar]
  8. ClimateActionTracker. Country Summary: India. 2020. Available online: https://climateactiontracker.org/countries/india/ (accessed on 3 June 2020).
  9. Mittal, S.; Dai, H.; Fujimori, S.; Masui, T. Bridging greenhouse gas emissions and renewable energy deployment target: Comparative assessment of China and India. Appl. Energy 2016, 166, 301–313. [Google Scholar] [CrossRef]
  10. Mallapragada, D.S.; Naik, I.; Ganesan, K.; Banerjee, R.; Laurenzi, I.J. Life Cycle Greenhouse Gas Impacts of Coal and Imported Gas-Based Power Generation in the Indian Context. Environ. Sci. Technol. 2018, 53, 539–549. [Google Scholar] [CrossRef]
  11. Shukla, P.; Dhar, S.; Pathak, M.; Mahadevia, D.; Garg, A. Pathways to Deep Decarbonization in India; SDSN-IDDRI: Copenhagen, Denmark, 2015. [Google Scholar]
  12. Selosse, S.; Ricci, O. Carbon capture and storage: Lessons from a storage potential and localization analysis. Appl. Energy 2017, 188, 32–44. [Google Scholar] [CrossRef]
  13. Pfeiffer, A.; Millar, R.; Hepburn, C.; Beinhocker, E. The ‘2 °C capital stock’ for electricity generation: Committed cumulative carbon emissions from the electricity generation sector and the transition to a green economy. Appl. Energy 2016, 179, 1395–1408. [Google Scholar] [CrossRef]
  14. Mittal, S.; Liu, J.-Y.; Fujimori, S.; Shukla, P.R. An assessment of near-to-mid-term economic impacts and energy transitions under “2 °C” and “1.5 °C” scenarios for India. Energies 2018, 11, 2213. [Google Scholar] [CrossRef] [Green Version]
  15. Vishwanathan, S.S.; Garg, A.; Tiwari, V.; Shukla, P.R. India in 2 C and well below 2 C worlds: Opportunities and challenges. Carbon Manag. 2018, 9, 459–479. [Google Scholar] [CrossRef] [Green Version]
  16. Garg, A.; Shukla, P.R. Coal and energy security for India: Role of carbon dioxide (CO2) capture and storage (CCS). Energy 2009, 34, 1032–1041. [Google Scholar] [CrossRef]
  17. Garg, A.; Shukla, P.R.; Parihar, S.; Singh, U.; Kankal, B. Cost-effective architecture of carbon capture and storage (CCS) grid in India. Int. J. Greenh. Gas. Control. 2017, 66, 129–146. [Google Scholar] [CrossRef]
  18. Garg, A.; Tiwari, V.; Vishwanathan, S. Relevance of clean coal technology for India’s energy security: A policy perspective. In Proceedings of the IOP Conference Series: Earth and Environmental Science, New Delhi, India, 13–14 February 2017; Volume 76, p. 12001. [Google Scholar]
  19. Kumar Shukla, A.; Ahmad, Z.; Sharma, M.; Dwivedi, G.; Nath Verma, T.; Jain, S.; Verma, P.; Zare, A. Advances of carbon capture and storage in coal-based power generating units in an Indian context. Energies 2020, 13, 4124. [Google Scholar] [CrossRef]
  20. Sifat, N.S.; Haseli, Y. A critical review of CO2 capture technologies and prospects for clean power generation. Energies 2019, 12, 4143. [Google Scholar] [CrossRef] [Green Version]
  21. Shearer, C.; Fofrich, R.; Davis, S.J. Future CO2 emissions and electricity generation from proposed coal-fired power plants in India. Earth’s Futur. 2017, 5, 408–416. [Google Scholar] [CrossRef]
  22. Kumar, R.; Jilte, R.; Nikam, K.C.; Ahmadi, M.H. Status of carbon capture and storage in India’s coal fired power plants: A critical review. Environ. Technol. Innov. 2019, 13, 94–103. [Google Scholar] [CrossRef]
  23. Sharma, N. Silver bullet or bitter pill? Reassessing the scope of CO2 capture and storage in India. Carbon Manag. 2018, 9, 311–332. [Google Scholar] [CrossRef]
  24. Viebahn, P.; Vallentin, D.; Höller, S. Prospects of carbon capture and storage (CCS) in India’s power sector-An integrated assessment. Appl. Energy 2014, 117, 62–75. [Google Scholar] [CrossRef] [Green Version]
  25. Singh, U.; Rao, A.B.; Chandel, M.K. Economic implications of CO2 capture from the existing as well as proposed coal-fired power plants in india under various policy scenarios. Energy Procedia 2017, 114, 7638–7650. [Google Scholar] [CrossRef]
  26. Sharma, N.; Mahapatra, S.S. A preliminary analysis of increase in water use with carbon capture and storage for Indian coal-fired power plants. Environ. Technol. Innov. 2018, 9, 51–62. [Google Scholar] [CrossRef]
  27. Kumar, H.; Upadhyay, M.K.; Bansal, R.; Gupta, R. Energizing India: A Joint Project Report of NITI Aayog and IEEJ. 2017. Available online: https://niti.gov.in/writereaddata/files/Energising-India.pdf (accessed on 30 December 2020).
  28. IESS. India Energy Security Scenarios: User Guide for Carbon Capture Storage (CCS). 2015. Available online: http://iess2047.gov.in/pathways/22202222222222220222222222012222202222222211202220222022222/primary_energy_chart (accessed on 30 December 2020).
  29. Greenpeace. Energy [r]evolution: A Sustainable world Energy Outlook; Greenpeace International: Stuttgart, Germany, 2015; Available online: https://elib.dlr.de/98314/1/Energy-Revolution-2015-Full.pdf (accessed on 30 December 2020).
  30. Greenpeace. Energy [r]evolution: A Sustainable India Energy Outlook; Greenpeace International: Stuttgart, Germany, 2012; Available online: http://www.indiaenvironmentportal.org.in/content/366606/energy-revolution-a-sustainable-energy-outlook-for-india-2012/ (accessed on 30 December 2020).
  31. Gulagi, A.; Bogdanov, D.; Breyer, C. The role of storage technologies in energy transition pathways towards achieving a fully sustainable energy system for India. J. Energy Storage 2017, 17, 525–539. [Google Scholar] [CrossRef]
  32. Anandarajah, G.; Gambhir, A. India’s CO2 emission pathways to 2050: What role can renewables play? Appl. Energy 2014, 131, 79–86. [Google Scholar] [CrossRef]
  33. Audoly, R.; Vogt-Schilb, A.; Guivarch, C.; Pfeiffer, A. Pathways toward zero-carbon electricity required for climate stabilization. Appl. Energy 2018, 225, 884–901. [Google Scholar] [CrossRef] [Green Version]
  34. Ram, M.; Child, M.; Aghahosseini, A.; Bogdanov, D.; Lohrmann, A.; Breyer, C. A comparative analysis of electricity generation costs from renewable, fossil fuel and nuclear sources in G20 countries for the period 2015–2030. J. Clean. Prod. 2018, 199, 687–704. [Google Scholar]
  35. Srinivasan, S.; Kholod, N.; Chaturvedi, V.; Ghosh, P.P.; Mathur, R.; Clarke, L.; Evans, M.; Hejazi, M.; Kanudia, A.; Koti, P.N.; et al. Water for electricity in India: A multi-model study of future challenges and linkages to climate change mitigation. Appl. Energy 2018, 210, 673–684. [Google Scholar] [CrossRef]
  36. Mishra, N.; Das, N. Coal Mining and Local Environment: A Study in Talcher Coalfield of India. Air Soil Water Res. 2017, 10. [Google Scholar] [CrossRef]
  37. Guttikunda, S.K.; Jawahar, P. Atmospheric emissions and pollution from the coal-fired thermal power plants in India. Atmos. Environ. 2014, 92, 449–460. [Google Scholar] [CrossRef]
  38. Krishna Priya, G.S.; Bandyopadhyay, S. Multi-objective pinch analysis for power system planning. Appl. Energy 2017, 202, 335–347. [Google Scholar] [CrossRef]
  39. Holland, R.A.; Scott, K.; Agnolucci, P.; Rapti, C.; Eigenbrod, F.; Taylor, G. The influence of the global electric power system on terrestrial biodiversity. Proc. Natl. Acad. Sci. USA 2019, 116, 26078–26084. [Google Scholar] [CrossRef] [Green Version]
  40. Mitavachan, H.; Srinivasan, J. Multi-criteria sustainability assessment of coal and solar power generation in India. Curr. Sci. 2017, 113, 1034–1038. [Google Scholar]
  41. Murrant, D.; Radcliffe, J. Assessing energy storage technology options using a multi-criteria decision analysis-based framework. Appl. Energy 2018, 231, 788–802. [Google Scholar] [CrossRef] [Green Version]
  42. Li, T.; Roskilly, A.P.; Wang, Y. Life cycle sustainability assessment of grid-connected photovoltaic power generation: A case study of Northeast England. Appl. Energy 2018, 227, 465–479. [Google Scholar] [CrossRef] [Green Version]
  43. Moslehi, S.; Reddy, T.A. A new quantitative life cycle sustainability assessment framework: Application to integrated energy systems. Appl. Energy 2019, 239, 482–493. [Google Scholar] [CrossRef]
  44. Hiremath, M.; Derendorf, K.; Vogt, T. Comparative life cycle assessment of battery storage systems for stationary applications. Environ. Sci. Technol. 2015, 49. [Google Scholar] [CrossRef] [PubMed]
  45. Sharifzadeh, M.; Hien, R.K.T.; Shah, N. China’s roadmap to low-carbon electricity and water: Disentangling greenhouse gas (GHG) emissions from electricity-water nexus via renewable wind and solar power generation, and carbon capture and storage. Appl. Energy 2019, 235, 31–42. [Google Scholar] [CrossRef] [Green Version]
  46. Lee, J.-Y.; Lin, H.-F. Multi-Footprint Constrained Energy Sector Planning. Energies 2019, 12, 2329. [Google Scholar] [CrossRef] [Green Version]
  47. Sanchez Moore, C.C.; Kulay, L. Effect of the implementation of carbon capture systems on the environmental, energy and economic performance of the Brazilian electricity matrix. Energies 2019, 12, 331. [Google Scholar] [CrossRef] [Green Version]
  48. Viebahn, P.; Daniel, V.; Samuel, H. Integrated assessment of carbon capture and storage (CCS) in the German power sector and comparison with the deployment of renewable energies. Appl. Energy 2012, 97, 238–248. [Google Scholar] [CrossRef] [Green Version]
  49. Viebahn, P.; Vallentin, D.; Höller, S. Prospects of carbon capture and storage (CCS) in China’s power sector—An integrated assessment. Appl. Energy 2015, 157, 229–244. [Google Scholar] [CrossRef] [Green Version]
  50. Viebahn, P.; Vallentin, D.; Höller, S. Integrated assessment of carbon capture and storage (CCS) in South Africa’s power sector. Energies 2015, 8, 14380–14406. [Google Scholar] [CrossRef] [Green Version]
  51. Gleick, P.H. Water and Energy. Annu. Rev. Energy Environ. 1994, 19, 267–299. [Google Scholar] [CrossRef]
  52. Zhang, Y.; Fang, J.; Wang, S.; Yao, H. Energy-water nexus in electricity trade network: A case study of interprovincial electricity trade in China. Appl. Energy 2020, 257, 113685. [Google Scholar] [CrossRef]
  53. World Economic Forum Water Initiative. Water Security: The Water-Food-Energy-Climate Nexus; Island Pres: Washington, DC, USA, 2012. [Google Scholar]
  54. Cui, Q.; He, L.; Han, G.; Chen, H.; Cao, J. Review on climate and water resource implications of reducing renewable power curtailment in China: A nexus perspective. Appl. Energy 2020, 267, 115114. [Google Scholar] [CrossRef]
  55. Chen, C.; Yu, L.; Zeng, X.; Huang, G.; Li, Y. Planning an Energy--Water--Environment Nexus System in Coal-Dependent Regions under Uncertainties. Energies 2020, 13, 208. [Google Scholar] [CrossRef] [Green Version]
  56. Amjath-Babu, T.S.; Sharma, B.; Brouwer, R.; Rasul, G.; Wahid, S.M.; Neupane, N.; Bhattarai, U.; Sieber, S. Integrated modelling of the impacts of hydropower projects on the water-food-energy nexus in a transboundary Himalayan river basin. Appl. Energy 2019, 239, 494–503. [Google Scholar] [CrossRef]
  57. Chang, Y.; Li, G.; Yao, Y.; Zhang, L.; Yu, C. Quantifying the water-energy-food nexus: Current status and trends. Energies 2016, 9, 65. [Google Scholar] [CrossRef] [Green Version]
  58. Price, J.; Zeyringer, M.; Konadu, D.; Sobral Mourão, Z.; Moore, A.; Sharp, E. Low carbon electricity systems for Great Britain in 2050: An energy-land-water perspective. Appl. Energy 2018, 228, 928–941. [Google Scholar] [CrossRef]
  59. Venghaus, S.; Märker, C.; Dieken, S.; Siekmann, F. Linking Environmental Policy Integration and the Water-Energy-Land-(Food-) Nexus: A Review of the European Union’s Energy, Water, and Agricultural Policies. Energies 2019, 12, 4446. [Google Scholar] [CrossRef] [Green Version]
  60. Yan, J.; Zhang, Z. Carbon Capture, Utilization and Storage (CCUS). Appl. Energy 2019, 235, 1289–1299. [Google Scholar] [CrossRef]
  61. Fan, J.-L.; Xu, M.; Li, F.; Yang, L.; Zhang, X. Carbon capture and storage (CCS) retrofit potential of coal-fired power plants in China: The technology lock-in and cost optimization perspective. Appl. Energy 2018, 229, 326–334. [Google Scholar] [CrossRef]
  62. Hammond, G.P.; Spargo, J. The prospects for coal-fired power plants with carbon capture and storage: A UK perspective. Energy Convers. Manag. 2014, 86, 476–489. [Google Scholar] [CrossRef] [Green Version]
  63. Wang, Y.; Nian, V.; Li, H.; Yuan, J. Life cycle analysis of integrated gasification combined cycle power generation in the context of Southeast Asia. Energies 2018, 11, 1587. [Google Scholar] [CrossRef] [Green Version]
  64. Viebahn, P.; Nitsch, J.; Fischedick, M.; Esken, A.; Schüwer, D.; Supersberger, N.; Zuberbühler, U.; Edenhofer, O. Comparison of carbon capture and storage with renewable energy technologies regarding structural, economic, and ecological aspects in Germany. Int. J. Greenh. Gas. Control. 2007, 1, 121–133. [Google Scholar] [CrossRef]
  65. Meldrum, J.; Nettles-Anderson, S.; Heath, G.; Macknick, J. Life cycle water use for electricity generation: A review and harmonization of literature estimates. Environ. Res. Lett. 2013, 8, 15031. [Google Scholar] [CrossRef]
  66. Jin, Y.; Behrens, P.; Tukker, A.; Scherer, L. Water use of electricity technologies: A global meta-analysis. Renew. Sustain. Energy Rev. 2019, 115, 109391. [Google Scholar] [CrossRef]
  67. Schmidt, T.S.; Beuse, M.; Zhang, X.; Steffen, B.; Schneider, S.F.; Pena-Bello, A.; Bauer, C.; Parra, D. Additional emissions and cost from storing electricity in stationary battery systems. Environ. Sci. Technol. 2019, 53, 3379–3390. [Google Scholar] [CrossRef]
  68. Rohatgi, A. WebPlotDigitizer, Version: 4.3. Available online: https://automeris.io/WebPlotDigitizer (accessed on 25 July 2020).
  69. Ricke, K.; Drouet, L.; Caldeira, K.; Tavoni, M. Country-level social cost of carbon. Nat. Clim. Chang. 2018, 8, 895–900. [Google Scholar] [CrossRef]
  70. IEA. Technology Roadmap: Carbon Capture and Storage; International Energy Agency: Paris, France, 2013. [Google Scholar]
  71. Udetanshu, B.P.; Khurana, S.; Nelson, D. Developing a Roadmap to a Flexible, Low-Carbon Indian Electricity System: Interim Findings; Climate Policy Initiative: New Delhi, India, 2019; Available online: https://www.climatepolicyinitiative.org/publication/developing-a-roadmap-to-a-flexible-low-carbon-indian-electricity-system-interim-findings/ (accessed on 30 December 2020).
  72. Tiewsoh, L.S.; Jirásek, J.; Sivek, M. Electricity generation in India: Present state, future outlook and policy implications. Energies 2019, 12, 1361. [Google Scholar] [CrossRef] [Green Version]
  73. Lawrenz, L.; Xiong, B.; Lorenz, L.; Krumm, A.; Hosenfeld, H.; Burandt, T.; Löffler, K.; Oei, P.-Y.; Von Hirschhausen, C. Exploring energy pathways for the low-carbon transformation in India—A model-based analysis. Energies 2018, 11, 3001. [Google Scholar] [CrossRef] [Green Version]
  74. TERI. Transitions in Indian Electricity Sector 2017–2030; The Energy and Resources Institute: New Delhi, India, 2017; Available online: https://www.teriin.org/files/transition-report/files/downloads/Transitions-in-Indian-Electricity-Sector_Report.pdf (accessed on 30 December 2020).
  75. Pachouri, R.; Spencer, T.; Renjith, G. Exploring Electricity Supply-Mix Scenarios to 2030; The Energy and Resources Institute: New Delhi, India, 2019; Available online: https://www.teriin.org/sites/default/files/2019-02/Exploring%20Electricity%20Supply-Mix%20Scenarios%20to%202030.pdf (accessed on 30 December 2020).
  76. CSTEP. Quality of Life for All: A Sustainable Development Framework for India’s Climate Policy; Center for Study of Science, Technology and Policy: Bengaluru, India, 2015; Available online: http://www.cstep.in/drupal/sites/default/files/2019-01/CSTEP_RR_Quality_of_Life_for_All_2015_technical_report.pdf (accessed on 30 December 2020).
  77. Ahluwalia, M.S.; Gupta, H.; Stern, N.H. A More Sustainable Energy Strategy for India; ICRIER: New Delhi, India, 2016; Available online: https://icrier.org/pdf/Working_Paper_328.pdf (accessed on 30 December 2020).
  78. Viebahn, P.; Höller, S.; Vallentin, D.; Liptow, H.; Villar, A. Future CCS implementation in India: A systemic and long-term analysis. Energy Procedia 2011, 4, 2708–2715. [Google Scholar] [CrossRef] [Green Version]
  79. Dooley, J.J.; Kim, S.H.; Edmonds, J.A.; Friedman, S.J.; Wise, M.A. A first-order global geological CO2-storage potential supply curve and its application in a global integrated assessment model. In Greenhouse Gas Control Technologies 7; Elsevier: Amsterdam, The Netherlands, 2005; pp. 573–581, Friedman, S.J. [Google Scholar]
  80. Singh, A.K.; Mendhe, V.A.; Garg, A. CO2 Storage Potential of Geologic Formations in India. In Proceedings of the 8th Greenhouse Gas Technology Conference, Trondheim, Norway, 19–22 June 2006. [Google Scholar]
  81. Holloway, S.; Garg, A.; Kapshe, M.; Deshpande, A.; Pracha, A.S.; Khan, S.R.; Mahmood, M.A.; Singh, T.N.; Kirk, K.L.; Gale, J. An assessment of the CO2 storage potential of the Indian subcontinent. Energy Procedia 2009, 1, 2607–2613. [Google Scholar] [CrossRef] [Green Version]
  82. GCCSI. The Global Status of CCS 2019; Global CCS Institute: Melbourne, Australia, 2019; Available online: https://www.globalccsinstitute.com/wp-content/uploads/2019/12/GCC_GLOBAL_STATUS_REPORT_2019.pdf (accessed on 30 December 2020).
  83. CEA. National Electricity Plan. (Volume I): Generation; Central Electricity Authority, Ministry of Power, Government of India: New Delhi, India, 2018. [Google Scholar]
  84. IEA. World Energy Outlook; International Energy Agency: Paris, France, 2018. [Google Scholar]
  85. CERC. Consultation Paper on Terms And Conditions of Tariff Regulations for Tariff Period. 1.4.2019 to 31.3.2024; Central Electricity Regulatory Commission, Government of India: New Delhi, India, 2018. Available online: http://cercind.gov.in/2018/draft_reg/AP.pdf (accessed on 30 December 2020).
  86. CSTEP. Benefit Cost Analysis of Emission Standards for Coal-based Thermal Power Plants in India; Center for Study of Science, Technology and Policy: Bengaluru, India, 2018; Available online: https://shaktifoundation.in/wp-content/uploads/2018/07/Benefit-cost-analysis-of-emission-standards-for-coal-based-thermal-power-plants-in-India-1.pdf (accessed on 30 December 2020).
  87. Vinca, A.; Rottoli, M.; Marangoni, G.; Tavoni, M. The role of carbon capture and storage electricity in attaining 1.5 and 2 °C. Int. J. Greenh. Gas. Control. 2018, 78, 148–159. [Google Scholar] [CrossRef] [Green Version]
  88. IEA. World Energy Outlook; International Energy Agency: Paris, France, 2016; Available online: https://www.oecd-ilibrary.org/energy/world-energy-outlook-2016_weo-2016-en (accessed on 30 December 2020).
  89. LAZARD. Lazard’s Levelized Cost of Energy Analysis—Version 13.0. 2019. Available online: https://www.lazard.com/media/451086/lazards-levelized-cost-of-energy-version-130-vf.pdf (accessed on 30 December 2020).
  90. Samadi, S. The social costs of electricity generation—Categorising different types of costs and evaluating their respective relevance. Energies 2017, 10, 356. [Google Scholar] [CrossRef] [Green Version]
  91. CPI. An Assessment of India’s Energy Choices: Managing India’s Renewable Energy Integration through Flexibility; Climate Policy Initiative: New Delhi, India, 2018; Available online: https://climatepolicyinitiative.org/wp-content/uploads/2018/05/Managing-Indias-Renewable-Energy-Integration-through-Flexibility-.pdf (accessed on 30 December 2020).
  92. Spencer, T.; Pachouri, R.; Renjith, G.; Vohra, S. Coal transition in India; The Energy and Resources Institute (TERI): New Delhi, India, 2018; Available online: https://www.climate-transparency.org/wp-content/uploads/2019/01/Coal-Transition-in-India.pdf (accessed on 30 December 2020).
  93. Mohan, R.R.; Dharmala, N.; Ananthakumar, M.R.; Kumar, P.; Bose, A. Greenhouse Gas. Emission Estimates from the Energy Sector in India at the Sub- National Level (Version/edition 2.0); GHG Platform India Report—CSTEP: New Delhi, India, 2019; Available online: http://www.ghgplatform-india.org/methodology-electricityenergy-sector (accessed on 30 December 2020).
  94. IEA. Cleaner Coal in China; International Energy Agency: Paris, France, 2009. [Google Scholar]
  95. Eggleston, S.; Buendia, L.; Miwa, K.; Ngara, T.; Tanabe, K. 2006 IPCC Guidelines for National Greenhouse Gas Inventories: Stationary Combustion; Institute for Global Environmental Strategies: Hayama, Japan, 2006; Volume 5. [Google Scholar]
  96. Samadi, S. The experience curve theory and its application in the field of electricity generation technologies-A literature review. Renew. Sustain. Energy Rev. 2018, 82, 2346–2364. [Google Scholar] [CrossRef] [Green Version]
  97. TNERC. Order on Generic Tariff for Wind Power and Related Issues; Tamil Nadu Electricity Regulatory Commission: Chennai, India, 2018; Available online: http://www.tnerc.gov.in/orders/TariffOrder2009/2018/Wind-6of2018.pdf (accessed on 30 December 2020).
  98. TNERC. Order on Generic Tariff for Solar Power and Related Issues; Tamil Nadu Electricity Regulatory Commission: Chennai, India, 2019. Available online: http://www.tnerc.gov.in/orders/Tariff%20Order%202009/2019/Solar-5-29-03-2019.pdf (accessed on 30 December 2020).
  99. KERC. Determination of Tariff in Respect of Solar Power Projects (Including Solar Rooftop Photovoltaic Projects) for FY20; Karnataka Electricity Regulatory Commission: Bengaluru, India, 2019; Available online: https://kredlinfo.in/Tariff/Determination of tariff in respect of SOlar Power Projects (including Solar Rooftop Photovoltaic Projects for FY20).pdf (accessed on 30 December 2020).
  100. KERC. Generic Tariff for Wind Power Projects 2019; Karnataka Electricity Regulatory Commission: Bengaluru, India, 2019; Available online: https://karunadu.karnataka.gov.in/kerc/Miscellaneous Orders 2018/Generic Tariff Order/Generic-Tariff-Order-for-WindPowerProject-2019.pdf (accessed on 30 December 2020).
  101. Chaurasiya, P.K.; Warudkar, V.; Ahmed, S. Wind energy development and policy in India: A review. Energy Strateg. Rev. 2019, 24, 342–357. [Google Scholar] [CrossRef]
  102. Naqvi, A.I.; Saxena, P. Unravelling India’s 2.44 rupee solar tariff: Refined sensibility or a churlish audacity?; PVTECH. July 2018. Available online: https://www.pv-tech.org/guest-blog/unravelling-indias-2.44-rupee-solar-tariff-refined-sensibility-or-a-churlis (accessed on 30 December 2020).
  103. CERC. Terms and Conditions for Tariff determination from Renewable Energy Sources; Central Electricity Regulatory Commission, Government of India: New Delhi, India, 2016. Available online: http://cercind.gov.in/2016/orders/sm_3.pdf (accessed on 30 December 2020).
  104. Cuéllar-Franca, R.M.; Azapagic, A. Carbon capture, storage and utilisation technologies: A critical analysis and comparison of their life cycle environmental impacts. J. CO2 Util. 2015, 9, 82–102. [Google Scholar] [CrossRef]
  105. Petrescu, L.; Bonalumi, D.; Valenti, G.; Cormos, A.-M.; Cormos, C.-C. Life Cycle Assessment for supercritical pulverized coal power plants with post-combustion carbon capture and storage. J. Clean. Prod. 2017, 157, 10–21. [Google Scholar] [CrossRef]
  106. Pehnt, M.; Henkel, J. Life cycle assessment of carbon dioxide capture and storage from lignite power plants. Int. J. Greenh. Gas. Control. 2009, 3, 49–66. [Google Scholar] [CrossRef]
  107. Odeh, N.A.; Cockerill, T.T. Life cycle GHG assessment of fossil fuel power plants with carbon capture and storage. Energy Policy 2008, 36, 367–380. [Google Scholar] [CrossRef]
  108. Korre, A.; Nie, Z.; Durucan, S. Life cycle modelling of fossil fuel power generation with post-combustion CO2 capture. Int. J. Greenh. Gas. Control. 2010, 4, 289–300. [Google Scholar] [CrossRef]
  109. Koornneef, J.; van Keulen, T.; Faaij, A.; Turkenburg, W. Life cycle assessment of a pulverized coal power plant with post-combustion capture, transport and storage of CO2. Int. J. Greenh. Gas Control. 2008, 2, 448–467. [Google Scholar] [CrossRef] [Green Version]
  110. Singh, B.; Strømman, A.H.; Hertwich, E.G. Comparative life cycle environmental assessment of CCS technologies. Int. J. Greenh. Gas. Control. 2011, 5, 911–921. [Google Scholar] [CrossRef]
  111. Viebahn, P. Life Cycle Assessment for Power Plants with CCS. In Efficient Carbon Capture for Coal Power Plants; Stolten, D., Scherer, V., Eds.; WILEY-VCH: Weinheim, Germany, 2011; pp. 83–109. ISBN 978-3-527-33002-7. [Google Scholar]
  112. Leccisi, E.; Raugei, M.; Fthenakis, V. The energy and environmental performance of ground-mounted photovoltaic systems—A timely update. Energies 2016, 9, 622. [Google Scholar] [CrossRef] [Green Version]
  113. Kadiyala, A.; Kommalapati, R.; Huque, Z. Characterization of the life cycle greenhouse gas emissions from wind electricity generation systems. Int. J. Energy Environ. Eng. 2017, 8, 55–64. [Google Scholar] [CrossRef] [Green Version]
  114. WRI. 3 Maps Explain India’s Growing Water Risks; World Resources Institute: Washington, DC, USA, 2015; Available online: https://www.wri.org/blog/2015/02/3-maps-explain-india-s-growing-water-risks (accessed on 3 June 2020).
  115. WRI. Over Heating: Financial Risks from Water Constraints on Power Generation in Asia; World Resources Institute: Washington, DC, USA, 2010; Available online: http://pdf.wri.org/over_heating_asia.pdf (accessed on 30 December 2020).
  116. Scott, C.A.; Sugg, Z.P. Global energy development and climate-induced water scarcity—Physical limits, sectoral constraints, and policy imperatives. Energies 2015, 8, 8211–8225. [Google Scholar] [CrossRef] [Green Version]
  117. CCO. Provisional Coal Statistics 2016–2017; Coal Controller’s Organisation, Ministry of Coal, Government of India: Kolkata, India, 2017. Available online: http://www.coalcontroller.gov.in/writereaddata/files/download/provisionalcoalstat/ProvisionalCoalStat2016-17.pdf (accessed on 30 December 2020).
  118. Chaturvedi, V.; Nagar-Koti, P.; Sugam, R.; Neog, K.; Hejazi, M. Implications of Shared Socio-Economic Pathways for India’s Long-Term Electricity Generation and Associated Water Demands; Council on Energy, Environment and Water: New Delhi, India, 2017; Available online: https://www.ceew.in/sites/default/files/CEEW-Implications-of-Shared-Socio-Economic-Pathways-for-India-Longterm_0.pdf (accessed on 30 December 2020).
  119. IRENA. Water Use in India’s Power Generation: Impact of Renewables and Improved Cooling Technologies to 2030; International Renewable Energy Agency: Masdar, Abu Dhabi, 2018; Available online: https://www.irena.org/-/media/Files/IRENA/Agency/Publication/2018/Jan/IRENAIndiapowerwater2018pdf.pdf (accessed on 30 December 2020).
  120. Ou, Y.; Zhai, H.; Rubin, E.S. Life cycle water use of coal-and natural-gas-fired power plants with and without carbon capture and storage. Int. J. Greenh. Gas. Control. 2016, 44, 249–261. [Google Scholar] [CrossRef]
  121. Zhai, H.; Rubin, E.S.; Versteeg, P.L. Water use at pulverized coal power plants with postcombustion carbon capture and storage. Environ. Sci. Technol. 2011, 45, 2479–2485. [Google Scholar] [CrossRef] [PubMed]
  122. Central Electricity Authority CEA. Growth of Electricity Sector in India from 1947–2019; Central Electricity Authority: New Delhi, India, 2019. [Google Scholar]
  123. Ramanathan, S.; Arora, S.; Trivedi, V. Coal-Based Power Norms: Where Do We Stand Today? Centre for Science and Environment (CSE): New Delhi, India, 2020. Available online: https://www.cseindia.org/coal-based-power-norms-coal-based-10125 (accessed on 30 December 2020).
  124. Rodell, M.; Velicogna, I.; Famiglietti, J.S. Satellite-based estimates of groundwater depletion in India. Nature 2009. [Google Scholar] [CrossRef] [PubMed] [Green Version]
  125. CWC. Water and Related Statistics; Central Water Commission, Ministry of Jal Shakti, Government of India: New Delhi, India, 2019; Available online: http://www.indiaenvironmentportal.org.in/files/file/water-and-related-statistics-2019.pdf (accessed on 30 December 2020).
  126. Barros, V.R.; Field, C.B.; Dokken, D.J.; Mastrandrea, M.D.; Mach, K.J.; Bilir, T.E.; Chatterjee, M.; Ebi, K.L.; Estrada, Y.O.; Genova, R.C.; et al. Climate Change 2014 Impacts, Adaptation, and Vulnerability Part. B: Regional Aspects: Working Group ii Contribution to the Fifth Assessment Report of the Intergovernmental Panel on Climate Change; Cambridge University Press: Cambridge, UK, 2014; ISBN 9781107415386. [Google Scholar]
  127. Yang, L.; Lv, H.; Jiang, D.; Fan, J.; Zhang, X.; He, W.; Zhou, J.; Wu, W. Whether CCS technologies will exacerbate the water crisis in China?—A full life-cycle analysis. Renew. Sustain. Energy Rev. 2020, 134, 110374. [Google Scholar] [CrossRef]
Figure 1. Integrated assessment methodology encompassing multiple energy sustainability assessment dimensions, including the methods and indicators used in this study.
Energies 14 00262 g001
Figure 2. Coal-CCS pathways 2050: (a) Capacity projections for Coal-CCS in India by 2050 (note: Energizing India [27] projection is for 2047); (b) Projections for CO2 storage demand in India by 2050.
Energies 14 00262 g002
Figure 3. Simple and Advanced LCOE Results: (a) Simple LCOE for coal-CCS, coal, solar PV and wind power sources from 2010 to 2050. The area-fill and bars show the low and high LCOE range; (b,c) Advanced LCOE estimations for the four power sources in 2030 and 2050 with breakdowns for LCOE, carbon costs and systems costs.
Energies 14 00262 g003
Figure 4. Sensitivity analyses: (a) The impact of carbon costs on the levelized costs of coal and coal-CCS in 2030 (mean values)—for coal-CCS, the three different trends show the additional effect of the carbon capture rate (90%/80%/70%); (b) The impact of coal fuel cost escalation rates on the LCOE projections of coal-CCS; note that the reductions in the LCOE are only due to technology learning rates and ‘M’ represents the mean coal fuel price trajectory assumed in this study; (c) Sensitivity of 2030 mean LCOE values to changes in overnight capital costs of coal-CCS—the three different trend lines for CCS indicate different cost overruns during power plant construction phase (5%/10%/20%); (d) Impact of CUF on the LCOE of coal based power plants. Note: The LCOE of solar PV and wind are kept constant at their 2030 mean estimates (with mean assumptions of 19% CUF for solar PV and 29% for wind); The blue dotted line in c and d indicate the mean LCOE values of coal-CCS estimated in this study.
Energies 14 00262 g004
Figure 5. (a) Life cycle GHG emissions and (b) Life cycle water consumption of coal, coal-CCS, solar PV and wind to generate 1 MWh of electricity.
Energies 14 00262 g005
Figure 6. (a) Comparative ratios between coal-CCS and a 70/30 solar PV/wind renewable energy mix (RE Mix) for water-climate-cost indicators; (b) Economic “operating space” for energy storage technologies by 2030.
Energies 14 00262 g006
Table 1. Review summary of the expected year of commercial availability of coal-CCS in India.
StudyYear of Commercial AvailabilityComments
IEA [70]2030 to 2040CCS technology roadmap study.
IEA [1,2]NoneCCS will only be feasible in India after being successfully deployed and achieving maturity in industrial countries.
Energizing India [27]Different scenarios:
2017–2027
Not clear; study lacks clarity and consistency.
IESS [28]Different scenarios:
2017–2032
Not clear; study lacks clarity and consistency.
Vishwanathan et al. [15]2 scenarios:
After 2020
After 2025
Not clear; it seems the authors refer to the year of installation of the first CCS projects, not the year of commercial availability.
Viebahn et al. [24]Not before 2030
3 scenarios:
2030/2035/2040
Considers 2030 as the base case.
Singh et al. [25]No mentionThe study assumes CCS deployment scenarios based on [28].
Shukla et al. [11]After 2030Not clear.
Greenpeace [29,30]Not applicableSuggests coal exit.
Table 2. A comprehensive overview of our integrated assessment results with respect to the seven chosen indicators.
No.IndicatorAssessmentNotes—See Text for Explanations
1Future Energy ScenariosNegativeCoal-CCS capacity projections in India’s future electricity scenarios are very conservative or the technology is ignored altogether.
2Carbon Storage PotentialDependsSystematic quantification and in-depth assessments of potential CO2 storage capacity available across geological reservoirs in the Indian subcontinent are not yet available.
Carbon Storage Demand (for Coal-CCS)PositiveOur cumulative CO2 storage demand estimates for coal-CCS scenarios up to 2050 fall within the good quality storage potential estimate quoted in the literature.
3Commercial AvailabilityDependsWe think it is still too early to predict the year of commercial availability of large-scale CCS for India’s coal power sector, even though we optimistically assume 2030 as the base year in our assessment.
4Levelized Costs (LCOE)NegativeCoal-CCS is very expensive in comparison to conventional coal and successful renewables; its LCOE is higher by a factor of 3 to 5 in comparison to renewables in 2030.
5Advanced Levelized Costs (aLCOE)DependsEven though carbon pricing makes coal-CCS competitive in relation to conventional coal power plants, it does not influence the lack of competitiveness of coal-CCS with respect to renewables.
6Climate FootprintDependsCoal-CCS might eventually act as a technology intervention to decarbonise the power sector if India follows a coal-dominant future pathway; however, its life cycle GHG emissions will still be higher by a factor of 8 to 15 in comparison to renewables.
7Water FootprintNegativeCoal-CCS has nearly twice the water footprint of conventional coal plants and consumes enormous amounts of water in comparison to renewables (20 to 900 times more).
Publisher’s Note: MDPI stays neutral with regard to jurisdictional claims in published maps and institutional affiliations.

