Abstract
This article presents the results of numerical and experimental studies on the impacts of the selected geometrical features of liquid solar collectors on their thermal efficiency. The experiments were carried out while meeting the requirements of the ISO 9806:2017 standard. Selected changes in the geometrical features were analysed by using fully functional prototypes of modified solar collectors. The correlations between the design and performance properties of the solar collectors were determined in accordance with the changes in the shape of the thermal efficiency curve.
1. Introduction
To date, in conjunction with the intensive development of energy systems, the use of renewable energy sources (RES) has increased significantly [1]. Modern heating systems are equipped with additional devices that allow the acquisition of solar energy, which contributes to gradually overcoming the energy limitations associated with the burning of fossil fuels [2]. This direction of changing the way of managing energy sources is a consequence of numerous geopolitical conditions related to the security and energy sovereignty of states [3,4]. However, the main motivation to tighten legislation on the exploitation of fossil fuels is to protect the environment from pollution. In Poland, a binding act regulating the problem of environmental protection, namely, the Regulation of the Minister of the Environment, was issued on 1 March 2018, to impose emission standards on certain types of installation and fuel combustion sources. In addition, the European Commission presented a set of documents referred to as the 2020 climate & energy package [5], the main goal of which was a 20% reduction in greenhouse gas emissions by 2020. The document also required EU member states to increase the use of energy from RES to 20% by 2020 and increase energy efficiency to reduce EU energy consumption by 20% by 2020 compared to the base year of 1990. After taking into account the criterion of equal efforts from the EU member states, Poland was offered the possibility to reduce emissions by 14% in 2020 compared to 2005 and to increase the use of energy from RES to 15% in 2020 [5].
New recommendations that extend beyond 2020 have been prepared by the Ecologic Institute as the EU climate policy for 2030. The European Commission has announced initial proposals for new targets and changes in some key schemes such as the Emissions Trading System (ETS). The status quo of EU climate and energy policies as well as current targets and recommendations may help to create a new package for the period up to 2030 [6].
Referencing the current targets and policies, climate and energy experts have recommended necessary improvements for the future towards 2030. A common guideline is to help ensure regulatory stability for investors and to coordinate EU countries’ actions [7]. This framework fosters a shift towards a low-carbon economy and the creation of an energy system that provides all users with affordable energy, increases the security of the energy supply in the EU, and reduces EU dependence on energy imports [5].
Solar energy, to which this article is devoted, is one form of renewable energy. Solar energy is widely used as support for central heating systems, domestic hot water systems (DHWS) and industrial heat processing, agriculture and drying applications. The report entitled “Vision of solar thermal energy development in Poland and action plan up to 2020” indicates that solar thermal energy is one of the fastest growing renewable energy sectors both in Poland and in the EU [8].
Technological advances in the energy sector have created the prospect of maintaining and even improving quality of life without adversely affecting human health and the planet. This potential is particularly salient with respect to halting climate change. Nevertheless, achieving this goal requires carbon neutrality. Emission neutrality was already mentioned in Article 4 of the Paris Agreement, which was adopted in 2015 and ratified by Poland in October 2016. According to these arrangements, the EU member states must seek a balance between greenhouse gas emissions and support for the natural environment [5].
Such a state of affairs has contributed to the technological development of energy systems and research activity regarding this subject [9]. One such research direction is correlated with ways to effectively utilize solar energy, which is accomplished through the implementation of new solutions and improvements in the efficiency of existing devices. Examples of such research have been presented in [10,11,12]. The research conducted to date has been associated with the modification of geometrical features; this approach for improving the efficiency of energy systems has been shown in [13,14]. A similar approach focused on improving the efficiency of solar collectors is presented in this paper.
2. Subject of the Study
The overwhelming majority of scientific research concerns high-temperature global horizontal irradiation (GHI) acquisition systems. Only a small number of publications are devoted to the efficiency of typical solar installations equipped with commonly used flat-plate solar collectors (FPCs). Moreover, there is no literature on the influence of individual FPC design features on their thermal efficiency characteristics, and experimental verification of simulation test results is necessary.
There is also a lack of information at the design stage needed to allow the approximate thermal efficiency of solar collectors to be estimated based on the amounts and types of materials planned for their construction. Therefore, data on product modifications are expected, the use of which will reduce production costs without significantly changing the original operating parameters. Information on the impacts of individual geometrical and structural features will also allow modifications to be applied [15]. The purpose of this article is therefore to assess the impacts of selected geometrical features on the heat exchange process in the flat-plate solar collector absorber.
The main goal of this research was to determine whether the geometrical features of the absorber system influence the thermal efficiency of the FPC. An analysis of the current status of this issue [16] and the results of previous work allow the formulation of the following hypotheses:
Hypothesis 1 (H1).
There are geometrical features of the absorber system with which the solar collector will achieve a high thermal efficiency for a wide range of thermal efficiency characteristics.
Hypothesis 2 (H2).
There are constructional variants of the absorber system whose production cost does not change while maintaining a high thermal efficiency.
To achieve these research goals, a test stand was built to measure the operational parameters of solar collectors in accordance with the requirements of the PN-EN ISO 9806:2017 standard [17]. This document defines the test methods for assessing the durability, reliability, safety and thermal characteristics of liquid solar thermal collectors. These test methods were used to create the measurement procedures in laboratory tests, and these procedures apply to all types of liquid solar thermal collectors while meeting the safety requirements. However, these procedures do not cover the electrical safety or other specific properties related directly to the generation of electricity [18].
3. Experimental Setup
The test stand consisted of a hydraulic system for stabilizing the parameters of the working medium, an external measurement platform, a solar radiation simulator, and a measurement data acquisition system. The hydraulic system diagram is shown in Figure 1.
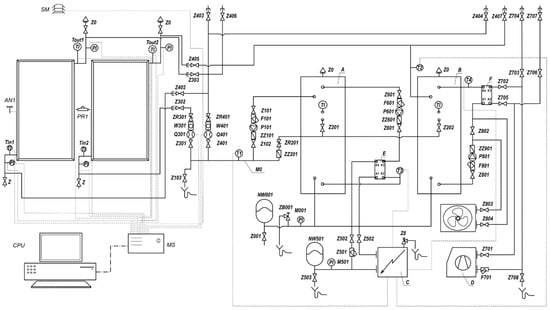
Figure 1.
Diagram of the hydraulic system.
The hydraulic structure of the system can be divided into three cooperating liquid circuits, i.e., the main circuit of the working medium and two auxiliary circuits for heating and cooling. The cooling auxiliary circuit is used to remove heat energy from the system accumulated by the solar collectors and circulation pumps. This circuit includes a compressor water cooler (C) with an internal tank capacity of 80 L and a cooling capacity of 4.1 kW. The refrigerator has a built-in rotary pump that allows the liquid to be pumped through the plate heat exchanger (E). The auxiliary heating circuit is equipped with an electric boiler (D) with a heating power of 21 kW. This circuit allows the operating fluid temperature in the system to be raised to the value required for the collector supply temperature. The medium flow in the heating circuit is forced by the rotary pump, which pumps the heated liquid through the heat exchanger (F). The auxiliary heating circuit is a closed circuit protected by a 3 bar (Z8) safety valve and a 2 dm3 (NW501) expansion vessel.
The main circulation circuit of the working medium is equipped with two water reservoirs, A and B, with a total capacity of 400 dm3 inside which the working medium is stabilized. The storage tanks cooperate with the heat exchangers (E and F) within the heating and cooling circuits. The flow of the working medium through the solar collectors is forced by a rotary pump (P101), which pumps the liquid to the bus (MO) and flow meters. Depending on the degree of opening of the control valves (ZR301 and ZR401), the working liquid is pumped to the collectors through the flow meters (Q301 and Q401). Excess liquid (P101) is drained through the valve bypass (ZR201) into the storage tanks. The main circuit cooperates with an outdoor platform for solar collector testing under natural conditions. The outdoor platform consists of a rotary column mounted on a concrete base, which allows the independent testing of two solar collectors (Figure 2). The rotary column allows the tilt angle to be manually adjusted in the range of with respect to the horizontal. The solar collectors are connected to the system using flexible water lines and hydraulic connections with metal-to-metal sealing clamps. The connections are equipped with four-wire RTD-type temperature sensors (PT100) and piezoresistive pressure transducers (DMP3A3, PI). Fluid temperature sensors are located in the connections to measure the temperature of the liquid after mixing in the mixing elbows [17].
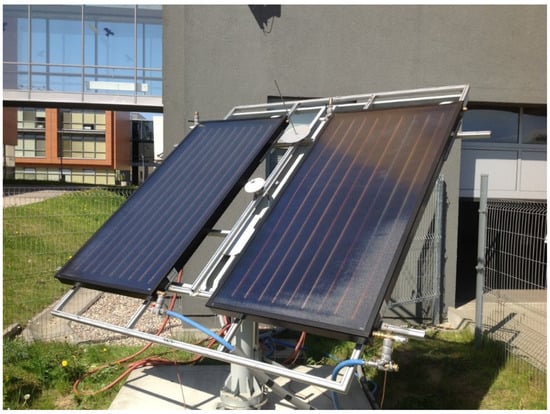
Figure 2.
Outdoor platform with solar flat-plate collectors.
Before starting the measurements, for each test, the temperature sensors were calibrated. To calibrate the working fluid temperature sensors, a thermally insulated water tank with a heating system and a stirrer was employed. Calibration was performed to correct the indications of the PT100 resistance sensors, which was determined based on the indications of a set of reference mercury thermometers with an accuracy of 0.1 K. Corrections were made for 10 liquid temperature points in the tank within a range of 5–95 °C. Based on the temperatures determined with the thermometers, the reference characteristics of the PT100 resistance transducers as a function of temperature were determined [19].
The wind speed was measured using a cranial anemometer (AN1). The anemometer was placed on the collector mounting frame in a manner enabling the measurement of the wind speed on the collector aperture surface. During outdoor tests, the ambient temperature was measured using a PT100 resistive temperature sensor (SM) embedded in a ventilated interior housing. The sensor was attached to the outer wall of the building at a distance of 2 m from the collector mounting frame. For testing solar collectors under laboratory conditions, a solar radiation simulator was used (Figure 3). The simulator consists of a construction on wheels connected to a cooled emission panel with a variable angle of inclination. The emission panel consists of 28 metal halide lamps with a power of 1 kW each embedded in specially designed aluminium reflectors. The lamps are operated by ballast electronic stabilizing discharges with a power control function using the RS485 serial transmission protocol.
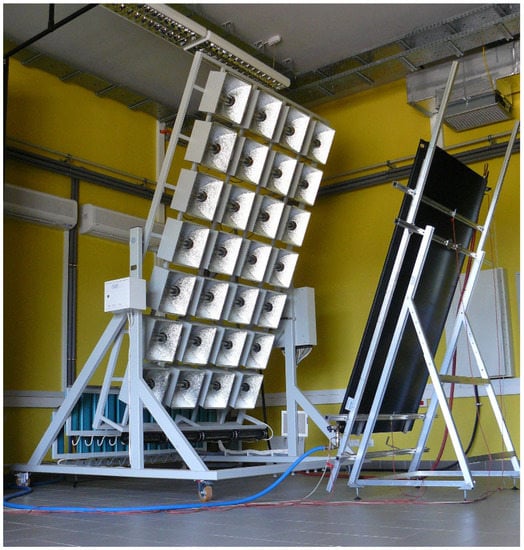
Figure 3.
Solar radiation simulator.
4. Numerical Modeling of the Photothermal Conversion Process
Numerical modeling is an integral part of current design processes. Modeling allows the design of new prototype solutions in the virtual domain without incurring the costs of expensive experimental work. For more complex problems, more than one numerical modeling procedure is expected [20]. In this work, research was carried out on the impact of changing the geometrical structure of the absorber system on the shape of the collector’s heat efficiency curve using two types of numerical modeling methods. The first and most commonly used modeling method for heat transfer in a solar collector is the computational fluid dynamics (CFD) technique based on the finite volume method (FVM) [21,22]. The second method presented in this work is the spatially distributed character (D-C) modeling method, characterized by a simple form of heat balance equations [23,24].
The CFD method consists of creating a virtual geometry of the examined object and subjecting it to spatial discretization using Ansys Fluent simulation software. The next step is to define the boundary conditions, initial conditions and interactions between individual computational domains [25]. Then, the mass, momentum, and energy balances are calculated according to the following formulas:
Mass conservation equation:
where is the working fluid density and is the working fluid particle velocity [7].
Momentum conservation equation:
where is the thermodynamic pressure, is the Kronecker delta function, represents the components of the stream of viscous stresses, and is the mass force of gravity [26].
Energy conservation equation:
where is the sum of the internal energy and kinetic energy and is the molecular heat flux [26].
The geometric model of the solar collectors developed for CFD calculations was divided into domains of the absorbing plate of the working pipes and the working medium (Figure 4). The division into finite elements was carried out with the use of a tool for creating a non-structural grid. A list of the parameters of the discretization grid is presented in Table 1.
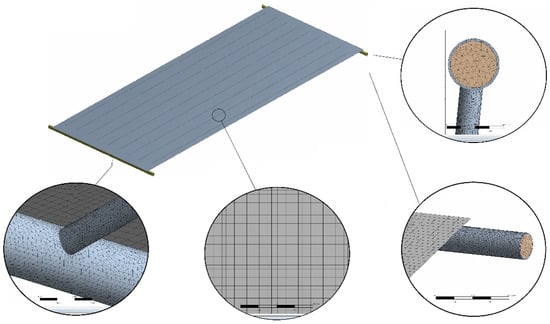
Figure 4.
Mesh setup for the solar collector model.

Table 1.
Mesh parameters for the solar collector absorber system.
To solve the system of CFD equations, a pressure-based segregated solver was used. This method relies on solving the momentum equations to obtain an approximate velocity field and then making pressure corrections to satisfy the mass equation. After applying the corrections to the pressure equation, additional balance equations are calculated—in this case, the energy equation.
Due to the long computation time of the CFD calculation procedure during the analysis of changes in the geometry of the examined object, a calculation method based on the D-C model was used. The example of D-C modelling is presented in [27] as a distributed power grid model. As in the case of the D-C method, the characteristics of the model nodes allow for a better representation of complex energy systems. It is worth mentioning that distributed methods, e.g., the distributed double-Newton descent (DDND) method, show great potential in terms of optimization. Through the possibility of asymptotic convergence to global extremes. In addition, distributed modelling allows for faster convergence of results [28].
The basic assumption of this method is to formulate only the energy balance equations for the main components of the solar collectors (i.e., the absorber plate, flow pipes and working fluid) in discrete form [29].
The first set of equations concerns the balance of the energy flux of the absorber plate. The equations include heat conduction, heat losses, and absorbed solar energy (Figure 5).
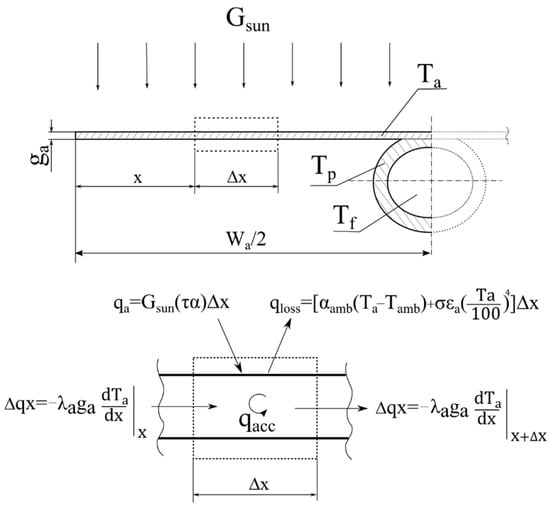
Figure 5.
Energy balance of the absorber plate.
The total amount of heat energy generated in the volume of the solar absorber plate is described as a sum of heat losses, heat converted from solar radiation and spatial heat conduction into the working pipes.
where is the heat loss coefficient determined by the experiment and is calculated as follows:
The second equation is based on the energy balance for the flow pipes, which are the transitional elements between the absorber plate and working fluid (Figure 6).
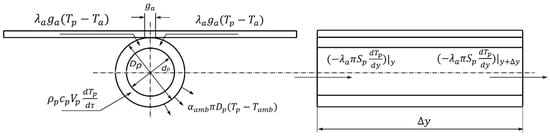
Figure 6.
The energy balance of the flow pipes.
The heat energy balance equation for the flow pipes is formulated as the sum of the heat flux generated in the pipe volume, the heat loss fluxes, the heat transferred from the absorber plate and heat conduction in the flow direction.
The final part of the model was created based on the heat balance for the working fluid. As shown in Figure 7. the temperature gradient of the working fluid is taken into account only in the flow direction. This approach allows us to obtain a satisfactory convergence level with a high computation speed.
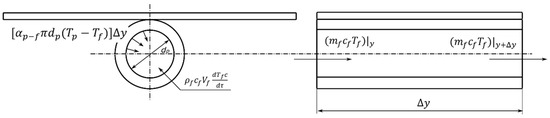
Figure 7.
Energy balance of the working fluid.
Similar to the previous components of the solar collector, the heat balance for the working fluid was formulated as follows:
The heat transfer coefficient for the contact area between the working fluid and working channel was calculated based on the Nusselt number [30].
where
The coefficients in Equation (9) were chosen based on the results presented in [30].
D-C modelling is an effective method for achieving high convergence in complex energy systems simulations [31]. In contrast to the CFD numerical approximation, the D-C method requires less time and computing power. The result of CFD model calculations, however, significant supplements the analysis performed by the D-C method for properly interpreting the experimental test results [32].
The advanced numerical models can be effectively implemented in the MATLAB environment [33]. This work presents the use of this tool to simulate spatially distributed heat transfer process.
5. Results
To assess the impacts of the geometrical parameters of solar collectors on their thermal efficiency curve, the numerical models presented in this work were used. The modifications of the geometrical features were chosen based on the procedure for identifying significant parameters shown in [34]. On the basis of numerical and experimental studies, three types of efficiency curve shape responses were defined: changes in the absorber thickness over the entire range of reduced temperature differences ; changes in the spacing and number of working pipes for the initial range of ; and changes in the efficiency relative to the horizontal axis for the internal diameter of the working channel.
The parameters shaping the thermal efficiency in the initial range of the efficiency characteristics include the modifications of the spacing and number of working pipes used in the system. Numerical studies have shown that increasing the number of pipes will improve the efficiency in the area of low values. The correlation between the thermal efficiency and the number of working pipes calculated using the D-C model is presented in Figure 8.
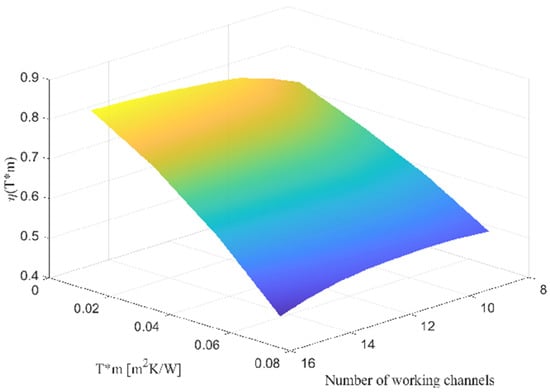
Figure 8.
Characteristic curve of as a function of the number of working pipes.
The same virtual prototypes were analyzed using the CFD method. For each of them, a geometric model was developed, which was discretized and calculated using the CFD solver. This allowed to confirm satisfactory convergence of both simulation methods.
To experimentally verify the numerical simulations, two physiacal prototypes of solar collectors were manufactured using the same technological process as a standard solar collector. During the experimental test, the prototypes (with 11 and 12 pipes) were examined in comparison with a standard collector (9 pipes). The results are presented in Figure 9.
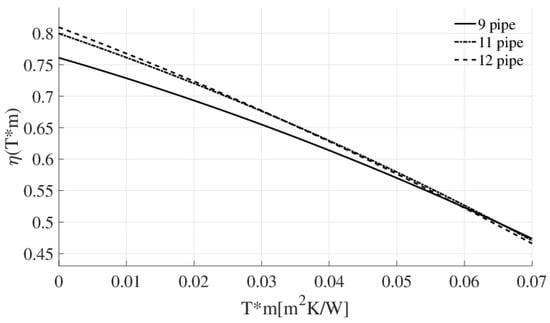
Figure 9.
Experimental verification of the correlation between the changes in the thermal efficiency and the number of working pipes in the solar collector.
To analyze the pipe spacing, the CFD model was used. A detailed geometry of the absorber plate and piping system was created. The results of the simulation indicated the possibility of transferring heat energy from the horizontal edge zone of the absorber plate by increasing the spacing between working pipes. The results of the CFD simulations are shown in Figure 10.
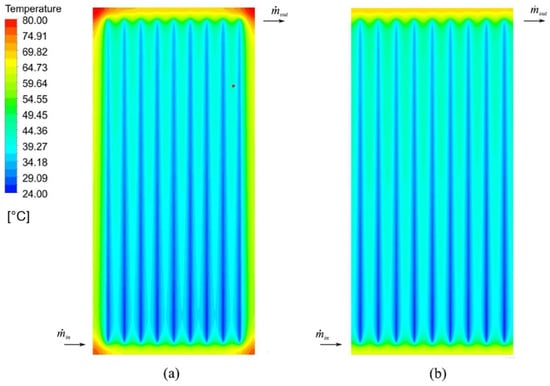
Figure 10.
Temperature distribution on the surface of the solar collector absorber plate. (a) Standard solar collector; (b) solar collector with a modified spacing.
To effectively transmit heat energy from the edge zones of the absorber plate, a 110 mm spacing between working pipes was proposed.To experimentally verify this modification, a prototype solar collector with the modified pipe spacing was manufactured. As before, all the geometrical details and technological processes were the same as those of the standard solar collector (with a 100 mm spacing).The experimental results, presented in Figure 11, confirm an increase in efficiency in the low range of .
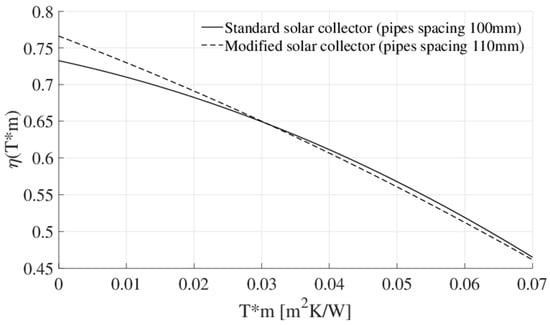
Figure 11.
Comparison between the efficiency curves of a standard collector and a modified collector with an increased spacing between working pipes.
The next geometrical feature taken into the thermal efficiency analysis was the thickness of the absorber plate. Using the simulation models, the correlation between the absorber plate thickness and thermal efficiency for a copper plate material was determined (Figure 12). As shown in this figure, an increase in the absorber plate thickness will increase the efficiency curve.
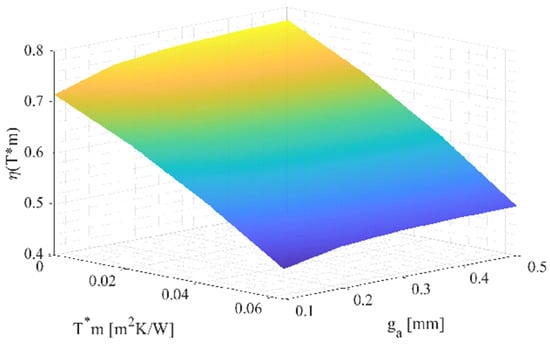
Figure 12.
Characteristic thermal efficiency curve as a function of the absorber plate thickness.
The results obtained from the simulations indicate a full-range efficiency curve response. For the purpose of experimentally verifying this statement, two prototypes of solar collectors with different absorber plate thicknesses (0.15 mm and 0.3 mm) were compared with the standard solar collector (0.2 mm). All tested solar collectors were copper-type absorber plates and were manufactured with the same manufacturing process. The results of the experimental tests are shown in Figure 13.
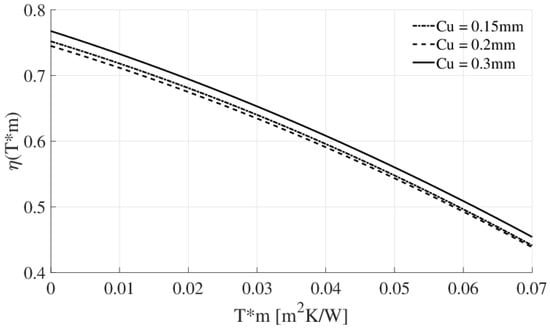
Figure 13.
Experimental verification of the correlation between the thermal efficiency and absorber plate thickness.
As shown in Figure 13, an increase in the absorber plate thickness improves the thermal efficiency over the full range of characteristics. The highest increase in thermal efficiency was observed in the initial range of values.
The final simulated geometrical modification was performed for the working pipe diameter . With the help of the D-C and CFD models, the surface was generated (Figure 14).
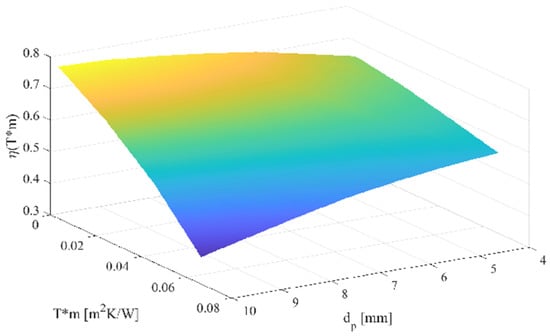
Figure 14.
Characteristic thermal efficiency curve as a function of the working pipe diameter.
The experimental verification of the D-C simulations of the pipe diameter modification required the creation of another prototype of solar collectors with the modified working pipe diameter. The experimental test was performed using a prototype with a working pipe diameter of 6 mm in comparison with standard 8 mm diameter pipes. The characteristics of both tested solar collectors are shown in Figure 15.
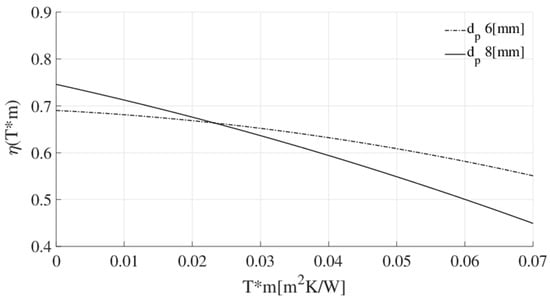
Figure 15.
Experimental verification of the correlation between the thermal efficiency and working pipe diameter.
The results of the simulation and experimental studies regarding the modified diameter of working pipes in the absorber system indicate the possibility of improving the thermal efficiency in the range of high values. It was observed that with a decrease in the diameter of the working pipes, the stream of heat losses decreased, which resulted in higher efficiency in the high range of thermal efficiency .
A characteristic common feature of these parameters is their direct impact on the overall amount of absorber material, which can be expressed in units of mass. The exception is the proposed modification of the working pipe spacing, which improves efficiency without having to increase the overall weight of the absorber.
6. Conclusions
Experimental tests were carried out entirely at the Laboratory of Solar Heating Systems at the Koszalin University of Technology. The developed test system, procedures and measurement collection equipment met the requirements of the European research standard PN-EN ISO 9806:2017-12. Fifteen fully functional flat-plate solar collectors were used to conduct experimental research. The group of tested collectors, including three standard collectors and twelve collectors with modified structures, were created on behalf of the company KOSPEL S.A. based on the provided construction guidelines. The prototype solar collectors submitted for testing, according to the authors’ recommendation, were made using the devices and technological operations used in serial production of the KSH-2.0 reference model while taking into account the required modifications of geometric features. Measurements of the modified solar collectors were carried out simultaneously with those of the reference collector, owing to which the influences of variable parameters were constrained in individual test samples. To ensure adequate repeatability of the tests inside the laboratory, these measurements were preceded by a temperature sensor calibration, and the density and distribution of artificial radiation were determined under a solar simulator. Based on the results obtained from these simulation and experimental studies, the validity of the assumed research hypotheses was confirmed. It was demonstrated that it is possible to shape the thermal efficiency curve of flat-plate solar collectors by interfering with their geometrical and structural parameters. Furthermore, it is possible to improve the thermal efficiency of these devices without increasing production costs. An important utilitarian conclusion from this research is a method for identifying the manner in which individual geometrical features influence the thermal efficiency . The considered modifications of the geometrical parameters were divided into those that significantly affect the performance characteristics in both the full range and the initial range and the degree of the thermal efficiency curve slope relative to the horizontal axis. Shaping the thermal efficiency curve in the full range of was observed upon modifying the absorber plate thickness (Figure 13). Modification of the efficiency curve in the initial range of was achieved by changing the number of working pipes and their spacing (Figure 9 and Figure 11). The geometric parameter that shaped the slope of the thermal efficiency curve was the diameter of the working pipes (Figure 15).
Both numerical simulations and experimental results showed that the effects of the considered geometrical feature modifications on the thermal efficiency curve can be combined. Various variants with multiple geometrical feature modifications allowed more advanced thermal efficiency curves to be shaped. For example, a higher thermal efficiency in the full range of can be obtained by simultaneously increasing the number of working pipes and decreasing the pipe diameter.
The comprehensive analysis of the heat exchange processes in flat-plate solar collectors (FPCs) using computer simulation techniques is the basis for modern methods of designing solar heating systems. The obtained results confirm that it is possible to develop numerical models that map the relationships between the geometrical and structural features of solar collectors and their thermal efficiency and flow parameters.
In addition, the developed numerical models can be used to carry out economic analyses taking into account the current prices of raw materials and manufacturing costs in the mass production of solar collectors [5].
Author Contributions
W.K., Conceptualization of this study, methodology; K.K., Conceptualization of this study, methodology, software, original draft preparation; P.Z., Methodology, software, data curation, original draft preparation; N.C.-G., Data analysis and interpretation. P.P., Conceived and designed the analysis. All authors have read and agreed to the published version of the manuscript.
Funding
This research received no external funding.
Institutional Review Board Statement
The study did not require ethical approval.
Informed Consent Statement
Informed consent was obtained from all subjects involved in the study.
Data Availability Statement
Data available in a publicly accessible repository.
Conflicts of Interest
The authors declare no conflict of interest.
Nomenclature
| RES | renewable energy sources |
| GHI | global horizontal irradiance, W/m2 |
| FPC | flat-plate collector |
| ETS | emissions trading system |
| DHWS | domestic hot water systems |
| FVM | finite volume method |
| CFD | computational fluid dynamics |
| D-C | distributed character |
| η | thermal efficiency |
| SM | resistive temperature sensor |
| A | collector area, m2 |
| FR | collector heat removal factor |
| Tc | collector average temperature, °C |
| Tini | inlet fluid temperature, °C |
| Tout | outlet fluid temperature, °C |
| Tamb | ambient temperature, °C |
| UL | collector overall heat loss coefficient, W/(m2K) |
| Qu | useful collector energy gain, W |
| τα | transmittance-absorptance product |
| ρ | density, kg/m3 |
| c | specific heat capacity, J/(kgK) |
| V | volume, m3 |
| τ | time, s |
| T | temperatures, K |
| δ | Boltzmann constant, (m2kg)/(s2K) |
| ε | emissivity coefficient |
| Gsun | global solar irradiation, W/m2 |
| S | internal cross-section area, m2 |
| λ | conduction coefficient, W/(mK) |
| mf | mass flow rate, kg/s |
| Subscripts | |
| a | absorber |
| p | pipe |
| f | fluid |
References
- Jurasz, J.; Canales, F.A.; Kies, A.; Guezgouz, M.; Beluco, A. A review on the complementarity of renewable energy sources: Concept, metrics, application and future research directions. Sol. Energy 2020, 195, 703–724. [Google Scholar] [CrossRef]
- Stolarski, M.J.; Warminski, K.; Krzyzaniak, M.; Olba-Ziety, E.; Stachowicz, P. Energy consumption and heating costs for a detached house over a12-year period—Renewable fuels versus fossil fuels. Energy 2020, 204, 117952. [Google Scholar] [CrossRef]
- EESC. Opinion of the European Economic and Social Committee on “The social implications of transport and energy developments”. Off. J. Eur. Union C 2009, 175, 43–49. [Google Scholar]
- Ehsanul, K.; Pawan, K.; Sandeep, K.; Adedeji, A.A.; Ki-Hyun, K. Solar energy: Potential and future prospects. Renew. Sustain. Energy Rev. 2018, 82, 894–900. [Google Scholar]
- European-Commission. A Clean Planet for All. A European Long-Term Strategic Vision for a Prosperous, Modern, Competitive and Climate Neutral Economy. Off. J. Eur. Union 2018, 773, 1–25. [Google Scholar]
- European-Commission. 2030 Climate and Energy Goals for a Competitive, Secure and Low-Carbon EU Economy; European Commision Press Release: Brussels, Belgium, 2014. [Google Scholar]
- Kryzia, D.; Gawlik, L.; PepĹ‚owska, M. Conditions for development of clean technologies of energy generation from fossil fuels. Energy Policy J. 2016, 19, 63–74. [Google Scholar]
- Gryciuk, M.; Kwasiborski, M.; Wiecka, A. Report Synthesis. Vision of Solar Thermal Energy Development in Poland and Action Plan up to 2020; Institute For Renewable Energy (IEO): Warsaw, Poland, 2009. [Google Scholar]
- Haikarainen, C.; Pettersson, F.; Saxen, H. Optimized phasing of the development of a regional energy system. Energy 2020, 206, 118129. [Google Scholar] [CrossRef]
- Kim, H.; Ham, J.; Park, C.; Cho, H. Theoretical investigation of the efficiency of a U-tube solar collector using various nanofluids. Energy 2016, 94, 497–507. [Google Scholar] [CrossRef]
- Luo, Y.; Andresen, J.; Clarke, H.; Rajendra, M.; Maroto-Valer, M. A decision support system for waste heat recovery and energy efficiency improvement in data centres. Appl. Energy 2019, 250, 1217–1224. [Google Scholar] [CrossRef]
- Wang, Z.; Wang, S.; Ren, J.; Meng, X.; Wu, Y. Model experiment study for ventilation performance improvement of the Wind Energy Fan system by optimizing wind turbines. Sustain. Cities Soc. 2020, 60, 102212. [Google Scholar] [CrossRef]
- Mehdipour, R.; Baniamerian, Z.; Golzardi, S.; Sohel-Murshed, S.M. Geometry modification of solar collector to improve performance of solar chimneys. Renew. Energy 2020, 162, 160–170. [Google Scholar] [CrossRef]
- Tajdaran, S.; Kendrick, C.; Hopkins, E.; Bonatesta, F. Geometrical optimisation of Transpired Solar Collectors using design of experiments and computational fluid dynamics. Sol. Energy 2020, 197, 527–537. [Google Scholar] [CrossRef]
- Kaminski, K.; Znaczko, P.; Lyczko, M.; Krolikowski, T.; Knitter, R. Operational properties investigation of the flat-plate solar collector with poliuretane foam insulation. Procedia Comput. Sci. 2019, 159, 1730–1739. [Google Scholar] [CrossRef]
- Verma, S.K.; Gupta, N.K.; Rakshit, D. A comprehensive analysis on advances in application of solar collectors considering design, process and working fluid parameters for solar to thermal conversion. Sol. Energy 2020, 208, 1114–1150. [Google Scholar] [CrossRef]
- Solar Energy. Solar Thermal Collectors—Test Methods. Approach. Standard; European Committee for Standardizations: Brussels, Belgium, 2017. [Google Scholar]
- Kung-Ming, C.; Chia-Chun, C.; Keh-Chin, C. Effect of diffuse solar radiation on the thermal performance of solar collectors. Case Stud. Therm. Eng. 2018, 12, 759–764. [Google Scholar]
- Rongshan, W.; Kui, O.; Xiaotian, B.; Xiong, G.; Chuandong, C. High-precision smart calibration system for temperature sensors. Sens. Actuators A Phys. 2019, 297, 11156. [Google Scholar]
- Schweiger, H.F.; Fabris, C.; Ausweger, G.; Hauser, L. Examples of successful numerical modelling of complex geotechnical problems. Innov. Infrastruct. Solut. 2019, 4, 2. [Google Scholar] [CrossRef]
- Selmi, M.; Al-Khawaja, M.; Marafia, A. Validation of CFD simulation for flat plate solar energy collector. Renew. Energy 2008, 33, 383–387. [Google Scholar] [CrossRef]
- Turgut, O.; Onur, N. Three dimensional numerical and experimental study of forced convection heat transfer on solar collector surface. Int. Commun. Heat Mass Transf. 2009, 36, 274–279. [Google Scholar] [CrossRef]
- Olivaz, A.; Costa, M.; Perez Segarra, C.D. Numerical simulation of solar collectors: The effect of nonuniform and nonsteady state of the boundary conditions. Sol. Energy 1991, 47, 359–373. [Google Scholar] [CrossRef]
- Quezada-Garcia, S.; Sanchez-Mora, H.; Polo-Labarrios, M.A.; Cazares-Ramirez, R.I. Modeling and simulation to determine the thermal efficiency of a parabolic solar trough collector system. Case Stud. Therm. Eng. 2019, 16, 100523. [Google Scholar] [CrossRef]
- Krolikowski, T.; Knitter, R.; Blazejewski, A. Computer modeling and testing of structural metamaterials. Procedia Comput. Sci. 2019, 159, 2543–2550. [Google Scholar] [CrossRef]
- Fluent. FLUENT 6.2 User’s Guide. NH 2005, 3766, 1–4. [Google Scholar]
- Li, Y.; Zhang, H.; Liang, X.; Huang, B. Event-Triggered-Based Distributed Cooperative Energy Management for Multienergy Systems. IEEE Trans. Ind. Inform. 2019, 15, 2008–2022. [Google Scholar] [CrossRef]
- Yushuai, L.; Gao, W.; Gao, W.; Zhang, H.; Zhou, J. A Distributed Double-Newton Descent Algorithm for Cooperative Energy Management of Multiple Energy Bodies in Energy Internet. IEEE Trans. Ind. Inform. 2020. [Google Scholar] [CrossRef]
- Hamed, M.; Fellah, A.; Brahim, A.B. Parametric sensitivity studies on the performance of a flat plate solar collector in transient behavior. Energy Convers. Manag. 2014, 78, 938–947. [Google Scholar] [CrossRef]
- Duffie, J.A.; Beckman, W.A. Solar Engineering of Thermal Processes, 4th ed.; WILEY: Hoboken, NJ, USA, 2013. [Google Scholar]
- Huang, B.; Liu, L.; Zhang, H.; Li, Y.; Sun, Q. Distributed Optimal Economic Dispatch for Microgrids Considering Communication Delays. IEEE Trans. Syst. Man Cybern. Syst. 2019, 49, 1634–1642. [Google Scholar] [CrossRef]
- de Ron, A.J. Dynamic modeling and verification of a flat-plate solar collector. Sol. Energy 1980, 24, 117–128. [Google Scholar] [CrossRef]
- Alawi, A.O.; Kamar, H.M.; Mallah, A.R.; Kazi, S.N.; Sidik, N.A.C. Thermal efficiency of a flat-plate solar collector filled with Pentaethylene Glycol-Treated Graphene Nanoplatelets: An experimental analysis. Sol. Energy 2019, 191, 360–370. [Google Scholar] [CrossRef]
- Kaminski, K.; Krolikowski, T.; Blazejewski, A.; Knitter, R. Significant Parameters Identification for Optimal Modelling of the Harp-Type Flat-Plate Solar Collector. Smart Inno. Syst. Technol. 2019, 155, 495–505. [Google Scholar]
Publisher’s Note: MDPI stays neutral with regard to jurisdictional claims in published maps and institutional affiliations. |
© 2021 by the authors. Licensee MDPI, Basel, Switzerland. This article is an open access article distributed under the terms and conditions of the Creative Commons Attribution (CC BY) license (http://creativecommons.org/licenses/by/4.0/).