Article

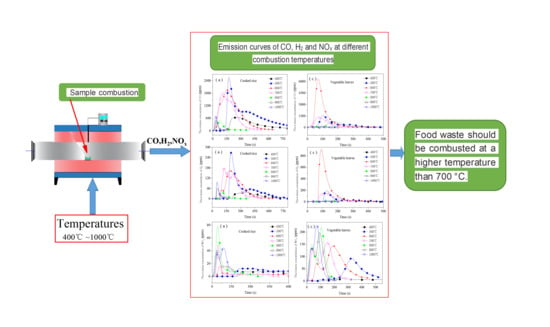
Emission Characteristics of Pollution Gases from the Combustion of Food Waste

School of Energy and Mechanical Engineering, Hunan University of Humanities, Science and Technology, Loudi 417000, China
*
Author to whom correspondence should be addressed.
Energies 2021, 14(19), 6439; https://doi.org/10.3390/en14196439
Submission received: 3 September 2021 / Revised: 30 September 2021 / Accepted: 4 October 2021 / Published: 8 October 2021
(This article belongs to the Special Issue Combustion and Energy Conversion under Small Scales)

Abstract

:
The emission characteristics of pollution gases produced via the combustion of food waste were studied through a laboratory-scale electrically heated tube furnace. The results showed that the pollution gases generated from the combustion of food waste were CO, H2 and NOx. Each emission curve of CO had a peak. When the combustion temperature rose from 400 °C to 1000 °C, the peak first increased (from 400 °C to 700 °C) and then decreased (from 800 °C to 1000 °C). However, the burnout time shortened with the increase in temperature. Therefore, food waste should be combusted at a higher temperature than 700 °C from the perspective of reducing CO emissions. The emissions of H2 were similar to those of CO. In other words, if CO emissions increased, H2 emissions also increased in the same temperature range. Some NOx emission curves had two peaks (the combustion of cooked rice at 1000 °C; the combustion of vegetable leaves in the temperature range of 600 °C to 1000 °C). The higher the combustion temperature, the higher the second NOx emission peak. NOx emissions from the combustion of cooked rice were greater in the temperature range of 400 °C to 500 °C, whereas for vegetable leaves, that temperature range was from 600 °C to 700 °C. Hence, from the viewpoint of reducing pollution gases, food waste should be combusted at a higher temperature than 700 °C.

Graphical Abstract

1. Introduction

With the development of the social economy and the acceleration of urbanization, municipal solid waste is growing rapidly. In China, for example, the solid waste yields were 2.28 × 10⁸ tons in 2018 [1]. If such a large amount of domestic waste cannot be treated harmlessly and reduced in time, it will pose a major threat to people’s health and the sustainable development of society.
Municipal solid waste mainly includes three types of substances, namely, combustible organic matter such as plastic, waste paper and rubber, inorganics such as cinders, glass and metal, as well as perishable organic matter such as branches, flowers, food waste [2,3,4]. Of all types of waste, food waste is the largest, accounting for about 50% of the total [5,6,7,8]. Food waste refers to a kind of solid waste produced by residents in daily consumption, which mainly covers leftover food, vegetable leaves, peel, bones and meat. Food waste is not only high in water content and prone to corruption and deterioration, but also generates a variety of bacteria, pathogens and emits foul-smelling gases, which all lead to serious environmental pollution [6]. How to dispose of food waste safely and effectively has attracted widespread attention from all sectors of society.
At present, there are a few methods to deal with food waste, such as landfill, composting, anaerobic digestion and incineration. Of these methods, landfill is the most widely used because it has lots of degradable components, low stability, and simple operation, which are conducive to the recovery of landfill sites [7,9]. However, landfill also has its shortcomings. For instance, landfill occupies a large area, generates a large amount of methane gas, accelerates the greenhouse effect, and is prone to fire and explosion accidents. In particular, a large amount of leachate is produced, which pollutes the surrounding groundwater [10]. Therefore, the rate of landfill is showing a downward trend. The advantages of aerobic composting are its simple process and the ability to retain more nitrogen in the compost product, which can be used in agriculture or in the manufacture of animal feed. However, it also occupies a large area, has a long production cycle, and produces lots of sewage and odor [11]. Although anaerobic digestion technology has the advantages of low energy consumption, lower secondary pollution and the generation of clean energy, it also has some problems, such as the high levels of water consumption, difficult solid–liquid separation after digestion, high treatment investment and the high operation cost of follow-up digestive solution [12].
Incinerating food waste together with other waste is of high treatment efficiency, with only about 5% of residues remaining [13]. At the same time, incineration can dispose of large quantities of waste and only occupies a small area of land, so it is popular in developed areas of China where there is a shortage of land. However, waste incineration emits large amounts of contaminants to the atmosphere, such as particulate matter, NOx, SO2, CO and dioxin, causing serious secondary pollution. To protect the environment and prevent pollution, the Standard for Pollution Control on the Municipal Solid Waste Incineration (GB18485-2014) was formulated in April 2014 in China. The standard sets stricter requirements for the emissions of smoke, such as NOx < 300 mg/Nm3, CO < 100 mg/Nm3 and SO2 < 100 mg/Nm3. Therefore, methods for the control of gas pollutants from municipal solid waste combustion have become a hot topic [14,15].
Many scholars have completed significant amounts of research on the control of pollutants from solid waste combustion. Dong et al. [16] reported that the emissions of pollutants could be reduced by controlling the combustion temperature (950–1100 °C) and residence time (not less than 2 s). At the same time, oxy-fuel combustion technology is considered to be one of the most effective methods for low pollutant emissions and CO2 capture in solid waste incineration [17,18]. Tang et al. [19] found that NOx and SOx emissions were reduced in oxy-fuel combustion when the temperature was in a certain range of 800 °C to 1000 °C. Ding et al. [20] affirmed that the generation of NOx is significantly suppressed in the process of O2/CO2 combustion. In addition, co-firing solid waste and other fuels is also a way to reduce pollutant emissions [21]. For example, researchers mixed solid waste with biomass or coal to improve combustion performance and reduce pollutant emissions [21,22,23]. However, considering people’s different lifestyles, consumption standards and environmental awareness, the components of municipal solid waste are also different, which causes distinct pollutant emission characteristics [24]. Therefore, it is necessary to study the typical components of solid waste separately. Tang et al. [2,19] studied the emission of rubber, plastic, and leather combustion. Jiang et al. [4] studied the oxy-fuel emission of scrap tire combustion. However, as the main component of municipal solid waste, there are few studies on the combustion emissions of food waste.
At present, research on the combustion emission characteristics of food waste is insufficient. Studies on the influence of temperature on the emission of CO, H2 and NOx in the flue gas from food waste combustion would be helpful to develop efficient food waste treatment technology. The study takes into account the emissions of CO, H2 and NOx, and determines the appropriate combustion temperature range, which provides a theoretical basis for efficient and low pollution in food waste combustion.

2. Materials and Methods

2.1. Materials

This paper selected two main components in food waste, namely, vegetable leaves and cooked rice, as research materials. After being dried at 105 °C for 24 h, cooked rice and vegetable leaves were pulverized and then filtered through 80-mesh screens. The resulting powder was sealed in a polythene bag for later use. The results of proximate and ultimate analysis of vegetable leaves and cooked rice are shown in Table 1.

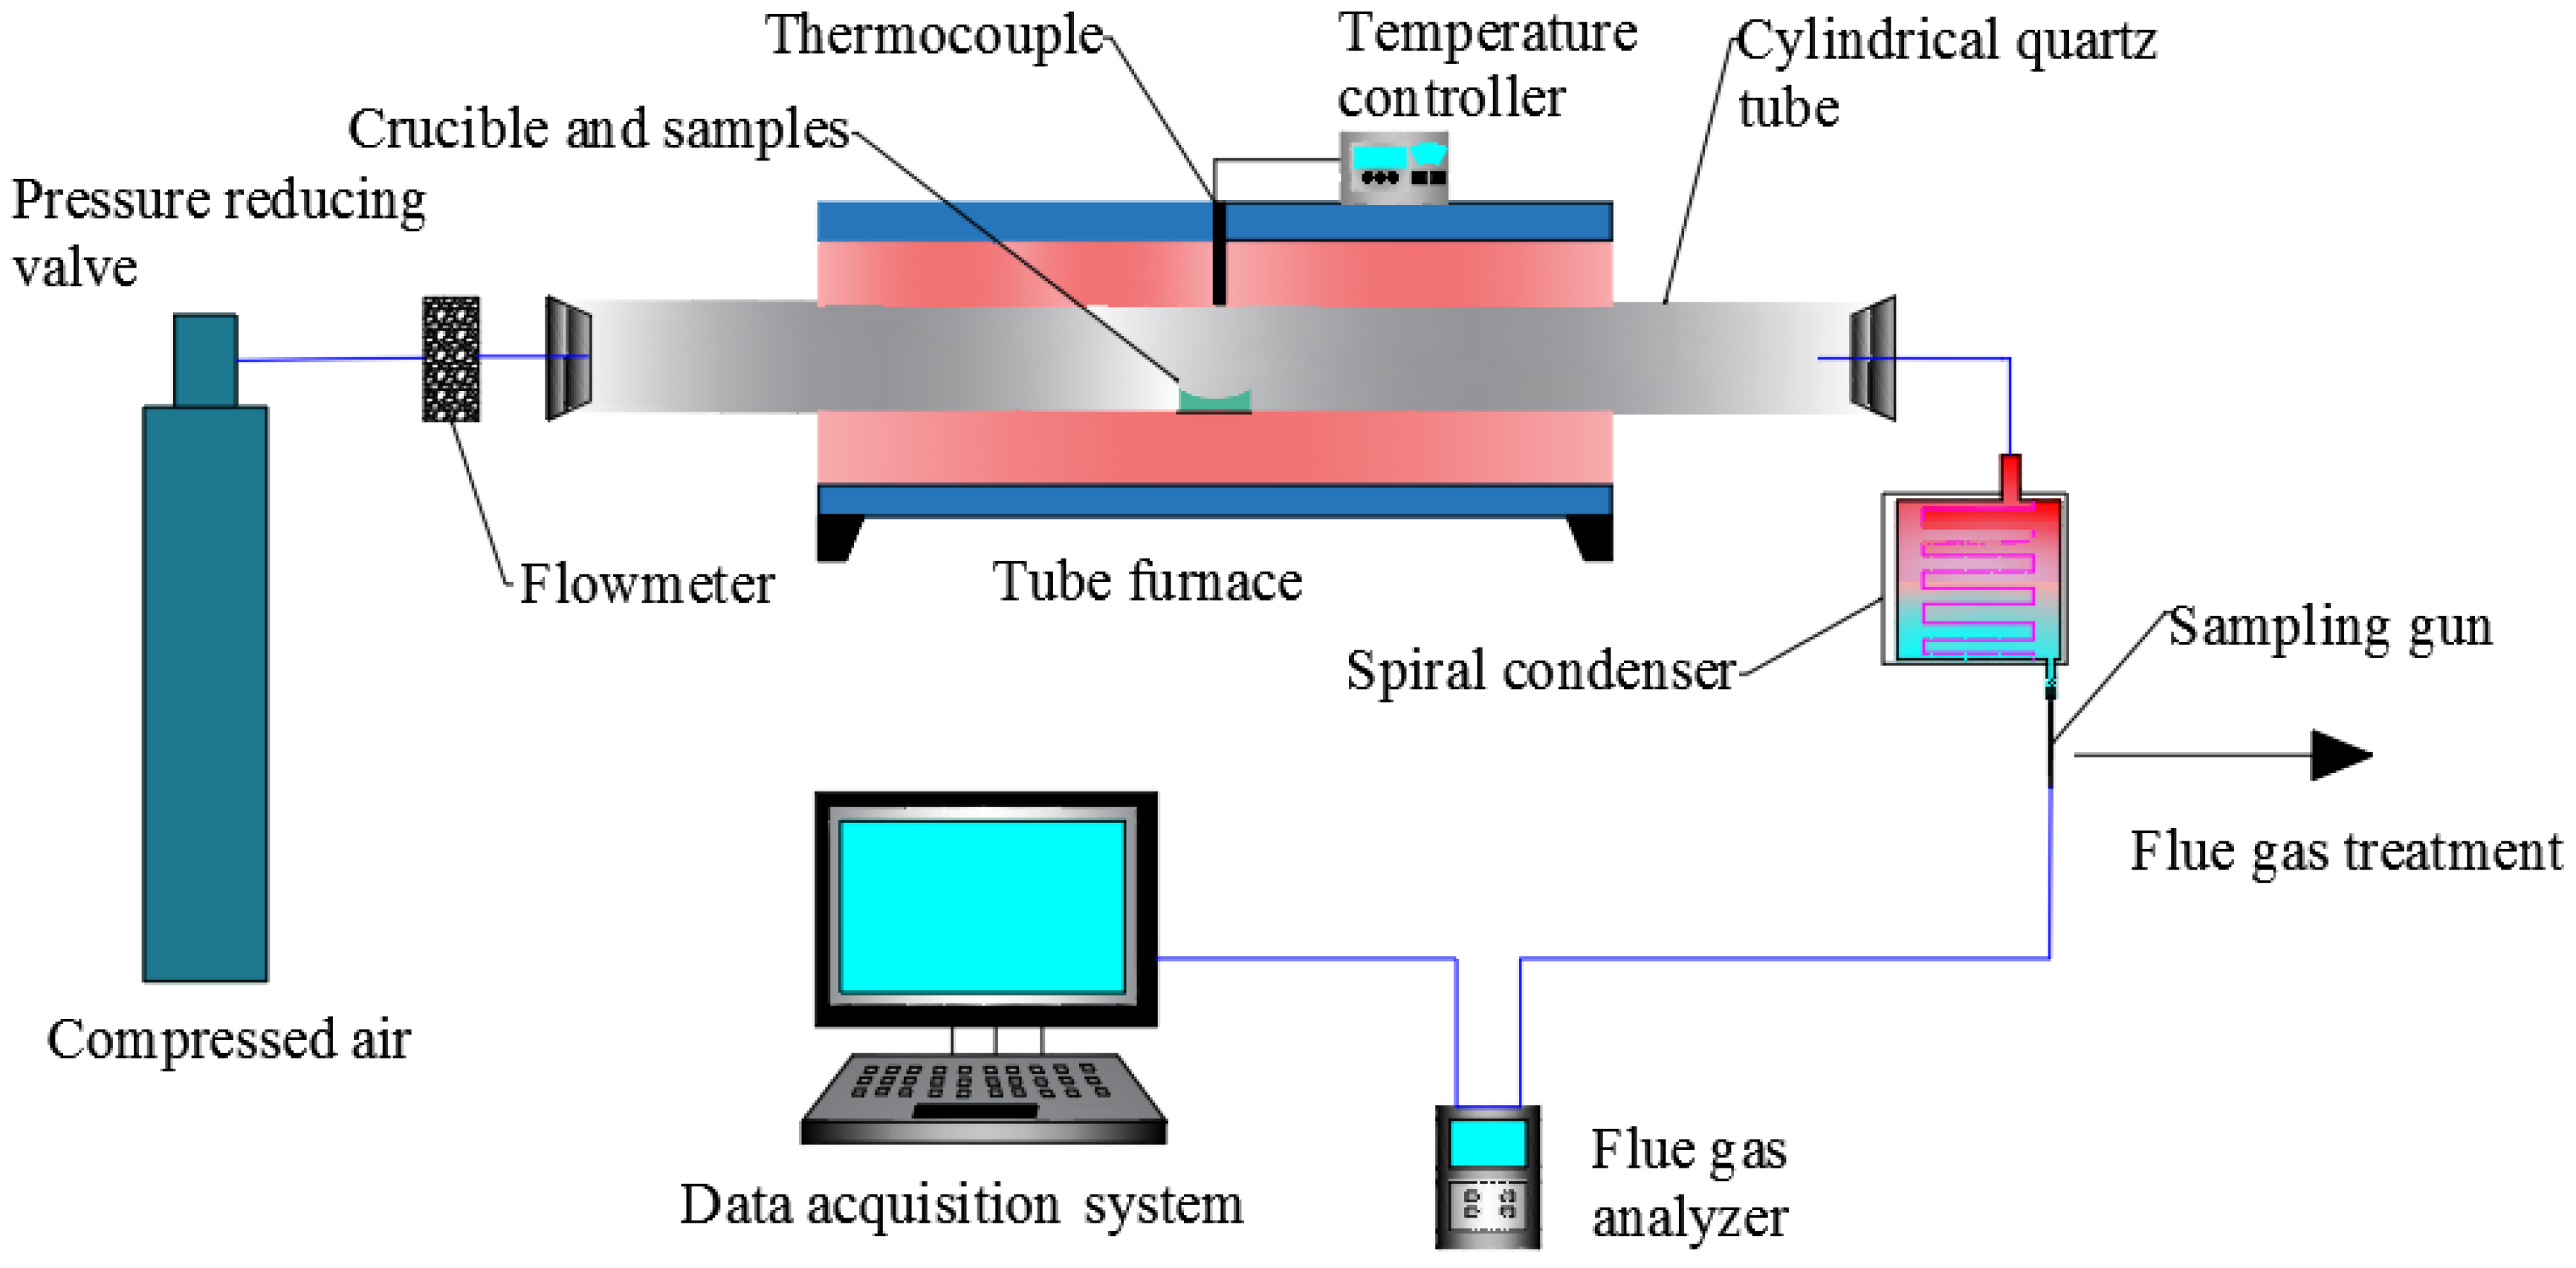
2.2. Experimental Equipment

The experiments were conducted on a self-built experimental bench for pollutants in the smoke from food waste combustion. The experimental bench was mainly composed of a gas supply system and a tube furnace. The quartz tube was placed in the electric heating furnace. The temperature was adjusted by a digital PID controller. The center of the quartz tube was allowed to rise to the pre-set temperature within a set time (Figure 1).
The probe of a 350-Pro smoke analyzer (Testo, Germany) that was connected to a computer was positioned at the smoke outlet. The experimental data were imported into the computer for further processing, the data collection time interval is 2 s. The smoke analyzer can measure the content of several gases, such as CO, H2, CO2, NOx, SO2, and H2S. Their measuring range, resolution and accuracy are as follows: CO (measuring range, 0–10,000 ppm; resolution, 1 ppm; accuracy, ±10 ppm), H2 (measuring range, 0–10,000 ppm; resolution, 1 ppm; accuracy, ± 10ppm), CO2 (measuring range, 0–50%; resolution, 0.01%; accuracy, ±0.3%); NOx (measuring range, 0–4000 ppm; resolution, 1 ppm, accuracy, ±5 ppm); SO2 (measuring range, 0–5000 ppm; resolution, 1 ppm; accuracy, ±5 ppm); and H2S (measuring range, 0–300 ppm; resolution, 0.1 ppm; accuracy, ±2 ppm).

2.3. Methods

2.3.1. Experimental Methods

The main steps of the experiment were as follows: (1) The heating process was started after setting a certain temperature on the temperature controller of the tube furnace; (2) the cylinder valve was opened and the air flowmeter was adjusted at 0.1 m3/h; (3) after rising to the pre-set temperature, specimens with a mass of 0.1 g were put in a combustion boat and pushed to the center of the quartz tube immediately after being leveled; (4) the probe of the smoke analyzer was placed at the smoke outlet and collected data were observed on the computer screen; (5) the measurement was stopped and the tube furnace was turned off when the amount of gases was almost zero. The combustion boat was then removed and cooled in a dryer; (6) experiments were repeated three times for each group and the mean values were taken as representative.

2.3.2. Calculation Methods

  • Peak concentration (ppm): the maximum concentration of gases produced.
  • Peak time (s): the time taken to reach the peak concentration of gases.
  • Burnout time t (s): the longer one of either the time taken for the H2 concentration to fall to zero or the time for CO concentration to decrease to 5% of its peak value.
  • The average concentration (AC) is given by
    A C i = 0 t c i d t t
    where the numerator on the right-hand side refers to the integral of the gas concentration for the reaction time, t represents the burnout time, and the AC is measured in ppm.
  • The produced gas volume (GV) is given by
    G V i = Q ( 1 + i = 1 n A C i 10 6 1 i = 1 n A C i 10 6 ) × t × A C i 10 6
    where Q , i = 1 n A C i 10 6 , and t refer to the injected air flow (L/s), the sum of AC of all gases, and the burnout time, respectively. The gas production is measured in L.
    Considering that i = 1 n A C i 10 6 is very small and can be ignored relative to 1, Equation (2) can be simplified to
    G V i = Q × t × A C i 10 6
  • The yield of gas (Yg) is given by
    Y g i = G V i m
    where m refers to the mass of the test sample.

3. Results and Discussion

In the range of 400 °C to 1000 °C, CO, H2 and NOx appeared in the smoke arising from the combustion of food waste specimens, while no SO2 was discovered. This occurred because the concentration of SO2 in the smoke was so low that it was not detected by flue gas analyzer. Therefore, more attention was paid to analyzing the emission of CO, H2, and NOx.

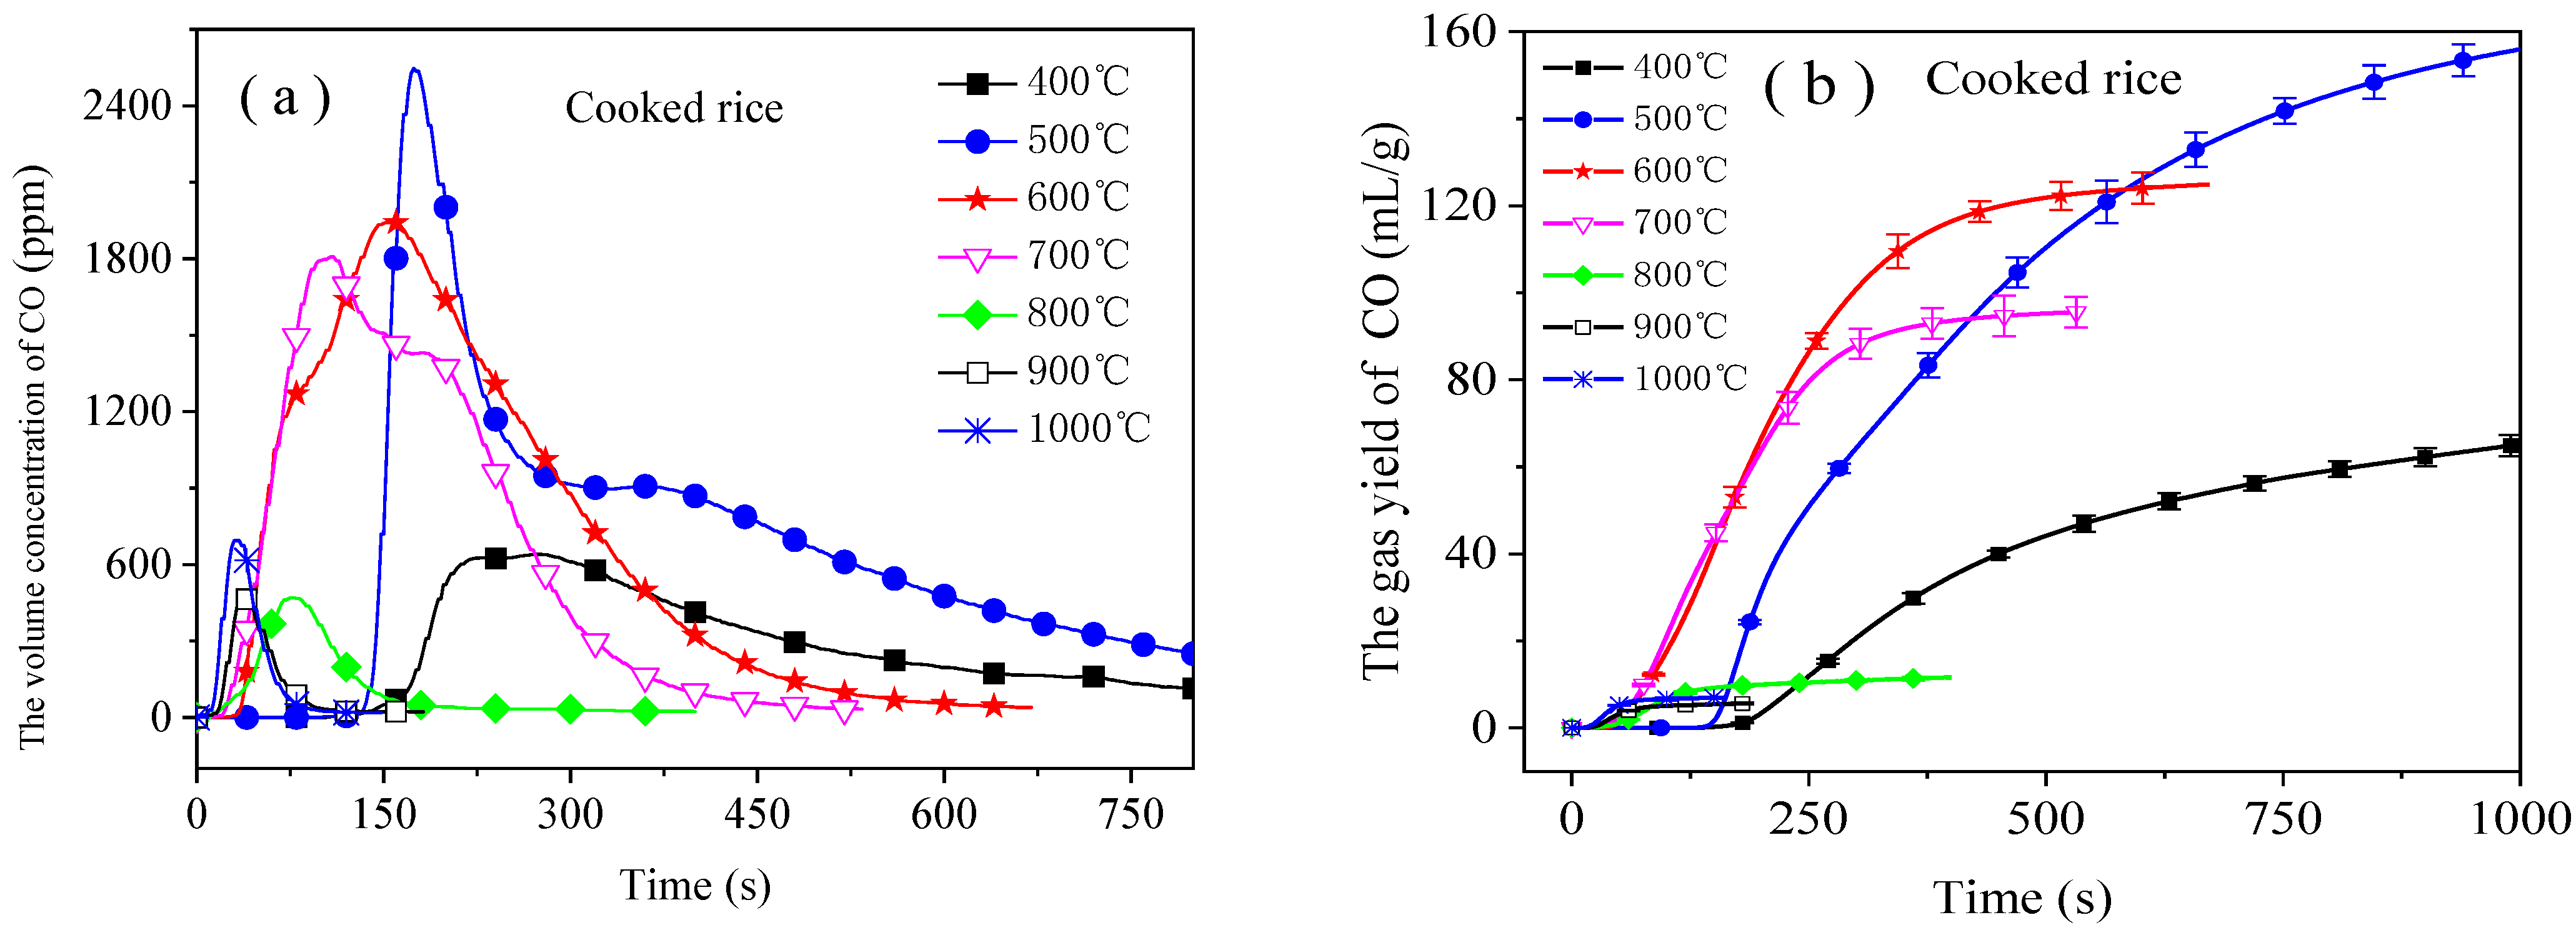
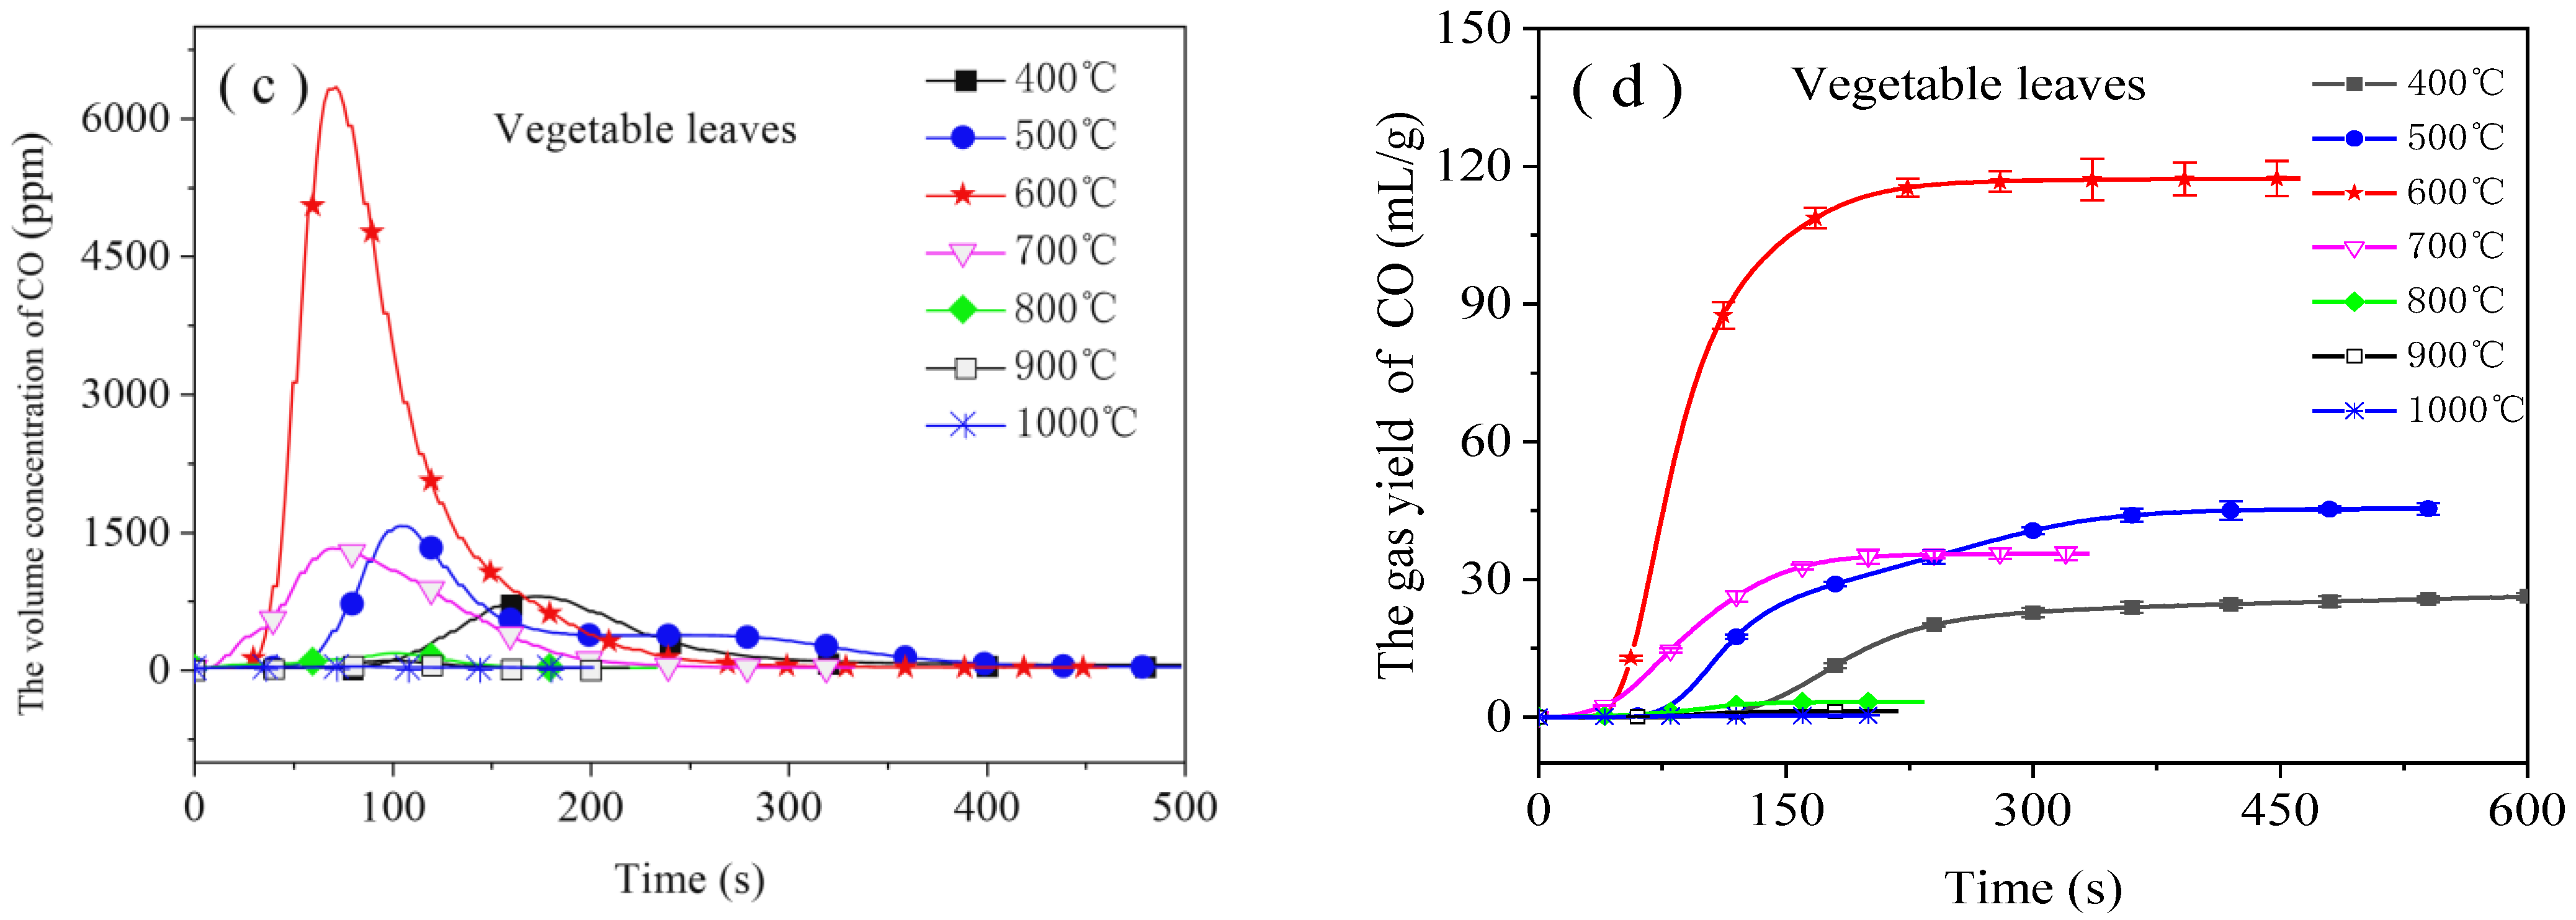
3.1. Emission Characteristics of CO

CO emissions during the combustion of food waste at different temperatures are displayed in Figure 2. Each emission curve of CO presents a single peak distribution (see Figure 2a,c); this may be because the combustion process of volatile and fixed carbon overlaps when the food waste is suddenly placed at a constant high temperature. Interestingly, CO emission concentration changed rapidly at first and then slowly, which indicates that, in the early stage, CO mainly comes from the combustion of volatile matter, while in the later stage, it is released from the joint combustion of fixed carbon and volatile matter. However, in terms of peak time, cooked rice and vegetable leaves demonstrated different laws as temperature changed. During the combustion of cooked rice, the peak time gradually dropped with the increase in temperature, which was only 30 s at 1000 °C, only 11.03% of that at 400 °C. Nevertheless, during the combustion of vegetable leaves, the peak time gradually shortened and then incrementally extended with the increase in temperature, which hit the minimum value of 70 s at 700 °C. Furthermore, the higher the combustion temperature of food waste, the shorter the burnout time. For cooked rice and vegetable leaves, the burnout time of 1000 °C is 0.065 times and 0.29 times that at 400 °C, respectively. This is because the higher the combustion temperature, the faster the combustion speed of the food waste, and the shorter the burnout time [26].
As the combustion temperature rose from 400 °C to 1000 °C, the peak concentration of food waste combustion first increased and then decreased, indicating that CO had a strong formation reaction, which was closely related to temperature. The highest peak values of cooked rice and vegetable leaves correspond to 500 °C and 600 °C, respectively, with values of 2547 ppm and 6336 ppm, which may be because the temperatures are the transition temperature from incomplete combustion to complete combustion of carbon [27]. Similarly, the maximum yield of CO is obtained at 500 °C (cooked rice) and 600 °C (vegetable leaves), up to 157.2 mL/g and 117.3 mL/g, respectively (see Figure 2b,d). This may also be attributed to the dual effect of temperature on CO formation. There does exist a minimum temperature of complete combustion of carbon. When the experimental temperature is lower than the minimum temperature, the higher the temperature, the more conducive to the overflowed of volatile matter from food waste and to CO emission [27]; when the experimental temperature exceeds that temperature, the higher the temperature, the greater the temperature gradient and the shorter the time for food waste to reach that temperature, which promotes carbon in food waste conversion to CO2, resulting in a reduction in CO emissions.
In general, the yields of CO from food waste combustion was larger at relatively low temperatures (400 °C to 700 °C), while those were smaller at higher temperatures (800 °C to 1000 °C). The yields of CO at 400 °C are 12.62 and 71.32 times higher than those at 1000 °C, respectively. This means that the Reaction (4) plays a dominant role in the high temperature range. Therefore, from the perspective of controlling CO emissions, the combustion temperature of food waste should exceed 700 °C.

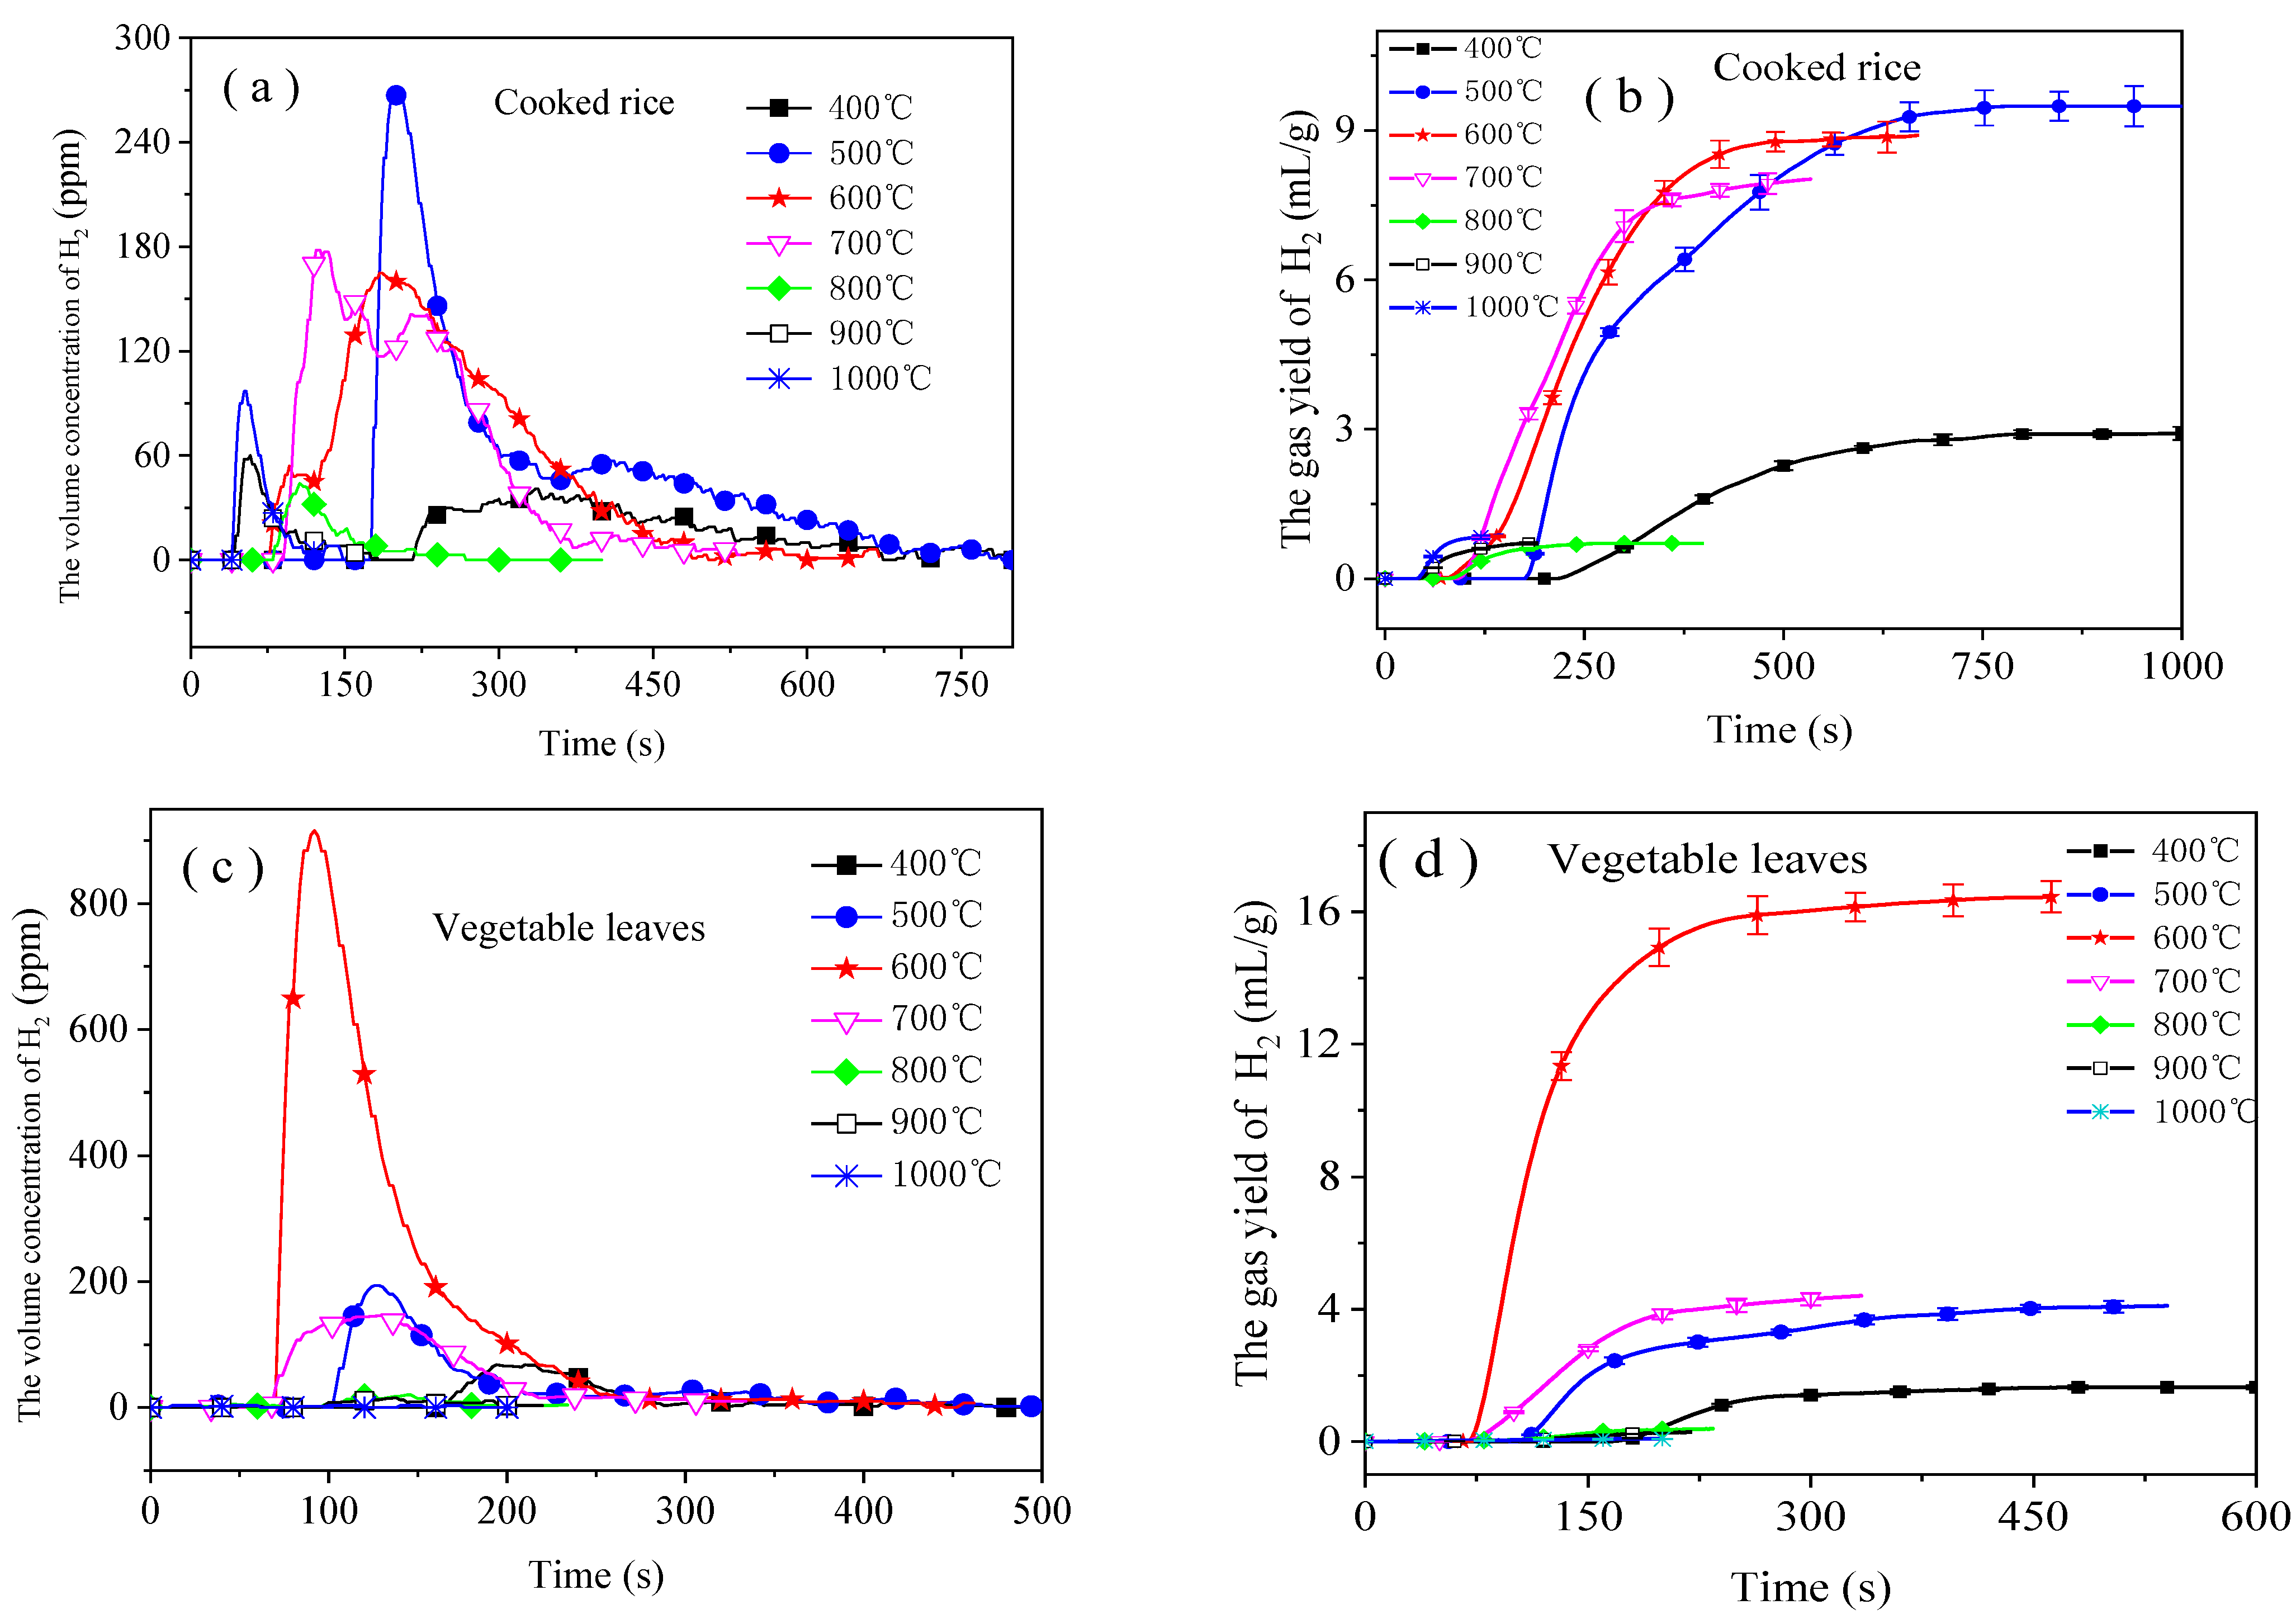
3.2. Emission Characteristics of H2

H2 started to be emitted as CO emissions reached their peak (see Figure 2 and Figure 3). This may have occurred for two reasons: On the one hand, under the reduction environment of CO, H2 produced by the gasification of food waste is hard to react with O2. On the other hand, the reducing ambient facilitates Reactions (5) and (6) for the generation of H2 [20].
C + H2 O → CO + H2   Δhr = + 131 kJ/kmol
CO + H2 O → CO2 + H2   Δhr = −41 kJ/kmol
The emission of H2 in the combustion smoke arising from food waste was similar to that of CO. Generally, the greater CO emissions at a certain temperature, the greater H2 emissions at this temperature. The maximum value (9.5 mL/g) of H2 emissions is obtained at 500 °C during the combustion of cooked rice, while that of vegetable leaves is 16.5 mL/g at 600 °C. Similar to CO, H2 emissions were larger in the range of 400 °C to 700 °C and lower in the range of 800 °C to 1000 °C, which was particularly true for the combustion of vegetable leaves. In Figure 3d, the H2 emission curve in the range of 800 °C to 1000 °C followed a linear trend and was almost parallel to the time axis. At a given combustion temperature, H2 emissions were much smaller than those of CO, with differences of one order of magnitude, which was due to H2 is easier to react with O2 under the same conditions because of its stronger reducibility than CO [28].

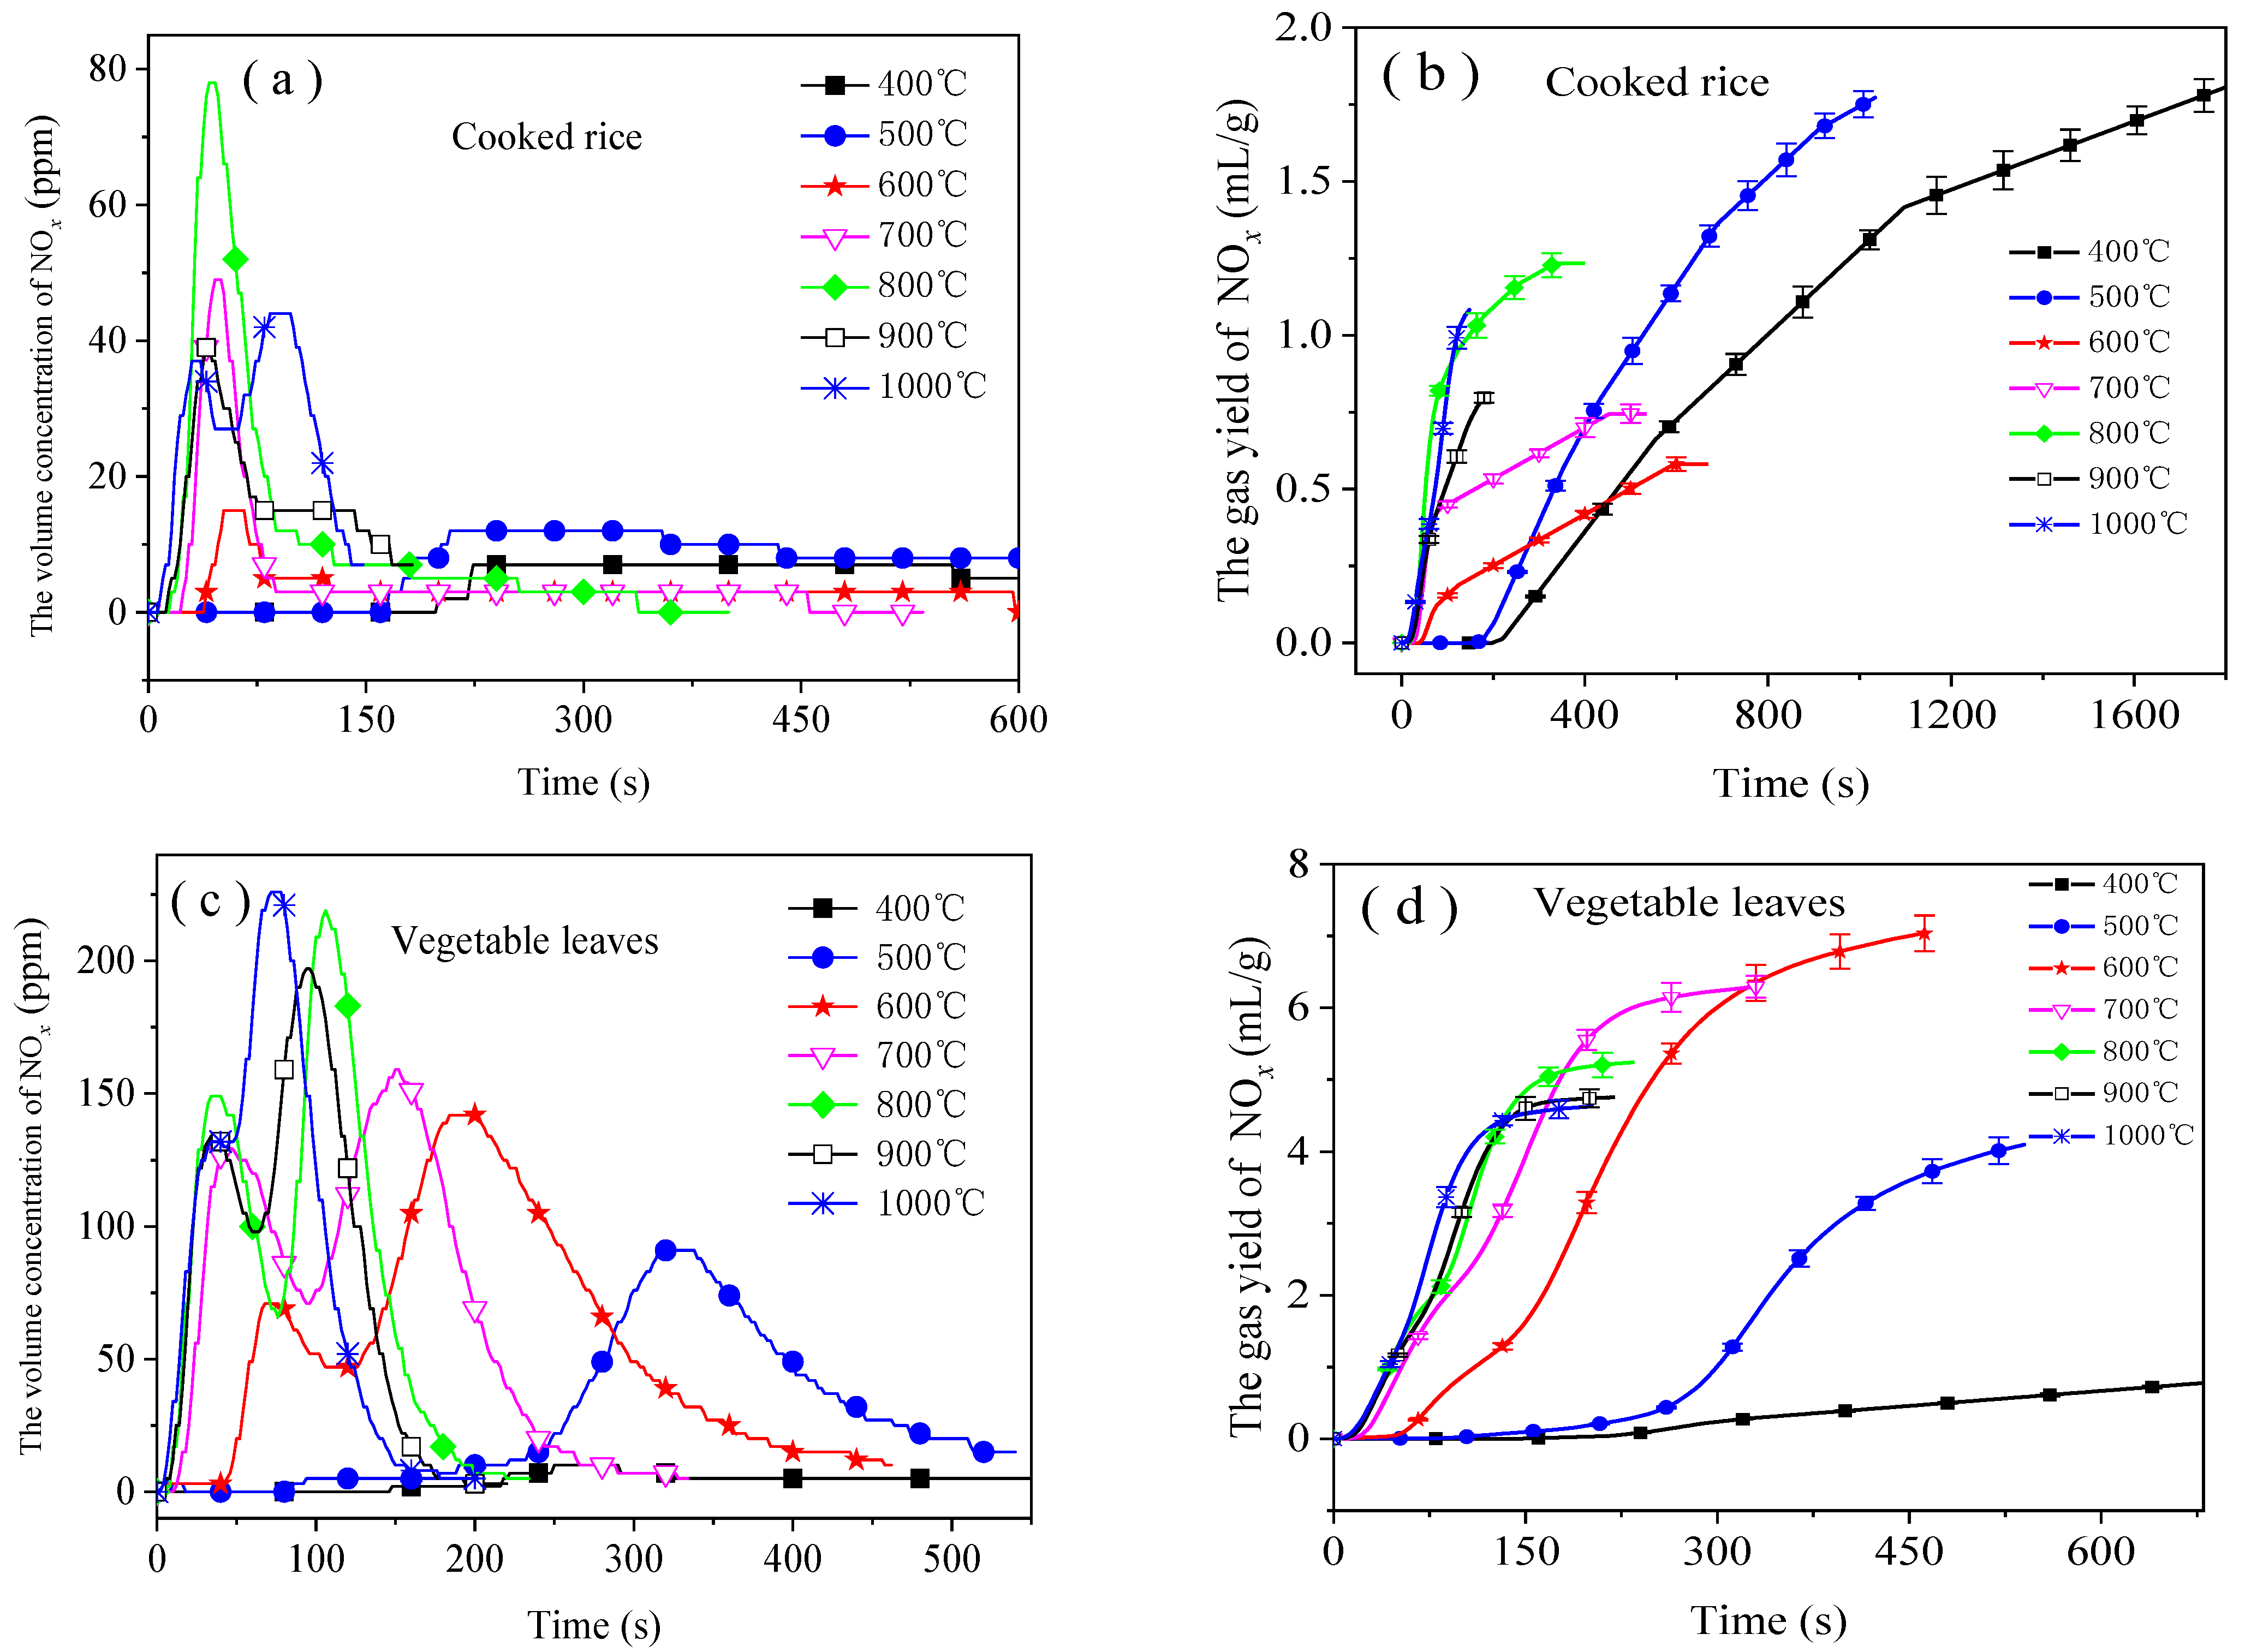
3.3. Emission Characteristics of NOx

NOx does great harm to the environment, which can not only contribute to acid rain and mist, but also react with hydrocarbons to produce photochemical smog [29,30]. In addition, it also deteriorates the ozonosphere [31]. During the combustion of food waste, NOx mainly originates from two sources. It is, mainly, on the one hand, produced from nitrogen of fuel generated by oxidation and, on the other hand, from the combination reaction of nitrogen with oxygen in the air at high temperatures [32,33]. The former is known as fuel NOx and the latter is known as thermal NOx. As only a small amount of thermal NOx is produced at temperatures below 1800 K [34], the NOx emitted in these experiments is mainly fuel NOx.
As shown in Figure 4, large amounts of NOx were released from the combustion of food waste, particularly from the combustion of vegetable leaves (see Figure 4c,d ) during which their peak emission exceeded 100 ppm under most conditions. This is because food waste has high nitrogen content, and the nitrogen content of vegetable leaves was higher than cooked rice. An abnormal phenomenon can be observed in Figure 4a,b. The NOx emission peak is the highest at 800 °C, but at 400 °C the yield is the highest, which is mainly due to the slow combustion reaction and long NOx emission time at 400 °C, which is 5.68 times that of 800 °C, resulting in the maximum yield of NOx at 400 °C. Distinguished from CO and H2, some NOx emission curves (when combusting cooked rice and vegetable leaves at 1000 °C and in the range of 600 °C to 1000 °C, respectively) had two peaks. Lane [35] and Sun [36] also found a similar phenomenon. This was mainly because the mechanism of NOx formation differed from that of CO and H2 formation, and proceeded in the following three stages [37]: (1) nitrogenous compounds were volatilized; (2) during the heating process, the volatilized nitrogenous compounds were decomposed to NH3 and HCN, which were then converted to NOx after a series of redox reactions; and (3) the nitrogen remaining in the char is burnt to produce NOx. The first peak was attributed to the oxidation of nitrogen volatilized from the fuel, and the second was attributed to the oxidation of nitrogen in the char.
It is notable that the second peak in the NOx emission curves (see Figure 4c) was generally higher than the first. Meng also found a similar phenomenon when pine and 85% corn were co-combusted [38]. It can be deduced that the combustion of nitrogen in the char plays a leading role in the formation of NOx. In general, the nitrogen in the char can only be combusted at high temperatures, which probably explained that the higher the temperature, the higher the second NOx emission peak, and that the second peak did not appear at low temperatures. Moreover, differing from vegetable leaves, two peaks did not show up in the NOx emission curves of cooked rice in the range of 400 °C to 900 °C, but only occurred at 1000 °C. This was probably because the combustion temperature of fixed carbon in the cooked rice was higher than that in vegetable leaves.
At different combustion temperatures, cooked rice and vegetable leaves showed different trends in the NOx emission. As for cooked rice, the NOx emissions were large at 400 to 500 °C, whose maximum value was 2.1 mL/g obtained at 400 °C, while for vegetable leaves, the maximum value was 7.0 mL/g obtained at 600 °C. This is different from Chen’s findings [39]. This was mainly because temperature exerted both positive and negative effects on NOx generation. Higher temperatures were conducive to NOx generation from the combustion of nitrogen in the char (Reaction (7)) [40]. Meanwhile, the higher the temperature, the greater the amount of volatilized nitrogen, which caused a lack of oxygen, accelerated smoke flow, and ultimately hindered the formation of NOx with intermediates such as NH3, HCN and HNCO (Reaction (8)) [41].
Char-N + 0.5O2 → NO
(Volatile-N: NH3 + HCN + HNCO) + O2 → NO
In the combustion of cooked rice, high temperature is probably one of major negative factors in NOx emissions—emissions were greater at lower temperatures. For vegetable leaves, temperature mainly played a positive role from 400 °C to 600 °C during the combustion, while negative effects predominated from 700 °C to 1000 °C. As a result, during the combustion of vegetable leaves, NOx emissions first increased and then decreased with as temperature increased. In general, the emission of NOx from the combustion of food waste was similar to that of CO, with a large amount of emissions in the low temperature range and less in high temperature range. Therefore, from the perspective of NOx emission control, the combustion temperature of food waste should also be higher than 700 °C.

4. Conclusions

The emission characteristics of three gases, namely, CO, H2, and NOx were analyzed experimentally through the combustion of typical components of food waste (cooked rice and vegetable leaves). The following conclusions were drawn:
  • Each emission curve of CO had a peak. The peak increased at first and then decreased. The burnout time gradually decreased as the combustion temperature rose from 400 °C to 1000 °C. CO emissions were greatest from 400 °C to 700 °C; therefore, the combustion of food waste within that temperature range should be avoided from the perspective of controlling CO emissions.
  • The emission of H2 resembled that of CO. If CO emissions were present in large amounts at a certain temperature, then those of H2 were also present in large amounts at this temperature. H2 emissions from the combustion of cooked rice and vegetable leaves were greatest (9.5 mL/g and 16.5 mL/g, respectively) at 500 °C and 600 °C, respectively.
  • Two peaks occurred in the NOx emission curves within the range of high temperatures (1000 °C for the cooked rice and 600 °C to 1000 °C for the vegetable leaves). The higher the temperature, the higher the second emission peak. When being combusted from 400 °C to 500 °C, cooked rice emitted a large amount of NOx, while vegetable leaves emitted a large amount of NOx from 600 °C to 700 °C. Therefore, from the perspective of reducing NOx emissions, the combustion of food waste should be done at a temperature higher than 700 °C.

Author Contributions

Investigation, H.L.; data curation, X.Z.; writing—review and editing, Q.H.; funding acquisition, H.L. and Q.H.; All authors have read and agreed to the published version of the manuscript.

Funding

This research was funded by the Hunan Provincial Natural Science Foundation of China (2021JJ50132) and the Hunan Province Graduate Scientific Research and Innovation Project of China (CX20201189).

Data Availability Statement

All data used to support the findings of this study are included within the article.

Conflicts of Interest

The authors declare that they have no conflict of interest regarding the publication of this paper.

Nomenclature

ACThe average concentration of gas(ppm)
GVThe gas volume (L)
QThe injected air flow (L/s)
tThe burnout time(s)
YgThe yield of gas (mL/g)
Subscripts and Superscripts
iThe type of gas

References

  1. China’s National Bureau of Statistics. China Statistical Yearbook 2019; China Statistical Press: Beijing, China, 2019.
  2. Tang, Y.; Ma, X.; Lai, Z.; Fan, Y. Thermogravimetric analyses of co-combustion of plastic, rubber, leather in N2/O2 and CO2/O2 atmospheres. Energy 2015, 90, 1066–1074. [Google Scholar] [CrossRef]
  3. Lai, Z.; Ma, X.; Tang, Y.; Lin, H. A study on municipal solid waste (MSW) combustion in N2/O2 and CO2/O2 atmosphere from the perspective of TGA. Energy 2011, 36, 819–824. [Google Scholar] [CrossRef]
  4. Jiang, X.; Wang, C.; Bi, H.; Jiang, C.; Liu, Y.; Song, Z.; Lin, Q. Experimental Investigation on Combustion and Gas Emission of Scrap Tire Pellet under Various Concentrations of CO2/O2 Mixtures. Combust. Sci. Technol. 2019, 193, 1495–1515. [Google Scholar] [CrossRef]
  5. Cheng, J.; Ding, L.; Lin, R.; Yue, L.; Liu, J.; Zhou, J.; Cen, K. Fermentative biohydrogen and biomethane co-production from mixture of food waste and sewage sludge: Effects of physiochemical properties and mix ratios on fermentation performance. Appl. Energy 2016, 184, 1–8. [Google Scholar] [CrossRef]
  6. Mahmood, R.; Parshetti, G.; Balasubramanian, R. Energy, exergy and techno-economic analyses of hydrothermal oxidation of food waste to produce hydro-char and bio-oil. Energy 2016, 102, 187–198. [Google Scholar] [CrossRef]
  7. Tang, Y.; Dong, J.; Chi, Y.; Zhou, Z.; Ni, M. Energy and exergy optimization of food waste pretreatment and incineration. Environ. Sci. Pollut. Res. 2017, 24, 18434–18443. [Google Scholar] [CrossRef]
  8. Zhou, H.; Meng, A.; Long, Y.; Li, Q.; Zhang, Y. An overview of characteristics of municipal solid waste fuel in China: Physical, chemical composition and heating value. Renew. Sustain. Energy Rev. 2014, 36, 107–122. [Google Scholar] [CrossRef]
  9. Hong, J.; Chen, Y.; Wang, M.; Ye, L.; Qi, C.; Yuan, H.; Zheng, T.; Li, X. Intensification of municipal solid waste disposal in China. Renew. Sustain. Energy Rev. 2017, 69, 168–176. [Google Scholar] [CrossRef]
  10. Sotiropoulos, A.; Malamis, D.; Michailidis, P.; Krokida, M.; Loizidou, M. Research on the drying kinetics of household food waste for the development and optimization of domestic waste drying technique. Environ. Technol. 2015, 37, 929–939. [Google Scholar] [CrossRef]
  11. Boldrin, A.; Hartling, K.R.; Laugen, M.; Christensen, T.H. Environmental inventory modelling of the use of compost and peat in growth media preparation. Resour. Conserv. Recycl. 2010, 54, 1250–1260. [Google Scholar] [CrossRef] [Green Version]
  12. Tsigkou, K.; Tsafrakidou, P.; Kopsahelis, A.; Zagklis, D.; Zafiri, C.; Kornaros, M. Used disposable nappies and expired food products valorisation through one- & two-stage anaerobic co-digestion. Renew. Energy 2019, 147, 610–619. [Google Scholar] [CrossRef]
  13. Pham, T.P.T.; Kaushik, R.; Parshetti, G.; Mahmood, R.; Balasubramanian, R. Food waste-to-energy conversion technologies: Current status and future directions. Waste Manag. 2015, 38, 399–408. [Google Scholar] [CrossRef] [PubMed]
  14. Wei, C.; Yu, Z.; Zhang, X.; Ma, X. Co-combustion behavior of municipal solid waste and food waste anaerobic digestates: Combustion performance, kinetics, optimization, and gaseous products. J. Environ. Chem. Eng. 2021, 9, 106028. [Google Scholar] [CrossRef]
  15. Zhang, S.; Lin, X.; Chen, Z.; Li, X.; Jiang, X.; Yan, J. Influence on gaseous pollutants emissions and fly ash characteristics from co-combustion of municipal solid waste and coal by a drop tube furnace. Waste Manag. 2018, 81, 33–40. [Google Scholar] [CrossRef]
  16. Dong, C.; Yang, Y.; Zhang, J.; Lu, X. Gaseous emissions from the combustion of a waste mixture containing a high concentration of N2O. Waste Manag. 2009, 29, 272–276. [Google Scholar] [CrossRef]
  17. Riaza, J.; Khatami, R.; Levendis, Y.A.; Álvarez, L.; Gil, M.V.; Pevida, C.; Rubiera, F.; Pis, J.J. Single particle ignition and combustion of anthracite, semi-anthracite and bituminous coals in air and simulated oxy-fuel conditions. Combust. Flame 2014, 161, 1096–1108. [Google Scholar] [CrossRef] [Green Version]
  18. Lasek, J.; Janusz, M.; Zuwała, J.; Głód, K.; Iluk, A. Oxy-fuel combustion of selected solid fuels under atmospheric and elevated pressures. Energy 2013, 62, 105–112. [Google Scholar] [CrossRef]
  19. Tang, Y.; Ma, X.; Lai, Z.; Zhou, D.; Chen, Y. Thermogravimetric characteristics and combustion emissions of rubbers and polyvinyl chloride in N2/O2 and CO2/O2 atmospheres. Fuel 2013, 104, 508–514. [Google Scholar] [CrossRef]
  20. Ding, G.; He, B.; Cao, Y.; Wang, C.; Su, L.; Duan, Z.; Song, J.; Tong, W.; Li, X. Process simulation and optimization of municipal solid waste fired power plant with oxygen/carbon dioxide combustion for near zero carbon dioxide emission. Energy Convers. Manag. 2018, 157, 157–168. [Google Scholar] [CrossRef]
  21. Onenc, S.; Retschitzegger, S.; Evic, N.; Kienzl, N.; Yanik, J. Characteristics and synergistic effects of co-combustion of carbonaceous wastes with coal. Waste Manag. 2018, 71, 192–199. [Google Scholar] [CrossRef] [PubMed]
  22. Huang, L.; Xie, C.; Liu, J.; Zhang, X.; Chang, K.; Kuo, J.; Sun, J.; Xie, W.; Zheng, L.; Sun, S.; et al. Influence of catalysts on co-combustion of sewage sludge and water hyacinth blends as determined by TG-MS analysis. Bioresour. Technol. 2018, 247, 217–225. [Google Scholar] [CrossRef] [PubMed]
  23. Boumanchar, I.; Chhiti, Y.; M’Hamdi Alaoui, F.E.; Elkhouakhi, M.; Sahibed-Dine, A.; Bentiss, F.; Jama, C.; Bensitel, M. Investigation of (co)-combustion kinetics of biomass, coal and municipal solid wastes. Waste Manag. 2019, 97, 10–18. [Google Scholar] [CrossRef] [PubMed]
  24. Lu, L.; Namioka, T.; Yoshikawa, K. Effects of hydrothermal treatment on characteristics and combustion behaviors of municipal solid wastes. Appl. Energy 2011, 88, 3659–3664. [Google Scholar]
  25. Liu, H.; E, J.; Ma, X.; Xie, C. Influence of microwave drying on the combustion characteristics of food waste. Dry Technol. 2016, 34, 1397–1405. [Google Scholar] [CrossRef]
  26. Chen, G.; Li, Y.; Peng, H.; Li, Y.; Jiang, Z. Characteristics of flue gas emissions during large wood pellet combustion. Trans. Chin. Soc. Agric. Eng. 2015, 31, 215–220. [Google Scholar]
  27. Xu, Q.; Peng, W.; Ling, C. An Experimental Analysis of Soybean Straw Combustion on Both CO and NOX Emission Characteristics in a Tubular Furnace. Energies 2020, 13, 1587. [Google Scholar] [CrossRef] [Green Version]
  28. Zhao, L.H.; Chu, X.J.; Cheng, S.J. Sulfur Transfers from Pyrolysis and Gasification of Coal. Adv. Mater. Res. 2012, 512–515, 2526–2530. [Google Scholar] [CrossRef]
  29. Liu, Y.; Gao, F.; Yi, H.; Yang, C.; Zhang, R.; Zhou, Y.; Tang, X. Recent advances in selective catalytic oxidation of nitric oxide (NO-SCO) in emissions with excess oxygen: A review on catalysts and mechanisms. Environ. Sci. Pollut. Res. 2020, 28, 2549–2571. [Google Scholar] [CrossRef]
  30. Yu, Z.-Y.; Fan, X.-H.; Gan, M.; Chen, X.-L. Effect of Ca-Fe oxides additives on NOx reduction in iron ore sintering. J. Iron Steel Res. Int. 2017, 24, 1184–1189. [Google Scholar] [CrossRef]
  31. Pillier, L.; Idir, M.; Molet, J.; Matynia, A.; De Persis, S. Experimental study and modelling of NOx formation in high pressure counter-flow premixed CH4/air flames. Fuel 2015, 150, 394–407. [Google Scholar] [CrossRef]
  32. Shamooni, A.; Debiagi, P.; Wang, B.; Luu, T.D.; Stein, O.T.; Kronenburg, A.; Bagheri, G.; Stagni, A.; Frassoldati, A.; Faravelli, T.; et al. Carrier-phase DNS of detailed NOx formation in early-stage pulverized coal combustion with fuel-bound nitrogen. Fuel 2021, 291, 119998. [Google Scholar] [CrossRef]
  33. Verma, P.; Zare, A.; Jafari, M.; Bodisco, T.; Rainey, T.; Ristovski, Z.; Brown, R.J. Diesel engine performance and emissions with fuels derived from waste tyres. Sci. Rep. 2018, 8, 2457. [Google Scholar] [CrossRef] [Green Version]
  34. Zhou, H.; Zhou, M.; Liu, Z.; Cheng, M.; Chen, J. Modeling NOx emission of coke combustion in iron ore sintering process and its experimental validation. Fuel 2016, 179, 322–331. [Google Scholar] [CrossRef]
  35. Lane, D.J.; Ashman, P.J.; Zevenhoven, M.; Hupa, M.; van Eyk, P.J.; de Nys, R.; Karlström, O.; Lewis, D.M. Combustion Behavior of Algal Biomass: Carbon Release, Nitrogen Release, and Char Reactivity. Energy Fuel 2014, 28, 41–51. [Google Scholar] [CrossRef]
  36. Sun, J.; Zhao, B.; Su, Y. Advanced control of NO emission from algal biomass combustion using loaded iron-based additives. Energy 2019, 185, 229–238. [Google Scholar] [CrossRef]
  37. Glarborg, P.; Jensen, A.D.; Johnsson, J.E. Fuel nitrogen conversion in solid fuel fired systems. Prog. Energy Combust. 2003, 29, 89–113. [Google Scholar] [CrossRef]
  38. Meng, X.; Sun, R.; Zhou, W.; Liu, X.; Yan, Y.; Ren, X. Effects of corn ratio with pine on biomass co-combustion characteristics in a fixed bed. Appl. Therm. Eng. 2018, 142, 30–42. [Google Scholar] [CrossRef]
  39. Chen, C.; Chen, F.; Cheng, Z.; Chan, S.; Kook, S.; Yeoh, G.H. Emissions characteristics of NOx and SO2 in the combustion of microalgae biomass using a tube furnace. J. Energy Inst. 2017, 90, 806–812. [Google Scholar] [CrossRef]
  40. Vermeulen, I.; Block, C.; Vandecasteele, C. Estimation of fuel-nitrogen oxide emissions from the element composition of the solid or waste fuel. Fuel 2012, 94, 75–80. [Google Scholar] [CrossRef]
  41. Zhao, B.; Su, Y.; Liu, D.; Zhang, H.; Liu, W.; Cui, G. SO2/NOx emissions and ash formation from algae biomass combustion: Process characteristics and mechanisms. Energy 2016, 113, 821–830. [Google Scholar] [CrossRef]
Figure 1. The experimental bench diagram.
Energies 14 06439 g001
Figure 2. The CO emission curves at different combustion temperatures: (a) the volume concentration of CO at cooked rice combustion; (b) the yield of CO at cooked rice combustion; (c) the volume concentration of CO at vegetable leaves combustion; (d) the gas yield of CO at vegetable leaves combustion.
Energies 14 06439 g002aEnergies 14 06439 g002b
Figure 3. The H2 emission curves at different combustion temperatures: (a) the volume concentration of H2 at cooked rice combustion; (b) the yield of H2 at cooked rice combustion; (c) the volume concentration of H2 at vegetable leaves combustion; (d) the gas yield of H2 at vegetable leaves combustion.
Energies 14 06439 g003
Figure 4. The NOx emission curves at different combustion temperatures: (a) the volume concentration of NOx at cooked rice combustion; (b) the yield of NOx at cooked rice combustion; (c) the volume concentration of NOx at vegetable leaves combustion; (d) the gas yield of NOx at vegetable leaves combustion.
Energies 14 06439 g004
Table 1. Proximate and ultimate analysis of vegetable leaves and cooked rice (dry basis). Reprinted with permission from ref. [25]. (Copyright 2021 Taylor & Francis).
MaterialsProximate Analysis (wt.%)Ultimate Analysis (wt.%)LHV(MJ·kg−1)
AVFCCHNS
Vegetable leaves13.6276.2210.1640.866.6384.2190.38914.938
Cooked rice0.4591.418.1443.288.041.5270.2615.806
Publisher’s Note: MDPI stays neutral with regard to jurisdictional claims in published maps and institutional affiliations.

