Article

Dynamic Spillovers and Asymmetric Spillover Effect between the Carbon Emission Trading Market, Fossil Energy Market, and New Energy Stock Market in China

1
School of Economics and Management, North China Electric Power University, Beijing 102206, China
2
School of Environment, Education & Development, The University of Manchester, Manchester M13 9PL, UK
*
Author to whom correspondence should be addressed.
Energies 2021, 14(19), 6438; https://doi.org/10.3390/en14196438
Submission received: 8 August 2021 / Revised: 24 September 2021 / Accepted: 27 September 2021 / Published: 8 October 2021
(This article belongs to the Section C: Energy Economics and Policy)

Abstract

:
In 2020, China proposed the goal of achieving carbon emission peaks by 2030 and carbon neutrality by 2060. For China, whose energy consumption structure has long been dominated by fossil energy, carbon trading and new energy are crucial for the realization of the emission target. By establishing a connectedness network model, this paper studies the static and dynamic spillovers between the Hubei carbon trading market, new energy stock market, crude oil market, coal market, and natural gas market in China, and draws the following conclusions: (1) the static spillover index of the carbon–energy–stock system is 3.57% and the dynamic spillover index fluctuates between 7.67% and 22.62%, indicating that the spillover effect of the system is low; (2) for the whole system, whether from a static or dynamic perspective, the carbon market always plays the role of net information receiver, while new energy is the net information transmitter; (3) the new energy stock market and the coal market always act as net information transmitters to the carbon market; and (4) the spillover effect of the system is asymmetric, wherein the system is more sensitive to negative information about price returns, and this asymmetry is much greater when the system is active.

1. Introduction

In recent years, climate change and energy shortages have become global problems. To better control greenhouse gas emissions and improve energy efficiency, the European Union (EU) took the lead in introducing the Emission Trading Scheme (ETS) in 2005 [1]. ETS is a cap-and-trade scheme in which the regulated companies trade carbon allowances based on the caps set by the ETS and their own emissions [2]. After years of operation, ETS has been recognized as a cost-effective way to promote both carbon emission reduction and the development of renewable energy technology, and is gradually being adopted by regions and countries outside of Europe. It is worth mentioning that China’s ETS has rapidly developed in recent years and the role of China’s carbon trading market in promoting global carbon emission reduction has gradually emerged.
As the world’s largest developing country and second largest economy, China is the world’s largest consumer of energy production and has been working hard in recent years to fulfill its carbon emission reduction commitments. In 2009, China promised at the Copenhagen Climate Conference that by 2020, China’s carbon emission intensity would be reduced by 40–45% compared to 2005 [3]. By the end of 2020, China has achieved a 48% reduction in carbon emission intensity compared with 2005 [4]. In 2016, China signed the Paris Agreement, promising to reduce carbon emissions per unit of GDP by 60–65% by 2030 compared to 2005 and to increase the proportion of non-fossil fuels in primary energy consumption to 20% [5]. In order to achieve the emission reduction target, China has been actively exploring the construction of a carbon trading market in recent years. In 2013, China established its first carbon trading pilot market in Shenzhen. In the next few years, pilot markets such as in Beijing, Shanghai, Guangdong, Tianjin, Hubei, Chongqing, and Fujian have been established, and the construction of a national carbon trading market began. By 2017, China had established eight pilot carbon trading markets across the country. As of the end of August 2020, the cumulative transaction volume of China’s carbon trading pilots reached 406 million tons and the cumulative turnover reached 6.8 billion yuan [6]. In September 2020, China announced at the UN General Assembly that it will strive to reach the peak of carbon emissions by 2030 and achieve carbon neutrality by 2060 [7]. So far, China has become the first developing country among the world’s major emitters to set a carbon neutral deadline. This is a huge challenge for China, who has ranked first in total carbon emissions since 2006. Therefore, the further improvement of the construction of the carbon trading market is not only essential for China to achieve its emission reduction goals but also for the global carbon emission reduction process.
China has actively developed new energy industries in recent years to reduce carbon emissions, improve the energy consumption structure, and realize the low-carbon transition of economic development. In the past few years, the new energy sector has become one of the fastest growing sectors in China’s energy industry. According to the white paper “Energy in China’s New Era”, released by China in 2020, as of the end of 2019, the installed capacity of wind power, photovoltaic power, and biomass power had reached 210 GW, 204 GW, and 23.69 GW, respectively, all ranking first in the world [4]. Since 2010, China has invested approximately USD 818 billion in new energy power generation, accounting for 30% of global investment in new energy power generation during the same period [4]. In addition, new energy vehicles are developing rapidly. In 2019, the number of new energy vehicles increased by 1.2 million and new energy vehicle ownership reached 3.8 million, both accounting for half of the global total [4]. As of the end of 2019, China’s electric vehicle charging infrastructures reached 1.2 million [4]. The development of the new energy industry has also attracted a large number of financial market investors to invest in some new energy listed companies, such as new energy vehicle companies, photovoltaic cell companies, and power generation companies. These investments from the financial market are very important for new energy companies because the development of new energy often depends on the development and upgrading of technology, which requires a great amount of funds, otherwise the development of the new energy industry will be hindered. Therefore, studying the new energy financial market is of great significance for the development of the new energy industry.
The construction of the carbon trading market and the development of new energy are two important approaches to reduce the dependence on fossil energy and emissions of greenhouse gases. Therefore, policy-makers pay great attention to the interactions between carbon allowances, new energy, and fossil energy. In addition, investors in the market have begun to pay more and more attention to this issue because understanding the interactions between the three is conducive to investment portfolio optimization, risk management, and hedging of different assets. At present, there are abundant research results in the field regarding the relationship between the carbon trading market, fossil energy market, and new energy financial market. The following is a review of the existing literature from three aspects: interaction relationship between the carbon trading market and fossil energy market; fossil energy and new energy stock market; and carbon trading market and new energy capital market.
Fossil energy, as a carbon-intensive energy, is considered to be closely related to the carbon trading market. Many existing studies have shown that the price of fossil energy is an important factor affecting the carbon price. Alberola et al. found that in the early stages of EU ETS, crude oil, natural gas, coal, and electricity will significantly affect carbon prices, and this effect may be different before and after structural breaks [8]. Hammoudeh et al. and Balcılar et al. expanded the sample period and obtained similar conclusions. They constructed a Bayesian structural VAR model and found that crude oil, natural gas, coal, and electricity have different effects on the price of carbon allowances [9]. By building a Markov regime-switching GARCH model with dynamic conditional correlations, Balcılar et al. found that the price of carbon futures will be affected by the price volatility of natural gas, electricity, and coal futures [10]. Some scholars believe that energy prices affect carbon prices through switching prices. Creti et al. emphasized that in Phase II of EU ETS, crude oil prices, stock price indices, and the switching price between coal and natural gas are significant long-term determinants of carbon prices [11]. Boersen and Scholtens found that the price of oil, natural gas, electricity, and the switching price of coal and natural gas will affect carbon prices through building the GARCH model [12]. In addition, some studies show that there is not only a unidirectional driving relationship between energy price and carbon price. Keppler and Mansanet-Bataller conducted a Granger causality test for EU ETS and found that there is unidirectional or bidirectional Granger causality between temperature, coal, gas, electricity, and the stock market or carbon market [13]. Cao and Xu used a Granger causality test on the relationship between carbon markets and energy markets throughout the Phase II of the EU ETS. They found that in the long run, there is a bidirectional Granger causality relationship between coal and carbon markets [14]. Wang and Guo also considered the interactions between the carbon market, crude oil, and natural gas market, and investigated the return and volatility spillovers between the markets. They found that the WTI crude oil market has a stronger spillover effect on the system compared to the Brent and natural gas markets [15]. Lee and Yoon found that compared with biofuels, the price of Brent oil has a stronger spillover effect on the price of EU carbon allowances [16]. Wu et al. came to different conclusions from a non-linear perspective. They stated that the impact of crude oil market volatility on the carbon market is far less than the impact of the coal and natural gas markets on the carbon market [17]. Yu et al. believed that while there may be no correlation between crude oil and the carbon market on a short-time scale, there is a strong linear or non-linear relationship between the two markets on a medium-time scale and long-time scale [18]. It can be seen from the above literature that although scholars have various conclusions regarding the relationship between the energy market and the carbon market, it is generally believed that there is a close relationship between the carbon market and the fossil energy market.
The development of the new energy industry requires a large amount of innovation and research investment, and thus the new energy stock market is very important as a financing market for the industry. Meanwhile, the price of fossil energy is considered an important factor influencing the profitability of new energy projects. Therefore, the relationship between the investment in clean energy and the price of traditional fossil energy has attracted more and more attention with the massive development and utilization of clean energy worldwide. The relationship between crude oil and the new energy stock market has become a hot topic in this field. Some of these scholars believe that fossil energy such as oil is an important factor in the price of new energy stocks. Henriques and Sadorsky stated that oil price is the Granger cause of the clean energy stock price [19]. Kumar et al. believed that clean energy stocks are affected by oil price, high-tech stock price, and interest rates [20]. By introducing the Wavelet method, Reboredo et al. found that the correlation between oil price and new energy stock price in the short-term is very low and there is no Granger causality, but in the medium and long-term time scales, the correlation is enhanced and Granger causality exists [21]. Through the research on the energy sector implied volatility index (VXXLE) and clean energy exchange-traded funds (ETFs), Dutta et al. found that the volatility of the energy sector has a negative impact on clean energy price returns and that the energy sector plays an important role in the price changes of clean energy ETFs [22]. In addition to oil, Reboredo and Ugolini also studied the impact of natural gas, electricity, and coal price on new energy stock price. They found that in the United States and Europe, oil and electricity prices are the main factors affecting the price of new energy stocks in the United States and there is a positive dependence between energy prices and the return of new energy stocks [23]. Song et al. stressed that compared with the coal and natural gas markets, the oil market has a greater impact on the returns and volatility of new energy stock price [24]. Xia et al. found that different fossil energies have varying degrees of impact on the price of new energy stocks and the interactions between the oil and coal price and the return of the new energy stock price are more active [25]. However, some other scholars believe that there is no significant correlation between oil price and new energy stock market. By constructing the GARCH model, Sadorsky found that the correlation between clean energy stocks and technology stocks is higher than that between clean energy and oil price, and investing in crude oil can effectively hedge the risks generated by investing in new energy stocks [26]. Similarly, Ahmad stressed that the interdependence between crude oil and clean energy stocks is very limited when considering technology stocks [27]. Taking the United States as an example, Ferrer et al. found that crude oil price do not seem to be a key factor in the price volatility of the stock price of clean energy companies [28]. It can be seen that previous studies have different views on the relationship between traditional energy prices and the financial performance of new energy companies, and this field is worthy of further study.
Although there are few studies on the carbon trading market and new energy financial market, existing studies have shown that there is a close relationship between the carbon trading market and macroeconomic factors. The macroeconomic situation is closely correlated to companies’ production activities and the production activities directly affect the companies’ carbon emissions; therefore, economic factors will affect the supply and demand of carbon allowances. Some studies suggest that carbon markets are related to macroeconomic factors. Sousa et al. selected the European stock market FTSEurofirst 300 Index as an economic variable and found that carbon price is not only related to fossil energy prices but also to economic growth trends [29]. Koch et al. came to a similar conclusion that in Phase II and in the early Phase Ⅲ of the EU ETS, economic factors have the greatest explanatory power for carbon price changes among the fundamental factors [30]. Lutz et al. stated that the stock market and energy price are the most important drivers of carbon price [31]. Yuan and Yang established a Gas-DCS-Copula and found that the uncertainty of the financial market has a considerable asymmetric risk spillover effect on the carbon market [32]. Considering that both fossil energy and macroeconomic factors are closely related to the new energy capital market, this paper believes that the relationship between the new energy capital market and the carbon trading market is also worthy of in-depth study.
There are also some studies that have focused on the relationship between China’s carbon trading market, traditional energy market, and new energy financial market. First, some scholars have explored the relationship between carbon allowance prices and energy prices in China. Zeng et al. investigated the relationship between Beijing carbon allowance prices, macroeconomic factors, and fossil energy prices by constructing a structural vector autoregression (SVAR) model and found that the carbon allowance price is mainly affected by its own historical price, and there is an insignificant but positive correlation between the price of crude oil, the price of natural gas, and economic development [33]. Chang et al. employed the DCC-GARCH model to respectively study the relationship between spot prices of carbon allowances in China’s five pilot carbon trading markets and the prices of coal, crude oil, and natural gas, and found that the volatility of the three energy prices have a long-term or short-term impact on the spot prices of carbon allowances; from the perspective of dynamic correlation, however, the spillover effect between energy price volatility and carbon allowance price volatility was relative low [34]. Second, some scholars have conducted research on the relationship between the fossil energy market and new energy stocks. Zhang and Du found that the volatility of new energy stocks will not affect the stock prices of fossil energy companies and the correlation between the two is lower than that of new energy and high-tech stocks [35]. Wen et al. built an asymmetric BEKK model and found that positive information about new energy stock price returns leads to a decline in the fossil fuel stock price return, while positive information about fossil fuel stock price returns leads to an increase in the new energy stock price returns [36]. Chang et al. studied the dependence structure between China’s carbon trading pilot markets and three major energy markets, namely coal, oil and natural gas, and found that there are significant regional differences in the dependence relationship between the carbon market and energy market [37]. In addition, there are a few studies on the relationship between China’s new energy stock market, fossil energy, and the carbon trading market. Lin and Chen studied the volatility spillover effect on the new energy stock market, coal market, and carbon trading market by establishing multivariate GARCH models and found that there is no significant volatility spillover effect between China’s carbon market and the fossil energy market, or between the carbon market and new energy stock market [38]. Jiang et al. introduced a multivariate wavelet method to investigate the dynamic correlation between the new energy stock market, coal market, and carbon trading market under different time-frequencies [39].
It can be seen from the above literature that although there is abundant research on the carbon trading market, new energy stock market, and fossil energy market, there are still some research gaps, which are mainly reflected in the following two aspects. One aspect concerns the fact that many previous studies have mainly focused on mature carbon trading markets in Europe or the US, but research on China, an emerging carbon trading market, is limited. However, the research on China’s carbon trading market is very important. This is because China has been the world’s largest emitter of greenhouse gases since 2006 and the efficiency of China’s emission reduction work is critical to the progress of global greenhouse gas reduction. At the same time, with the proposal of carbon neutral and carbon emission peak targets, China will accelerate the improvement and development of the carbon trading market, and research on China’s carbon trading market will be an important complement to the current research on carbon trading markets. Moreover, the study of China’s carbon trading market can provide reference for the construction of other emerging carbon trading markets. The second aspect concerns the fact that previous studies on the carbon trading market, new energy stock market, and fossil energy market have focused on the interactions between the two markets, and there are few studies considering the interactions between them from a systematic perspective. In contrast, conducting research from a system perspective can help in gaining a better understanding of the relationship between the three, which allows investors to engage in asset portfolio optimization and risk management, and is also conducive to policy-makers to establish effective policies. In consideration of the above research gap, this paper selects the Hubei carbon trading pilot market and builds a connectedness network model, as proposed by Diebold and Yilmaz, to study the time-varying spillover effect and asymmetry of the spillover effect of China’s carbon trading market, fossil energy market, and new energy stock market from 20 June 2014 to 18 September 2020 [40].
The purpose of this paper is to explore the interactions between the three markets from a systematic perspective and to provide more information for investors and policy-makers by studying the quantitative spillovers among markets in the carbon–energy–stock system in China. The contributions of this paper are as follows:
(1) This may be the first study on the dynamic spillovers between China’s carbon trading market, fossil energy market, and new energy stock market from a systematic perspective. Different from using VAR and GARCH models to study the spillovers between every two markets in turn, this paper constructs a connectedness network model to measure both the system-wide and pairwise spillovers in the carbon–energy–stock system.
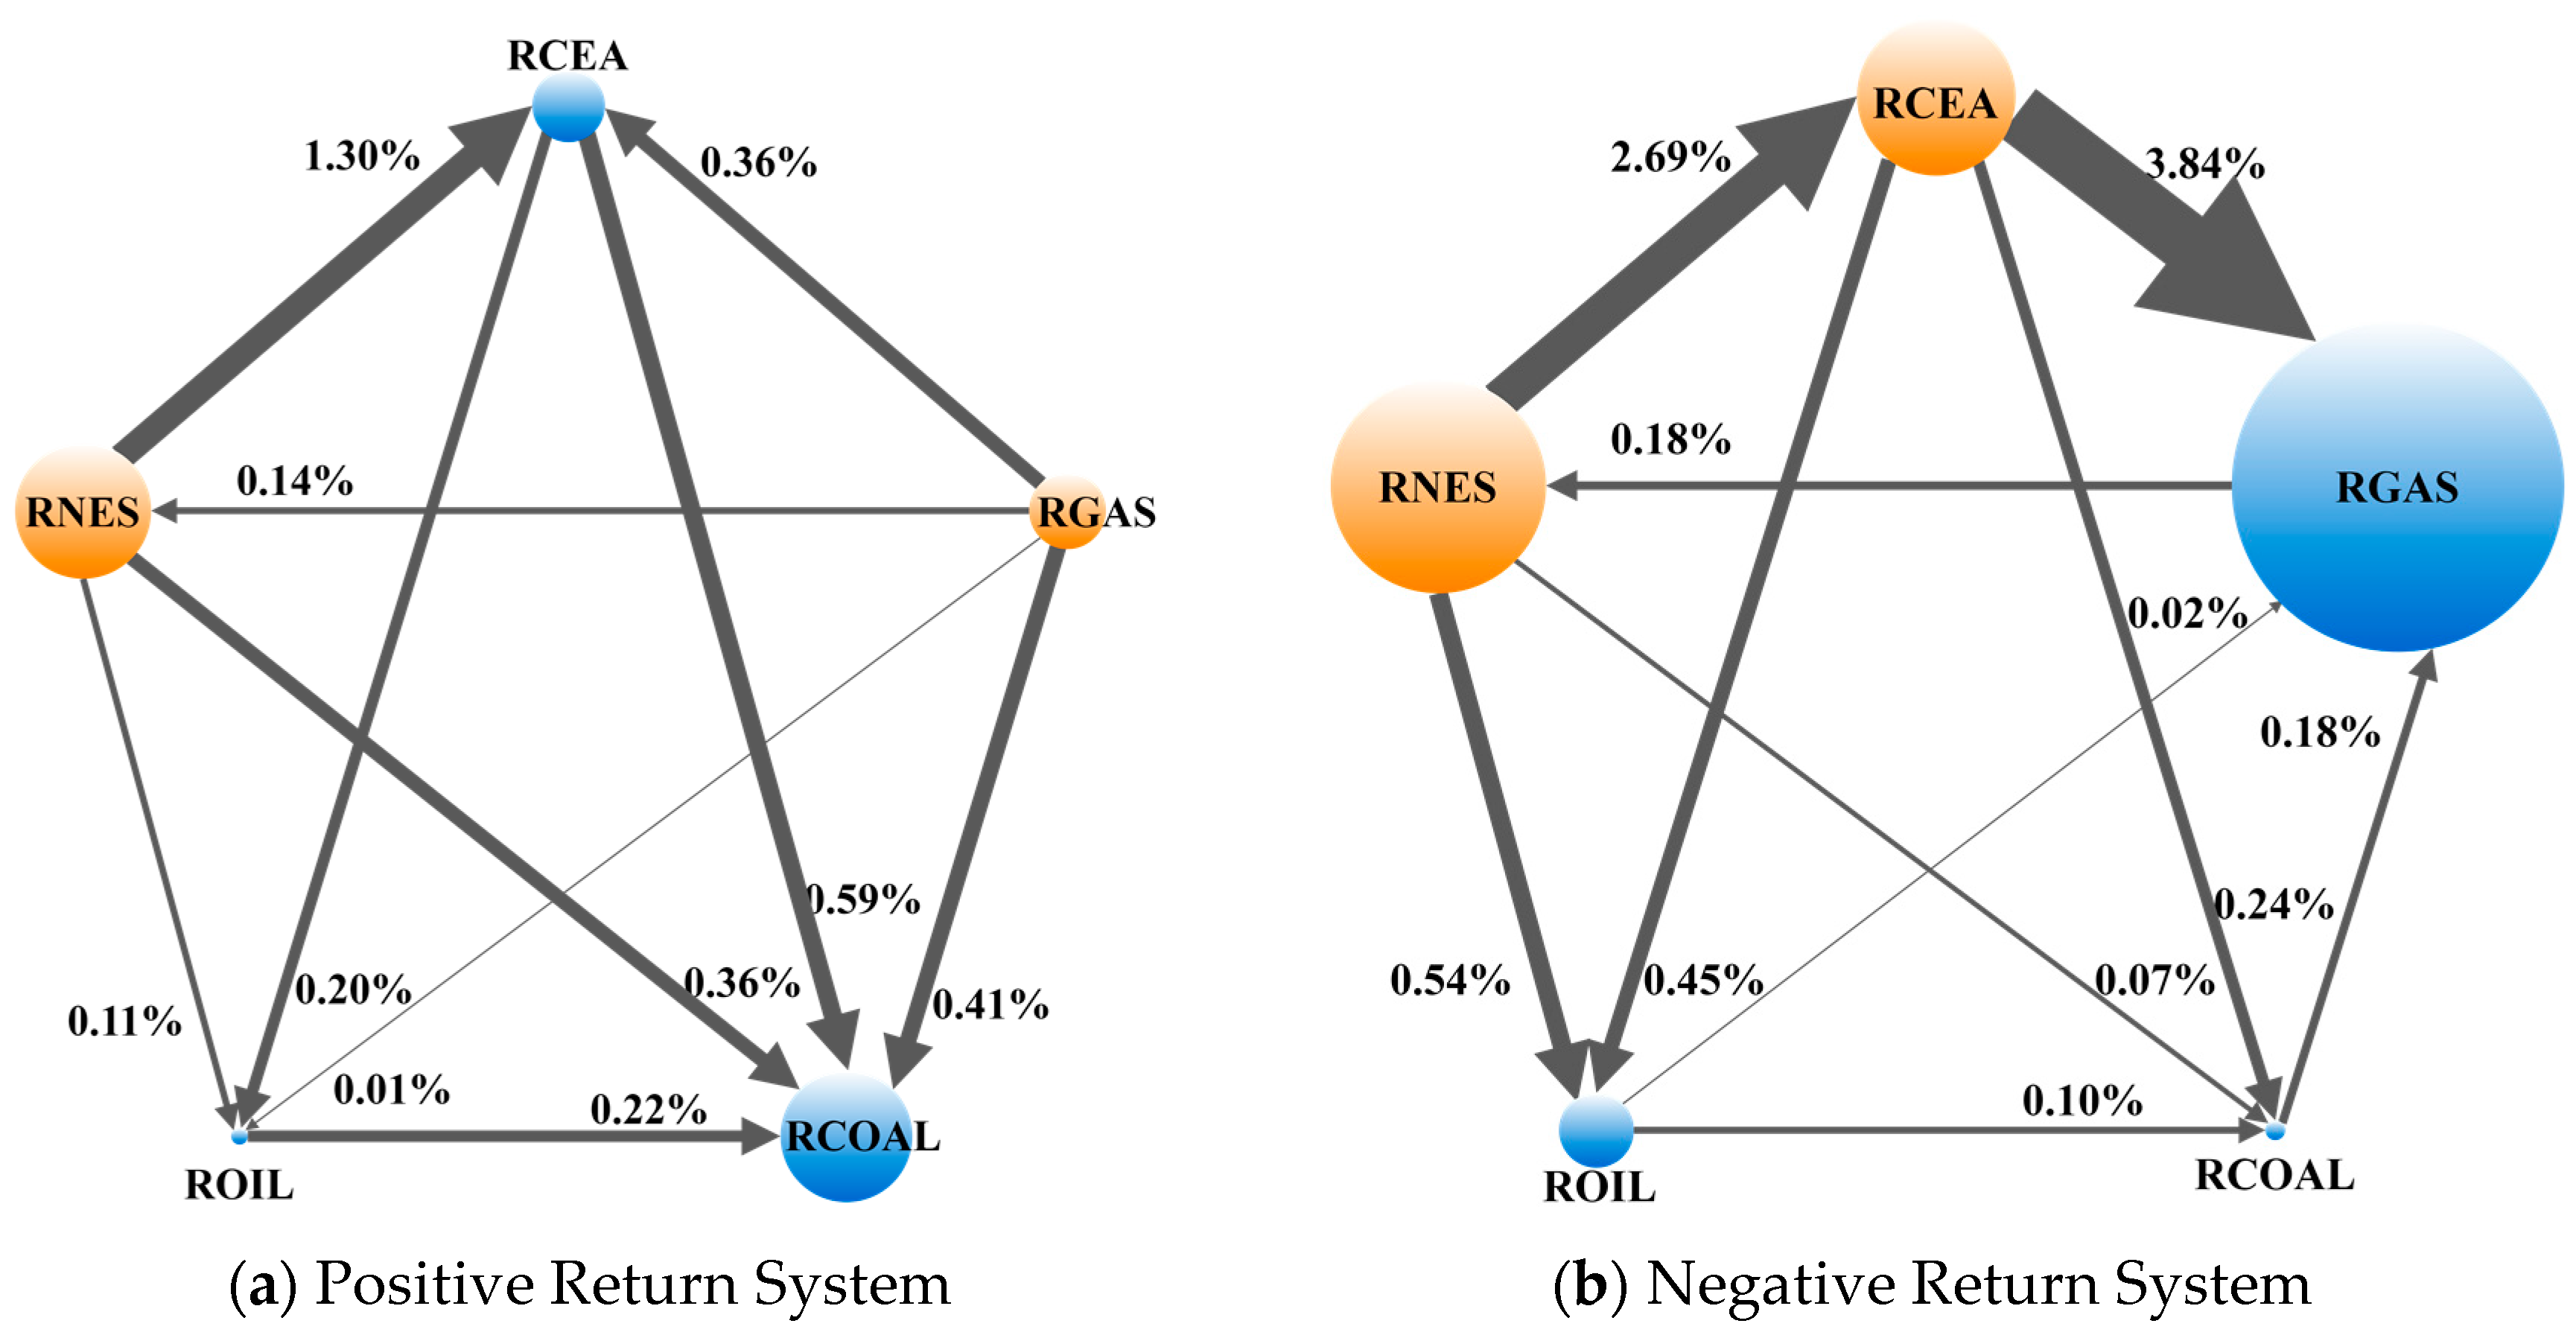
(2) Although there have been previous studies on the spillover effect between China’s carbon trading market, fossil energy market, and new energy stock market, there is no research on the asymmetry of the spillover effect of their spillover effect. This paper studies the asymmetry of the spillover effect by constructing a positive return connectedness network and a negative return connectedness network. The results show that the spillover effect of the carbon–energy–stock system is asymmetric, that is, the system is more sensitive to the negative information about price returns. Research on the asymmetry of the spillover effect can provide important information for market investors and policy-makers.
(3) In previous studies on the relationship between China’s carbon trading market, fossil energy market, and new energy stock market, scholars often chose the oil or coal market as the representative of the fossil energy market, but this paper selects three fossil energy sources: oil, coal, and natural gas. Thus, this paper takes into account the interactions between different fossil energy markets when analyzing the relationship between fossil energy and other markets. This can also provide more evidence for the relationship between different energy sources and the carbon trading market, which is conducive to assessing the role of the carbon trading market in improving China’s energy consumption structure.
(4) The existing research mainly focuses on mature carbon trading markets in Europe or the US, while this paper is a research study on the emerging carbon trading market, namely China’s carbon trading market, which is an important complement to the existing research. China’s carbon trading market has a different market structure. So far, it is a decentralized carbon trading market composed of several pilot carbon trading markets throughout the country. The research on China’s carbon trading market is not only of great significance to China but also can provide reference for other emerging carbon trading markets. Moreover, promoting the improvement of China’s carbon emission reduction work and the development of the new energy industry is conducive to accelerating the process of global carbon emission reduction; thus, the research in this paper has important theoretical and practical significance.
The structure of the remainder of this paper is as follows: Section 2 introduces the connectedness network model; 
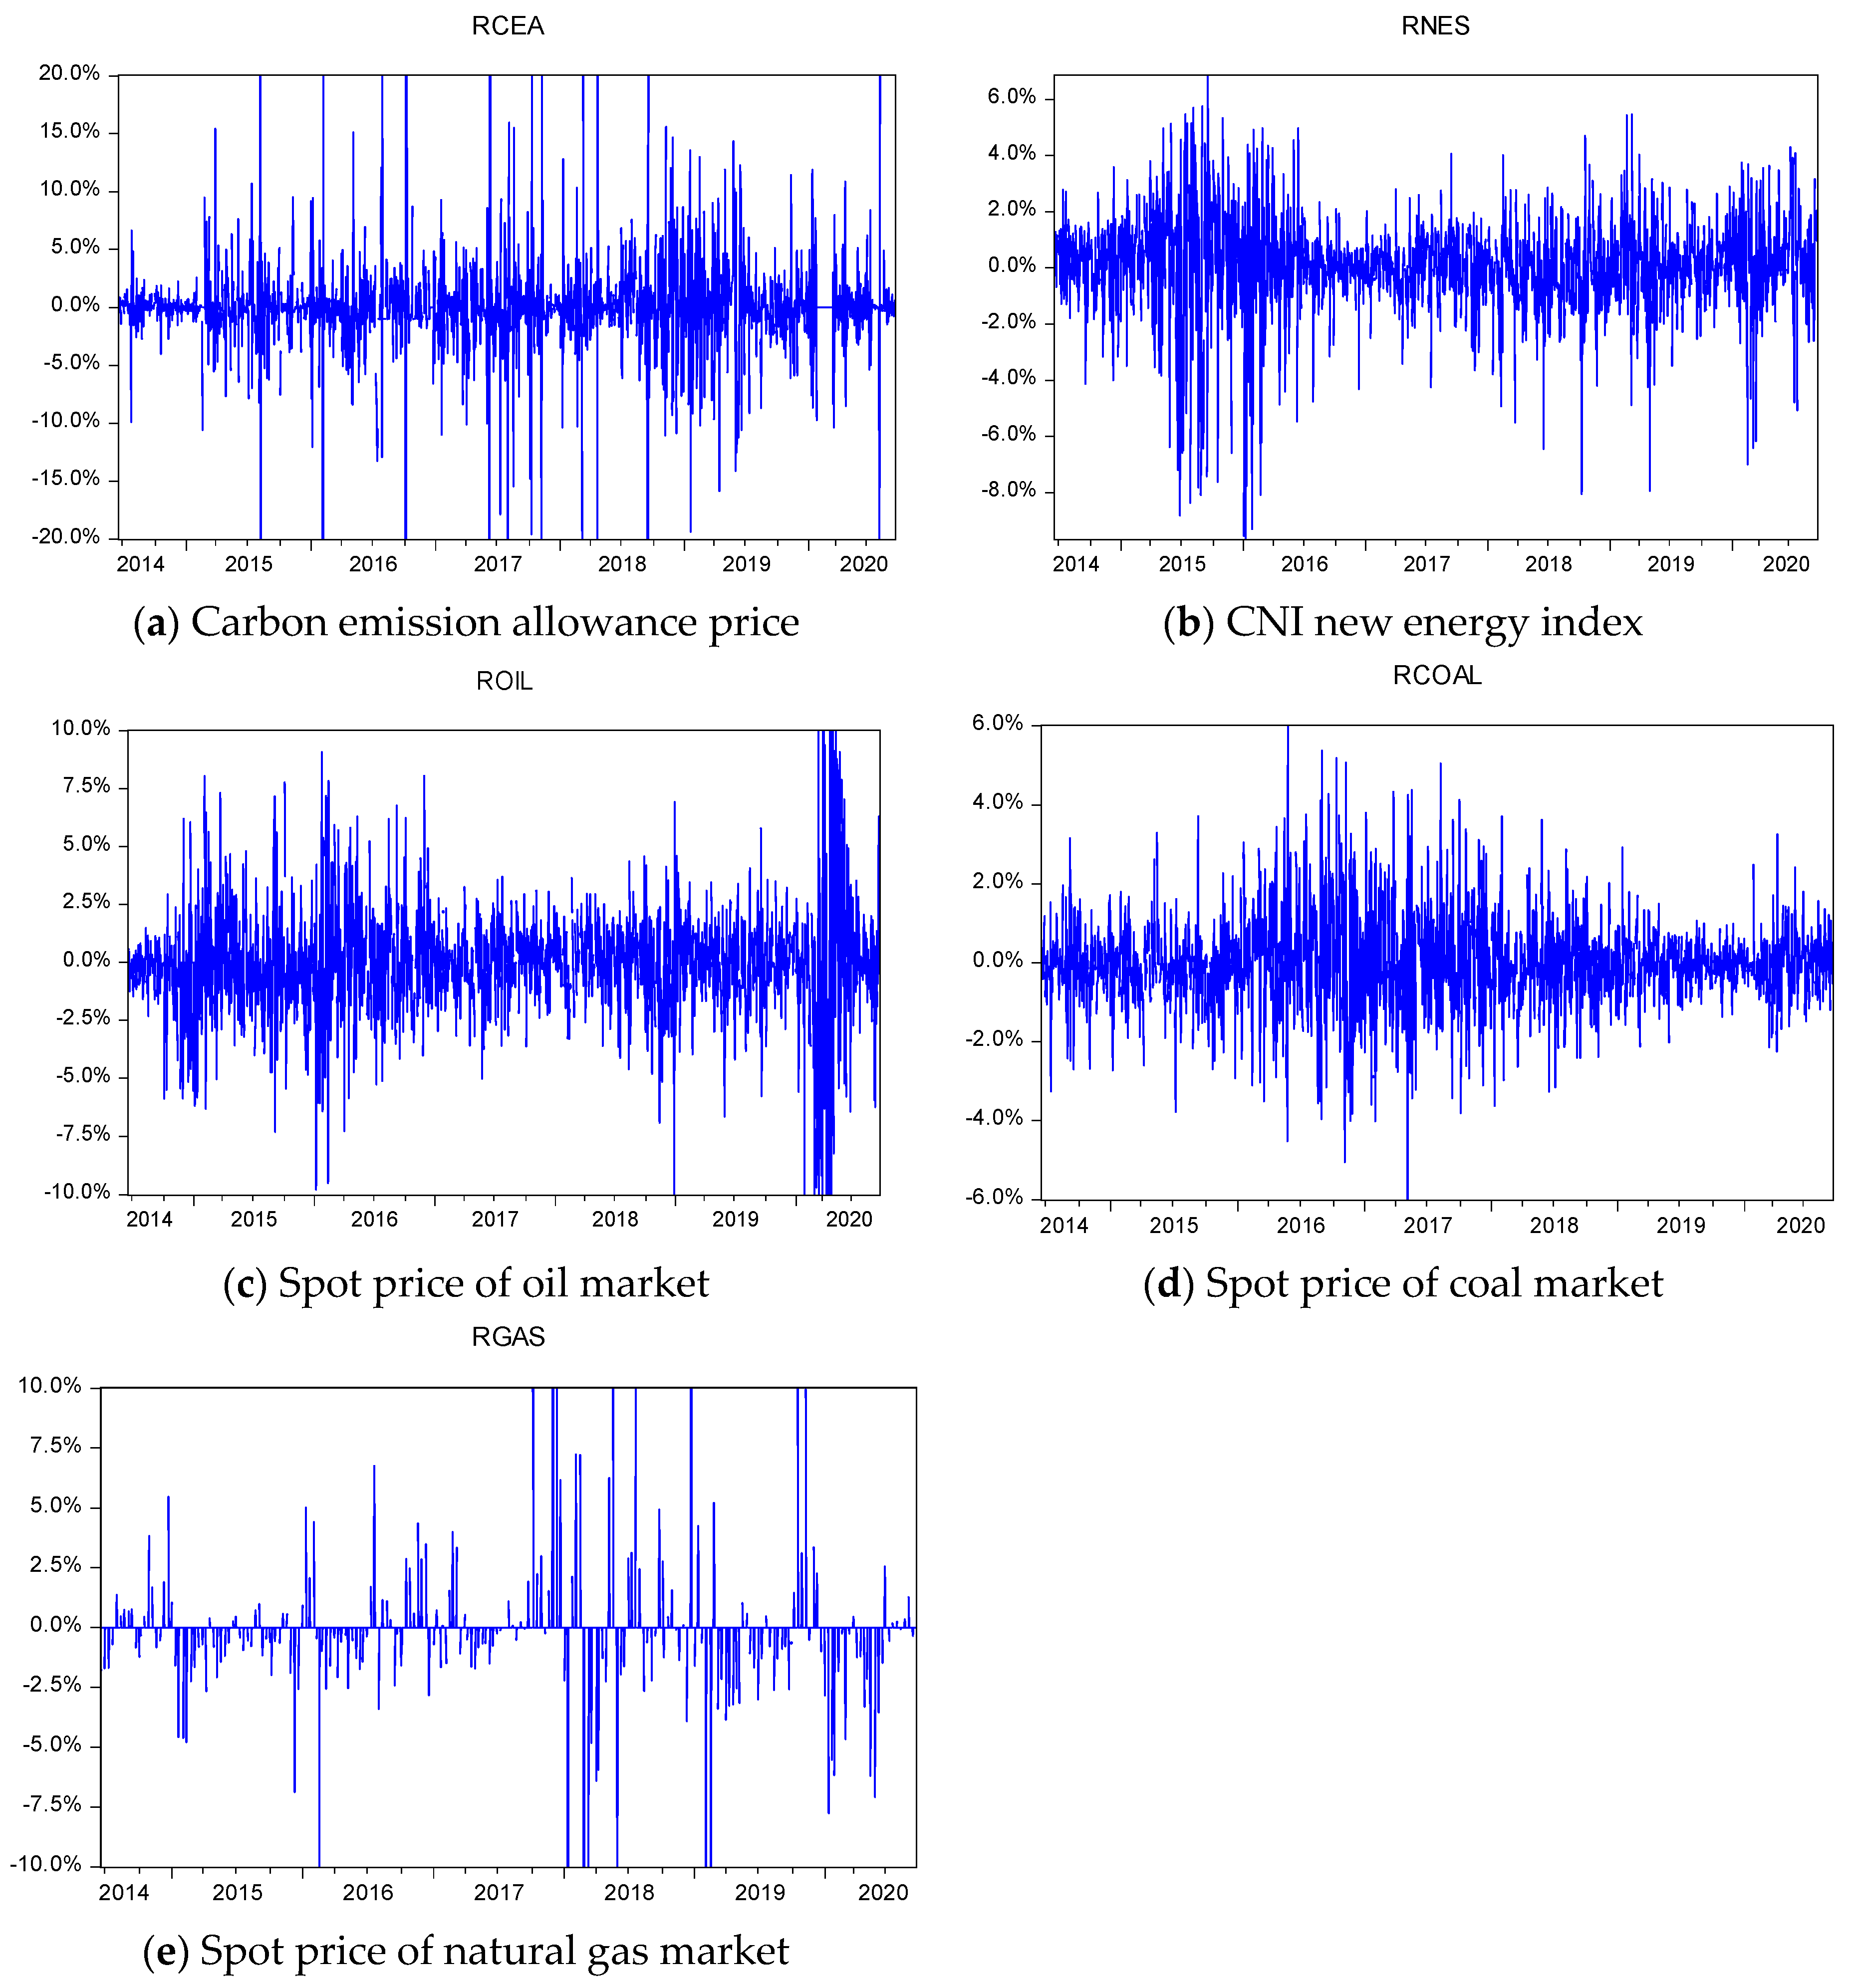
Section 3 explains the contents of the variables and the source of the data, and makes a preliminary analysis of the original data; in Section 4, we investigate the spillover from the static and dynamic perspectives of the carbon–energy–stock connectedness network and analyze the asymmetry of the spillover effect; lastly, Section 5 summarizes the main findings of this paper and makes recommendations for policy-makers and market investors.

2. Methodology

In order to study the spillover effect of the carbon–energy–stock system, this paper introduces the connectedness network method proposed by Diebold and Yilmaz in 2014 [40]. This method is based on forecast error variance decompositions from vector auto regressions (VAR). Different from standard approaches relying on Cholesky factorization, the result of variance decomposition in this method proposed by Diebold and Yilmaz is invariant to the ordering of the variables. In addition, this method can not only measure the pairwise spillovers between variables but can also measure the spillovers of the whole system.
First, we establish a standard p-order lag VAR model with N variables.
R t = i = 1 p Φ i R t i + ϵ t
where R t is an N × 1 vector, which can be expressed as, R t = ( R 1 t , , R n t ) T . In this paper, R t is a 5 × 1 vector that includes the prices of oil, natural gas, coal, clean energy, and carbon allowances. Φ i is an N × N vector autoregressive coefficient matrix. The error term ϵ t is a vector of independently and identically distributed disturbances. Equation (1) can also be expressed by the equation of the moving average, that is,   R t = A i ϵ t i . A i = Φ 1 A i 1 + Φ 1 A i 1 + + Φ p A i p , A 0 is an N × N identity matrix. Additionally, this applies when k < 0 , A k = 0 . Based on the generalized variance decomposition framework proposed by Koop et al. and Pesaran and Shin, Diebold and Yilmaz defined variable j’s contribution to variable i’s H-step-ahead generalized forecast error variance as that in [40,41,42].
θ i j ( H ) = σ j j 1 h = 0 H 1 ( e i A h Σ ϵ e j ) 2 h = 0 H 1 ( e i A h Σ ϵ A h e i )
where Σ ϵ is the variance matrix of error vector ϵ ; σ j j is the standard deviation of the error term of the j-th variable; e i is a selection variable whose i-th element is 1, and the other elements are 0. θ i j ( H ) measures the pairwise directional connectedness between variable i and variable j, which can also be denoted as S i j H .
In order to make the sum of each row of the variance decomposition matrix (the matrix with the ij-th element in Equation (2)) equal to 1, the elements in the matrix are normalized.
θ ˜ i j ( H ) = θ i j ( H ) j = 1 N θ i j ( H )
Now, j = 1 N θ ˜ i j ( H ) = 1 and i . j = 1 N θ ˜ i j ( H ) = N . Sometimes, we need to measure the net pairwise directional connectedness between variables
S i j = S i j ( H ) S j i ( H )
If the net connectedness between the two variables is positive, it means that variable i is a net information transmitter to j, and if it is negative, it means that variable i is a net information receiver from j.
To determine how all variables together contribute to a single variable, the total directional connectedness from all variables to i is defined as
S i   ( H ) = j = 1 i j N θ ˜ i j ( H ) i , j = 1 N θ ˜ i j ( H ) × 100
The total directional connectedness from i to all variables is computed as
S   j ( H ) = j = 1 i j N θ ˜ j i ( H ) i , j = 1 N θ ˜ i j ( H ) × 100
To determine the role of the market in the overall system as a net information transmitter or receiver, the net total directional connectedness is calculated as
S i ( H ) = S i   ( H ) S   i ( H )
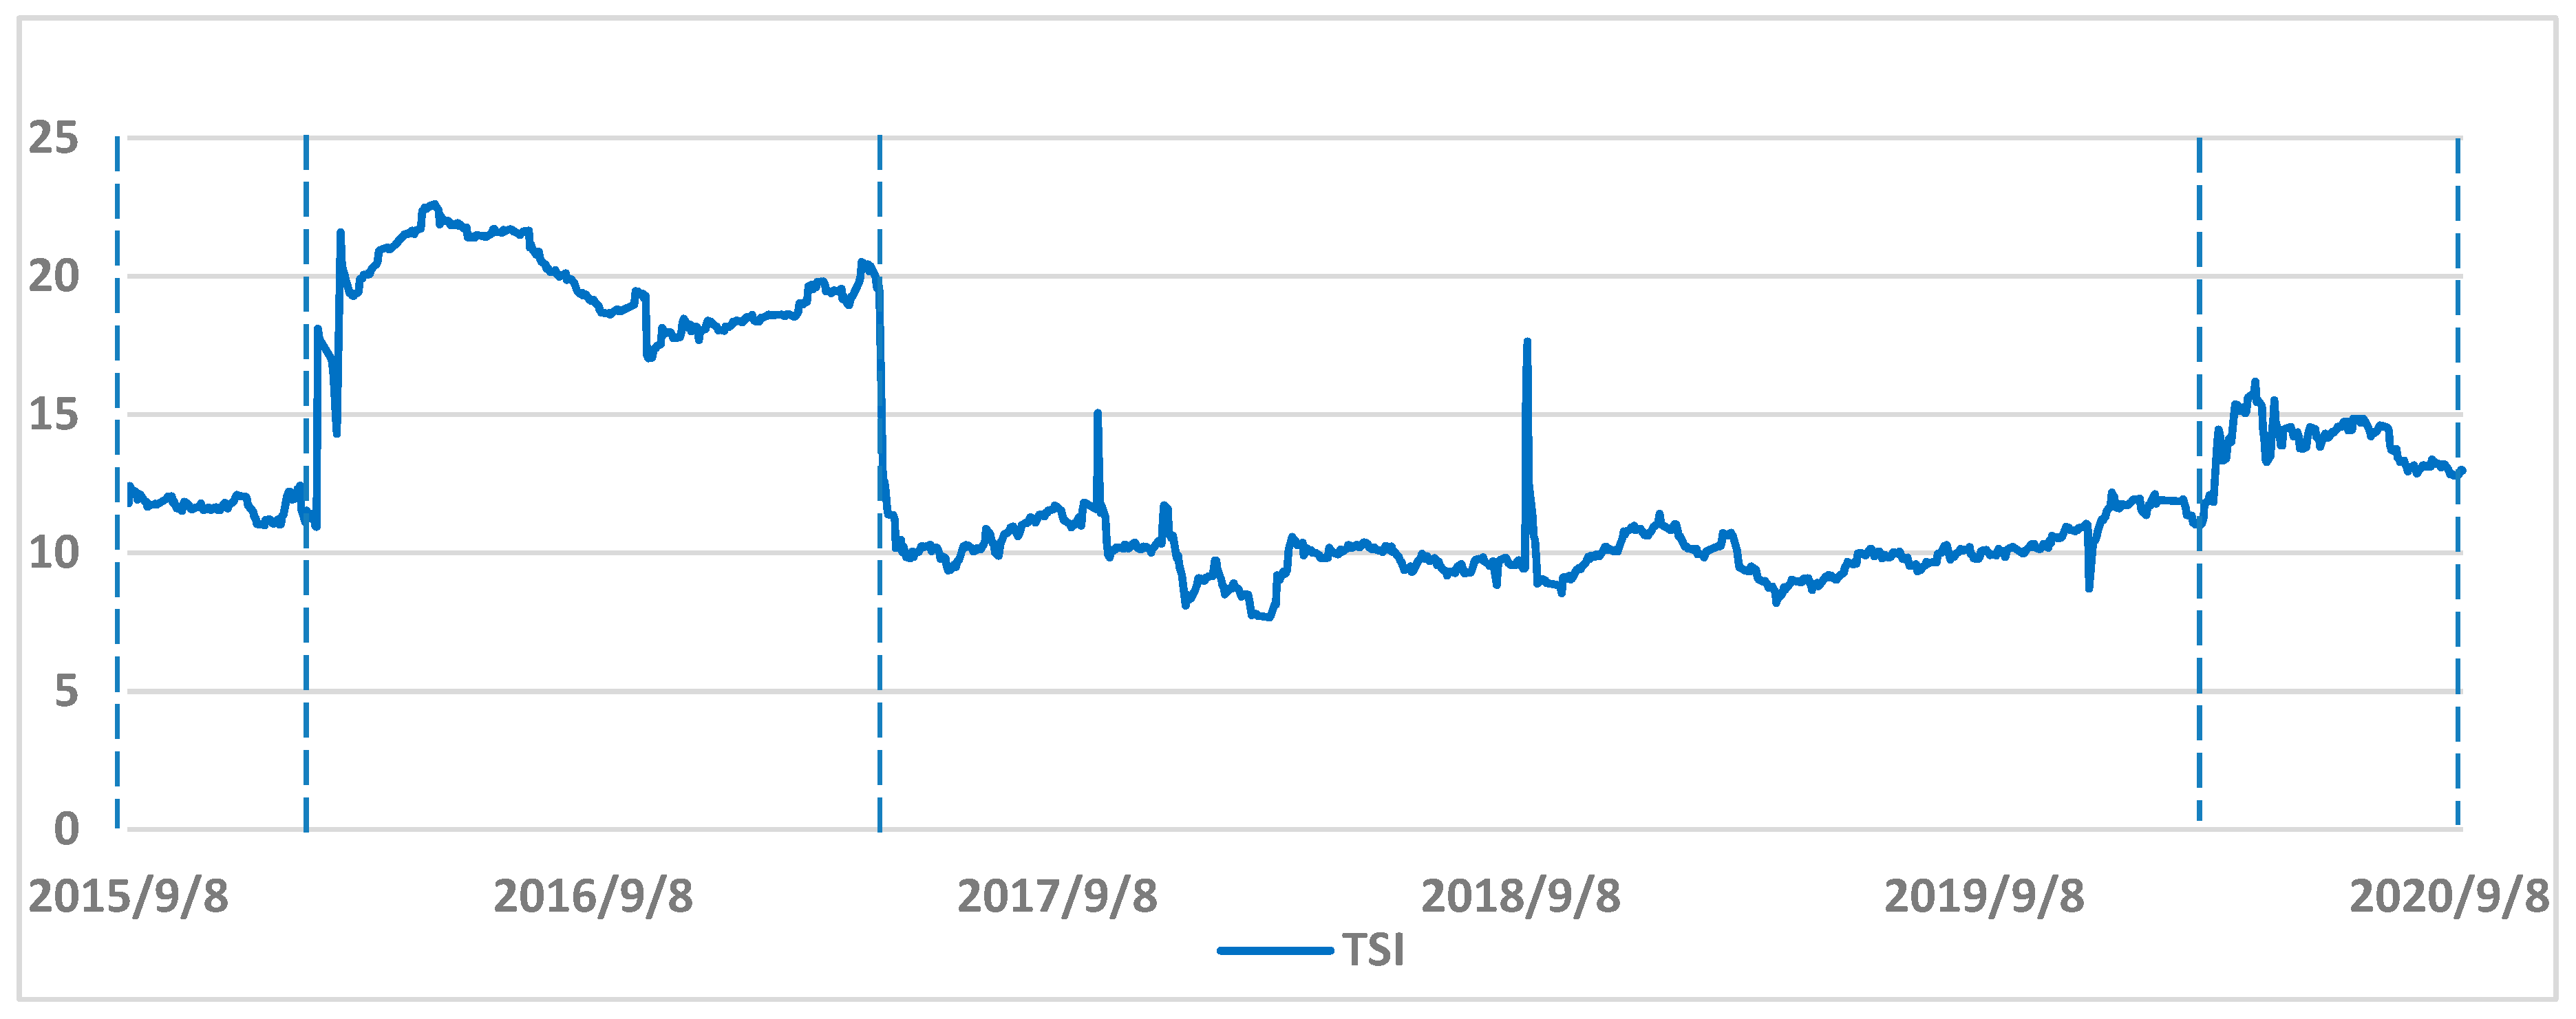
In order to get system-wide connectedness, the total spillover index of the system is computed as
T S I ( H ) = i , j = 1 i j N θ ˜ i j ( H ) i , j = 1 N θ ˜ i j ( H ) × 100 = i , j = 1 i j N θ ˜ i j ( H ) N × 100
In order to study the asymmetry of market return volatility, it is necessary to construct the connectedness network of positive returns and negative returns. Referring to the research of Ji et al., this paper processed the original price return as follows to derive the time series of positive returns and negative returns [43]. When R t > 0 , set R + = R t , and otherwise set R + = 0 . Similarly, when R t < 0 , set R = R t , and otherwise set R = 0 
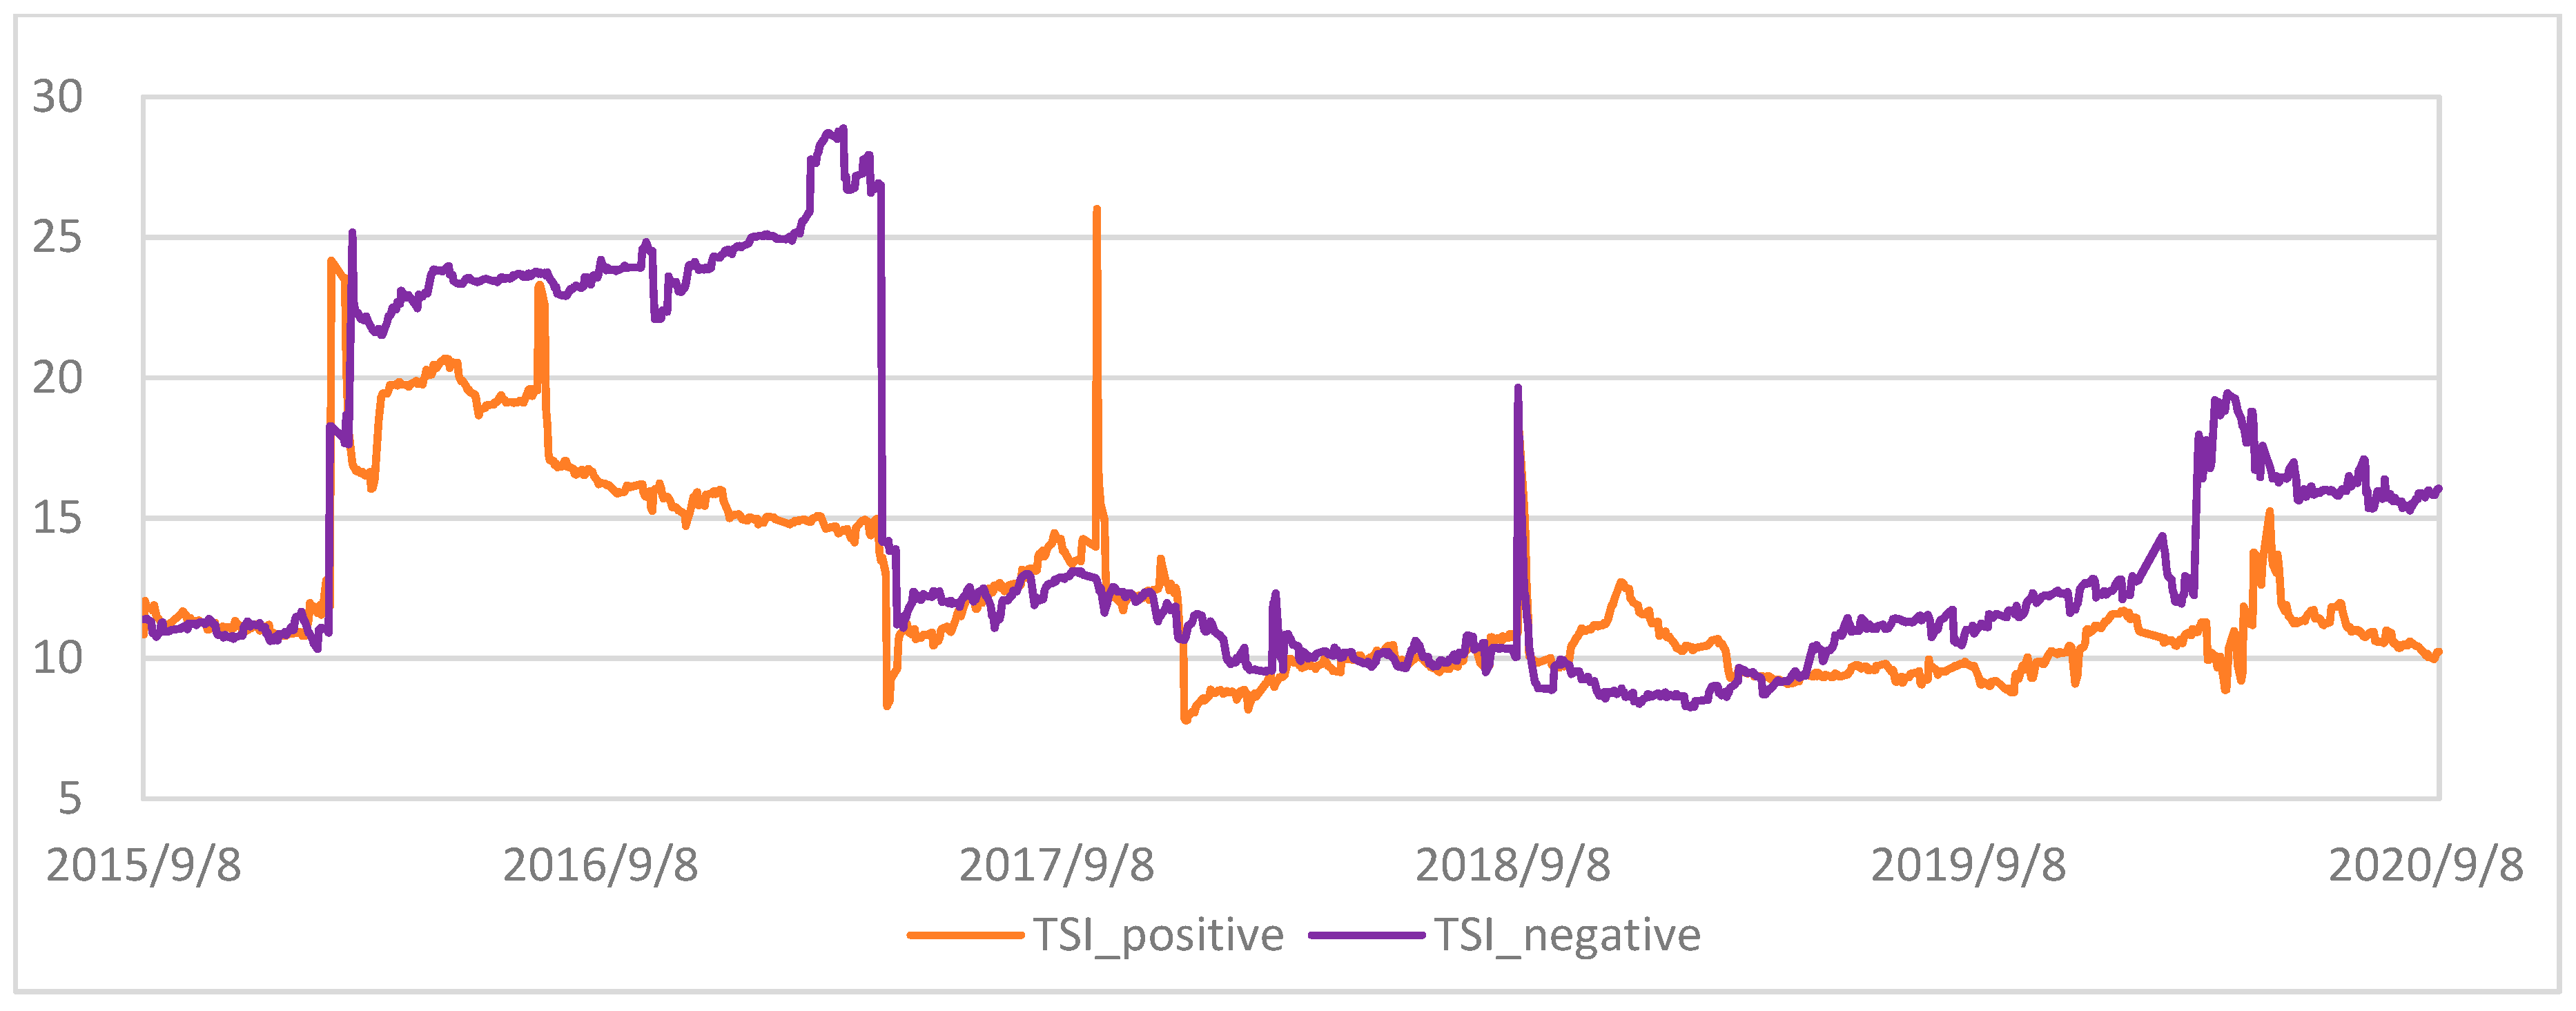
. The total spillover indexes of the positive and negative return connectedness networks are denoted as T S I + and T S I 
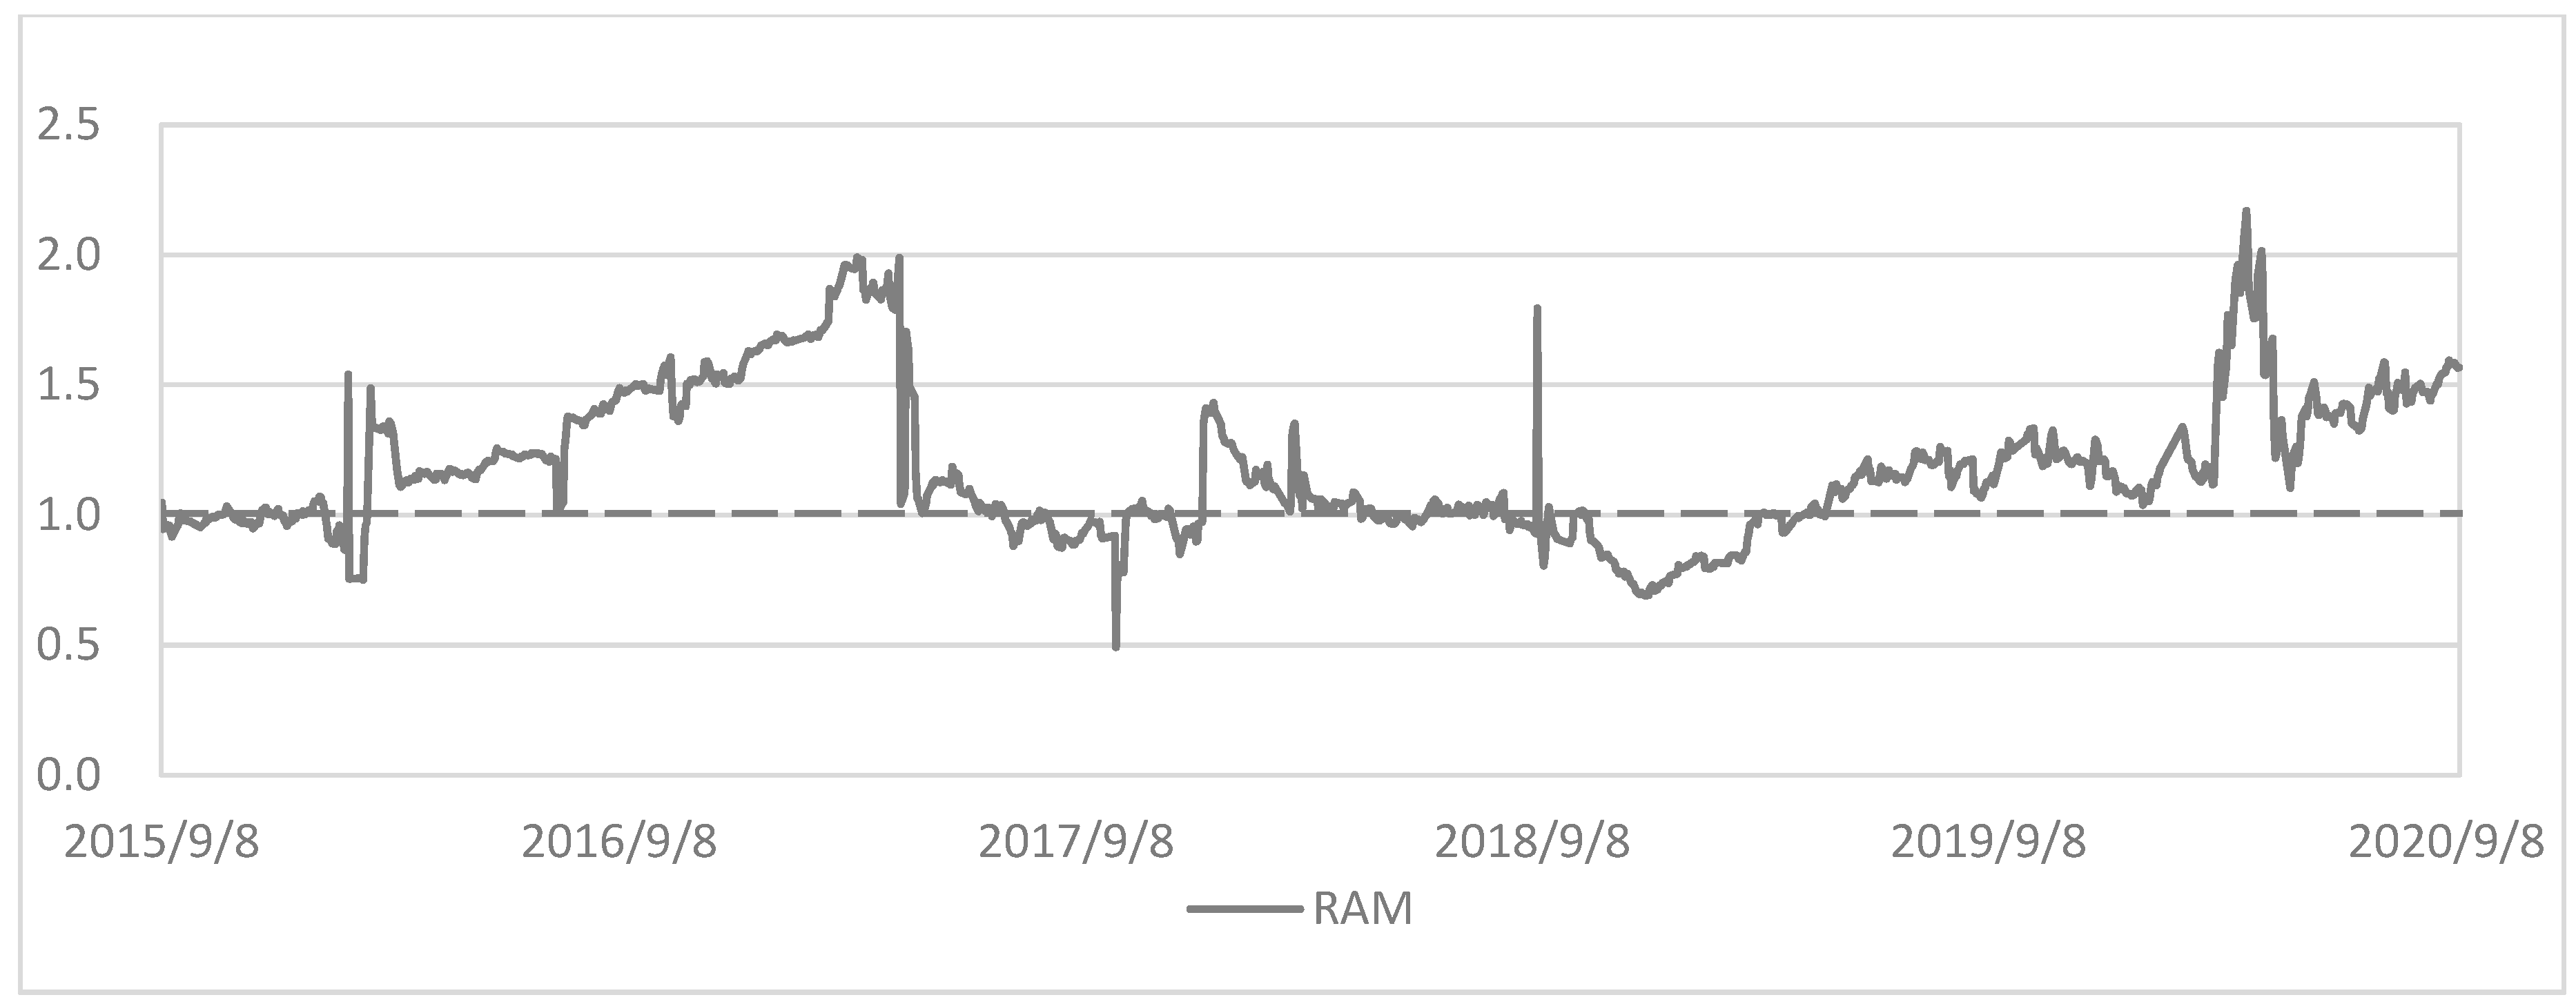
, respectively. Then, we define the spillover asymmetry measure as
S A M = T S I T S I +
When the system does not have asymmetry, S A M = 1 , which means that the system reacts to positive information as much as to negative information. When S A M 1 , it indicates that the system has asymmetry and there are two cases. When S A M < 1 , it indicates that the volatility of the system affected by positive information is greater than that of negative information. When S A M > 1 , it indicates that the system is more affected by negative information than by positive information. With the asymmetry of the spillover effect, we can know whether the system is more sensitive to positive or negative information about price returns.
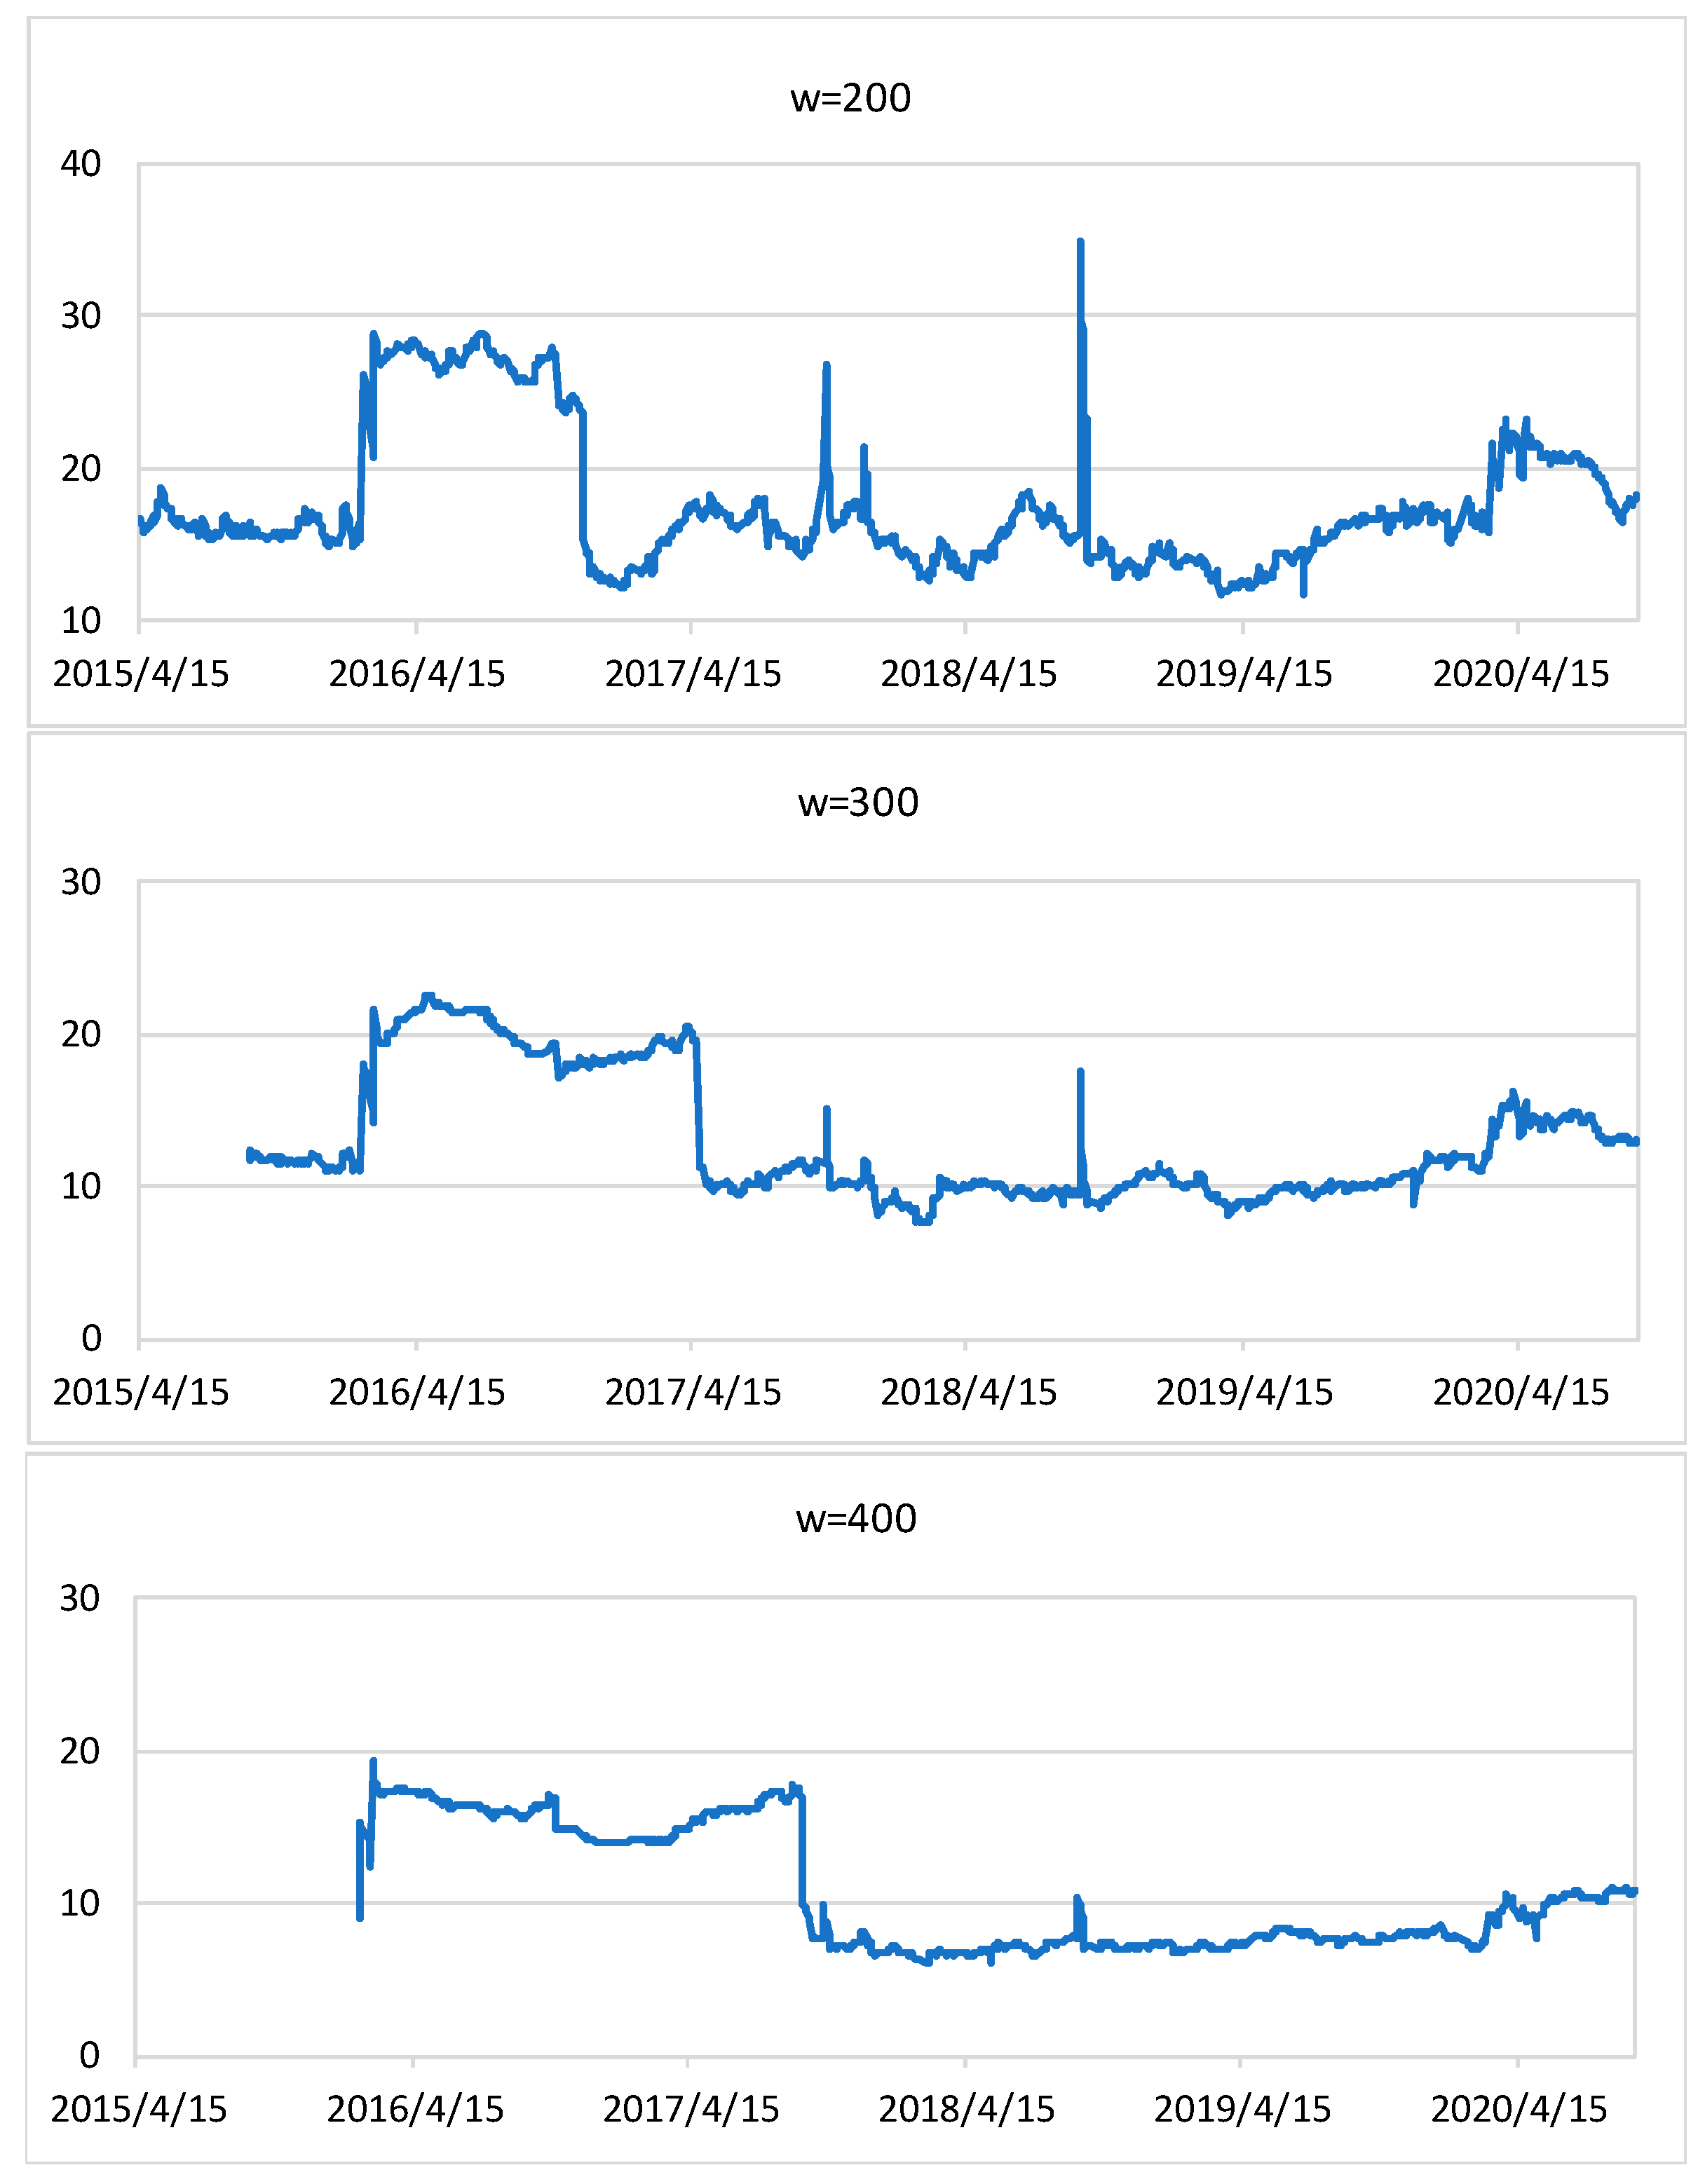
In order to study the dynamic spillovers between markets, the rolling window method is introduced. In the rolling window method, the full sample period is divided into several overlapping sub-sample periods and the connectedness network within each small sample period is studied. Then, time-varying characteristics of the volatility within the system are detected.

3. Variables and Data

This section is divided by subheadings. It should provide a concise and precise description of the experimental results and their interpretation, as well as the experimental conclusions that can be drawn.

3.1. Variables

This paper studies the spillover effect on China’s carbon trading market, fossil energy market, and new energy stock market. For these three markets, this paper selects a set of variables. For the fossil energy market, this paper selects the daily closing price of South China Sea crude oil, the daily closing price of thermal coal futures contract, and the daily trading price of liquefied natural gas to represent the crude oil market, coal market, and natural gas market, respectively. For the new energy stock market, this paper selects the CNI new energy index. For the carbon trading market, this paper selects the daily trading price of carbon allowance in the Hubei carbon pilot market. The details of the variables selected in this paper are shown in Table 1.

3.2. Data

In order to study the spillover effect on China’s carbon trading market, fossil energy market, and stock market of new energy companies, this paper selects the daily trading price of carbon allowance of the Hubei carbon trading pilot market; the daily closing price of the South China Sea crude oil market; the daily closing price of thermal coal futures; the daily market price of liquefied natural gas; and the daily closing price of the stock price of new energy companies as sample data. The full sample period was from 20 June 2014 to 18 September 2020 for a total of 1522 available daily observations. Data sources are shown in Table 1.

3.2.1. Carbon Emission Trading Market

Among the eight pilot markets in China, this paper selects the daily trading price of carbon allowances in the Hubei carbon trading pilot market, which is mainly based on the following three reasons. Firstly, the Hubei carbon trading pilot market has been running for a long time and sufficient data can be obtained. The Hubei carbon trading pilot market officially started operation on 7 April 2014 and has been operating stably for more than 6 years as of 2020. Second, the Hubei carbon trading pilot market is more active. Its carbon trading volume and carbon trading turnover have long been ranked first in the country [38]. Thus, more representative and effective data can be obtained from this pilot market. Third, the trading price of carbon allowances in the Hubei carbon trading pilot market is relatively stable and the price level is at the middle level in China’s pilot markets. Therefore, the Hubei carbon trading pilot market can better represent the operation of China’s carbon trading market. The data was sourced from the website of carbon k-line [6].

3.2.2. Stock Market of New Energy Companies

This paper selects the CNI new energy index to represent the stock price of Chinese new energy companies. The CNI new energy index is a stock index that can reflect the overall performance of listed companies in China’s new energy industry and new energy vehicle industry. The sample of the CNI new energy index includes 70 new energy or new energy vehicle companies listed in mainland China and it is regularly adjusted. The sample includes the companies in nuclear energy, solar energy, wind energy, biomass energy, new energy vehicle battery industry, etc., which can effectively represent the changes in the Chinese new energy companies’ stock value. In some previous studies, the index has also been selected as the price of China’s new energy market [37,38]. The data was downloaded from the WIND database [44].

3.2.3. Crude Oil Market

In this paper, the spot price of South China Sea crude oil is selected as the crude oil price. The crude oil market is an important part of the energy market and is closely related to the macroeconomic conditions of a region or country. Since crude oil futures have been officially traded in China since 2017, there are not enough observations. This paper chose the spot price of crude oil to represent the price of crude oil. China’s spot crude oil mainly includes China Daqing, China Shengli, and South China Sea crude oil, as well as others. By comparison, it is found that the prices of these three crude oil products have similar movements. Referencing the research of Chang et al., since the crude oil price in the South China Sea is more closely related to the international crude oil price, this paper finally selects the daily closing price of crude oil in the South China Sea [28]. We downloaded the data from the WIND database [44].

3.2.4. Coal Market

As for coal prices, this paper selects thermal coal futures prices. For a long time, China’s energy consumption structure has been dominated by coal and coal will remain one of the most important fossil energy sources in China for a long time to come. Therefore, the coal market is a very important part of China’s energy market. Moreover, the power generation industry is a key regulated industry in China’s carbon trading market and currently China’s power generation is dominated by thermal power generation. This establishes a very close connection between the coal market and the carbon trading market. In order to better represent the price of coal, this paper selects the price of thermal coal futures listed and traded on the Zhengzhou Commodity Exchange. The data was obtained from the WIND database [44].

3.2.5. Natural Gas Market

In this paper, the market price of LNG is used to represent the market price of natural gas. Liquid natural gas (LNG) is an important natural gas resource in China, which can well represent the utilization of natural gas. In addition, the market price of liquefied natural gas can well represent the transaction price level of spot transactions in the natural gas market. Therefore, this paper chose the market price of liquefied natural gas to represent the market price of natural gas. The series were extracted from the WIND database [44].

3.3. Preliminary Analysis of the Data

All the prices’ time series for fossil energy-related products and renewable energy stock are originally transferred to returns series by the logarithmic difference, as follows.
R t = 100 × L n ( P t / P t 1 )
The data after logarithm processing is shown in Figure 1.
Furthermore, this paper conducts a preliminary statistical analysis of these data and obtains Table 2. Table 2 shows that the carbon price has the highest standard deviation, which indicates that the carbon market has the largest price volatility. In addition, by comparing the maximum and minimum values of the five variables, we find that the fluctuation range of the carbon trading market price is much larger than for other variables. This suggests that participants in the carbon market take more risks. The oil market and natural gas prices fluctuate in the range of −39.4616, 37.0557 to −33.4422, 24.9173 respectively. Their price fluctuation range is much smaller than the carbon trading market but higher than the new energy stock market and coal market.

4. Empirical Analysis

This paper constructs the connectedness network model of the carbon-energy-stock system and calculates the connectedness from the static and dynamic perspectives. Additionally, the asymmetry of the system spillover effect is analyzed by building the connectedness network model of positive returns and negative returns. The full sample period was from June 20, 2014 to September 18, 2020 for a total of 1522 available daily observations.

4.1. Static Connectedness Analysis

This section constructs a VAR model with five variables including carbon price returns, new energy stock price returns, crude oil price returns, coal price returns, and natural gas price returns, and calculates the static connectedness of the original return system, positive return system, and negative return system.

4.1.1. Static Connectedness Analysis of the Original Return System

Basing on Equation (2), the connectedness matrix of the original return system is obtained, as shown in Table 3. From a system perspective, 3.57% of the changes in the carbon–energy–stock system can be explained by the interactions between markets within the system. This level is very low, indicating that the overall interaction between China’s carbon trading market, fossil energy market, and stock market of new energy companies is relatively weak. From the “To” row in Table 3, it can be seen that the new energy stock market has the largest contribution to system volatility (6.34%) and the contributions of other markets to system volatility are 4.44% (OIL), 3.53% (CEA), 2.31% (COAL), and 1.21% (GAS). In the system, each market transmits and receives information. Through the calculation of net connectedness, it can be known whether each market is a net information transmitter or a net information receiver in the system. Through the analysis of the net connectedness in Table 3, it is found that in the carbon–energy–stock system, the carbon market, crude oil market, and natural gas market are the net information receivers in the system, while the new energy stock market and coal market are the net information transmitters in the system. This shows that the new energy stock market and coal market have a certain leading role in the system.
Next, we analyzed the degree of connectedness between each market and other markets in the system. Specifically, there are different degrees of spillovers between each two markets, which indicates that there are different degrees of correlation between the markets. For the carbon trading market, the largest contributor to the volatility of its price returns is the new energy market stock system, which contributes 2.48%. The crude oil market, coal market, and natural gas market contribute less to the spillover of the carbon trading market than the new energy market, with a connectedness of 0.96%, 0.37%, and 0.30%, respectively. This shows that compared with other markets, the carbon market is most affected by the new energy market. Companies participating in carbon trading should pay more attention to the new energy market.
  • For the new energy stock market, the biggest contributor is the crude oil market, with a contribution of 2.43%. This may be due to the close connection between the crude oil market, macroeconomic market and the stock market. The carbon market, the natural gas market, and the coal market have relatively low contributions at 0.39%, 0.36%, and 0.28%, respectively.
  • For the crude oil market, its biggest contributor is the new energy stock market, which contributes 2.81%. Combined with the analysis of the new energy stock market, it can be seen that the crude oil market and new energy stock market are closely related. The coal market and carbon market contribute similarly to the volatility of crude oil prices, at 1.04% and 1.35%, respectively. The natural gas market contributes the least to crude oil price fluctuations at 0.19%.
  • As for the coal market, the analysis revealed that it is greatly influenced by the crude oil market and 0.79% of its volatility can be explained by the crude oil market. It is worth noting that the coal market has low connectedness with the carbon market, which indicates that the implementation of carbon trading in China has not yet had enough impact on the coal market. Therefore, the spillover of the carbon trading market to the coal market is relatively low. In other words, so far, carbon trading has not been enough to be a significant factor influencing whether regulated companies use coal as fuel. If the existing carbon trading mechanism is not improved, it will be difficult to change China’s strong dependence on coal use.
For the natural gas market, compared with other markets, the carbon market has the largest spillover to the natural gas market. This may be because when power generation companies are affected by the carbon trading mechanism and need to change the fuel mix for power generation, they tend to change the proportion of natural gas in their fuel mix. In order to further analyze the interactions between the markets, the difference in the connectedness between the two markets was calculated to obtain the net connectedness, as shown in Figure 2. In the figure, the direction of the arrow represents the spillover direction and the value represents the size of the information spillover. The new energy stock market is the information transmitter to the carbon market, crude oil market, coal market, and natural gas market, and its spillover to these markets is 2.09%, 0.38%, 0.11%, and 0.3%, respectively. This indicates that the new energy stock market has a certain leading role for other markets. The natural gas market is the information receiver to other markets in the system and the carbon market has a higher spillover degree to it, which indicates that the carbon market has a greater impact on gas markets than other natural gas alternatives in the system. This finding is of concern to participants in the natural gas market.

4.1.2. Static Connectedness Analysis of Positive and Negative Return Systems

This section constructs the connectedness network of the positive return system and the negative return system, and calculates the spillover matrix to analyze the asymmetry of the spillover effect of the system, as shown in Table 4 and Table 5.
It can be seen from Table 4 and Table 5 that the total spill-over index of the positive and negative return systems is 3.07% and 3.97%, respectively. According to Equation (9), the asymmetry coefficient is 1.29. In other words, the system is more sensitive to negative information about price returns than positive information about price returns.
Through the comparative analysis of Table 3, Table 4 and Table 5, the following findings can be obtained. First, the spillover index of the original return system is 3.57%, which is at a medium level among the three return systems. Second, in these three systems, the new energy stock market is the net information transmitter and the crude oil market is the net information receiver. Third, the new energy market is the largest net information transmitter in the three systems, with a net information spillover of 2.88%, 1.65%, and 3.15%. Fourth, the natural gas market is the largest net information receiver in both the full sample return system and the negative return system, with a net spillover of −1.96% and −3.85%, respectively. In the positive return system, the natural gas market is a weak in-formation transmitter, with a contribution of 0.95% to the system.
Similar to the study on the net spillover between the markets in the original return system, this section calculates the net spillover between the markets in both the positive return spillover system and the negative return spillover system, as depicted in Figure 3a,b. By comparing with Figure 2, we obtain following findings. First, in the original and the positive return system, the net spillovers between the new energy stock market and the carbon market are higher than that of other markets, at 2.09% and 1.30%, respectively. In the negative return system, the spillover between the new energy stock market and the carbon market is also relatively high (2.69%), which is only lower than the spillover between the carbon market and the natural gas system (3.84%). Second, in the original and the negative return system, the spillovers of the carbon market to the natural gas market are 1.33% and 3.84%, respectively, ranking second and first in each system. This shows that the carbon market plays a leading role for the natural gas market in these two systems. Third, the net spillovers between oil and natural gas are the lowest in all three systems, at 0.07%, 0.01%, and 0.02%, respectively. According to the spillovers between these two markets, as shown in Table 3, Table 4 and Table 5, it can be found that the low net spillovers are due to the similar and relatively low spillovers between the two markets.

4.2. Dynamic Connectedness Analysis

Based on the study of static connectedness, this section calculates the dynamic connectedness of the carbon–energy–stock system by introducing the method of rolling window and conducts a time-varying analysis of the asymmetry of the spillover effect. In this paper, 300 observations, which is about one fifth of the total observations, are selected as the window length.

4.2.1. Dynamic Connectedness Analysis of the Original Return System

Figure 4 depicts the trend of the spillover index of the system. The spillover indexes fluctuate within the range of 7.67% to 22.62%, with an average value of 12.99%. According to the trend of the total spillover index, the samples can be divided into four stages. In the first stage, the total spillover level is relatively low but stable. There is a clear distinction between the second stage and first stage. From the beginning of 2016 to the middle of 2017, the total spillover index rises greatly compared with the first stage and maintains at a relatively high level. In the third stage, the overall spillover level falls back to a relatively low level, which lasts until the end of 2019. In this stage, the total spillover index mostly fluctuates slightly around 10%. The fourth stage begins at the beginning of 2020: the total spillover index is at a higher level than the previous stage and during this stage the index is greater than 10%.
It is found that there may be a certain correlation between the spillover index and the changes in energy market prices. During the first stage of the spillover index, affected by the decline of international crude oil prices and turbulence of the stock market, China’s energy market was relatively depressed. During this period, both crude oil and coal prices in China were on a downward trend, which continued into early 2016. In the second stage with a higher spillover index, the prices of crude oil and coal in China showed an obvious upward trend, the trading in the energy market was more active, and the interaction between the participants in the energy market was also improved. Then, in the third stage, the prices of crude oil and coal prices in China were stable, without a sharp rise or fall. In this stage, the spillover index is at a low level and is relatively stable. At the beginning of 2020, affected by the COVID-19 epidemic and the impact of the international energy market, China’s crude oil prices and coal prices experienced a sharp decline. It was not until April 2020 that the crude oil market and coal market began to gradually recover and during this time the spillover index also increased slightly compared with the third stage.
We noticed that there are two spikes during the second stage. We believe that these spikes may be related to the events that occurred in the coal market and natural gas market. The first spike may be related to the sharp rise in the coal price during this period. In April 2016, the Chinese government imposed capacity restrictions on the coal industry. The policy required coal producers to produce at maximum of 276 days a year. Additionally, since 2016, the Chinese government has launched a crackdown on illegal coal mining. These two measures have reduced the output of the coal industry, greatly changing the supply and demand of the industry, and raising the coal price sharply. The shock of the coal market enhanced the spillover effect of the system. The second spike may be related to the sharp fluctuations in the natural gas price during this period. In 2017, in an effort to improve the air quality, the government implemented the coal-to-gas project, which aimed to promote the use of natural gas instead of coal for heating in rural areas. The policy led to a sharp increase in demand for natural gas in northern China at the end of 2017, resulting in severe shortages of natural gas in many areas. To ensure residents had enough natural gas to heat their homes, plants that produced liquefied natural gas (LNG) and natural gas for industrial use were forced to shut down or limit production. The LNG price experienced a significant increase at the end of 2017 and remained high in the first half of 2018, until the LNG price lowered in the second half of 2018.
As can be seen from Figure 5a,b, the spillovers received and transmitted by each market also change over time.
In order to obtain more findings from the research on dynamic connectedness, we analyzed the data of dynamic connectedness, as shown in Table 6. The expected value and standard deviation of the received spillover, transmitted spillover, and net spillover of each market were calculated. It can be seen from Table 6 that the coal market is a net transmitter most of the time and the proportion is as high as 69.83%. The proportion of the new energy market as a net transmitter is 57.24%, which indicates that the new energy stock market is a net transmitter most of the time. The carbon market is a net receiver most of the time and its proportion as a net transmitter is only 27.15%. This is consistent with the conclusion obtained in the static analysis, that is, the coal and new energy markets are the net transmitters, and the crude oil, natural gas, and carbon markets are the net receivers.

4.2.2. Dynamic Connectedness Analysis of Positive and Negative Return Systems

We calculated the dynamic connectedness of the positive return and negative return systems, and depicted the total spillover index of the system, as shown in Figure 6. As can be seen from Figure 6, positive spillovers and negative spillovers generally show a similar trend and both of them change over time. In addition, we depicted the dynamic asymmetry coefficient, as shown in Figure 7. It can be seen that the index is greater than 1 most of the time. The number of sub-samples with an index greater than 1 accounted for 72.44% of the total, which means that the negative spillover is greater than the positive spillover most of the time and the system is more sensitive to the negative information about price returns. This is also consistent with our conclusion from the static connectedness analysis, that is, the spillover effect of the system is asymmetric. Moreover, it can be seen that when the total spillover indexes of the positive or negative return system are high, the asymmetry coefficients are also high. This indicates that the asymmetry of the spillover effect is much greater when the system is active.

4.3. Robustness Check

To test the robustness of the methodology and results in this paper, in addition to the selected size of the rolling windows (300 observations), we also considered another two sizes of the rolling windows (200 and 400 observations). In this section, we estimate the model under three different window lengths and depict the dynamic total connectedness indexes. The results are presented in Figure 8. As shown in Figure 8, the dynamic total connectedness index becomes smoother with the increase of the window lengths and the values of the indexes become smaller. This may be because, compared with a wider rolling window, the total connectedness index captures more short-term changes of the spillover effect under a narrower rolling window. However, the general trend remains, which indicates that the dynamic spillover effect of the system is robust to the window lengths. Similarly, we obtained the same results of the robustness tests under the positive and negative return system.

5. Conclusions

The study of the spillovers between China’s carbon trading market, new energy stock market, and fossil energy market is of great significance for China and for other developing countries that are in the early stages of establishing a carbon trading market. For China, this is useful for policy-makers and market participants to understand the interactions between markets and to establish energy policies or investment strategies. For other developing countries, this paper provides ideas and methods to analyze the dynamic linkages between the three markets. By constructing a connectedness network model of the carbon–energy–stock system, this paper conducted an empirical study on the spillovers between the carbon trading market, new energy stock market, and fossil energy market in China from June 2014 to September 2020.

5.1. Main Findings

First, from a systematic perspective, the spillover effect between China’s carbon trading market, new energy stock market, and fossil energy market is relatively weak. The empirical results show that the total spillover index of the carbon–energy–stock system is low from both static and dynamic perspectives.
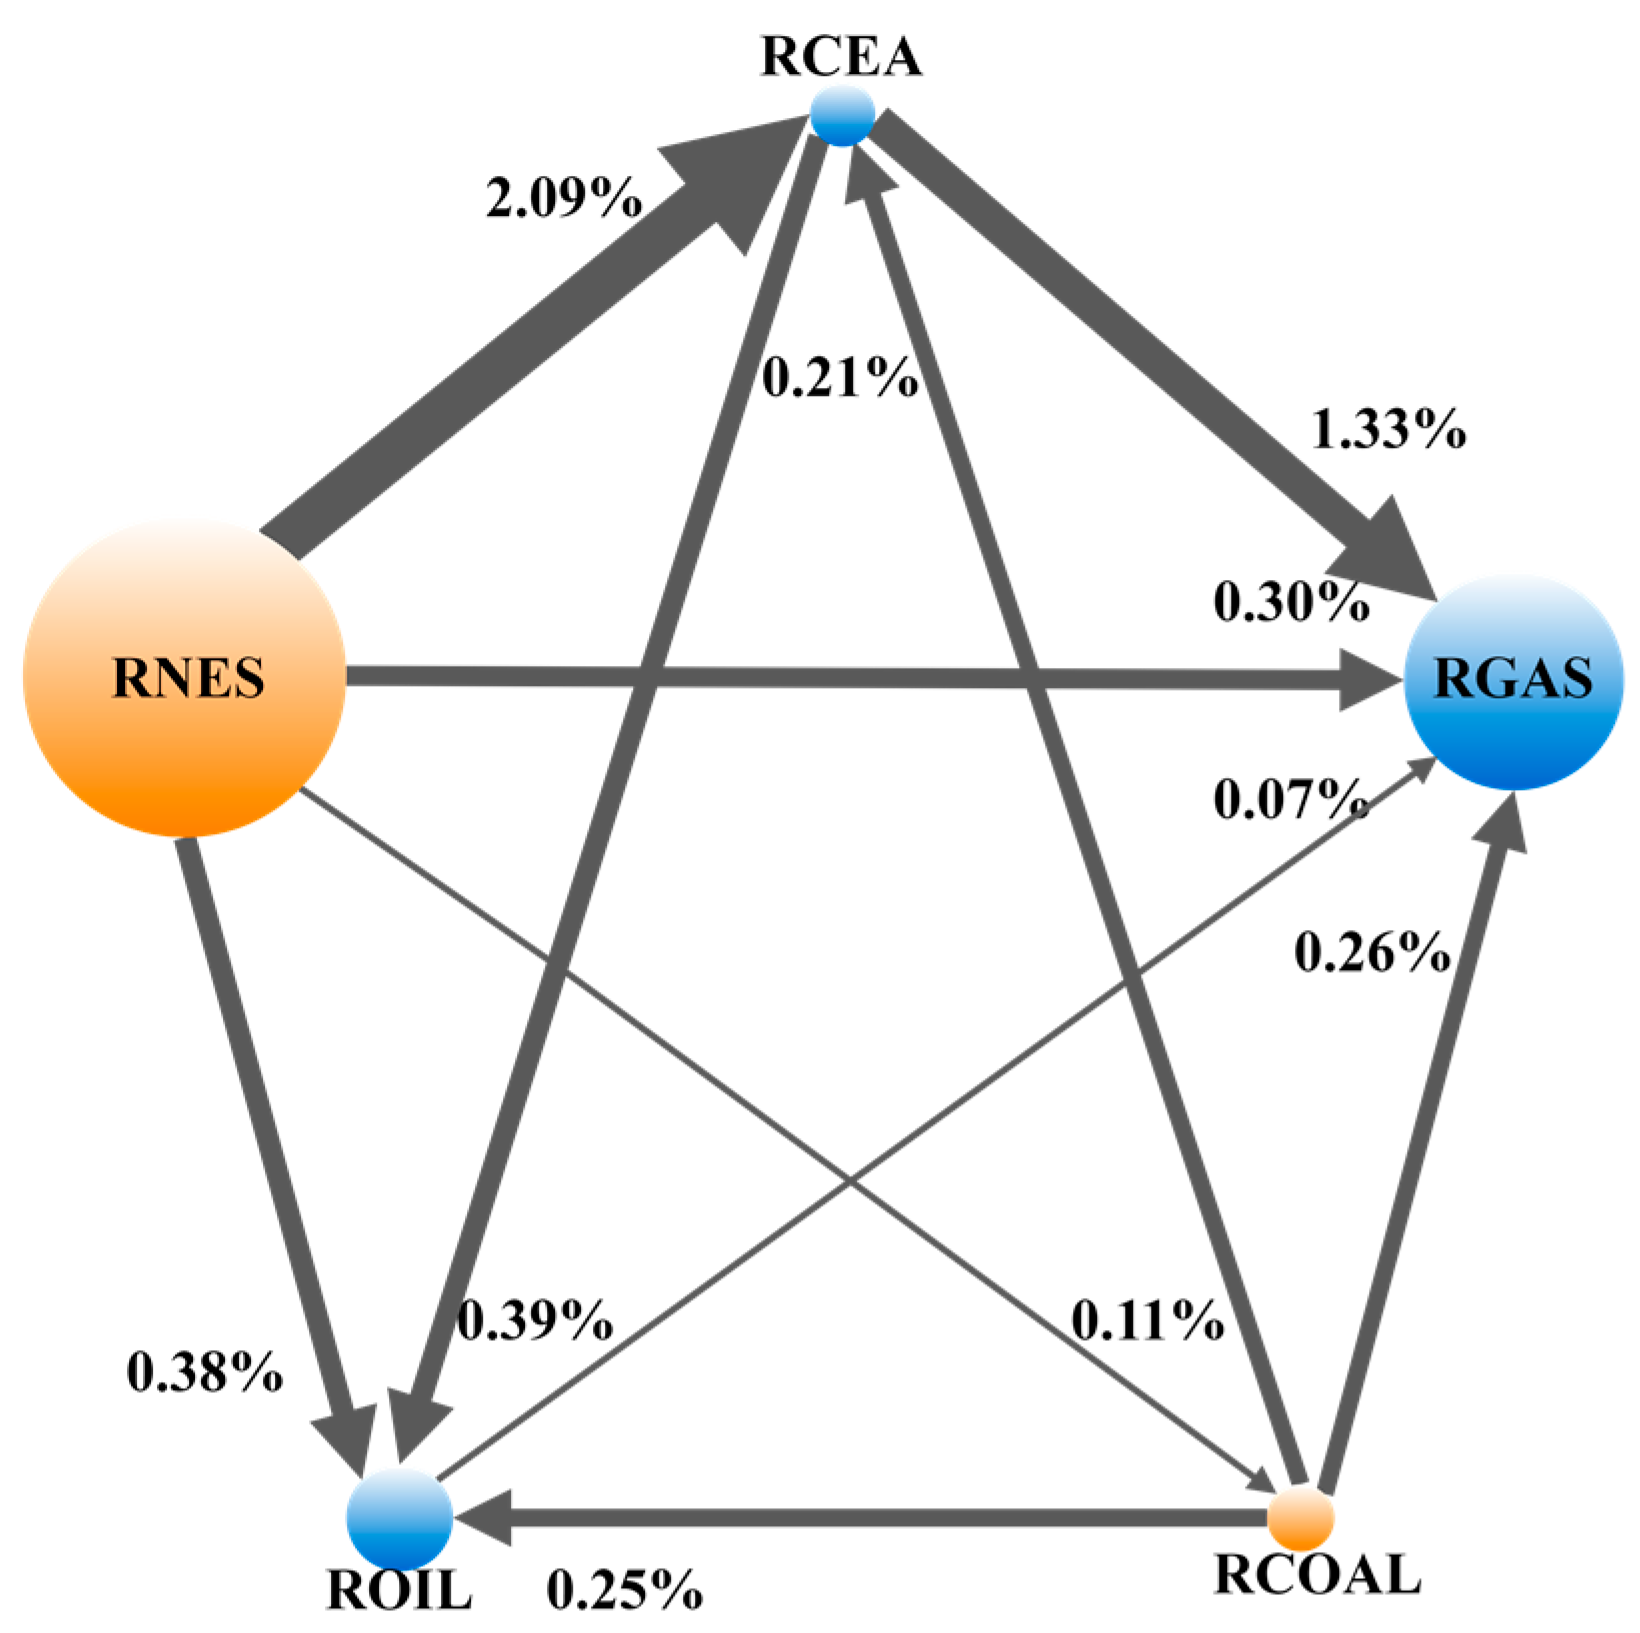
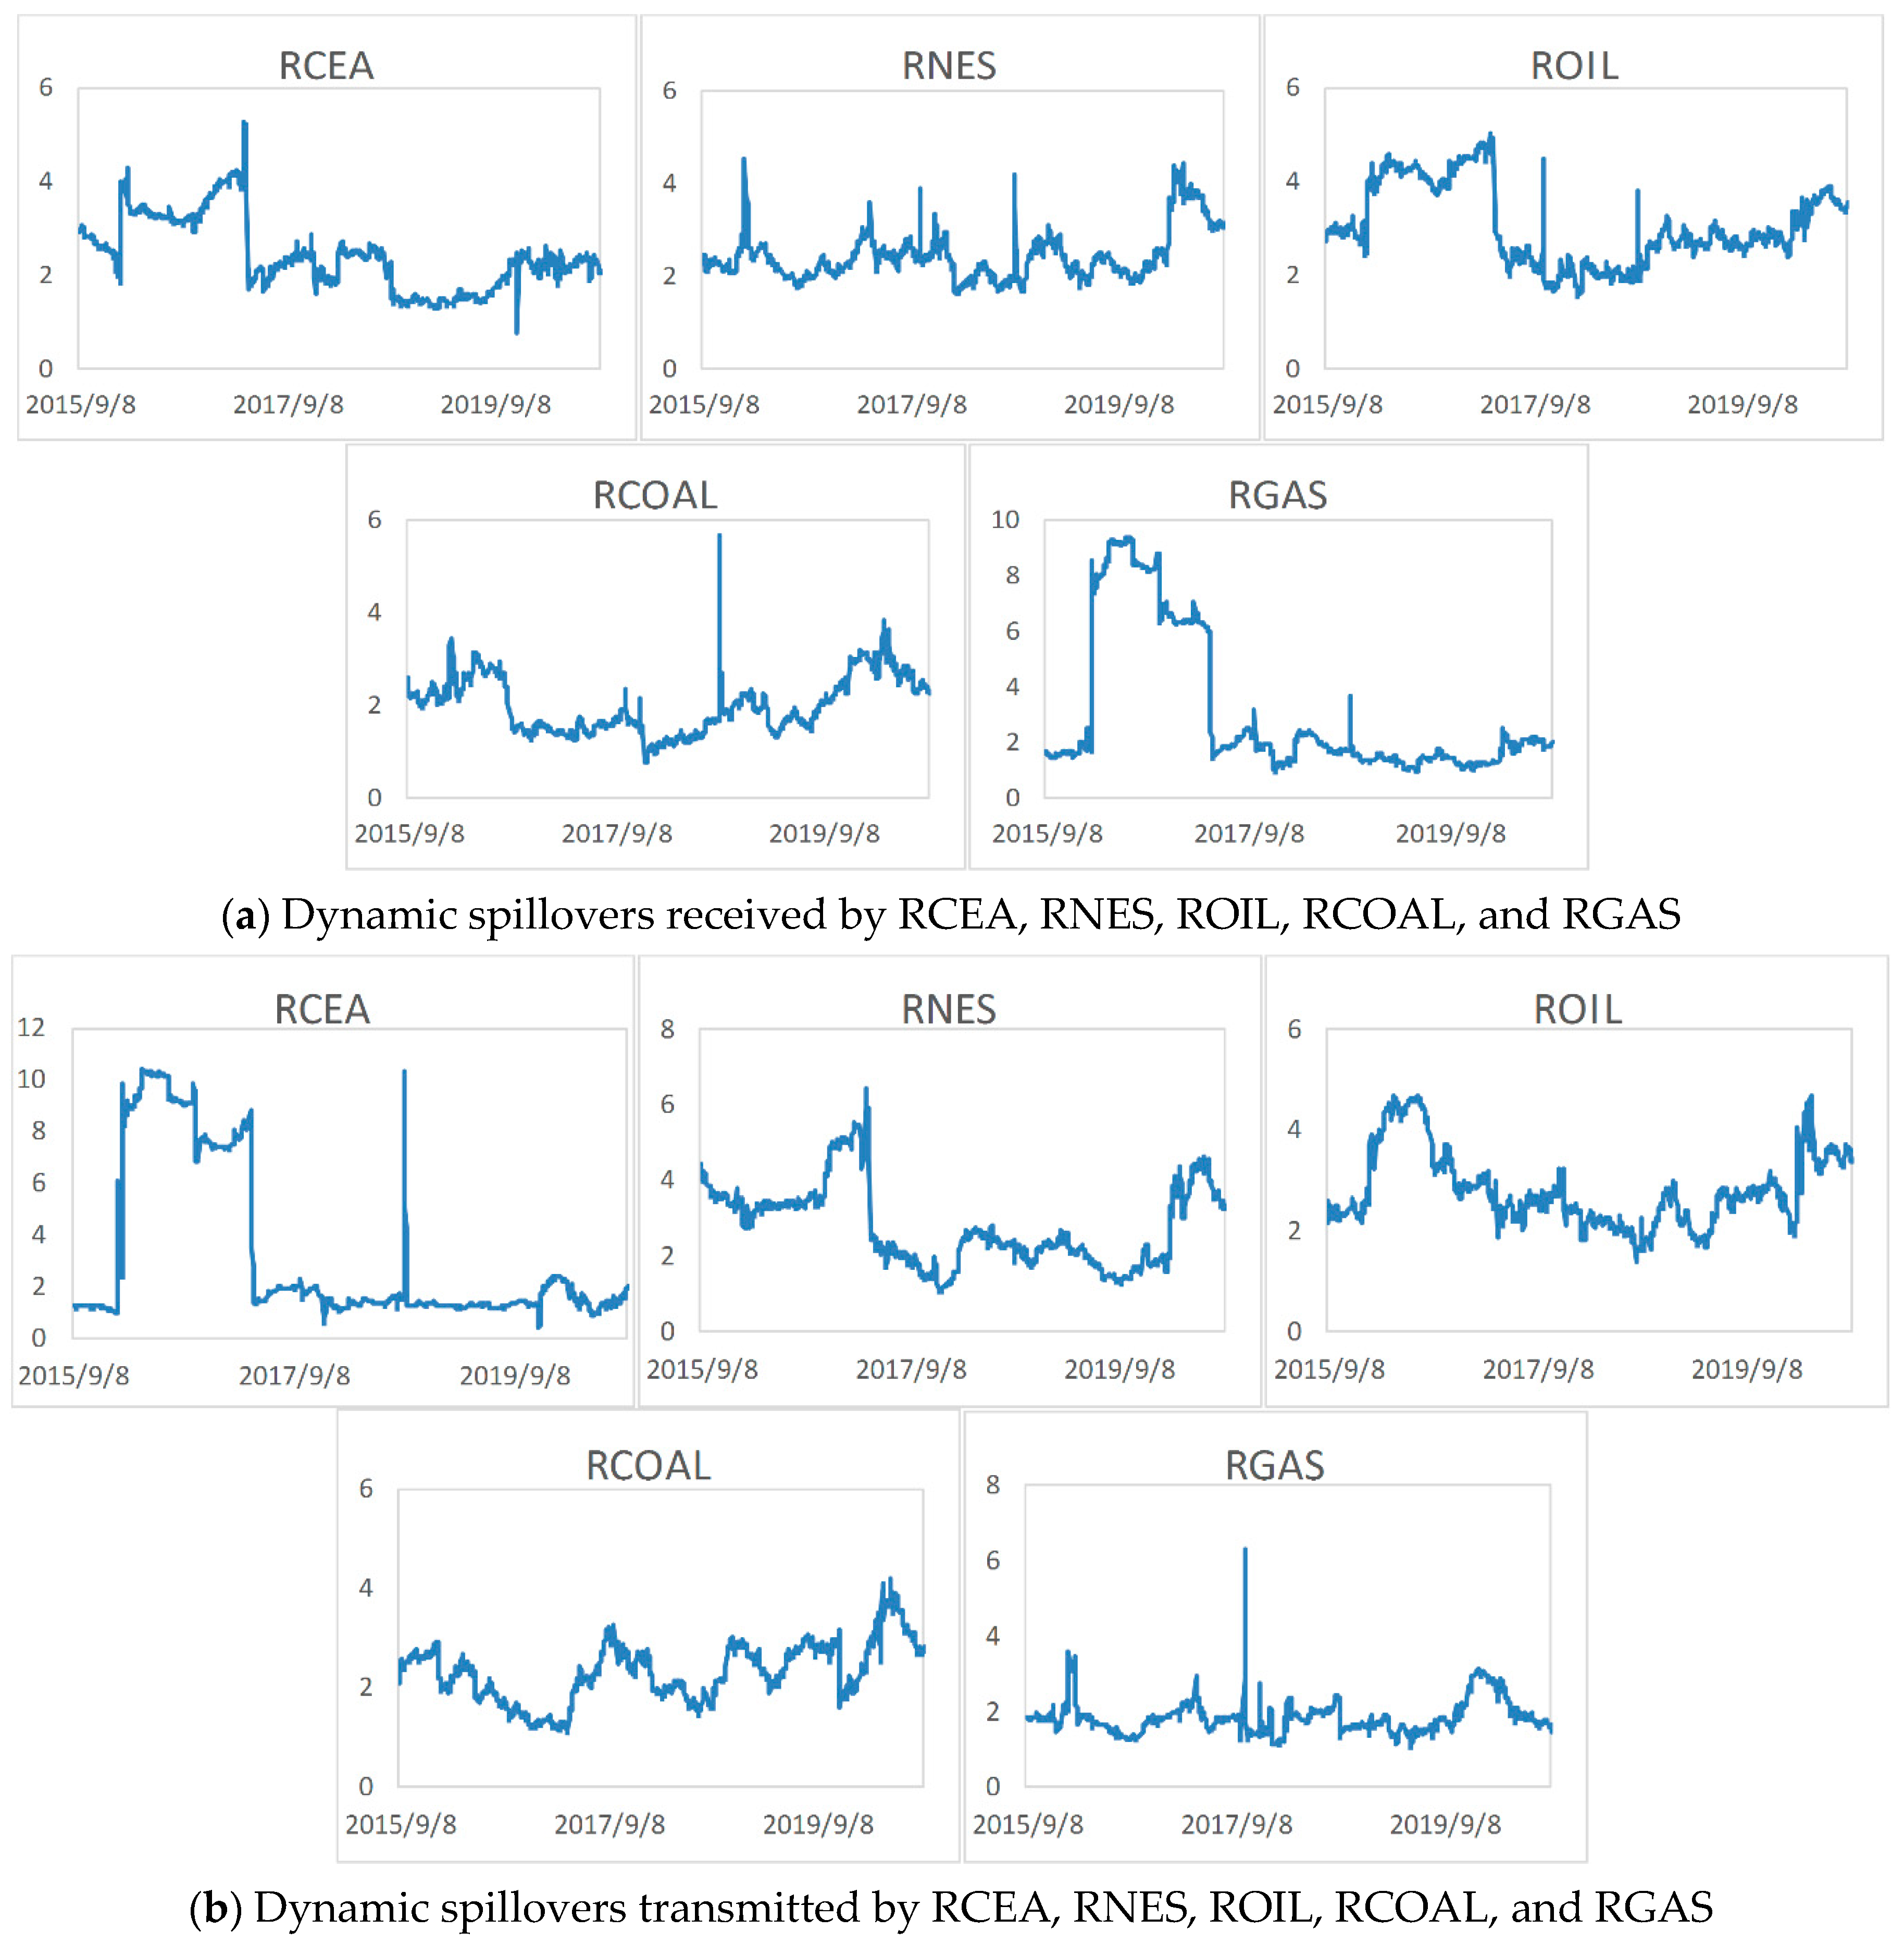
Second, in the carbon–energy–stock system, the new energy market plays a strong leading role. For the whole system, the new energy market always acts as a net information transmitter from both static and dynamic perspectives. For the carbon market, during the full sample period, the new energy market had a higher degree of information spillover to the carbon trading market than other fossil energy markets, which indicates that the price return changes in the new energy market have a greater impact on the price changes in the carbon trading market than in the fossil energy market.
Third, for the carbon market, the new energy stock market and coal market always play the role of net information transmitters, which indicates that China’s carbon trading has yet to have a significant impact on the energy market and cannot effectively promote the low-carbon energy structure. This is consistent with Lin and Chen’s conclusion that China’s carbon market is currently unable to effectively stimulate new energy sources to replace traditional fossil fuel [38].
Fourth, the spillover effect of the carbon–energy–stock system is asymmetric, that is, the system is more sensitive to negative news about price return than to positive news about price return, and this asymmetric effect is much greater when the market interaction is active.
Fifth, by studying the time-varying characteristics of the dynamic total connectedness index, we found that the index is correlated with events in the fossil energy market. The spillover effect of the system may be related to energy prices, especially crude oil and coal prices.

5.2. Implications for Policy-Makers

According to the main conclusions above, we can observe that the total spillover effect of China’s carbon–energy–stock system is weak and the three markets are less related. In particular, the carbon market has yet to have a significant impact on energy markets and cannot promote the low-carbon energy structure in China, which indicates that the market efficiency of China’s carbon market is low. The development of China’s carbon trading market faces some obstacles, such as decentralized pilot markets where market participants in different markets cannot trade with each other; loose caps and quotas; vague rewards and punishment mechanism; and so on. These issues have had a negative impact on market liquidity and trading activity.
Policy-makers should take active measures to solve the problems mentioned above. First, they should promote the construction of the national carbon trading market and launch national legislative guidance for regional pilot markets. Establishing the national legislation would prevent carbon pilot projects from being subject to administrative interference that affects the flexibility of the market. In addition, the establishment of strict national laws and regulations can improve the legal restriction of carbon trading. Second, policy-makers should improve the quota allocation mechanism as well as the reward and punishment mechanism. The cap and quota in the pilot markets are loose and the carbon price is low, which has not yet been able to motivate enterprises to actively participate in carbon trading. Third, policy-makers should encourage investment institutions and individual investors to participate in carbon market trading to enrich market participants, thereby enhancing market liquidity.
In addition, since this paper finds that the new energy market plays a leading role in the carbon–energy–stock system, policy-makers should provide policy support for the development of new energy technologies as well as for energy-saving and emission reduction technologies of fossil energy. The government should provide favorable tax policies or financial services for these companies. This is conducive to ensuring the stable development of the new energy industry and to preventing the volatility of the new energy industry from having a huge impact on the system or carbon market.
Moreover, because of the asymmetric spillover effect of the carbon–energy–stock system, policy-makers should pay more attention to falling energy prices to prevent serious impacts on the system. This paper believes that in addition to paying attention to the development of new energy, it is necessary to improve the price regulation mechanism of the fossil energy market to prevent the fossil energy price from being greatly impacted by the international energy price or by the supply and demand conditions in the domestic market, which both transmit risks to the entire system.

5.3. Suggestions for Market Investors

For investors, this paper provides useful information regarding the relationship between market price changes. Considering the new energy market has a certain leading role in the system, investors in the market should pay attention to the price return changes of the new energy stock market in cases where they are considering long-term or short-term investment.

5.4. Limitations and Future Research

This paper may be the first study to explore the spillover effect and asymmetry of the spillover effect between China’s carbon trading market, fossil energy market, and new energy financial market from a systematic perspective, which provides a new perspective for the research on the interaction relationship between China’s energy market and carbon trading market. The limitation of this paper is that it focuses on the results of spillovers between markets but pays less attention to the transmission path of spillovers between markets. Future research can investigate the transmission path and influencing factors of the spillover effect so as to have a better understanding of the relationship between the energy market and carbon trading market in China.

Author Contributions

D.N. put forward the idea of the article, conducted the empirical analysis, and wrote the original manuscript; Y.L. provided important support and guidance; X.L. provided key advice and revised the manuscript. All authors have read and approved the final manuscript.

Funding

This research study was funded by the “Beijing social science foundation research base project” (grant number 17JDGLA009).

Institutional Review Board Statement

Not applicable.

Informed Consent Statement

Not applicable.

Data Availability Statement

Not applicable.

Conflicts of Interest

The authors declare no conflict of interest.

References

  1. Ellerman, A.D.; Buchner, B.K. Over-Allocation or Abatement ? A Preliminary Analysis of the EU ETS Based on the 2005—2006. Emiss. Data 2008, 41, 267–287. [Google Scholar] [CrossRef] [Green Version]
  2. Chang, C.L.; Ilomäki, J.; Laurila, H.; McAleer, M. Moving Average Market Timing in European Energy Markets: Production versus Emissions. Energies 2018, 11, 3281. [Google Scholar] [CrossRef] [Green Version]
  3. Riti, J.S.; Song, D.; Shu, Y.; Kamah, M. Decoupling CO2 Emission and Economic Growth in China: Is There Consistency in Estimation Results in Analyzing Environmental Kuznets Curve? J. Clean. Prod. 2017, 166, 1448–1461. [Google Scholar] [CrossRef]
  4. The State Council Information Office of the People’s Republic of China Official Website. Available online: http://www.scio.gov.cn/zfbps/32832/Document/1695117/1695117.htm/ (accessed on 3 August 2021).
  5. The Website of CCTV News. Available online: http://news.cctv.com/2016/11/04/ARTINmMvNL834wLuzuAH2BRr161104.shtml?from=timeline/ (accessed on 15 September 2021).
  6. The Carbon K-line Website. Available online: http://k.tanjiaoyi.com/ (accessed on 31 August 2021).
  7. The Website of Tanpaifang. Available online: http://www.tanpaifang.com/tanzichanguanli/2021/0112/76220_3.html/ (accessed on 15 September 2021).
  8. Alberola, E.; Chevallier, J.; Chèze, B. Price Drivers and Structural Breaks in European Carbon Prices 2005–2007. Energy Policy 2008, 36, 787–797. [Google Scholar] [CrossRef]
  9. Hammoudeh, S.; Nguyen, D.K.; Sousa, R.M. What Explain the Short-Term Dynamics of the Prices of CO2 Emissions? Energy Econ. 2014, 46, 122–135. [Google Scholar] [CrossRef]
  10. Balcılar, M.; Demirer, R.; Hammoudeh, S.; Nguyend, D.K. Risk Spillovers across the Energy and Carbon Markets and Hedging Strategies for Carbon Risk. Energy Econ. 2015, 54, 159–172. [Google Scholar] [CrossRef] [Green Version]
  11. Creti, A.; Jouvet, P.A.; Mignon, V. Carbon Price Drivers: Phase I versus Phase II Equilibrium? Energy Econ. 2012, 34, 327–334. [Google Scholar] [CrossRef] [Green Version]
  12. Boersen, A.; Scholtens, B. The Relationship between European Electricity Markets and Emission Allowance Futures Prices in Phase II of the EU (European Union) Emission Trading Scheme. Energy 2014, 74, 585–594. [Google Scholar] [CrossRef]
  13. Keppler, J.H.; Mansanet-Bataller, M. Causalities between CO2, Electricity, and Other Energy Variables during Phase I and Phase II of the EU ETS. Energy Policy 2010, 38, 3329–3341. [Google Scholar] [CrossRef] [Green Version]
  14. Cao, G.; Xu, W. Nonlinear Structure Analysis of Carbon and Energy Markets with MFDCCA Based on Maximum Overlap Wavelet Transform. Phys. A Stat. Mech. its Appl. 2016, 444, 505–523. [Google Scholar] [CrossRef]
  15. Wang, Y.; Guo, Z. The Dynamic Spillover between Carbon and Energy Markets: New Evidence. Energy 2018, 149, 24–33. [Google Scholar] [CrossRef]
  16. Lee, Y.; Yoon, S.M. Dynamic Spillover and Hedging among Carbon, Biofuel and Oil. Energies 2020, 13, 4382. [Google Scholar] [CrossRef]
  17. Wu, Q.; Wang, M.; Tian, L. The Market-Linkage of the Volatility Spillover between Traditional Energy Price and Carbon Price on the Realization of Carbon Value of Emission Reduction Behavior. J. Clean. Prod. 2020, 245, 1–12. [Google Scholar] [CrossRef]
  18. Yu, L.; Li, J.; Tang, L.; Wang, S. Linear and Nonlinear Granger Causality Investigation between Carbon Market and Crude Oil Market: A Multi-Scale Approach. Energy Econ. 2015, 51, 300–311. [Google Scholar] [CrossRef]
  19. Henriques, I.; Sadorsky, P. Oil Prices and the Stock Prices of Alternative Energy Companies. Energy Econ. 2008, 30, 998–1010. [Google Scholar] [CrossRef]
  20. Kumar, S.; Managi, S.; Matsuda, A. Stock Prices of Clean Energy Firms, Oil and Carbon Markets: A Vector Autoregressive Analysis. Energy Econ. 2012, 34, 215–226. [Google Scholar] [CrossRef]
  21. Reboredo, J.C.; Rivera-Castro, M.A.; Ugolini, A. Wavelet-Based Test of Co-Movement and Causality between Oil and Renewable Energy Stock Prices. Energy Econ. 2017, 61, 241–252. [Google Scholar] [CrossRef]
  22. Dutta, A.; Bouri, E.; Saeed, T.; Vo, X.V. Impact of Energy Sector Volatility on Clean Energy Assets. Energy 2020, 212, 118657. [Google Scholar] [CrossRef]
  23. Reboredo, J.C.; Ugolini, A. The Impact of Energy Prices on Clean Energy Stock Prices. A Multivariate Quantile Dependence Approach. Energy Econ. 2018, 76, 136–152. [Google Scholar] [CrossRef]
  24. Song, Y.; Ji, Q.; Du, Y.J.; Geng, J.B. The Dynamic Dependence of Fossil Energy, Investor Sentiment and Renewable Energy Stock Markets. Energy Econ. 2019, 84, 104564. [Google Scholar] [CrossRef]
  25. Xia, T.; Ji, Q.; Zhang, D.; Han, J. Asymmetric and Extreme Influence of Energy Price Changes on Renewable Energy Stock Performance. J. Clean. Prod. 2019, 241, 118338. [Google Scholar] [CrossRef]
  26. Sadorsky, P. Correlations and Volatility Spillovers between Oil Prices and the Stock Prices of Clean Energy and Technology Companies. Energy Econ. 2012, 34, 248–255. [Google Scholar] [CrossRef]
  27. Ahmad, W. On the Dynamic Dependence and Investment Performance of Crude Oil and Clean Energy Stocks. Res. Int. Bus. Financ. 2017, 42, 376–389. [Google Scholar] [CrossRef]
  28. Ferrer, R.; Shahzad, S.J.H.; López, R.; Jareño, F. Time and Frequency Dynamics of Connectedness between Renewable Energy Stocks and Crude Oil Prices. Energy Econ. 2018, 76, 1–20. [Google Scholar] [CrossRef]
  29. Sousa, R.; Aguiar-Conraria, L.; Soares, M.J. Carbon Financial Markets: A Time-Frequency Analysis of CO2 Prices. Phys. A Stat. Mech. its Appl. 2014, 414, 118–127. [Google Scholar] [CrossRef]
  30. Koch, N.; Fuss, S.; Grosjean, G.; Edenhofer, O. Causes of the EU ETS Price Drop: Recession, CDM, Renewable Policies or a Bit of Everything?—New Evidence. Energy Policy 2014, 73, 676–685. [Google Scholar] [CrossRef] [Green Version]
  31. Lutz, B.J.; Pigorsch, U.; Rotfuß, W. Nonlinearity in Cap-and-Trade Systems: The EUA Price and Its Fundamentals. Energy Econ. 2013, 40, 222–232. [Google Scholar] [CrossRef] [Green Version]
  32. Yuan, N.; Yang, L. Asymmetric Risk Spillover between Financial Market Uncertainty and the Carbon Market: A GAS–DCS–Copula Approach. J. Clean. Prod. 2020, 259, 120750. [Google Scholar] [CrossRef]
  33. Zeng, S.; Nan, X.; Liu, C.; Chen, J. The Response of the Beijing Carbon Emissions Allowance Price (BJC) to Macroeconomic and Energy Price Indices. Energy Policy 2017, 106, 111–121. [Google Scholar] [CrossRef]
  34. Chang, K.; Ye, Z.; Wang, W. Volatility Spillover Effect and Dynamic Correlation between Regional Emissions Allowances and Fossil Energy Markets: New Evidence from China ’ s Emissions Trading Scheme Pilots. Energy 2019, 185, 1314–1324. [Google Scholar] [CrossRef]
  35. Zhang, G.; Du, Z. Co-Movements among the Stock Prices of New Energy, High-Technology and Fossil Fuel Companies in China. Energy 2017, 135, 249–256. [Google Scholar] [CrossRef]
  36. Wen, X.; Guo, Y.; Wei, Y.; Huang, D. How Do the Stock Prices of New Energy and Fossil Fuel Companies Correlate? Evidence from China. Energy Econ. 2014, 41, 63–75. [Google Scholar] [CrossRef]
  37. Chang, K.; Zhang, C.; Wang, H.W. Asymmetric Dependence Structures between Emission Allowances and Energy Markets: New Evidence from China’s Emissions Trading Scheme Pilots. Environ. Sci. Pollut. Res. 2020, 27, 21140–21158. [Google Scholar] [CrossRef] [PubMed]
  38. Lin, B.; Chen, Y. Dynamic Linkages and Spillover Effects between CET Market, Coal Market and Stock Market of New Energy Companies: A Case of Beijing CET Market in China. Energy 2019, 172, 1198–1210. [Google Scholar] [CrossRef]
  39. Jiang, C.; Wu, Y.; Li, X.; Li, X. Time-Frequency Connectedness between Coal Market Prices, New Energy Stock Prices and CO2 Emissions Trading Prices in China. Sustainability 2020, 12, 2823. [Google Scholar] [CrossRef] [Green Version]
  40. Diebold, F.X.; Yilmaz, K. On the Network Topology of Variance Decompositions: Measuring the Connectedness of Financial Firms. J. Econom. 2014, 182, 119–134. [Google Scholar] [CrossRef] [Green Version]
  41. Koop, G.; Pesaran, M.H.; Potter, S.M. Impulse Response Analysis in Nonlinear Multivariate Models. J. Econom. 1996, 74, 119–147. [Google Scholar] [CrossRef]
  42. Pesaran, H.H.; Shin, Y. Capital Taxation and Production Efficiency in an Open Economy. Econ. Lett. 1999, 62, 85–90. [Google Scholar]
  43. Ji, Q.; Xia, T.; Liu, F.; Xu, J.H. The Information Spillover between Carbon Price and Power Sector Returns: Evidence from the Major European Electricity Companies. J. Clean. Prod. 2019, 208, 1178–1187. [Google Scholar] [CrossRef]
  44. The Website of Wind Database. Available online: https://www.wind.com.cn/ (accessed on 14 September 2021).
Figure 1. The price returns of carbon allowance and the stock of new energy companies and fossil energies.
Energies 14 06438 g001
Figure 2. The net pairwise connectedness of the carbon trading market, new energy stock market, and fossil energy market in the original return system. The color of the node in the figure represents whether it is a net transmitter or a net receiver. Net transmitters are shown in orange and net receivers are shown in blue. The size of the node shows the value of the net spillover; the larger the node, the larger the value of the net spillover. The thickness of the arrow line indicates the degree of information spillover; the thicker the line, the higher the degree of spillover between markets.
Energies 14 06438 g002
Figure 3. The pairwise connectedness of the carbon trading market, new energy stock market, and fossil energy market in the positive return and negative return system. The color of the node in the figure represents whether it is a net transmitter or a net receiver. Net transmitters are shown in orange and net receivers are shown in blue. The size of the node shows the value of the net spillover; the larger the node, the larger the value of the net spillover. The thickness of the arrow line indicates the degree of information spillover; the thicker the line, the higher the degree of spillover between markets.
Energies 14 06438 g003
Figure 4. Dynamic total connectedness index with rolling windows. The length of the rolling window is 300 days and the date in the figure is the last day of each rolling window.
Energies 14 06438 g004
Figure 5. Dynamic spillovers of the carbon market, new energy stock market, and fossil energy markets. The length of the rolling window is 300 days and the date in the figure is the last day of each rolling window.
Energies 14 06438 g005
Figure 6. Dynamic total spillover indexes under the positive return system and negative return system.
Energies 14 06438 g006
Figure 7. Asymmetry coefficient with rolling windows.
Energies 14 06438 g007
Figure 8. Dynamic total connectedness indexes with window lengths of 200, 300, and 400 observations.
Energies 14 06438 g008
Table 1. Introduction of variables and data.
CategoryVariableContent
Carbon emission allowance priceRCEAHubei carbon emissions allowance price (the daily trading price)
Fossil energy pricesROILSouth China Sea crude oil price (the daily closing price)
RCOALThermal coal futures contract price (the daily closing price)
RGASLiquefied natural gas price (the daily trading price)
Stock price of new energy companiesRNESCNI new energy index (the daily closing price)
Table 2. Descriptive statistics for RCEA, RNES, ROIL, RCOAL, and RGAS.
MeanMaximumMinimumStd. Dev.SkewnessKurtosisJarque–Bera
RCEA0.0152630.3252−629.541727.3922−0.0254386.65609,334,423.3501 ***
RNES0.04346.8430−9.65051.9370−0.99316.94181235.5286 ***
ROIL−0.074337.0557−39.46163.3283−0.405039.560884,809.9692 ***
RCOAL0.00736.7289−8.09141.27740.11246.0584596.4084 ***
RGAS−0.039224.9173−33.44222.0394−1.3235105.0641661,060.4418 ***
Note: *** represents significance levels of 1%.
Table 3. The connectedness matrix of the original return system.
RCEARNESROILRCOALRGASFROM
RCEA95.892.480.960.370.304.11
RNES0.3996.542.430.280.363.46
ROIL1.352.8194.611.040.195.39
RCOAL0.160.390.7998.300.361.70
RGAS1.630.660.260.6296.833.17
TO3.536.344.442.311.21 TSI = 3.57
NET−0.582.88-0.950.61−1.96
Note: “From” is the aggregation of each row, excluding diagonal elements; “To” is the aggregation of each column, excluding diagonal elements; “Net” is the net contribution of each variable; and “TSI” is the total spillover index.
Table 4. The connectedness matrix of the positive return system.
RCEARNESROILRCOALRGASFROM
RCEA95.962.350.860.260.574.05
RNES1.0596.241.550.760.403.75
ROIL1.061.6696.790.290.203.20
RCOAL0.851.120.5196.710.813.30
RGAS0.210.260.190.4098.931.05
TO3.155.403.101.702.00 TSI + = 3.07
NET−0.901.65−0.10−1.600.95
Table 5. The connectedness matrix of the negative return system.
RCEARNESROILRCOALRGASFROM
RCEA95.823.170.640.300.084.20
RNES0.4896.242.310.440.543.75
ROIL1.092.8595.380.520.154.60
RCOAL0.540.510.6297.830.512.15
RGAS3.920.360.170.6994.865.15
TO6.056.903.751.951.30 TSI = 3.97
NET1.853.15−0.85−0.20−3.85
Table 6. Summary statistics of dynamic connectedness.
From To Net Proportion
MeanStd. Dev.MeanStd. Dev.MeanStd. Dev.
RCEA2.43030.76353.19033.14170.76002.591927.15%
RNES2.44400.53632.80171.08550.35771.060757.24%
ROIL3.04020.84612.82150.7479−0.21870.618437.69%
RCOAL1.98930.60102.33050.59910.34120.640269.83%
RGAS3.08562.61361.84530.4326−1.24022.705848.00%
Note: “Proportion” refers to the proportion of the number of sub-samples with positive net spillovers in each market to the total number of sub-samples.
Publisher’s Note: MDPI stays neutral with regard to jurisdictional claims in published maps and institutional affiliations.

