1. Introduction
Operation of condenser cooling systems of power unit thermal turbines has a significant impact on the efficiency of electricity generation. In Central-European conditions, large generation units most often have closed-circuit cooling systems with natural draft wet cooling towers (
NDWCT). Their operation and, consequently, the temperature of the cooling water entering the condenser depends significantly on the temperature and humidity of the ambient air [
1,
2]. It is believed that their operation is also somewhat influenced by wind and its direction [
3,
4,
5,
6] and interaction of cooling towers located close together is possible.
The phenomenon of water evaporation and its losses in cooling towers have also been the subject of many studies. Water losses in cooling towers are the basic item in the water balance of thermal power units. In publications describing the cooling process, water losses are considered to be limited to the evaporation phenomenon itself. The effects of weather conditions and cooling water parameters on cooling efficiency and water losses are also taken into account [
7,
8,
9]. The analysis does not take into account the additional losses due to entrainment of water droplets by the air flow through the cooling tower. This extra flux of lost water can be significant.
In studies of cooling systems of power units in operation, water losses are considered globally, taking into account the designs used as well as the weather conditions. For example, a very comprehensive review paper [
10] presents the water demand of various power generation systems (Generic, Subcritical and Supercritical with and without
CCS) and cooling systems (Tower, once-through, pound). Water consumption is expressed per unit of electricity generated. The study provides, for a given cooling system, minimum, average and maximum water consumption levels. It is noted that maximum water demand occurs in “low-carbon emitting technologies that use evaporative cooling towers”. It is also emphasized that changes in cooling systems made by implementing dry cooling technologies result, in the case of concentrating solar power (
CSP), in lower quantities of generated electricity and higher production costs. This is also confirmed by the results presented in [
11], where the generated power of the power unit and the cooling water losses were compared between
NDWCT and a hybrid cooling system. The hybrid system was based on a dry cooling tower system supported by pre-humidification of the air when weather conditions required it. Modeling based on the developed algorithm, which is based on Merkel and Poppe methods, indicated significant water savings when the hybrid system is used (at ambient temperatures above
). At the same time, a reduction in the maximum power generated from
to
during the winter months was indicated. This is due to the reduced heat transfer efficiency of the natural draft hybrid cooling tower (
NDHCT). It is also shown how humidity affects the amount of generated power and the water consumption.
Paper [
12] presents linear regression equations based on the results of experiments conducted by Poppe [
13], which express the evaporative loss in a wet cooling tower. The diagrams in this paper show that these losses (according to Poppe’s experiment) can amount to
of the hydraulic load of the cooling tower. Based on the Merkel method, Yuan et al. [
1] determined the evaporative losses for wet cooling towers of a
power unit. The results presented indicate water loss due to evaporation of
of the cooling tower load, with air humidity
and ambient temperature on the level of
. As humidity increases this loss decreases to
at
. These calculations show an almost linear decrease in evaporation loss with increasing humidity. Furthermore, at constant humidity, they indicate a near linear decrease in evaporation loss, equal to about
, as the air dry bulb temperature increases by
. The evaporation loss determined in [
14] by numerically modeling the heat and mass exchange process in a wet cooling tower was at a very similar level.
The calculation methodology presented in [
12] was applied by the authors in their study of evaporative fluid coolers [
15]. The results show that the evaporation losses in this type of facilities amount to
of the cooling water flow rate in the heat exchanger and change significantly with the temperature and humidity of the ambient air.
The effect of wind on cooling tower operation is difficult to measure due to the variability of the velocity, direction and spatial distribution of the vectors defining air movement in the surroundings of the cooling tower. Air movement in the vicinity of a cooling tower can be affected by neighboring facilities, including other cooling towers. Important research problems are the size of the studied structures and the fact that their operation must be subordinated to the time-varying process of electricity generation. Due to these problems, research is dominated by studies carried out on scaled models. Mathematical modeling of air flow and numerical simulations are also used in research.
Gao et al. [
4] conducted a field test on the effect of wind on the operation of a cooling tower of a power unit
. The test duration was 10 days. A steady flow rate of water (approximately
) was maintained. The effect of wind (recorded at a weather station) on the water cooling level
was studied primarily. It was found that in the range of the tested wind velocities up to
, wind negatively affected water cooling by reducing
by a maximum of
, which constituted a
temperature drop. Paper [
16] presents the results of repeated tests when air-deflectors were introduced at the air inlet of the cooling tower. Their role was to reduce the effect of wind on the heat exchange process in the cooling tower. The presence of air deflectors reduced the negative effect of wind on the water cooling process by half.
The paper by Alavi and Rahmati [
6] presents the results of a study carried out on a
scale model of a cooling tower. The effect of wind on water temperature decrease and cooling efficiency
was studied. The effects of water inlet temperature, water flux and wind velocity on water temperature decrease and cooling efficiency were taken into account. The corresponding correlation functions binding these quantities were presented. In general, it can be concluded that up to a certain value (
in the study), wind reduces
and cooling efficiency
. Once this value is exceeded,
and ε increase and exceed the values in windless conditions. These changes range from
to
. The study by Lu et al. [
17] concerned the effect of wind on the performance of a
scale model of a dry cooling tower. The electric heating system simulated the operation of a horizontal heat exchanger. The study was accompanied by the results of numerical calculations of the airflow inside and in the surroundings of the cooling tower.
Both experimental results and numerical calculations show that up to a certain wind velocity, the speed of convective motion in the cooling tower decreases and then it significantly increases. These changes were expressed in relation to the convection velocity of a motion undisturbed by wind. The range of these changes was from to .
In paper [
18], the heat exchange process and the air movement inside and in the surroundings of a dry cooling tower were also numerically modeled. In general, cooling efficiency was found to deteriorate from
to
, with wind velocity increasing from
to
.
Paper [
19] presents the results of a full-scale study of dry cooling towers. That study investigated the effect of wind on the difference in water temperature at the inlet and outlet of a cooling tower. The authors concluded that cooling tower sectors directly facing the wind have better thermal performance and show larger temperature differences. In contrast, there is a reduction in the temperature difference in sectors perpendicular to the wind direction. These changes are on the level of
, resulting in changes not exceeding
. By analyzing the heat exchange throughout the cooling tower, the authors highlighted the decrease of heat exchange in the cooling tower to
as the wind velocity increased.
The study on the effect of wind on the heat exchange process conducted on a
scale model of a wet cooling tower [
5] is consistent with [
6]. The difference in inlet and outlet water temperature and the coefficient of efficiency first decrease and then increase with increasing wind velocity. The range of these changes, for
, is a fraction of a degree Celsius. For the coefficient of efficiency, these changes are on the level of
%. As a criterion quantity to determine the effect of wind, the authors used the Froude number
, where
is the wind velocity and
is the lower diameter of the colling tower. As the authors pointed out,
is the value above which
and cooling efficiency begins to increase.
Based on an analysis of the numerical results presented in [
20], it can be concluded that for a dry cooling tower of a
power unit, horizontal wind decreases the heat exchange in the cooling tower to about
. It also has a significant impact on the value of the temperature of the water flowing out of the cooling tower, as it increases by more than
. This has a significant impact on condenser pressure and power unit efficiency. The authors concluded that the use of deflectors can reduce the effect of wind on cooling tower operation to a minimum. One can also encounter the results of research on the impact on operation of cooling towers located close to one another and with accompanying industrial facilities [
21,
22]. The effect of wind on the level of cooling in zones of cooling towers operated in different ways in relation to the wind direction has also been evaluated [
23].
There are many fewer publications concerning the evaluation of drift loss and the effect of cooling tower operating conditions on its value. In paper [
23], this loss was determined for a cooling tower with the water flow rate of
. The value of drift loss was determined by measuring the total water content of the air exiting the cooling tower and calculating the evaporative loss. The calculations and measurements show that this loss is at the level of
of the water load of the cooling tower. The drift loss given in paper [
24], determined for the same cooling tower, is specified at
of the water flow. Depending on the droplet eliminator installed, the drift loss determined in [
3] is in the range of
of the water. This research concerns a laboratory-scale cooling tower, with water flow rate of
and with forced air flow.
In this paper, the task undertaken by the authors is to determine the effect of weather and operating conditions on the amount of water loss and the share of evaporation and drift in it. The effect of weather conditions and the power unit load on water cooling level and cooling efficiency was also investigated. An effort was also made to evaluate the effect of wind on cooling efficiency and cooling water loss. In the case of cooling towers of large power units, research results on the effect of wind on the operation of cooling towers and in particular on water loss are quite limited.
2. Materials and Methods
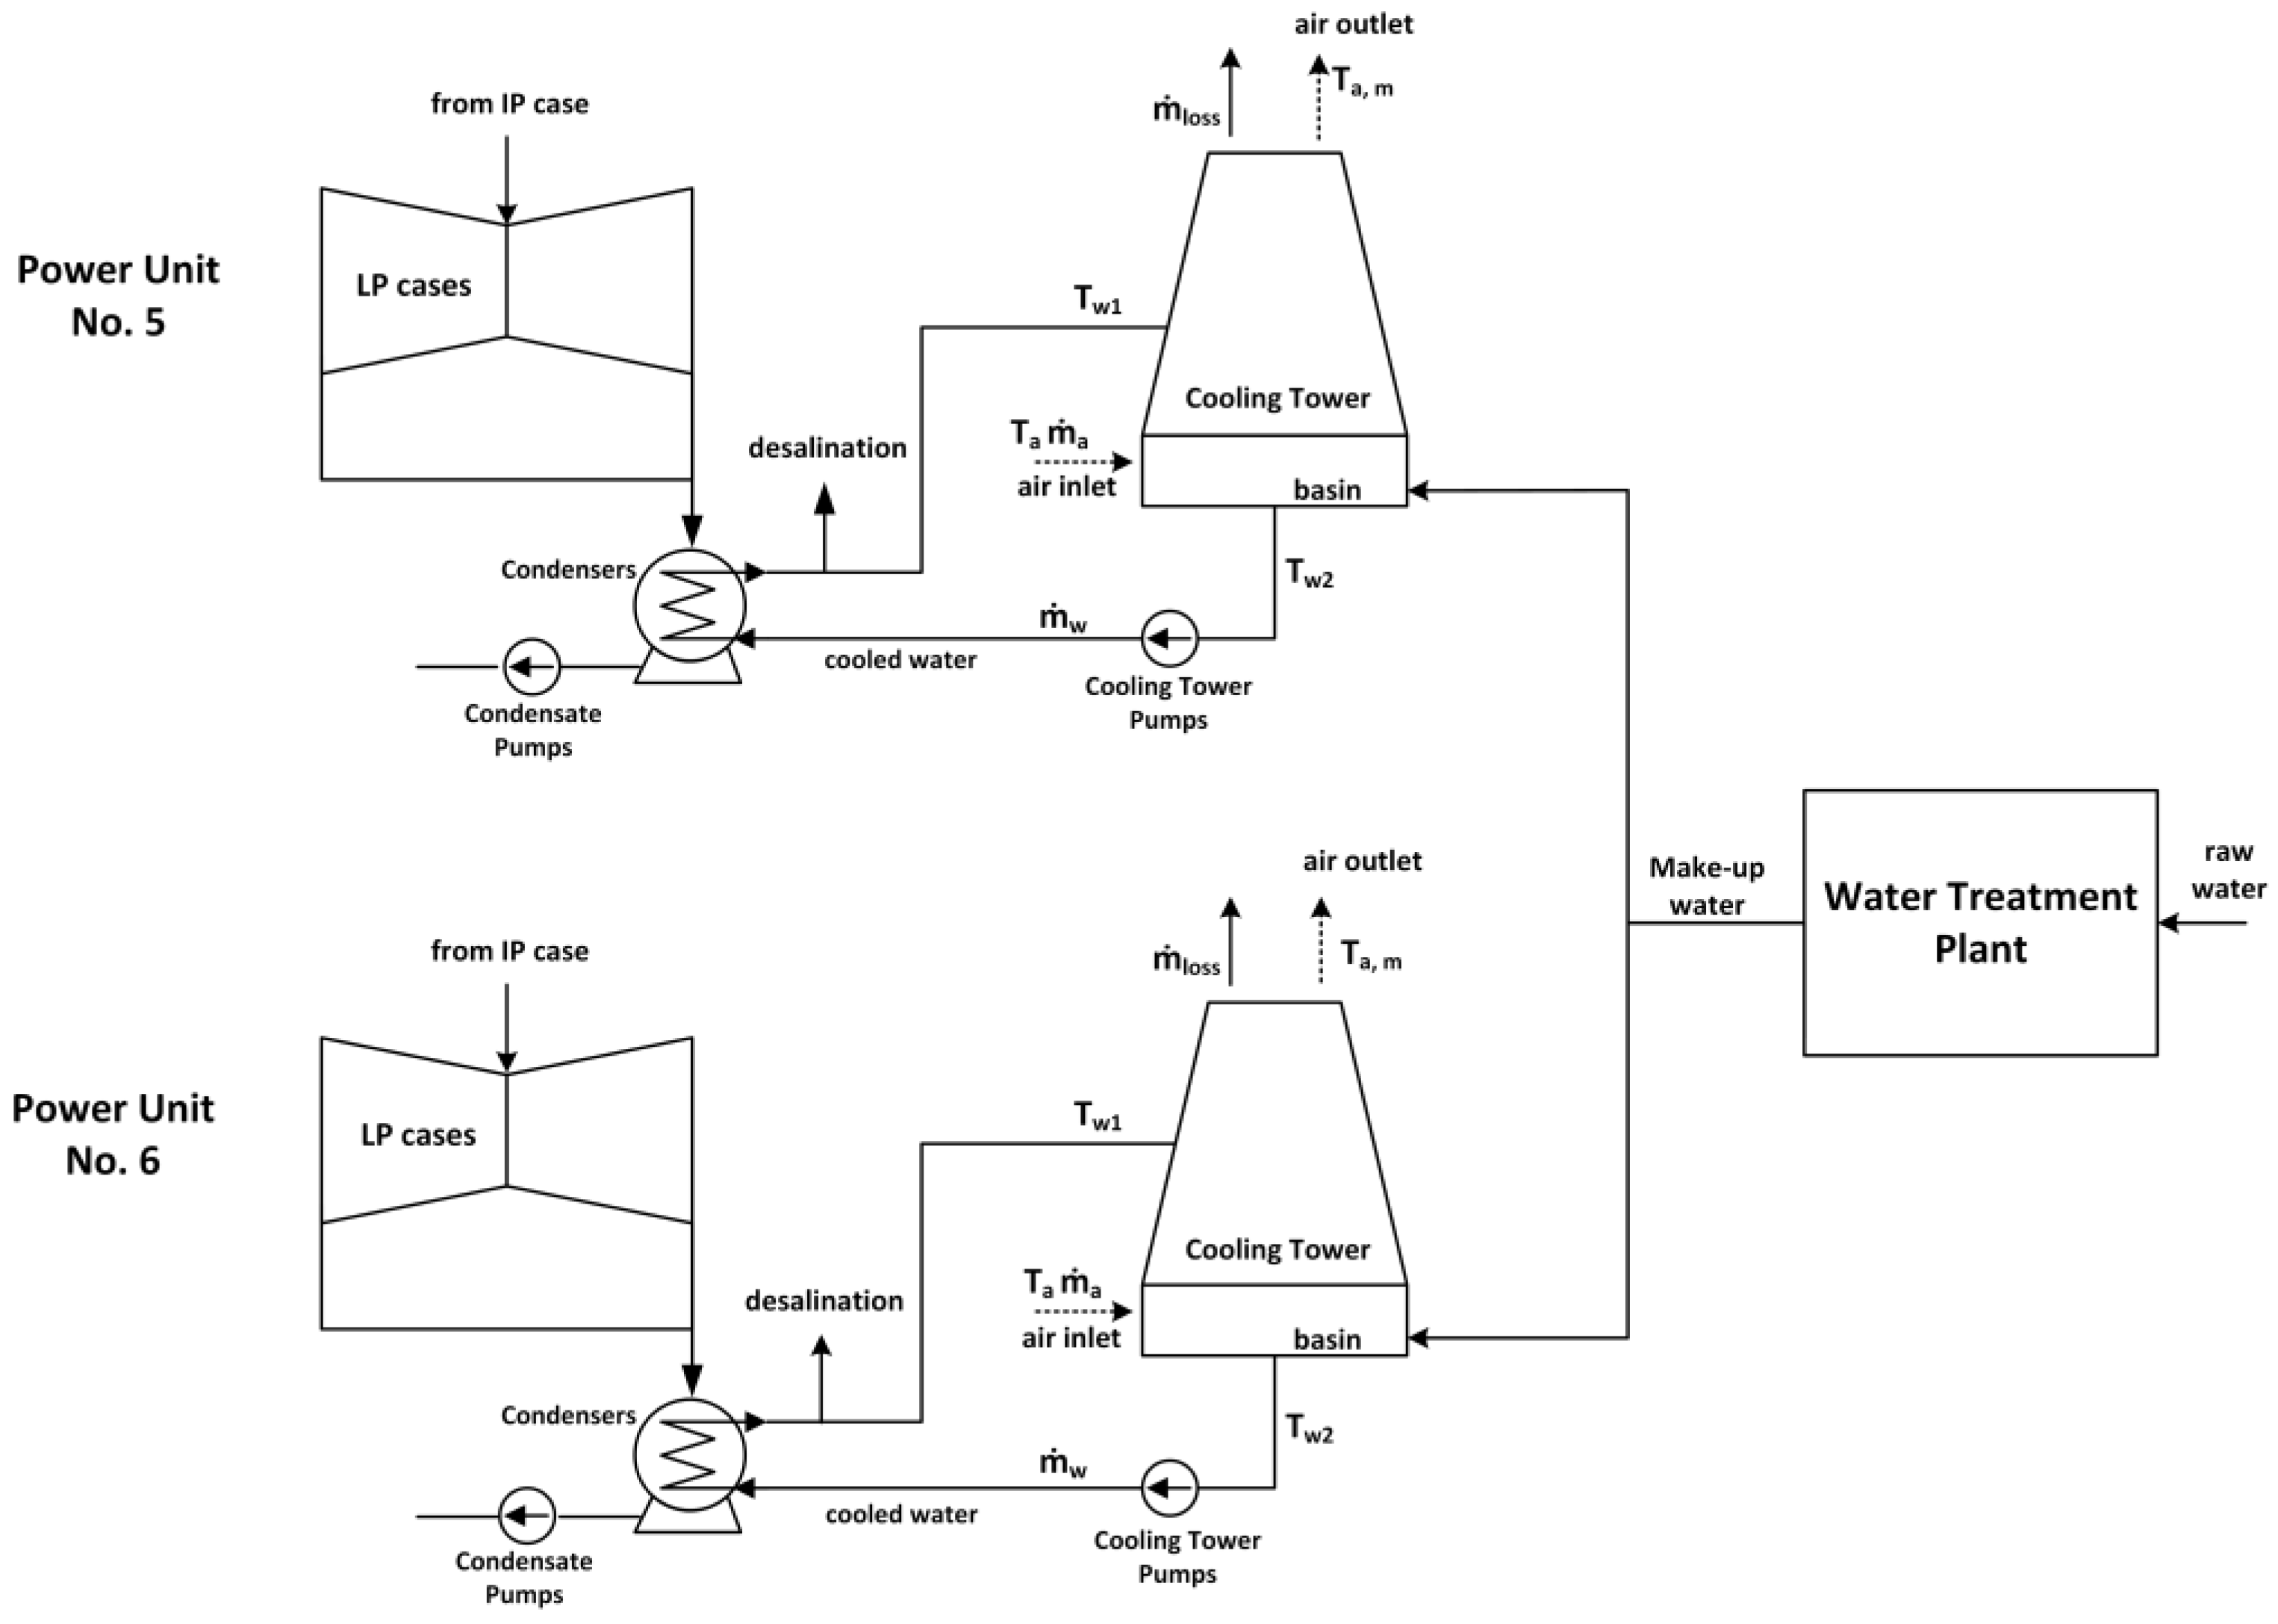
The subject of analysis in this paper is the cooling towers of power units 5 and 6 of the Opole Power Plant. The Opole Power Plant is located in south-western Poland, in the northern part of the city of Opole, downstream of the confluence of the Mała Panew River with the Oder River. It is a thermal, condensing power plant with a closed cooling water system. It comprises four power units with the rated capacity of
each and two new power units with the rated capacity of
each. A diagram of cooling water system for power units 5 and 6 is shown in
Figure 1.
Both power units are the same in terms of their design and equipment parameters. The rated capacity of of each power unit is
. Each power unit has an ultra-supercritical pulverized coal boiler, producing a steam flow rate
Bp = 2555 tons/h with parameters
and
. Steam turbines of the units 5 and 6 are reaction, axial condensing turbines with one interstage superheater. Each turbine consists of high-, medium– and low-pressure cases with bottom exhaust to a single-pressure condenser. The low-pressure section consists of three casings (shown as one in
Figure 1). After expansion, the steam is directed to the water-cooled surface condensers. Each condenser consists of three parts (shown as one in
Figure 1). They are heat exchangers in the cooling water circuit and transfer to the cooling water the condensation thermal energy of the exhaust steam from the
LP section of the turbine set.
The power units have closed cooling systems with cooling towers, without cooling zones separated by walls. Cooling water is continuously replenished from the water treatment plant (WTP). The cooling tower basin desalination plant is also in continuous operation. The assumed net efficiency of the power unit is (under rated capacity without start-up and shut-down of the unit).
A Rosemount 8705 Emerson flowmeter was used to measure the water flow in the desalination system. The uncertainty of the flow meter was 0.25%. Water flow to make up the cooling circuits was measured with a Rosemount 8750 Emerson electromagnetic flowmeter with a measured uncertainty of 0.5%. Cooling water temperatures were measured with Pt-100 class A resistance thermometers, along with Rosemount 248 Emerson transmitters. The sensors were calibrated to obtain a measurement with an uncertainty of less than . Air temperature was measured with Pt-100 class A resistance thermometers with Phoenix-contact TT-ST-M-2 transmitters, calibrated for an uncertainty of less than . Air humidity was determined using a WM33 humidity transmitter from Michell Instruments, with an accuracy of (RH). The water level in the cooling tower basin was determined using the Enders-Hauser FMB52 hydrostatic probe with a measurement uncertainty of 0.2% of the measured value. Measurements of temperatures and water levels in the cooling tower basin were carried out in several places. The measured values have been averaged. The measuring instruments cooperated with the computer measuring system with the use of intermediary devices.
The study covered a one-year period of operation of the power units. Data for calculations were taken from the PROMAN system for visualization created and developed by PROCOM SYSTEM S.A. Registered and averaged measurements, in a specific time interval, of the operating parameters of the power units and the cooling towers were used in the study and in the analysis of the problem. The wet bulb temperature was measured at three different locations in the surroundings of the cooling tower. The water flow rate flowing through the cooling towers was constant and equal to . The wind velocity and direction were measured at the weather station located close to the cooling towers.
The evaporative losses were determined using a simplified method based on the measured parameters of atmospheric air and cooled water. Drawing on the example of [
25,
26], the average water temperature
was determined, where
is the water temperature at the inlet of the cooling tower and
is the temperature of the water flowing out of the cooling tower basin. The air flowing out of the cooling tower was assumed to be at the temperature of
and is saturated with moisture (
). The air flow
and the evaporative loss flux
are determined from the cooling tower energy balance. Both parameters are represented by Equations (1) and (2):
where
is the cooling water rate and
is the specific heat of water.
and
are the enthalpy and moisture content of the air surrounding the cooling towers, determined from measurements of the temperature, relative humidity and barometric pressure (
) of the air. The moisture content of saturated air at temperature
was determined from (3):
where the saturation pressure
was calculated from Equation (4) [
27]:
The above approach assumes a number of simplifications, including the following: in Equation (1), as in [
25] and [
28], the loss of water due to evaporation and drift
is omitted.
Equation (1) makes it possible to estimate the air flow through the cooling tower. The assumptions make it possible to determine the change in the moisture content resulting from water evaporation.
Based on the measured temperatures, the Merkel number was also determined from the following Formula (5) [
26]:
in which
is the enthalpy of the inlet air at the temperature of
and the moisture content corresponding to the inlet conditions.
The calculations were intended to determine the contribution of evaporation to the changed water loss from the cooling tower circuit. It was assumed that the difference between the water loss and the evaporative loss flux is due to the water droplets drifting away from the cooling tower (drift loss).
The water cooling level
is equal to the difference between the temparatures
and
. The cooling efficiency was also determined using Equation (6) below:
where
is the wet bulb temperature of the air at the inlet of the cooling tower.
The non-parametric Kruskal–Wallis test was used to analyze the effect of wind on cooling tower performance (
and
). The grouping variable was wind strength classified on a rank scale. Due to the quantitative nature of the variables (
,
, and
, a one-way analysis of variance (ANOVA) would have to be used to assess whether wind strength significantly influences their values. Thus, it was checked at the outset whether the distributions of the variables subjected to statistical analysis conformed to a normal distribution. Due to the fact that the distributions of the studied variables did not show this conformity, a non-parametric equivalent of the one-way analysis of variance by way of the Kruskal–Wallis test was used [
29,
30]. To confirm the results obtained, the median test was also performed [
31]. It was verified whether the strength of the wind (in categories) significantly statistically differentiates the levels (medians) of the studied variables. The study assumed the significance level of
.
3. Results and Discussion
Blocks 5 and 6 are constructed of practically identical devices. Their parameters practically do not differ.
Figure 2,
Figure 3,
Figure 4,
Figure 5,
Figure 6,
Figure 7 and
Figure 8 were made for power unit 5. Any slight differences in the figures for unit 6 could result from different loads on the power units at different times. Renovation breaks occurred at different times for both blocks.
Figure 2,
Figure 3,
Figure 4,
Figure 5 and
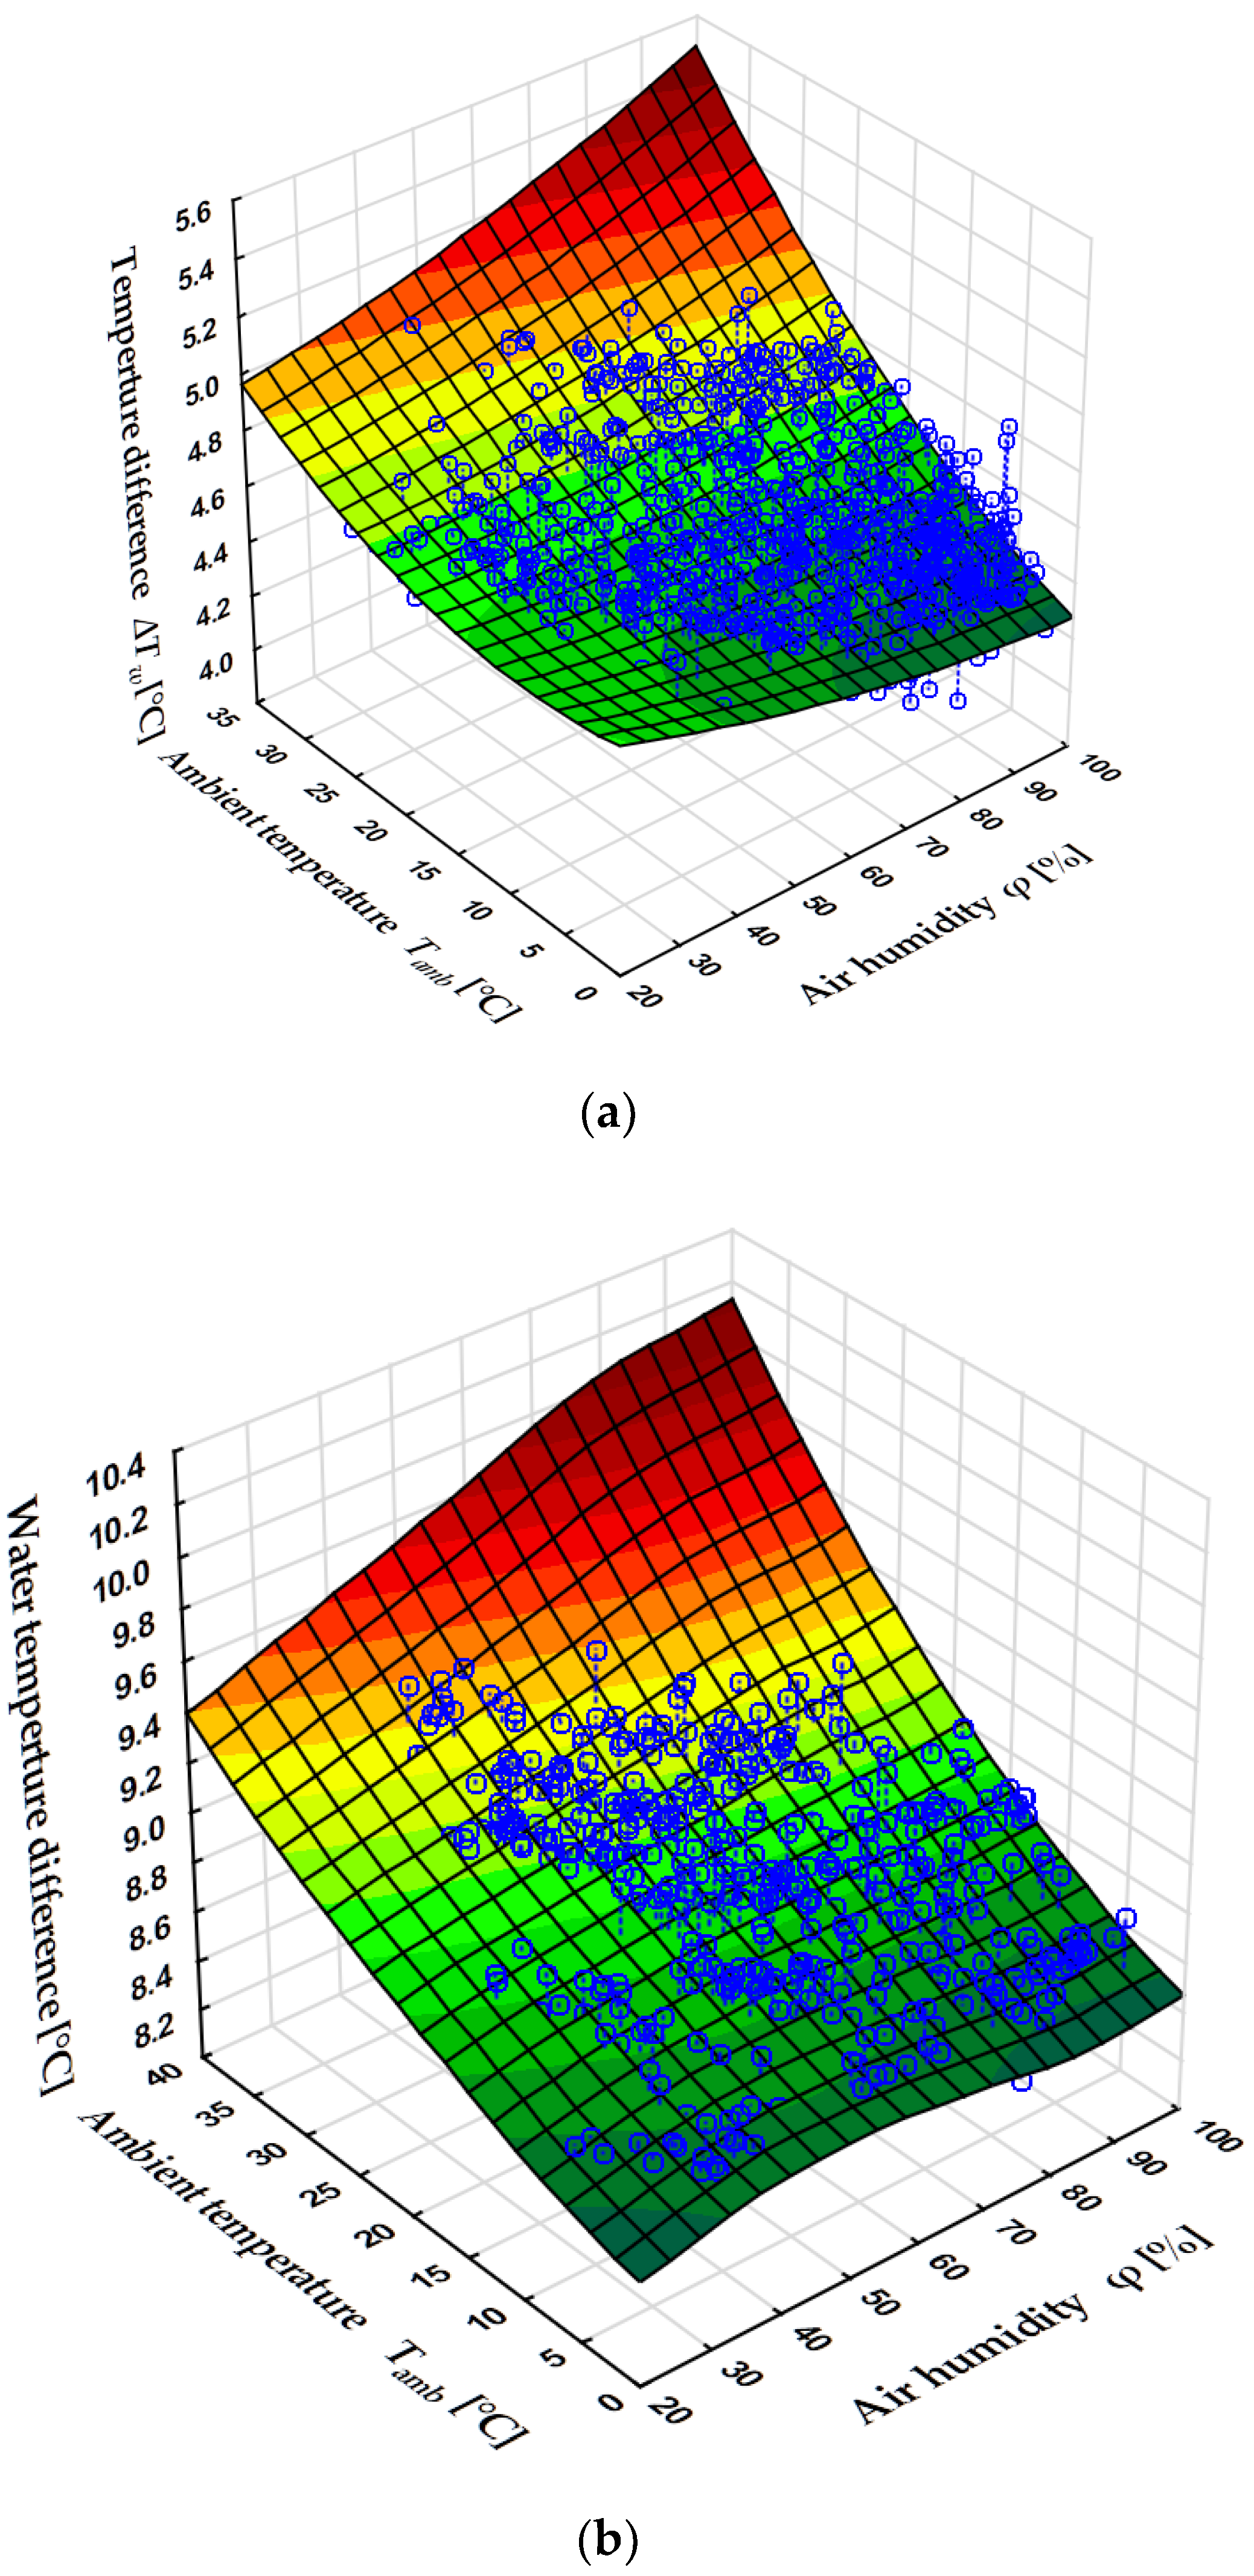
Figure 6 show in blue the scatter of empirical points whose coordinates correspond to the measured values. The planes shown in the figures are the result of approximation of the relationships studied using the method of least squares.
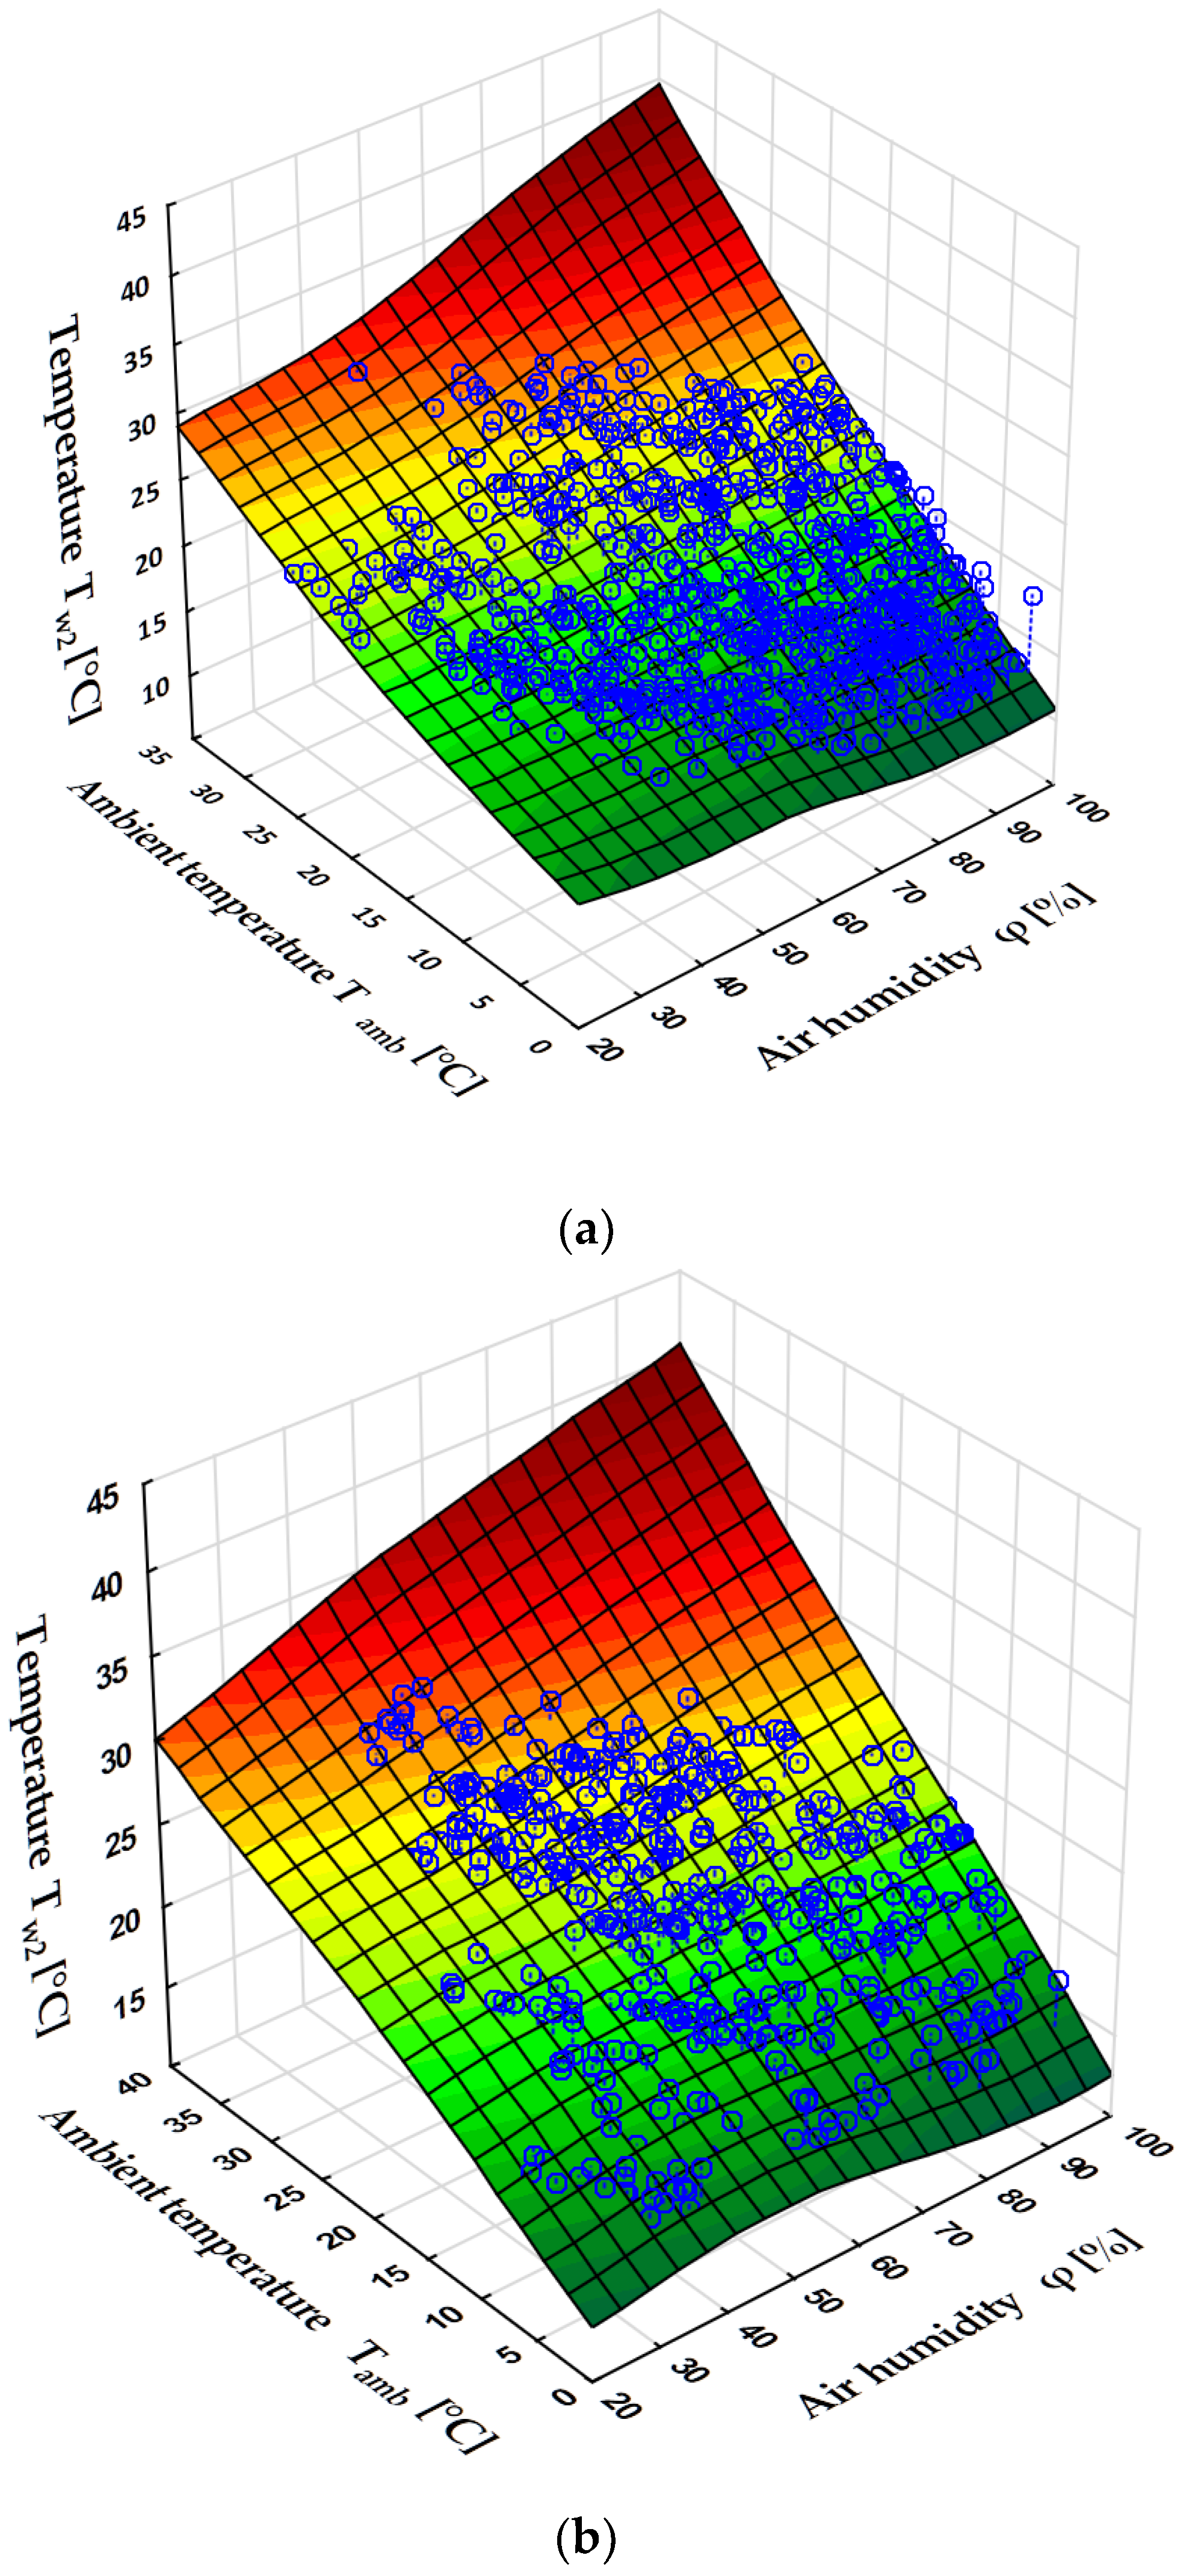
Figure 2a,b show the measured values of cooling water temperature at the outlet of the cooling tower
as a function of ambient temperature
and relative humidity of air
. Two load ranges of power unit
and
were selected. The cooling water rate (
) was constant (in the entire power unit load range). Graphs were prepared for them by approximating the measurement points with a plane. As in other works, a strong dependence of cooling water temperature on ambient temperature can be seen. For example, in the analyzed power unit operating conditions, an increase of
by
(from
to
) causes an increase of outlet temperature by
. This increase depends on the humidity
and the power of the power unit. An increase in power results in an increase in the temperature
at the inlet of the cooling tower and an increase in the temperature difference (cooling levels)
.
Air humidity at
has less effect on the rise of temperature
. The higher the ambient temperature, the greater this effect. This is due to the change in contribution of evaporation and conduction (contact heat dissipation) to heat exchange. The contribution of conduction increases which is also indicated by the results of the calculations presented in [
1].
An increase in temperature
at a constant water flow rate in the cooling tower circuit and a constant power of the power unit
results in a proportional increase in the temperature at the inlet of the cooling tower
. The power changes resulting from the operation of the power unit affect both temperatures, causing changes in the water cooling level
. An increase in air humidity reduces the heat extraction through evaporation, thus resulting in an increase in the temperature of the cooling water at the outlet of the cooling tower
. This increase is strongly dependent on the ambient temperature
. These results are consistent with the results presented in [
32].
Figure 2a,b were prepared for the very different power levels of the power unit. For the same ambient air parameters, the differences in values
are small (
); they are larger at higher power values of the power unit. This is mainly due to the higher temperature
at the inlet of the cooling tower at a high power of the power unit. This effect is shown in
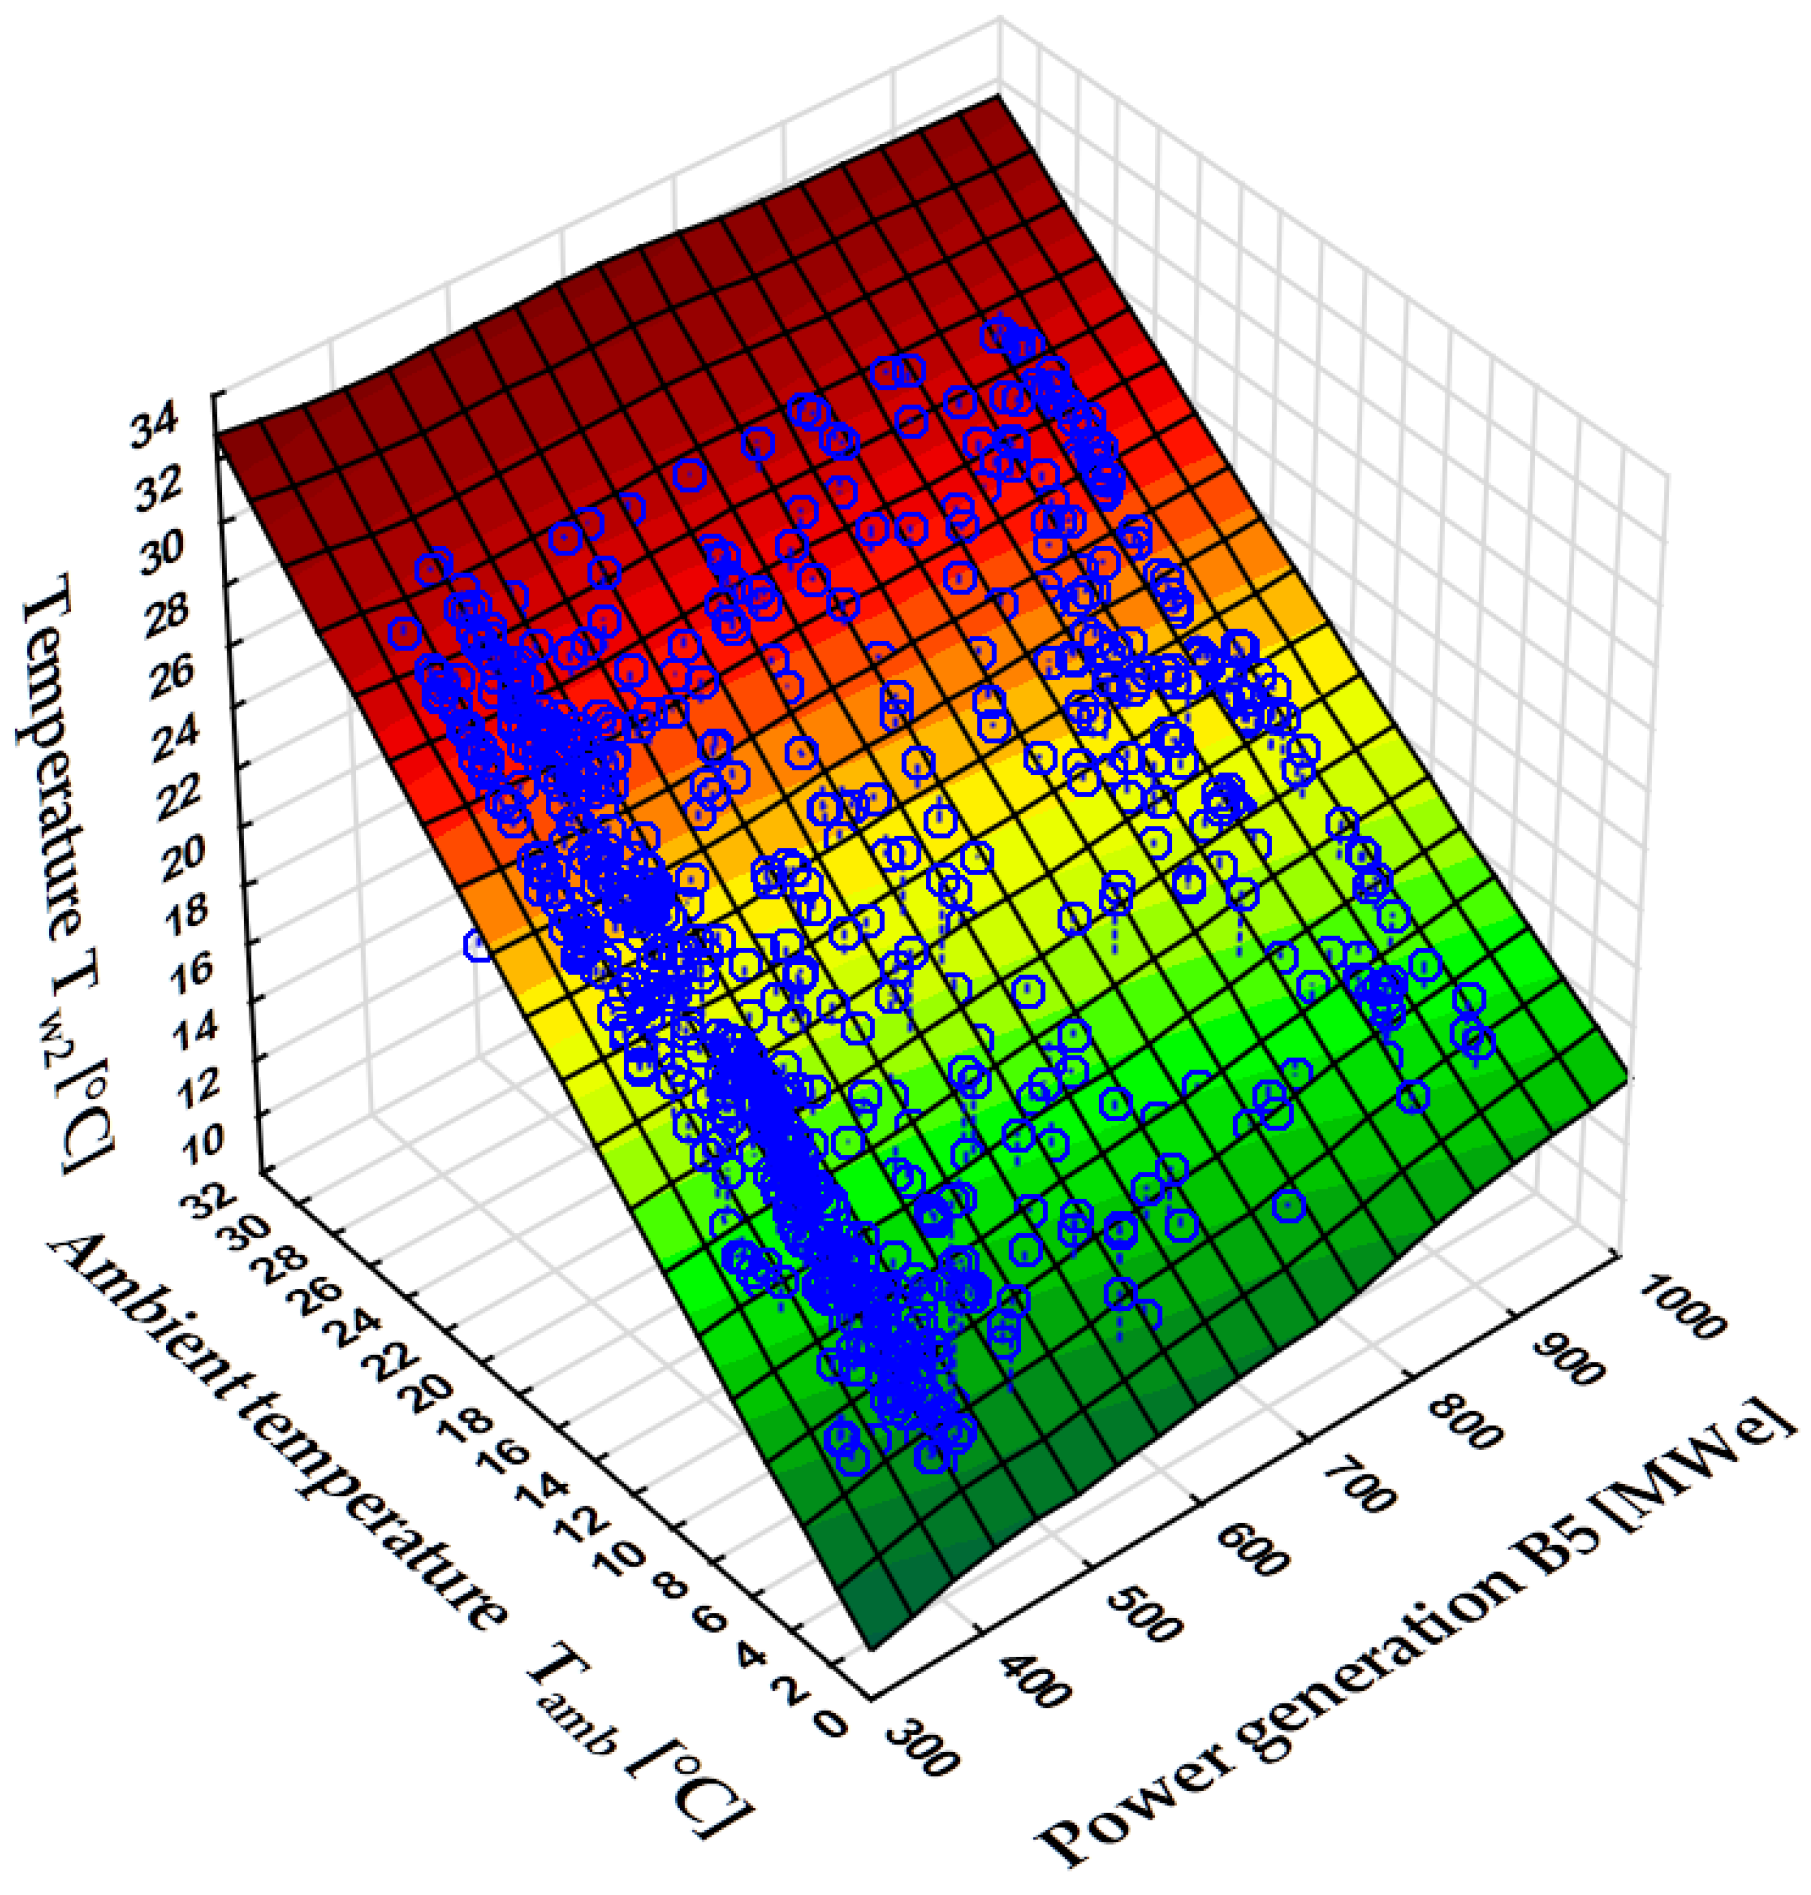
Figure 3, which expresses
as a function of
and the power of the power unit
. The collected data is characterized by a similar value of relative humidity
.
Figure 3 shows that the effect of the power of the examined unit on the value of
manifests itself to a greater extent at lower air temperatures.
The power of the unit 5 and the associated heat flux transmitted in the condenser has a practically directly proportional effect on the value of
, as shown in
Figure 3.
Figure 4a,b show the water cooling level
as a function of ambient air parameters. Offtake of a certain amount of heat in the condenser is associated, at stable conditions of power unit operation, with a strictly defined decrease in cooling water temperature.
The decrease in is due to heat dissipation from the condenser to the environment. In this context, does not depend on temperature and air humidity. On the other hand, a change in the water temperature in the cooling tower due to changes in the ambient conditions has a significant effect on the operating parameters in the condenser. Steam pressure in the condenser affects the efficiency of the power unit. Therefore, at a constant power generated by the power unit, a change in efficiency is associated with a change in the amount of heat transferred to the condenser and consequently a change in . These changes are small; in the context of the value of , in the range of , with powers in the range of . Therefore, at constant power , condenser cooling water rate , and humidity , an increase in temperature causes an increase in the cooling water temperature and a change in the operating conditions of the condenser. A greater heat flux results in an increase in .
At the power of the examined unit in the range of , these changes are equal to about with an increase of by . At the power of the power unit in the range of , this increase is relatively greater and is equal to approximately with an increase of the ambient temperature by .
As the relative humidity of air increases, the cooling rate of the water increases. The compiled measurement results show that the effect of air humidity on the cooling level is small, in the direction of an increase in with increasing . The mechanism of this increase is analogous to the mechanism applicable to ambient temperature . It is related to the cooling water temperature () at the condenser inlet.
Figure 2a,b and
Figure 4a,b show that the maximum cooling water temperatures associated with the maximum ambient temperatures
occur at
, which takes place early in the afternoon. On the other hand,
, in the range of
, occurs at relatively low temperatures
associated with the evening and night and with the winter period. These conditions directly affect the operation of a wet cooling tower.
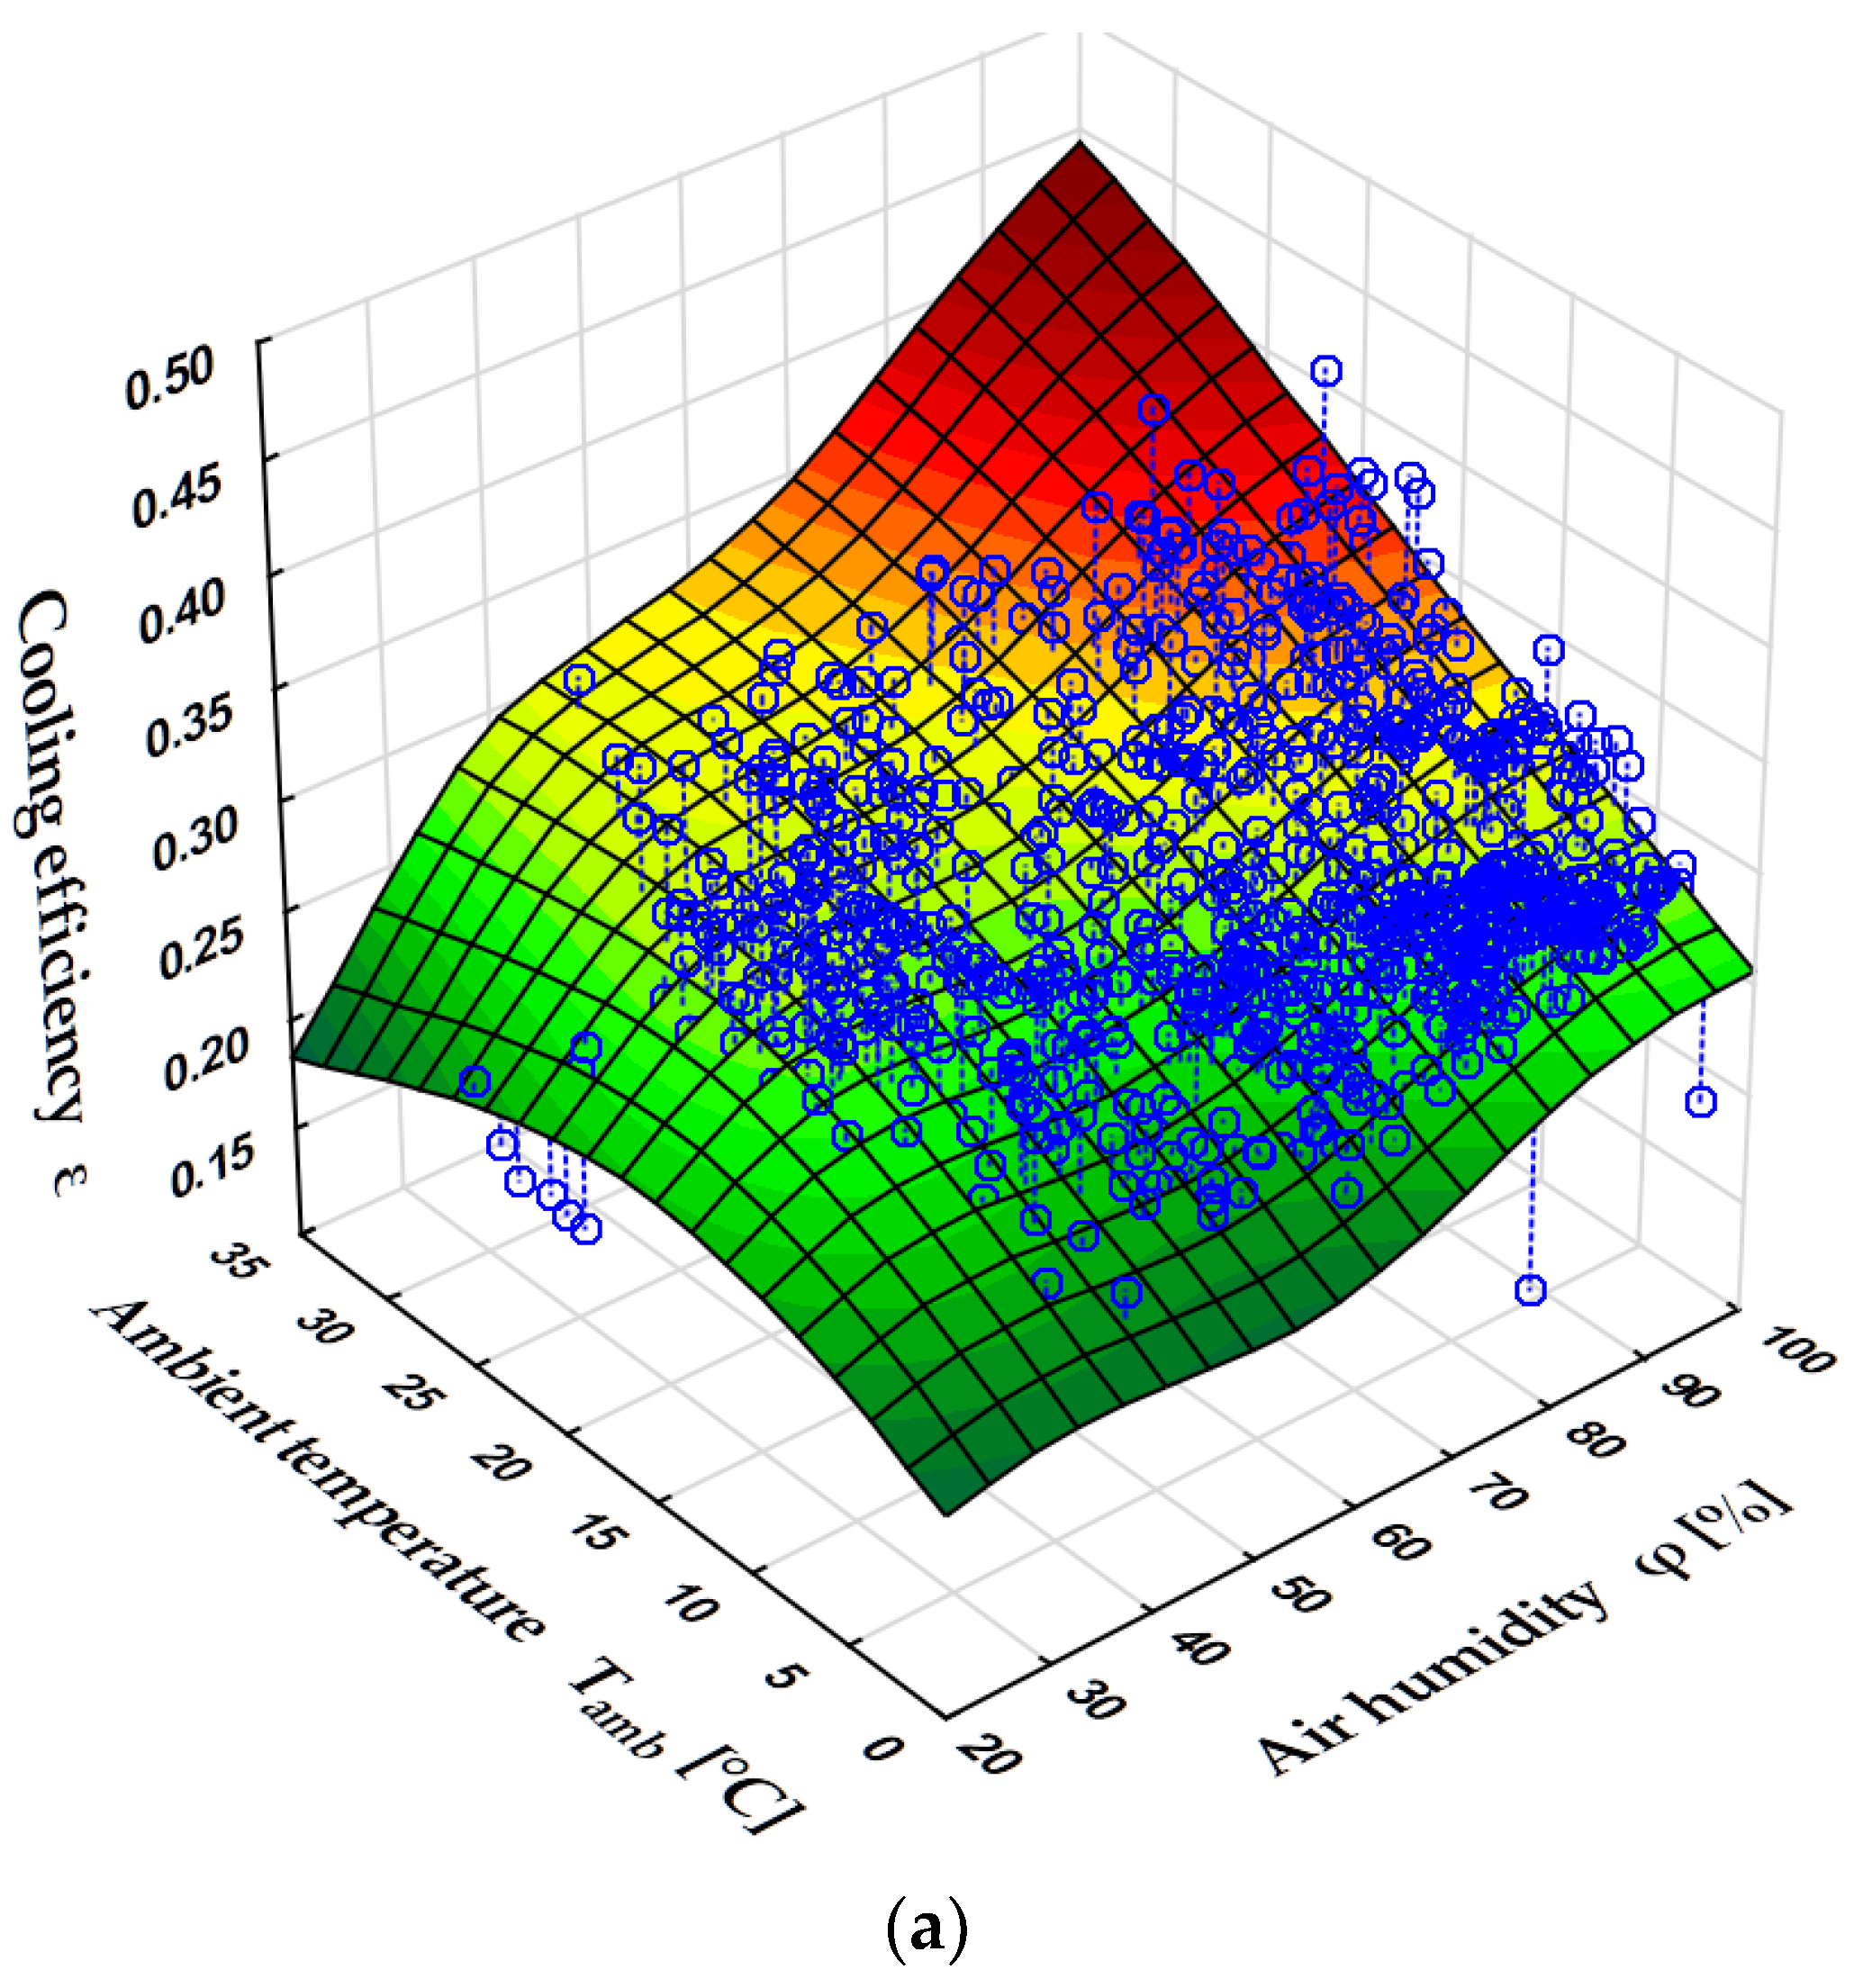
Figure 5a,b shows the effect of temperature and air humidity on the cooling efficiency ε.
The efficiency
is shown as before for the two power levels of the power unit. The values in
Figure 5a,b indicate that
ε increases with the increase in the temperature of the air surrounding the cooling towers as well as with an increase in its relative humidity
. An increase in temperature
is associated with some increase in
, which consequently increases ε. On the other hand, an increase in
causes the temperature
to approach
. When the ambient temperature rises markedly at the same time, the wet bulb temperature
can be several degrees lower than temperature
, and
can exceed the value of
. In the measurements analyzed, this occurred sporadically.
In general, there is a strong effect of the environmental conditions on , mainly due to the dependence of on and .
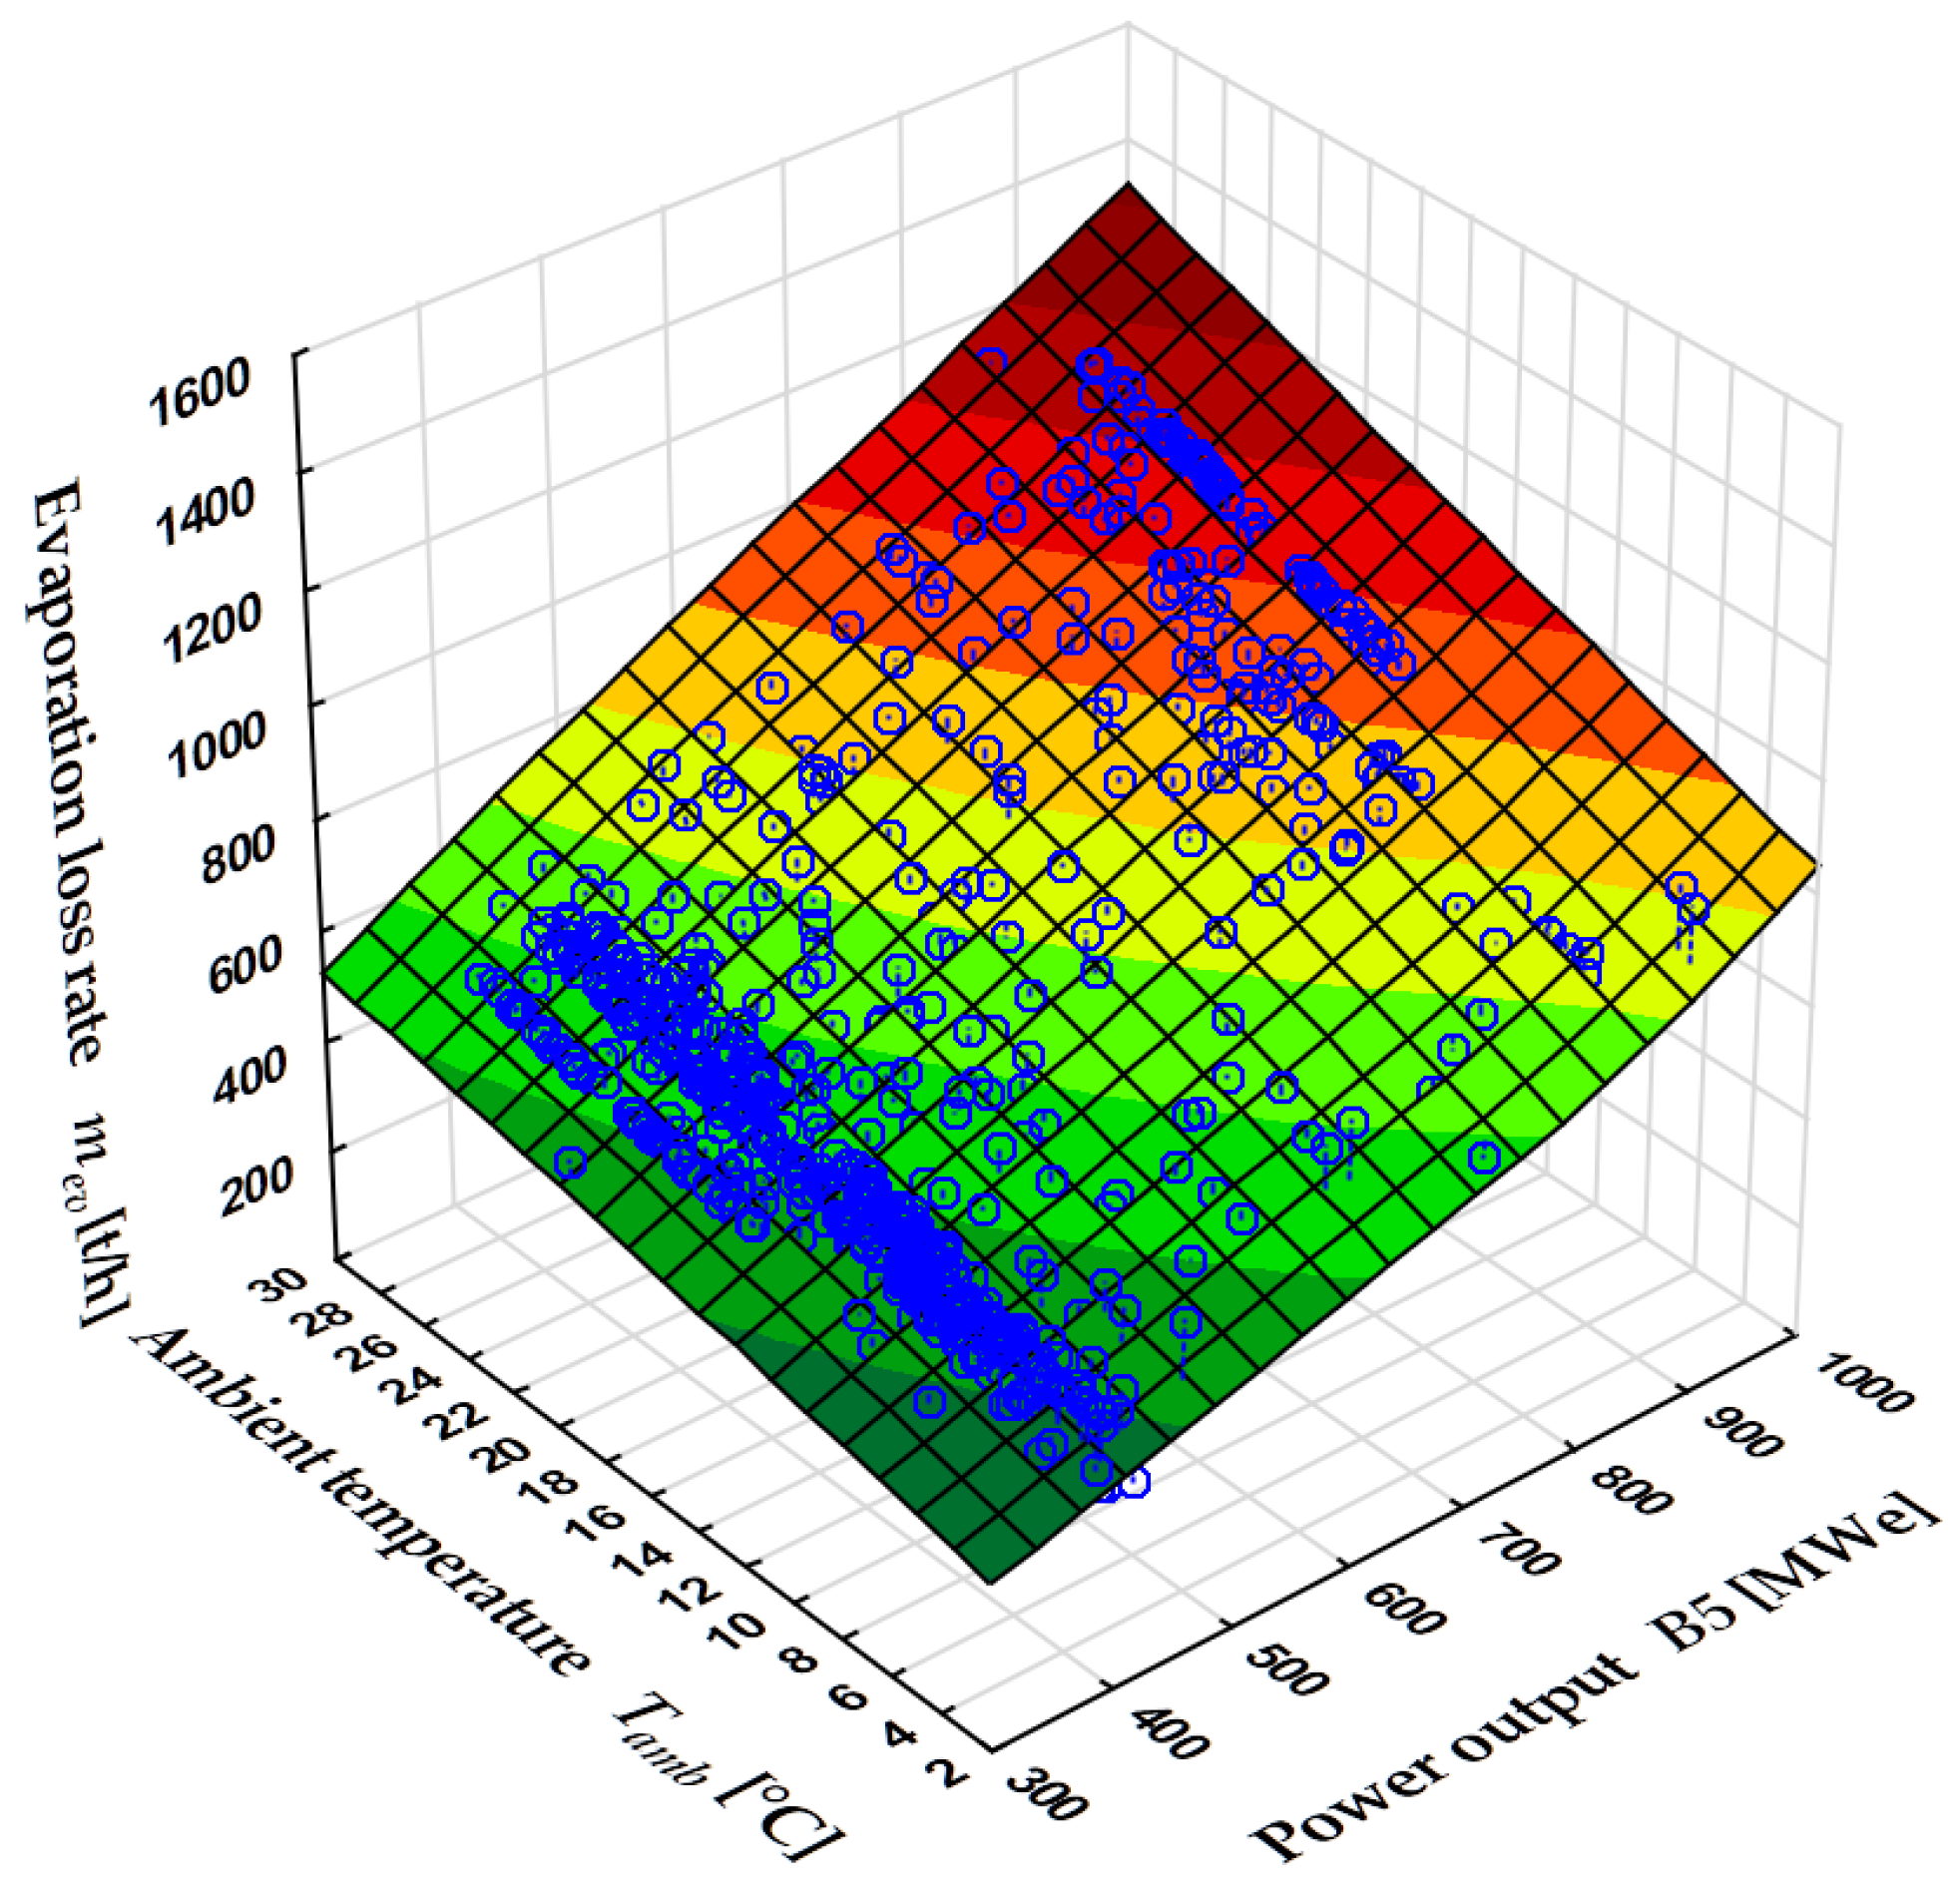
Based on the measurement data for power unit 5, the flux of water loss due to evaporation was determined using Formula (2). An analysis of the results indicates that the power of the examined unit and the ambient temperature have the decisive effect on the values of . Higher power requires more heat to be removed, mainly through evaporation. Higher air temperature enables evaporation of a greater quantity of water.
Figure 6 shows the evaporated water flux
in [
] as a function of air temperature and the power of the power unit, at humidity
in the
range. It can be seen that the dependence of the evaporation loss on the power of the power unit is practically linear. This is due to the fact that evaporation is the predominant ways to lower the temperature of the water in the cooling tower. As for changes of the power from
to
, the evaporated water flux
, depending on the ambient conditions, increases from
to
.
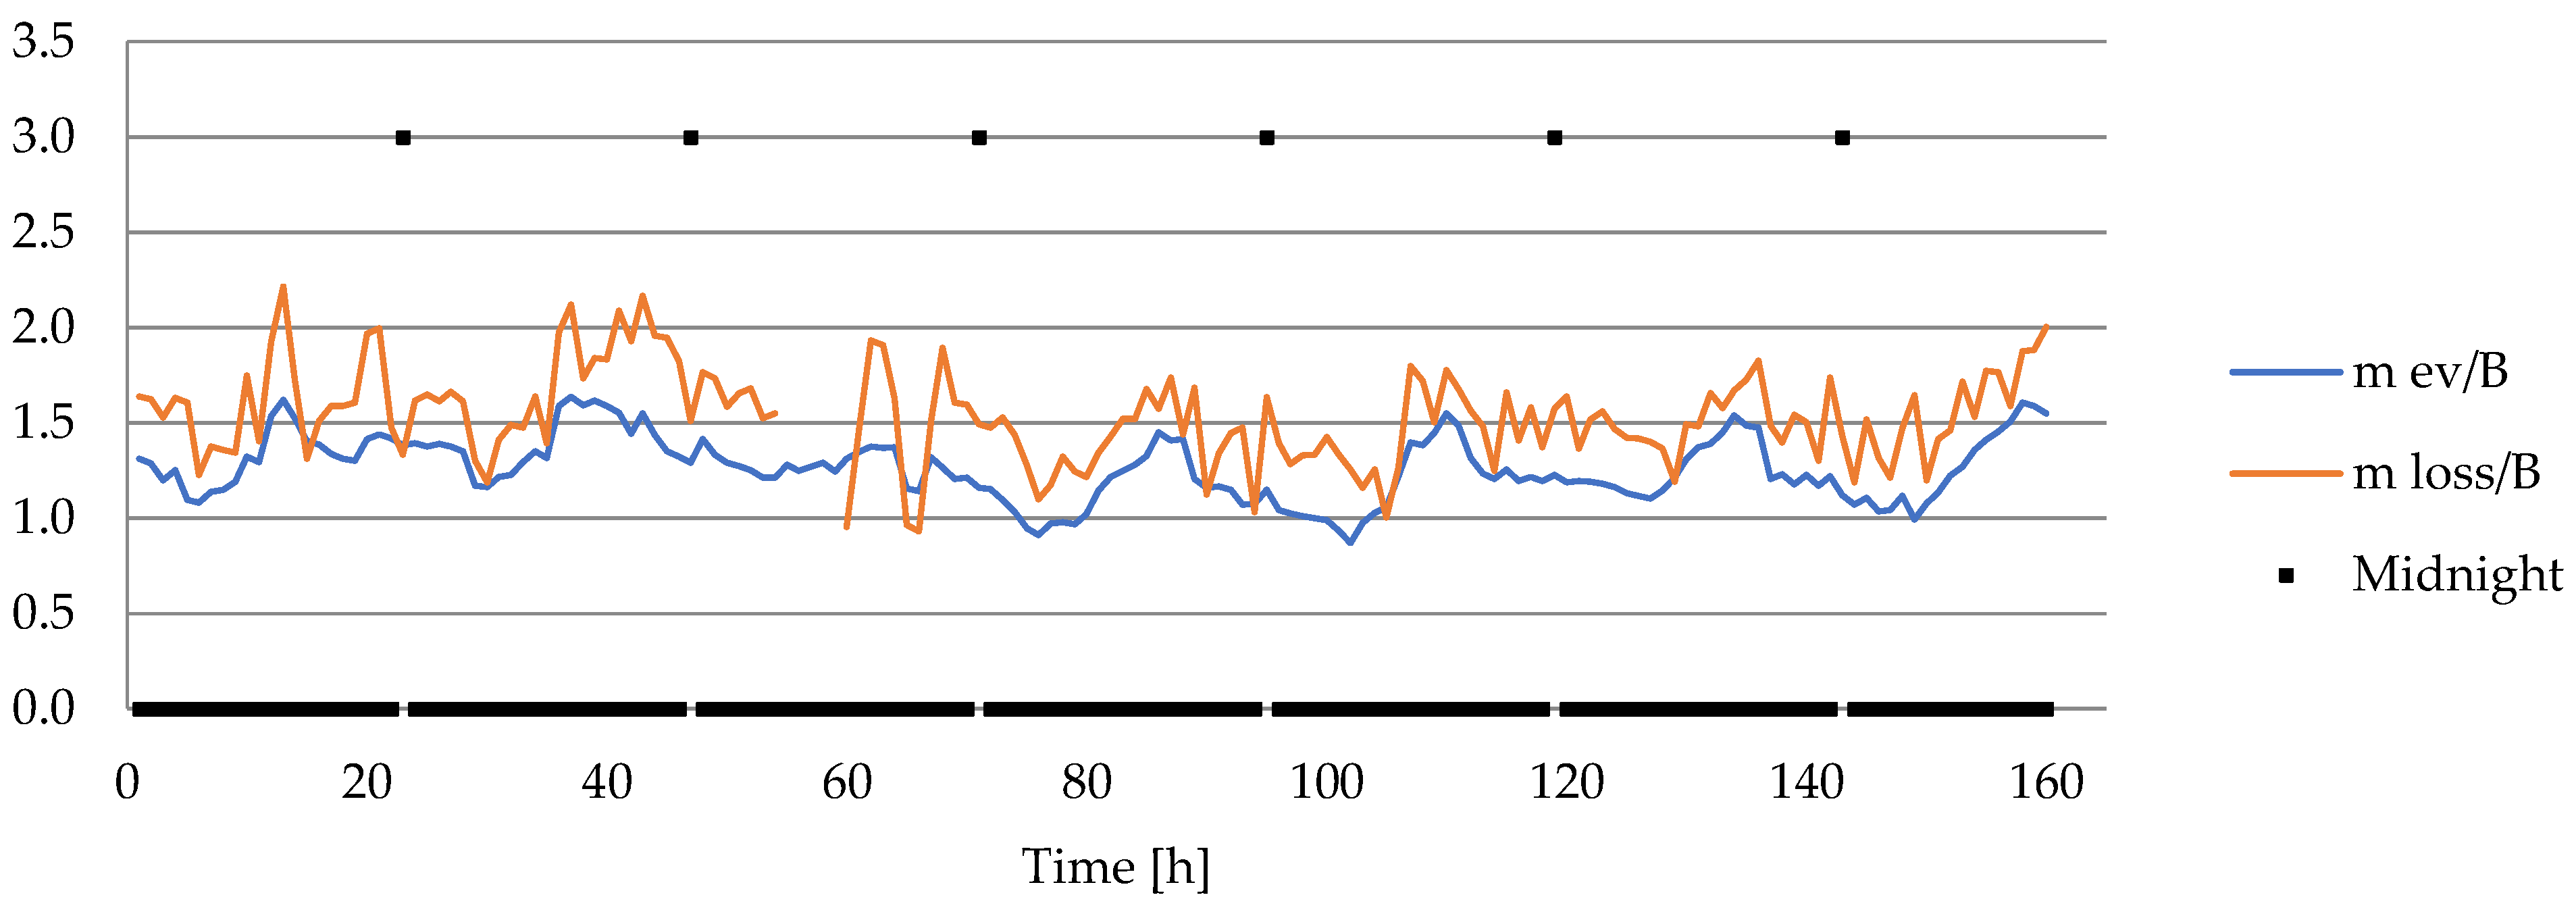
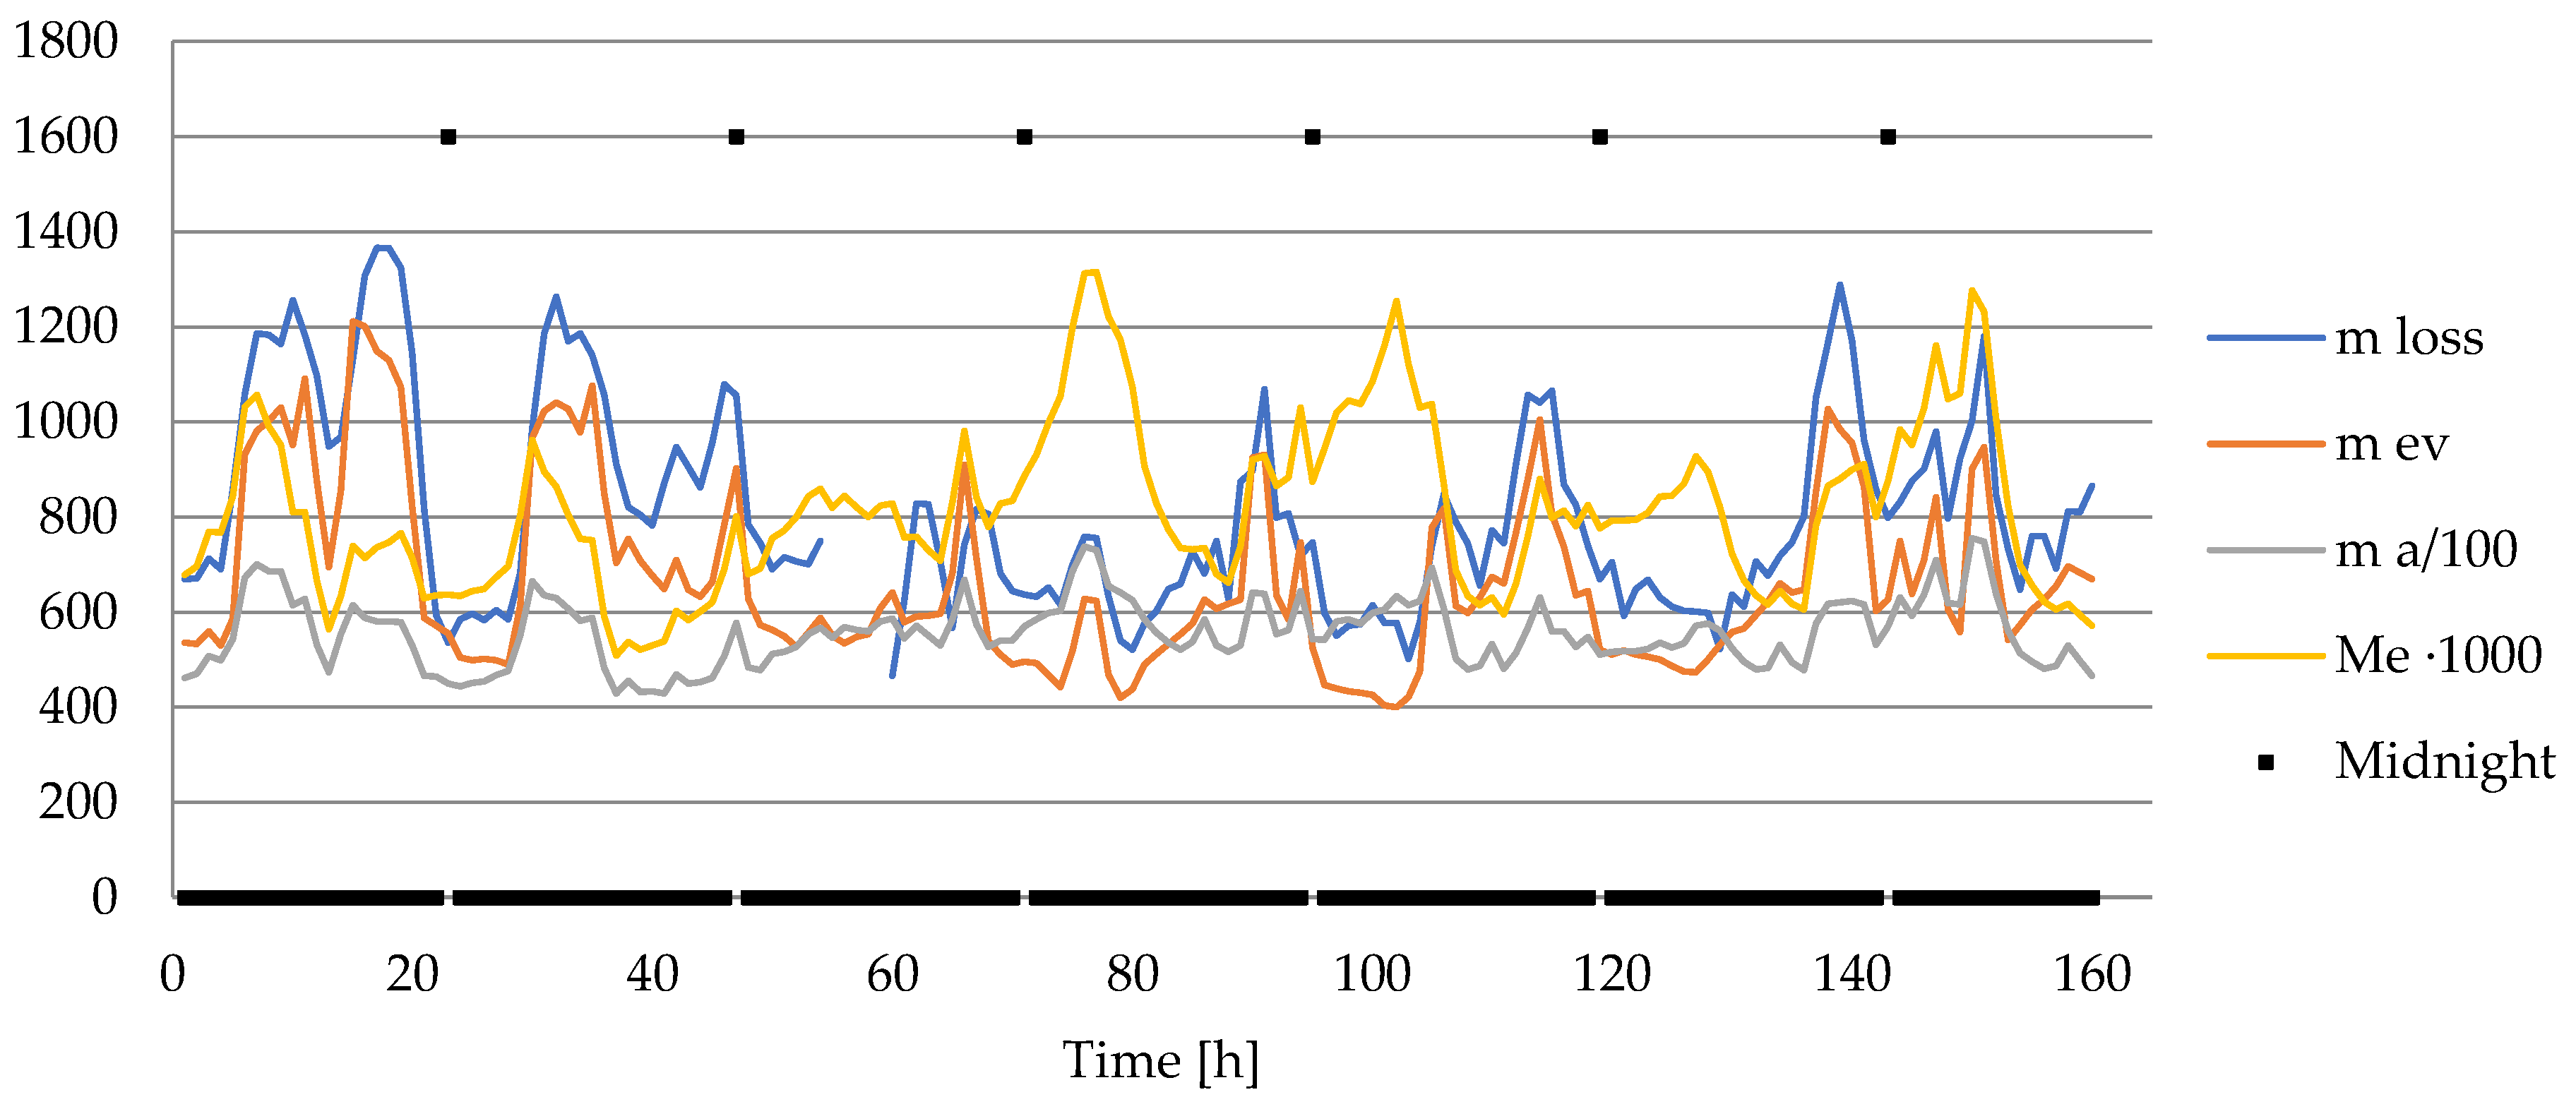
Figure 7 shows the water loss flux
for power unit 5 for 14 days, determined based on the measurements. The second of the investigated power units underwent a planned overhaul. This made it possible to precisely determine the flux of makeup water supplied to the cooling tower circuit. Water losses associated with desalination of the system and changes in the water level in the cooling tower basin were also taken into account. The value
is the sum of the evaporation and drift loss fluxes. In addition,
Figure 7 shows the evaporation loss flux determined from Equation (2), where the air flow was estimated from the balance Equation (1). The air flow calculated in this manner was also plotted in
Figure 7. Furthermore, the instantaneous values of the Merkel number defined by Equation (5) are shown in the figure.
The high variability of the analyzed values results from changes of the power unit load in the power system, as well as from the variable temperature and air humidity. The waveforms of the variables indicate a clear difference between the fluxes and (evaporated water flux) ranging from a few to tens of percent . In the analyzed period, the average power of the power unit was , the average flow rate and the average flux . Consequently, the average values of evaporation and drift fluxes were equal to, respectively, and of the water flux in the cooling tower circuit. The air flow through the cooling tower remains relatively stable at 60,000 ± 10,000 nm3/h. This is mainly due to the constant flow of cooling water.
Variation in the power unit load and the ambient conditions affect the value of . What is also important is the fact that the parameter values used in the calculations are the hourly averages. The Merkel number during the dominant time period was in the range of 0.60.8. This is a typical range for this type of cooling towers.
Figure 8 shows the fluxes
and
in relation to the power generated by the power unit. The average value defined by
of water and corresponds to the level that for wet cooling towers is given in [
10,
11,
25].
Figure 8 better illustrates the difference between
and
.
The effect of wind on the operating parameters of cooling towers was also analyzed. Both wind strength and wind direction were considered when it is possible for one cooling tower to interact with another. The graphs prepared and the correlations of the variables determined did not give clear answers as to whether and to what extent wind influences the heat exchange process in both analyzed cooling towers. Therefore, the measured wind velocity data were divided into four groups.
Table 1 contains information about the proposed categories, their counts, and the codes assigned.
The Kruskal–Wallis test and the median test were performed for the numerous categories thus identified. It was investigated whether the level of the variables that characterize the operating parameters of cooling towers ( and ) depend on wind velocity. As mentioned in the Materials and Methods section, the choice of non-parametric tests was due to the failure to meet the assumptions of ANOVA regarding the normal distribution of the studied variables. The following results were obtained for power units 5 and 6 and are shown in the tables and figures below.
The tests were conducted for each power unit separately. The weather conditions for both power units were virtually the same. However, the power units operated at different times and with different power. The timing of the power unit outages also varied. The use of separate data from the two power units in the tests made it possible to verify the test results and the conclusions.
As can be seen from
Table 2, there is a statistically significant difference in the levels (medians) for the water temperature difference variable
because
p-value < 0.05. Thus, there is a relationship between wind strength and the variable under examination.
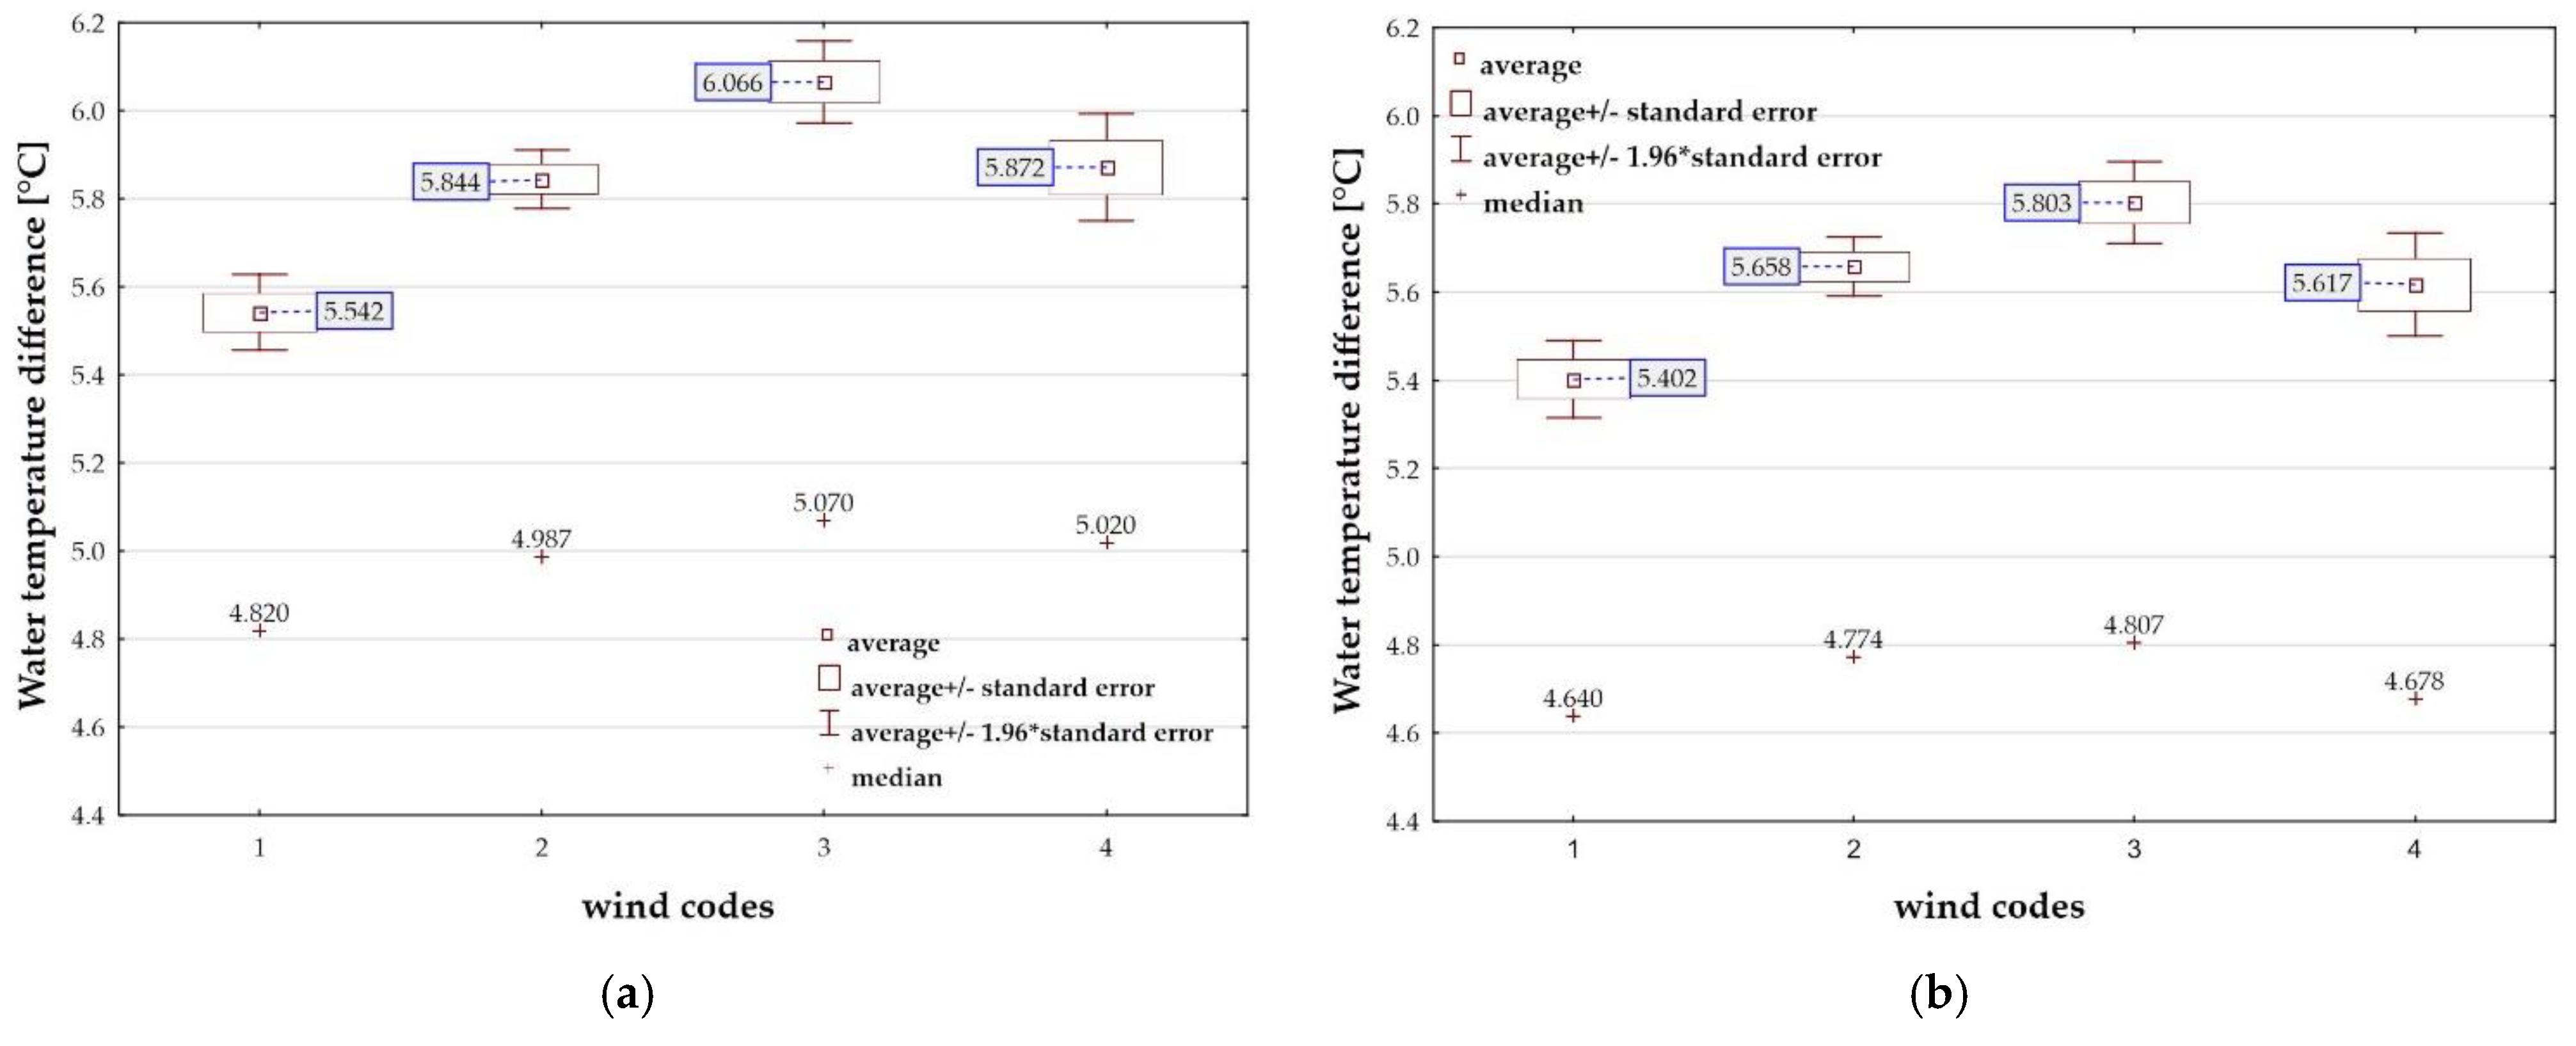
Figure 9a shows the distribution of the median and average values of the water cooling level
for the cooling tower of power unit 5. The average and median value
for the first data set, which corresponds to the minimum wind velocity
, was taken as a reference value. The results indicate an increase in
by
as the average wind velocity increases to
. With a further increase in wind velocity, there is a marked decrease in
The value of
for this data group, however, is higher than the reference level
by
. The results for the cooling tower of power unit 6, shown in
Figure 9b, confirm the changes in the average groups of
and median values.
The maximum increase in
was 9.5%. In general, it can be concluded that the presence of wind and an increase in its velocity result in an increase in
in the analyzed range of changes for both cooling towers. It is difficult to identify and only by analyzing averages for large sample sizes was it possible to reach conclusions. These results are the opposite of those shown in [
4]. In contrast, paper [
6] indicates wind velocity ranges, especially higher ones, at which
increases.
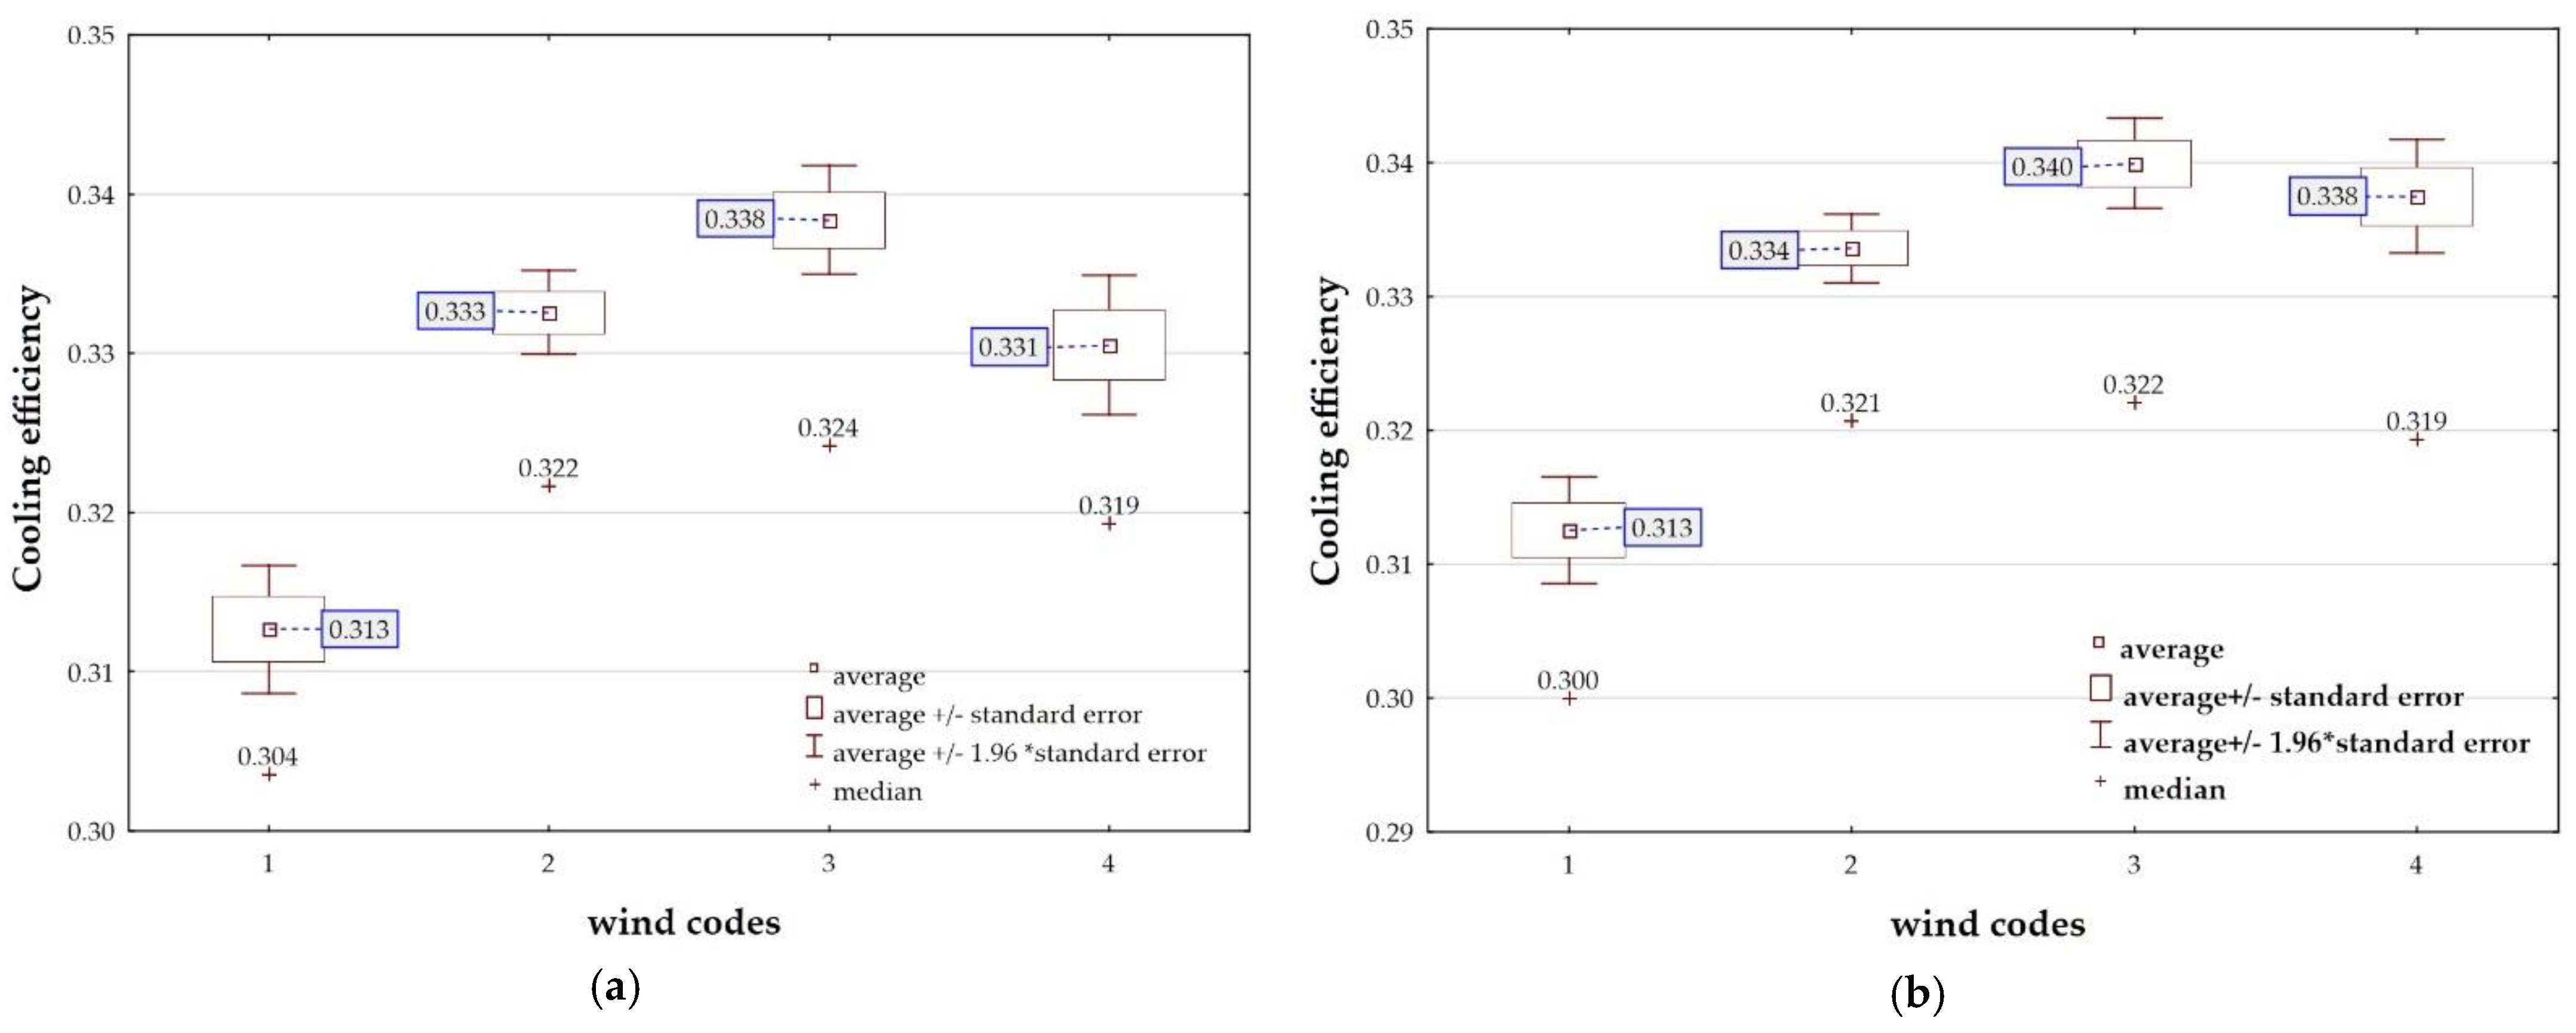
Then, using the same methodology, it was checked whether the cooling efficiency
depends on wind velocity. Test results are shown in
Table 3 and
Figure 10a,b. An analysis of the data from
Table 3 indicates that
p-value < 0.05, i.e., the difference in levels (of median values) for the water cooling efficiency variable–
[%] is statistically significant. Thus, there is a relationship between wind velocity and the variable under study.
Figure 10a,b show the distributions of the median and average values for the water cooling efficiency variable–ε [%]. If the average values ε and the median of the data group for (
) are assumed as a reference level, ε increases, reaching a maximum level for the data group in the
interval). This increase is equal to
of the reference level for the cooling tower of power unit 5 and
for the cooling tower of power unit 6. For both cooling towers, the increase is slightly smaller for date from the interval (>3 m/s), compared to the reference level. The comparison even shows a quantitative consistency between the average and median ε values in each data group for the cooling towers of power units 5 and 6.
Tests were also performed for the same data intervals for the total water evaporative loss and drift loss—
. The measurement system made it impossible to precisely allocate the water replenishment to the cooling tower basins of individual power units. Exact determination is possible when one power unit is not in operation. This also applies to the
, which is determined from the water balance and changes in the water level in the cooling tower basin. Therefore, the above analysis was attempted by taking into account the total loss flux for both power units
. These values were compared to the power generated by both power units. The test results are shown in
Table 4 and
Figure 11.
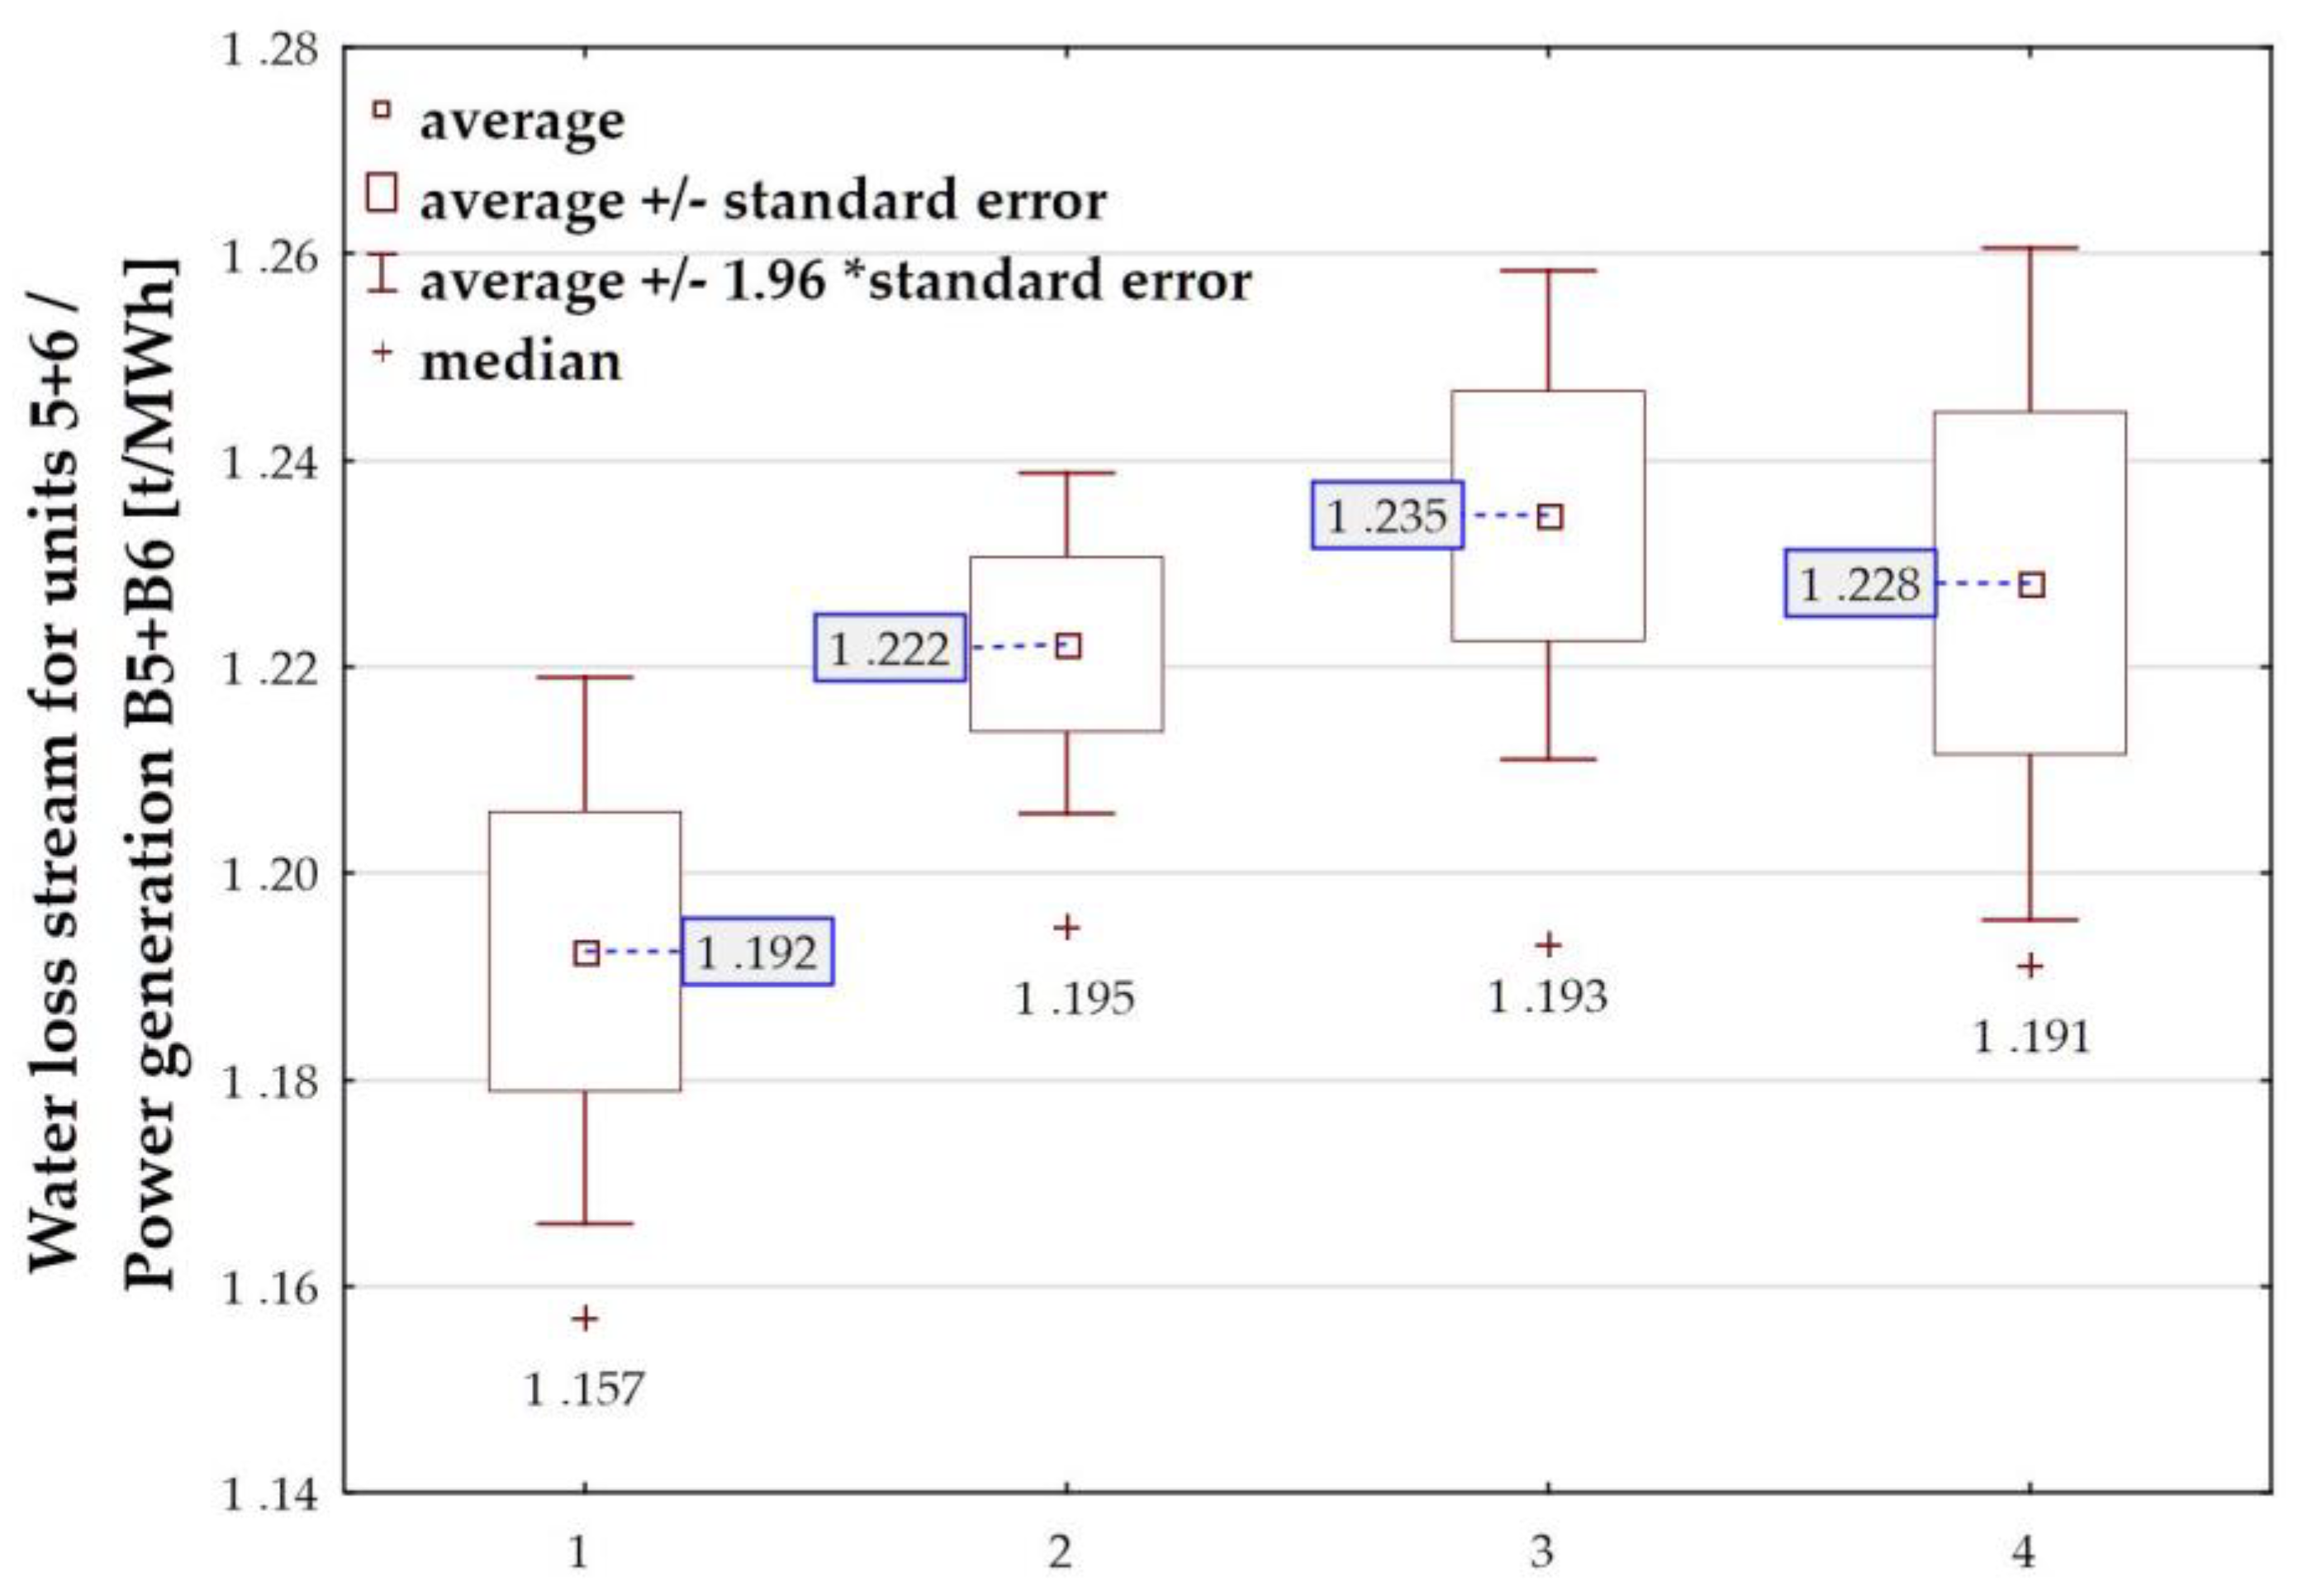
As shown in
Table 4, there is a statistically significant difference in the levels (medians) for the studied variable for both tests (
p-value < 0.05).
As before,
Figure 11 shows the distributions of the median and average values for quantities:
(
). The average and median values from the first data group (
were treated as in previous figures as the reference level. It can be concluded that the values in the other groups are significantly higher than the average and median values (
) for the interval (
). The maximum increase in the average was 3.5%. The trend of wind effect on the changes (
) is similar to the changes in
and
. In general, it can be said that this effect is statistically significant and increases
and
, as well as (
). A comparison of the results for power units 5 and 6 confirms this regularity.
It is difficult to interpret the above results at this stage. In [
26] a negative effect of wind on the operation of cooling towers is generally discussed. It is also indicated there that wind causes an increase in the temperature
. The increase in the temperature of the cooling tower outlet water
may consequently cause the increase in
and
, which has been discussed earlier.


