1. Introduction
The main objective of this paper is to examine systemic risk spillovers for the European energy sector, considering both the contribution of individual energy firms and the aggregate spillovers between the energy sector and other economic sectors. In other words, the purpose of our article is to study systemic risk spillovers for European energy companies and to determine the spillover network of the energy sector with other sectors. Our approach is motivated by the fact that the 2008 Global Financial Crisis (hereafter GFC) caused turbulence in global financial markets which translated into important negative economic effects. Such monumental negative externalities constituted a catalyzing factor for phenomena such as the European Sovereign Debt Crisis of 2009, which had paramount effects on both the financial and real sides of the economy. This crippling impact was visible across all economic sectors, including energy markets. The specific literature renders an important dose of attention to energy markets given the fact that the dynamics of energy prices impact the efficiency and performance of the vast majority of economic sectors through different channels and at different levels [
1]. At the portfolio level, having information about the risk in the energy futures market helps investors to optimize their market risk mitigation strategies. Moreover, in both developed and developing markets, crude oil acts as a prime driver of various economic variables.
In such an adverse scenario as the GFC, it became clear that one institution or a small fraction of the financial system can generate an impact that can cripple the entire system, causing cascade defaults and systemic disturbances [
2]. This prompted the idea that the evaluation of the potential riskiness and the level of interconnectedness of financial institutions is a primary element for the stability of the financial system.
Given its macroeconomic importance, climate change, and associated environmental problems, the energy sector attracts a solid block of attention in terms of research and development aimed at optimizing its structures. This interest translates into consistent capital movements which make energy-related companies an appealing target for portfolio formation. As a consequence, the specific literature bears marks of the inclusion of the sector in a vast array of financial applications in various areas, such as energy consumption and financial development [
3], information spillovers [
4], volatility spillovers from energy markets to financial markets [
5], systemic risk [
6], oil shocks and their effects [
7], risk spillovers between crude oil and stock index returns [
8], or energy sector bubbles [
9], mentioning here solely those areas that have a direct connection to our present research question. In addition to this, there is a well-grounded literature linking energy markets or commodities with various facets of the financial spectra; see for example [
10,
11,
12,
13,
14,
15].
Our approach is also motivated by the fact that despite this interest, there are sparse previous attempts oriented towards modeling systemic risk dynamics for energy markets, and especially focusing on offering a systemic risk characterization of energy companies.
In a very interesting contribution, [
6] conducts a comparison between the systemic risk of the energy and the financial sector for the European market. The investigation is built around a set of credit default swaps belonging to 18 energy companies and 27 financial firms and is conducted via a dynamic factor copula setup. In terms of systemic risk assessment, [
6] relies on two measures, namely: the joint probability of distress and the expected fraction of companies in distress conditioned on a given company being in distress. In this framework, the author manages to isolate three peaks for systemic risk for the energy sector, in 2008, 2009, and 2012.
The authors of [
7,
8] study systemic risk via its connection to oil dynamics or shocks. The former study uses a structural VAR (vector autoregression) approach for a set of 20 countries and concludes that oil structural shocks have effects on both individual markets and their connections with others. The authors of [
8] also report interesting results, among which we remark upon the fact that stock market returns seem to be more sensitive to oil price dynamics in volatile times than in times of tranquility. Recent research, see [
16] or [
17] inter alia, has confirmed the relevance of certain industry groups in systemic risk proliferation. In addition to this, [
16] shows that besides banks, real estate, or insurance, other economic sectors have a relevant potential in terms of being risk spillover sources. This motivates our orientation towards filling the gap in the literature highlighted above and our focus on the energy sector as we aim to determine systemic risk dynamics, both within the sector and in relation to other sectors.
As highlighted above, the objective of our article is to study systemic risk spillovers for European energy companies and to determine the spillover network of the energy sector with other economic sectors. These two objectives represent the first two original contributions of our manuscript. Thirdly, in order to examine the spillovers existing within the energy sector, we employ three systemic risk measures, namely the CoVaR, Delta CoVaR, and marginal expected shortfall (MES) measures considered previously by both [
8] and [
16]. We then embed the results of these models into a Diebold–Yilmaz [
18] framework obtaining from, to, and net spillovers for each company in our sample. This allows us to determine which company contributes the most to systemic risk, or which company is the most vulnerable to systemic risk. From a technical point of view, in this area we employ both a rolling window and a full-sample perspective. As it will be detailed in a subsequent section, our baseline specification incorporates a 120-day rolling window approach which moves by one day at a time, resulting in 3314 samples. This setup allows us to obtain three sequences of results that show to, from, and net contagion patterns, a view on general transmission, and a specification for an intra-sector spillover index. Fourthly, in the second part of our analysis, we consider an extension of the modeling procedure put forward by [
19] in order to extract a Bayesian formulation of the systemic risk spillover entropy for the energy sector vis à vis other economic sectors. Finally, we test the sector-oriented, entropy-based approach for robustness. In order to do so, we employ alternatives for the window size moving from 120 days to 90 days first, and then to 150. Under this setup, we employ 3344 samples for the 90-day rolling and 3284 samples for the 150-day rolling windows.
All our computations target the most relevant European companies included in the STOXX 600 index. Company allocation to a specific sector is considered via the GICS 24 categorization system.
Our results offer a detailed picture of the dynamics of risk spillovers between the companies in the energy sector, and then between the energy sector and other economic sectors. We notice that the entire sample of companies exhibits inflated spillovers during 2008, early 2009, and 2020. We attribute these episodes to the global turmoil caused by the global financial and pandemic crises. Moreover, our approach allows us to determine which companies are the main risk drivers in the energy sector, both in times of market distress and normal conditions. Our last batch of results highlights the fact that certain economic sectors such as banks, capital goods, consumer services, and diversified financials induce substantial spillovers to the energy sector.
The remainder of this paper is organized in the following manner. The following section includes a condensed presentation of the related literature.
Section 3 discusses our methodological approach.
Section 4 is dedicated to our results, discussion, and robustness testing, while
Section 5 concludes.
2. Literature Review
The importance of the energy sector is well acknowledged by reference works. Current interest topics relate, for example, to energy security [
20,
21,
22,
23,
24,
25]. The pressing issue of finite resources and climate change has also generated a prominent body of literature. Many studies deal with sustainable or renewable energy from a multidisciplinary point of view [
24,
26,
27,
28,
29,
30,
31,
32]. Another relevant strand of literature addresses energy policy matters [
31,
32,
33,
34,
35], incorporating aspects related to innovation and development in the energy sector [
36,
37,
38,
39,
40].
The energy sector has, generally speaking, a great macroeconomic relevance. This wave of interest has propelled energy stocks and commodities into the center of a consistent research body, dealing with their implications for financial markets. Many authors address the riskiness of energy stocks for portfolio formation [
41,
42,
43]. For example, [
44] examine the risk hedging and portfolio diversification implications of clean energy equity. The hedging capacity of energy equities is also studied by [
45] in a multivariate copula framework.
In recent years, spillover analyses have revealed that some economic sectors have, to say the least, the potential of inflicting systemic risk. A notable presence among them is that of the energy sector, either in the form of stocks or energy prices. Closer to our research path, some works delve deeper into the riskiness of energy stocks and analyze their spillover effects and tail dependence with other sectors. The fact that energy plays a risk driver role in financial markets is confirmed by [
46], or [
47]. In a very interesting contribution, [
48] find that the energy sector has the highest value-at-risk (VaR) and worst risk–return profile of the analyzed sectors. At the same time, [
49] study the risk spillover between Bitcoin, energy, and technology companies, and conclude that energy is a risk transmitting sector. The authors of [
50] estimate Diebold–Yilmaz spillovers in commodity markets and find that energy and precious metals are the main risk contributors. A similar methodology, based on the Diebold–Yilmaz index and conditional correlations, is employed more recently by [
46]. They provide evidence that energy prices drive a consistent amount of risk to renewables and coal. In a related work, [
47] relies on implied volatility indices to investigate whether energy prices and the US stock markets are cointegrated. His results show that the uncertainty indices of energy and stocks are strongly cointegrated, and that the causality relation runs from the latter to the former. The authors of [
51] analyze the correlation and co-movement of financial and energy markets. Their approach, using market indices, provides evidence that energy and financials have similar patterns of dynamics, particularly in the long run. Moreover, [
4] focus on the information connectedness of new energy companies in a network framework and find an intense risk and price transmission between their stocks.
The literature dealing with the systemic relevance of non-traditional industry sectors has been growing lately. Insights into the systemic importance of the energy sector have also been provided by [
6,
16,
52]. In [
16,
52], the authors use different expected shortfall methodologies to assess sectoral risk. Based on their results, financials, energy, and some industry sectors are main risk contributors to the financial system. Conclusions are similar, albeit the fact that the latter study has a broader, and hence more representative sample for statistical inference.
These findings fed the interest of recent works, and provided us the incentive to give a better insight into the importance of the energy sector for financial markets. Consequently, we study systemic risk dynamics both within the sector and in relation to other industry sectors. We further aim at investigating systemic risk spillover patterns for European energy companies and at determining the spillover network of the energy sector with other industry sectors. To do so, we first rely on CoVaR, Delta CoVaR, and marginal expected shortfall to estimate systemic risk. These market-based indices are well established in the financial literature, and have been used heavily for systemic risk assessment—we mention here the seminal works of [
53,
54]. These measures have been considered before also by [
8,
17,
55]. Using three baseline systemic risk indices provides us with more consistent results. A Diebold–Yilmaz spillover index is then calculated based on the three systemic risk indices corresponding to each company included in our sample. Recent attempts at examining volatility spillovers between energy and stock prices using the Diebold–Yilmaz index were made by [
44] or [
56]. Secondly, we extract a Bayesian entropy for each company and imbed them into a similar Diebold–Yilmaz framework. In recent years, entropy methods have become more popular with financial market uncertainty and contagion studies [
57,
58]. We investigate the entropy spillover between industries, and analyze the place that the energy sector occupies in the hierarchy of risk transmitters and receivers. Few, if any works to date rely on entropy methods to investigate systemic risk spillovers between energy and other economic sectors. An approach in this direction was made by [
16].
3. Methodology
Our approach is built on the daily returns of the companies included in the Stoxx 600 index, labeled as pertaining to the energy industry group. The data are collected from Bloomberg, and we use the GICS 24 system to isolate the energy companies. Our sample stretches over the 1 January 2007–31 July 2020 interval. This choice is motivated by the fact that for this timeframe, we obtain the largest length for the time series associated with our company selection. The companies included in this study are provided in
Appendix A. The size of our sample is similar to recent investigations, such as [
4,
6,
52]. Descriptive statistics on our sample are presented in
Appendix B. Our modeling approach can be divided into five main steps that we further detail in this section in order to show the manner in which we obtain all the types of results reported.
The first step in our method relies on the computation of three systemic risk measures, namely, CoVaR, Delta CoVaR, and MES, for the case of the energy companies. Both the CoVaR and Delta CoVaR measures have been introduced by [
53] and start from stipulating the value-at-risk for a specific company
and a certain quantile q.
In the equation,
depicts the return loss of a given institution i. Given this setup, the
will return a positive number if q exceeds 50.
represents the VaR of a given institution j conditional on a discrete event
specific to institution i. Thus,
will be enforced by the q% quantile of the conditional probability distribution as shown below:
A very tractable solution put forward by [
53] comes from the possibility of isolating j’s fraction of systemic risk. This can be formalized as follows:
In addition to the two measures mentioned above, we consider also the contribution of [
54] that deals with the systemic expected shortfall (SES) concept, a measure capable of cloistering the systemic risk contribution of a specific company. In [
54], the authors build SES on the basis of two measures, MES (marginal expected shortfall) and LVG (leverage). The former is incorporated in our approach, and by definition captures the average return for the case of the most adverse days for the market return. This can be shown formally in the following equation:
As second step, we implement a Diebold–Yilmaz [
18] spillover index computation sequence. The model isolates spillover effects using a general vector autoregression (VAR) framework that incorporates a Cholesky factor orthogonalization for the removal of latent order-dependent results. The procedure starts from an N-variable VAR(p) process:
where ε~(0,Σ) stands for a vector of i.i.d disturbances.
The following equation details the moving average given the above process.
In addition to this, the
coefficient matrices are set apart by:
A central element of the Diebold–Yilmaz [
18] framework is the formulation of the H-step-ahead forecast error variance decomposition:
For
H = 1,2,…, where Σ depicts the variance matrix corresponding to the error vector ε,
and the elements of the variance decomposition matrix are normalized via the row sum in the following manner:
The construction proposed by Diebold and Yilmaz [
18] postulates that the following two relations must also hold:
Considering the specifications on variance decomposition, the authors then introduce the total volatility spillover index as:
Diebold and Yilmaz [
18] consider also a specification for direction volatility spillovers. In order to explain this, we consider the spillovers received by market
i from market
j as follows:
In a congruous manner, the direction volatility spillovers coming from market
i to other markets
j is delivered by:
On the basis of the two equations presented above, we can determine the net volatility spillover coming from market
i to all other markets
j by a simple subtraction:
The third step in our methodology is to use a rolling window of 120 observations (equivalent to about 6 calendar months) which moves by one day at a time, resulting in 3314 samples for the 120-day rolling window. We perform this to obtain to, from, and net results for the spillover index for each of the three systemic risk measures presented (CoVaR, Delta CoVaR, and MES), for each of the energy companies included in the Stoxx 600 index. This leads to our first set of results, as we will show in the subsequent section. The fourth step generates our second batch of results, which will be presented in a graphical manner as heat maps. They are constructed in order to reflect the dynamics of contagion received and contagion given from/to the system. The analysis is carried out on the entire sample, as we do not employ the rolling window approach in this case. From these computations, we also determine an intra-sector contagion index. This is given by the sum of all the elements from the heat map table. The fifth step of our method paves the way to our last battery of results. On the basis of the companies from the energy sector and those from other sectors of the STOXX 600 index, we employ a Bayesian procedure to determine the entropies for the energy sector. Our approach is based on the framework introduced by [
18] and is similar to the one used in [
16].
Both the above-mentioned contributions start from a Bayesian least squares estimators structure such as:
In the above equation,
p(
π|
x) is the posterior, given the prior
p(
π), and
p(
X|
π) represents the discrete likelihood. Given these aspects:
Archer, Park, and Pillow [
19] employ a Dirichlet distribution of the following form:
where a signifies a concentration parameter.
The authors argue the need to correct undesirable technical effects deriving from narrow posterior intervals. This is achieved by implementing the prior previsions of Nemenman et al. [
59].
Here,
stands for the
prior on π. The set of weights
derive from the following specification:
where
corresponds to the expected value of H for a
prior. The Bayesianleast squares is thus formulated as:
where
stands for the posterior mean for the
prior.
The next construction block is the formation of the infinite discrete distributions. In the spirit of [
19], we incorporate Dirichlet and Pitman–Yor processes. As the priors matter is answered by this point, we can infer given observations. Considering these arguments, we opt for a Pitman–Yor-adjusted Bayesian least squares estimator that has the following form:
We note the fact that
corresponds to the expected posterior entropy given a certain
. Lastly, the evidence is given by:
On the newly found sector entropies, we conduct again the Diebold–Yilmaz [
18] procedure in the rolling window formulation. For each sample, we build the VAR structure and estimate the values of from, to, and net spillovers from each sector to the other sectors in the samples. This way we create a dynamic track for the evolution of spillovers over time with a focus on the energy sector. This sector-oriented approach will be tested for robustness later in the paper. In order to do so, we employ alternatives for the window size, moving from 120 days to 90 days first, and then to 150. Under this setup, we employ 3344 samples for the 90-day rolling and 3284 samples for the 150-day rolling windows.
4. Results and Discussion
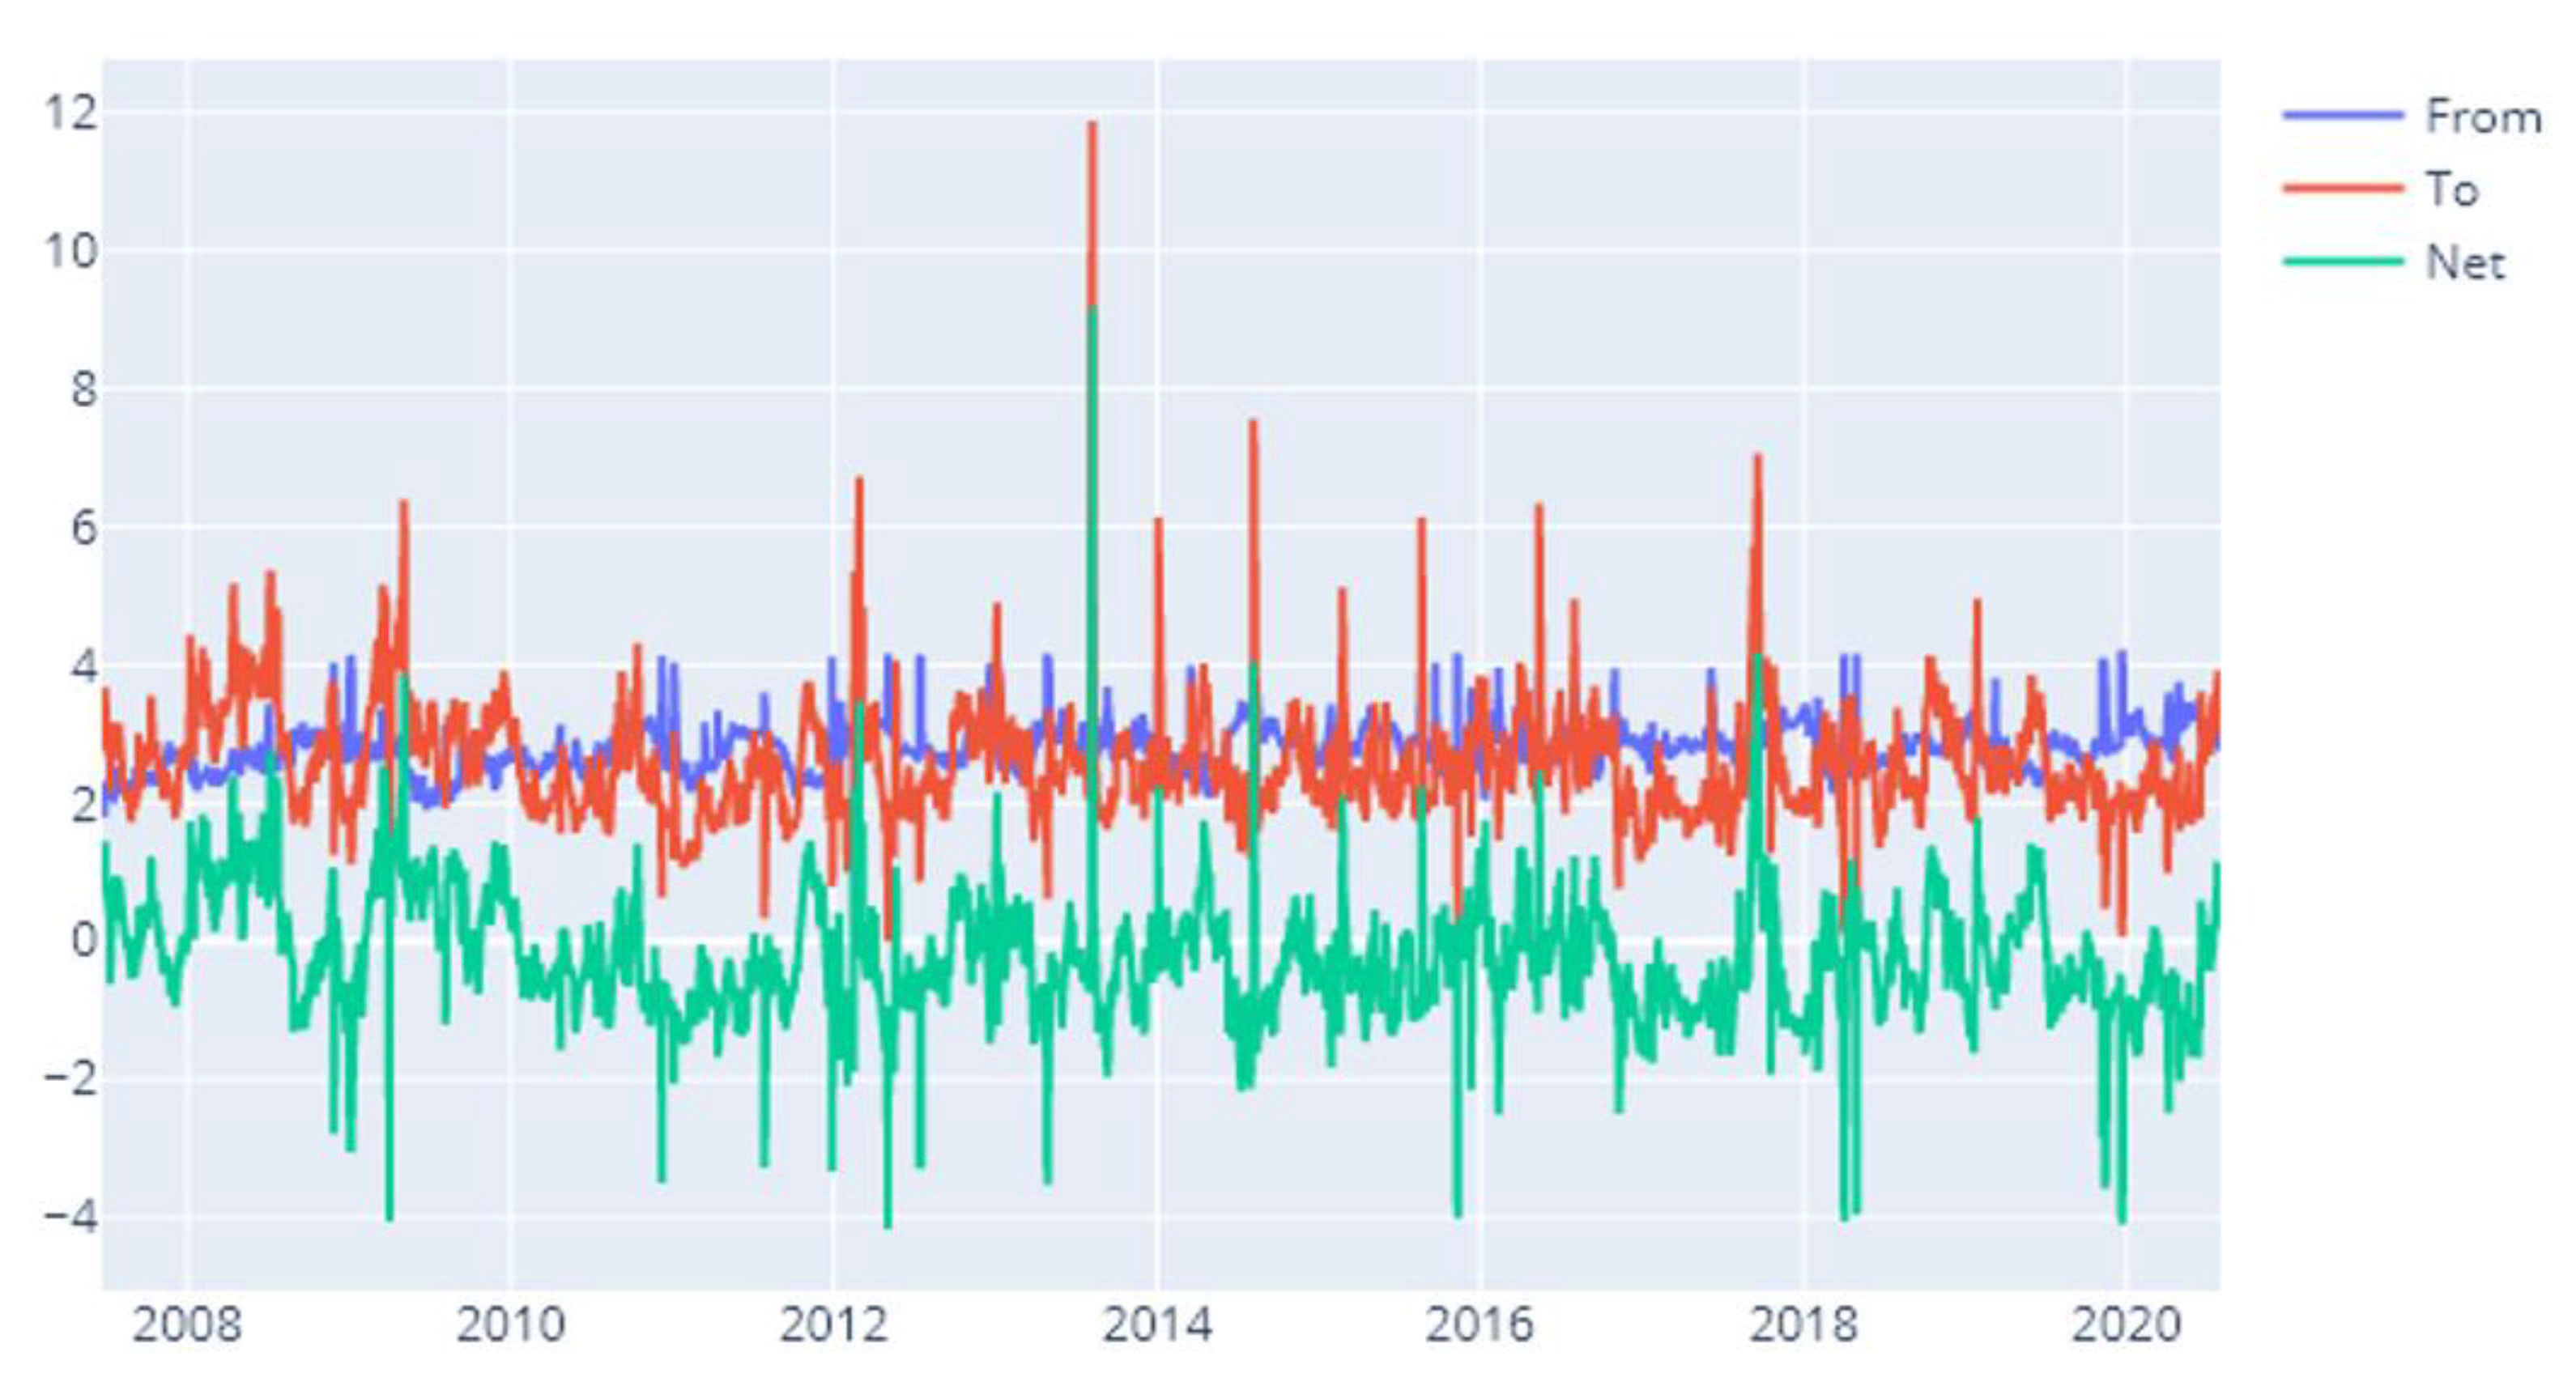
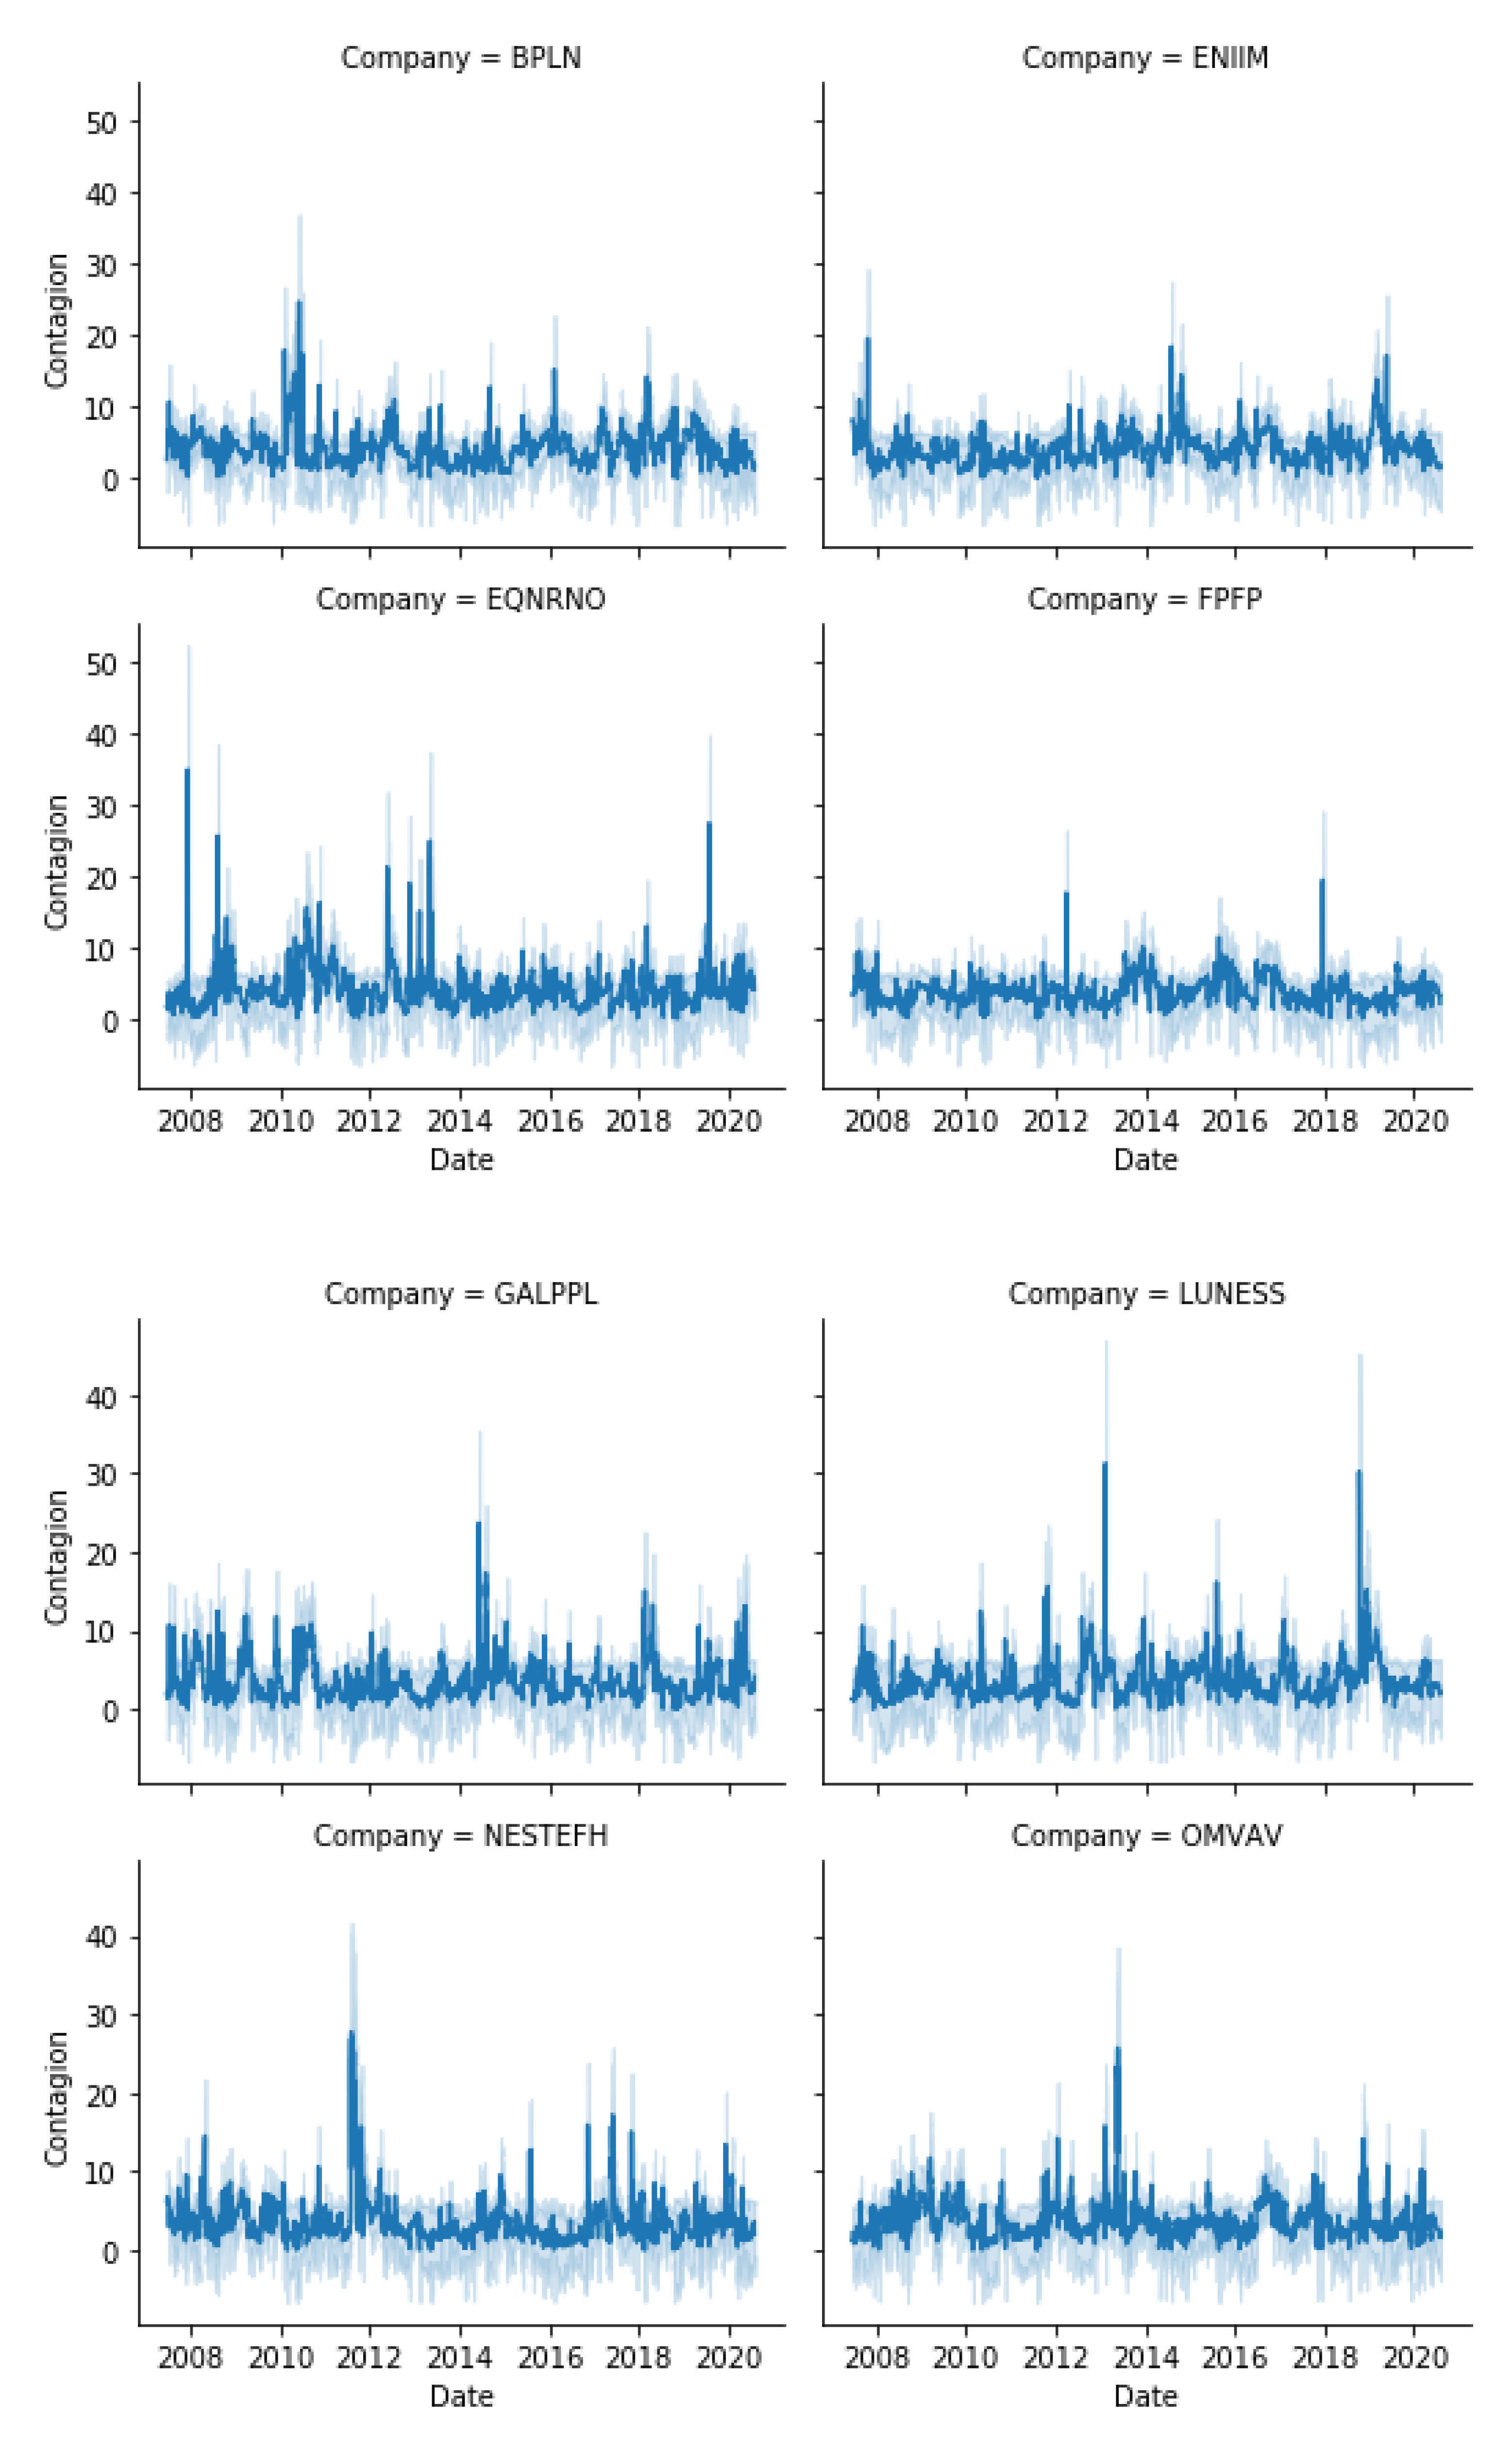
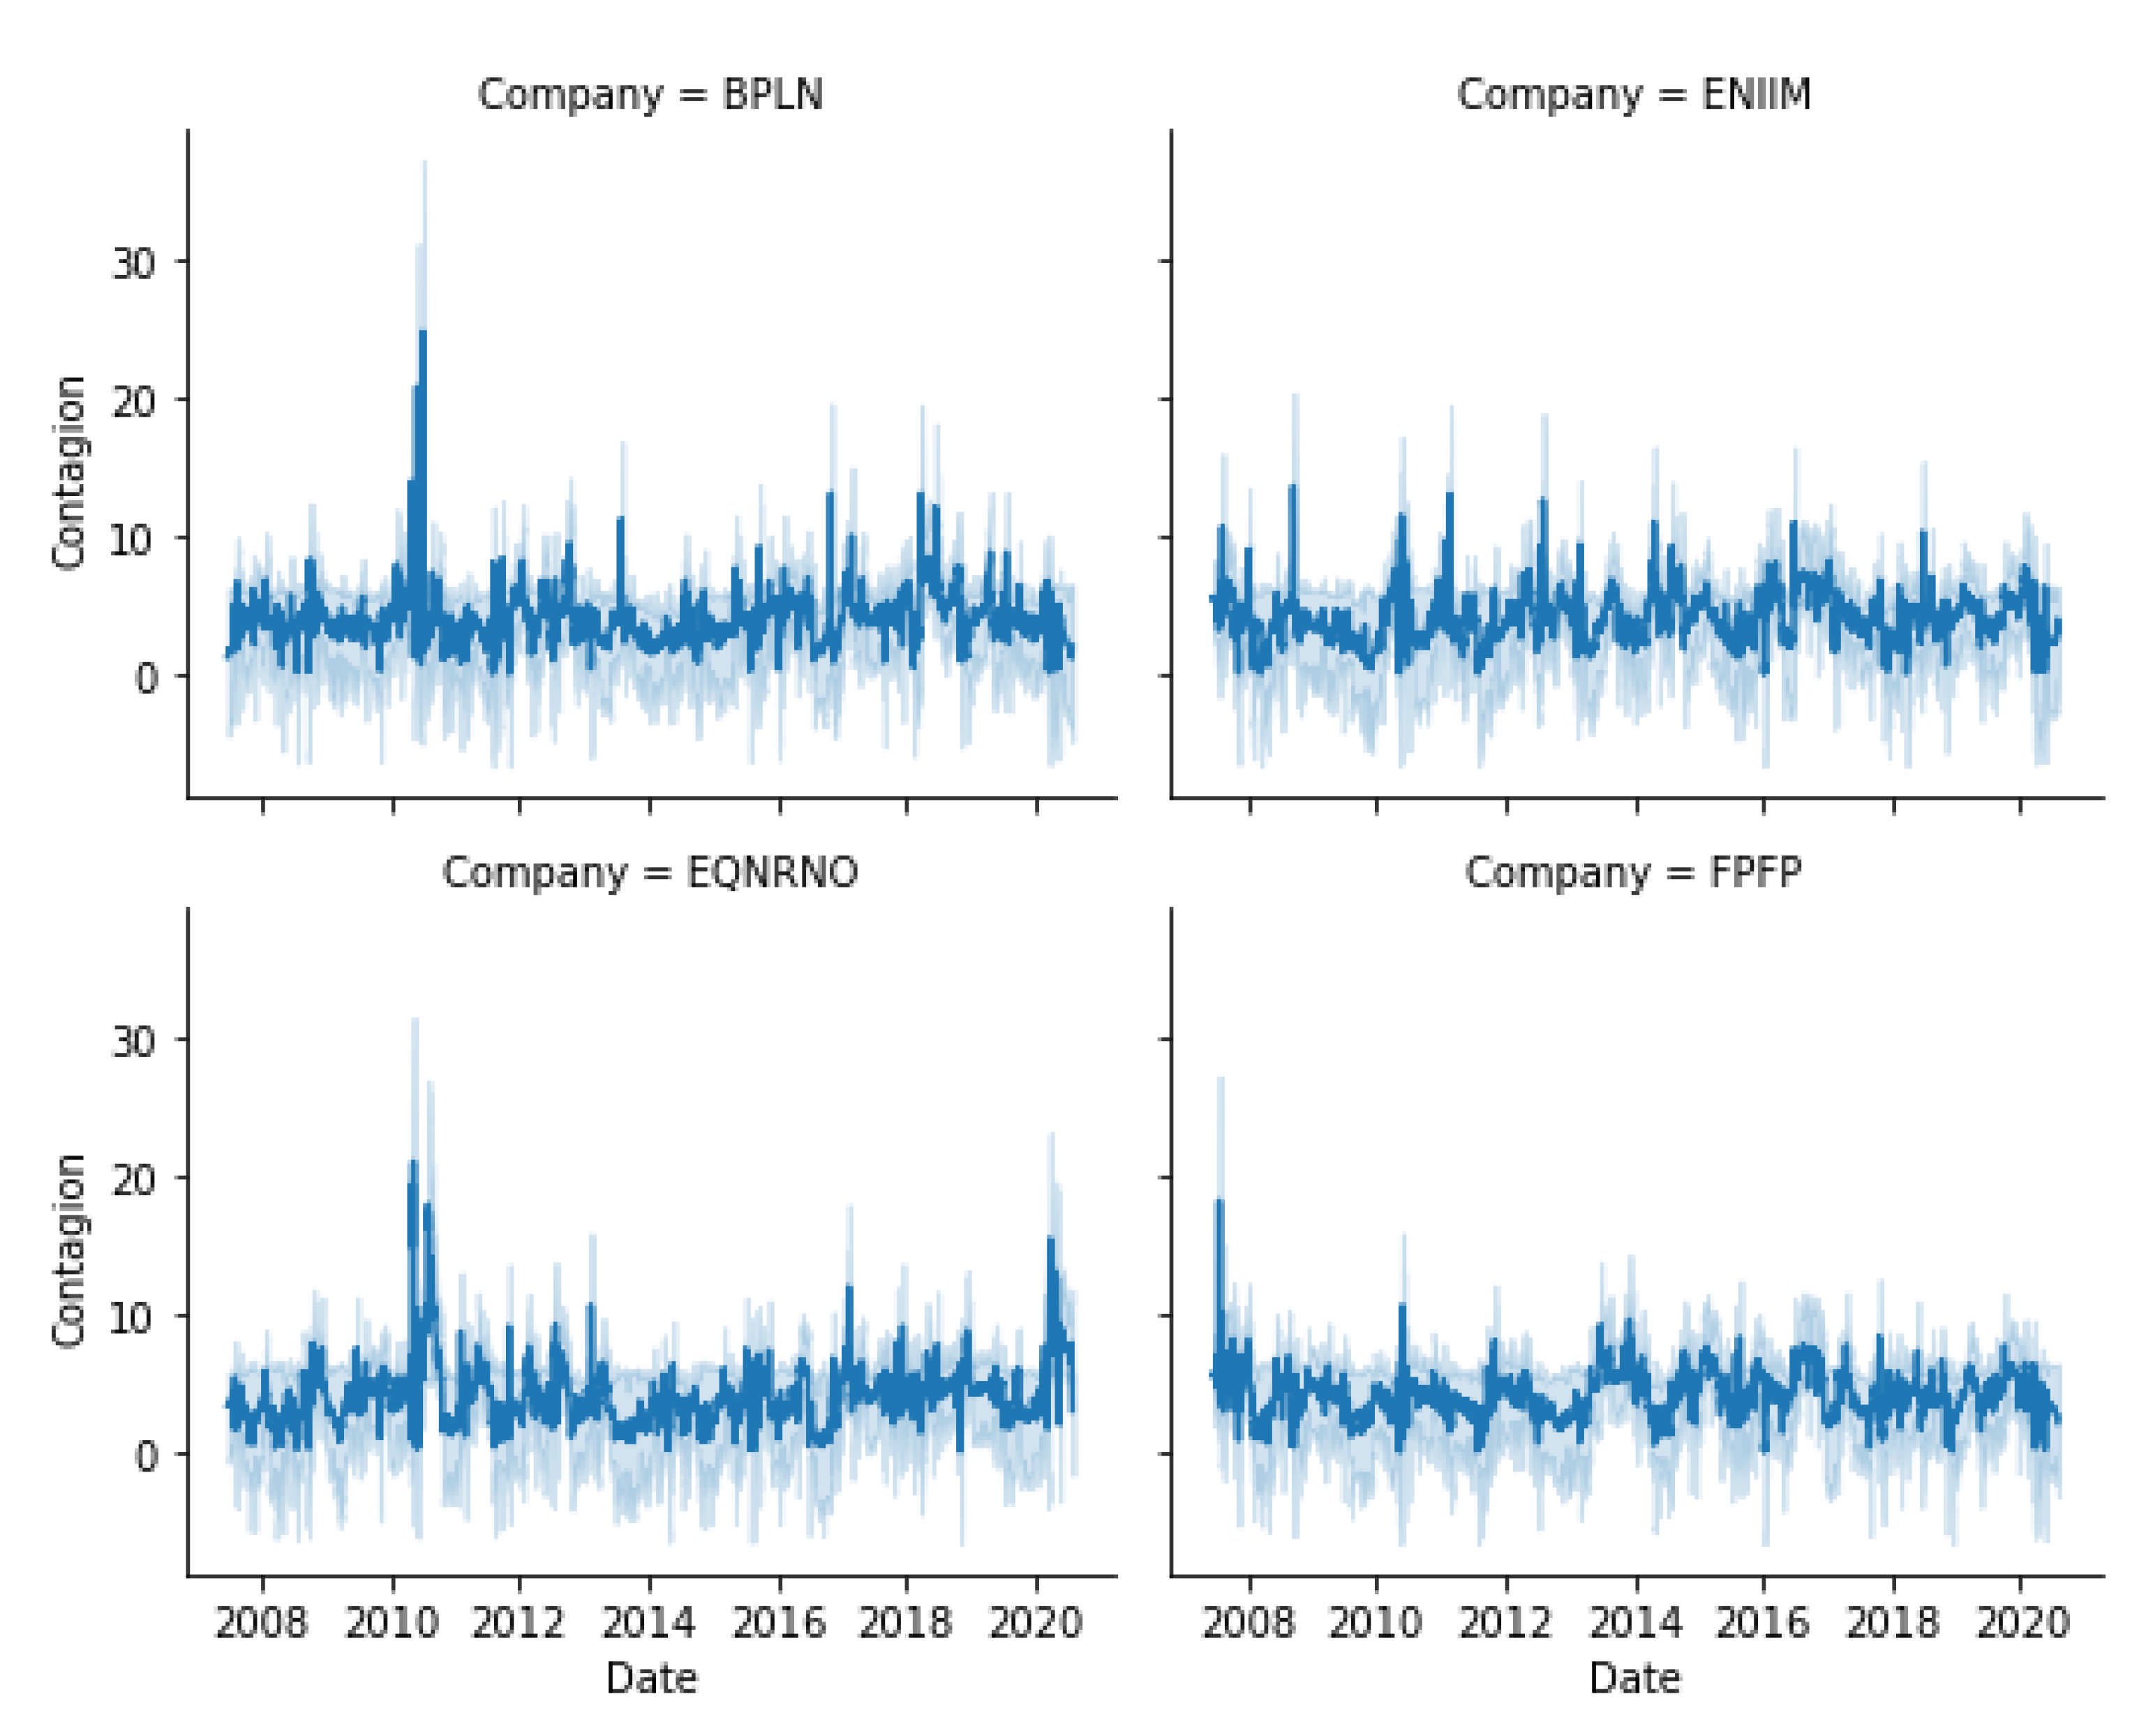
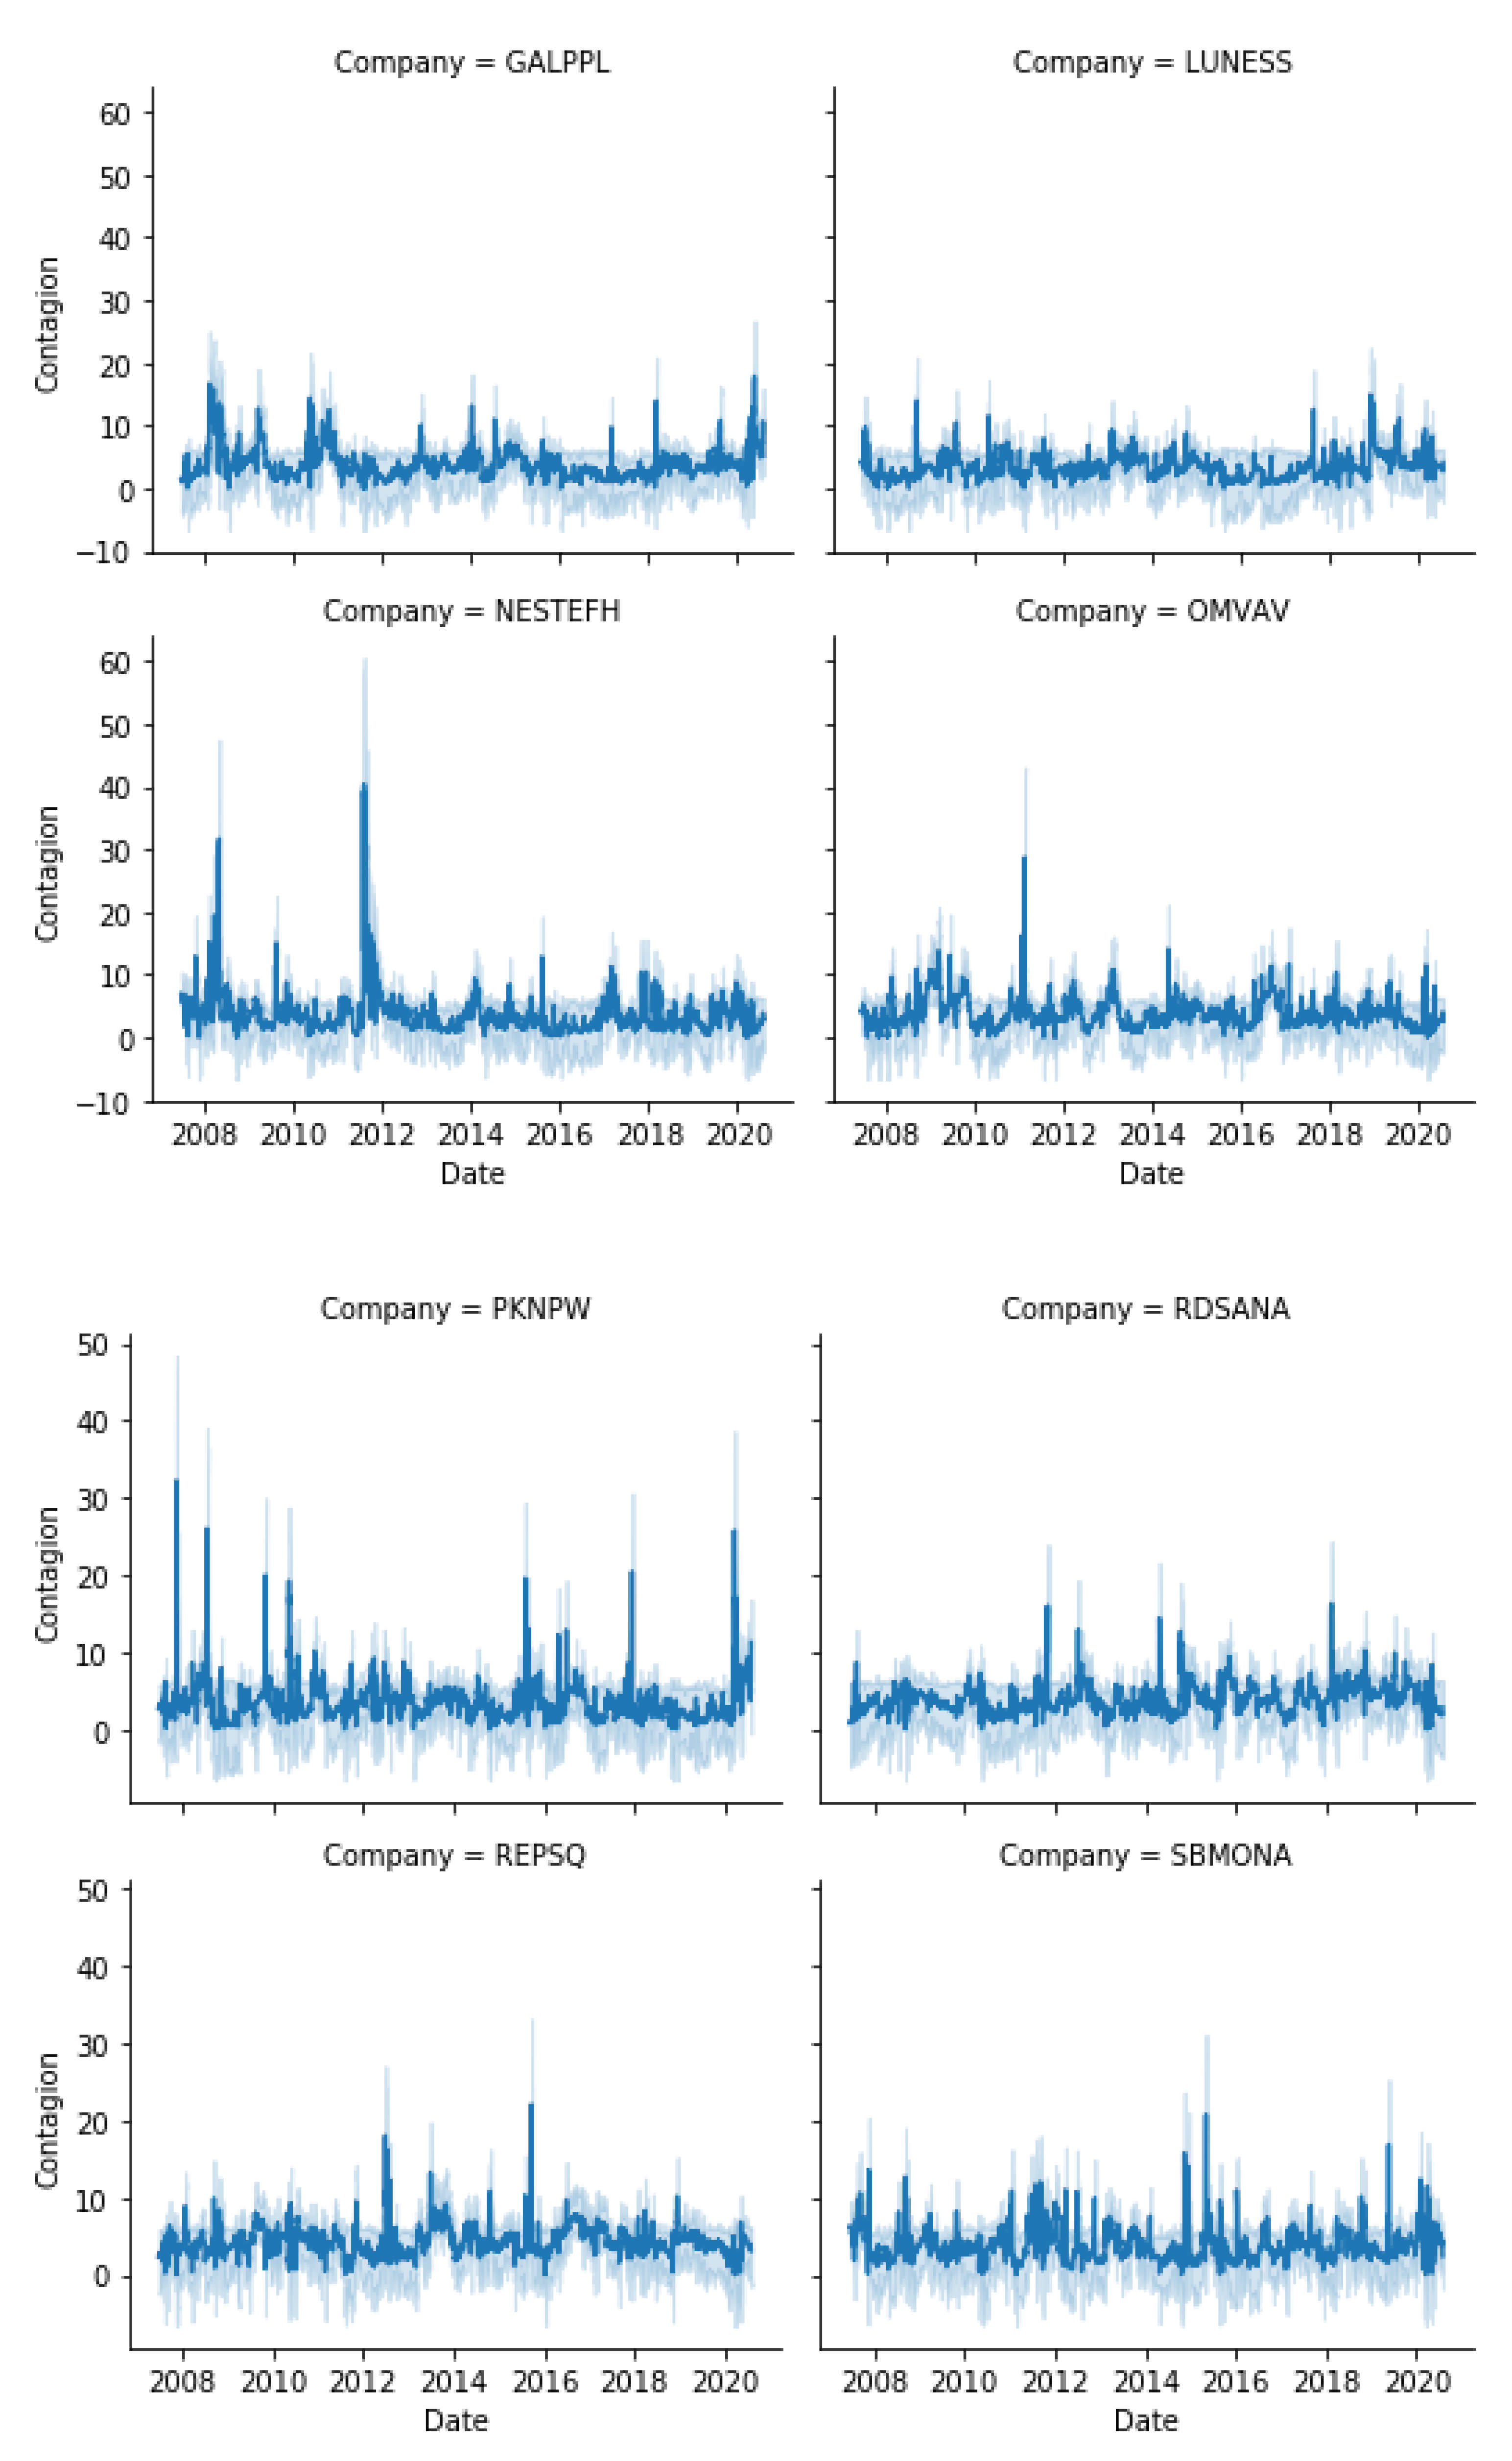
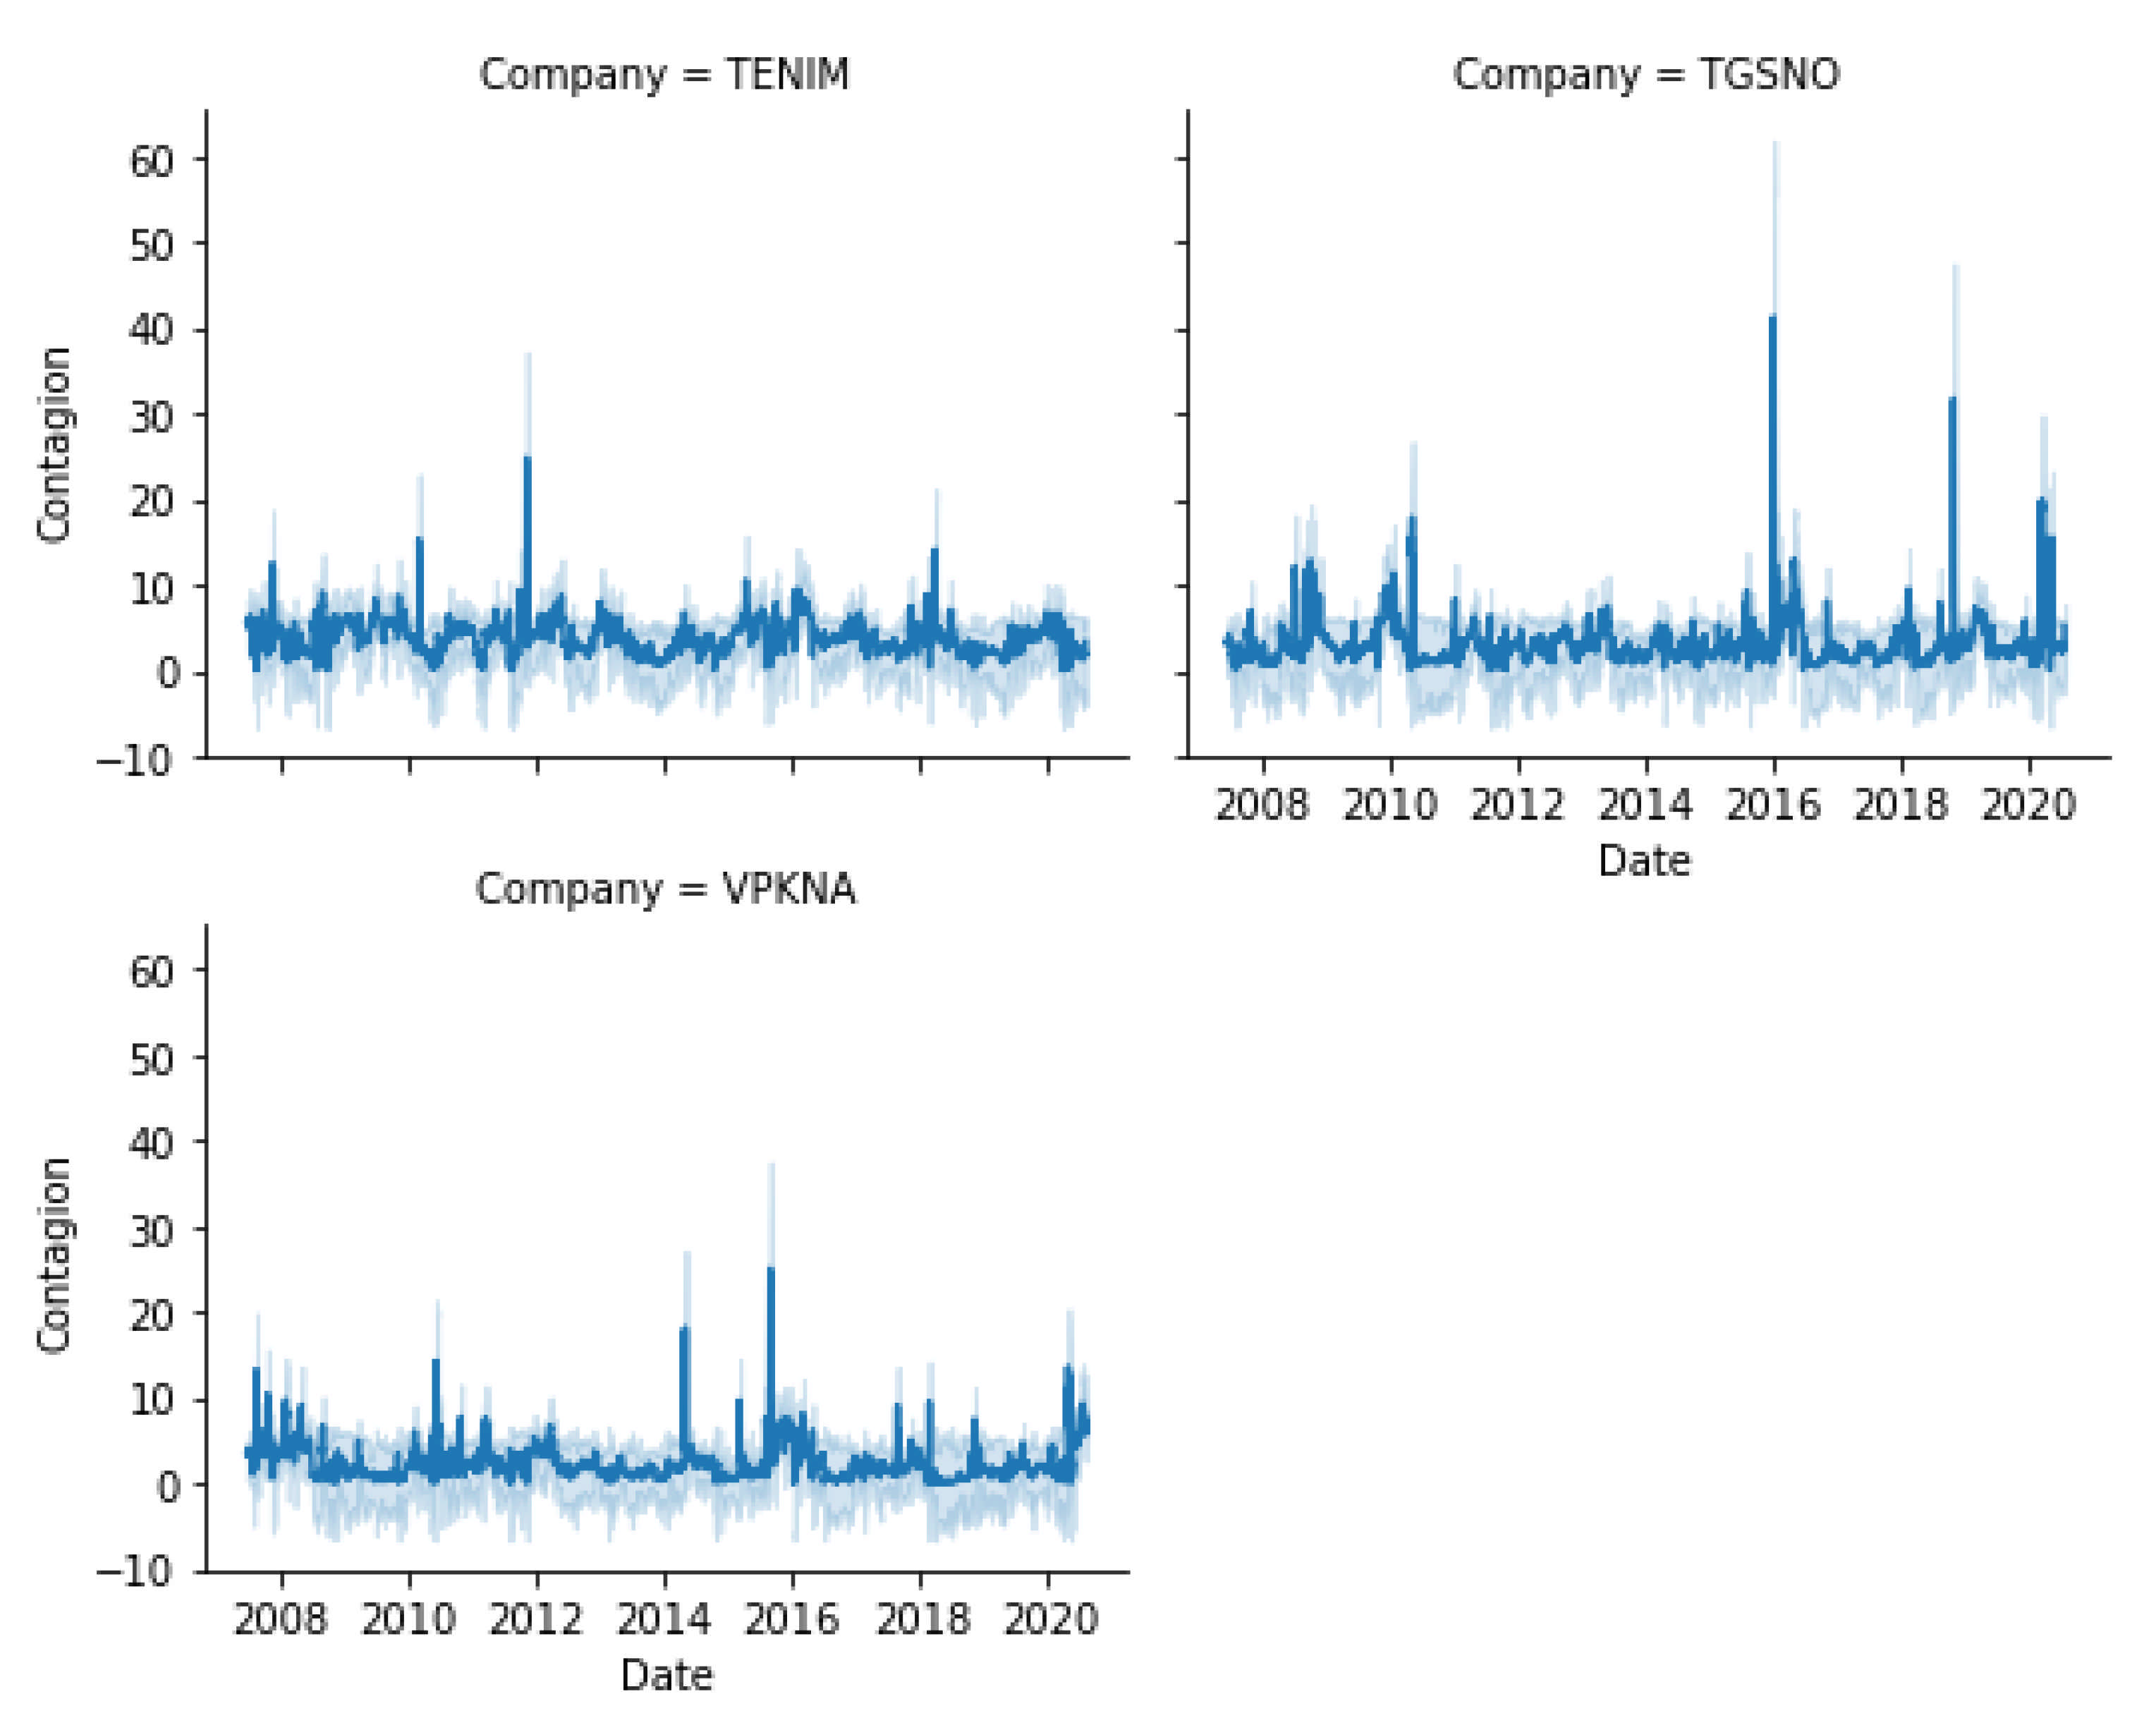
Our first batch of results document the spillovers recorded among the energy companies as captured by the CoVaR, Delta CoVaR, and MES measures. We visually present our results in the three figures of
Appendix C (namely A1 to A3). Each panel of these specific figures shows the “From”, “To”, and “Net” spillovers for the companies included in the sample and is constructed from three sets of results. For example, the first panel of
Appendix C Figure A1 depicts the “From”, “To”, and “Net” spillovers obtained via the DY procedure on the results generated by the CoVaR measure, for the BPLN company (BP plc). We start from this point, as the results obtained under this approach can offer valuable details on the dynamics of company response to systemic concerns and regulations. In addition to this, such an investigation can offer valuable input in risk management and portfolio selection. Focusing first on the CoVaR specification (see
Appendix C Figure A1), we consider the “from” analysis, which sheds light on the companies that generate spillover effects in the system. Our approach allows us to time stamp the dynamics of the spillover and an early observation resides in the identification of heightened spillovers for all the companies in the sample during 2008, early 2009, and 2020. This can be easily related to the concerns regarding the most recent financial crisis and the global pandemic. The effects of the pandemic on energy markets have been analyzed by very recent studies, see [
60,
61] inter alia. For example, [
60] study risk spillovers deriving from the pandemic on the Chinese energy sector. The authors offer an in-depth investigation, dividing the market into nine sub-sectors. In a HD-TVP-FAVAR modeling framework, [
61] find evidence in support of risk spillovers in energy markets.
Another batch of interesting and recent results are reported by [
61]. The authors aim to investigate systemic risk during the COVID-19 period in different subsectors of STOXX600 North America and STOXX600 Europe via a traffic light system for systemic stress formulation, a focus that is very similar to that of the present paper. The study reports enhanced effects for Europe for the first half of 2020.
Both including and excluding the above-mentioned time periods in which all companies exhibit enhanced spillovers, we notice that that certain companies have a more profound impact on the system. The highest influences are visible for Royal Dutch Shell PLC (Netherlands), Total SE (France), Eni SpA (Italy), and SBM Offshore NV (Netherlands). In other words, these companies contribute the most spillover effects to the system both in times of turbulence and in times of normal market dynamics. On the opposite spectrum, we detect far less effervescent effects for companies such as BP PLC (UK) or Koninklijke Vopak NV (Netherlands). Our results are, to a certain extent, very close to those reported in very recent research, see [
52] or [
6] inter alia, that explains the role played by companies such as Royal Dutch Shell PLC and Total in systemic risk patterns for European energy markets. A plausible cause of this result might be the market position of the contributors in terms of gross profit and total revenue, as compared with their peers.
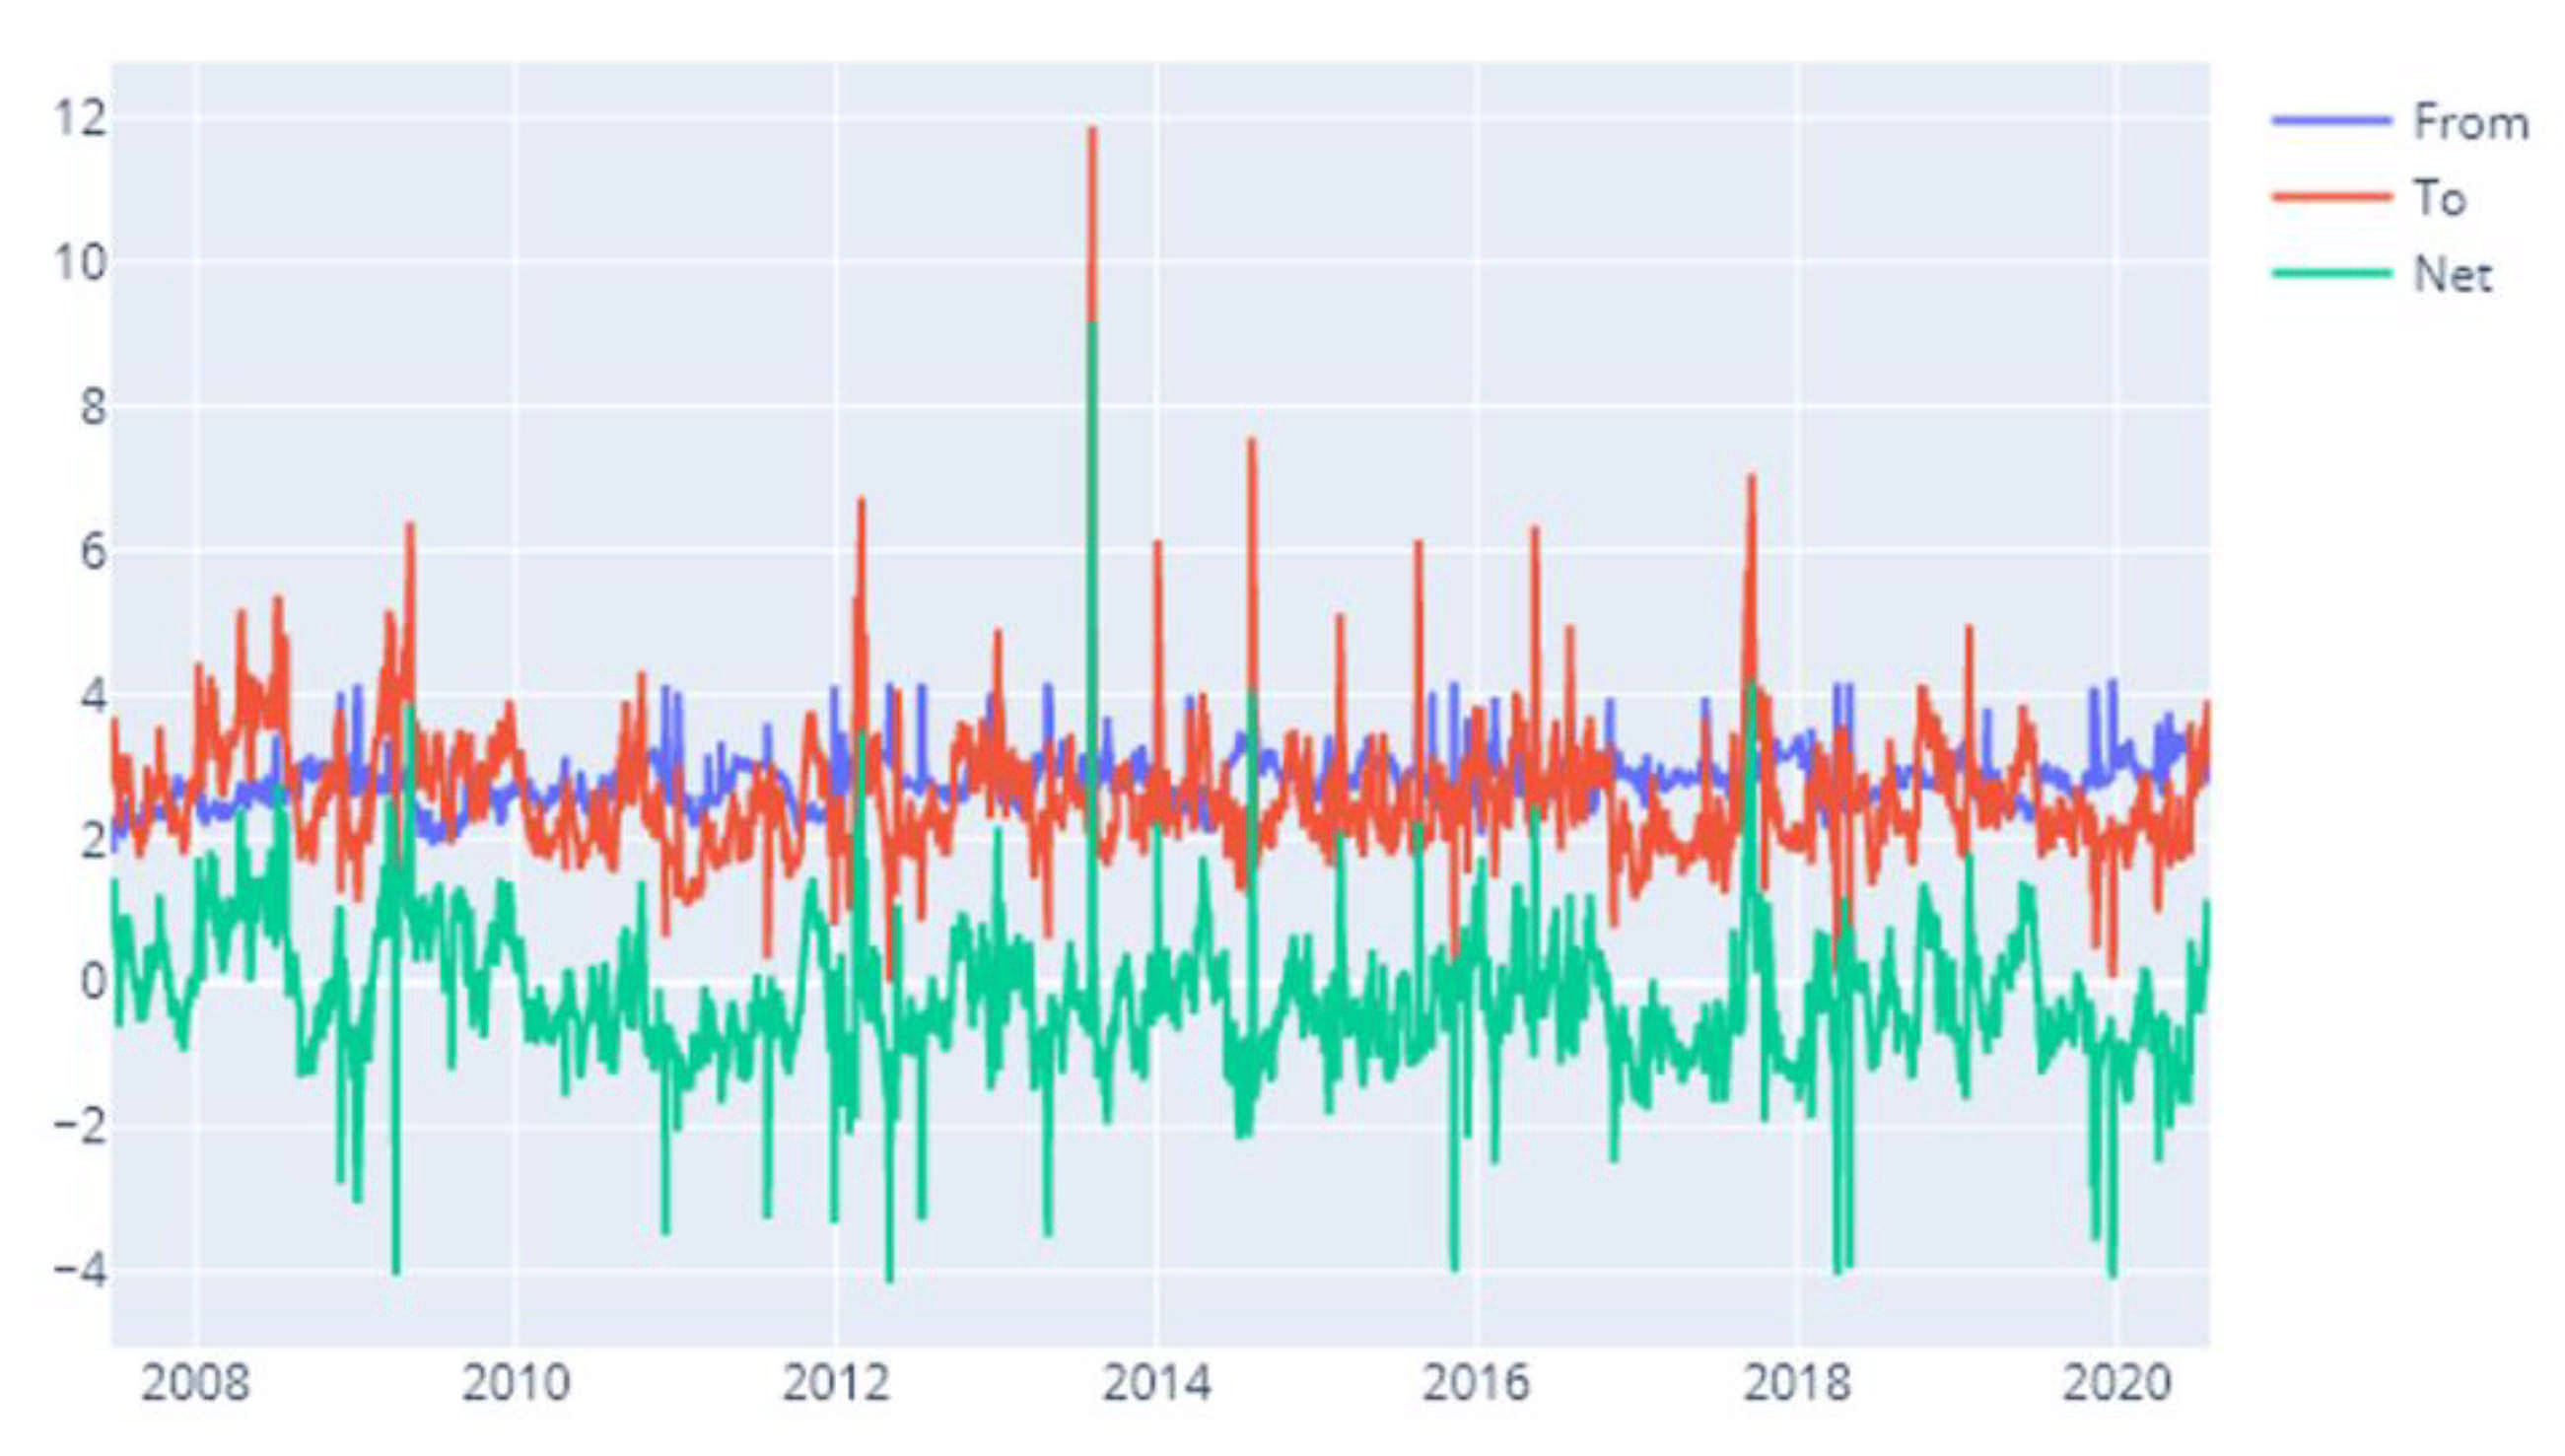
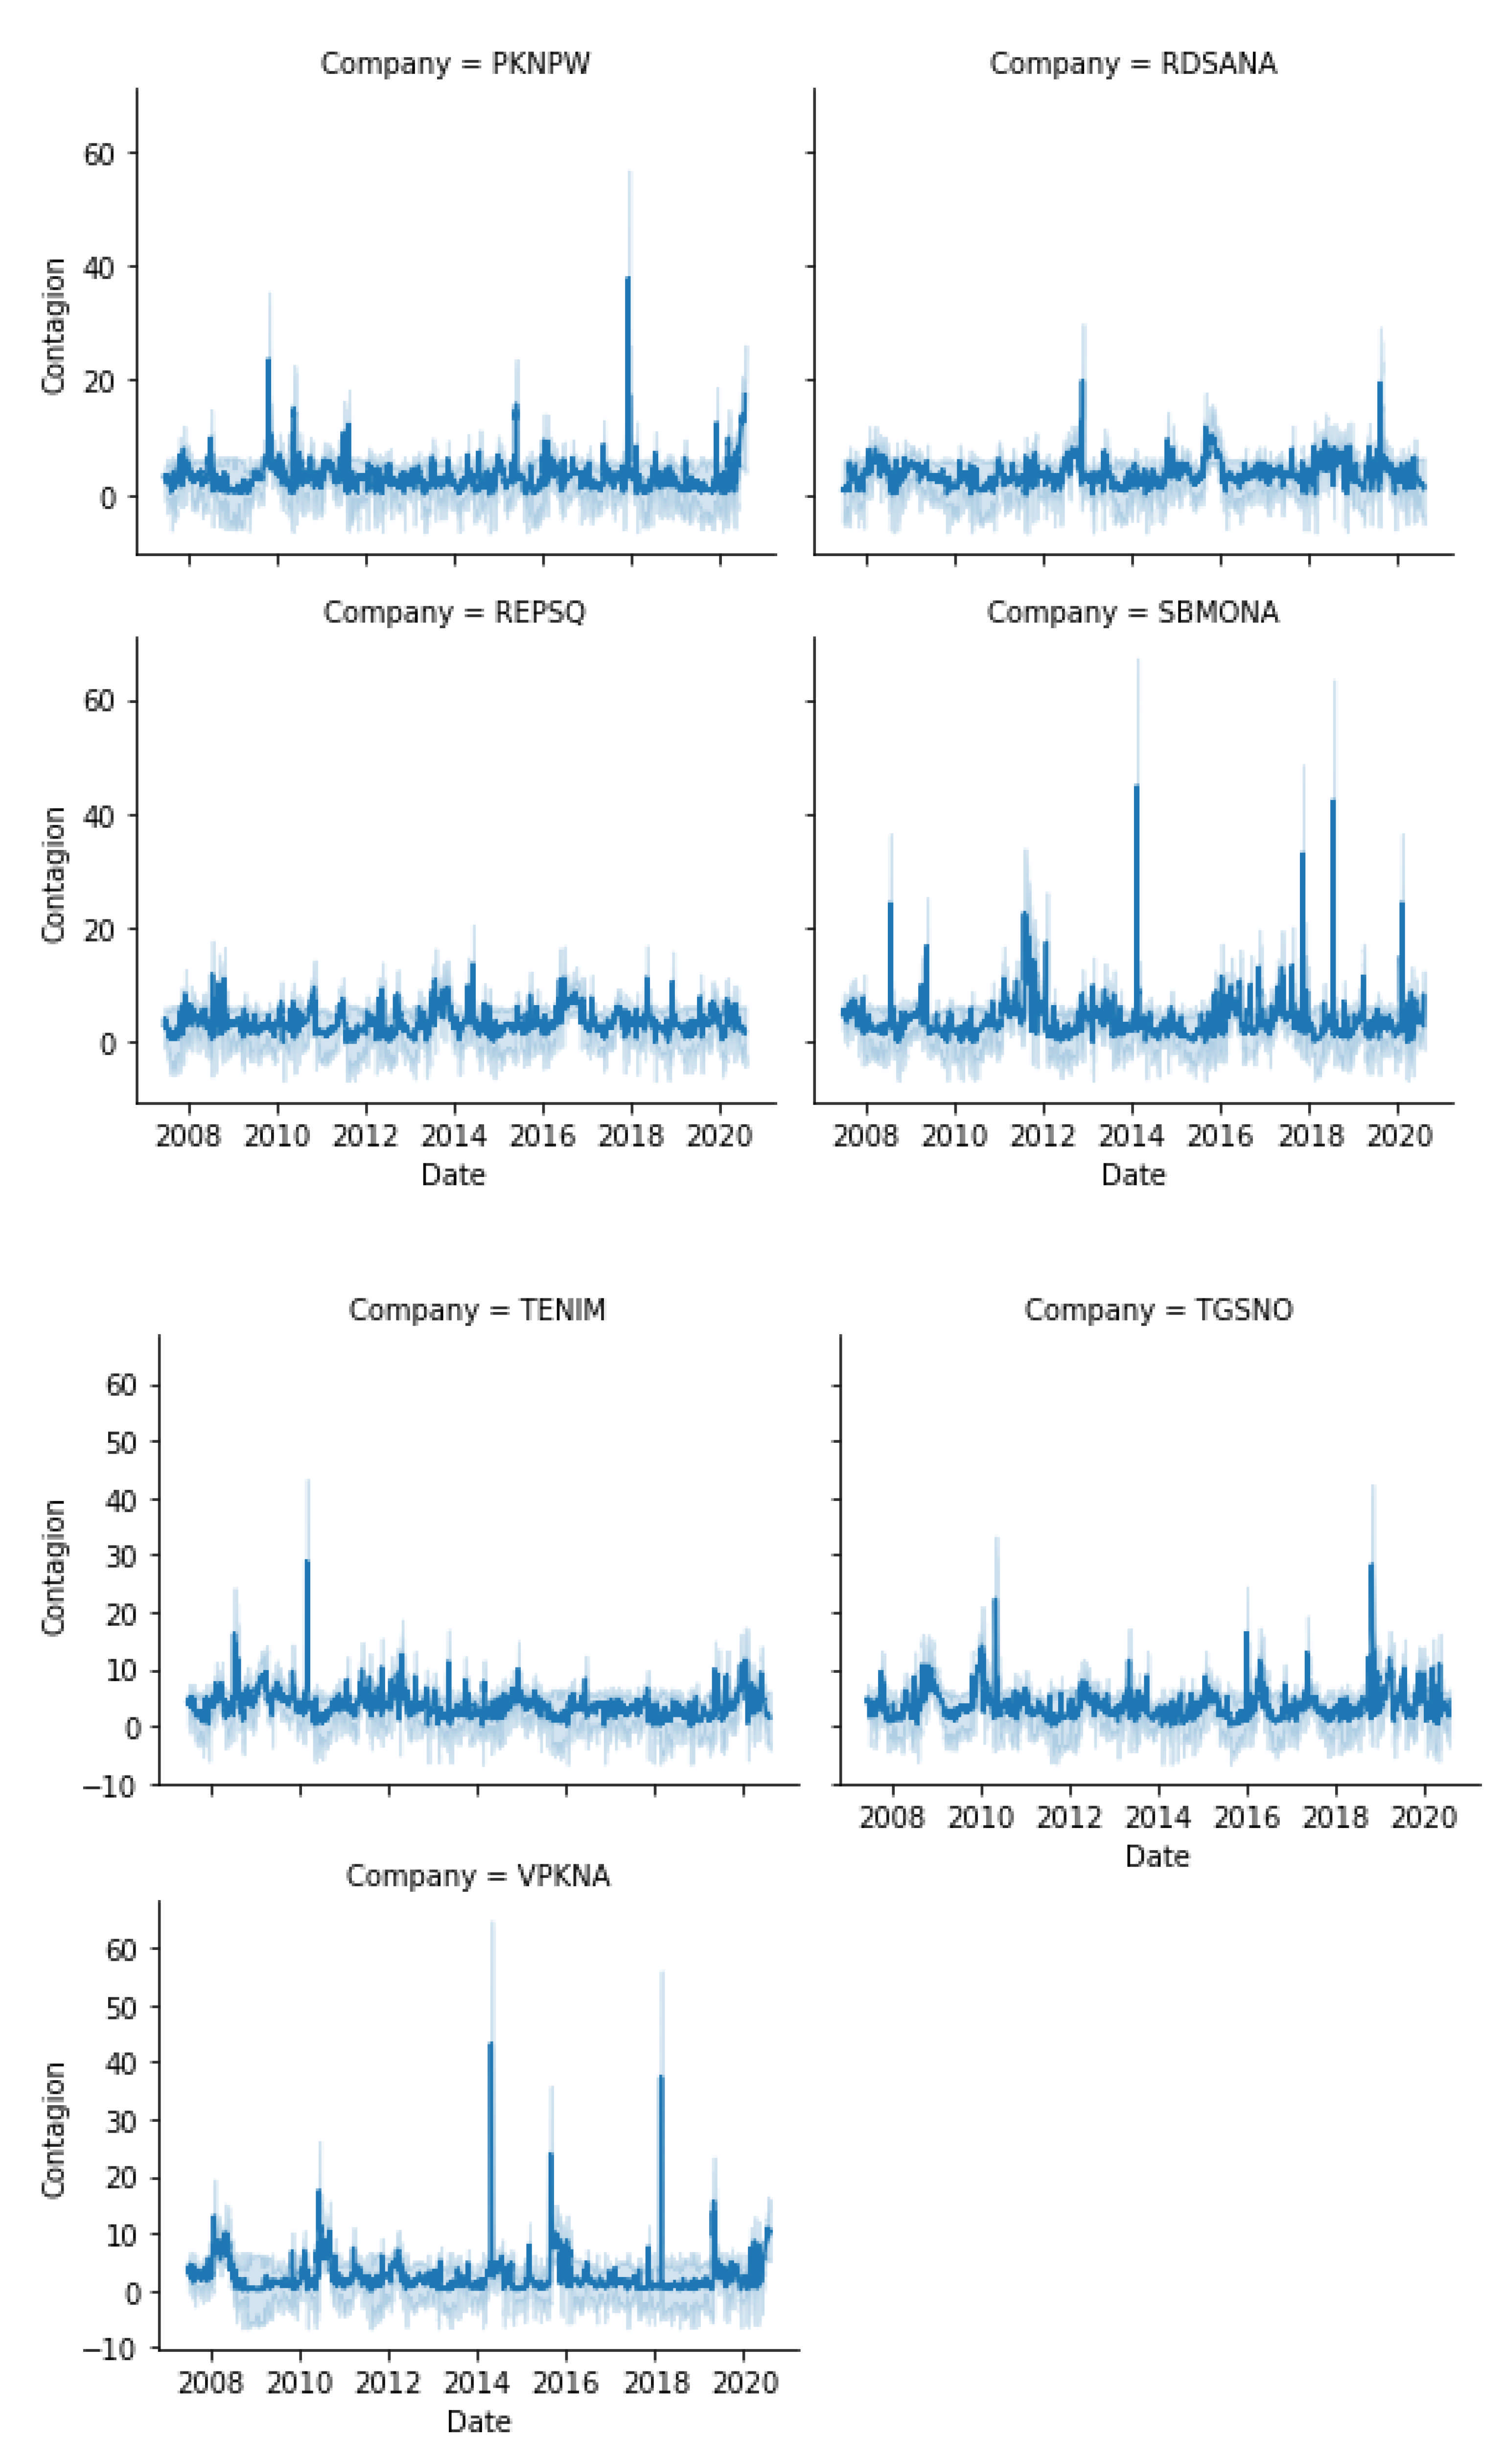
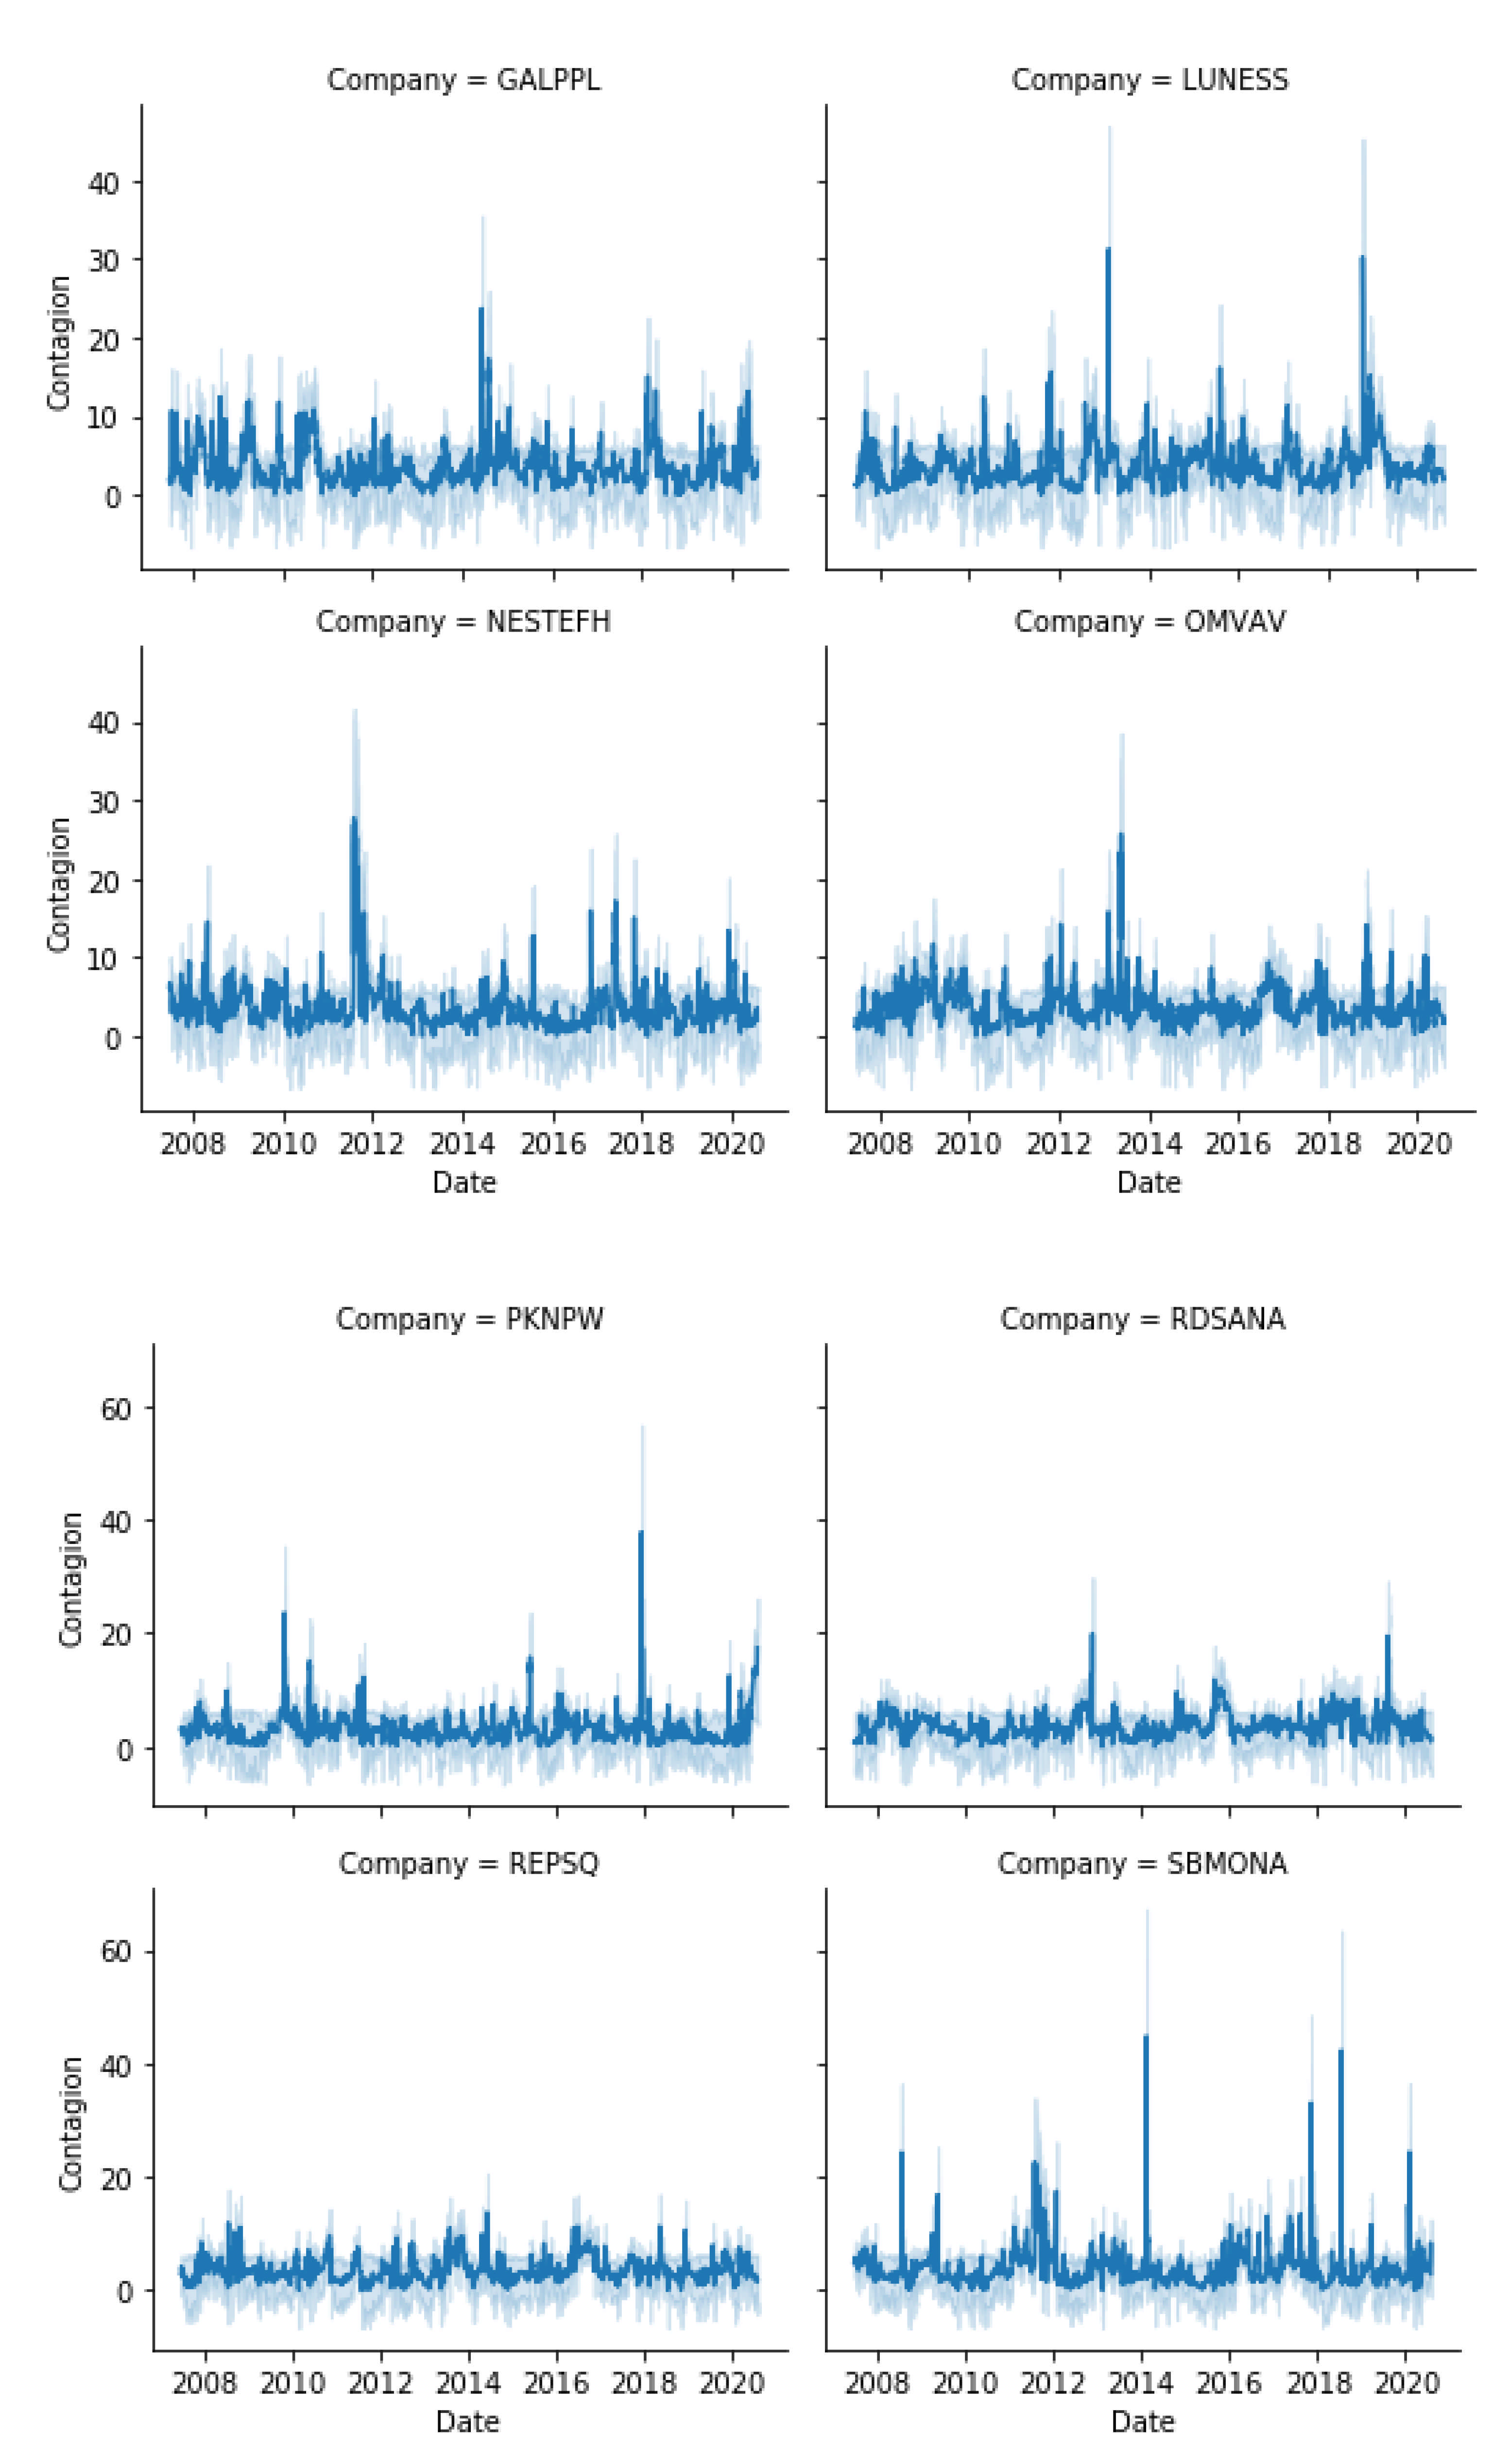
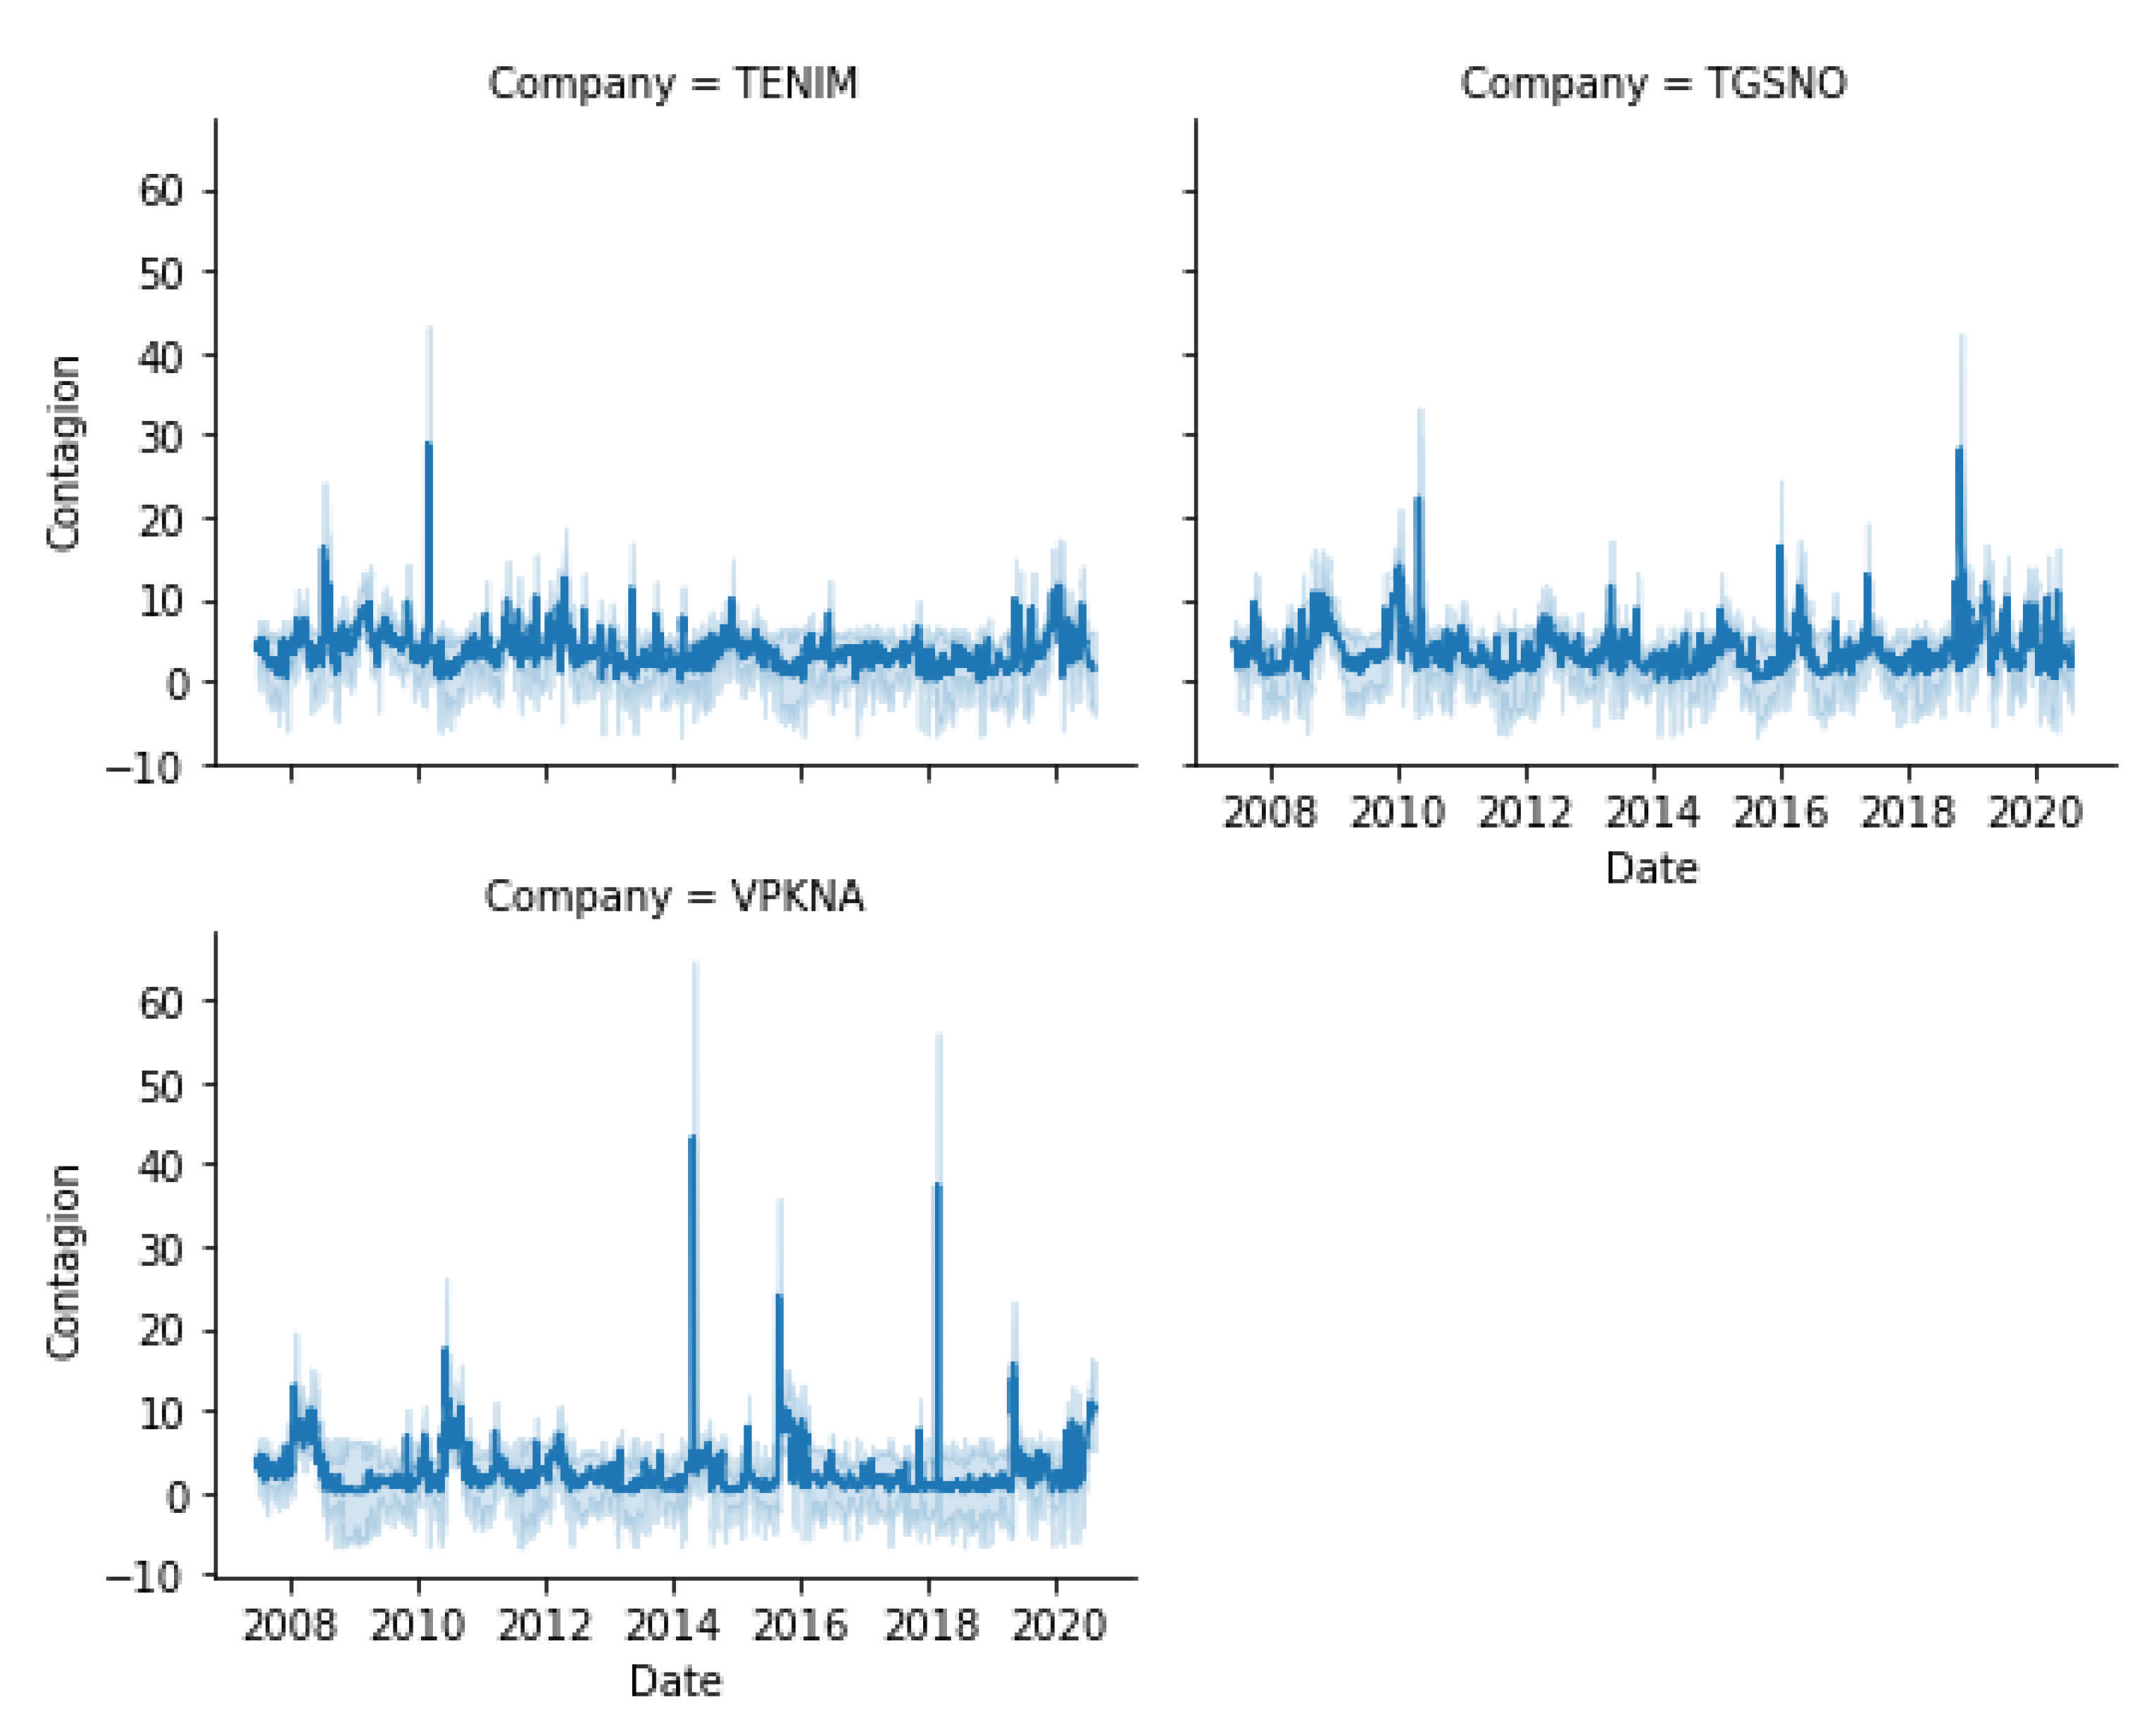
Appendix CFigure A1 also exhibits the results for the “To” analysis, which show the companies that are most prone to absorbing effects coming from the system. For this case, the results identify Galp Energia SGPS SA (Portugal), TGS NOPEC Geophysical Co ASA (Norway), and Koninklijke Vopak NV (Netherlands). We notice concentrations in 2018, but with a lesser magnitude than that observed for the “From” analysis. Several points in this trajectory can be explained by the fraction of downstream business carried out by the above-mentioned companies that makes them vulnerable to volatility in upstream sectors.
The last type of result presented in
Appendix C Figure A1 is the “Net” analysis. It shows the difference between “To” and “From” and gives the contribution of each company to the spillover effects existing in the system. It comes as no surprise to isolate in this category the main contributors found in the previous analysis, with a special participation by Total (a result also obtained by [
6]). This makes sense, given the fact that the dynamics of their extreme risks manifest the greatest effects on the system-wide extreme risk patterns.
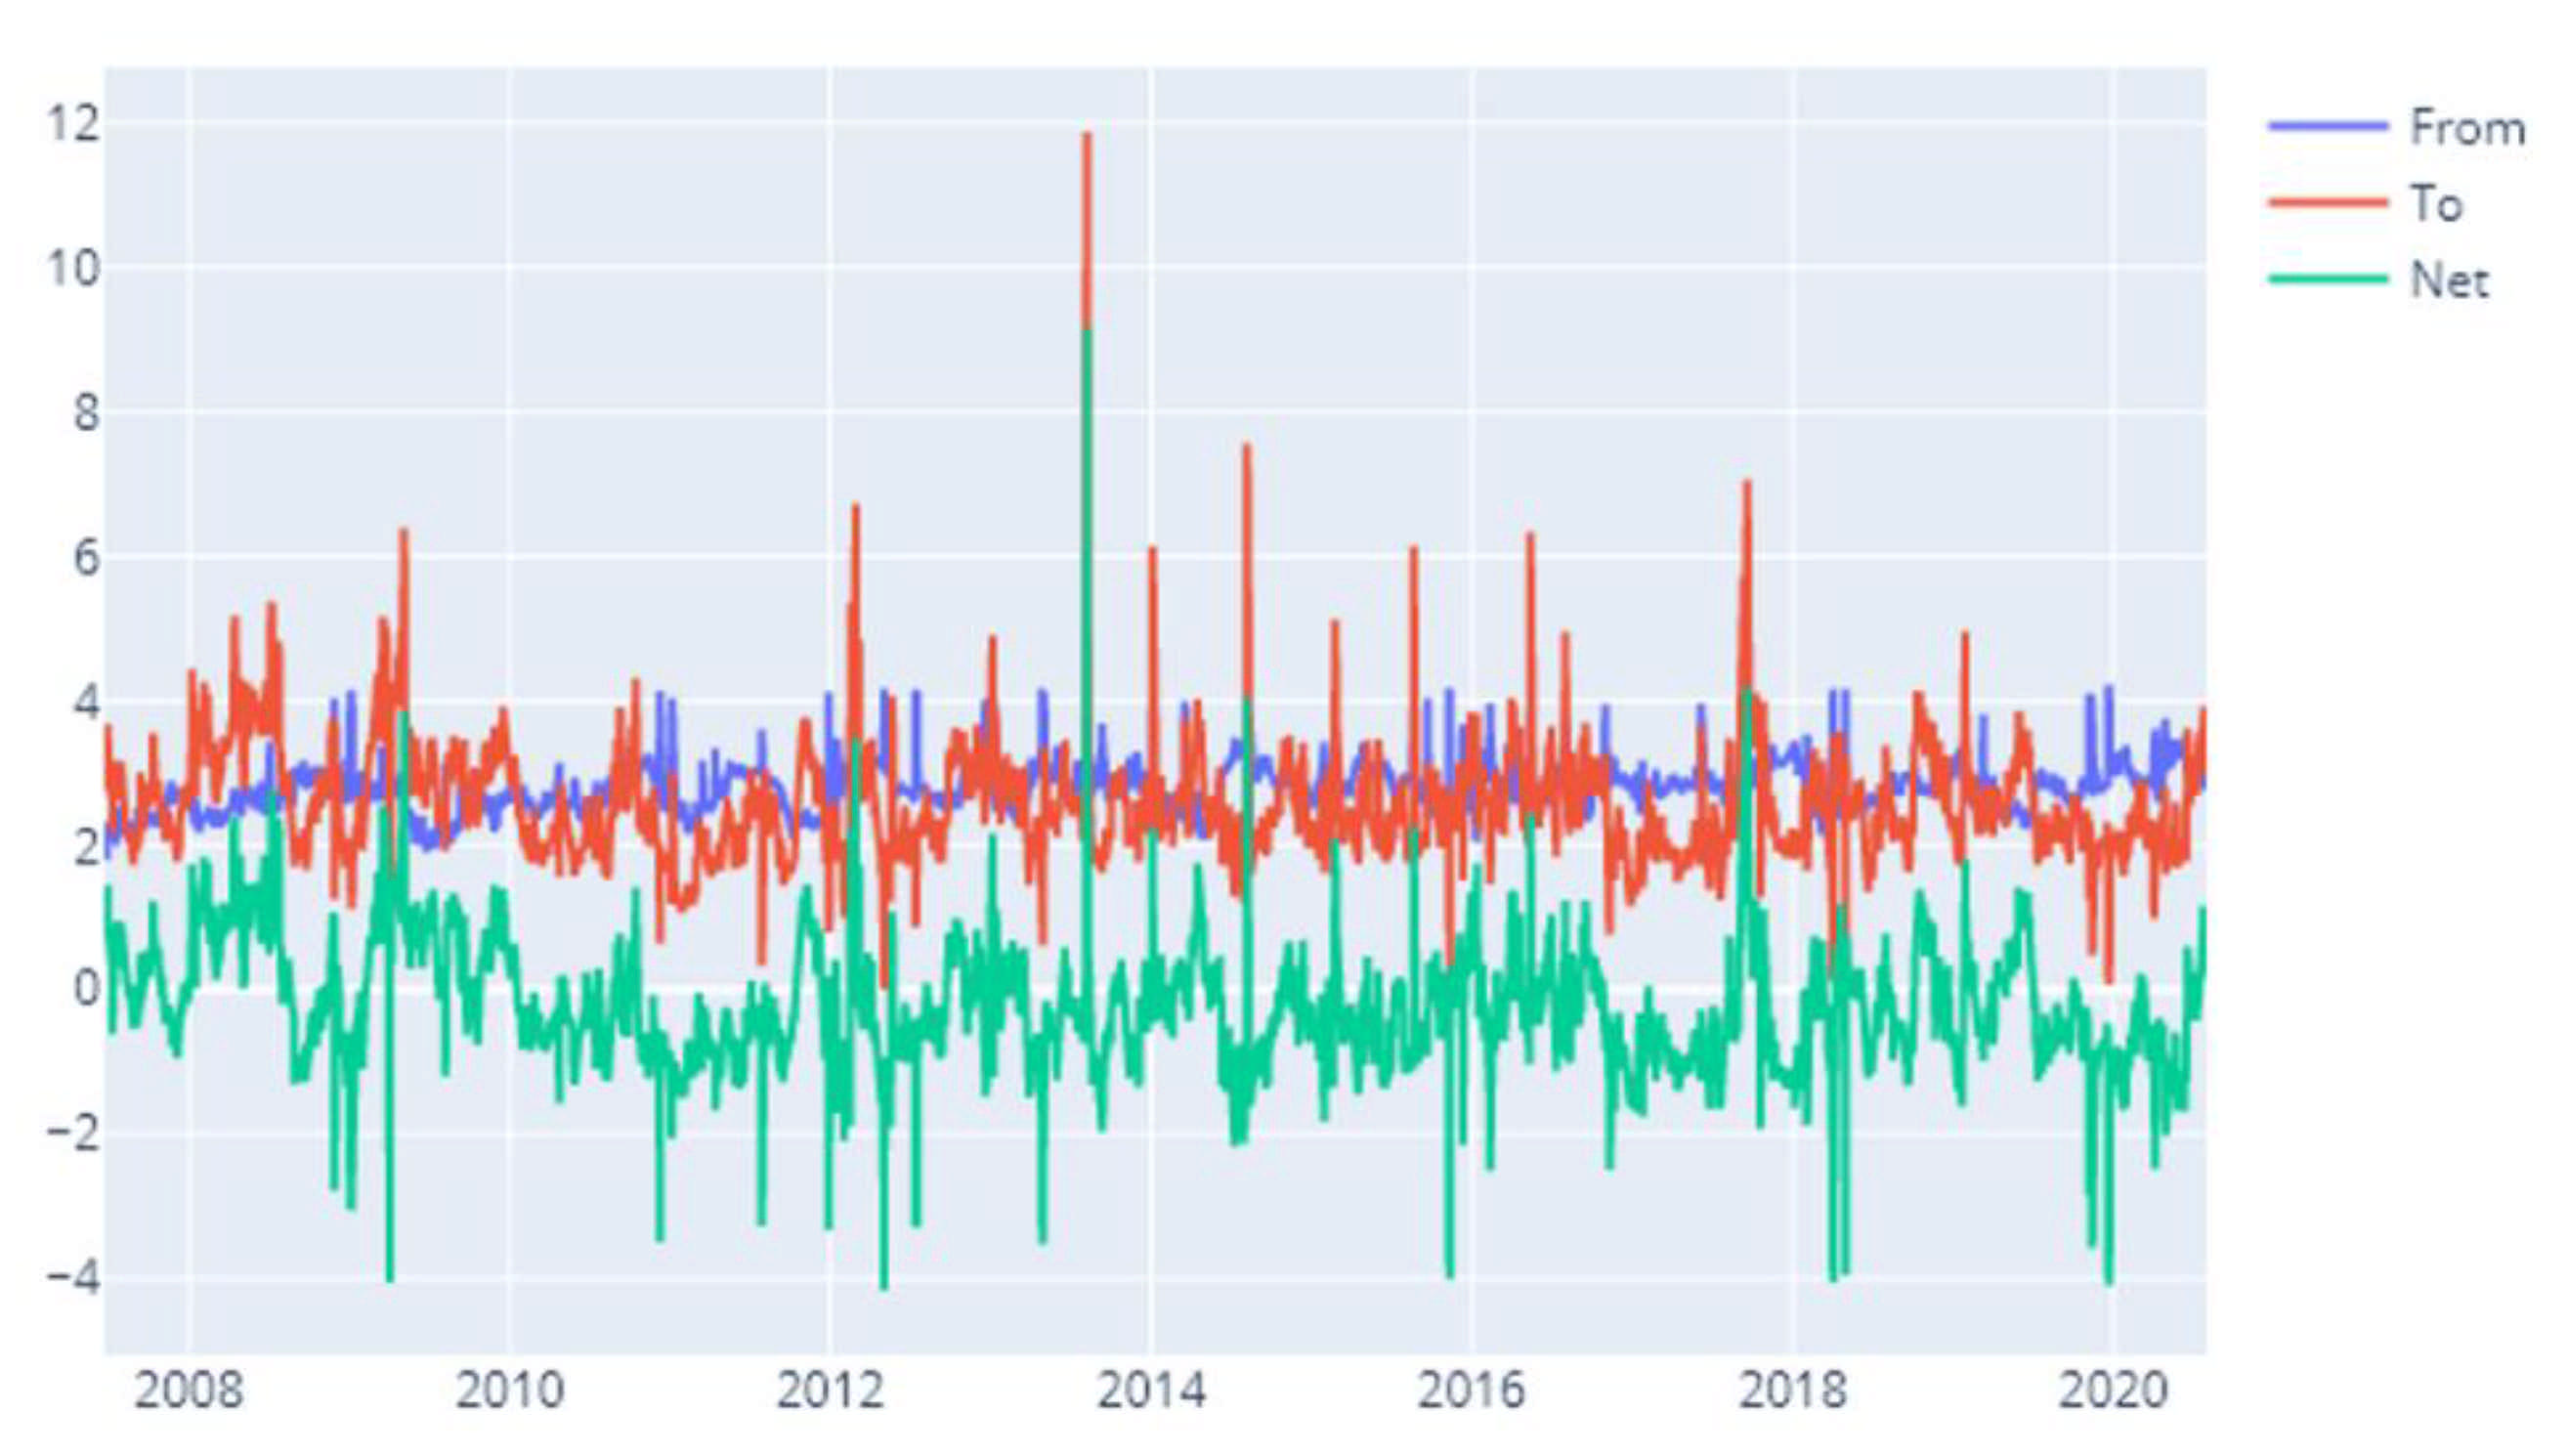
Appendix
Figure A2 and
Figure A3 exhibit the results for the same analyses performed as above but now perceived through the lens of alternative systemic risk measures, namely Delta CoVaR and MES. From a technical perspective, these specifications can be considered as a robustness test for the initial one. However, our aim in this section is to provide an exhaustive set of results that are not influenced by the specifics of a particular risk measure.
We turn our attention to the results found under the Delta CoVaR measure. In the “From” investigation, despite the fact that the main contributors are generally the same, we notice less simultaneous hikes in the spillovers around the 2008–2009 and 2020 intervals. These are still present, but to a lower extent than in the CoVaR setup. We notice also relevant synergies towards the third quarter of 2010, which can be associated with the European debt crisis that followed the 2008 episode. The main spillover-receiving companies remain the same, despite the fact that in this setup they are joined by Equinor ASA (Norway). We notice that from the total of four main receivers, three companies are from Northern Europe. This is an interesting result that matches a comment put forward earlier by the contribution of [
6] that employs a totally different methodology. Moreover, we notice that the results for the net spillovers are consistent with our initial evaluation. Given space constraints we do not comment fully on all the results upon which the paper is constructed. However, supplementary data are available on demand from the corresponding author.
Finally, we take into consideration the results obtained under the MES specification, as shown in
Appendix C Figure A3. We notice from the start that for all three types of spillovers (from, to, and net), the results are very close to the CoVaR specification discussed in the beginning of the section. This applies to both the main contributors and receivers and to the times of exacerbated spillovers.
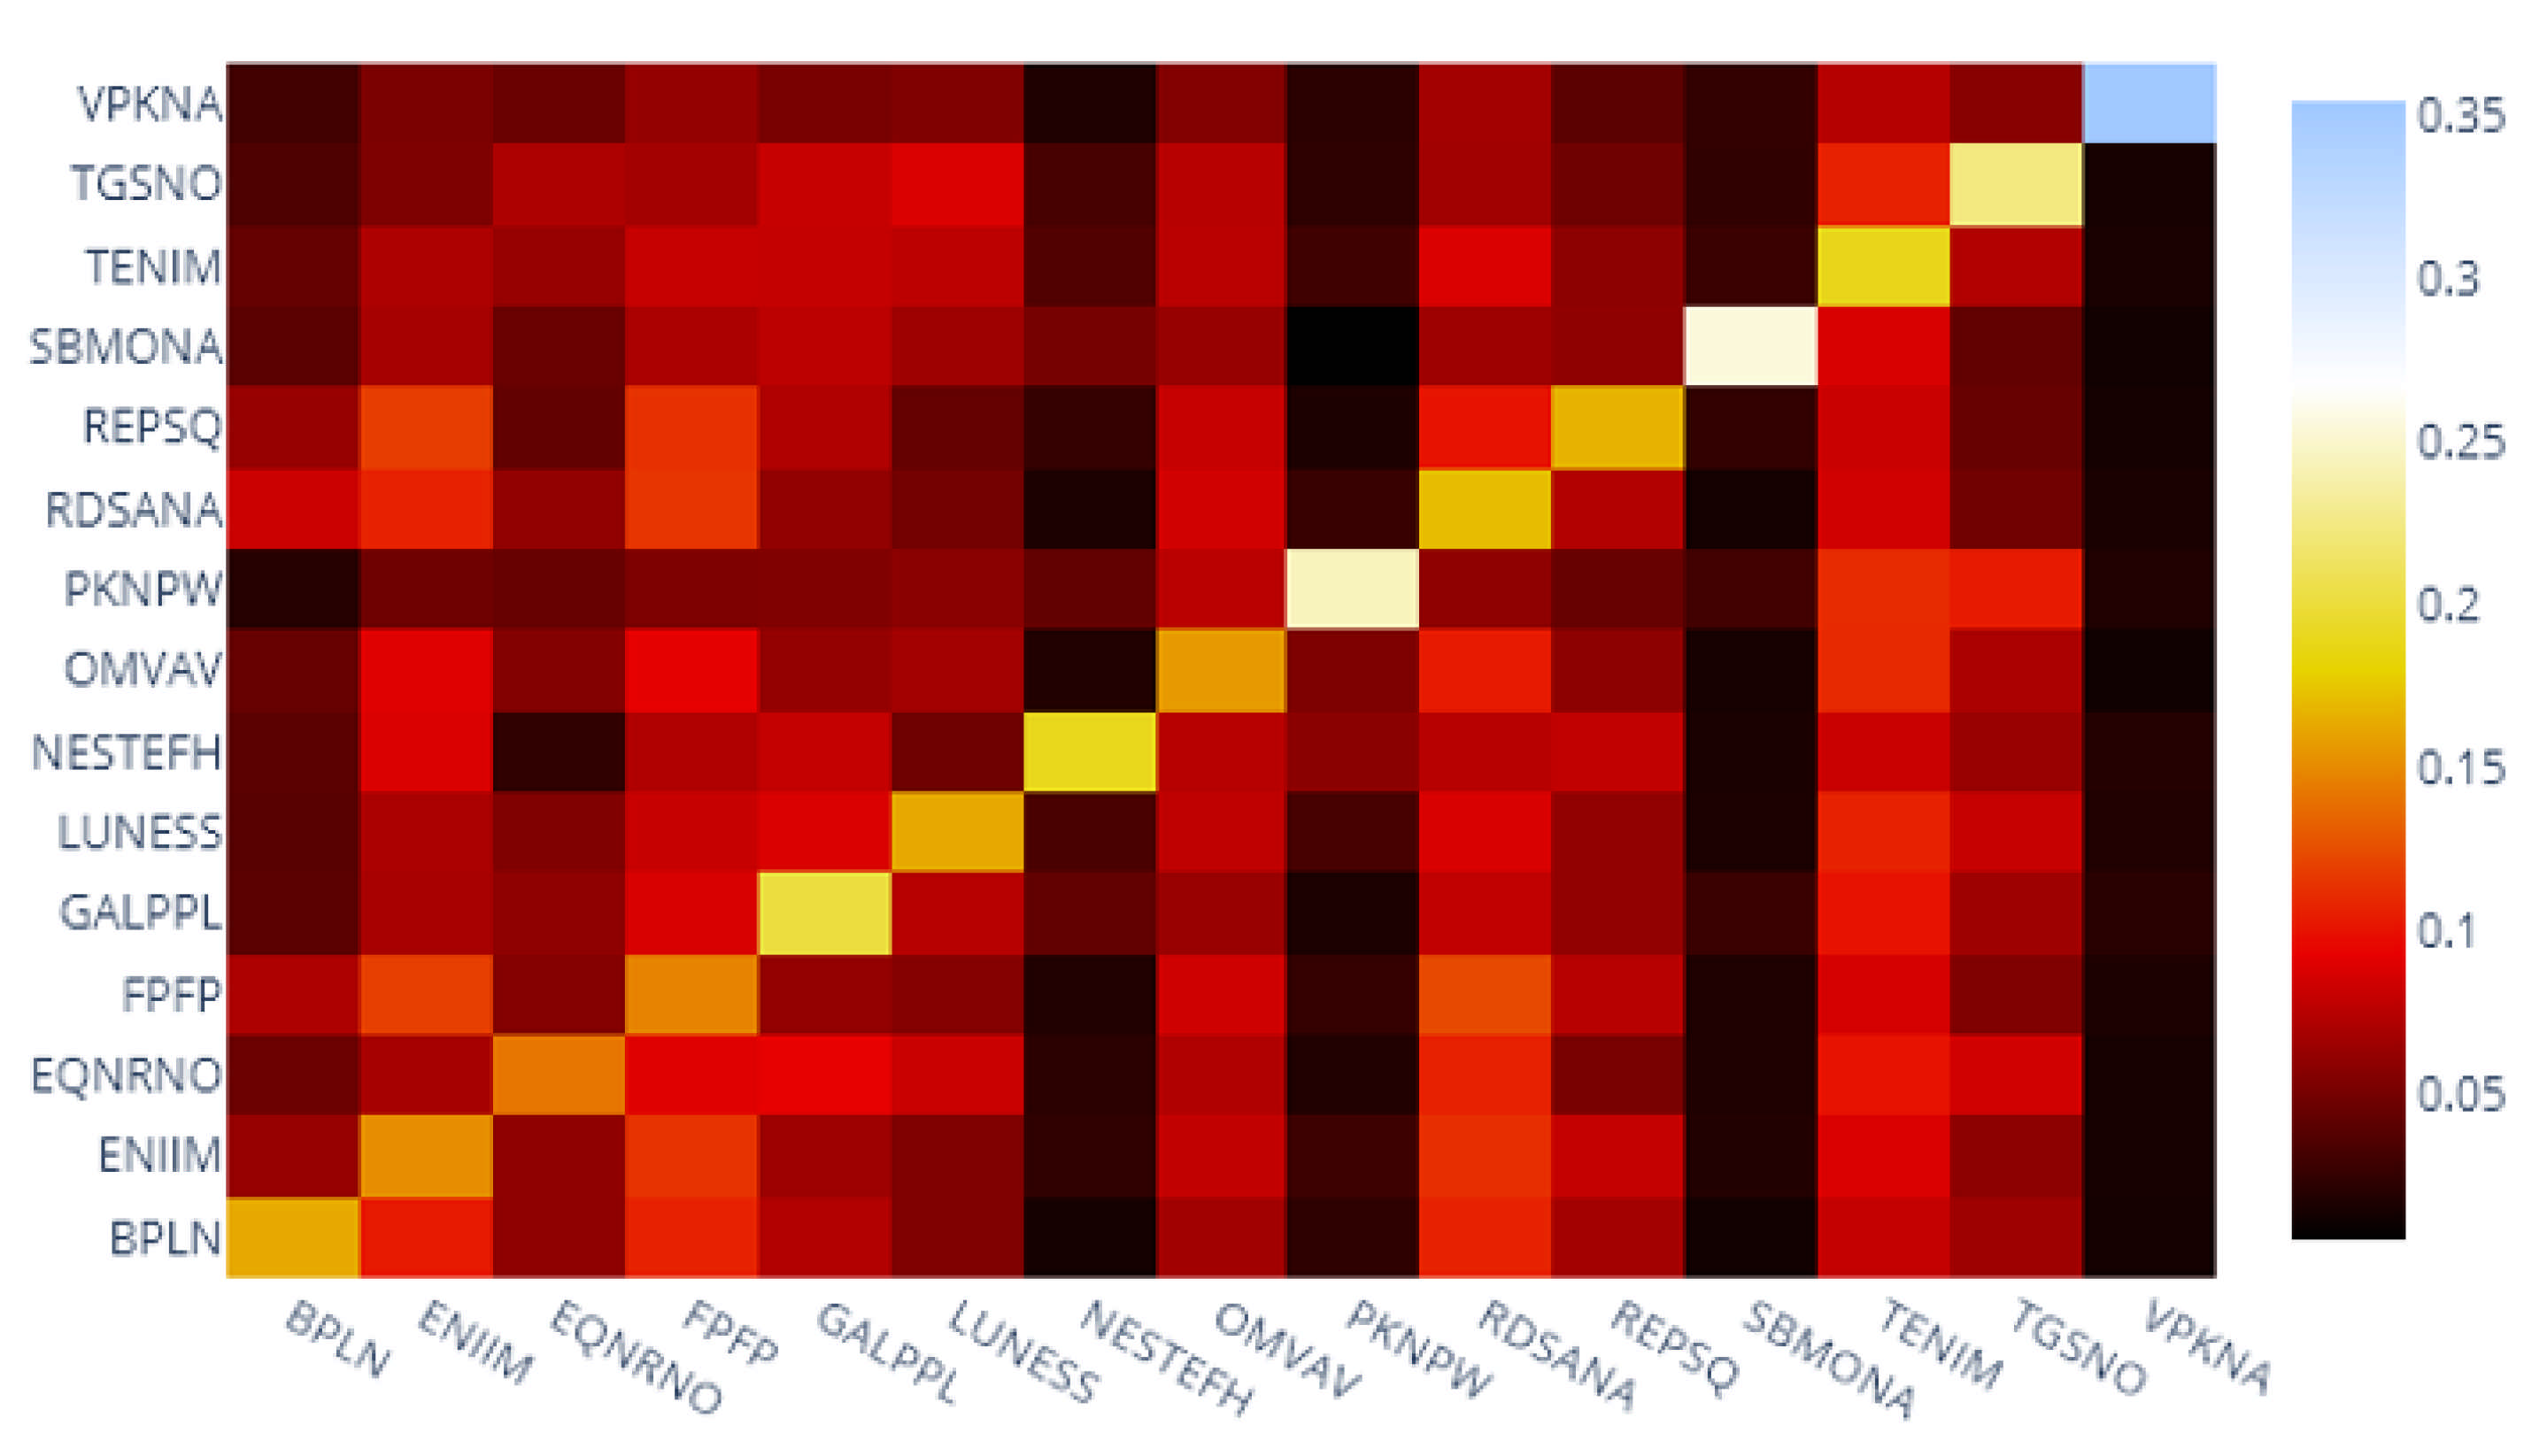
Figure 1,
Figure 2 and
Figure 3 show the spillovers across the companies inside the energy sector studied through our three systemic risk specifications. At this moment, we construct heatmaps to better discuss the relationships existing among the companies inside the sector.
Figure 1 summarizes the results obtained for the CoVaR measure. In this case, the top companies that generate spillovers to their peers are Tenaris SA (Luxembourg), Royal Dutch Shell PLC (Netherlands), Total SE (France), and Eni SpA (Italy). An interesting observation is that the contribution of Tenaris SA is highly consistent, its spillovers to other companies being placed in the top 30% spillovers recorded in the analysis. We notice heavy contributions deriving from Royal Dutch Shell PLC (Netherlands) and Total SE (France) to the system, which is consistent both with our previous results and with the precursory literature.
For the Delta CoVaR measure, the results shown in
Figure 2 are almost identical to the previous case. A striking observation is that in both cases, the lowest spillovers are associated with the same two companies, namely: Neste Oyj (Finland) and Polski Koncern Naftowy ORLEN S (Poland). This could be explained on the grounds of market position and operations in comparison to the other companies in the sample. In addition to this, what these companies share is the fact that they both deal in oil refining and distribution.
As it can be observed, the results are robust to changes in systemic risk measures.
Figure 3 shows the results obtained for the MES measure. Despite the fact that this measure differs totally in construction from the previous two, the results remain consistent and identical.
The third type of result offered by our investigation resides in the construction of an aggregate spillover index constructed at the sector level, which shows the transmission patterns among the companies. We perform this in a manner similar to the procedure introduced above, and produce a spillover index for each of the three systemic risk measures.
In the case of the CoVaR specification, even though we are not offering a visual representation (visual representations or results are available upon request) of the spillover index, we notice that given its changing trajectory throughout the sample, we have grounds to consider that it exhibits time-varying features. What is particularly interesting is the fact that the index manifests certain episodes of apparent time variance during our observation period. The first is in the 2008–2009 interval, and this is a common feature observed earlier in the company spillover analysis. We notice another profound peak in May 2010. A very interesting observation is that [
4] report the existence of a similar peak in July 2010. We agree with the authors in associating this episode with the European debt crisis. Besides the methodology, the key difference between our approach and that of [
4] resides in the fact that our study focuses on seasoned companies while theirs considers new energy firms. We notice additional peaks in 2011 and 2020. At the opposite spectrum, the lowest values are observed in the 2013–2015 interval. We observe similar trajectories for the other two systemic risk measures employed in the analysis.
Our last set of results goes past the orientation provided upon and derives from an entropy-based approach, as discussed in the previous section. We compute sector entropies and then subject them to the Diebold–Yilmaz [
18] procedure in a rolling window approach of 120 days. Again, we provide from, to, and net specifications for the entropy-based spillovers. As we will see in a subsequent section, we further test our results for robustness by changing the size of the rolling window.
Figure 4,
Figure 5 and
Figure 6 present the results obtained in the above-mentioned setup for our three systemic risk measures. For example,
Figure 4 shows the “From”, “To”, and “Net” entropy spillovers that are originally captured via a CoVaR approach. Given this construction, we start from the CoVaR specification to determine what sectors are imbuing spillovers to the energy sector. Our approach allows us to track these spillovers throughout the entire sample. We notice again that we obtain explosive values for the 2008–2009 and 2020 periods. Our second observation is that there is a solid number of sectors that generate spillovers towards the energy sector. Among the most relevant we specify banks, capital goods, consumer services, diversified financials, retailing, semiconductors and semiconductor equipment, software and services, and telecommunication services. Our results manifest similarities to those put forward in very recent research such as [
61] that focuses on the global dynamics of all economic sectors from a systemic risk perspective.
We now turn our attention to the “To” investigation in order to gauge what are the sectors receiving spillovers from the energy sector. Our results confirm that the main sectors, in this case, are automobiles, commercial and professional services, consumer durables and apparel, retailing, semiconductors and semiconductor equipment, software and services, and utilities. If in the case of the “From” analysis, the transmission patterns for 2020 are consistent throughout the year, in this case, we notice more solid effects for the first two quarters.
Finally, for the “Net” analysis, our results isolate automobiles and commercial and professional services as key sectors. As it can be observed in
Figure 5 and
Figure 6, our results are consistent when switching the systemic risk measures, as we obtain similar patterns for both the Delta CoVaR and MES.
Our results are in line with very recent state-of-the-art research, which despite employing other quantitative tools germinate a similar perspective [
44,
46,
47,
56]. The authors of [
52] investigate firm-level interconnections that exist within the global energy market. They start from a network of 20 global energy firms and employ a method that blends a value-at-risk (VaR) measure and a Diebold–Yilmaz [
18] approach. The companies belong to three major geographic areas (Americas, Europe, Middle East, Africa, and Asia/Pacific). Out of the total sample, around 30% are European companies. The authors notice that the energy companies exhibit common risk factors and that their operational decisions might influence market supplies and have an impact on energy prices. This is consistent with other investigations such as [
4], or previously [
62]. The authors of [
52] also employ a “to-from-net” procedure for the spillover effects. They report that Chevron is the leading contributor, while other major influences are rendered by Exxon and Total. This is very closely related to the results obtained under our specifications, which indicate Total as a reference in terms of spillover generation.
The results put forward in this paper are close to those reported by [
6]. The study seeks to determine a comparison between the dynamics of systemic risk in the European energy and financial sector. As we expressed earlier, such a task is valuable for determining the sector-specific response of regulatory processes, risk management, and portfolio selection. In [
6], the authors use a sample of 18 companies, several of them being considered also in our approach, and build towards obtaining two systemic risk measures, namely: the expected proportion of firms in distress (EPD) and the joint probability of distress (JPD). The first important conclusion is that the JPD for the energy sector is about 50% lower than that of the financial sector, a result that has been confirmed on an aggregate form by [
16]. In addition to this, company-wise, the lowest EPD values are reported for Royal Dutch Shell PLC, while the highest are found for Enel SpA.
5. Robustness Testing
Since in our first batch of analyses, we perform our calculation based on three systemic risk measures, out of which two can be seen as robustness support for the first, in this section, we will focus on the entropy measure and provide results for different rolling window sizes. Several attempts have been put forward in the literature up to this moment in this direction. For example, [
4] employ a rolling window of 100 which for their data corresponds to about 2 years. In a study that focuses on the same data frequency as the current paper, [
16] employ a battery of rolling windows of 100, 120, and 200 days. The authors point out that their results are robust in any of the above-mentioned scenarios. Given these previous attempts and given the fact that our baseline estimation window consists of 120, we are motivated to study the dynamics when employing 90 and 150 rolling windows. For all these estimation windows, we compute the “from, to, net analysis” for each of the three systemic risk measures, thus obtaining 18 blocks of results for the two estimation windows.
We start with the smaller estimation window and focus on the CoVaR measure. We again notice synergies for the crisis period and 2020, and the main contributors in the “from” analysis remain the same. However, we find higher contributions from technology hardware and equipment and banks. The results of the “To” analysis also confirm our baseline, although we notice differences in magnitude for certain sectors such as automobiles and utilities. Most importantly, all results remain consistent even when employing alternative systemic risk measures.
Finally, we look at the results obtained for the rolling window of 150 days. We observe that the results remain consistent; however, when using this larger window, they are far more similar to the baseline than to the previous test. While all the major contributing or attacking sectors remain the same both in the “from” and “to” investigations, we notice higher synchronicity around key time moments. Additionally, for the “from” analysis, we notice that the financial sectors induce a more effervescent impact in terms of spillovers around the time of the most recent financial crises. However, the differences remain minor.
6. Conclusions
The very recent literature has brought clear evidence that the stability of the energy system is vital for economic growth; see for example [
52]. Given this aspect, this paper focused on systemic risk spillovers for European energy companies and determined the spillover network of the energy sector with other economic sectors. From a methodologic point of view, our approach is set apart from previous attempts at investigating the risk contribution of individual energy firms and the aggregate spillover patterns of the sector. We conducted our analysis for the most liquid energy companies, quoted by the Stoxx 600 index, for a period spanning from 1 January 2007 to 31 July 2020. First of all, we employed three systemic risk measures, namely the CoVaR, Delta CoVaR, and marginal expected shortfall (MES) to ensure the coherence of the results across different risk gauges. Second, we embedded the results of these models into a Diebold–Yilmaz framework, obtaining from, to, and net spillovers for each company in our sample. This allowed us to pinpoint and rank the main companies that are sending and receiving systemic risk. The spillover indices are calculated both for the full sample and using a rolling window for estimation. Third, we extract a Bayesian formulation of the systemic risk spillover entropy for the energy sector—sent towards and received from other economic sectors. From this perspective, our study is the first to date to investigate spillovers in a framework that combines conditional capital shortfall methods and Bayesian entropy formulations. Moreover, we shed new light on the riskiness of the energy sector from an investor/equity point of view.
We find that all companies exhibit increased spillovers during 2008, early 2009, and in 2020. This is likely related to concerns regarding the global financial crisis and the pandemic crisis. Our results thus fall in line with those derived from very recent contributions such as [
60] or [
61]. Certain companies stand out as main risk drivers in the European energy sector. On one hand, a specific set of companies contributes the most spillover effects to the system both in times of turbulence and in times of calm market dynamics. On the other hand, other companies are the most prone to absorbing effects coming from the system. The results are robust to different systemic risk measures. Moreover, the aggregate spillover indices display time-varying features, which reach peaks in 2008 and 2010. We reach the same conclusions as previous analyses that associate the 2010 peak with the sovereign debt crisis. Increased spillovers can also be observed during the pandemic crisis. This is indicative of the fact that energy companies are sensitive and risk-reactive, independent of the endogenous or exogenous origin of the crises.
Our last set of results provide from, to, and net specifications for the entropy-based spillovers. Once again, we obtain substantial values for the 2008–2009 and 2020 periods. Our second observation is that there is a solid number of sectors that generate spillovers towards the energy sector. Among the most relevant, we specify banks, capital goods, consumer services, diversified financials, retailing, and semiconductors. At the opposite end, the main risk receivers from the energy sector are automobiles, commercial and professional services, consumer durables and apparel, retailing, semiconductors and semiconductor equipment, software and services, and utilities. Our results are also consistent to switching systemic risk measures. Furthermore, we notice that our results remain consistent when checking for robustness by using a different rolling window size. Given the provisions of very recent studies, we opt for two alternative specifications that focus on 90-day and 150-day rolling windows, and we take note of the fact that our results manifest minor differences compared to the baseline setup.
Our findings provide valuable insights into the dynamics of systemic risk in the European energy sector. As we observe, energy companies are highly responsive to systemic concerns and regulations. In addition to this, such an investigation offers useful inputs in risk management. This type of analysis could be helpful in determining the sector-specific response of regulatory processes. From another point of view, our results bring forth the need for a heightened regulation of certain risk-driving companies during turbulent times. Regulators that focus on market surveillance should consider risks deriving from the energy markets to safeguard the financial system from exacerbated risk deriving from the uncontrolled volatility of energy prices.
Moreover, as investors are more and more drawn to assets that cover the energy spectrum, this analysis has relevant implications for portfolio selection and risk diversification matters. Future in-depth studies could focus on the response of energy sector systemic risk to punctual events. Valuable insights could also be provided by investigating these systemic risk connections from a commodity point of view, to compare and contrast with the equity-based results that we obtained. In addition to this, future research could shift to a more firm-based approach and focus on a large batch of energy companies endemic to a certain market. This could shed more light on risk dynamics. Moreover, alternative specifications for entropy could be implemented for a more in-depth perspective. Other relevant results might derive from testing systemic risk patterns on subsets of companies grouped by their core business orientation. This could provide more evidence for interactions that exist in the energy sector.
Finally, another interesting vein of research could focus on specific comovements between spillover dynamics and several key variables that shed light on the financial evolution of a certain economic sector. Such an approach could generate a wide batch of research questions that could offer a more global perspective on the drivers and effects of energy spillovers (we thank an anonymous reviewer for bringing up this discussion).


