Article

Case Study of Load Matching and Energy Cost for Net-Zero Energy Houses in Korea †

1
Department of Architectural Engineering, Daejeon University, Daejeon 34520, Korea
2
Korea Institute of Sustainable Design and Educational Environment, Seoul 05066, Korea
*
Author to whom correspondence should be addressed.
This paper is an extended version of our paper published in 4th International Conference on Smart and Sustainable Technologies (Splitech), Split, Croatia, 18–21 June 2019.
Energies 2021, 14(19), 6407; https://doi.org/10.3390/en14196407
Submission received: 24 August 2021 / Revised: 17 September 2021 / Accepted: 30 September 2021 / Published: 7 October 2021

Abstract

:
Over the past 20 years, net-zero energy house (NZEH) construction costs have steadily decreased because of many reasons, such as technical progress, energy-saving design obligations, and dramatic cost reductions in renewable energy systems, especially solar power systems. Currently, the costs of NZEH are estimated to be about 5% higher than similar-sized houses. These additional costs are mainly for installing PV systems, which can be offset by energy saving costs. This study assessed energy performance and load matching through remote monitoring systems, and energy costs were analyzed for two-family houses. The two houses were all-electric houses and different in both size and location. A 6 kWp grid-connected PV system and 16 kW air source heat pump for space heating and domestic hot water were equally implemented. After data analysis, 100% of the energies were supplied through the PV system for 3 years, thus achieving net-zero energy. According to the Korean residential electricity tariff system, the annual electricity charges were, on average, between USD 105.1 and USD 121.4 after adding demand charges and value-added tax for import electricity charges. The energy cost reduction rate, compared to the same house without a PV system, was about 95%, and the simple payback period of the 6 kW PV system in NZEH was about 6 years. In addition, the annual load cover factor and supply cover factor as load-match indices between electricity generation and the load were in a range of 0.39–0.49 and 0.37–0.42, respectively.

1. Introduction

The past 20 years have seen considerable progress in the development of energy-efficient buildings that significantly reduce energy usage. Since 2020, the Korean government has required net-zero energy by law for new public buildings with a total floor area of over 1000 m2, and from 2025, the scope will be expanded to include public buildings with over 500 m2, as well as private buildings. For this reason, the building energy-saving design standard has been strengthened further since 2018. Various incentives have also been provided for net-zero energy buildings (NZEB) and renewable systems, such as relaxation of building standards (floor area ratio and building height restriction), acquisition tax reductions by up to 20%, 70% subsidy for the installation of BIPV and fuel cells, and 50% subsidy for the installation of 3.3 kWp PV systems [1,2].
However, the market share of NEZH is still low (the market entry of NEZH continues to be restricted). It is assumed that construction costs, which are 5% higher than conventional houses, will reduce its competitiveness [3]. If additional construction costs are offset by energy-saving costs, NEZH could increase its competitiveness. In other words, the implementation strategy for NZEH is to present the empirical evidence of cost-benefit.
As prior studies related to NZEHs have shown, several simulations have been conducted to achieve net-zero energy through a combination of energy-efficient technology and renewable energy. Optimizing the design of building envelopes (insulation and windows, airtightness performance, and more) for the load reduction in residential buildings [4,5,6,7,8,9,10,11,12] is one way to achieve this. Baek et al. analyzed energy usage for six houses of the same shape, size, and renewable energy system located in Daejeon, Korea, which were designed with the object of net-zero as empirical cases of NZEHs. The results showed a significant difference in energy usage according to the occupants’ awareness of energy-saving and habits. Each house’s actual energy self-sufficiency (solar fraction) was somewhere between 39 and 78% in 2014 [13]. Lim et al. evaluated the energy performance for farmhouses located in the middle region of Korea, wherein solar domestic hot water systems of a collecting area of 5.4 m2 and a 6 kW PV system were installed. The annual energy productions of PV and solar thermal systems were 6125 kWh and 1564 kWh, respectively, and the energy self-sufficiency rate was 97.1% [14]. Christian evaluated the energy performance and economic feasibility for the four NZESs built during 2002–2004. The average daily energy costs for the houses were USD 1.01, 0.88, 0.79, and 0.75, and the annual energy rate supplied from the PV system was estimated as 20–27% [15]. Stephan et al. evaluated the feasibility of the net-zero life cycle primary energy and greenhouse gas emission (NZLCPEGHG) buildings. The analysis was conducted on research apartment buildings with an effective area of 154m2 per household in Sehaille, Lebanon. To achieve NZLCPEGHG, they concluded that it would be necessary to improve the insulation performance of the buildings (U-value of 0.32 W/m²·K), reduce the electrical demand for applications, and install a 6.5 kWp PV system (building total of 52.4 kWp), including tubular gel batteries, for each household. The resulting additional capital costs and life cycle costs were USD 75/m2 and USD 47/m2, respectively, and the net-zero life cycle energy and greenhouse gas emission balances were expected to be reached at years 48 and 49 [16]. Kosonen et al. conducted an energy performance evaluation for the zero-energy log house (ZELH) in southern Finland. The ZELH, with a space heating area of 183 m2, had a 21.1 kWp PV system, and the electricity self-sufficiency rate was higher than 35% for 3 years from 2017 till 2019 [17]. Stefanović et al. discussed the possibility of achieving NZES through PV system installation—in case of no reinforcing insulation or strengthening insulation performance—in five ways for non-insulated houses built in 1927 and located in Serbia. As a result, it has been shown that investing in some part of the insulation of a house, and then in a PV system, can be the most economically advantageous way to have a house with a net-zero energy cost. A total investment of EUR 6164 is required to install a PV system without reinforcing the insulation performance of the house, and the payback period is 11.7 years. However, when insulation performance was the highest among the five methods, the PV system investment cost and payback period were EUR 4494 and 8.5 years [18].
As discussed above, there is uncertainty about the reliability of cost–benefit data because the cost–benefit, according to the implementation of NZEH, varies by time, country, and climate. A lack of empirical evidence on the cost–benefit of NZEH has increased this uncertainty.
This study investigated the detailed energy system and information of two existing NZEHs, aiming to analyze the cost and benefit according to NZEH implementation. Electricity consumption and production data were measured with an edge computing-based remote monitoring system over the past 3 years. Load mating and energy cost during this period were also analyzed. The findings provide actual cost–benefit information of NZEHs, which are in the interests of different builders, engineers, and architects.

2. Houses for Case Study

The two houses in this study are part of a project conducted by the architect, engineer, and house owner with the objective of energy zero right from the initial design stage. Based on what occurred in previous low-energy housing projects, mass and envelope designing have been performed from the initial stage of designing to effectively use natural environmental elements, such as solar energy and winds, by minimizing energy that would otherwise be lost to the outside [13]. In addition, excessive insulation and strengthening the airtightness performance were avoided due to the cost, and the investment was focused instead on renewable energy.

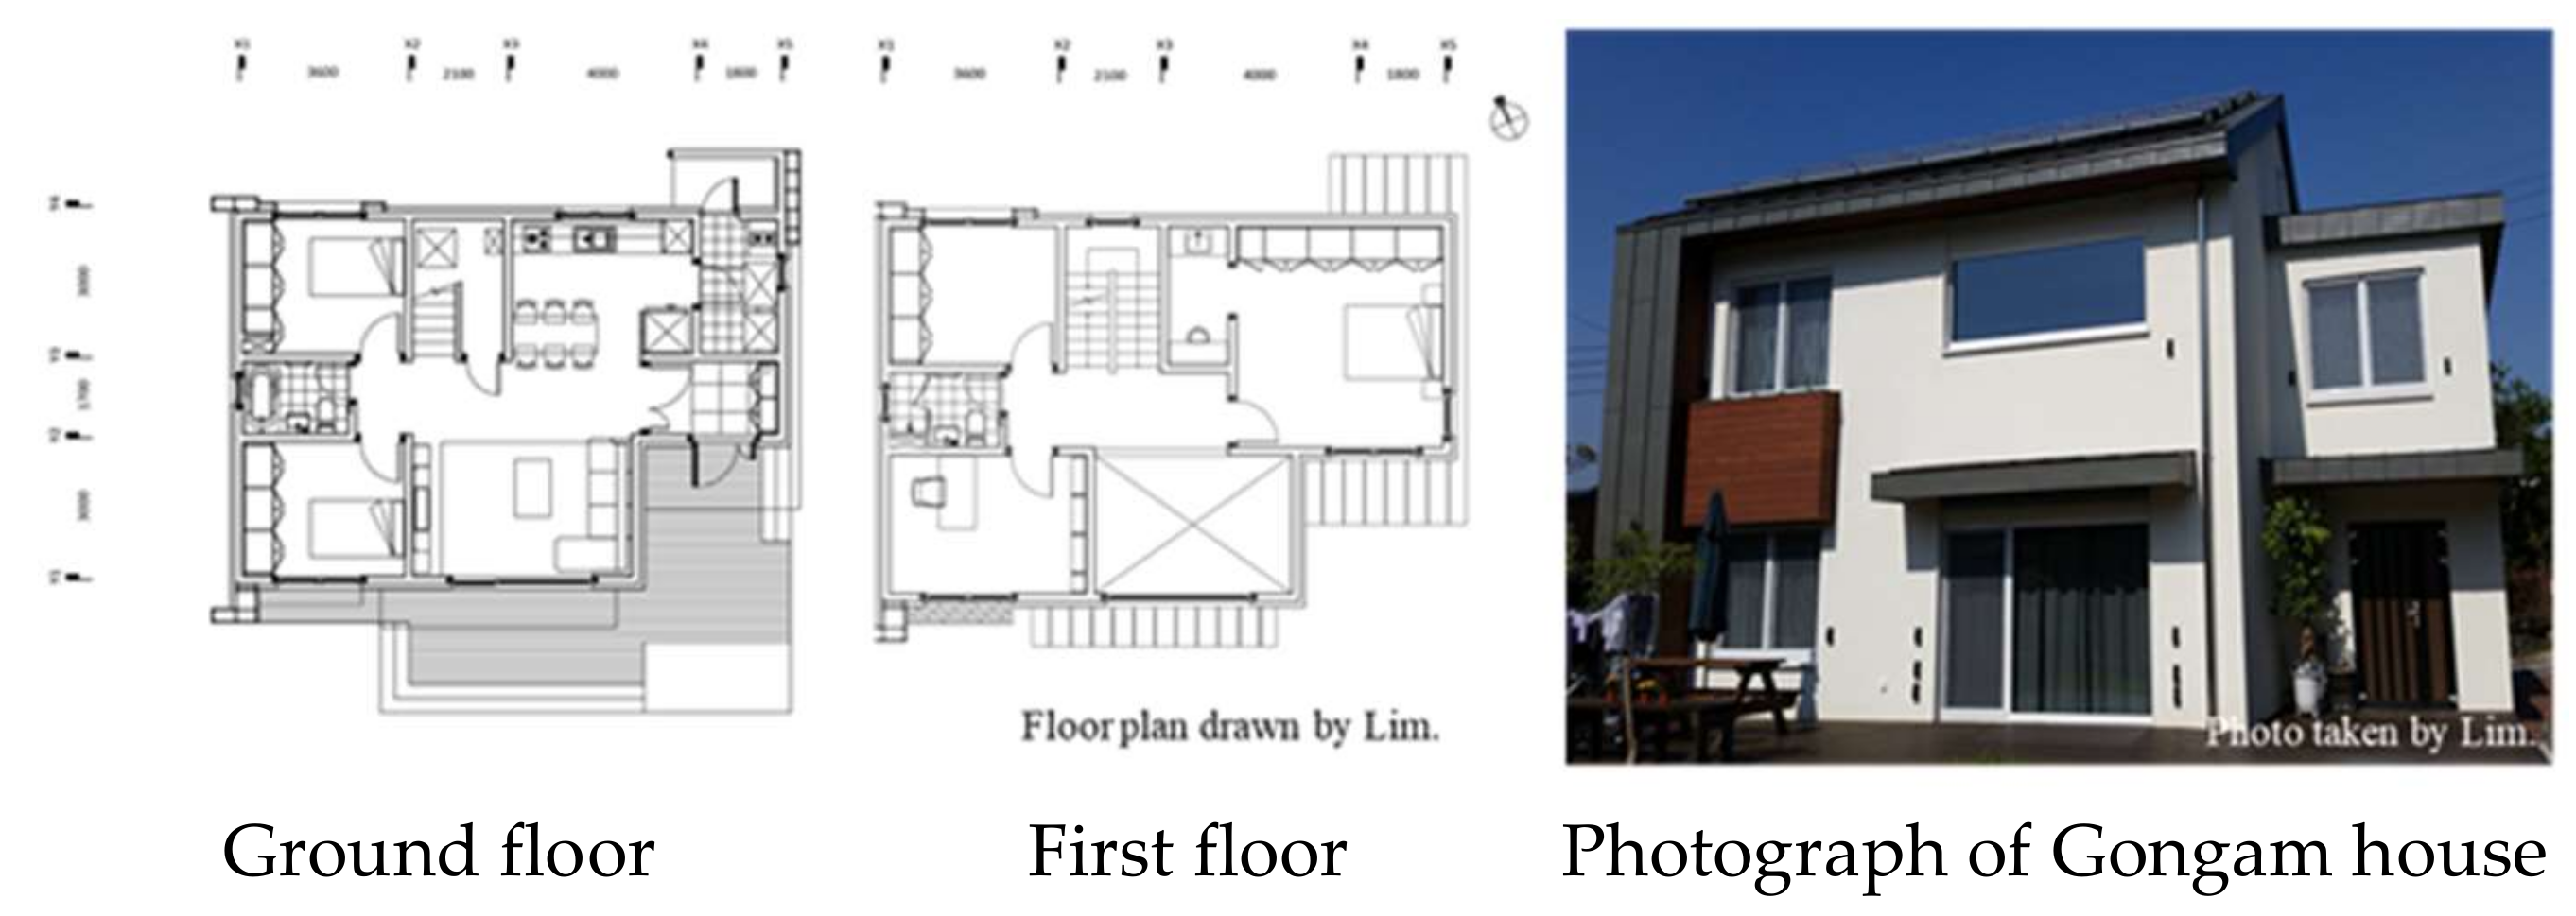
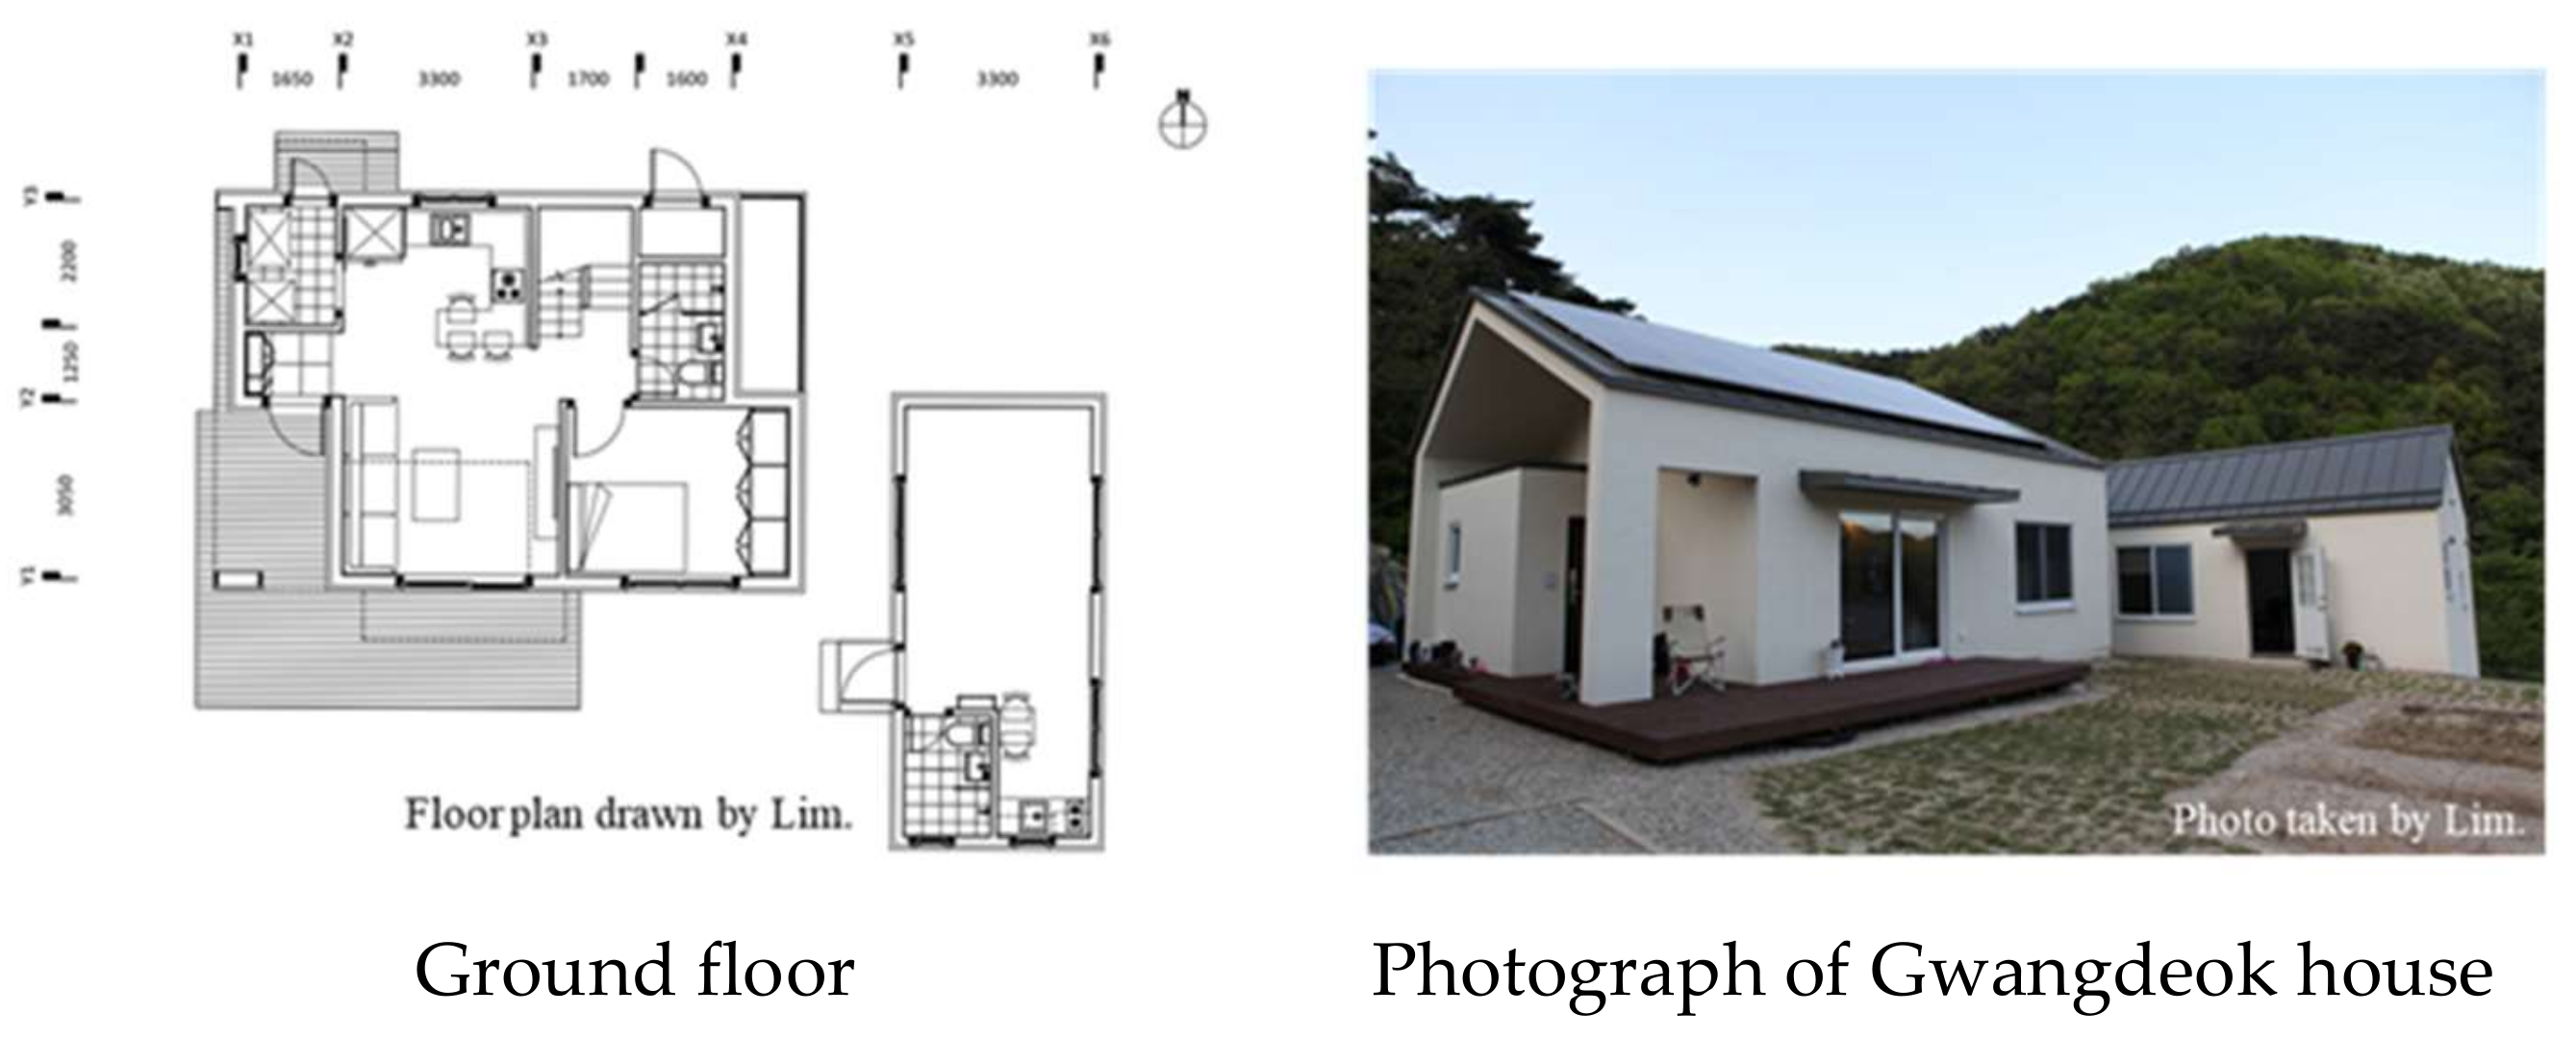
2.1. Architecture Scheme

Figure 1 and Figure 2 present the two houses’ south floors. Gongam house and Gwangdeok house are located on the ground without surrounding shielding in Gongju and Cheonan, Korea, and were completed in September 2015 and April 2016, respectively. There is no climate difference between the two regions, located about 36 km away from each other. The annual average temperature and annual insolations are 13 °C and 1.400 kWh/m2·a. Gongam house is a two-story building with a total floor area of 149 m2, while Gwangdeok house is a one-story building with a loft and a separate building with a total floor area of 109 m2. Light-frame wood structures that had structural stability and were easy to construct were used for both houses. Both houses were planned in a long east–west shape for natural ventilation and light, with a window-to-wall ratio of 13.5% for Gongam house and 6.3% for Gwangdeok house, and both the living rooms and bedrooms facing the south side.

2.2. Building Insulation and Air Tightness

Table 1 shows the envelope insulation levels of the two houses. The insulation performances of the houses were slightly higher than the insulation standard at the time of construction, but these were designed lower than the current insulation standard of Passivhaus. In the case of the external wall of Gongam house, cellulose insulation materials with a thickness of 140 mm were filled between the structural timbers, and an EPS 100 mm in thickness was additionally inserted to reduce thermal loss at the structural timbers. In Gwangdeok house, cellulose insulation materials with a thickness of 185 mm were filled between the structural timbers, while an EPS of 30 mm was additionally installed. The triple-glazed windows with a U-value of 0.98 W/m2 K and g-value of 0.45 were used for the two houses, and the blower door test results were 1.3 ACH and 1.25 ACH when the pressure difference between the room and outside area was 50 pa.

2.3. Other Energy-Saving and High-Efficiency Devices

LEDs were applied in all the lighting systems of the houses, and heat recovery ventilation systems were installed. In addition, in the bedrooms at the southern side and guest rooms, movable blind systems were installed to adjust sun radiation.

3. Energy System of the Houses

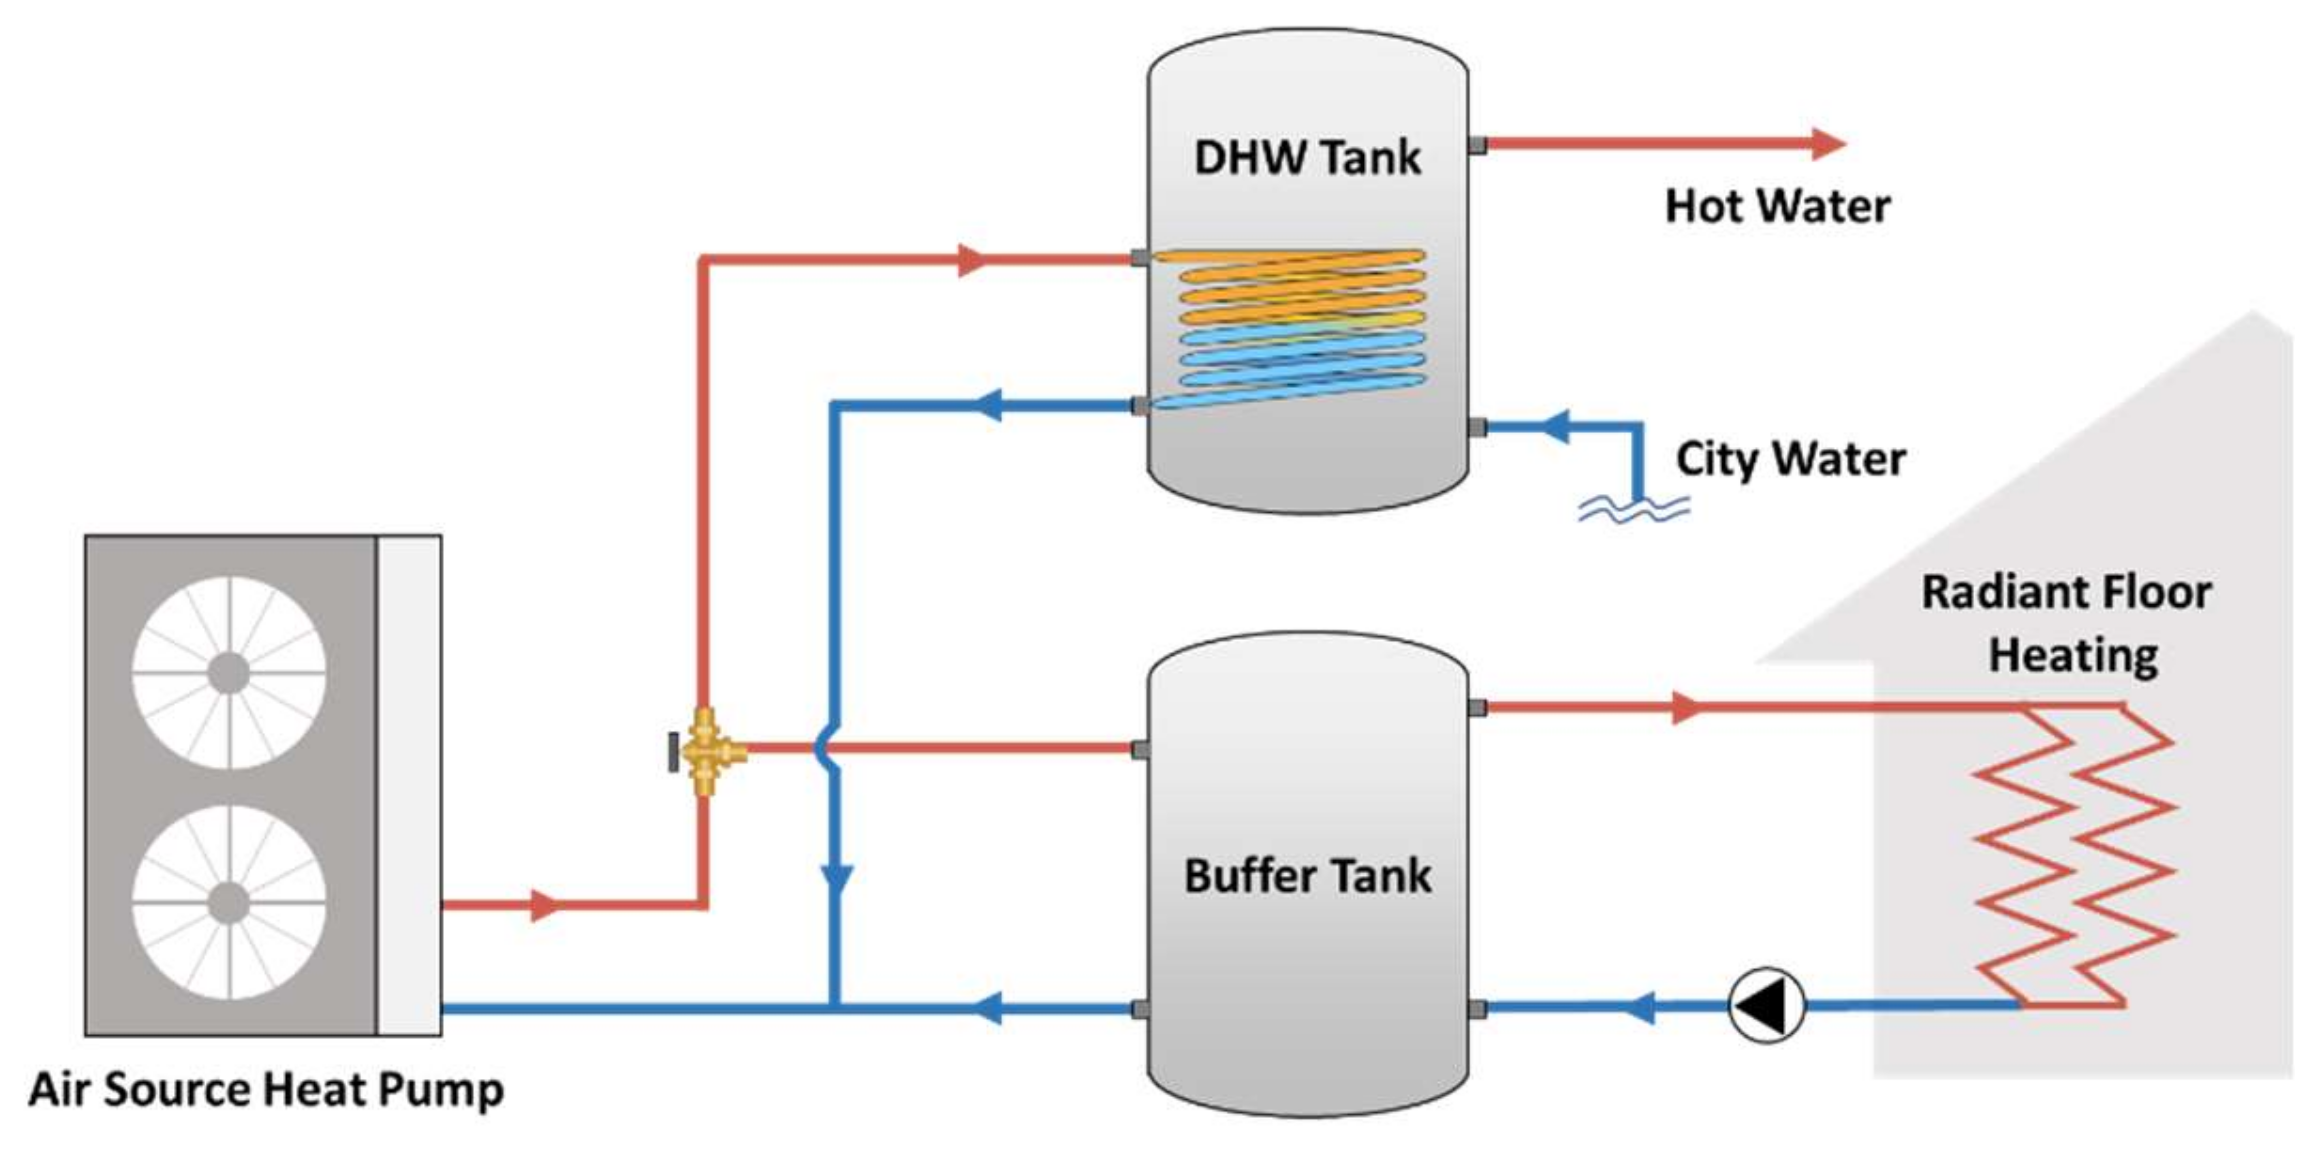
3.1. Space Heating and Domestic Hot Water System

Both houses were planned to be all-electric so the entire energy supply, including heating and cooking, would be carried out with electricity, with consideration towards the convenience of maintenance and repairing and cost-zero aspect. The air source heat pump (ASHP)LG AHUW166A1 and split-type air conditioners for cooling were equally applied for both houses. ASHP is inferior in thermal performance operation compared to the ground source heat pump but has the merit of low initial investment.
Table 2 and Figure 3 show the specifications and system diagrams of space heating and domestic hot water systems. The hot water was heated in the ASHP and is stored in a domestic hot water tank and a space heating buffer tank, respectively.

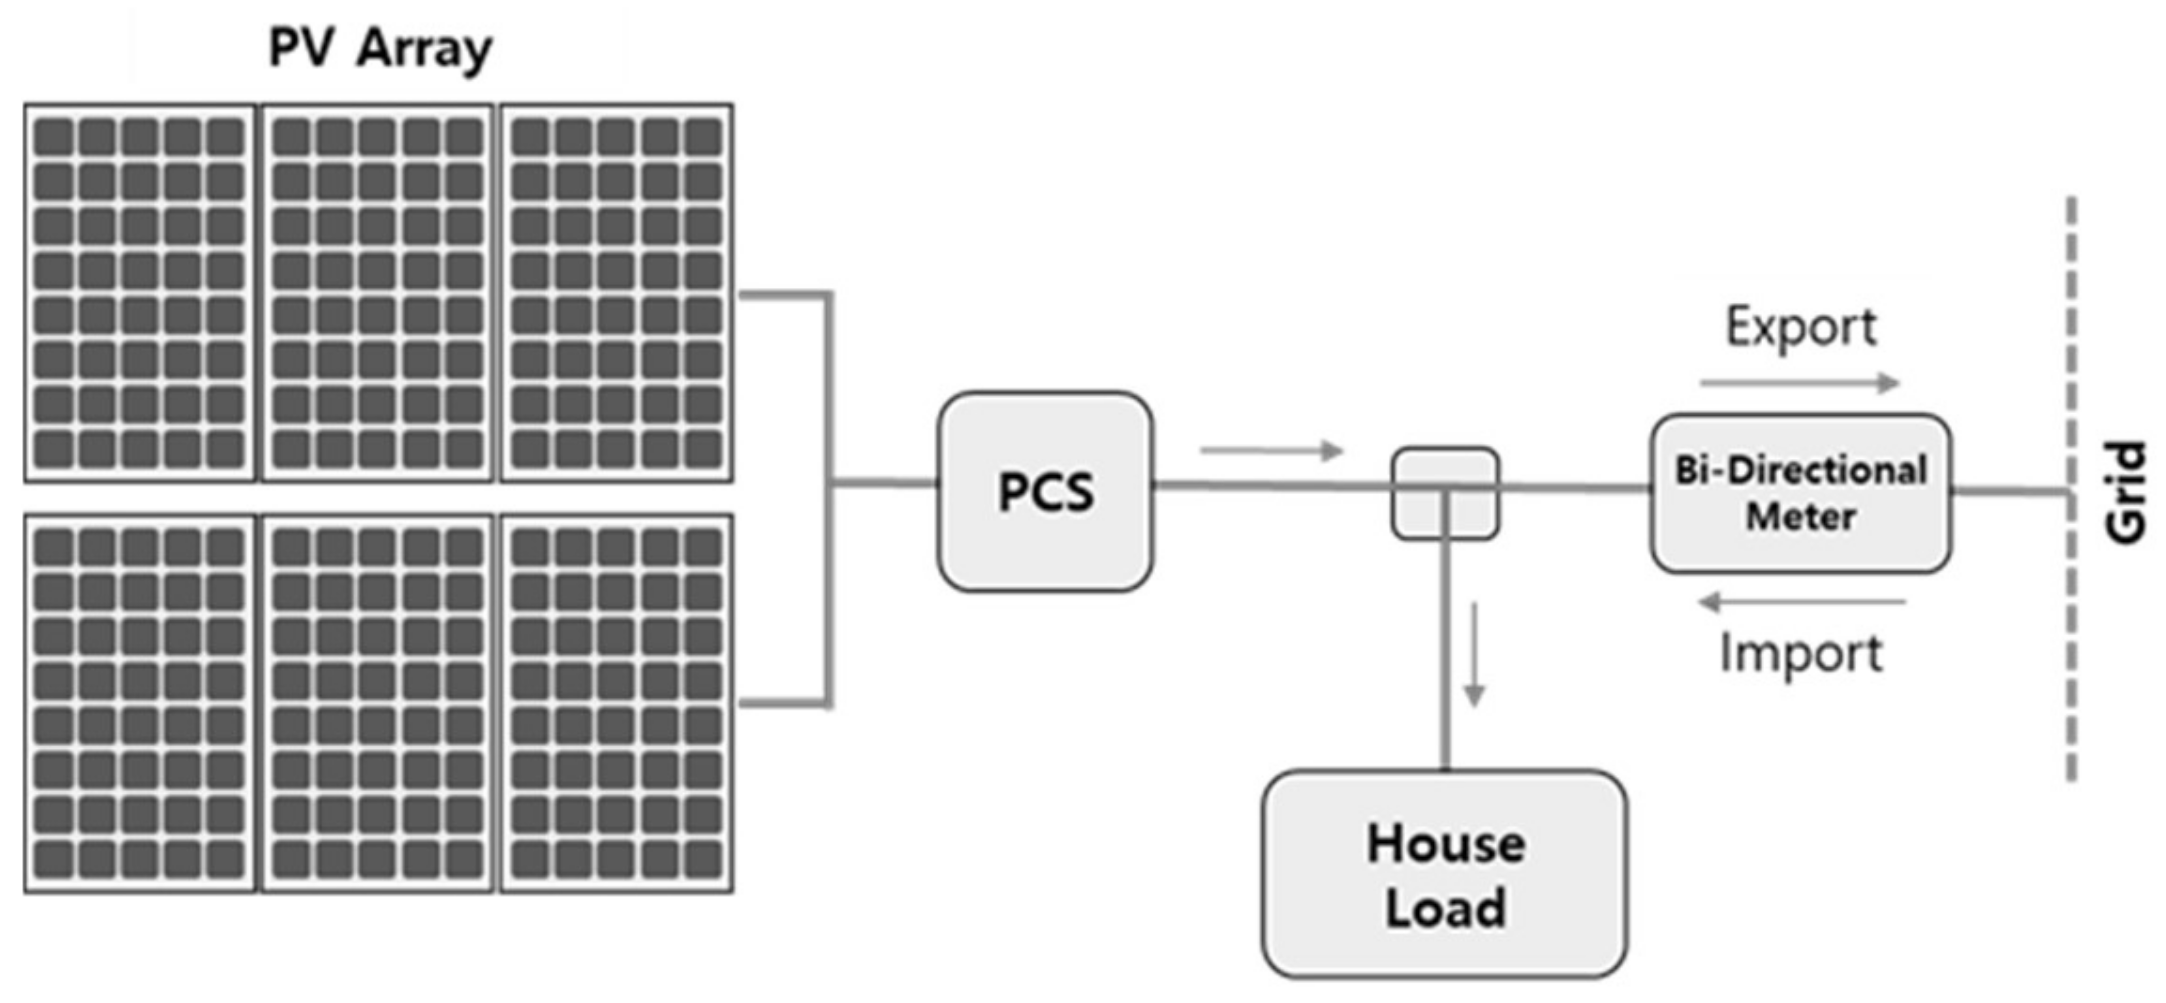
3.2. Photovoltaics (PV) System

Table 3 and Figure 4 display the specifications and system diagrams of grid-connected PV systems installed in the two houses. Roof-mount type 6 kWp PV systems were installed on both houses, and the rated efficiency of inverters was the same, at 96.79%. The DC power generated by the PV system is converted to AC in the inverter and then supplied first to the electrical demand of the house; when surplus power occurs, it is transmitted to the grid and carried over to the next month. Here, the surplus electricity carried over continues to accumulate and is offset against the next month’s import electricity. In this way, when the PV system is grid-connected, bi-directional meters are installed to measure electricity imported and exported across the grid.

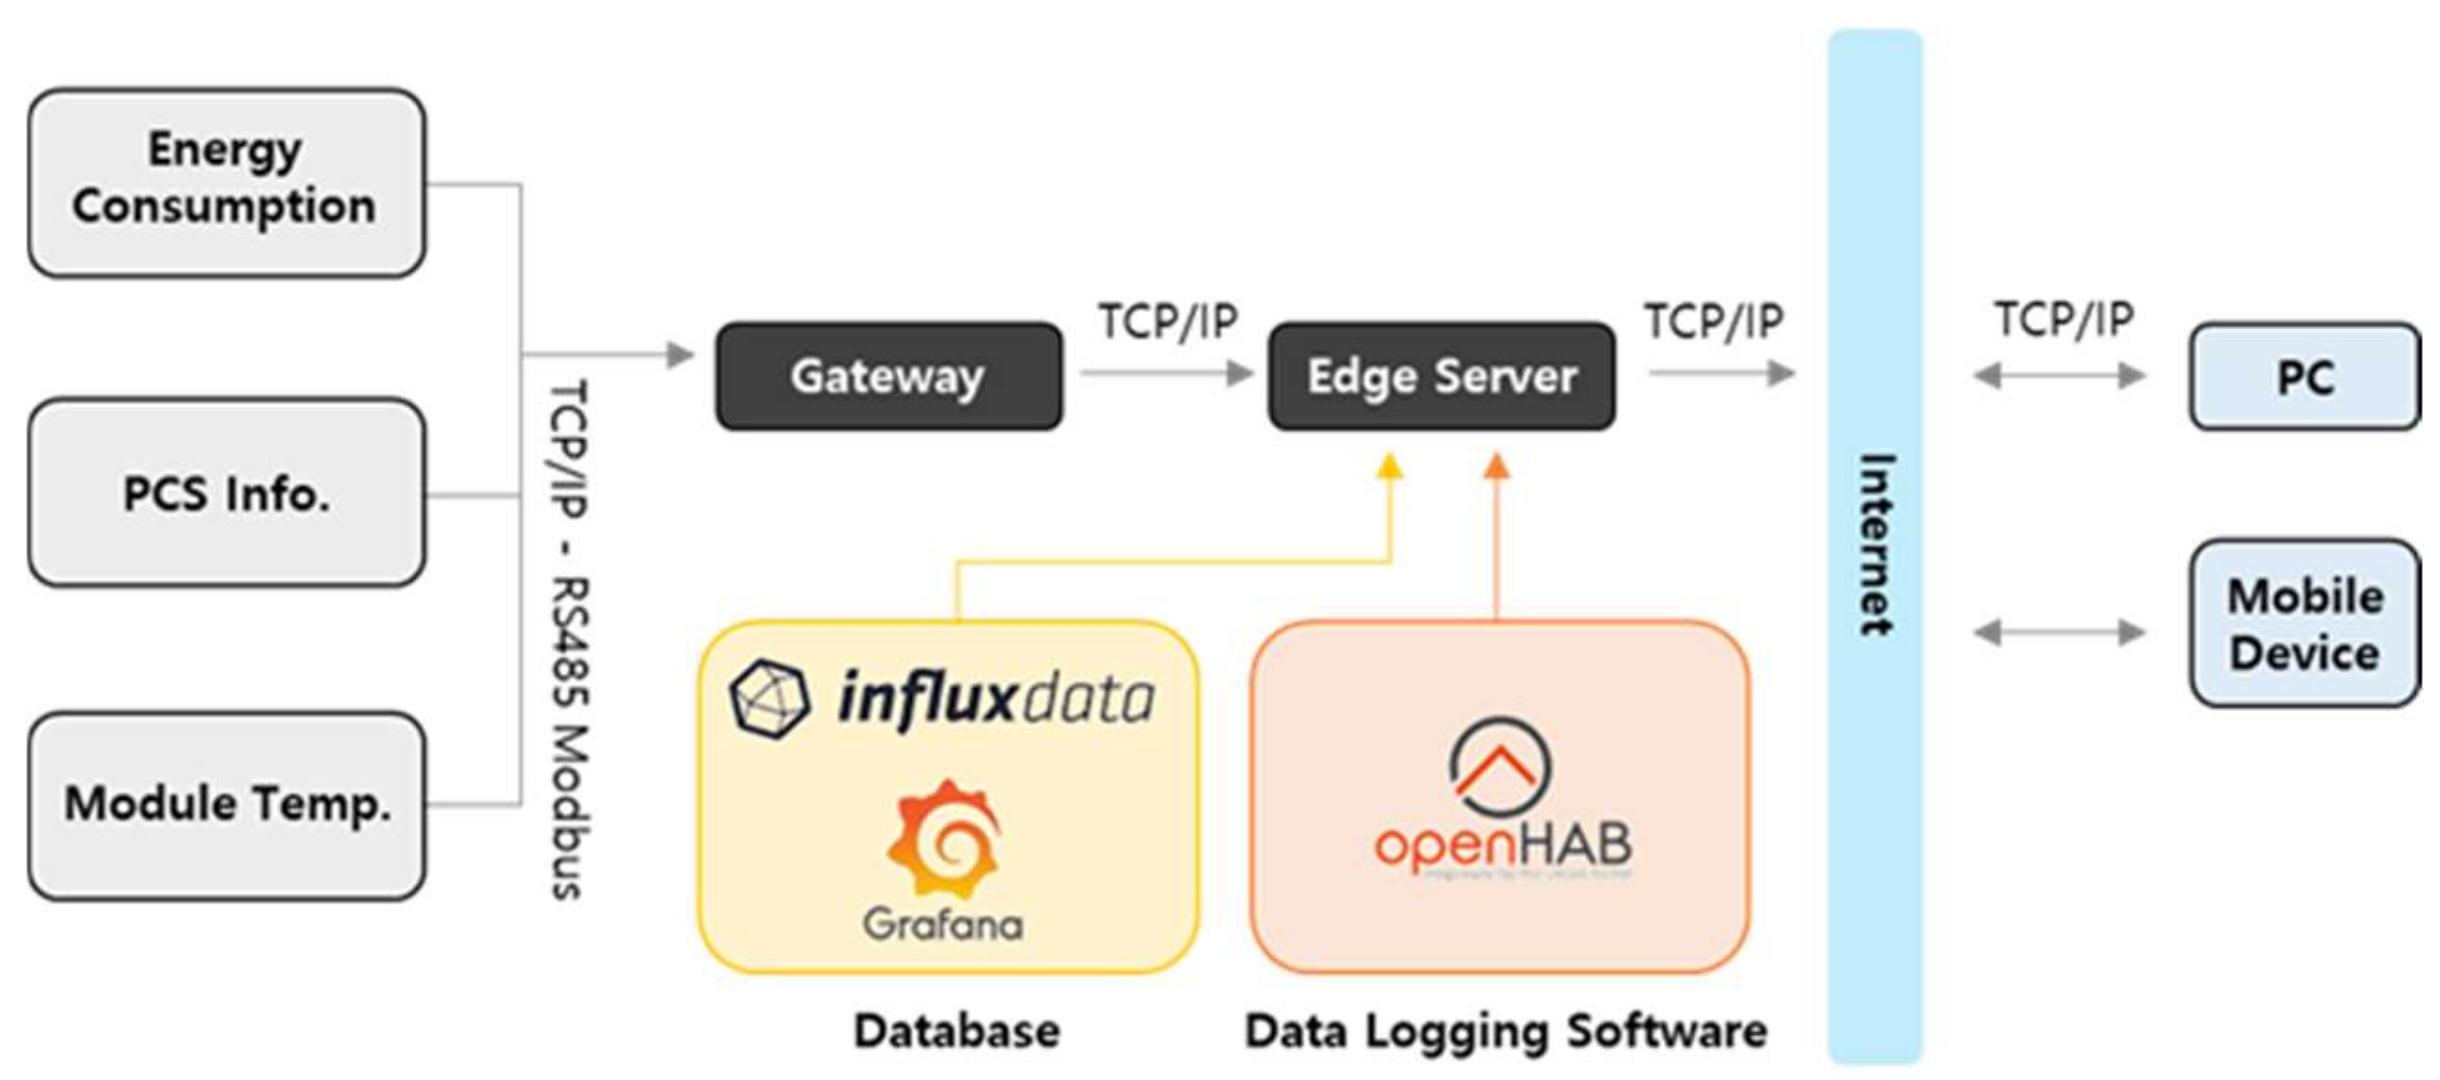
3.3. Data Acquisition System

An edge computing-based remote monitoring system was established, as shown in Figure 5, to analyze the energy performance of the two houses. Here, three electricity sensors to measure import and export electricity and on-site PV generation (Next Technology System; Seongnam, Korea) were installed. The present system was constructed with an Open Home Automation Bus (openHAB - openHAB Foundation e.V.; Germany) platform and InfluxDB (InfluxData Inc.; San Francisco, USA), a time-series database (TSDB). Since an open-source software platform without a separate license was used in all the system design processes, the system construction was relatively economical.

4. Evaluation of Energy Performance of NZESs

The cumulative surplus powers of the Gongam house and Gwangdeok house were 4209 kWh and 4102 kWh, respectively, from the completion day until the end of December 2017. The surplus electricity during 3 years from January 2018 to December 2020 was monitored.

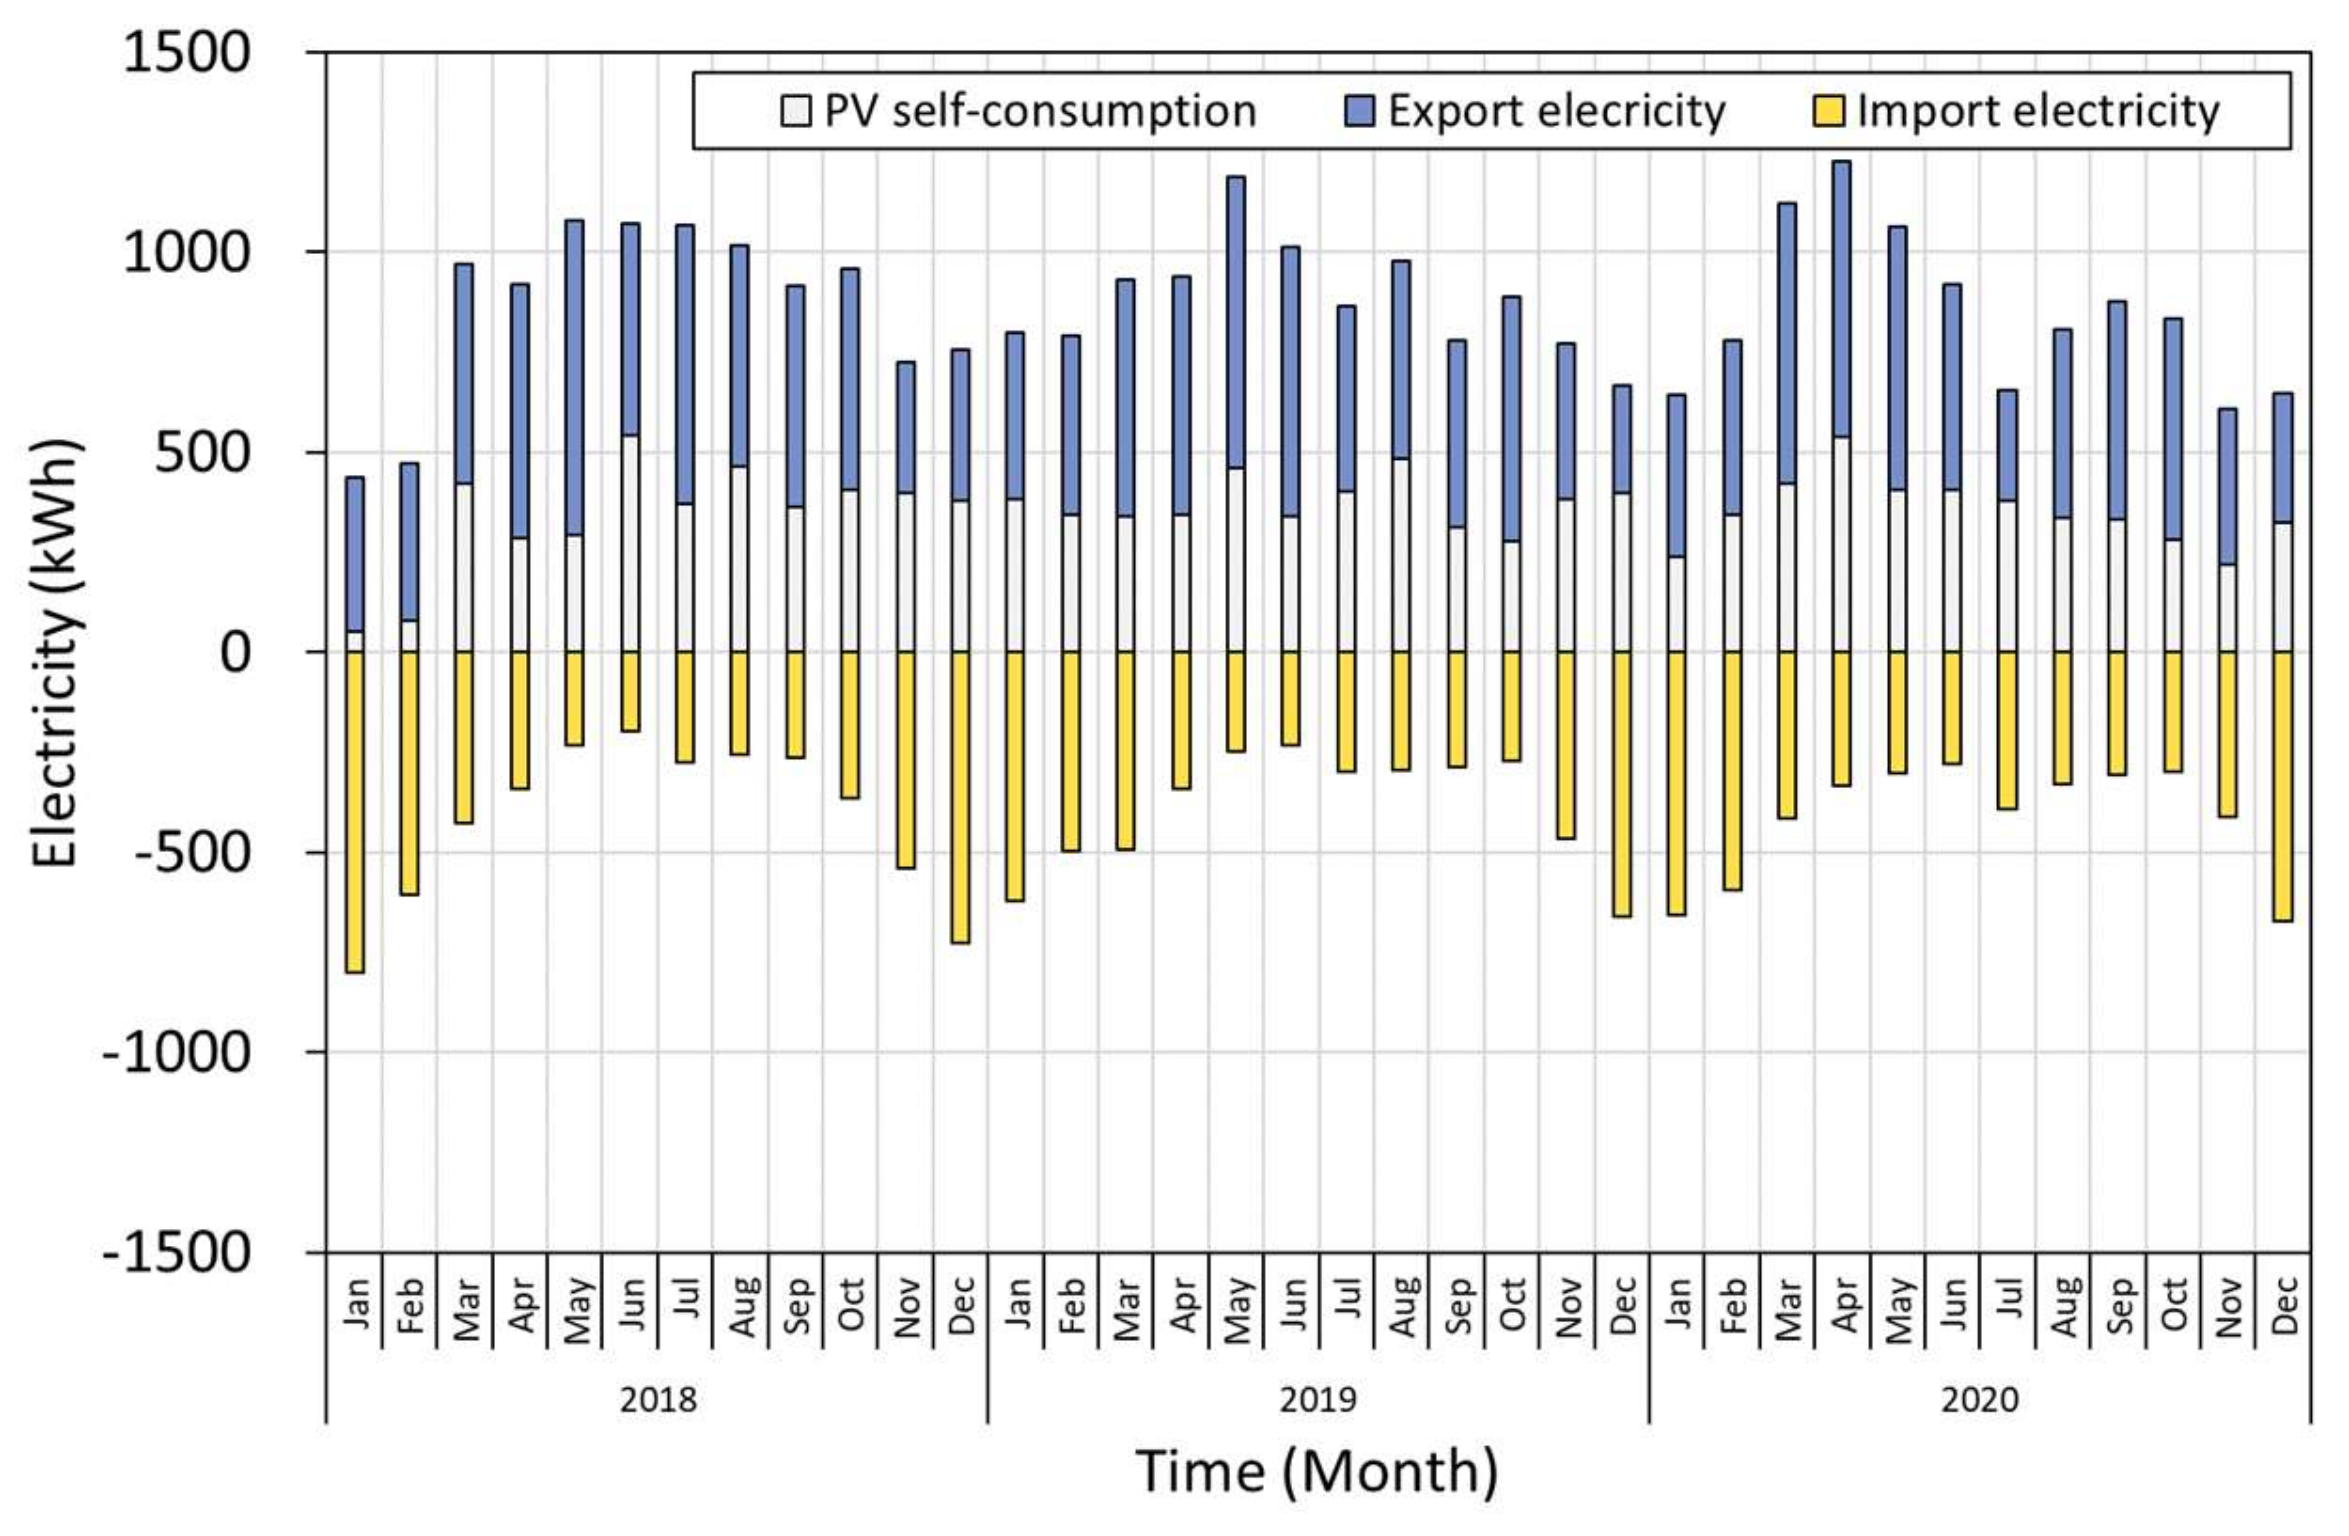
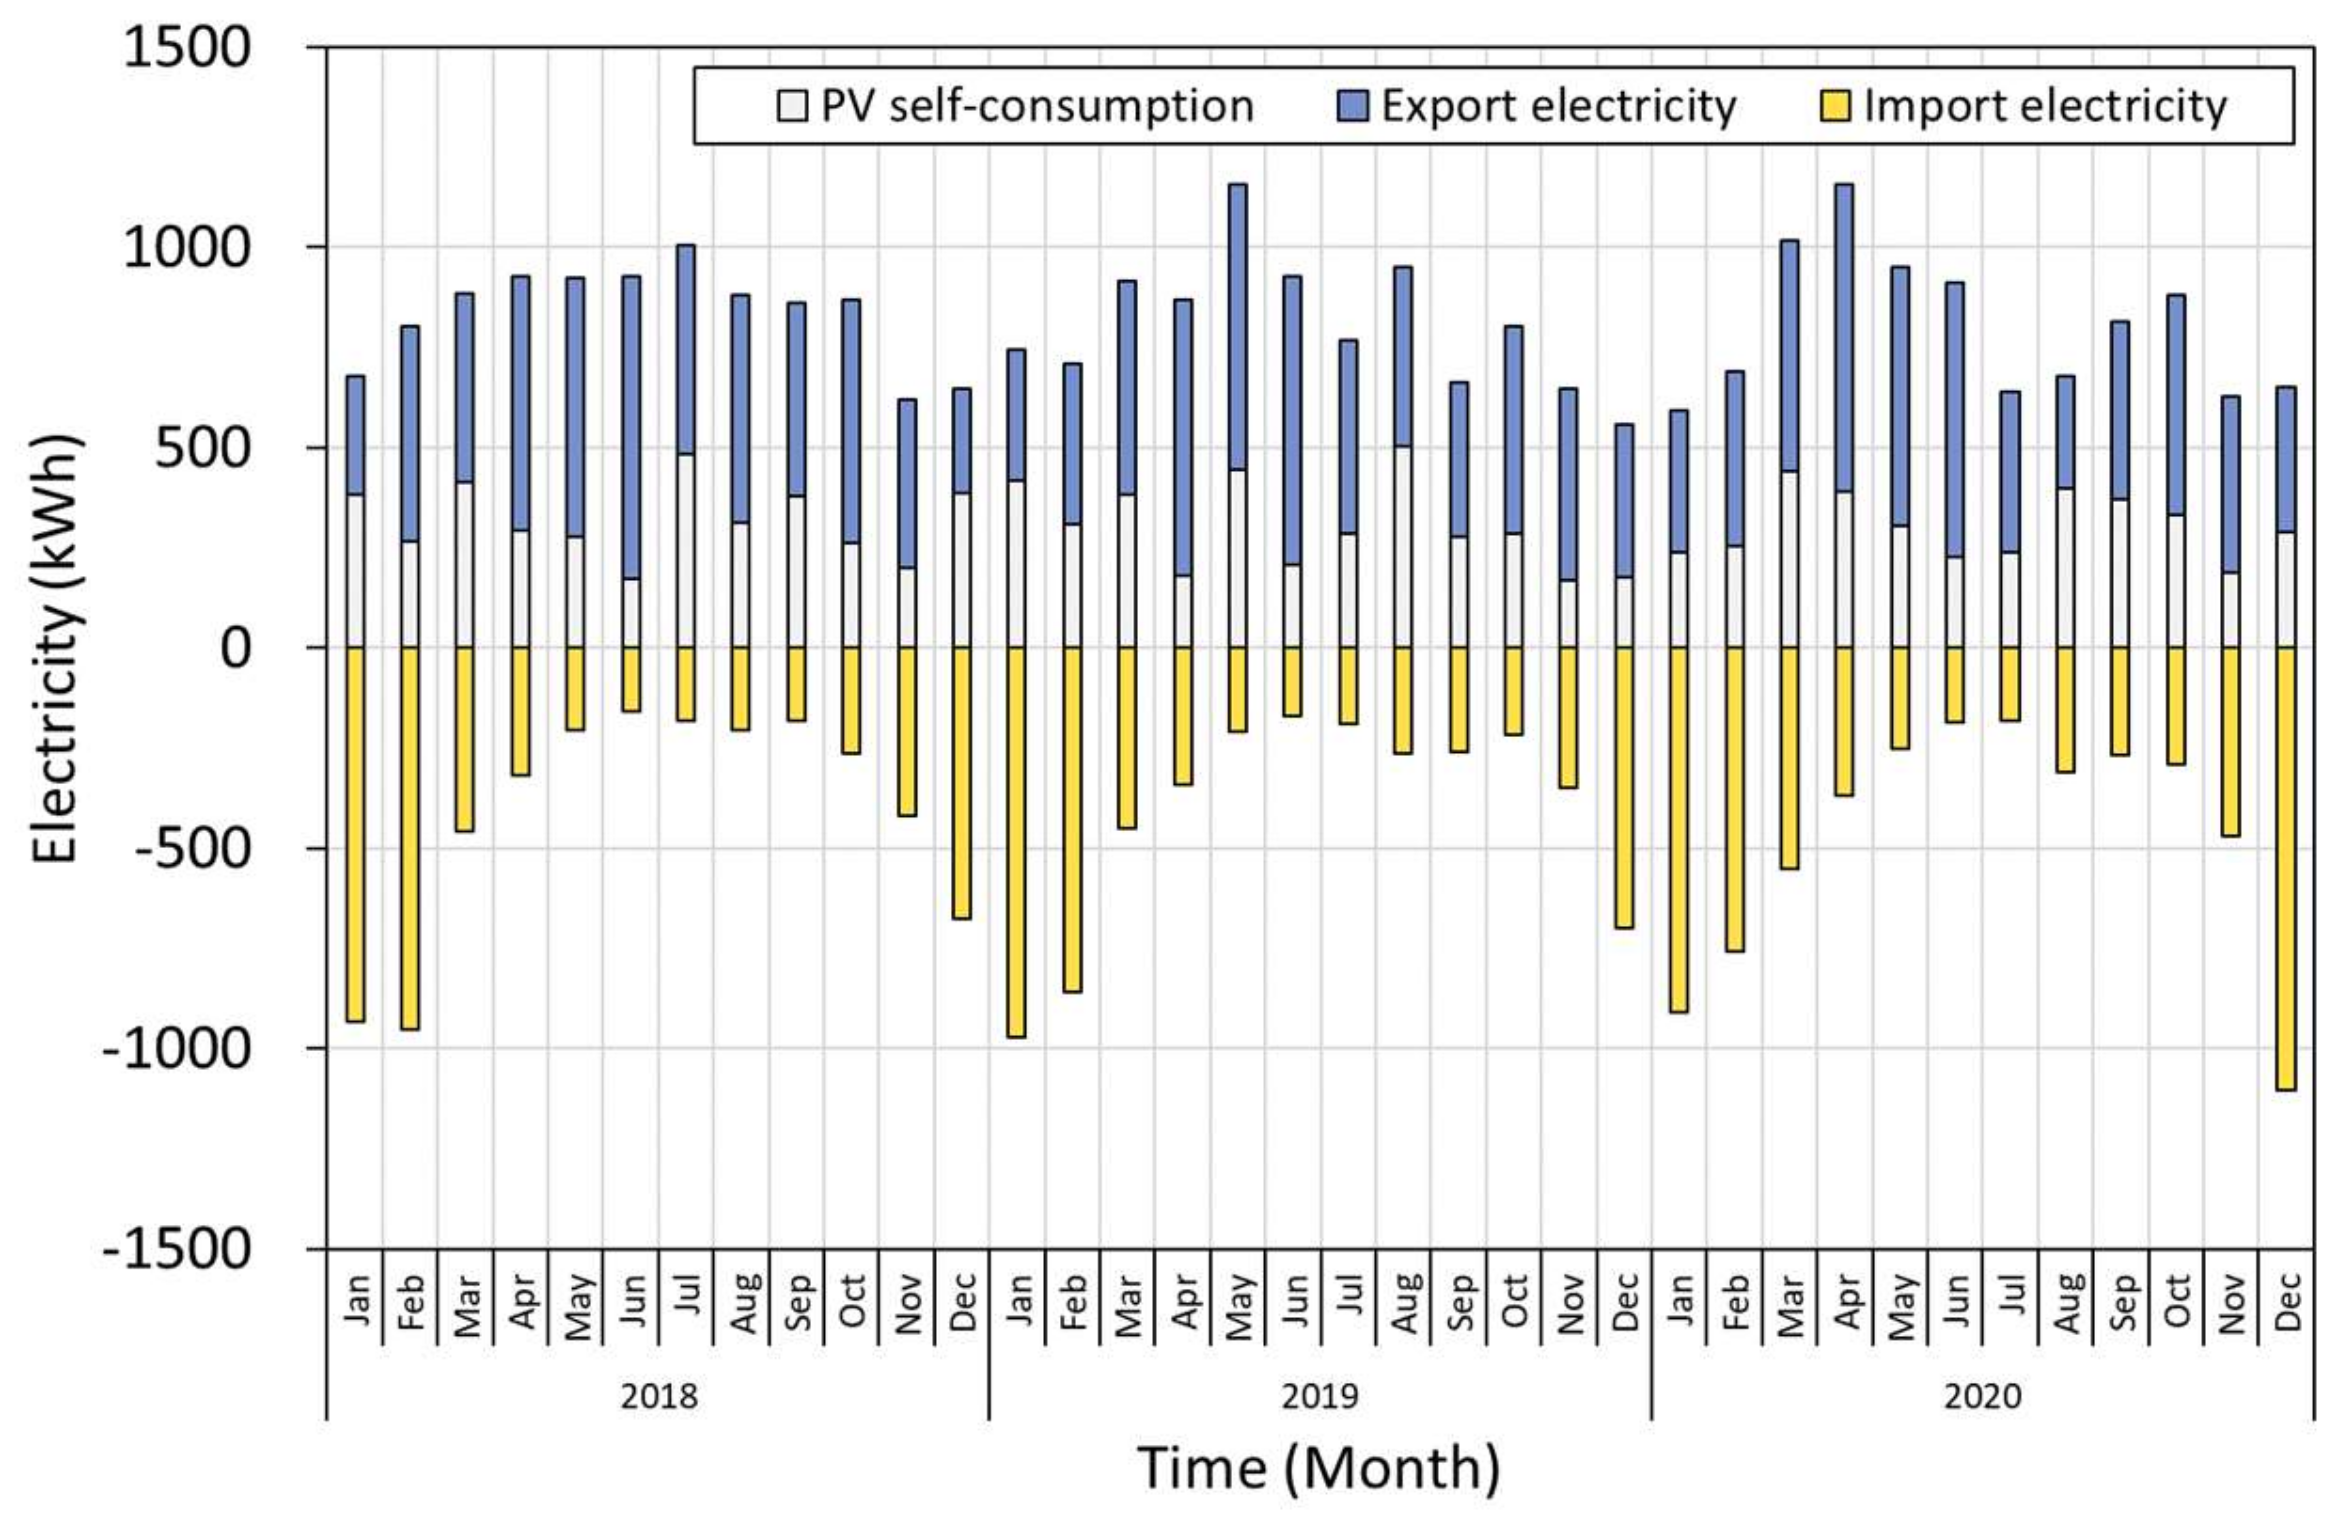
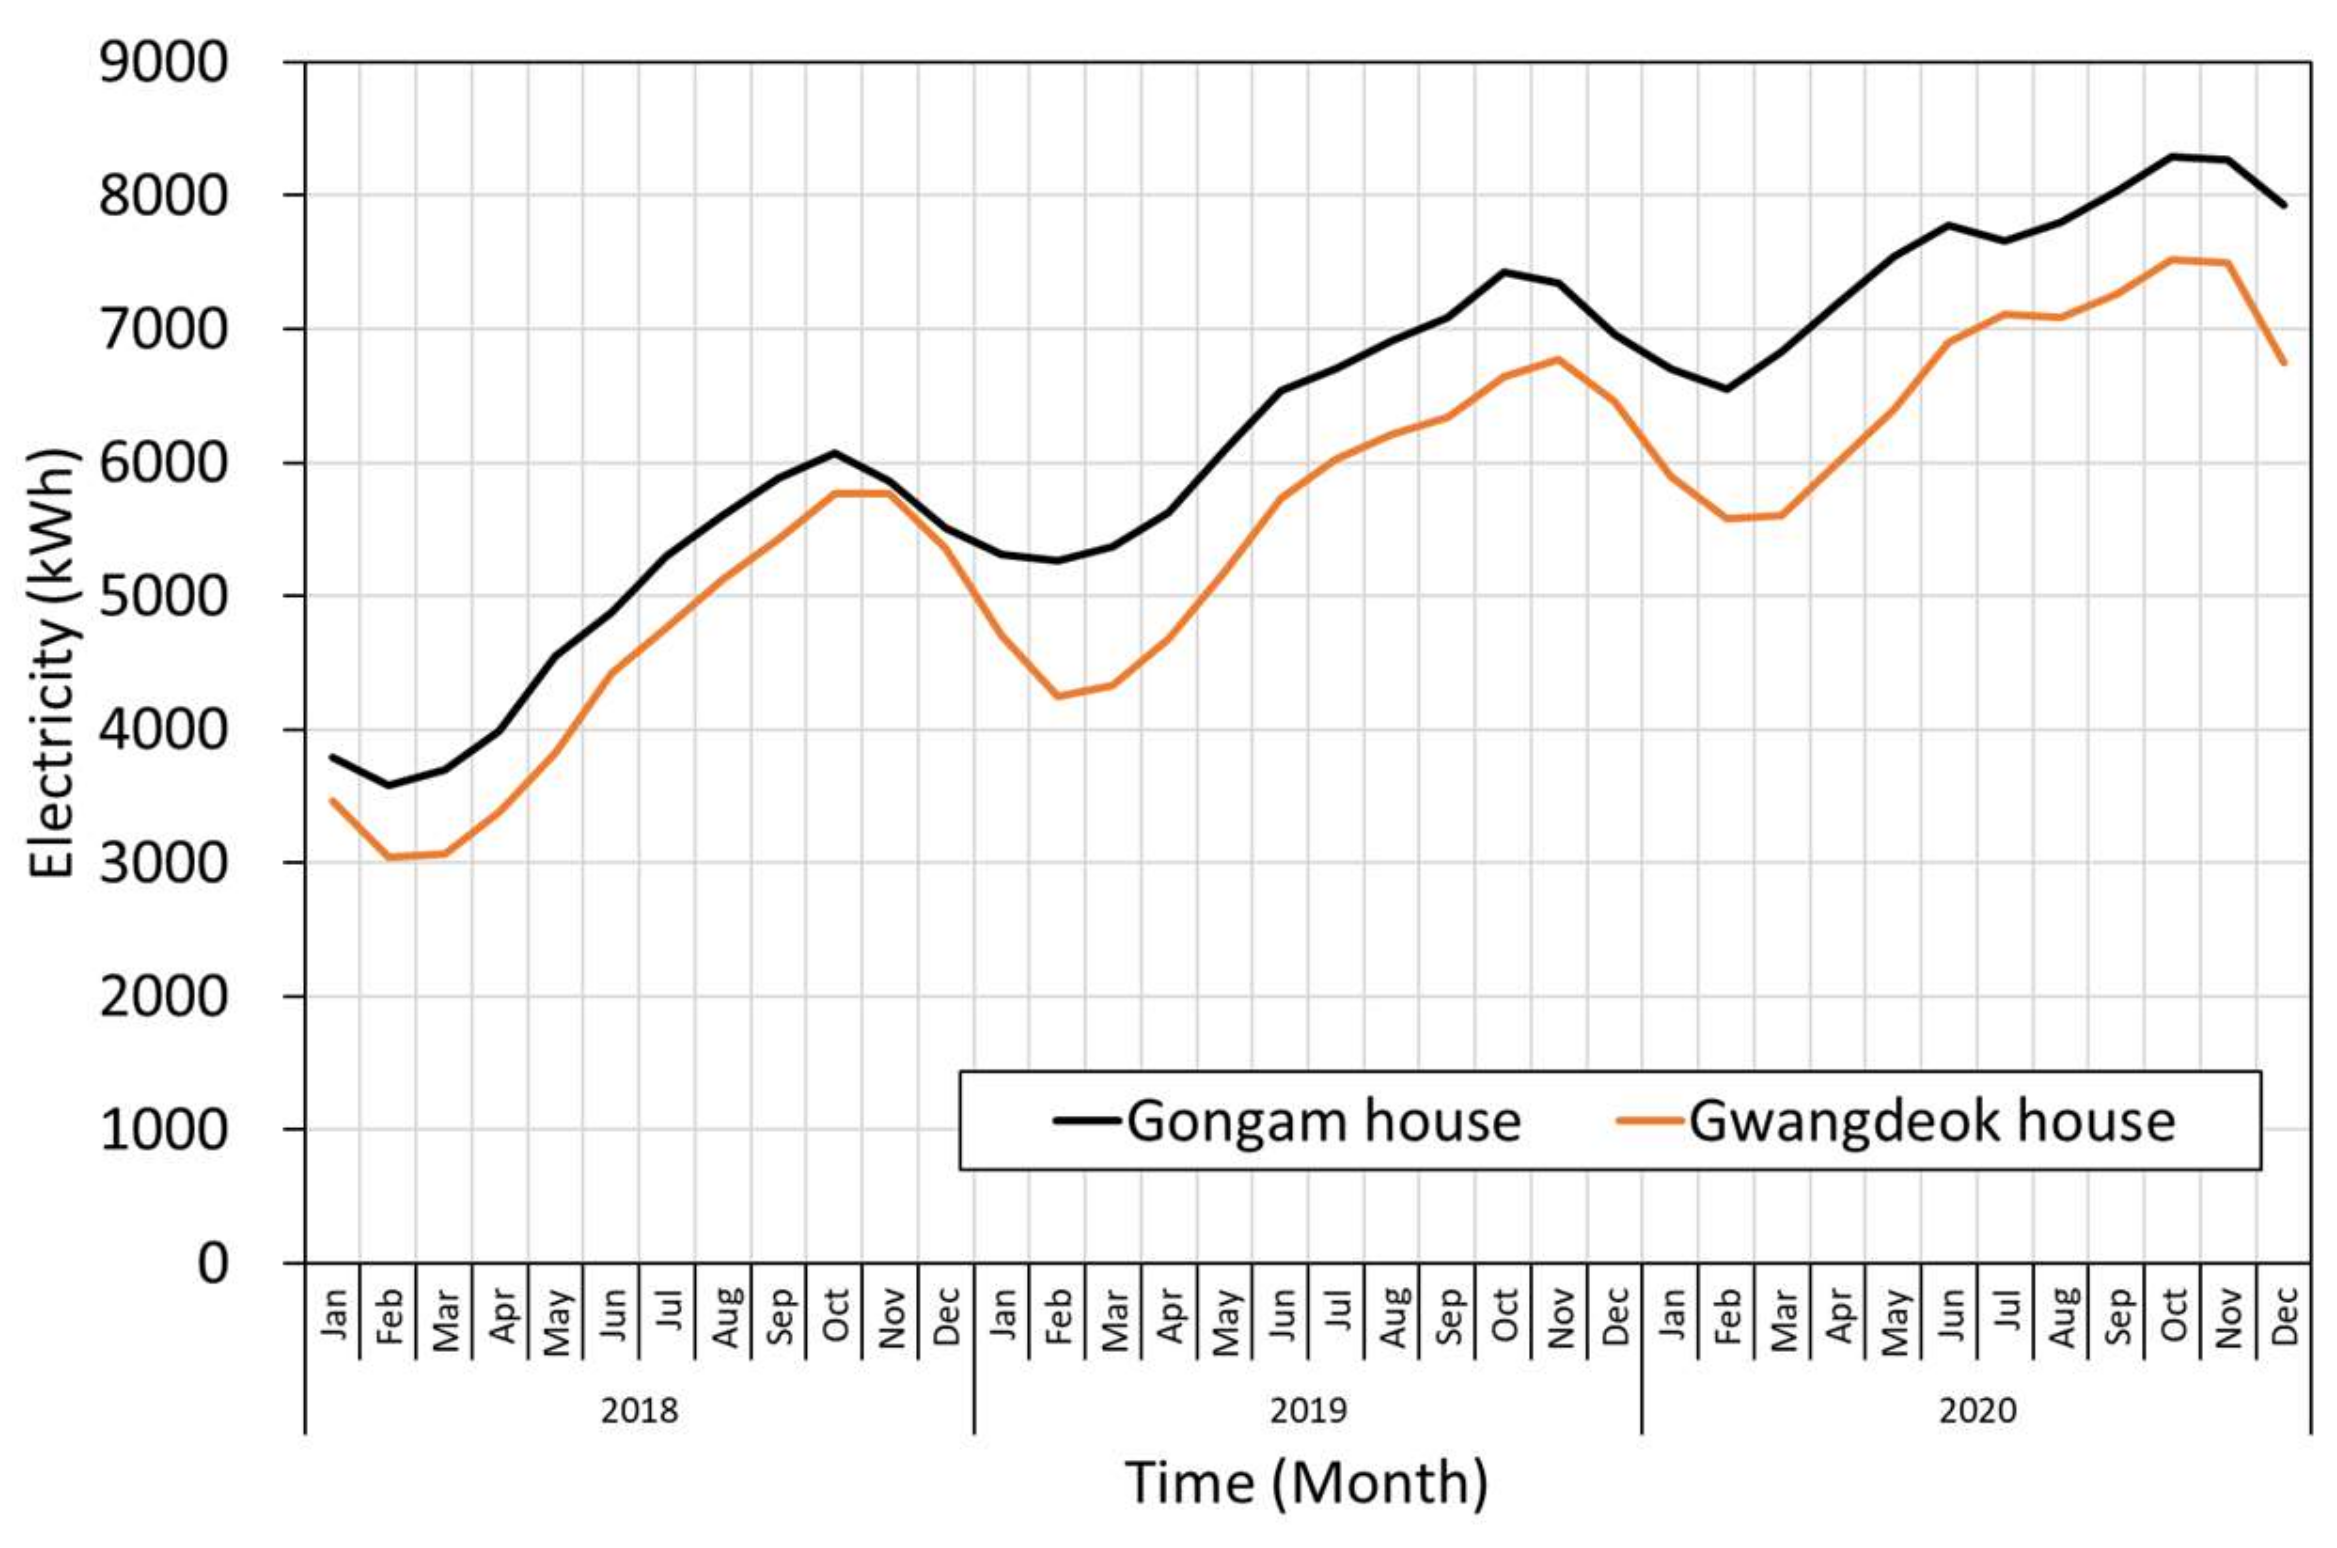
4.1. Analysis of Electricity

Figure 6 and Figure 7 show monthly export and import electricity and PV self-consumption of the two houses in the past three years. The imported electricity increased during winter and decreased in spring, while on-site PV generation decreased in winter and increased in spring, repeating every year. The maximum PV generation was 1228 kWh in April 2020, of which 537 kWh (44% of the total generation) was directly supplied to the electric load and the remaining 691 kWh was transmitted to the grid. While the minimum generation was 437 kWh in January 2018, 51 kWh (12% of the total) was directly consumed, and the remaining power was transmitted to the grid. The electricity consumption was the sum of import electricity and PV self-consumption, and it was the largest at 1102 kWh in December 2018 and the lowest at 525 kWh in May 2018. In Gwangdeok house, though electricity consumption was increased slightly in winter compared to Gongam house, consumptions were almost the same.
Table 4 shows the annual electricity distribution. The export of electricity in 3 years exceeded the imported electricity in both houses to realize net-zero energy. The average annual on-site electricity consumption and PV generation of Gongam house were 9157 kWh and 10,396 kWh, respectively, and the average annual surplus electricity of 1239 kWh was generated. Here, annual electricity consumption consisted of imported electricity of 4908 kWh and PV self-consumption of 4249 kWh, and the remaining 6157 kWh was transmitted to the grid. In Gwangdeok house, the average annual electricity consumption and PV generation were 8903 kWh and 9785 kWh, respectively—slightly reduced compared to those of Gongam house. Therefore, the resulting surplus electricity was on an annual average of 882 kWh. Meanwhile, among the annual electricity consumption, imported electricity was 5190 kWh, which increased by 5.7% compared to Gongam house.
Figure 8 presents the accumulated surplus electricity for the past 3 years. In both houses, the surplus electricity decreased due to the use of the electricity for space heating in winter, but it continuously increased in non-winter seasons, including summer. The total accumulated surplus electricity of the two houses for five years from the building completion date to December 2020 was 7925 kWh and 6750 kWh, respectively. This continuous increase in the amount of (accumulated) surplus electricity means that the PV system’s capacity is somewhat over the optimal spec in both houses.

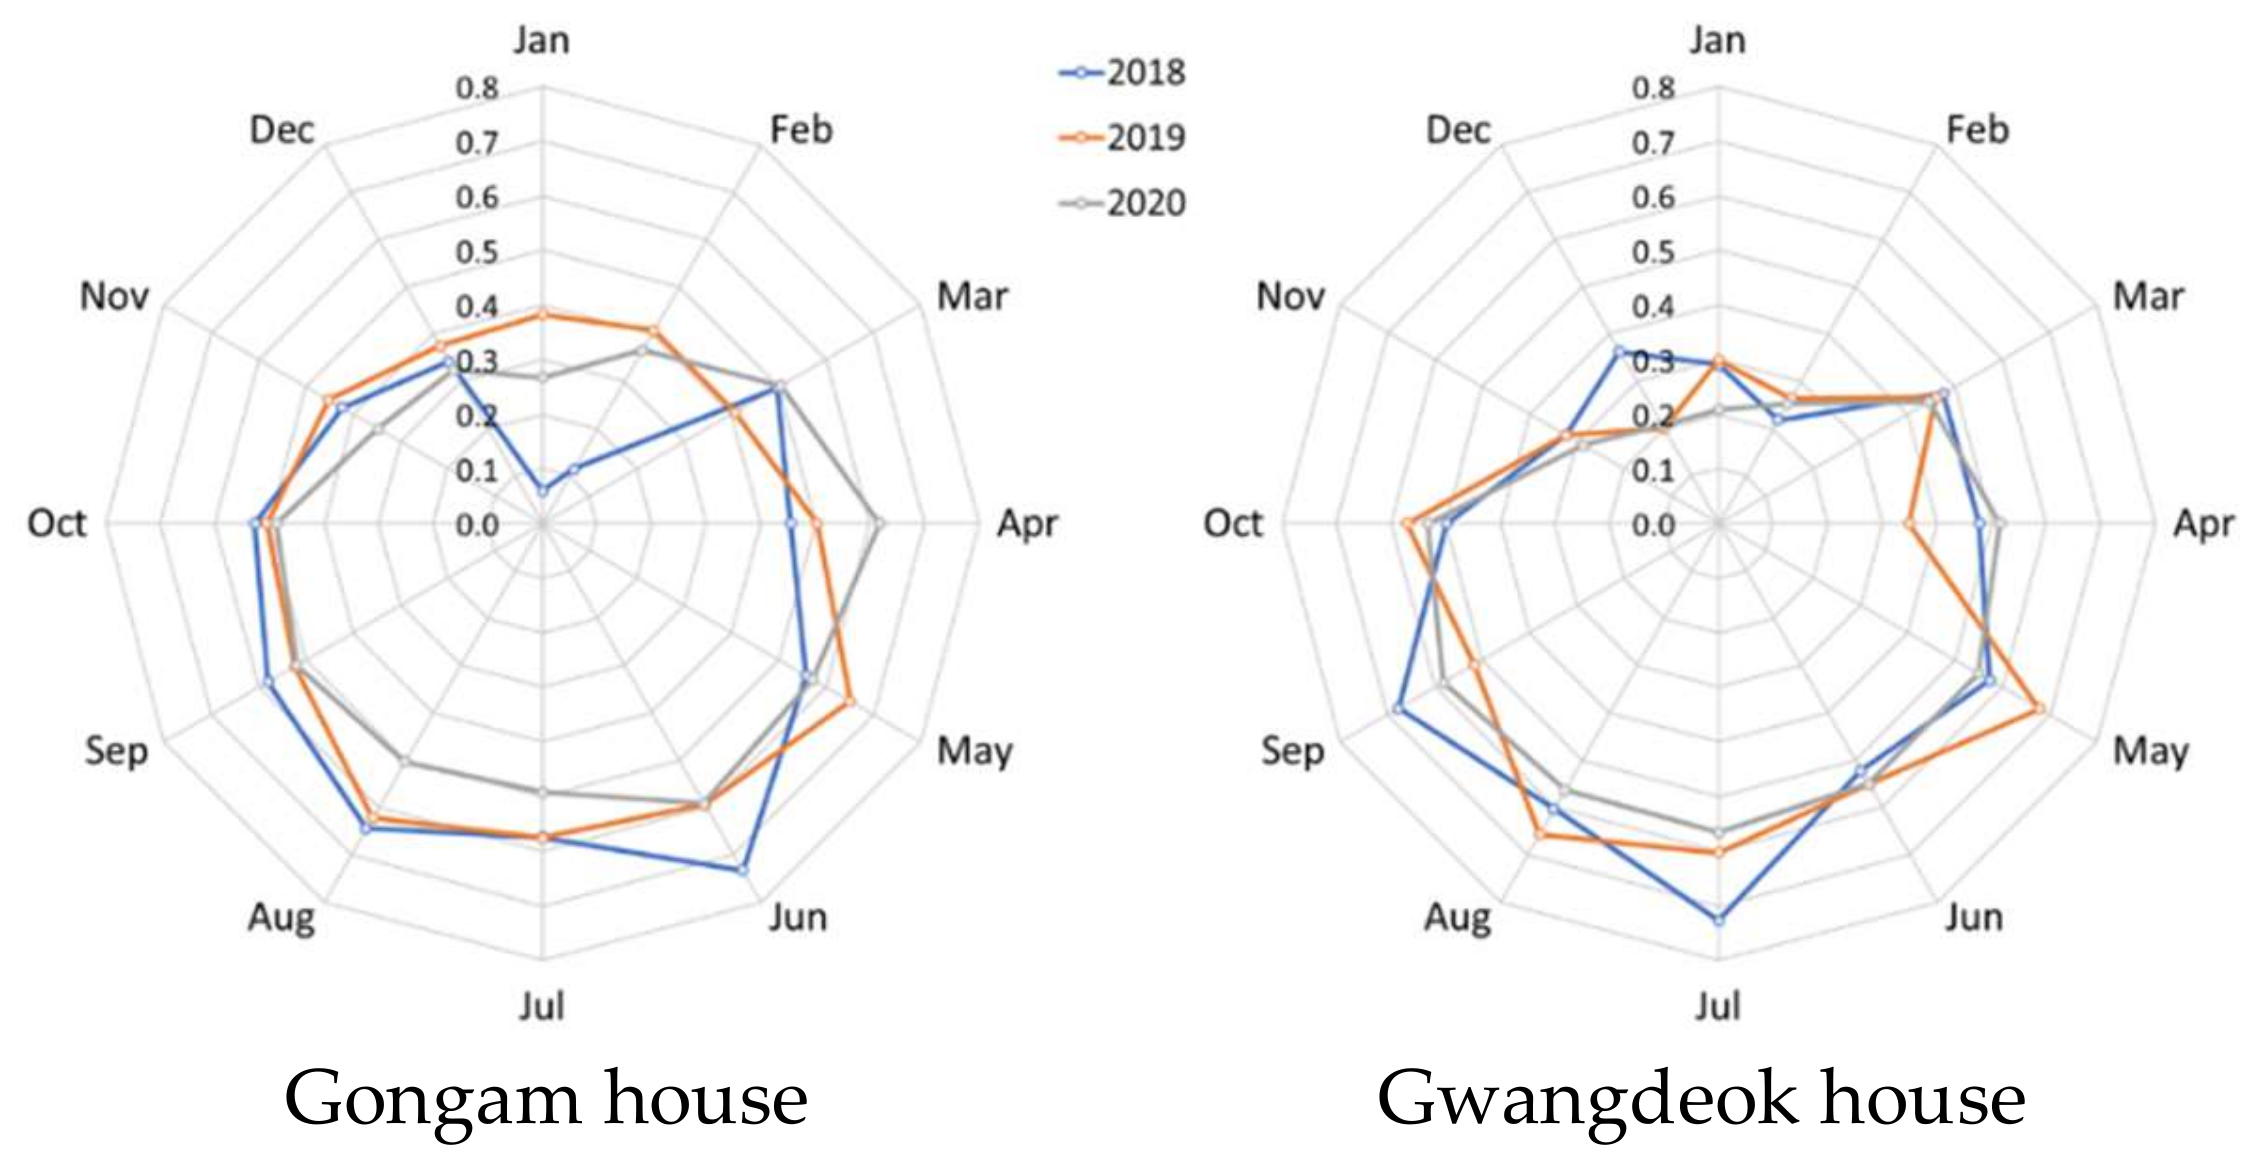
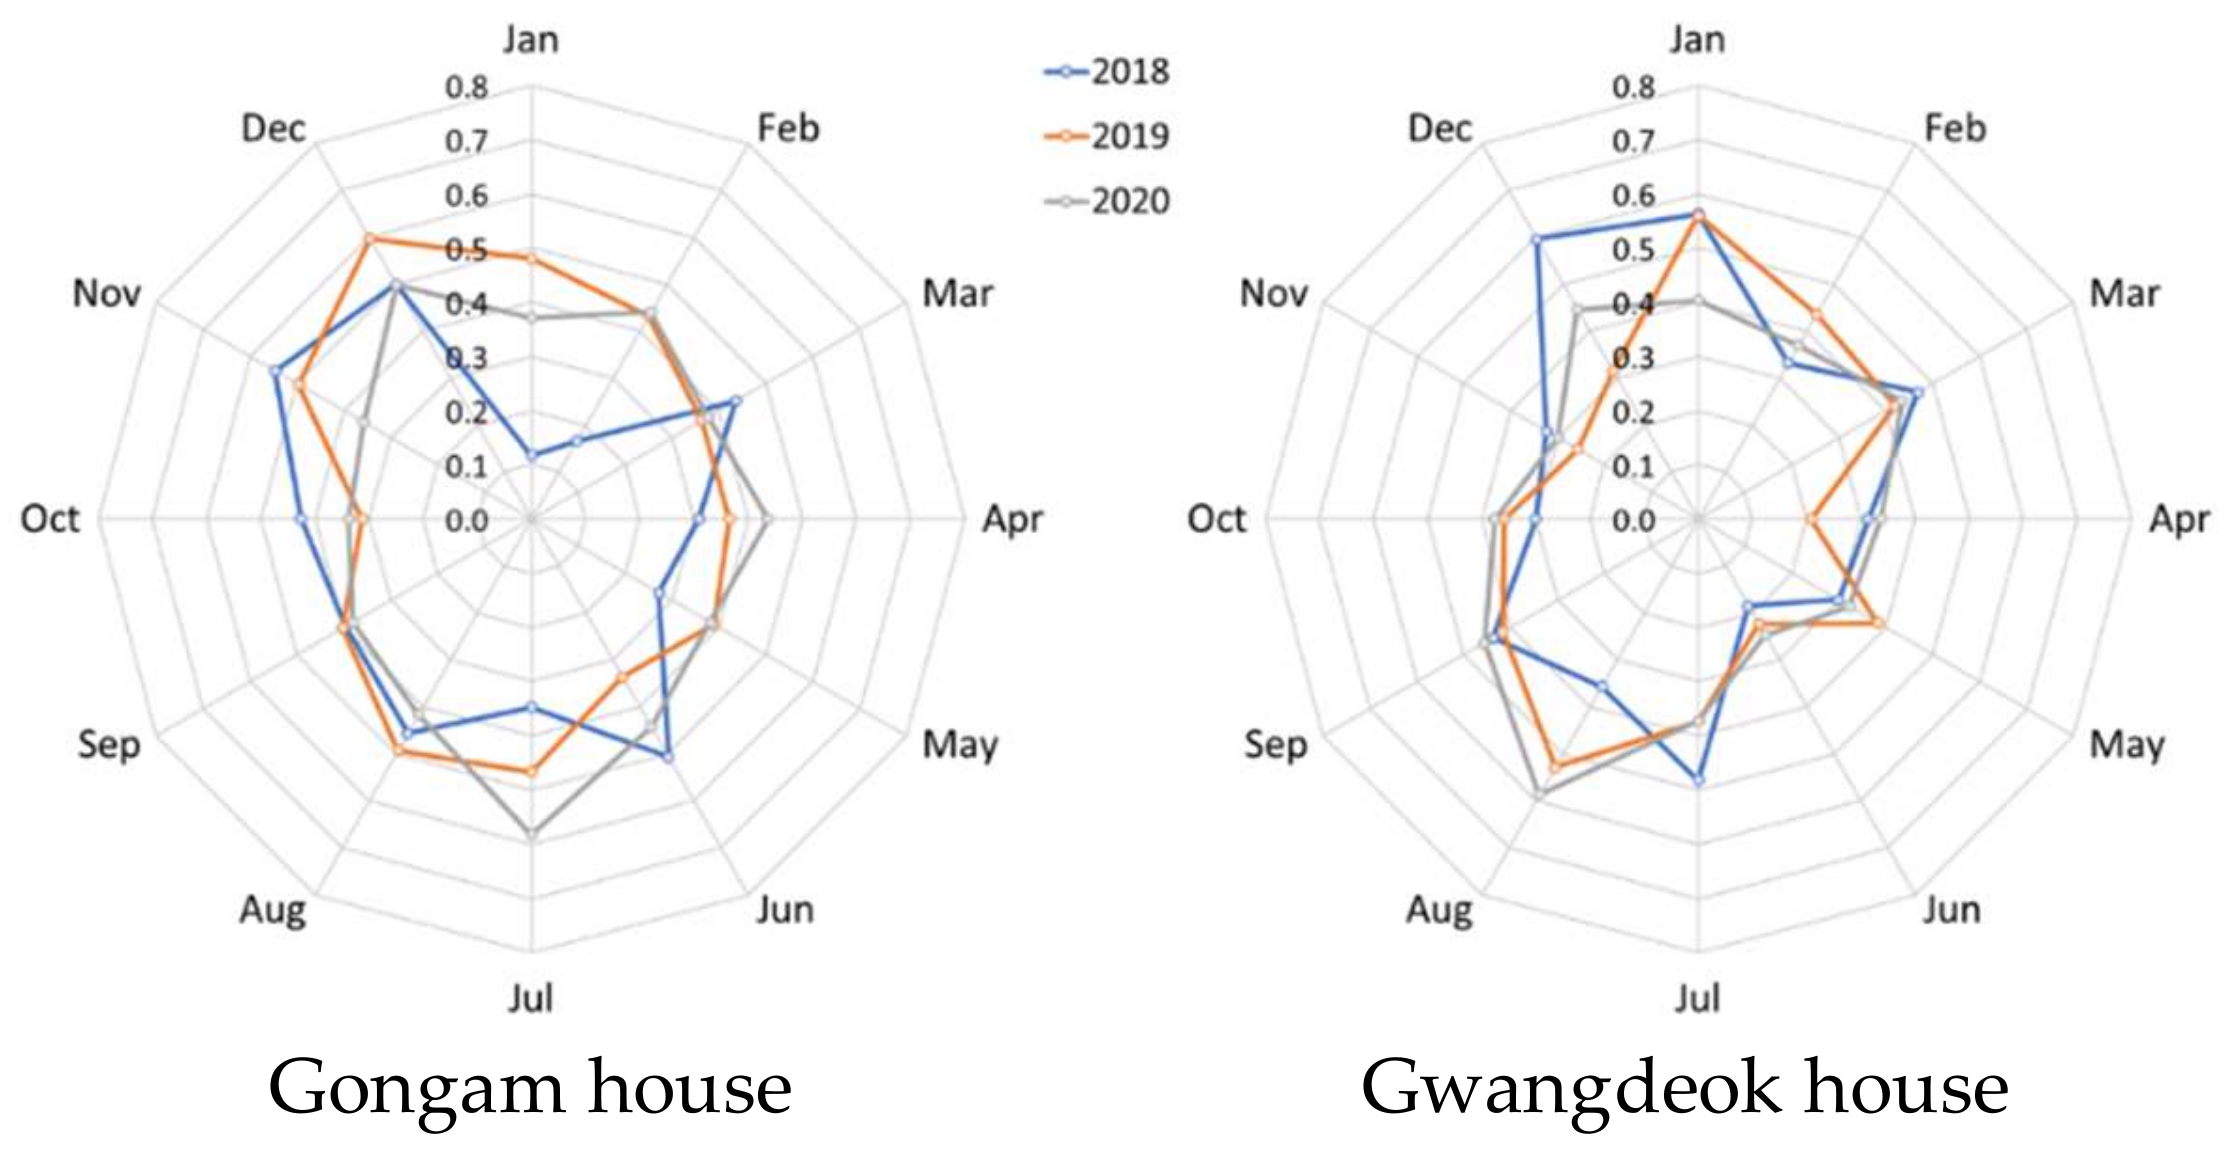
4.2. Load Match Index

Load cover factor ( f l o a d ) and supply cover factor ( f s u p p l y ) were calculated as Equations (1) and (2) as quantitative indices to evaluate the load-matching level for the two houses. The load cover factor refers to a ratio of demand supplied by on-site PV generation, while the supply cover factor is a ratio of on-site PV generation supplied to electric load in real-time [19].
f l o a d = m i n [   1 ,                     o n   s i t e   g e n e r a t i o n l o a d   ]  
f s u p p l y = m i n [   1 ,                     l o a d o n   s i t e   g e n e r a t i o n   ]  
Figure 9 shows the monthly load cover factor per year for the two houses calculated at 10 min intervals. The load cover factors of both houses were lower than 0.4 in winter (November–February), which was significantly less than that of summer at 0.6—attributed to the increases in the space heating electricity in winter. The annual load cover factor of Gongam house was in a range of 0.46–0.49, which was slightly higher than that of Gwangdeok house at 0.39–0.44.
Figure 10 shows the annual, monthly supply cover factors of the two houses. Unlike the load cover factor described above, the yearly seasonal changes were different between the two houses. The supply cover factor of Gwangdeok house in November and June was lower than 0.3, which was significantly lower than 0.6, the supply cover factor during December and August. Meanwhile, the supply cover factor of Gongam house was more than 0.3, except for January until February 2018, showing a relatively uniform distribution. The annual supply cover factors of Gongam house and Gwangdeok house for 3 years were 0.39–0.42 and 0.37–0.38, respectively. The above values are high compared to the load cover factors (0.22 and 0.25) of two NZEHs, confirmed by a previous study [20].

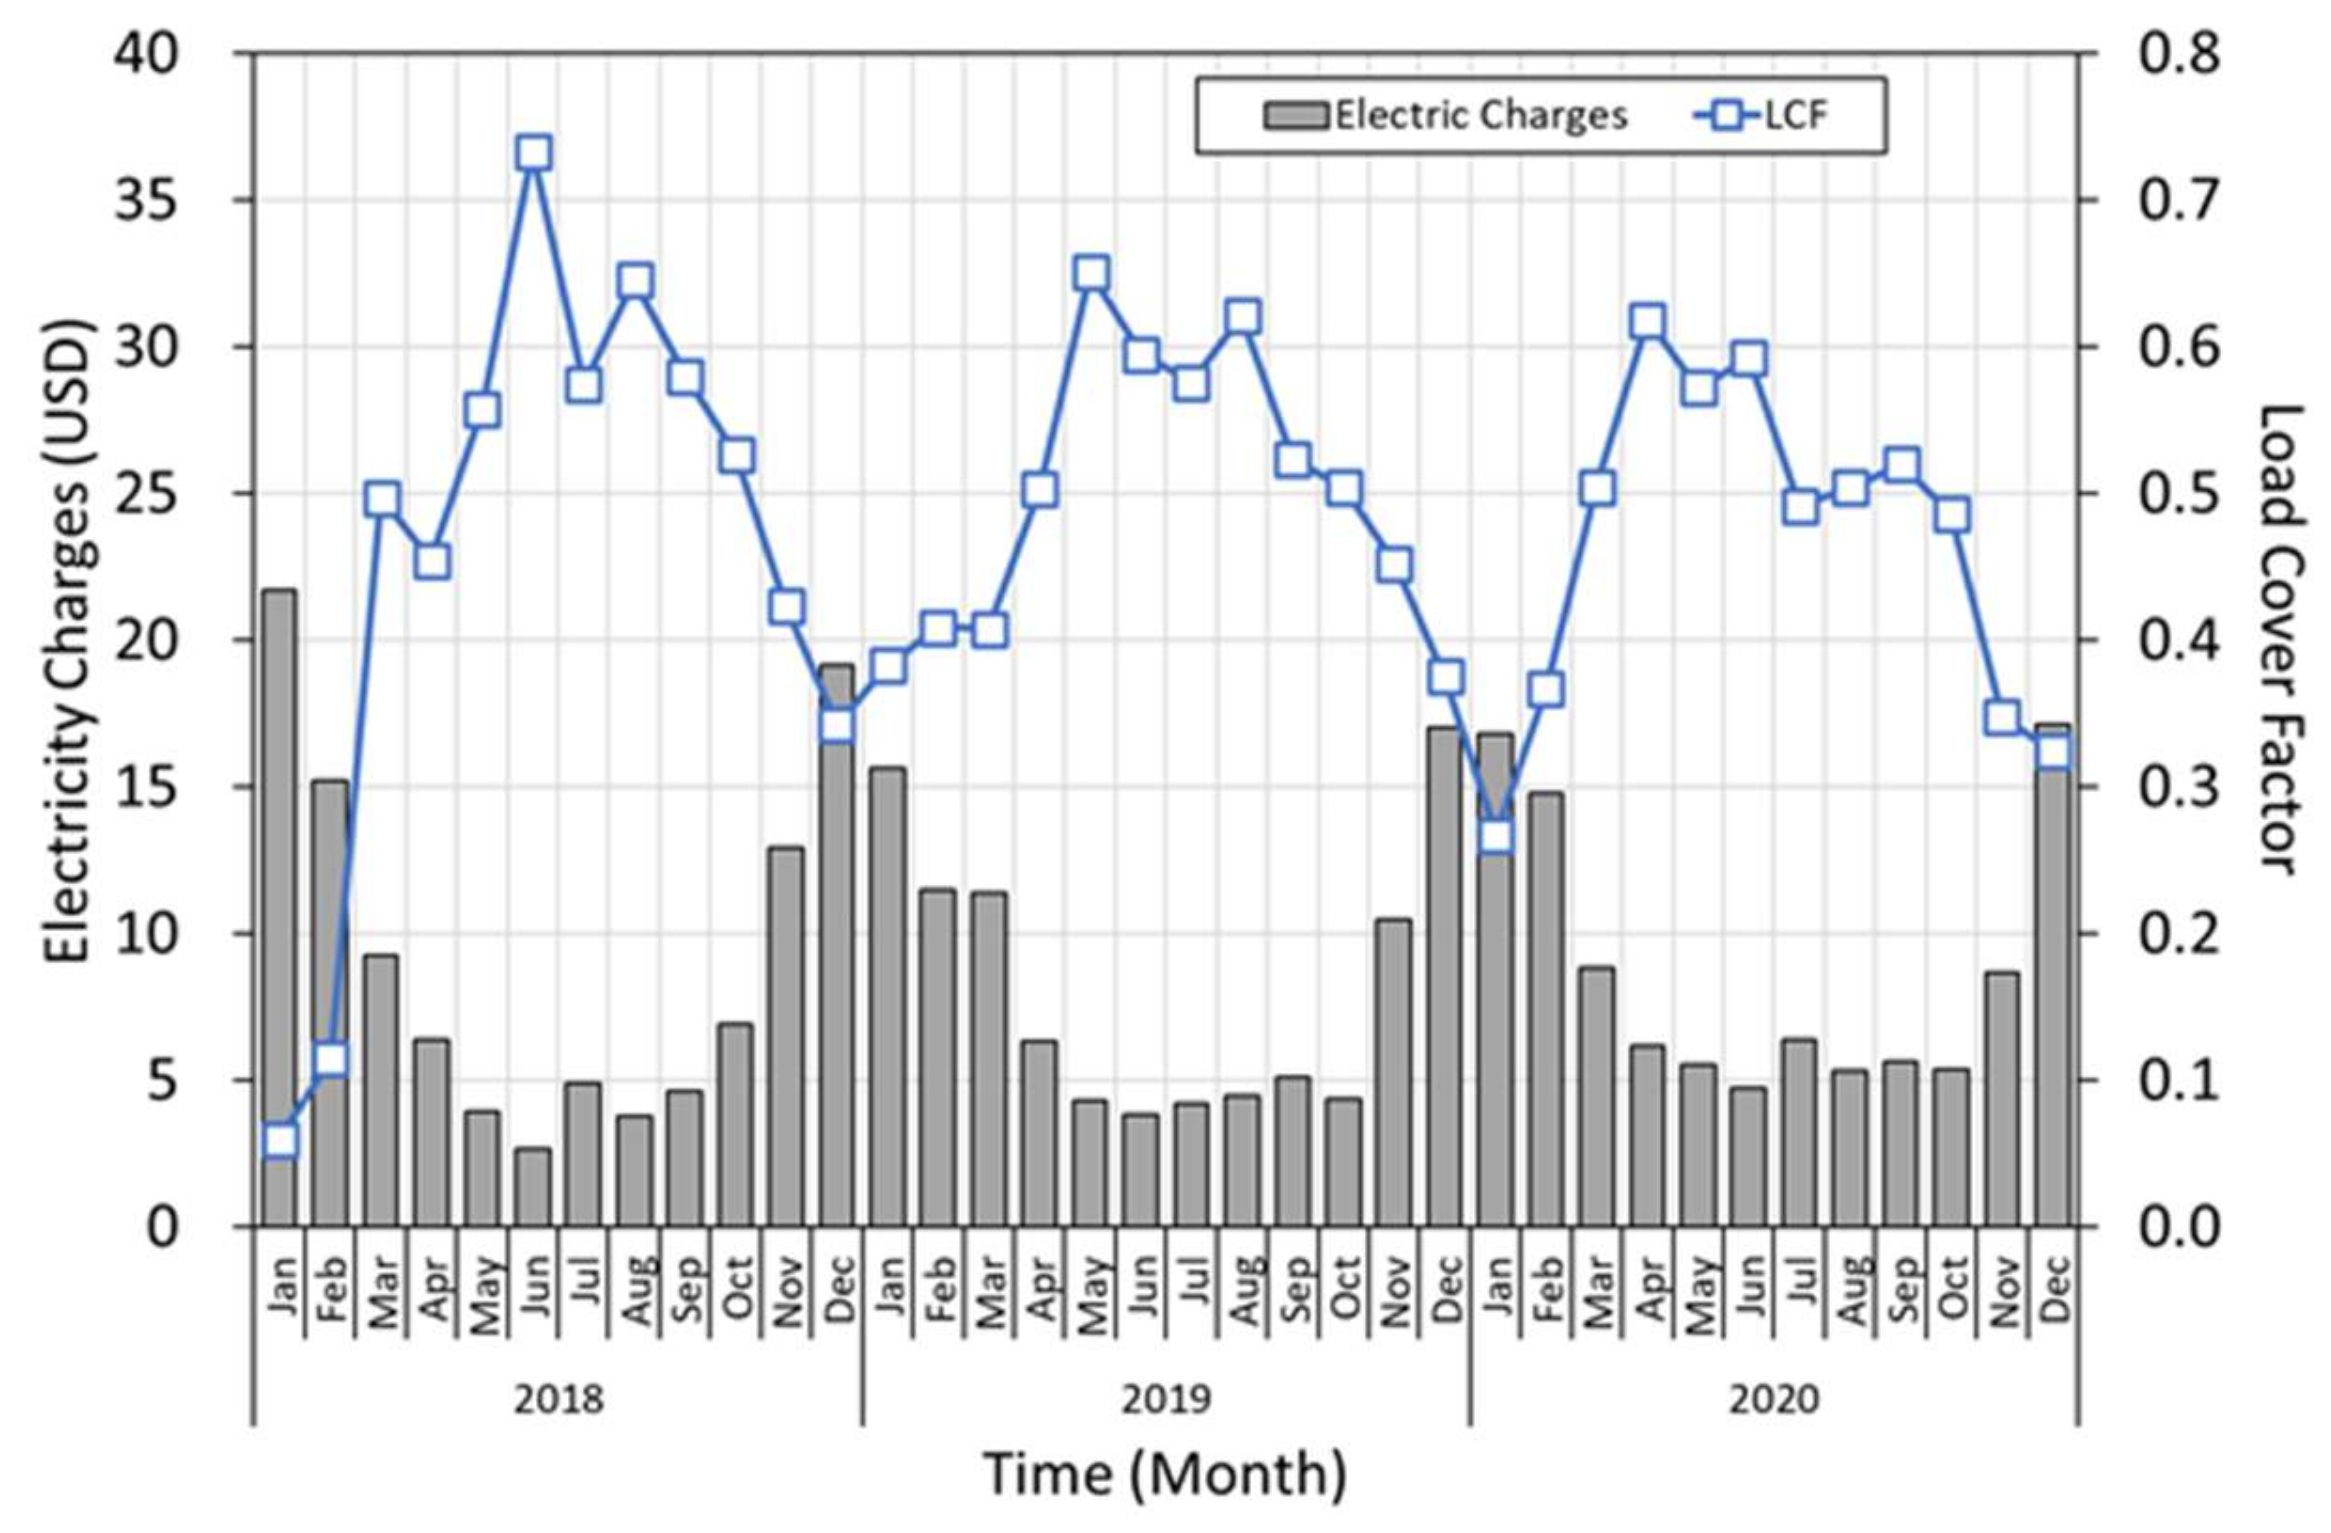
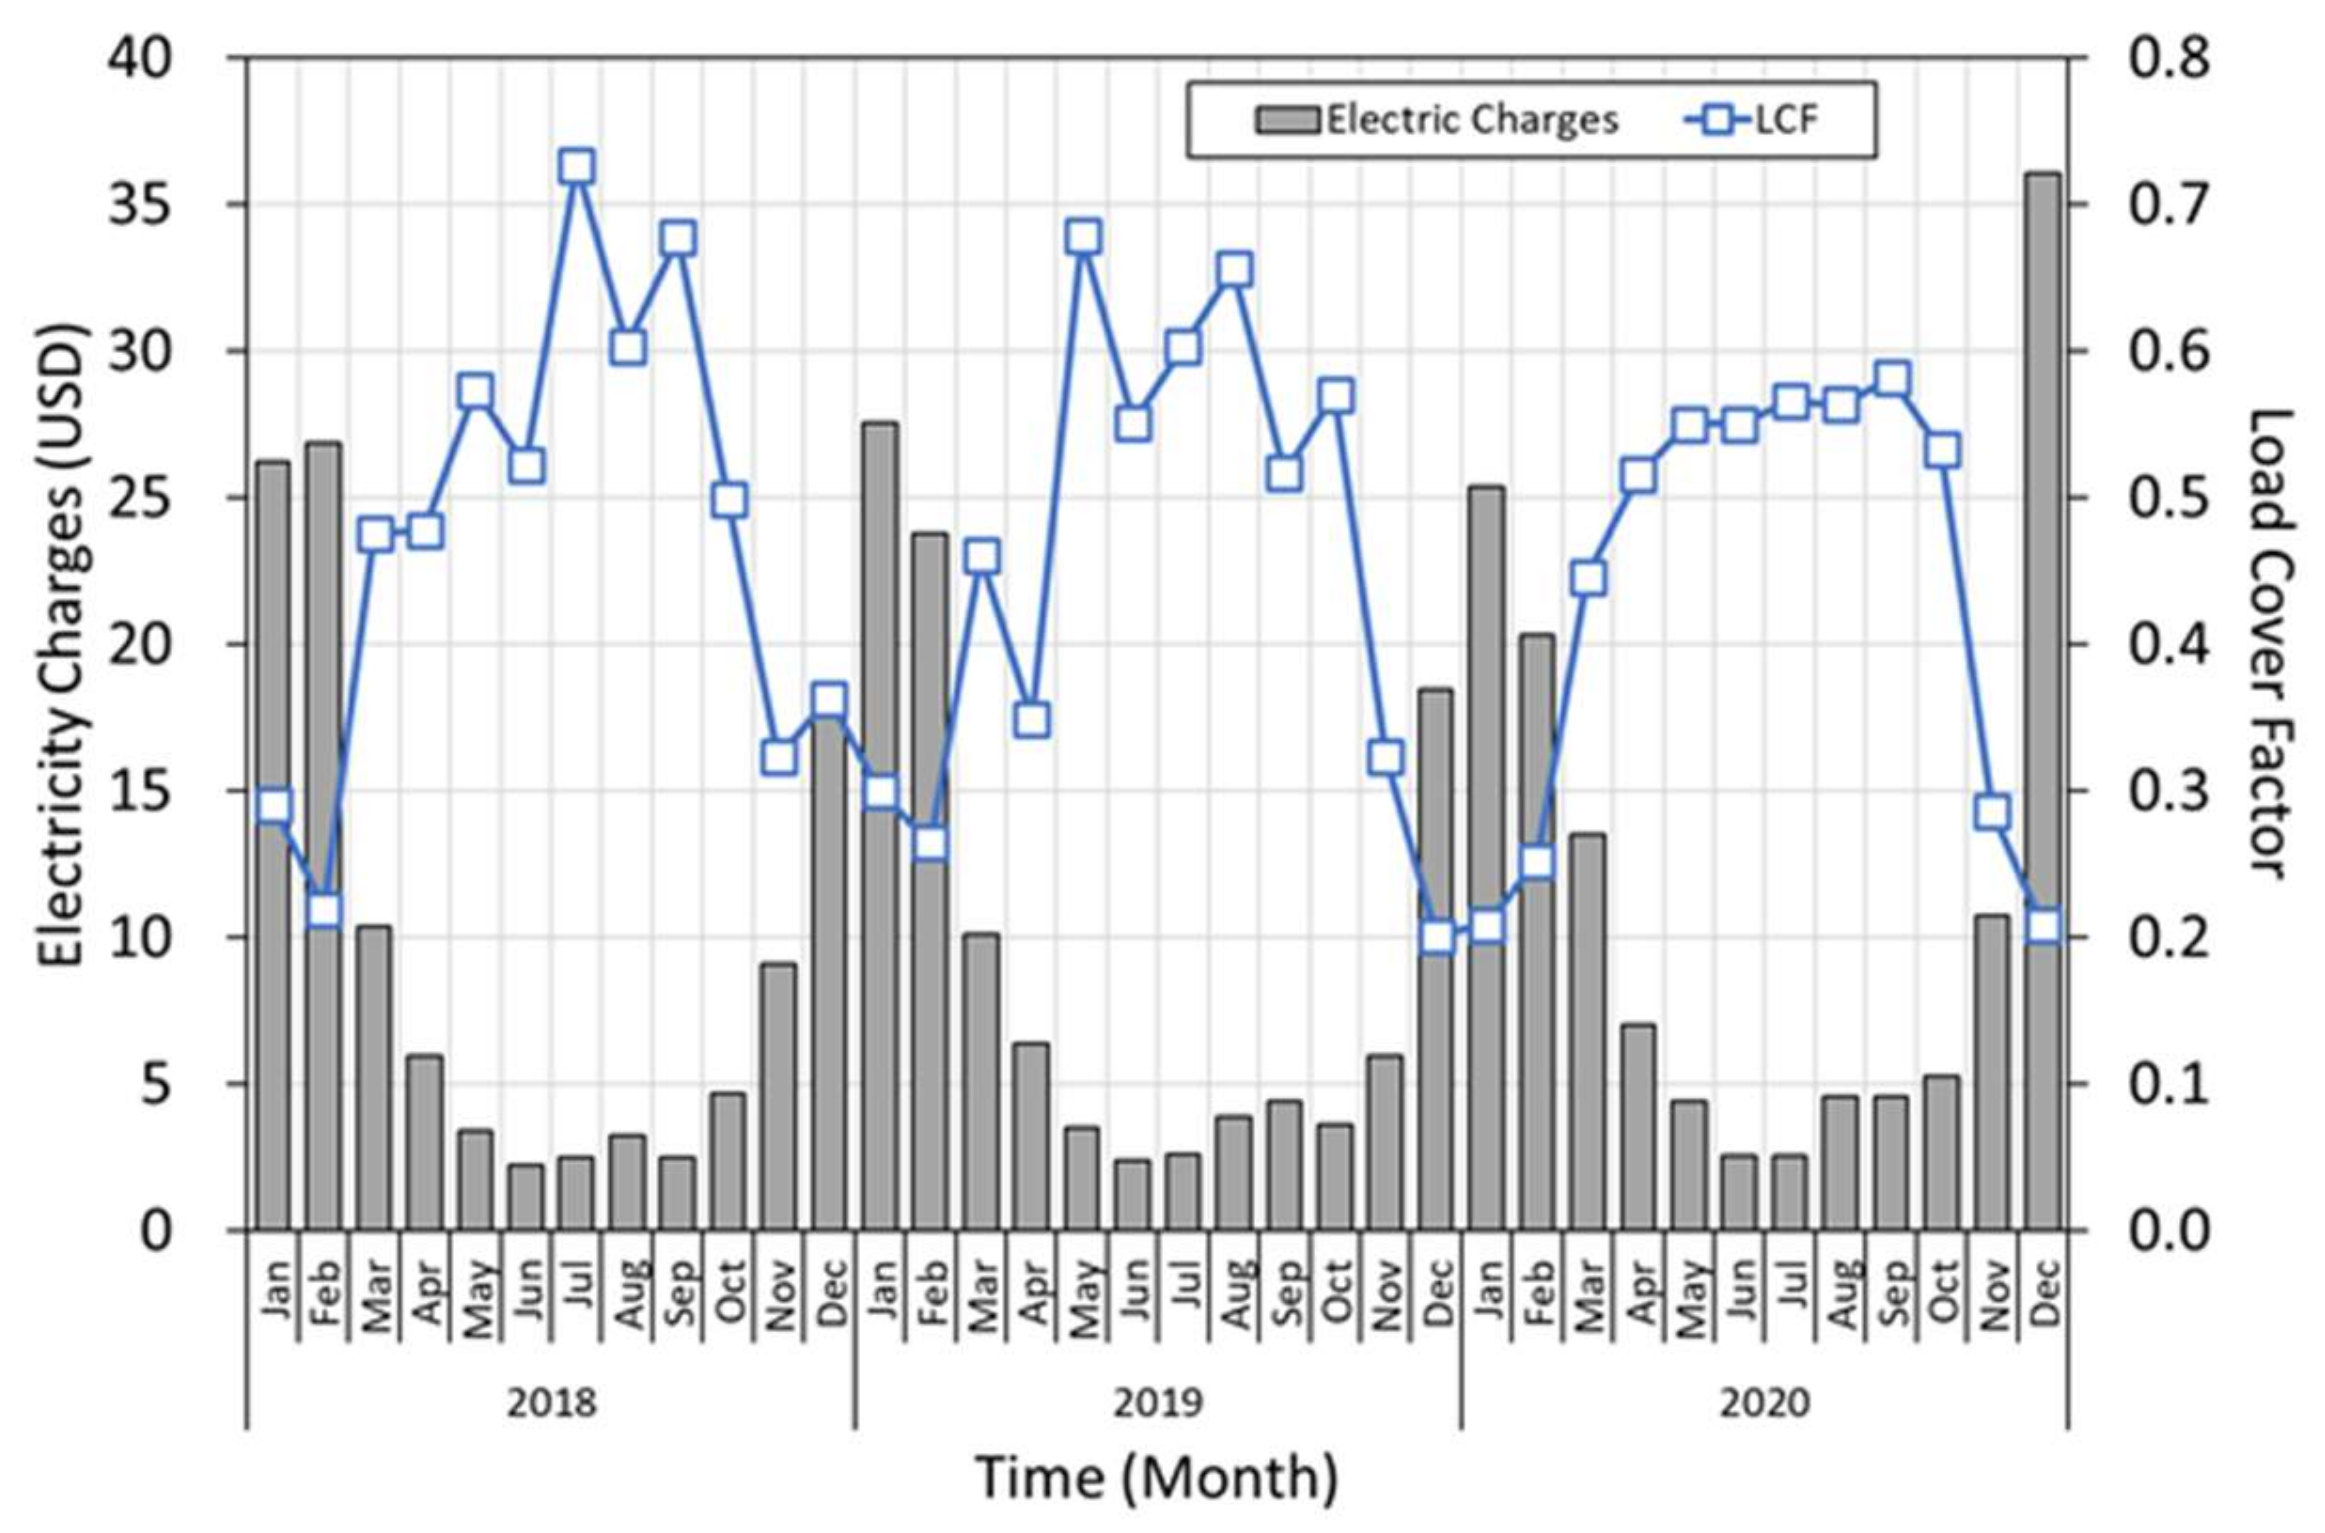
4.3. Analysis of Energy Cost

In the Korean residential electricity tariff structure, the surplus electricity carried over and the import electricity are offset, so that even when net-import electricity becomes “0”, demand charge, value-added tax for import electricity charges, and the Electric Power Industry Foundation Fund are charged. Table 5 shows the residential electricity tariff.
Figure 11 and Figure 12 present the monthly electricity bills and load cover factors of the two houses for 3 years. In the case of Gongam house in January 2018, the imported electricity of 802 kWh was offset by surplus electricity of 4209 kWh carried over from the previous month, and net-imported electricity became “0.” However, a total of USD 32.71 was charged, including demand charges (USD 5.26), value-added tax (USD 218 × 10% = USD 21.8) for import electricity charges (USD 218) and the Power Industry Infrastructure Fund (USD 218 × 3.7% = USD 5.66).
The electricity charges were almost linearly proportional to the import electricity (R2 = 0.9959), as shown in Figure 6 and Figure 7. On the other hand, the load cover factor was inversely proportional to the electricity charges (R2 = 0.7684). The higher the LCF, the lower the amount of power received and the lower the electricity rate.
Meanwhile, the average annual electricity bill for the past 3 years for Gongam house was USD 105.1, less than USD 121.4 for Gwangdeok house. This was because the amount was decided according to the imported electricity in net-zero energy conditions. On the other hand, the estimated annual average electricity bills when no PV system was installed in the same house were USD 1959 and USD 1888, respectively, and the energy cost reduction rates of the two NZEHs were 94% and 93%.
Currently, the outright cost of a typical PV system of 6 kWp is about USD 10,500 [21]. The simple payback period for investment in a PV system is expected to be just around 6 years. If incentives for a 3 kW PV system are applied, the payback period will be further reduced.

5. Conclusions

In this study, energy performance and energy costs were analyzed for two single-family houses that were planned with NZES from their initial design. These two houses were designed as all-electric houses, and a 6 kWp PV system and 16 kW air source heat pumps were installed for space heating and domestic hot water. The data acquisition system in each house was installed in 2017, which has since been monitoring electricity consumption and production. The analysis results are summarized below:
(1)
Two houses were realized as net-zero energy self-sufficient for all forms of energy, including cooking, electric appliance, and plug load for 3 years from 2018 to 2020.
(2)
The annual load cover factor and supply cover factor, calculated as load-match indices between generation and load, were analyzed, and these were in the ranges of 0.39–0.49 and 0.37–0.42, respectively. The higher the load cover factor, the lower the electricity rate.
(3)
Average annual electricity charges for two houses were USD 105.1 and USD 121.4, respectively. The energy cost reduction rate compared to the same houses without PV systems was about 95%, and the simple payback period of the 6 kW PV system in NZEH was estimated to be about 6 years.
Furthermore, when the current insulation regulation is applied, it is expected that there will be no additional construction costs for NZEH. It is also expected that the cost–benefit of NZEH could be maximized if the PV system capacity is determined by the energy consumption of individual users.

Author Contributions

Conceptualization, H.-W.L., J.-H.K., H.-S.L., and U.-C.S.; methodology, H.-W.L. and U.-C.S.; formal analysis, H.-W.L.; investigation, H.-W.L. and J.-H.K.; resource, J.-H.K., H.-W.L., H.-S.L., and U.-C.S.; writing—original draft, H.-W.L.; writing—review and editing, H.-W.L. and U.-C.S.; visualization, J.-H.K. All authors have read and agreed to the published version of the manuscript.

Funding

This research was supported by the Korea Institute of Energy Technology Evaluation and Planning (KETEP); granted financial resource from the Ministry of Trade, Industry & Energy, Republic of Korea (No. 20182010600110).

Institutional Review Board Statement

Not applicable.

Informed Consent Statement

Not applicable.

Conflicts of Interest

The authors declare no conflict of interest.

References

  1. Korea Energy Agency. Zero Energy Building Mandatory Roadmap. Available online: https://zeb.energy.or.kr/BC/BC02/BC02_02_001.do (accessed on 17 September 2021).
  2. Lee, J.-Y. Zero energy in all buildings in 10 years? Maeil Business News Korea, 20 June 2019. [Google Scholar]
  3. Korea Energy Agency. Zero Energy Building Certification Incentive System. Available online: https://zeb.energy.or.kr/BC/BC03/BC03_05_003.do (accessed on 17 September 2021).
  4. Marszal, A.; Heiselberg, P. Life cycle cost analysis of a multi-storey residential Net Zero Energy Building in Denmark. Energy. 2011, 36, 5600–5609. [Google Scholar] [CrossRef]
  5. Gowid, S.; Musharavati, F.; Hamouda, A. Cost Benefit Analysis of a Net-Zero Energy Housing in Qatar. J. Clean Energy Technol. 2019, 7. [Google Scholar] [CrossRef]
  6. Peng, C.; Huang, L.; Liu, J.; Huang, Y. Energy performance evaluation of a marketable net-zero-energy house: Solark I at Solar Decathlon China 2013. Renew. Energy 2015, 81, 136–149. [Google Scholar] [CrossRef]
  7. Zhou, Y.; Cao, S. Investigation of the flexibility of a residential net-zero energy building (NZEB) integrated with an electric vehicle in Hong Kong. In Proceedings of the 10th International Conference on Applied Energy, Hong Kong, China, 22–25 August 2018. [Google Scholar]
  8. Tiana, Z.; Zhang, S.; Li, H.; Jiang, Y.; Dong, J.; Zhang, B.; Yi, R. Investigations of Nearly (net) Zero Energy Residential Buildings in Beijing. In Proceedings of the 9th International Symposium on Heating, Ventilation and Air Conditioning (ISHVAC) and the 3rd International Conference on Building Energy and Environment (COBEE), Tianjin, China, 12–15 July 2015. [Google Scholar]
  9. Leckner, M.; Zmeureanu, R. Life cycle cost and energy analysis of a Net Zero Energy House with solar combi system. Appl. Energy 2011, 88, 232–241. [Google Scholar] [CrossRef]
  10. Wu, W.; Skye, H.M. Net-zero nation: HVAC and PV systems for residential net-zero energy buildings across the United States. Energy Convers. Manag. 2018, 177, 605–628. [Google Scholar] [CrossRef] [PubMed]
  11. Rezaee, R.; Vakilinezhad, R.; Haymaker, J. Parametric framework for a feasibility study of zero-energy residential buildings for the design stage. J. Build. Eng. 2021, 35, 101960. [Google Scholar] [CrossRef]
  12. Zhou, Y.; Cao, S. Quantification of energy flexibility of residential net-zero-energy buildings involved with dynamic operations of hybrid energy storages and diversified energy conversion strategies. Sustain. Energy Grids Netw. 2020, 21, 100304. [Google Scholar] [CrossRef]
  13. Baek, N.; Kim, S.; Oh, B.; Yoon, J.; Shin, U. Energy Performance Evaluation of Low Energy Houses using Metering Data. Korean J. Air-Cond. Refrig. Eng. 2015, 27, 369–374. [Google Scholar]
  14. Lim, H.W.; Yoon, J.H.; Shin, U. Annual Energy Performance Evaluation of Zero Energy House Using Metering Data. Int. J. Korea Inst. Ecol. Archit. Environ. 2015, 16, 113–119. [Google Scholar]
  15. Christian, J. How to Build a Zero Electric Utility Cost House. ACEEE Summer Study Energy Effic. Build. 2006, 1, 48–60. [Google Scholar]
  16. Stephan, A.; Stephan, L. Achieving net zero life cycle primary energy and greenhouse gas emissions apartment buildings in a Mediterranean climate. Appl. Energy 2020, 280, 115932. [Google Scholar] [CrossRef]
  17. Kosonen, A.; Keskisaari, A. Zero-energy log house—Future concept for an energy efficient building in the Nordic conditions. Energy Build. 2020, 228, 110449. [Google Scholar] [CrossRef]
  18. Stefanović, A.; Bojić, M.; Gordić, D. Achieving net zero energy cost house from old thermally non-insulated house using photovoltaic panels. Energy Build. 2014, 76, 57–63. [Google Scholar] [CrossRef]
  19. Voss, K.; Sartori, I.; Napolitano, A.; Geier, S.; Gonzalves, H.; Hall, M.; Heiselberg, P.; Widén, L.; Candanedo, J.A.; Musal, E.; et al. Load Matching and Grid Interaction of Net Zero Energy Buildings. In Proceedings of the EuroSun 2010, Graz, Austria, 28 September–1 October 2010. [Google Scholar]
  20. Salom, J.; Marszal, A.J.; Widén, J.; Candanedo, J.; Lindberg, K.B. Analysis of load match and grid interaction indicators in net zero energy buildings with simulated and monitored data. Appl. Energy 2014, 136, 119–131. [Google Scholar] [CrossRef]
  21. Yun, Y.-S.; Cho, K.-J.; Cho, D.-W. Economic Analysis of a Photovoltaic System for Zero-energy Multi-residential Houses. Korea Inst. Ecol. Archit. Environ. 2020, 20, 93–99. [Google Scholar]
Figure 1. Floor plan and south view of Gongam house.
Energies 14 06407 g001
Figure 2. Floor plan and south view of Gwangdeok house.
Energies 14 06407 g002
Figure 3. Schematic diagram of space heating and domestic hot water system.
Energies 14 06407 g003
Figure 4. Schematic diagram of grid-connected PV system.
Energies 14 06407 g004
Figure 5. Schematic diagram of the remote monitoring system.
Energies 14 06407 g005
Figure 6. Monthly consumption and generation distribution in Gongam house.
Energies 14 06407 g006
Figure 7. Monthly consumption and generation distribution in Gwangdeok house.
Energies 14 06407 g007
Figure 8. Monthly cumulative surplus electricity.
Energies 14 06407 g008
Figure 9. Monthly load cover factor.
Energies 14 06407 g009
Figure 10. Monthly supply cover factor.
Energies 14 06407 g010
Figure 11. Monthly electricity charges and load cover factor of Gongam house.
Energies 14 06407 g011
Figure 12. Monthly electricity charges and load cover factor of Gwangdeok house.
Energies 14 06407 g012
Table 1. Thermal performance of envelope. (Unit: W/m2 K).
Gongam HouseGwangdeok HouseNational
Building Code (2014–2015)
National
Building Code (2018–Present)
Passivhaus
Roof0.180.180.220.150.15
External wall0.180.210.340.170.15
Ground floor0.220.220.280.17N/A
Table 2. Specification of space heating and domestic hot water system.
ASHPHeatingNominal capacity16 kW
Nominal power3.81 kW
COP4.2
Buffer tank1000 L
DHW tank300 L
Table 3. PV system specifications.
ItemsGongam HouseGwangdeok House
PV modulePmax(Wp)250
Cell typeMono crystalline
Efficiency(%)15.2216.89
InverterEfficiency(%)96.79
Table 4. Electricity distribution. (Unit: kWh).
Year201820192020Mean
Gongam houseImport electricity5031470349904908
On-site PV generationSelf-consumption4051446842274249
Exported to the grid6337614459596147
Gwangdeok houseImport electricity4954497856375190
On-site PV generationSelf-consumption3827363736753713
Exported to the grid6207607759336072
Table 5. Electricity tariff for residential service.
Demand Charge (USD/Household)Energy Charge (USD/kWh)
~200 kWh0.63~200 kWh0.06
201–400 kWh1.09201–400 kWh0.12
401 kWh~5.26401 kWh~0.18
Publisher’s Note: MDPI stays neutral with regard to jurisdictional claims in published maps and institutional affiliations.

