Article

Changes in Electricity Production from Renewable Energy Sources in the European Union Countries in 2005–2019

by
Aleksandra Matuszewska-Janica
1,
Dorota Żebrowska-Suchodolska
1,*,
Urszula Ala-Karvia
2 and
Marta Hozer-Koćmiel
3
1
Institute of Economics and Finance, Warsaw University of Life Sciences—SGGW, Nowoursynowska 166, 02-787 Warsaw, Poland
2
Ruralia Institute, University of Helsinki, Kampusranta 9 C, 60320 Seinäjoki, Finland
3
Institute of Economics and Finance, University of Szczecin, Mickiewicza 64, 71-101 Szczecin, Poland
*
Author to whom correspondence should be addressed.
Energies 2021, 14(19), 6276; https://doi.org/10.3390/en14196276
Submission received: 9 August 2021 / Revised: 23 September 2021 / Accepted: 24 September 2021 / Published: 2 October 2021
(This article belongs to the Special Issue Renewable and Sustainable Energy: Current State and Prospects)

Abstract

:
The policy related to the use of renewable sources is a key element of the energy policy executed in the European Union (EU). One of the targets set for 2050 is to increase the share of electricity in energy consumption to 50%, and 80% of electricity is to be generated from low-carbon sources. In recent years, the EU economies have significantly modified their electricity production, which raises the question of the scale of these changes. The aim of the presented analysis is to assess changes in the use of renewable sources for electricity production in the EU countries in 2005–2019. Gini coefficient and k-mean are applied in the analysis. The conducted research shows that EU countries, in line with the energy policy assumptions, have both increased the share of renewable sources in energy production, especially in electricity production, as well as increased the diversity of used renewable sources. The results also indicate a vast diversity in terms of the use of such sources for the production of renewable electricity in the EU. This indicates that the energy transition is being implemented by EU countries with individual country-level approaches. Nonetheless, a variety of the EU’s both support and restrictive measures are of considerable importance for the ongoing energy transition.

Graphical Abstract

1. Introduction

The energy policy is one of the key pillars of the functioning of individual countries, as the energy sector is a driving force behind the economic development. The energy demand has been growing worldwide for many years, in line with the dynamic development of the economy on a global scale. This trend also continues in projections for the next decades [1]. Numerous actions have been taken around the world to accelerate the energy transition towards low-carbon economies using renewable energy sources (RESs). This is because, among other things, such an intensive use of energy products has negative effects on the environment, such as excessive exploitation of non-renewable energy sources and high emissions of harmful substances, including CO2, SO2, or nitrogen oxides. These problems are highlighted and discussed in References [2,3,4,5,6,7], among others. Such actions on a global scale include the United Nations Framework Convention on Climate Change (UNFCCC) [8] signed in Rio de Janeiro in 1992, and the Kyoto Protocol [9], which came into force to supplement the UNFCCC. However, the greatest intensification of energy transition activities has been observed in Europe.
The policy related to the use of renewable sources is a key element of the energy policy implemented in the European Union (EU). In a broader context, it is a pillar of activities undertaken in the implementation of the sustainable development goals. In the document “Next steps for a sustainable European future European action for sustainability” [10], the European Commission (EC) has outlined goals to be achieved by 2030. Among the 17 goals, there are two that relate directly to the energy sector. The first one concerns ensuring access to energy sources that are, above all, affordable, reliable, and sustainable. The second of these goals concerns acting to mitigate climate change and its impacts. In another document, “Clean energy for all Europeans” [11], the EC has set a target of 50% of electricity in total EU energy consumption in 2050. Furthermore, 80% of the electricity is to be obtained from renewable sources or nuclear energy. This means that electricity will gain importance, and ultimately, it will be the key source of energy in the EU. The policy of moving towards low-carbon economies also means that the main burden of electricity production will be on renewable sources.
Eurostat’s statistics clearly show that while electricity consumption has not increased significantly in recent years, the changes that have taken place in electricity production are significant. Firstly, the share of renewable sources in electricity production has increased significantly, from 16.3% in 2005 to 34.6% in 2019. Secondly, the diversification of renewable sources used has increased across the EU countries. Currently, wind energy has the largest share among renewable energy sources. In line with “EU Strategy to harness the potential of offshore renewable energy for a climate neutral future” [12], further intensive development of wind energy technology is planned in particular in marine areas. Solar energy is also gaining importance. From the perspective of the consumer, internal business processes, the development and financial aspects, solar and wind energy are considered the most competitive renewable sources in electricity production [13].
Therefore, the question arise what changes have occurred in the use of renewable sources in the production of electricity in the EU countries. In particular, the period of interest is 2005–2019. The beginning of this period was selected for two reasons. First, 2005 was the first full year in the EU after its largest enlargement. Second, when analyzing the statistics, since 2005, the greatest progress in the use of renewable sources in the EU can be observed. The end of the study period is related to the availability of data at the time of the analysis. Due to the fact that the composition of the EU underwent changes, in the presented analysis, it is assumed that the research sample includes countries from the composition from 2020 (EU-27) and the UK as the EU member until 2019. It should also be noted that the aggregate statistics for the EU area provided in the presented analysis concern the composition of the EU-27. These statistics are also used as a benchmark for national statistics. However, in more detailed analyses, considering individual countries, the UK is also added.
The aim of the conducted analysis is to assess changes in the use of renewable sources for electricity production in the EU countries in 2005–2019. This goal is carried out in two steps. In the first step, changes in the concentration of renewable sources are assessed in the production of electricity from renewable sources, using the Gini coefficient. In the second step, we apply k-means algorithm for clustering of EU countries (EU-27 + UK). The conducted study allows us to verify the following hypotheses:
  • Activities related to energy policy reduce the concentration of the use of renewable sources for electricity production.
  • There is a large diversity between EU countries in the use of renewable sources for the production of electricity, while the development of individual energy sources in specific countries is to a large extent supported by government bodies.
The literature presents numerous studies on the use of renewable sources, which are presented in international cross-sections. However, they mostly refer to several issues. The first is the analysis of the use of RES (or types of RES) in energy consumption or production (without dividing this energy into its types). The second is the analysis of share of total RES in different types of energy consumption or production. The third is the analysis of only one type of RES. In contrast, there is a lack of studies that present an analysis of the use of different types of renewable sources in the production of renewable electricity and examine their concentration. The approach presented in this paper is fulfilling the research gap. It should also be noted that we aimed to show changes in the composition of the energy portfolio composed only of RES used for electricity generation in the presented study. Therefore, this analysis refers to “renewable electricity”.

2. Renewable Energy Sources in Literature and EU Directives

Renewable energy sources (RESs) are in line with the concept of the “Sustainable Development Strategy of the European Union” adopted in June 2001. The very notion of sustainable development was defined in the Brundtland Report (WCED, 1987) as development meeting the needs of the present generations without limiting the same possibilities for the future ones [14]. Such development is then to be applied at both the social and environmental levels. The verification of the 2001 strategy that took place in 2006 allowed to pursue a long-term concept of sustainable development. Article 3 of the Treaty on the Functioning of the European Union (TFEU) urges the EU to disseminate the principles of sustainable development and to guard climate change and a low-carbon economy, inter alia, by lobbying multilevel actions improving the quality of the environment [15]. It is being implemented on multiple levels, both in the long and short terms [16]. In the case of energy policy, this takes place on the basis of various directives or strategies of the European Energy Union.
Moreover, the TFEU, and in particular, its Article 194, can be indicated as a point of reference for formulating strategies related to the EU energy policy in general. The first point of Article 194 presents the objectives of the EU energy policy by calling all EU countries, among others, to promote energy efficiency, to save energy, to develop new and renewable forms of energy and to ensure security of energy supply in the EU. The first milestone indicated in the process of formalizing the EU’s energy strategy is said to be the White Paper on renewable energy, adopted in 1997 [17]. The White Paper included goals that the production of electricity from renewable sources was to increase to 23.5% by 2010 (from 14.3% at that time). The next step was, the already mentioned, issuance of Directive 2001/77/EC of the European Parliament and of the Council of 27 September 2001 on supporting the production of electricity produced from renewable sources on the internal market [18]. This Directive indicated country-specific targets to be met by the year 2010 with regard to the use of RES in the production of electricity. For the entire EU, this indicator was 22%, and for individual countries it ranged from 5.7% for Luxembourg to 78.1% for Austria. The biggest increase was expected for Denmark—by 20.3%, from 8.7% in 1997 to 29% in 2010. On 10 January 2007, the European Commission issued a communication entitled “Renewable energy road map—Renewable energies in the 21st century: building a more sustainable future” [19]. In that document, the Commission indicated that the greatest progress with regard to the use of renewable sources has been made in the production of electricity. In addition, there were suggestions that in 2020, electricity production from renewable sources could increase up to 34% (from 15% at the time of the release). “Directive 2009/28/EC of the European Parliament and of the Council on the promotion of the use of energy from renewable sources” was issued in 2009, amending and subsequently repealing Directives 2001/77/EC and 2003/30/EC [20]. The Directive 2009/28/EC set a target that by 2020 the share of total energy consumption from renewable sources should amount to 20%. This goal was mentioned in the Europe 2020 strategy [21] as one of the five main priorities determining the development of the EU. Furthermore, the directive 2009/28/EC also contained guidelines related to the electricity production, in detail it stressed that energy produced from renewable sources should be prioritized and use of support schemes for electricity production from RES. In 2018, the Renewable Energy Directive was amended again [22] and showed that support schemes for renewable electricity have proved to be useful tools. In addition, a target was set to increase the share of renewable energy consumption in the total energy consumption up to 32% by 2030. In March 2019, the EC published the “Clean energy for all Europeans package” [11] presenting numerous strategic proposals in the field of energy. According to this document, electricity will gain strategic importance in the EU. Additionally, estimates are given that electricity will be responsible for more than half of the EU’s energy needs by 2050, with RES and nuclear energy expected to account for 80% of the electricity generated in the EU. A discussion of the factors affecting electricity is given in Reference [23].
Due to the fact that one of the priorities of the EU’s energy policy is to increase energy efficiency and increase the share of renewable energy, there is a strong synergy of renewable energy concept with some of the goals of sustainable development [24]. Research on various renewable energy sources in terms of sustainable development indicators (e.g., price of generated electricity, availability of renewable sources, gas emissions, land requirements, efficiency of energy conversion, water consumption, and social impacts) rank individual energy sources. Assuming that all factors are of equal importance, wind, hydro, solar and geothermal energy are in the first place. Wind energy has the lowest greenhouse gas emissions but requires a large land area and high investments [25].
The EU put great emphasis on various types of activities and promotion of renewable energy [26,27,28]. However, due to its high cost, generating energy from renewable sources on a large scale is not possible without support [29]. These support strategies differ from one Member State to another [30]. There are many ways to promote ecological solutions, as well as their various combinations. Some of the EU countries decide to promote one support system, others promote hybrid solutions [31]. However, as it turns out, one of the most beneficial actions is financial support [32,33]. Next to it, there are also tax incentives, feed-in tariffs and tenders [34]. Important aspects related to the promotion of renewable energy are social pressure, environmental impact, and the level of development of the country. The concern for the environment and the pressure of subjective norms have also an indirect influence [35].
The increased focus on sustainability in the energy field is a response to dwindling natural resources and high CO2 emissions. Required technological changes supporting sustainable development strategies include replacing fossil fuels with renewable energy, saving energy, or improving the efficiency of its production [36]. The EU is taking a number of actions to reduce CO2 emissions such as supporting the development of the renewable energy sector and supporting research on innovations within this sector. Restrictive measures are also taken, for examples introduction of the “European Union Emission Trading” [37,38]. RES are considered a solution to an environmental degradation [39], depletion of non-renewable resources, destruction of the ozone layer or increasing energy consumption [40]. Another reason for using renewable energy and striving to increase its share in energy consumption by the EU is the awareness of high dependence on energy imports [41] and the shortage of energy reserves [42]. The higher variety of energy sources ensures higher energy security that should take into account the security of energy supply and demand for it, as well as the existing energy shortages and its surplus [43]. The EU countries apply equal strategies in this field. In the case of coal-based countries, the coal is converted into a growing share of gas and a slow increase in the share of renewable energy [44]. Renewable energy can also be a factor in supporting economic growth. Environmentally friendly companies and institutions also receive a positive perception [45]. In the long run, there is a two-way relationship between economic growth and renewable energy consumption [46,47]. Renewable energy production also expands spatially to neighboring countries. This is due to the spread of knowledge and the similar potential of renewable energy [48].
It is also worth noting, in the context of considering electricity generation, that this aspect (getting electricity) is considered when evaluating regions in terms of attractiveness to investors [49]. In turn, given the strong focus on creating socially responsible businesses, sourcing electricity from renewable sources gains an additional dimension.
According to Eurostat, RES include hydro (RA100), wind (RA300), Solar (including RA410—Solar thermal and RA420—Solar photovoltaic), biofuels (R5110-5150_W6000RI—primary solid biofuels, R5220P—pure biodiesels, and R5290—other liquid biofuels), biogases (R5300), renewable municipal waste (W6210), other (RA200—geothermal and RA500—tide, wave, ocean). In the literature, individual sources are mentioned in different level of detail. For example, Reference [50] mentions sun, wind, waves, tides, or biomass fuels. Meanwhile, the main sources are solar, wind, and biomass energy [51].
RES are used directly to heat or light homes, as well as to produce fuel and electricity [52]. The importance of the transport sector is increasing, the increase in renewable energy consumption reduces CO2 emissions in this sector by around 12% [53]. This occurs through, inter alia, use of biofuels [54] that are combined with other technologies [55].
The EU promotes the direct use of renewable energy for both heating and cooling [56]. Research on transforming the heating sector into solutions using renewable energy is focused, for example, on smart grid or smart energy systems [57]. In urban environments, district heating and cooling systems (5GDHC) are proposed, among others concepts [58]. However, in the case of cooling, the RES Directive does not contain a definition of renewable cooling, and therefore it may be difficult to directly include cooling from renewable sources [59]. Nevertheless, the future lies in various types of integrated energy systems that will ensure high energy efficiency. In the case of cooling, these include, for example, district cooling systems (DSC) used in the construction sector for drying and cooling rooms. The most suitable RESs for such systems are biomass, solar, geothermal, surface water, solar, and waste heat energy [60]. The adaptive energy supply systems under development try to also consider the changeable availability of renewable energy. Finally, thanks to new technological solutions, renewable energy has a chance to be cheaper [61].
The development of new renewable energy technologies could be reflected in a decrease in electricity production costs [62]. This, in turn, could translate into lower electricity prices. Lower electricity prices can be equated with achieving the EU’s affordable and clean energy goal (Sustainable Development Goal (SDG) 7). The prices of energy carriers have a wider dimension. They affect the general price level in the economy and thus have an impact on economic growth (see, e.g., References [63,64]).
The production of electricity by using renewable energy is confirmed by green certificates. They are used by energy companies, which are obliged to include renewable energy in the overall energy balance. They are therefore traded, which can help to meet the renewable energy target [65]. Green certificates also support producers of renewable energy. Apart from green certificates, feed-in tariffs are another form of support [66].
In connection with the new proposals for the EU on increasing the share of renewable energy in general energy consumption, considerations of 100% of renewable energy share arise in the literature. Multistage analysis, considering the impact in terms of energy, environment and economy indicates that such system is achievable by combining heating, electricity, cooling, and transport sectors [67,68]. Such considerations can also be found in relation to specific countries. A Danish study showed that the pursuit towards 100% of the share of renewable energy from local sources is possible. A decision on the participation of biomass and wind energy is said to be crucial [69]. According to [70] a total transition to renewable energy and closure of nuclear energy is also possible in Germany by 2050. An overview of other literature on different energy systems in terms of 100% renewable energy can be found in Reference [71]. The literature also points out the need for electricity storage in the case of transition to renewable energy and including it in intelligent energy systems [72]. The renewable energy defects include the lack of continuity of its production, which is often associated with the climate. There are different solutions in the field of optimization methods [73].
Due to the subsequent objectives placed by the EU, renewable energy will play more and more importance. It is anticipated that the share of renewable energy in gross final energy consumption in the EU in 2050 will amount to 55–75% [74]. Furthermore, the achievement of climate neutrality is associated with an increase in renewable energy by 2050 by over 80% [75]. Therefore, the national and local level implementation of these goals, as well as the similarity among EU countries in terms of achieving the targets of sustainable development, concentration of renewable sources or their shares are crucial. Recent research on a relationship between RES and sustainable EU development carried out on the basis of a hierarchical method of cluster (Ward’s method) gave division of countries into five clusters. Countries that best deal with the use of renewable energy and make progress in sustainable development are Denmark, Finland, Latvia, and Sweden. Meanwhile, at the other end, there are Belgium, Cyprus, Lithuania, Luxembourg, and Malta [76].
Pacesila, Burcea and Colesca [77] examined the similarity in terms of the share of renewable energy in total consumption for EU countries, however the share of renewable energy considered was treated jointly for all sources. The research, carried out by using the k-means method for data from 2013, resulted in three clusters: the first cluster included countries with energy dependence of up to 30% (Denmark, Sweden, Estonia, Romania, and Czech Republic), the second one consisted of countries with energy dependence between 30% and 70% (Latvia, Austria, Slovenia, Finland, Germany, France, Bulgaria, Croatia, Greece, Slovakia, Hungary, Poland, Netherlands, and United Kingdom), and the last cluster (Lithuania, Portugal, Spain, Italy, Belgium, Cyprus, Ireland, Malta, and Luxembourg) with energy dependence higher than 70%. Additionally, a ranking was created in terms of the characteristics of renewable energy. The results showed that RES can help reduce energy dependency.
On the other hand, Reference [78] determined the concentration of consumption of RES in 28 EU countries in 2016. The concentration factor was 0.59. The high value of the coefficient was due to the fact that there were several countries that have high consumption of renewable energy, while all the rest have low consumption. Countries with high consumption of clean energy were Germany, Italy, and France.
The share of renewable energy in total energy consumption in 2004–2016 and the concentration of total energy consumption and renewable energy were examined in Reference [79]. The Gini coefficient was calculated for 2004 and 2016 and a high concentration of renewable energy consumption was found in several countries. For the energy in total, the concentration factor was 0.62 in 2004 and 2016. In the case of renewable energy, 0.58 (2004) and 0.59 (2016). The highest total energy consumption was in Germany, France, the UK, Italy, and Spain. The structure of renewable energy consumption was very similar; however, Sweden took the place of the UK. The concentration factor was also determined in Reference [80], but it only referred to the level of primary production, export, import, and total energy supply in the EU.
Due to the fact that the existing research focuses only on the share of renewable energy in total energy production, there is a need for extended research in terms of the use of renewable energy in electricity production. This paper will fill the research gap in this area.

3. Data and Methodology

The main analysis focused on the share of each renewable energy source in gross electricity production from renewable sources, which can be written as follows:
X i j t = G E P _ R E S i j t G E P _ R E S j t · 100 %
where G E P _ R E S i j t is the amount of electricity production from the i-th renewable source or biofuel in the j-th country in the period t, (GWh); and G E P _ R E S j t is the total amount of electricity production from renewable sources and biofuels in the j-th country in the period t (GWh), where G E P _ R E S j t = i = 1 n G E P _ R E S i j t .
We use publicly available Eurostat’s data in the presented study [81]. In the analysis the EU countries (2020 composition) and United Kingdom are included. United Kingdom is counted since this state is the EU member until the end of 2019 and the analysis cover the period 2005–2019.
The Gini coefficient ( G ) is applied to the concentration analysis in Reference [80]:
G j t = i = 1 n 2 i n 1 G E P _ R E S i j t n 2 G E P _ R E S ¯ j t
where G E P _ R E S i j t is the amount of electricity production (GWh) from i-th renewable source in j-th country in period t, and n = 7; and G E P _ R E S ¯ j t = 1 n i = 1 n G E P _ R E S i j t .
The considered sources of renewable energy are as follows: i = 1 (hydro), 2 (wind), 3 (solar), 4 (biofuels), 5 (biogases), 6 (renewable municipal waste), and 7 (other: geothermal and tide, wave, and ocean).
The k-means is the research tool applied for data clustering. This algorithm is introduced by Reference [82], (see also the description of the algorithm presented in References [83,84]). A procedure scheme for the application of the k-means is presented by Reference [85], among others. The calculations are prepared by using STATISTICA 13 software (TIBCO Software Inc. Palo Alto, CA, USA). In the first stage, all variables are standardized. Then Euclidean distance is used as a distance measure. The clustering is conducted for a different number of clusters, k = 2, …, 12. The number of clusters is selected by using the silhouette index (SI index [86]; see also References [87,88]. The highest value of SI index indicates the best division. In turn Reference [89] or [88] reports that acceptable divisions are characterized by the values of the SI index at least 0.5 (then the structure of the clustering is considered reasonable).
In the data clustering, seven variables constructed according the Formula (1) are considered. The list of variables is as follows:
X 1 j t —the share of electricity production in hydro power plants in total electricity production from renewables and biofuels ( G E P _ R E S j t ) in j-th country in period t;
X 2 j t —the share of electricity production in wind power plants in total electricity production from renewables and biofuels ( G E P _ R E S j t ) in j-th country in period t;
X 3 j t —the share of electricity production from solar power (solar thermal and solar photovoltaic) in total electricity production from renewables and biofuels ( G E P _ R E S j t ) in j-th country in period t;
X 4 j t —the share of electricity production from biofuels (primary solid biofuels, pure biodiesels, and other liquid biofuels) in total electricity production from renewables and biofuels ( G E P _ R E S j t ) in j-th country in period t;
X 5 j t —the share of electricity production from biogases in total electricity production from renewables and biofuels ( G E P _ R E S j t ) in j-th country in period t;
X 6 j t —the share of electricity production from renewable municipal waste in total electricity production from renewables and biofuels ( G E P _ R E S j t ) in j-th country in period t;
X 7 j t —the share of electricity production from other sources in total electricity production from renewables and biofuels ( G E P _ R E S j t ) in j-th country in period t (other sources are geothermal and tide wave, ocean).

4. Use of Renewable Energy Sources and Biofuels in the Electricity Production in the European Union

This section presents selected issues related to the use of renewable sources for electricity production in the European Union. In the first part, we present the share of electricity production from renewables and biofuels in the total electricity production. This part of the analysis covers the European Union (EU27, for the period 1990–2019) and the individual EU countries, including the UK (for the years 2005 and 2019). In the second part, we describe the types of renewable sources (RESs, according to the Eurostat’s classification) used for the electricity production in the EU and characterize the changes that have occurred in the shares of the five most popular RES in renewable energy production from RES (GEP_RES). In the third part, we report an analysis of changes in the level of concentration (measured by the Gini coefficient) of individual RES in GEP_RES production. We conduct this part of the analysis for the EU area (EU27) for the period 1990–2019 and for the individual EU countries, including the UK, for the years 2005 and 2019).

4.1. Renewable Energy in the Electricity Production in the EU

The main determinant of electricity production is the demand for electricity created by consumers. According to Eurostat data [90], in 2019, final energy consumption in the EU accounted for 10,879,807.319 GWh and was 5.1% lower than in 2005. The share of electricity in total final energy consumption is 22.8%, which is higher than the corresponding rate from 2005 by 1.6 percentage point (pp). In general, the electricity final consumption increased by 2.1% in the analyzed period. Increasing the share of electricity in the EU’s total energy consumption is included in the Clean energy for all Europeans package [11].
Figure 1 shows the gross electricity production (GEP), GEP from renewables and biofuels (GEP_RES) and share of gross electricity production from RES in total GEP in the EU (EU-27). As the presented data dates back to the year 1990, it can be noted that until around year 2005, gross electricity production in the EU had been steadily growing. During that period (1990–2005) GEP increased by 28.2%. As in the period of 2005–2019, one can observe a relatively constant level of GEP in the EU. In 2019, there was even a slight decrease in GEP compared to 2005—by 0.5%. However, analyzing the changes of the production of electricity from renewable sources (GEP_RES) shows that, in the period 1995–2005, there was an increase in its production by 49.2%, while, in the period between 2005 and 2019, there was an intensification and increase amounted by 110.8%. The total increase in the production of GEP_RES in the extended period (1990–2019) accounts for 214.4%. The vast development is also visible from the share of RES in GEP production (columns in Figure 1). In 1990, this share was 14.1%; in 2005, it slightly increased to 16.3%, but in 2019, it was already 34.6%. One of the reasoning behind such increase is the fact that the new member states joining the EU in its largest expansions in 2004 undertook many actions to adopt the guidelines related to the transition to low-emission economies (e.g., reduction of CO2 and other harmful substances emissions and the use of renewable sources for energy production to a greater extent).
Table 1 shows the shares GEP_RES in the total GEP in individual EU countries (including UK) in 2005 and 2019. In 2005, these shares ranges from 0% in Malta to 69.6% in Latvia. In 17 out of 28 analyzed countries, in 2005, the share of RES in electricity production was below the EU level (16.3%). The RES shares in GEP ranges from 10% in Cyprus to 85.9% in Luxembourg in 2019. In three more countries, the share of RES in GEP is greater than 70%; Lithuania (81.9%), Denmark (78.2%), and Austria (77.8%). Numerous countries have recorded a significant increase in the share of RES in GEP. In 11 countries, it is higher by 20 pp, and in three by as much as 50 pp: in Denmark (by 51.1 pp), Lithuania (by 76.3 pp), and Luxembourg (by 61.8 pp). This means that the policy of increasing RES for energy production has brought visible effects, especially in the case of electricity production. As a result, there is a noticeable reduction in the differentiation between EU countries in terms of this feature.

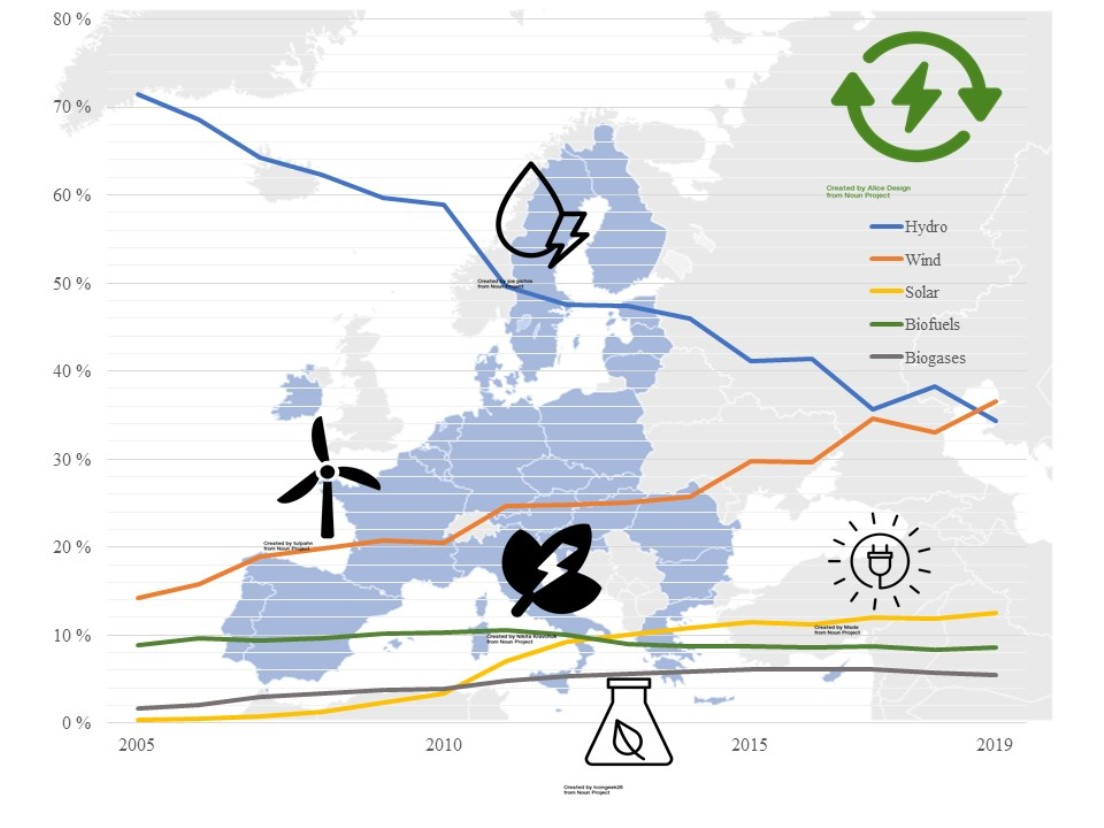
4.2. Types of Renewable Energy Sources Used for Electricity Production in the EU

Energy data are collected by Eurostat according to a strictly defined methodology [91]. Data are collected in areas that allow to assess, firstly, the origin of energy, secondly, the degree of dependence on energy imports, and thirdly, the types and costs of energy consumed. A key element of the EU’s energy policy is increasing the use of renewable sources, in particular regarding electricity production. As previously mentioned, the Clean energy for all Europeans package [11] assumes that, by 2050, electricity will account for over 50% of the energy consumption in the EU, with a significant share of renewable energy sources. Reliable and comparable statistics are therefore essential to be able to evaluate activities and progress in this area. In Table 2, we present the types of renewable sources and biofuels used for electricity production listed by Eurostat. While in 2019 the amount of electricity produced from all sources decreased slightly compared to 2005 (by 0.5%), the production of electricity from renewable sources and biofuels increased by 100.8% and exceeded 1 M GWh. This stands for an increase in the share of RES in the total electricity production by 18.3 pp (from 16.3% in 2005 to 34.6% in 2019).
Table 2 also shows the shares of individual sources used in gross electricity production from renewables and biofuels ( X i E U ) in 2005 and 2019 (columns three and five) in the EU-27 area. Figure 2, additionally, presents the changes in the shares of selected sources in an extended period of 1990–2019. In 2005, hydropower constituted the largest share of the RES_GEP (71.4%). Hydropower [92] noted a great decrease compared to 1990 (by 22.9 pp), when hydropower was responsible for over 94% of electricity generated from renewable sources (see Figure 2). Continuously, this share significantly decreased by 2019—by 37 pp. (to the level of 34.3%). Even if the actual amount of the electricity produced from hydropower has slightly increased since 2005 (by 1.4%), the highly decreased trend is due to other emerging technologies enabling the use of other renewable sources. In the study period (2005–2019), energy produced from wind; kinetic energy of wind exploited for electricity generation in wind turbines [93] gained a lot of importance, and increased by 439.1%. Its share in the production of electricity from renewable sources in 2019 was 36.5% and is higher by 22.2 pp from that in 2005. In 2019, both wind and hydro were responsible for 70.9% of electricity produced from renewable sources. Thus, these two sources are currently the main RESs used for electricity production. Another source that has gained in importance in recent years is solar energy. Eurostat distinguishes two types of solar power; solar photovoltaic (sunlight converted into electricity employing solar cells which exposed to light will generate electricity [94]) and solar thermal (heat from solar radiation (sunlight) exploited for useful energy purposes [95]). The second type of energy is produced by using, for example, solar thermal–electric plants, and its technology for the production of electricity is currently under development. According to Eurostat data, in 2005 this source was not used, and in 2019 it accounted for 0.6% of electricity production. In total, in 2019, solar energy was responsible for 12.5% of electricity produced from renewable sources. This indicator was higher than in 2005 by 12.2%. Since 2007, which is the year of the technology development, there has been an increase in the share of this type of energy (see Figure 2). Among the other technologies for the production of electricity from renewable sources, biofuels (solid and liquid biofuels) and biogases are a significant source. Electricity production from solid and liquid biofuels increased by 102.9% in the period 2005–2019, and the share of GEP production from RES slightly decreased (from 8.9% in 2005 to 8.5% in 2019). Furthermore, biogas significantly increased its importance in the production of electricity. In their case, the X i E U ratio increased by 3.8 percentage points in the analyzed period, to the level of 5.5%, while the production of electricity from this source increased by 581.5%. RES of minor importance in the entire EU-27 are renewable municipal waste, which in 2019 was responsible for about 2% of electricity produced from RES and geothermal and tide, wave, and ocean. The latter two sources are used by only a few countries. Geothermal is most used in Italy; and tide, wave, and ocean are used in France. While in 2005 their share in GEP_RES was 2%, in 2019, it was only 0.7%. Thus, it is not a technology of strategic importance in the production of electricity, and its importance is marginalized in the scale of the entire EU.

4.3. Concentration of Renewable Sources in Electricity Production

In our analysis, we determine the Gini coefficient (see Formula (2)) by dividing renewable sources into seven categories (see Section 3, Data and Methodology). Figure 3 shows the evolution of this coefficient for the EU-27 area in 1990–2019. In 1990, the value of this coefficient was 0.83. This means that, in the EU, there was a high concentration of renewable sources used to produce electricity, and hydroelectric power plants were mainly used during this period. The energy produced by this method accounted for almost 95% of electricity production from renewable sources. In the following years, we observe a decrease in the value of the Gini coefficient. The pace of its changes is firstly slow, till around 2001, and then it accelerates. This is the result of measures taken to use more diverse sources of renewable energy. After 2001, we observe the use of wind energy and biofuels to a greater extent. In turn, after 2007, we can see that the importance of solar energy was increasing. In 2005, the concentration of renewable fuel sources was 0.704 and was lower than in 1990 by about 15%. In the following years, an even greater decline in the Gini coefficient occurred. In 2019, it was 0.512 and was lower than in 2005 by over 27%. This was influenced by several factors. Firstly, it refers to the largest enlargement of the EU in 2004. The EU-27 area for which we calculate the Gini coefficient includes the countries currently constituting the EU. Before accession, they were not obliged to implement measures for low-carbon economies on the scale that followed. The newly admitted member states had to comply with the introduced rules concerning the use of renewable sources for energy production. It is worth noting that, in the years 1990–2005, the average change in the concentration coefficient of the use of renewable sources for electricity production was higher in the EU-15 countries, and it was 0.11 (refer to the formula from the Methodology section), and for the new coming countries in 2004 or later, this change was only 0.02. In the period 2005–2019, the situation was different. It is in the new member states that the changes intensified (the Gini coefficient dropped by 0.16 on average, and for the EU-15 countries decreased by 0.08). Therefore, it is visible that the greatest progress in this area was recorded by the states of the EU-15 before 2005, and the newly admitted states only after joining the EU structures.
Table 3 presents the values of the Gini coefficients for 2005 and 2019 for the EU and UK. In 2005, the highest concentration of RES appeared in Bulgaria, Croatia, Lithuania, Romania, and Slovakia (in their case, the G coefficient exceeded 0.85), as well as France, Latvia, Austria, Slovenia, and Sweden (0.85 > G > 0.8). These are the countries that used mainly hydroelectric power at that time, and the share of this type of source in the generation of electricity from RES was about 90% or more. In 2005, only in eight countries, the concentration level was lower than 0.7. During this period, we notice the greatest diversity in the use of renewable sources in the case of the UK (0.51), Germany (0.562), Estonia (0.583), Belgium (0.584), the Netherlands (0.626), Portugal (0.664), Spain (0.685), and Ireland (0.697). In the UK, the distribution of renewable energy use was as follows: hydro (40%), biogases and biofuels (41%), wind (14%), and other (5%). Germany, on the other hand, made the greatest use of wind (39.6%), hydro (37.6%), biofuels (10.8%), and all others (12%). It is also worth taking a closer look at the diversity of the use of individual sources for the production of electricity. Assuming that the i-th source can be considered significant in the production of renewable electricity, we see that the limit of X i > 1 % is set, then in 2005 for two countries the limit of 1% was exceeded in the case of six sources (Germany and Italy). Furthermore, for four countries, X i > 1 % was recorded for five sources (Belgium, Luxemburg, Netherlands, and the UK). For 14 countries, there were only three or fewer sources. In 2019, the concentration level above 0.8 was recorded only in Malta (0.849), which mainly uses solar energy (97%), and Slovenia (0.807), where hydro is mainly used (89.3%). In nine countries, the concentration level was below 0.6. The lowest values of the Gini coefficients were recorded for the Czech Republic (0.409) and Italy (0.448). The Czech Republic used mostly hydro (28.3%), biogases and biofuels (43.9%), and solar (20.6). On the other hand, in Italy, hydro (40.9%), solar (20.1%), and winds (17.2%) are used the most. Considering the diversity of the use of sources, the shares of X i > 1 % for each of the seven sources, this was the case only for Italy. For seven other countries (Belgium, Germany, France, Lithuania, Luxembourg, Hungary, and the UK), X i > 1 % were recorded for six sources. For only two countries (Malta and Cyprus), the number of valid sources was three (Cyprus) or less (two—Malta). In Cyprus, mainly 46.3% winds and 42.4% solar and 11.3% biogases were used, while in Malta, the main source of renewable electricity was solar energy (97.04%) and, to a much lesser extent, biogases (2.93%). Looking at the changes in the concentration factor, it is clear that the concentration of renewable sources in electricity production increased in the analyzed period (2005–2019) in three countries. It is most noticeable in Estonia, where the value of the Gini coefficient increased by 0.104, due to an increase in the use of biofuels by 58.8%. An increase in concentration coefficient was also recorded in the case of Ireland (∆G = 0.074) and the UK (∆G = 0.057). The largest drops in the concentration level were recorded in the Czech Republic (∆G = −0.373), Bulgaria (∆G = −0.342), Hungary (∆G = −0.274), Italy (∆G = −0.265), and Lithuania (∆G = −0.244). The Czech Republic has significantly reduced the share of hydropower (to 28.3% in 2019) in favor of solar energy and biofuels and biogases. In Hungary, in 2005, the largest share was recorded for energy produced from biofuels; in 2019, the importance of this source was reduced in favor of a greater use of solar and winds.
In summary, we note that there has been a significant reduction in the concentration of renewable source types used for electricity production in almost all EU countries over the period analyzed. In those countries with slightly higher levels of concentration, wind-generated electricity in particular has gained in importance. In general, we are now seeing trends across the EU where two sources in particular are gaining in importance: wind and solar. Supporting these sources is part of the EU’s energy policy.

5. Classification of the EU Countries by the Usage of Renewable Sources for Electricity Production

To examine similarities and differences in the use of renewables for electricity generation, we conducted the classification of the EU countries (including the UK) by applying the k-means algorithm. As in previous parts of the paper, the year 2019 was set as the reference year. The selection of the number of clusters was made based on the values of the silhouette coefficient (SI) presented in Table 4. The highest value of SI = 0.603 in the 2019 classification was obtained for 10 groups, and thus it was adopted as final. This is a satisfactory result because, with SI > 0.5, it is considered that the obtained division is characterized by a strong class structure. In the 2005 classification, the SI value for 10 groups is 0.81 and is slightly lower than the highest score for 12 groups (0.852). With an SI score > 0.7, the obtained division is considered to have a strong class structure. In addition, for the classification of data from 2011, the best division turns out to be the one into 12 groups (SI = 0.832). However, to ensure the comparability of the results, further analysis considered the division into 10 clusters, which is considered satisfactory, because the value of SI = 0.554 exceeds the limit of 0.5.
The breakdown for 2005 (see Table 5) shows, first, numerous of one-object (one-element) clusters—as many as 7 out of 10. These are the following groups: 1 (UK), 3 (Hungary), 4 (Denmark), 5 (Netherlands), 8 (Malta), 9 (Cyprus), and 10 (Italy). Those clusters constitute countries classified as standing out from the others in terms of the use of renewable sources for the production of electricity.
In 2005, Malta did not use renewable sources to produce electricity. Therefore, this country is naturally classified as a separate group. However, to maintain the consistency of the samples with the samples used in the other classifications (for 2011 and 2019), it is also included in the analysis for 2005. Italy in 2005 is distinguished primarily by the fact that it used sources that for the purposes of the presented classifications are categorized as other (variable X7). In Italy, geothermal is a popular source of energy. In 2005, this source contributed to the generation of almost 10% of renewable electricity. In the case of Cyprus, the main characteristic is that, in 2005, solar energy was mainly used to produce renewable electricity (over 61%). Moreover, in 2005, only two renewable sources were used in Cyprus—apart from solar energy, Cyprus used wind energy (over 38% share). Hungary is distinguished as a single-element group due to the fact that biofuels (over 84%) has a significant share in the production of renewable electricity. On the other hand, in the case of Denmark, the distinguishing factor is the share of wind energy (over 67%). The Netherlands and the UK are distinguished from other EU countries by the considerable variety of renewable sources they use. In the case of the Netherlands, these are biofuels (almost 50%), wind (over 27%), and waste (17%). The Netherlands is the only country where waste is classified as meaningful. In turn, the UK uses mainly hydro (almost 40%), as well as wind, biofuels, and biogases, the share of which in the production of renewable electricity is greater than 10% (for each of the sources). The UK is distinguished by the share of biogases (almost a quarter of renewable electricity generated). Great diversification of renewable sources in the case of the UK is confirmed by the low value of the Gini coefficient (see Table 3).
The most numerous cluster is cluster #2. The algorithm classified 13 countries into it (46% of the analyzed objects). This cluster is distinguished by a high share of energy produced in hydroelectric plants. The group mean for this feature is X ¯ 1 2005 = 93.3%, and the group included countries for which these shares (X1) are at least 80%.
Cluster number six joins four countries with large share of wind energy: Germany, Estonia, Ireland, and Spain. The group mean for this feature is X ¯ 2 2005 = 45.844, and the individual values of this coefficient (X2) for these countries ranged from 39% to 51%. The algorithm assigns Belgium, Poland, Portugal, and Finland to Cluster #7. These countries are characterized by a similar level of hydropower consumption (X1 between 46% and 70%) with a simultaneous significant consumption of biofuels (group average X ¯ 4 2005 = 27%, and the individual values of the X4 feature are between 15% and 40%).
In the 2011 classification (Table 6), only four clusters are single-object. As in the previous classification (from 2005), Malta (#5), Italy (#10), and the Netherlands (#9) are classified as single-object clusters. In Malta, in 2011, two sources of renewable electricity were used: solar (X3 = 50.4%) and biogases (X5 = 49.6%). It is worth noting that, compared to other countries, Malta has the largest share of solar energy use. Italy, as in the previous classification, is distinguished due to the high level of use of other sources (X7 = 6.66%) compared to other countries. However, this share is lower than in 2005, as, at that time, Italy began to use wind and solar panels on a larger scale. In the case of the Netherlands, there is a significant share of waste (X6 = 16.5%), comparable to the previous classification. Other sources with a high share of renewable electricity production are wind and biofuels, but in 2011 their proportions changes in favor of greater use of the wind. Finland is also classified in a separate cluster, which is distinguished by the fact that the main sources used in the production of renewable electricity are hydro (X1 = 51.48%) and biofuels (X4 = 44.75%), totaling 96.23%.
In the 2005, Finland is classified together with Belgium, Poland, and Portugal. In the case of Belgium and Poland, in 2011, a much smaller share of renewable electricity production in hydroelectric plants is recorded, and in the case of Portugal, the importance of using biofuels decreased. The values of the coefficients have changed so significantly that these countries are no longer characterized as similar. This time Poland joined the group together with Estonia and Hungary (cluster #6). This cluster is distinguished by the significant use of biofuels (average X ¯ 4 2011 = 58%). Furthermore, Belgium is classified together with the Czech Republic (#3). Characteristic for this cluster is the use of various sources. Cluster means greater than 10% are observed for the following traits: X1 (hydro), X2 (wind), X3 (solar), and X4 (biofuels). Due to the increased production of renewable electricity from wind in Ireland (the share increased from 50% to 80%), the algorithm classifies it together with Denmark (#4). The clusters’ mean of this coefficient ( X ¯ 2 2011 ), in this case, accounted for almost 75%. Ten countries remain classified in the largest cluster (#8). Their main source of renewable electricity production is hydro, with the mean is X ¯ 1 2011 = 84.5% and range from 71% to over 95%. Cluster #7 (Greece, Spain, Portugal, and Lithuania) is distinguished by the largest shares of two sources: hydro ( X ¯ 1 2011 =49.78%) and wind ( X ¯ 2 2011 = 38.11%). The last cluster (#2) includes Germany, UK, and Cyprus, with the main sources in the production of renewable electricity being wind ( X ¯ 2 2011 = 48.20%), biogases ( X ¯ 5 2011 = 20.64%), and hydro ( X ¯ 1 2011 = 13.55%). It is worth adding that, in the case of Cyprus, the role of the solar source has significantly decreased, from 61.45% in 2005 to 6.7% in 2011, with a simultaneous large increase in energy production from these two sources.
The compositions of clusters change again for the 2019 classification (see Table 7). Five countries are classified into single-object clusters. As in the previous classification, these are Malta (#8) and Italy (#1), as well as the Czech Republic (#3), Hungary (#5), and Estonia (#6). Italy, as in the previous cases, is distinguished primarily by a high share of other sources (X7 = 5.16%) compared to other countries. Although it decreased compared to 2011, the amount of electricity generated with this method has increased. It is also worth noting that, in Italy, the importance of the use of solar and wind energy has increased. In 2019, in Malta, solar is the dominant source used for the production of renewable electricity, with the share of X3 = 97.04%. This is a significant increase compared to 2011, by over 45 pp. Estonia is distinguished by a high consumption of biofuels, with a significant consumption of wind energy and a significant reduction in the share of hydropower compared to that in 2011. In Hungary, significant shares of biofuels (X4 = 37.74%) and solar energy (X3 = 31.94%) are recorded. On the other hand, the Czech Republic still stands out due to the significant—compared to other countries—use of biogases in the mix of renewable sources (X5 = 22.54%) and the burden of electricity production being distributed among four sources: in addition to the mentioned biogases, hydro (X1 = 40.92%), biofuels (X4 = 21.38), and solar energy (X3 = 20.13%). Thus, a low level of concentration of RES in the production of electricity.
The cluster with the highest share of hydro is Cluster #4: Croatia, Austria, Romania, and Slovenia. The clusters’ mean for this variable was as high as X1 = 74.81%. Another cluster with high hydro consumption is Cluster #2 (Bulgaria, France, Latvia, Luxembourg, Slovakia, Finland, and Sweden). At the same time, in this cluster, there is a significant consumption of biofuels (X4 = 16.7%), which distinguished it from #4. Eight countries are classified to the largest Cluster #9, distinguished by the significant use of wind energy (X1 = 57.35%). The other two clusters are Clusters #8 (Belgium and the Netherlands) and #10 (Germany and Cyprus), which are also characterized by significant use of wind energy (group averages for this variable being, respectively, 49.16% and 48.52%). However, significant use of other sources is also important for the breakdown. In the case of Belgium and the Netherlands, these are solar (X3 = 22.15%) and biofuels (X4 = 14.49%). Menawhile, in the case of Germany and Cyprus, these are solar (X3 = 30.54%) and biogases (X5 = 12.25%).

6. Discussion

On one hand, the EU members are obliged to increase the share of renewable sources in the total energy consumption, but on the other hand, they have certain freedom in shaping the energy policy and selecting the sources according to their own possibilities. This is why the EU countries differ significantly in terms of the types of renewable sources used to produce electricity. The presented data clearly show that all EU countries are increasing the share of renewable sources for electricity production, which is in line with the guidelines contained in EU directives. Furthermore, the diversity of these sources is increasing, which is indicated by the decreasing values of the Gini coefficients (for the vast majority of countries). It is also worth noting the fact that the EU-15 countries have already started this transition process at the beginning of the 21st century, the new EU member states followed only after their accession.
In 2005, at the beginning of the analyzed period, it is noticeable that the energy produced by hydroelectric power plants is of the highest importance in the production of electricity from renewable sources. Its share in the production of renewable electricity (GEP_RES) accounted for over 80% and is recorded for as many as half (14) of the analyzed countries, and in the case of 21 countries, the share is greater than 50%. During the next 14 years, the importance of hydroelectric power plants in the production of electricity did not increase, although this method is said to have a high potential [96].
Although hydropower has an established position in the production of electricity and belongs to the so-called renewable sources, the amount of electricity produced by this method (in GWh) in the scale of the entire EU (EU-27) increased by only 1.4% in the period 2005–2019. In 15 countries (out of 26 analyzed), its production is even reduced (Malta and Cyprus are not included in this list, as, in 2005, electricity was not produced by this method in these countries). This is justified by the fact that this type of electricity production is not environmentally neutral [97,98,99], and the degree of its impact depends on the scale of the production [96,97]. There is little chance of a large-scale hydropower plant in the European Union, mainly due to the fact that most of the areas have already been taken into use [96]. Nevertheless, hydropower plays an important role in providing flexibility to the electricity system [100]. It is indicated that the technology used in the hydropower plants allows meeting sudden fluctuations in supply or demand of other renewable sources, such as solar and wind power. Therefore, the EU support hydropower innovation. It is worth noting, the EU legislation stands in the way of a freer choice of RES and restricts the development of certain technologies, including hydropower (e.g., References [99,101]). In 11 countries, the increase in production by this method is mainly not significant. Only five countries recorded an increase in production by more than 15%: Portugal (increase in production by around 100%), Slovenia (by around 35%), Spain (16.7%), Ireland (16.1%), and Lithuania (by 15.6%). It is worth mentioning that, in these countries, in 2005, hydropower accounted already for a significant share in GEP_RES. In 2019, these shares decreased significantly due to the fact that these countries have been developing other technologies for obtaining electricity from renewable sources to a greater extent. Only in Slovenia, in 2019, the share of hydropower in the generation of GEP_RES stayed significant (89.3%), and in the other countries mentioned above, it became less than 36%, while in Ireland, it was less than 10%. In Portugal, the largest increase in hydropower production is recorded, as it is a country with one of the highest possible potentials to exploit this area [99]. In addition, in 2007, the Portuguese government approved the National Program of Dams with High Hydroelectric Potential [99]. As previously mentioned, the development of hydropower may be restricted by the EU legislation (e.g., see Reference [101]), due to negative environmental effects. However, as emphasized by Reference [102], the acceptability of the side effects of RES in terms of benefits related to climate protection and socioeconomic benefits lies with the national policy pursued by states as part of the development of RES and environmental protection. Portugal, as one of the few countries, has decided to invest in this type of energy on a large scale, as the contractor (Iberdrola, Bilbao, Spain) has been awarded €650 million by the European Investment Bank [103] for the expansion of the hydroelectric power plant in Portugal. This does not confirm the thesis by Reference [96] that indicates that only small projects (generating a capacity of no more than 10 MWh) can count on support from EU bodies. In the case of Slovenia, the work of Reference [104] indicates that energy needs will be best met by a mix of nuclear, water and gas technologies. The only source of renewable energy in this list is hydropower. Therefore, it is not surprising that the energy policy in Slovenia also focuses on the development of this technology. Another study [105] considered many criteria related to electricity generation, such as environmental protection and institutional—political, economic, social, and technological. The researchers indicated that hydropower, biomass, and nuclear power are the most effective RES investments. Hence, it is not surprising that the production in hydroelectric power plants increased by over 15%. However, this potential is not fully used in Lithuania. Lithuania has one of the most restricted environmental regulations related to the introduction of this type of technology, even to a small extent [106].
Wind energy is gaining importance in the renewable energy mix used for electricity production in the EU. The data we present in this paper confirm a significant intensification of electricity production, using wind during the analyzed period. Currently, it constitutes the largest share in the production of GEP_RES (36.5%). The amount of electricity produced in this way increased in the period 2005–2019 by almost 440%. This is not a surprise, as the literature indicates this technology as the most competitive compared to other RES [13]. That competitiveness is examined by using a balanced scorecard based on four types of variables: the perspective of the consumer, internal business processes, the development aspect, and the financial aspect. Kapitonov and Voloshin [13] describe the advantages of this technology as “the cost of electricity, safety, minimum possible power, productivity, and performance development aspect and financial aspect”. It is worth mentioning that, as in the case of hydropower, also wind energy can affect the natural environment. Wang and Wang [107] and Pecesila et al. [77] mention the following effects: noise pollution, change the landscape, and impact on local to regional weather and climate if the area of turbines is large enough, and it may affect the local populations of various species of birds. Nevertheless, this type of energy is indicated as the least harmful to the environment [108]. Therefore, it is strongly supported (in addition to solar energy) by the EU bodies as a mean of achieving the sustainable development goals, and in particular achieving the so-called climate neutrality planned for 2050 (see References [109,110]. At the same time, wind energy is mentioned as the one to support these goals to the greatest extent [111]. The European Commission notes that, thanks to the pan-European efforts to reduce greenhouse gas emissions, in 2016 (compared to 1990), it succeeded in reducing these emissions by 22% [109]. This is due to the significant increase in the share of RES in energy production, in particular wind and solar energy. It is directly linked to a significant reduction in costs related to the production of solar and on- and off-shore wind energy in the recent years (European Commission, 2018). Currently, offshore wind energy receives particular interest from the EU bodies. A strategy for the development of this type of energy was formulated, an EU Strategy to harness the potential of offshore renewable energy for a climate neutral future [12], referred to as the EU Strategy on Offshore Renewable Energy. This strategy assumes an increase in the Europe’s offshore wind capacity from 12 GW (level from 2020) to at least 60 GW by 2030 and to 300 GW by 2050. Additionally, the development of several new technologies (by 2050), such as floating wind and solar, is expected.
Currently, the leaders in wind energy production are (according to data from 2019) Germany (125,894 GWh), UK (64,334 GWh), Spain (55,647 GWh) and France (34,721 GWh). As for the share of wind energy in the production of GEP_RES, the largest is recorded for Ireland (83%), Denmark (70%), Poland (58%), Spain (54%), UK (53%), Germany, and the Netherlands (51%). Countries with shares between 40% and 50% are Lithuania, Belgium, Portugal, Cyprus, and Greece. In the 2019 cluster classification, all these countries are classified into three clusters: #7, #9, and #10 (see Table 6). These three clusters are characterized by a high share of wind energy in GEP_RES, and they are differentiated by significant shares of other sources. The UK, Sweden, Denmark, and Ireland are considered the most efficient countries in terms of wind energy use [112]. It is worth noting that the countries from the abovementioned clusters have favorable conditions for the development of this type of energy because they are either large in terms of area or have the possibility of developing offshore wind farms. At the same time, the countries using offshore wind energy are considered to be the most effective [112]. Therefore, large-scale investments are being made in many countries to develop offshore wind farms. An example is the support system for the construction of offshore wind farms in Poland, which is approved by the European Commission in May 2021 [113]. According to the assumptions of the Polish energy strategy, offshore wind farms are to be the main pillar of the energy system in Poland. Government support systems for offshore wind energy can be found also in the UK ([114]), Ireland ([115,116]), and Denmark ([117]).
Another renewable source used for electricity production that has gained in importance in recent years is solar energy. In the EU-27, the production of this type of electricity increased from 1458 to 125,717 GWh, i.e., by over 8500%. Solar technology is relatively new and in 2005 it is the least used resource for the production of renewable electricity (its share is only 0.3% in GEP_RES). However, in 2019, it is the third most important source, and its share in GEP_RES is 12.5%. The increase in popularity of this source may be due to several reasons. Firstly, solar energy is the second technology, after wind energy, considered the most competitive in the group of renewable energy technologies used for energy production [13]. Secondly, the development of this technology has contributed to a significant reduction in the cost of electricity production, and therefore it will continue to be of interest to the EU bodies as a technology to be supported. As such, more investments are planned for its further development, e.g., in the form of offshore solar energy (floating solar panels) (European Commission, 2020). Thirdly, this type of energy is included in the EU strategies for reducing CO2 emissions and ensuring energy security for the EU area.
There are different technologies for using the sun to produce energy [118]. Eurostat’s data for gross electricity production include two technologies: solar photovoltaic and solar thermal, with electricity production using the latter in 2019 only in Spain (its share was 5.5% in GEP_RES).
The environmental impacts are discussed at the level of the photovoltaic panels’ production technology [118]. The first issue being the use of allium arsenide or cadmium telluride to produce more energy-efficient photovoltaic panels. In the event of a leak, those compounds are said to not be harmful to the environment. Silicon used for the production of photovoltaic panels is said not to be harmful to the environment, however characterized by relatively lower energy converting efficiency. In the case of a technology called concentrated solar power techniques, coolant and lubricant are harmful, also in the event of a leak. The methods of neutralizing the harmfulness of these substances are included to be considered in the further development of these technologies.
The country which, in 2019, produced renewable electricity almost entirely by using solar technology was Malta (97% share in GEP_RES). It is also the only country where this share is greater than 50%. Therefore, in the 2019 cluster classification, it is assigned to a separate cluster. The second country in this respect is Cyprus, where 42.7% of GEP_RES is produced using this technology. Cyprus is classified in one cluster together with Germany, and this is due to the similarity of the use of other sources at a similar level (wind and biogases). The third country in this ranking is Hungary with 31.9% of solar energy in GEP_RES. For five other countries, the share is greater than 20% (but less than 30%): Greece, the Netherlands, Belgium, Czech Republic, and Italy. Belgium and the Netherlands (cluster #7) have similar levels of solar energy use, but this is not surprising, as these countries are adjacent to each other and have similar climatic conditions for using RES to produce GEP.
All in all, the increased importance of solar energy in the production of electricity is recorded in many countries. However, only in the case of Malta is it considered as the main source. In other countries, where this share is also significant (but not leading), this source can be described as complementary to the energy mix.
The paper of Reference [119] presents the possibility of developing solar technologies for energy production with respect to geographic location. Without a surprise, the countries of Southern Europe are characterized by the greatest potential. By comparing these results with those presented in this paper, it can be concluded that so far only few of the EU countries are developing their solar energy potential. These are Malta, Cyprus, Italy, and Greece, as well as Hungary. On the other hand, Spain, Portugal, and Romania are examples of countries with significant potential for the development of this technology, but only to a limited extent (favoring wind and hydropower).
It is worth noting that the use of solar energy is quite important in countries that have not been previously named as those with such a high potential in this particular technology. These are the Czech Republic, Germany, the Netherlands, and Belgium. In their electricity mix, the share of solar energy accounted for at least 18%. In the case of the Czech Republic, support systems, which Reference [120] define as generous, are of great importance for the development of photovoltaics. They see this as the cause of the massive boom for the construction of the photovoltaic power plant in the period of 2009–2012. However, it is pointed out that these systems are only slightly in line with the potential of solar resources in the Czech Republic. Furthermore, in Germany, support systems and national strategies for the development of solar energy played a significant role in its development, despite the limited domestic potential (compared to the countries of Southern Europe). In the case of Germany, the most important factor is the feed in tariffs (preferential tariffs) [121].
Biofuels, biogases, and renewable municipal waste are collectively classified under the biomass category. Currently, it is estimated that biomass contributes as much as 60% to total renewable energy production in the EU, including electricity, heat, and energy used in transport [122]. In the production of renewable electricity, this share is lower, at the level of 15.9%. Thus, in its production, these sources play a smaller role than in the case of other types of energy. Of these three sources, biofuels and biogases are used to the greatest extent. In 2019, biofuels accounted for 8.55% of GEP_RES production, biogases—5.47%, and renewable municipal waste only 1.9%. In the period 2005–2019, there was an increase in electricity production with these sources, by 102.9% and over 580% and 80%, respectively. These numbers show that the use of biofuels is already well established in the production of electricity in the EU, while the importance of biogas has grown significantly.
Biofuels used for electricity production according to the Eurostat category are divided into primary solid biofuels (fuelwood, wood residues, wood pellets, animal waste, and vegetal material), pure biodiesel and other liquid biofuels. The latter two are of marginal importance. Solid biofuels are used to the greatest extent in heating energy, but they have also gained popularity in the production of electricity. In this matter, biofuels are most often used in Estonia (share of 58.8% in GEP_RES), Finland (38.5%) and Hungary (37.7%). Estonia and Hungary in the 2019 classification are classified as single-element clusters, due to, among others, such a dominant share of biofuels in the energy mix used for the production of electricity from renewable sources. Furthermore, Estonia is the only country among the analyzed countries where biofuels are the basis for the production of GEP_RES (share greater than 50%). Finland, despite such a significant share of this source, was classified in the second cluster, as in addition to biofuels, hydropower, and wind power are used to a large extent. Other countries that use this source to a large extent are Poland (24.6% shares in GEP_RES) and the Czech Republic (21.4%). For the following nine countries, this share ranges from 10% to 20%: Bulgaria, Denmark, Latvia, Belgium, Slovakia, the Netherlands, Sweden and Lithuania, and the UK. All in all, apart from Estonia, for the other countries mentioned, biofuels complement the portfolio of renewable sources used in electricity production as one of three (or four as in the case of the Czech Republic and Bulgaria) sources. The presented results also indicate that this is the source typical for countries located mainly in the northern part of Europe, where solar energy does not have as high potential as in the case of southern countries. Bulgaria is the southernmost country on this list, followed by Hungary. In the case of Hungary, the share of biofuels has significantly decreased—from almost 85% in 2005 to almost 38% in 2019 It is due to the fact that nowadays in Hungary more use is made of other sources (solar and winds). The production of electricity from biofuels in this country in the analyzed period slightly increased—by about 12%.
Biogases are reported to be as less common source than biofuels. They are used to the bigger extent only in the Czech Republic (22.5%) as well as in Germany, Cyprus, and Latvia (share between 11% and 14%). While in the case of the Czech Republic, Germany and Cyprus, the share of biogas in the energy mix distinguishes them from other countries, in Latvia, greater shares of hydro and biofuels meant that it was assigned to cluster #2.

7. Conclusions

The purpose of the presented analysis was to assess the changes that have occurred in the use of RES in the production of electricity in the EU and UK, and the main research period was set as 2005–2019. As different countries have different levels of use of renewable energy sources (RESs) in electricity production (GEP), in our main analyses, we focused only on the electricity generated from RES (GEP_RES) and its amount generated from each RES. It is this approach that distinguishes the presented study from others presented in the literature that focus primarily on GEP-related analyses. In the presented study, we analyzed the shares of seven types of different sources (hydro, wind, solar, biofuels, biogases, renewable municipal waste, and others) in the production of GEP_RES. The main research methods are the Gini concentration coefficient and the k-means algorithm.
The analysis shows that the Gini coefficients decreased for almost all countries in the period 2005–2019. This means that the concentration of renewable sources used for electricity production has decreased significantly across the EU. As indicated in the discussion, one of the main drivers of change in this respect (increased use of RES) has been the EU energy policy targets and national energy policies to adjust national energy sectors to these targets. This inclines us to accept Hypothesis (1). This phenomenon is in line with the recommendations of the European Commission regarding the diversification of energy sources, which is to support the energy security. It is worth noting that, while in 2005, in most countries, the predominant source of renewable electricity (with a share of over 80% in GEP_RES) was hydroelectric power plants, in 2019, a significant increase in the importance of other sources occurred.
The level of electricity production in hydroelectric power plants did not increase significantly, but with the simultaneous significant increase in the production of renewable electricity, the share of this source decreased. Hydropower production is still of great importance and is the main renewable source for electricity production in many European countries (with a share of more than 50% in GEP_RES). However, since this method of obtaining energy requires specific geographical conditions and the fact that it is not completely neutral to the environment, its development focuses primarily on more efficient use of already existing facilities, in particular those large ones. Wind energy is gaining importance. In 2019 in the EU-27, the share of this type of source in the production of GEP_RES was already over 36% and was greater than the share of hydropower. This source is recognized as the most effective among renewable sources in the production of electricity. It is also a resource promoted by the EU bodies. In particular, the emphasis is on the development of offshore wind energy, which is included in the directive [12].
The significant shares of the abovementioned sources (hydro and wind) in the production of GEP_RES in the vast majority of EU countries make those two the most important sources of renewable electricity. The remaining sources are usually treated as complementary. Among those sources of renewable electricity, solar energy, in particular photovoltaic energy, is important in the EU scale. It plays a key role in most of the countries of Southern Europe that is related to the level of insolation [119]. This technology, considered the second most effective renewable source of electricity after wind energy, is also developed and promoted in countries with less favorable climatic conditions for it: the Czech Republic, Germany, the Netherlands, and Belgium. The ecological aspects add to the importance of the solar technology and influence a support from governments of many countries (e.g., Germany and the Czech Republic). In northern countries, biomass— particularly biofuels—plays an important role as a complementary resource to the renewable energy mix.
Two sources that were categorized in this paper as “other” are of importance in only two countries: energy from the geothermal source produced in Italy and tide wave ocean used in France. As the first technology increased in importance (both in Italy and to small extent in other countries), the shares of tide wave ocean technology began to lose their importance. In the analyzed period, this source was not used to a greater extent.
The performed cluster analysis shows that, firstly, there are EU countries with a very individual structure of using the renewable sources, such as Malta (the only country where solar energy is used to a higher extent) or Estonia (a leading country in the use of biofuels). Secondly, there are countries where the use of renewable sources is highly diversified. An example is the Czech Republic, where as many as four sources had shares in GEP_RES at the level of more than 10%. Thirdly, the vast majority of countries has been assigned to multi-element clusters, indicating that they have similar structures of consumption of renewable sources in GEP_RES. Importantly, the clusters constitute countries often not closely located geographically to each other. As it turns out, geographical factors are not the only determinants of the amount of energy consumed, or the sources used for its production. The key factors here are the national energy policies and strategies that formulate the national goals and publicly supported technologies. Therefore, the presented study can be used as a basis for comparisons of impacts of national policies on the promotion and use of renewable sources for electricity production.
The presented study clearly shows that all EU countries implement the assumptions of the energy policy regarding both increasing the share of renewable sources in energy production—in particular, electricity—and increasing the diversity of these sources. The results indicate a vast diversity within the EU countries in terms of the use of the renewable sources for the production of electricity. This shows individual country-oriented approaches to implement the energy transformation towards low-carbon economies. The EU’s support and restrictive measures (e.g., the already mentioned EU ETS) are of considerable importance for this transformation. Currently, the main source of renewable energy in the EU is wind energy, which is increasingly used by most EU countries, and the offshore renewable energy strategy (European Commission, 2020) is guiding the development of this type of energy. Maintaining the pace of the energy transformation allows the achievement of the goals set for 2050 in the Clean Energy for all Europeans document [11].

Author Contributions

Conceptualization, A.M.-J., D.Ż.-S., U.A.-K. and M.H.-K.; methodology, A.M.-J.; validation A.M.-J. and U.A.-K.; formal analysis, A.M.-J., D.Ż.-S. and U.A.-K.; investigation, A.M.-J. and D.Ż.-S.; resources, D.Ż.-S. and A.M.-J.; data curation, A.M.-J. and U.A.-K.; writing—original draft preparation, A.M.-J. and D.Ż.-S.; writing—review and editing, D.Ż.-S., U.A.-K., A.M.-J. and M.H.-K.; visualization, D.Ż.-S.; supervision, A.M.-J., D.Ż.-S., U.A.-K. and M.H.-K.; project administration, D.Ż.-S. All authors have read and agreed to the published version of the manuscript.

Funding

This research received no external funding.

Institutional Review Board Statement

Not applicable.

Informed Consent Statement

Not applicable.

Data Availability Statement

Not applicable.

Conflicts of Interest

The authors declare no conflict of interest.

References

  1. EIA—U.S. Energy Information Administration. International Energy Outlook 2019 with Projections to 2050, #IEO2019, U.S. Energy Information Administration Office of Energy Analysis. September 2019. Available online: https://www.eia.gov/outlooks/ieo/ (accessed on 7 August 2021).
  2. Aklin, M.; Urpelainen, J. Renewables: The politics of a global Energy Transition; MIT Press: Cambridge, MA, USA, 2018. [Google Scholar]
  3. Child, M.; Koskinen, O.; Linnanen, L.; Breyer, C. Sustainability guardrails for energy scenarios of the global energy transition. Renew. Sustain. Energy Rev. 2018, 91, 321–334. [Google Scholar] [CrossRef]
  4. Davidson, D.J. Exnovating for a renewable energy transition. Nat. Energy 2019, 4, 254–256. [Google Scholar] [CrossRef]
  5. Watari, T.; McLellan, B.C.; Giurco, D.; Dominish, E.; Yamasue, E.; Nansai, K. Total material requirement for the global energy transition to 2050: A focus on transport and electricity. Resour. Conserv. Recycl. 2019, 148, 91–103. [Google Scholar] [CrossRef]
  6. Pietrzak, M.B.; Igliński, B.; Kujawski, W.; Iwański, P. Energy Transition in Poland—Assessment of the Renewable Energy Sector. Energies 2021, 14, 2046. [Google Scholar] [CrossRef]
  7. Kuc-Czarnecka, M.E.; Olczyk, M.; Zinecker, M. Improvements and Spatial Dependencies in Energy Transition Measures. Energies 2021, 14, 3802. [Google Scholar] [CrossRef]
  8. UNFCCC. United Nations Framework Convention on Climate Change. 1992. Available online: https://unfccc.int/resource/docs/convkp/conveng.pdf (accessed on 7 August 2021).
  9. Kyoto Protocol. 1997. Available online: https://www.eea.europa.eu/policy-documents/kyoto-protocol-to-the-un (accessed on 3 June 2021).
  10. European Commission. Communication from the Commission to the European Parliament, the Council, the European Economic and Social Committee and the Committee of the Regions Next Steps for a Sustainable European Future European action for Sustainability, COM/2016/0739 Final, Strasbourg, 22.11.2016. 2016. Available online: https://eur-lex.europa.eu/legal-content/EN/TXT/?uri=COM%3A2016%3A739%3AFIN (accessed on 5 August 2021).
  11. European Commission. Clean Energy for All Europeans; European Commission: Brussels, Belgium, 2019. [Google Scholar] [CrossRef]
  12. European Commission. Communication from the Commission to the European Parliament, the Council, the European Economic and Social Committee and the Committee of the Regions, An EU Strategy to Harness the Potential of Offshore Renewable Energy for a Climate Neutral Future {SWD(2020) 273 Final, Brussels, 19.11.2020 COM(2020) 741 Final. 2020. Available online: https://eur-lex.europa.eu/legal-content/EN/TXT/?uri=COM:2020:741:FIN (accessed on 30 July 2021).
  13. Kapitonov, I.A.; Voloshin, V.I. International Journal of Energy Economics and Policy Strategic Directions for Increasing the Share of Renewable Energy Sources in the Structure of Energy Consumption. Int. J. Energy Econ. Policy 2017, 7, 90–98. [Google Scholar]
  14. WCED (World Commission on Environment and Development). Our Common Future Report of the World Commission on Environment and Development. 1987. Available online: https://digitallibrary.un.org/record/139811 (accessed on 29 July 2021).
  15. The Treaty on European Union. 2007. Available online: http://data.europa.eu/eli/treaty/teu_2012/oj (accessed on 29 July 2021).
  16. Balcerzak, A.P.; Pietrzak, M.B. Application of TOPSIS Method for Analysis of Sustainable Development in European Union Countries. In Proceedings of the 10th International Days of Statistics and Economics: Conference Proceedings, Prague, Czech Republic, 8–10 September 2016. [Google Scholar]
  17. Communication from the Commission Energy for the Future: Renewable Sources of Energy. White Paper for a Community Strategy and Action Plan. 1997. Available online: https://europa.eu/documents/comm/white_papers/pdf/com97_599_en.pdf (accessed on 29 July 2021).
  18. Directive 2001/77/EC of the European Parlament and of the Council. September 2001. Available online: https://eur-lex.europa.eu/legal-content/EN/TXT/PDF/?uri=CELEX:32001L0077&from=en (accessed on 29 July 2021).
  19. Communication from the Commission to the Council and the European Parliament—Renewable energy road map—Renewable Energies in the 21st Century: Building a More Sustainable, COM(2006)848. 2007. Available online: https://www.eumonitor.eu/9353000/1/j4nvke1fm2yd1u0_j9vvik7m1c3gyxp/vkcweehp63z8/v=s7z/f=/com(2006)848_en.pdf (accessed on 29 July 2021).
  20. Directives 2009/28/EC of the European Parlament and of the council. April 2009. Available online: https://eur-lex.europa.eu/legal-content/EN/TXT/PDF/?uri=CELEX:32009L0028&from=PL (accessed on 29 July 2021).
  21. Europe June 2020. Available online: https://ec.europa.eu/eu2020/pdf/COMPLETENBARROSO007-Europe2020-ENversion.pdf (accessed on 3 June 2021).
  22. Directive 2018/2001 of the European Parliament and of the Council of 11 December 2018 on the Promotion of the use of Energy from Renewable Sources. December 2018. Available online: https://eur-lex.europa.eu/legal-content/EN/TXT/PDF/?uri=CELEX:32018L2001&from=PL (accessed on 29 July 2021).
  23. Bojnec, Š.; Križaj, A. Electricity Markets during the Liberalization: The Case of a European Union Country. Energies 2021, 14, 4317. [Google Scholar] [CrossRef]
  24. Swain, R.B.; Karimu, A. Renewable electricity and sustainable development goals in the EU. World Dev. 2020, 125, 104693. [Google Scholar] [CrossRef]
  25. Evans, A.; Strezov, V.; Evans, T.J. Assessment of sustainability indicators for renewable energy technologies. Renew. Sustain. Energy Rev. 2009, 13, 1082–1088. [Google Scholar] [CrossRef]
  26. Streimikiene, D.; Šivickas, G. The EU sustainable energy policy indicators framework. Environ. Int. 2008, 34, 1227–1240. [Google Scholar] [CrossRef]
  27. Bohringer, C.; Loschel, A. Promoting Renewable Energy in Europe: A Hybrid Computable General Equilibrium Approach. Energy J. 2006, SI2006. [Google Scholar] [CrossRef]
  28. Özdemir, Ö.; Hobbs, B.F.; van Hout, M.; Koutstaal, P.R. Capacity vs energy subsidies for promoting renewable investment: Benefits and costs for the EU power market. Energy Policy 2020, 137, 111166. [Google Scholar] [CrossRef]
  29. Radović, U. Support of the electricity generation from renewable energy sources in Poland: Is the additional system cost justified? Polityka Energ. Energy Policy J. 2005, 8, 469–482. [Google Scholar]
  30. Reiche, D.; Bechberger, M. Policy differences in the promotion of renewable energies in the EU member states. Energy Policy 2004, 32, 843–849. [Google Scholar] [CrossRef]
  31. Poullikkas, A.; Kourtis, G.; Hadjipaschalis, I. An overview of the EU Member States support schemes for the promotion of renewable energy sources. Int. J. Energy Environ. 2012, 3, 553–566. [Google Scholar]
  32. Haas, R.; Panzer, C.; Resch, G.; Ragwitz, M.; Reece, G.; Held, A. A historical review of promotion strategies for electricity from renewable energy sources in EU countries. Renew. Sustain. Energy Rev. 2011, 15, 1003–1034. [Google Scholar] [CrossRef]
  33. Nicolini, M.; Tavoni, M. Are renewable energy subsidies effective? Evidence from Europe. Renew. Sustain. Energy Rev. 2017, 74, 412–423. [Google Scholar] [CrossRef]
  34. Kilinc-Ata, N. The evaluation of renewable energy policies across EU countries and US states: An econometric approach. Energy Sustain. Dev. 2016, 31, 83–90. [Google Scholar] [CrossRef]
  35. Liobikienė, G.; Dagiliūtė, R. Do positive aspects of renewable energy contribute to the willingness to pay more for green energy? Energy 2021, 231, 120817. [Google Scholar] [CrossRef]
  36. Lund, H. Renewable energy strategies for sustainable development. Energy 2007, 32, 912–919. [Google Scholar] [CrossRef] [Green Version]
  37. EU ETS. EU ETS Handbook. 2015. Available online: https://ec.europa.eu/clima/policies/ets_en#tab-0-0 (accessed on 7 August 2021).
  38. Chovancová, J.; Tej, J. Decoupling economic growth from greenhouse gas emissions: The case of the energy sector in V4 countries. Equilibrium. Q. J. Econ. Econ. Policy 2020, 15, 235–251. [Google Scholar] [CrossRef]
  39. Akadiri, S.S.; Alola, A.A.; Akadiri, A.C.; Alola, U.V. Renewable energy consumption in EU-28 countries: Policy toward pollution mitigation and economic sustainability. Energy Policy 2019, 132, 803–810. [Google Scholar] [CrossRef]
  40. Dincer, I. Renewable energy and sustainable development: A crucial review. Renew. Sustain. Energy Rev. 2000, 4, 157–175. [Google Scholar] [CrossRef]
  41. Marques, A.C.; Fuinhas, J.A.; Manso, J.R.P. Motivations driving renewable energy in European countries: A panel data approach. Energy Policy 2010, 38, 6877–6885. [Google Scholar] [CrossRef]
  42. Gökgöz, F.; Güvercin, M.T. Energy security and renewable energy efficiency in EU. Renew. Sustain. Energy Rev. 2018, 96, 226–239. [Google Scholar] [CrossRef]
  43. Blum, H.; Legey, L.F.L. The challenging economics of energy security: Ensuring energy benefits in support to sustainable development. Energy Econ. 2012, 34, 1982–1989. [Google Scholar] [CrossRef]
  44. Jonek-Kowalska, I. Transformation of energy balances with dominant coal consumption in European economies and Turkey in the years 1990–2017. Oeconomia Copernic. 2019, 10, 627–647. [Google Scholar] [CrossRef] [Green Version]
  45. Filimonova, I.; Komarova, A.; Mishenin, M. Impact of the global green factor on the capitalization of oil companies in Russia. Oeconomia Copernic. 2020, 11, 309–324. [Google Scholar] [CrossRef]
  46. Saad, W.; Taleb, A. The causal relationship between renewable energy consumption and economic growth: Evidence from Europe. Clean Technol. Environ. Policy 2018, 20, 127–136. [Google Scholar] [CrossRef]
  47. Al-Mulali, U.; Ozturk, I.; Lean, H.H. The influence of economic growth, urbanization, trade openness, financial development, and renewable energy on pollution in Europe. Nat. Hazards 2015, 79, 621–644. [Google Scholar] [CrossRef]
  48. Shahnazi, R.; Shabani, Z.D. Do renewable energy production spillovers matter in the EU? Renew. Energy 2020, 150, 786–796. [Google Scholar] [CrossRef]
  49. Kiseľáková, D.; Šofranková, B.; Onuferová, E.; Čabinová, V. The evaluation of competitive position of EU-28 economies with using global multi-criteria indices. Equilibrium. Q. J. Econ. Econ. Policy 2019, 14, 441–462. [Google Scholar] [CrossRef]
  50. Kothari, R.; Tyagi, V.V.; Pathak, A. Waste-to-energy: A way from renewable energy sources to sustainable development. Renew. Sustain. Energy Rev. 2010, 14, 3164–3170. [Google Scholar] [CrossRef]
  51. Benedek, J.; Sebestyén, T.T.; Bartók, B. Evaluation of renewable energy sources in peripheral areas and renewable energy-based rural development. Renew. Sustain. Energy Rev. 2018, 90, 516–535. [Google Scholar] [CrossRef]
  52. Johansson, T.B.; Kelly, H.; Reddy, A.K.N.; Williams, R.H. Renewable Energy: Sources for Fuels and Electricity; Island Press: Washington, DC, USA, 1993. [Google Scholar]
  53. Amin, A.; Altinoz, B.; Dogan, E. Analyzing the determinants of carbon emissions from transportation in European countries: The role of renewable energy and urbanization. Clean Technol. Environ. Policy 2020, 22, 1725–1734. [Google Scholar] [CrossRef]
  54. Jäger-Waldau, A.; Szabó, M.; Scarlat, N.; Monforti-Ferrario, F. Renewable electricity in Europe. Renew. Sustain. Energy Rev. 2011, 15, 3703–3716. [Google Scholar] [CrossRef]
  55. Mathiesen, B.V.; Lund, H.; Nørgaard, P. Integrated transport and renewable energy systems. Util. Policy 2008, 16, 107–116. [Google Scholar] [CrossRef]
  56. Cansino, J.M.; Pablo-Romero, M.d.; Román, R.; Yñiguez, R. Promoting renewable energy sources for heating and cooling in EU-27 countries. Energy Policy 2011, 39, 3803–3812. [Google Scholar] [CrossRef]
  57. Lund, H. Renewable heating strategies and their consequences for storage and grid infrastructures comparing a smart grid to a smart energy systems approach. Energy 2018, 151, 94–102. [Google Scholar] [CrossRef]
  58. Boesten, S.; Ivens, W.; Dekker, S.C.; Eijdems, H. 5th generation district heating and cooling systems as a solution for renewable urban thermal energy supply. Adv. Geosci. 2019, 49, 129–136. [Google Scholar] [CrossRef] [Green Version]
  59. Braungardt, S.; Bürger, V.; Zieger, J.; Bosselaar, L. How to include cooling in the EU Renewable Energy Directive? Strategies and policy implications. Energy Policy 2019, 129, 260–267. [Google Scholar] [CrossRef]
  60. Inayat, A.; Raza, M. District cooling system via renewable energy sources: A review. Renew. Sustain. Energy Rev. 2019, 107, 360–373. [Google Scholar] [CrossRef]
  61. Scholz, Y. Renewable Energy Based Electricity Supply at Low Costs: Development of the REMix Model and Application for Europe. 2012. Available online: http://nbn-resolving.de/urn:nbn:de:bsz:93-opus-76350 (accessed on 17 July 2021).
  62. The International Renewable Energy Agency (IRENA). Renewable Power: Sharply Falling Generation Costs. 2017. Available online: https://www.irena.org/-/media/Files/IRENA/Agency/Publication/2017/Nov/IRENA_Sharply_falling_costs_2017.pdf (accessed on 23 September 2021).
  63. Rubene, I.; Koester, G. Recent dynamics in Energy Inflation: The Role of Base Effects and Taxes. ECB Economic Bulletin. 2021. Available online: https://www.ecb.europa.eu/pub/economic-bulletin/focus/2021/html/ecb.ebbox202103_04~0a0c8f0814.en.html (accessed on 23 September 2021).
  64. Galchynskyi, L. Estimation of the price elasticity of petroleum products’ consumption in Ukraine. Equilibrium. Q. J. Econ. Econ. Policy 2020, 15, 315–339. [Google Scholar] [CrossRef]
  65. Aune, F.R.; Dalen, H.M.; Hagem, C. Implementing the EU renewable target through green certificate markets. Energy Econ. 2012, 34, 992–1000. [Google Scholar] [CrossRef]
  66. Ringel, M. Fostering the use of renewable energies in the European Union: The race between feed-in tariffs and green certificates. Renew. Energy 2006, 31, 1–17. [Google Scholar] [CrossRef]
  67. Connolly, D.; Lund, H.; Mathiesen, B.V. Smart Energy Europe: The technical and economic impact of one potential 100% renewable energy scenario for the European Union. Renew. Sustain. Energy Rev. 2016, 60, 1634–1653. [Google Scholar] [CrossRef]
  68. Mathiesen, B.V.; Lund, H.; Connolly, D.; Wenzel, H.; Østergaard, P.A.; Möller, B.; Nielsen, S.; Ridjan, I.; Karnøe, P.; Sperling, K.; et al. Smart Energy Systems for coherent 100% renewable energy and transport solutions. Appl. Energy 2015, 145, 139–154. [Google Scholar] [CrossRef]
  69. Lund, H.; Mathiesen, B.V. Energy system analysis of 100% renewable energy systems—The case of Denmark in years 2030 and 2050. Energy 2009, 34, 524–531. [Google Scholar] [CrossRef]
  70. Hansen, K.; Mathiesen, B.V.; Skov, I.R. Full energy system transition towards 100% renewable energy in Germany in 2050. Renew. Sustain. Energy Rev. 2019, 102, 1–13. [Google Scholar] [CrossRef]
  71. Hansen, K.; Breyer, C.; Lund, H. Status and perspectives on 100% renewable energy systems. Energy 2019, 175, 471–480. [Google Scholar] [CrossRef]
  72. Lund, H.; Østergaard, P.A.; Connolly, D.; Ridjan, I.; Mathiesen, B.V.; Hvelplund, F.; Thellufsen, J.Z.; Sorknæs, P. Energy Storage and Smart Energy Systems. Int. J. Sustain. Energy Plan. Manag. 2016, 11, 3–14. [Google Scholar]
  73. Baños, R.; Manzano-Agugliaro, F.; Montoya, F.G.; Gil, C.; Alcayde, A.; Gómez, J. Optimization methods applied to renewable and sustainable energy: A review. Renew. Sustain. Energy Rev. 2011, 15, 1753–1766. [Google Scholar] [CrossRef]
  74. Ionescu, G.H.; Firoiu, D.; Pîrvu, R.; Enescu, M.; Rădoi, M.-I.; Cojocaru, T.M. The Potential for Innovation and Entrepreneurship in EU Countries in the Context of Sustainable Development. Sustainability 2020, 12, 7250. [Google Scholar] [CrossRef]
  75. European Environmental Agency. Renewable Energy in Europe—Recent Growth and Knock-on Effects. pp. 1–65. 2016. Available online: http://www.eea.europa.eu/publications/renewable-energy-in-europe-2016/download (accessed on 29 July 2021).
  76. Włodarczyk, B.; Firoiu, D.; Ionescu, G.H.; Ghiocel, F.; Szturo, M.; Markowski, L. Assessing the Sustainable Development and Renewable Energy Sources Relationship in EU Countries. Energies 2021, 14, 2323. [Google Scholar] [CrossRef]
  77. Pacesila, M.; Burcea, S.G.; Colesca, S.E. Analysis of renewable energies in European Union. Renew. Sustain. Energy Rev. 2016, 56, 156–170. [Google Scholar] [CrossRef]
  78. Gromada, A.; Trebska, P.; Wysokinski, M. Use of renewable energy in the European Union—Trends of change. In Proceedings of the Economic Science for Rural Development Conference, Jelgava, Latvia, 9–10 May 2019. [Google Scholar] [CrossRef]
  79. Rokicki, T.; Michalski, K.; Ratajczak, M.; Szczepaniuk, H.; Golonko, M. Use of Renewable Energy Sources in European Union Countries. Annu. Set Environ. Prot. 2018, 20, 1318–1334. [Google Scholar]
  80. Rokicki, T.; Perkowska, A. Diversity and Changes in the Energy Balance in EU Countries. Energies 2021, 14, 1098. [Google Scholar] [CrossRef]
  81. Eurostat. Production of Electricity and Derived Heat by Type of Fuel[nrg_bal_peh]. 2021. Available online: https://appsso.eurostat.ec.europa.eu/nui/show.do?dataset=nrg_bal_peh&lang=en (accessed on 6 June 2021).
  82. McQueen, J.B. Some methods of classification and analysis of multivariate observations. In Proceedings of the Fifth Berkeley Symposium on Mathematical Statistics and Probability, Los Angeles, CA, USA, 21 June–18 July 1967; pp. 181–197. [Google Scholar]
  83. Han, J.; Kamber, M.; Pei, J. Data Mining Concepts and Techniques, 3rd ed.; Elsevier: Amsterdam, The Netherlands, 2012. [Google Scholar]
  84. Yadav, J.; Sharma, M. A Review of K-mean Algorithm. Int. J. Eng. Trends Technol. 2013, 4, 2972–2976. [Google Scholar]
  85. Bieszk-Stolorz, B.; Dmytrów, K. Spatial diversity of effectiveness of forms of professional activisation in Poland in years 2008–2014 by poviats. Oeconomia Copernic. 2019, 10, 113–130. [Google Scholar] [CrossRef]
  86. Kaufman, L.; Rousseeuw, P.J. Finding Groups in Data-An Introduction to Cluster Analysis; John Wiley & Sons: New York, NY, USA, 1990. [Google Scholar]
  87. Dudek, A. Silhouette Index as Clustering Evaluation Tool. In Classification and Data Analysis. SKAD 2019. Studies in Classification, Data Analysis, and Knowledge Organization; Jajuga, K., Batóg, J., Walesiak, M., Eds.; Springer: Berlin/Heidelberg, Germany, 2020. [Google Scholar]
  88. Roszko-Wójtowicz, E.; Grzelak, M.M. Multi-dimensional analysis of regional investment attractiveness in Poland. Equilibrium. Q. J. Econ. Econ. Policy 2021, 16, 103–138. [Google Scholar] [CrossRef]
  89. Walesiak, M. Rekomendacje w zakresie strategii postępowania w procesie klasyfikacji zbioru obiektów (ang. Recommendations for strategies to deal with the classification process of a set of objects). In Przestrzenno-Czasowe Modelowanie i Prognozowanie Zjawisk Gospodarczych (Spatial-Temporal Modelling and Forecasting of Economic Phenomena); Zeliaś, A., Ed.; CeON Repository: Unspecified, Poland, 2006; pp. 185–203. [Google Scholar]
  90. Eurostat. Simplified Energy Balances [nrg_bal_s]. Final Consumption—Energy Use. 2021. Available online: https://appsso.eurostat.ec.europa.eu/nui/show.do?dataset=nrg_bal_s (accessed on 29 July 2021).
  91. Eurostat. Access to Methodology Information on Energy data. 2021. Available online: https://ec.europa.eu/eurostat/web/energy/methodology (accessed on 29 July 2021).
  92. Eurostat. RAMON—Concepts and Definitions, Eurostat’s Concepts and Definitions Database—Term Hydro (Code RA100). 2021. Available online: https://ec.europa.eu/eurostat/ramon/nomenclatures/index.cfm?TargetUrl=DSP_GLOSSARY_NOM_DTL_VIEW&StrNom=CODED2&StrLanguageCode=EN&IntKey=16493335&RdoSearch=&TxtSearch=&CboTheme=&IsTer=&ter_valid=0&IntCurrentPage=1 (accessed on 29 July 2021).
  93. Eurostat. RAMON—Concepts and Definitions, Eurostat’s Concepts and Definitions Database—Term Wind (Code RA300). 2021. Available online: https://ec.europa.eu/eurostat/ramon/nomenclatures/index.cfm?TargetUrl=DSP_GLOSSARY_NOM_DTL_VIEW&StrNom=CODED2&StrLanguageCode=EN&IntKey=16623435&RdoSearch=&TxtSearch=&CboTheme=&IsTer=&ter_valid=0&IntCurrentPage=121 (accessed on 29 July 2021).
  94. Eurostat. RAMON—Concepts and definitions, Eurostat’s Concepts and Definitions Database—Term Solar Photovoltaic (code RA420). 2021. Available online: https://ec.europa.eu/eurostat/ramon/nomenclatures/index.cfm?TargetUrl=DSP_GLOSSARY_NOM_DTL_VIEW&StrNom=CODED2&StrLanguageCode=EN&IntKey=22543617&RdoSearch=BEGIN&TxtSearch=solar&CboTheme=&IsTer=&IntCurrentPage=1&ter_valid=0 (accessed on 29 July 2021).
  95. Eurostat. RAMON—Concepts and Definitions, Eurostat’s Concepts and Definitions Database—Term Solar Thermal (Code RA410). 2021. Available online: https://ec.europa.eu/eurostat/ramon/nomenclatures/index.cfm?TargetUrl=DSP_GLOSSARY_NOM_DTL_VIEW&StrNom=CODED2&StrLanguageCode=EN&IntKey=22543667&RdoSearch=BEGIN&TxtSearch=solar&CboTheme=&IsTer=&IntCurrentPage=1&ter_valid=0 (accessed on 29 July 2021).
  96. Balat, M. Hydropower Systems and Hydropower Potential in the European Union Countries. Energy Sources Part A Recover. Util. Environ. Eff. 2006, 28, 965–978. [Google Scholar] [CrossRef]
  97. Sternberg, R. Hydropower’s future, the environment, and global electricity systems. Renew. Sustain. Energy Rev. 2010, 14, 713–723. [Google Scholar] [CrossRef]
  98. Renöfält, B.M.; Jansson, R.; Nilsson, C. Effects of hydropower generation and opportunities for environmental flow management in Swedish riverine ecosystems. Freshw. Biol. 2010, 55, 49–67. [Google Scholar] [CrossRef]
  99. Botelho, A.; Ferreira, P.; Lima, F.; Pinto, L.M.C.; Sousa, S. Assessment of the environmental impacts associated with hydropower. Renew. Sustain. Energy Rev. 2017, 70, 896–904. [Google Scholar] [CrossRef]
  100. European Commission. Hydropower, Why the EU Supports Hydropower Research and Innovation. 2021. Available online: https://ec.europa.eu/info/research-and-innovation/research-area/energy-research-and-innovation/hydropower_en (accessed on 5 August 2021).
  101. Directive 2000/60/EC of the European Parliament and of the Council Establishing a Framework for Community Action in the Field of Water Policy. 2000. Available online: https://eur-lex.europa.eu/legal-content/en/ALL/?uri=CELEX%3A32000L0060 (accessed on 5 August 2021).
  102. Fruhmann, C.; Tuerk, A.; Kulmer, V.; Gubina, A.F. Balancing environmental benefits and damages of small hydropower generation in policy-making: Assessing the implementation of a contradicting EU policy framework in Austria and Slovenia. Int. J. Sustain. Energy 2019, 38, 37–49. [Google Scholar] [CrossRef]
  103. International Water Power & Dam Construction. EIB Funds New Dams in Portugal, 23 July 2018. Available online: https://www.waterpowermagazine.com/news/newseib-funds-new-dams-in-portugal-6261561 (accessed on 29 July 2021).
  104. Bohanec, M.; Trdin, N.; Kontić, B. A qualitative multi-criteria modelling approach to the assessment of electric energy production technologies in Slovenia. Cent. Eur. J. Oper. Res. 2017, 25, 611–625. [Google Scholar] [CrossRef]
  105. Štreimikiene, D.; Šliogeriene, J.; Turskis, Z. Multi-criteria analysis of electricity generation technologies in Lithuania. Renew. Energy 2016, 85, 148–156. [Google Scholar] [CrossRef]
  106. Jatautas, J.; Kasiulis, E. The effect of legislation on hydropower development: Case study of Lithuania. Investig. Manag. Financ. Innov. 2016, 13, 300–309. [Google Scholar] [CrossRef] [Green Version]
  107. Wang, S.; Wang, S. Impacts of wind energy on environment: A review. Renew. Sustain. Energy Rev. 2015, 49, 437–443. [Google Scholar] [CrossRef]
  108. Dragomir, G.; Şerban, A.; NǍstase, G.; Brezeanu, A.I. Wind energy in Romania: A review from 2009 to 2016. Renew. Sustain. Energy Rev. 2016, 64, 129–143. [Google Scholar] [CrossRef]
  109. European Commission. Communication from the Commission to the European Parliament, the European Council, the Council, the European Economic and Social Committee, the Committee of the Regions and the European Investment Bank: A Clean Planet for All. A European Strategic Long-Term Vision for a Prosperous, Modern, Competitive and Climate Neutral Economy COM/2018/773 Final, Brussels. 2018. Available online: https://eur-lex.europa.eu/legal-content/EN/TXT/?uri=CELEX:52018DC0773 (accessed on 30 July 2021).
  110. European Commission. 2050 Long-Term Strategy. 2021. Available online: https://ec.europa.eu/clima/policies/strategies/2050_en#tab-0-0 (accessed on 30 July 2021).
  111. European Commission. Why the EU Supports Wind Energy Research and Innovation. 2021. Available online: https://ec.europa.eu/info/research-and-innovation/research-area/energy-research-and-innovation/wind-energy_en (accessed on 30 July 2021).
  112. Papież, M.; Śmiech, S.; Frodyma, K. Factors affecting the efficiency of wind power in the European Union countries. Energy Policy 2019, 132, 965–977. [Google Scholar] [CrossRef]
  113. Renewable Energy Association. The European Commission Has Approved the Polish Offshore Wind Farm Support Program. 2021. Available online: http://seo.org.pl/en/ke-zatwierdzila-polski-program-wsparcia-morskich-farm-wiatrowych (accessed on 30 July 2021).
  114. Higgins, P.; Foley, A. The evolution of offshore wind power in the United Kingdom. Renew. Sustain. Energy Rev. 2014, 37, 599–612. [Google Scholar] [CrossRef]
  115. Kandrot, S.; Cummins, V.; Jordan, D.; Murphy, J. Economic and employment impacts of offshore wind for Ireland: A value chain analysis. Int. J. Green Energy 2020, 17, 687–696. [Google Scholar] [CrossRef]
  116. O’Hanlon, Z.; Cummins, V. A comparative insight of Irish and Scottish regulatory frameworks for offshore wind energy—An expert perspective. Mar. Policy 2020, 117, 103934. [Google Scholar] [CrossRef]
  117. Johansen, K. Wind Energy in Denmark: A Short History [History]. IEEE Power Energy Mag. 2021, 19, 94–102. [Google Scholar] [CrossRef]
  118. Chu, Y.; Meisen, P. Review and Comparison of Different Solar Energy Technologies; Global Energy Network Institute (GENI): San Diego, CA, USA, 2011. [Google Scholar]
  119. Šúri, M.; Huld, T.A.; Dunlop, E.D.; Ossenbrink, H.A. Potential of solar electricity generation in the European Union member states and candidate countries. Sol. Energy 2007, 81, 1295–1305. [Google Scholar] [CrossRef]
  120. Hofierka, J.; Kaòuk, J.; Gallay, M. The Spatial Distribution of Photovoltaic Power Plants in Relation to Solar Resource Potential: The Case of the Czech Republic and Slovakia. 2014. Available online: http://sunbird.jrc.it/pvgis/ (accessed on 30 July 2021).
  121. Timilsina, G.R.; Kurdgelashvili, L.; Narbel, P.A. Solar energy: Markets, economics and policies. Renew. Sustain. Energy Rev. 2012, 16, 449–465. [Google Scholar] [CrossRef]
  122. European Commission. Why the EU Supports Bioenergy Research and Innovation. 2021. Available online: https://ec.europa.eu/info/research-and-innovation/research-area/energy-research-and-innovation/bioenergy_en (accessed on 30 July 2021).
Figure 1. Gross electricity production (GEP), gross electricity production from renewables and biofuels (GEP_RES), and share of gross electricity production from RES in the total gross electricity production (%RES) in 1990–2019 in the European Union (EU-27). Source: Reference [81].
Energies 14 06276 g001
Figure 2. Shares of selected renewable sources ( X i E U ) in the production of electricity from renewable sources (GEP_RES). Source: Own calculation based on Reference [81].
Energies 14 06276 g002
Figure 3. Changes in concentration of analyzed types of renewable sources in the production of electricity from renewable sources (GEP_RES) in the EU-27 in 1990–2019. Source: Own calculation based on Reference [81].
Energies 14 06276 g003
Table 1. Share of electricity produced from renewable sources and biofuels in the total electricity production in individual EU countries in 2005 and 2019.
CountryShare of RES_GEP
in GEP (%)
Change
2019–2005
(pp)
CountryShare of RES_GEP
in GEP (%)
Change
2019–2005
(pp)
2005201920052019
BE—Belgium3.921.917.9LT—Lithuania5.781.976.3
BG—Bulgaria10.718.07.3LU—Luxembourg24.185.961.8
CZ—Czech Republic4.612.98.3HU—Hungary5.213.88.5
DK—Denmark27.178.251.1MT—Malta0.010.510.5
DE—Germany11.340.929.6Netherlands7.518.911.4
EE—Estonia1.128.127.0AT—Austria64.777.813.1
IE—Ireland8.538.930.3PL—Poland3.516.012.5
EL—Greece11.733.221.5PT—Portugal18.654.235.7
ES—Spain16.237.821.6RO—Romania34.042.08.0
FR—France10.620.710.0SI—Slovenia23.632.68.9
HR—Croatia54.466.211.8SK—Slovakia15.224.28.9
IT—Italy18.340.121.9FI—Finland33.446.613.3
CY—Cyprus0.010.010.0SE—Sweden51.358.77.4
LT—Latvia69.649.6−20.0UK—United Kingdom5.037.832.8
EU2716.334.618.3
Source: Own study based on data [81].
Table 2. Gross electricity production from RES and the total gross electricity production in EU-27 in 2005 and 2019.
Energy Product-Source
(Eurostat’s Codes Included)
200520192019/2005
GWh X i E U ( % ) GWh X i E U ( % ) d G E P _ R E S i E U
(1)(2)(3)(4)(5)(6)
RA000—Renewables and biofuels476,989.5931001,005,271.556100110.8%
RA100—Hydro340,546.18471.4345,264.88734.31.4%
RA200—Geothermal5397.6731.16725.8060.724.6%
RA300—Wind68,094.58714.3367,115.30136.5439.1%
RA410—Solar thermal0.0000.05683.0000.6x
RA420—Solar photovoltaic1458.6880.3120,034.72111.98129.0%
RA500—Tide, wave, ocean480.8950.1498.9640.03.8%
R5110-5150_W6000RI—Primary solid biofuels40,583.5288.580,720.5468.098.9%
R5220P—Pure biodiesels0.0000.029.5410.0x
R5290—Other liquid biofuels1767.7300.45170.8420.5192.51%
R5300—Biogases8063.6421.754,951.3055.5581.47%
W6210—Renewable municipal waste10,596.6662.219,076.6431.980.02%
TOTAL—Total2,917,663.780x2,904,012.166x−0.5%
Source: Own elaboration based on Reference [81]; d G E P _ R E S i E U = G E P _ R E S i , 2019 E U G E P _ R E S i , 2005 E U 1 · 100 % —means a change in the production of electricity from the i-th source in the period 2005–2019.
Table 3. Concentration of types of sources in the production of electricity from renewable sources in the EU countries—the values of Gini coefficients.
20052019 20052019
Country G 2005 G 2019 G Country G 2005 G 2019 G
Belgium0.5840.536−0.048Lithuania0.8520.608−0.244
Bulgaria0.8570.515−0.342Luxembourg0.7900.594−0.196
Czech Republic0.7820.409−0.373Hungary0.7910.517−0.274
Denmark0.7160.711−0.005Maltax0.849x
Germany0.5620.552−0.01Netherlands0.6260.591−0.035
Estonia0.5830.6870.104Austria0.8160.737−0.079
Ireland0.6970.7710.074Poland0.7520.655−0.097
Greece0.7950.614−0.181Portugal0.6640.621−0.043
Spain0.6850.646−0.039Romania0.8570.722−0.135
France0.8040.625−0.179Slovenia0.8450.807−0.038
Croatia0.8560.708−0.148Slovakia0.8530.688−0.165
Italy0.7130.448−0.265Finland0.7310.603−0.128
Cyprus0.7470.672−0.075Sweden0.8200.711−0.109
Latvia0.8460.700−0.146UK0.5100.5670.057
EU270.7040.512−0.192
Source: Own calculation based on Reference [81]. G = G 2019 G 2005 .
Table 4. Silhouette coefficients for the 2005, 2011, and 2019 classifications and the selected number of clusters.
Number of ClustersSilhouette Coefficient
200520112019
80.7130.5980.519
90.7900.4800.590
100.8100.5540.603
110.8300.6490.545
120.8520.8320.537
Source: Own calculations.
Table 5. The results of the classification of EU countries according to the shares of individual renewable energy sources in the production of electricity (clusters averages, %)—data from 2005.
#CountryHydroWindSolarBiofuelsBiogasesWasteOther
X ¯ 1 2005 X ¯ 2 2005 X ¯ 3 2005 X ¯ 4 2005 X ¯ 5 2005 X ¯ 6 2005 X ¯ 7 2005
1 UK 39.5214.620.0416.9823.994.850.00
2 BG, CZ, EL, FR, HR, LV, LT,
LU, AT, RO, SI SK, SE
93.342.440.142.531.000.490.06
3 HU 10.810.540.0084.181.313.150.00
4 DK 0.2367.410.0219.302.8610.170.00
5 NL 1.1827.750.4849.633.9617.000.00
6 DE, EE, IE, ES 37.6245.840.488.356.301.400.00
7 BE, PL, PT, FI 58.617.590.0227.772.283.520.20
8 MT 0.000.000.000.000.000.000.00
9 CY 0.0038.5461.450.000.000.000.00
10 IT 77.624.240.063.922.172.379.63
Source: Own calculation in STATISTICA based on Reference [81]. Country abbreviations refer to those used by Eurostat; see Table 3.
Table 6. Results of the classification of EU countries according to the shares of individual renewable energy sources in the production of electricity (clusters averages, %)—data from 2011.
#CountryHydroWindSolarBiofuelsBiogasesWasteOther
X ¯ 1 2011 X ¯ 2 2011 X ¯ 3 2011 X ¯ 4 2011 X ¯ 5 2011 X ¯ 6 2011 X ¯ 7 2011
1 FI 51.481.990.0244.750.661.110.00
2 DE, CY, UK 13.5548.207.487.5920.642.540.01
3 BE, CZ 24.2014.5919.8428.168.794.410.00
4 DK, IE 6.5774.840.0612.113.063.350.00
5 MT 0.000.0050.400.0049.600.000.00
6 EE, HU, PL 10.3725.990.0258.004.161.470.00
7 EL, ES, LT, PT 49.7838.114.715.131.530.520.21
8 BG, FR, HR, LV, LU,
AT, RO, SI, SK, SE
84.896.671.684.091.710.890.08
9 NL 0.4641.400.8532.388.4016.510.00
10 IT 56.2511.6112.726.154.012.606.66
Source: Own calculation in STATISTICA based on Reference [81]. For country abbreviations, refer to those used by Eurostat (see Table 3).
Table 7. Results of the classification of EU countries according to the shares of individual renewable energy sources in the production of electricity (clusters averages, %)—data from 2019.
#CountriesHydroWindSolarBiofuelsBiogasesWasteOther
X ¯ 1 2011 X ¯ 2 2011 X ¯ 3 2011 X ¯ 4 2011 X ¯ 5 2011 X ¯ 6 2011 X ¯ 7 2011
1 IT 40.9217.1720.137.587.032.015.16
2 BG, FR, LV, LU, SK, FI, SE 55.7715.296.6116.704.201.340.07
3 CZ 28.306.2420.6121.3822.540.930.00
4 HR, AT, RO, SI 74.8114.364.204.241.950.150.27
5 HU 4.6715.5531.9437.746.782.920.38
6 EE 0.8932.073.4358.811.812.990.00
7 BE, NL 3.0649.1622.1514.494.296.860.00
8 MT 0.000.0397.040.002.930.000.00
9 DK, IE, EL, ES
LT, PL, PT, UK
17.9357.358.4111.482.101.730.10
10 DE, CY 5.1748.5230.542.3212.251.170.04
Source: Own calculation in STATISTICA based on Reference [81]. Country abbreviations refer to those used by Eurostat (see Table 3).
Publisher’s Note: MDPI stays neutral with regard to jurisdictional claims in published maps and institutional affiliations.

