
The Use of Well-Log Data in the Geomechanical Characterization of Middle Cambrian Tight Sandstone Formation: A Case Study from Eastern Pomerania, Poland


Abstract
:1. Introduction
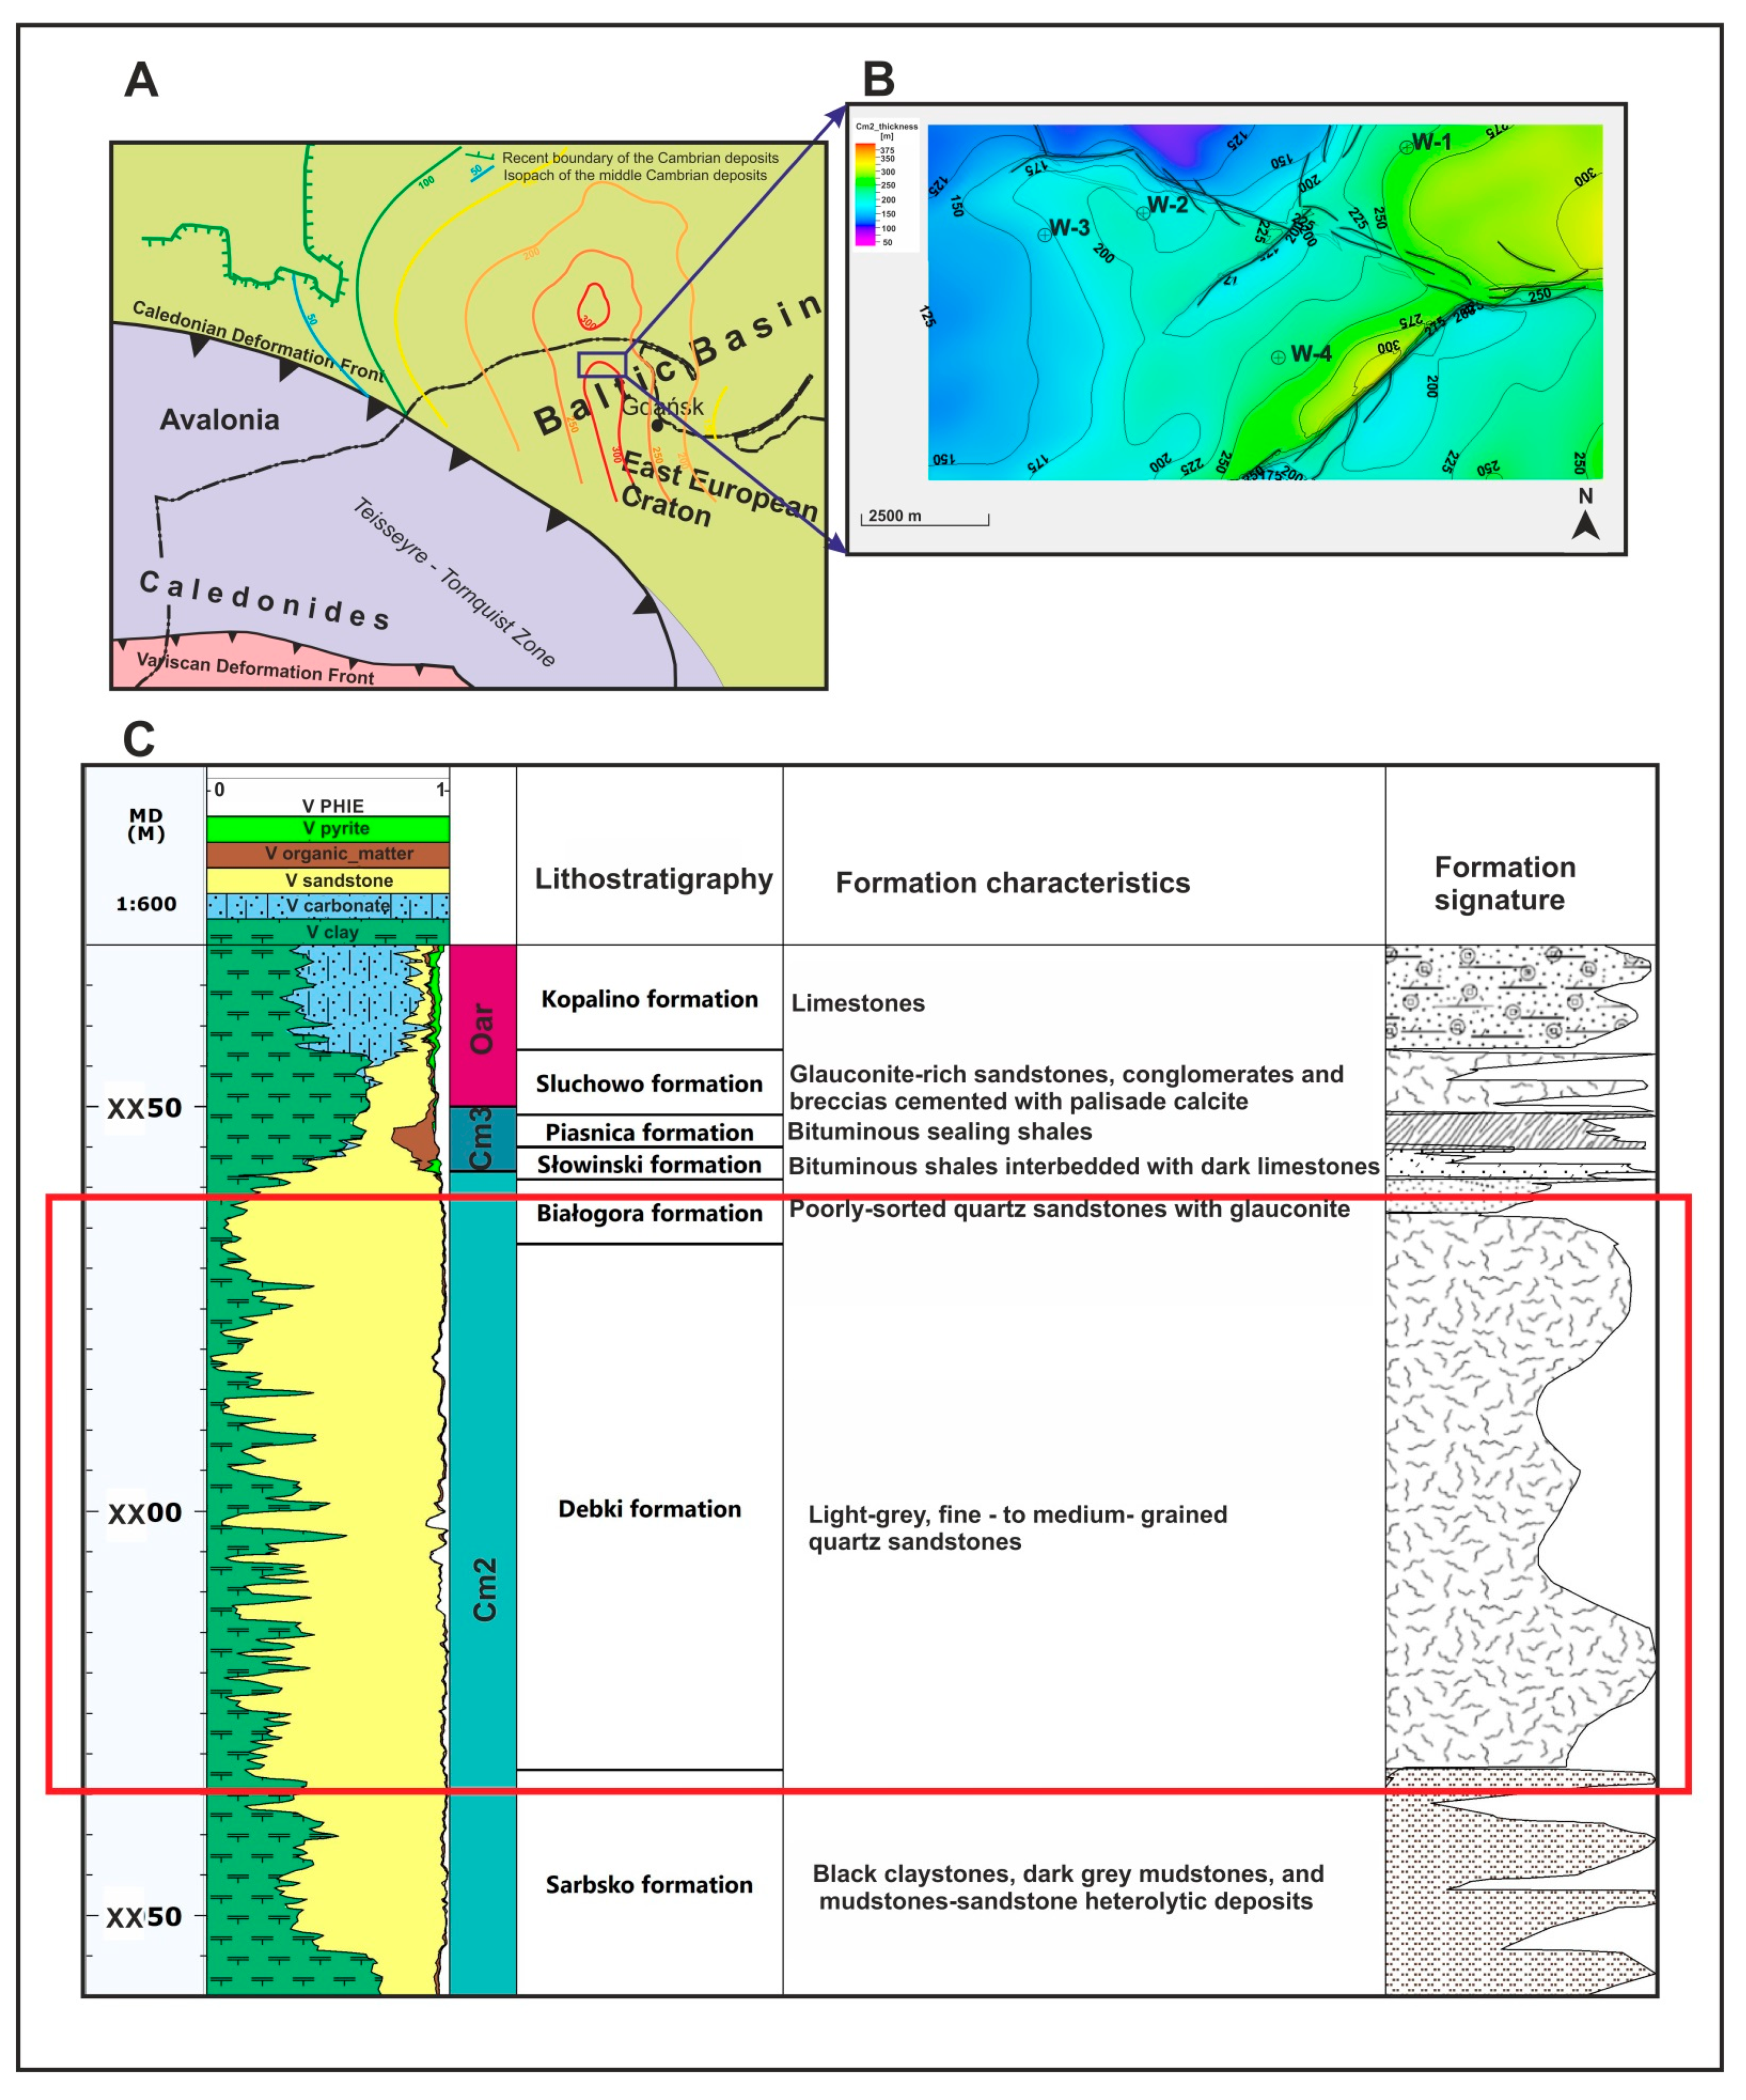
Geological Setting

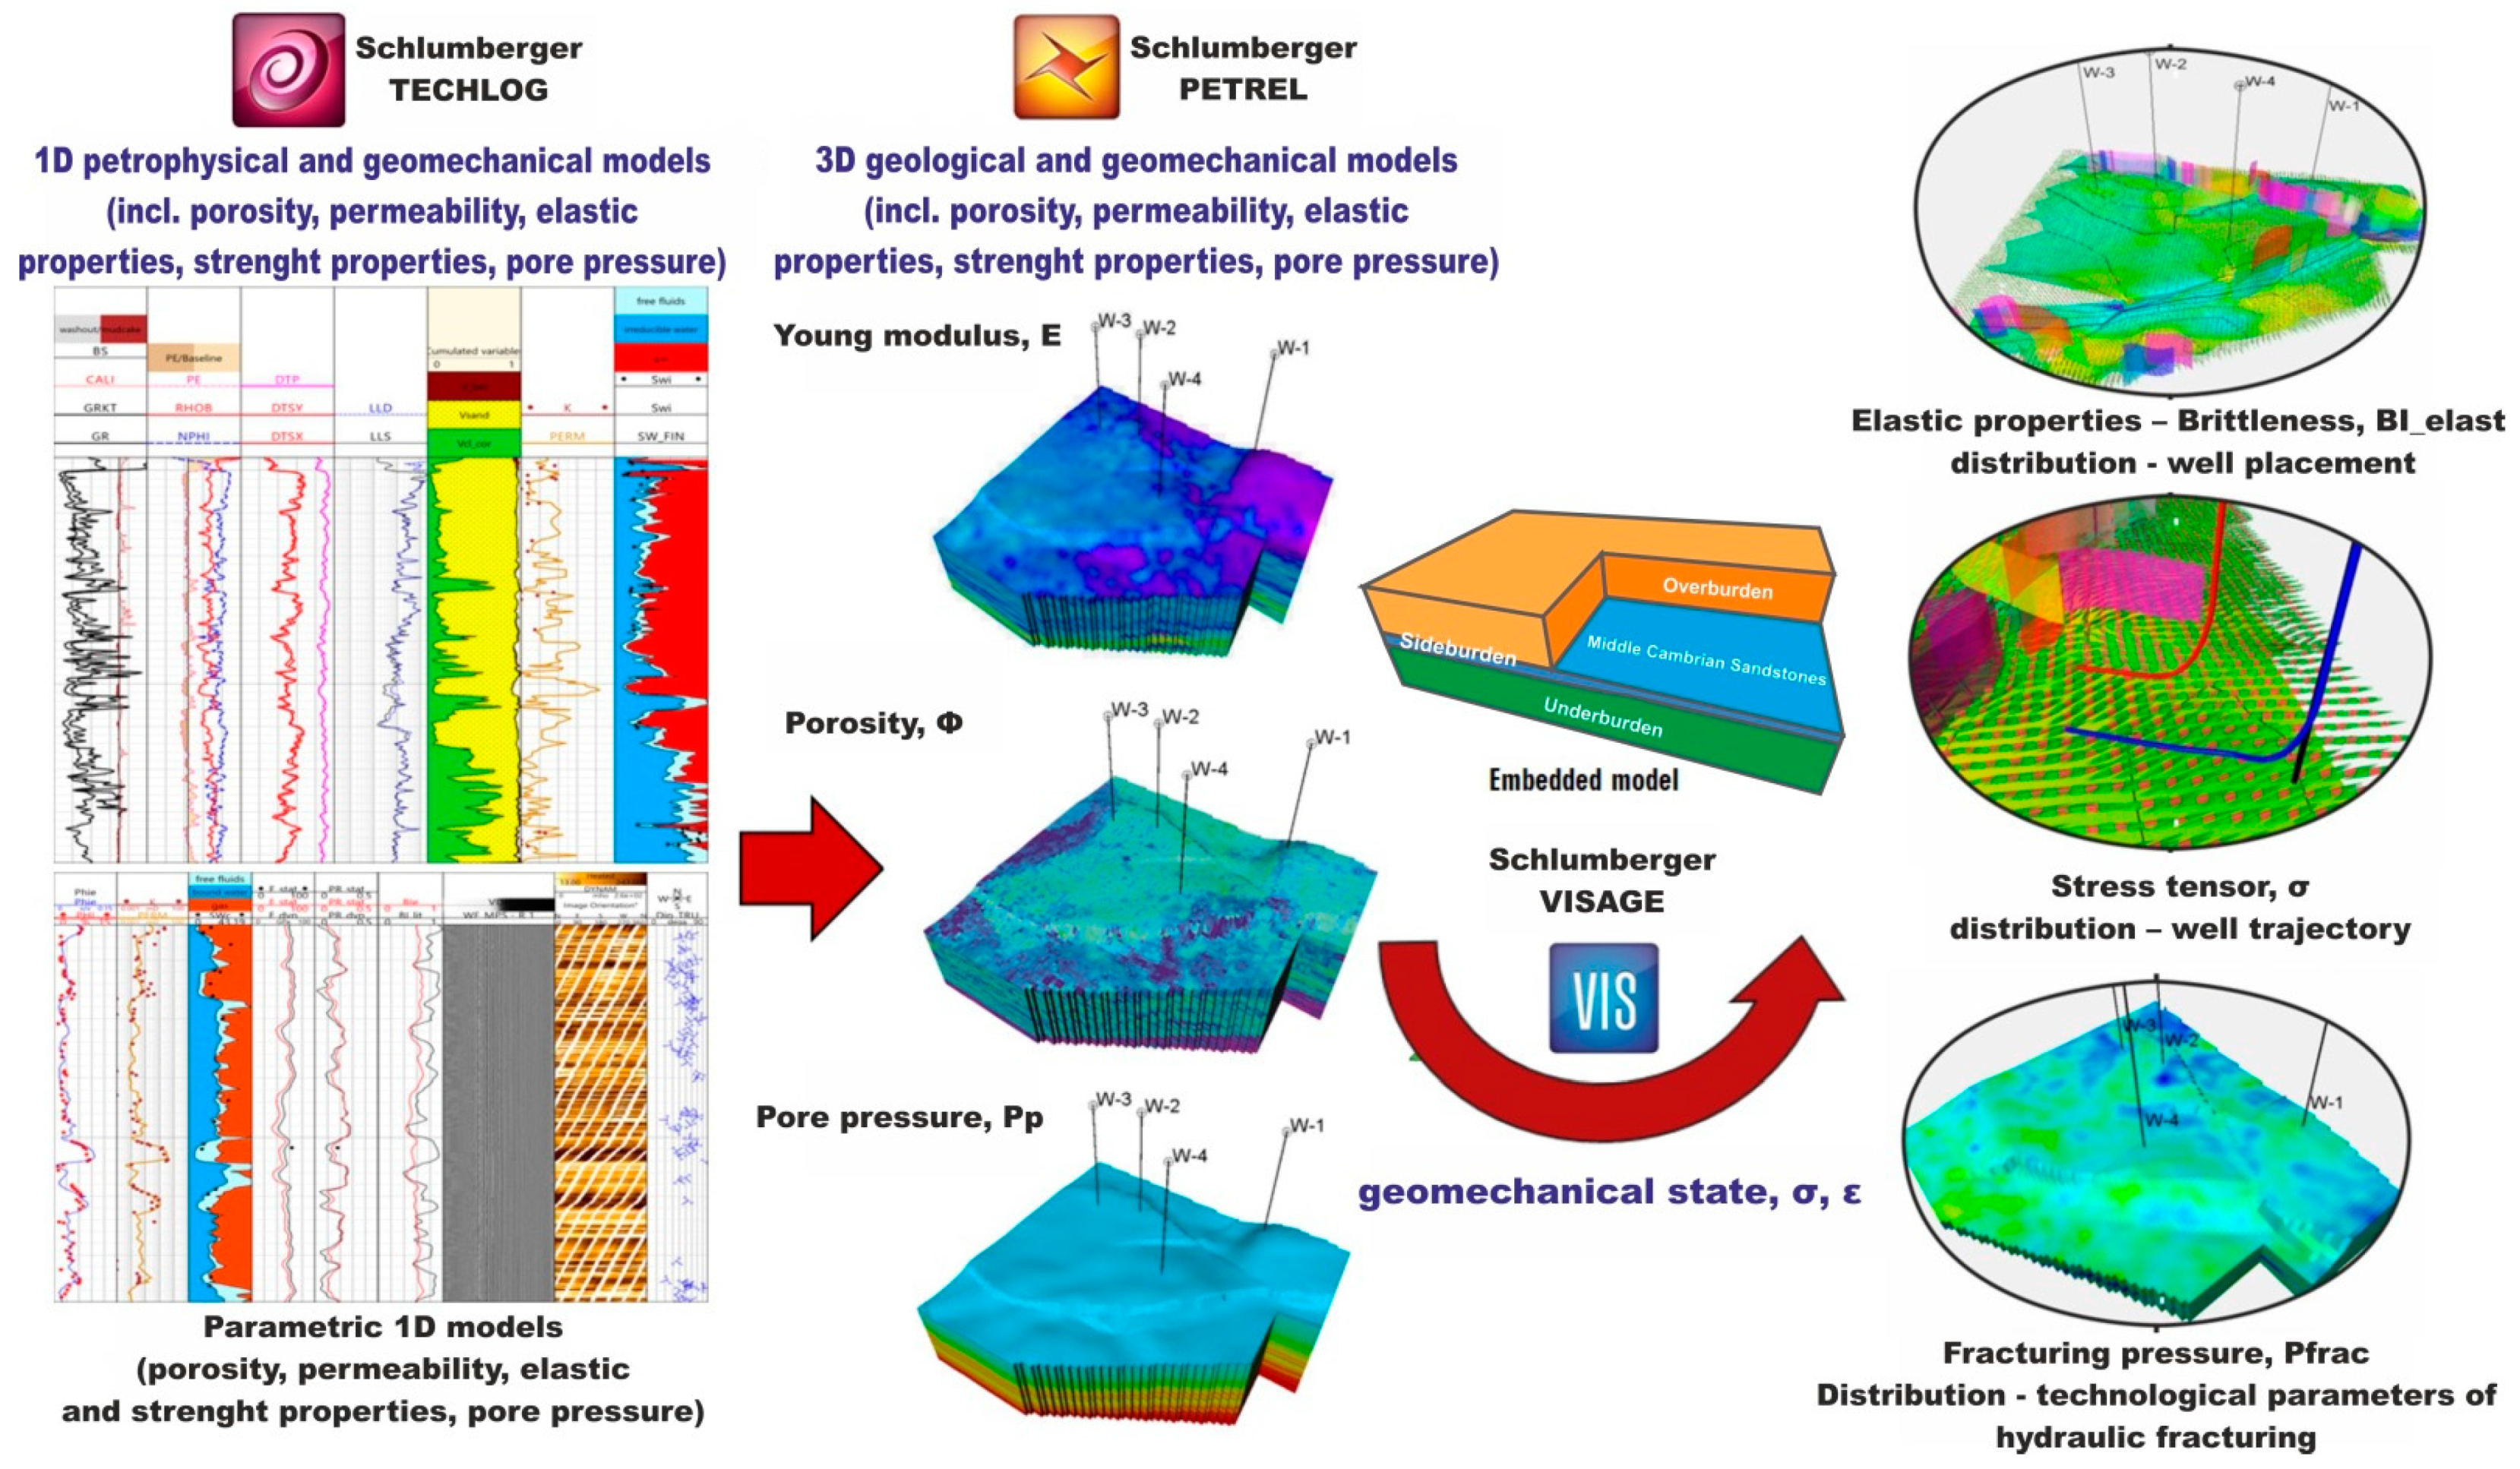
2. Methodology
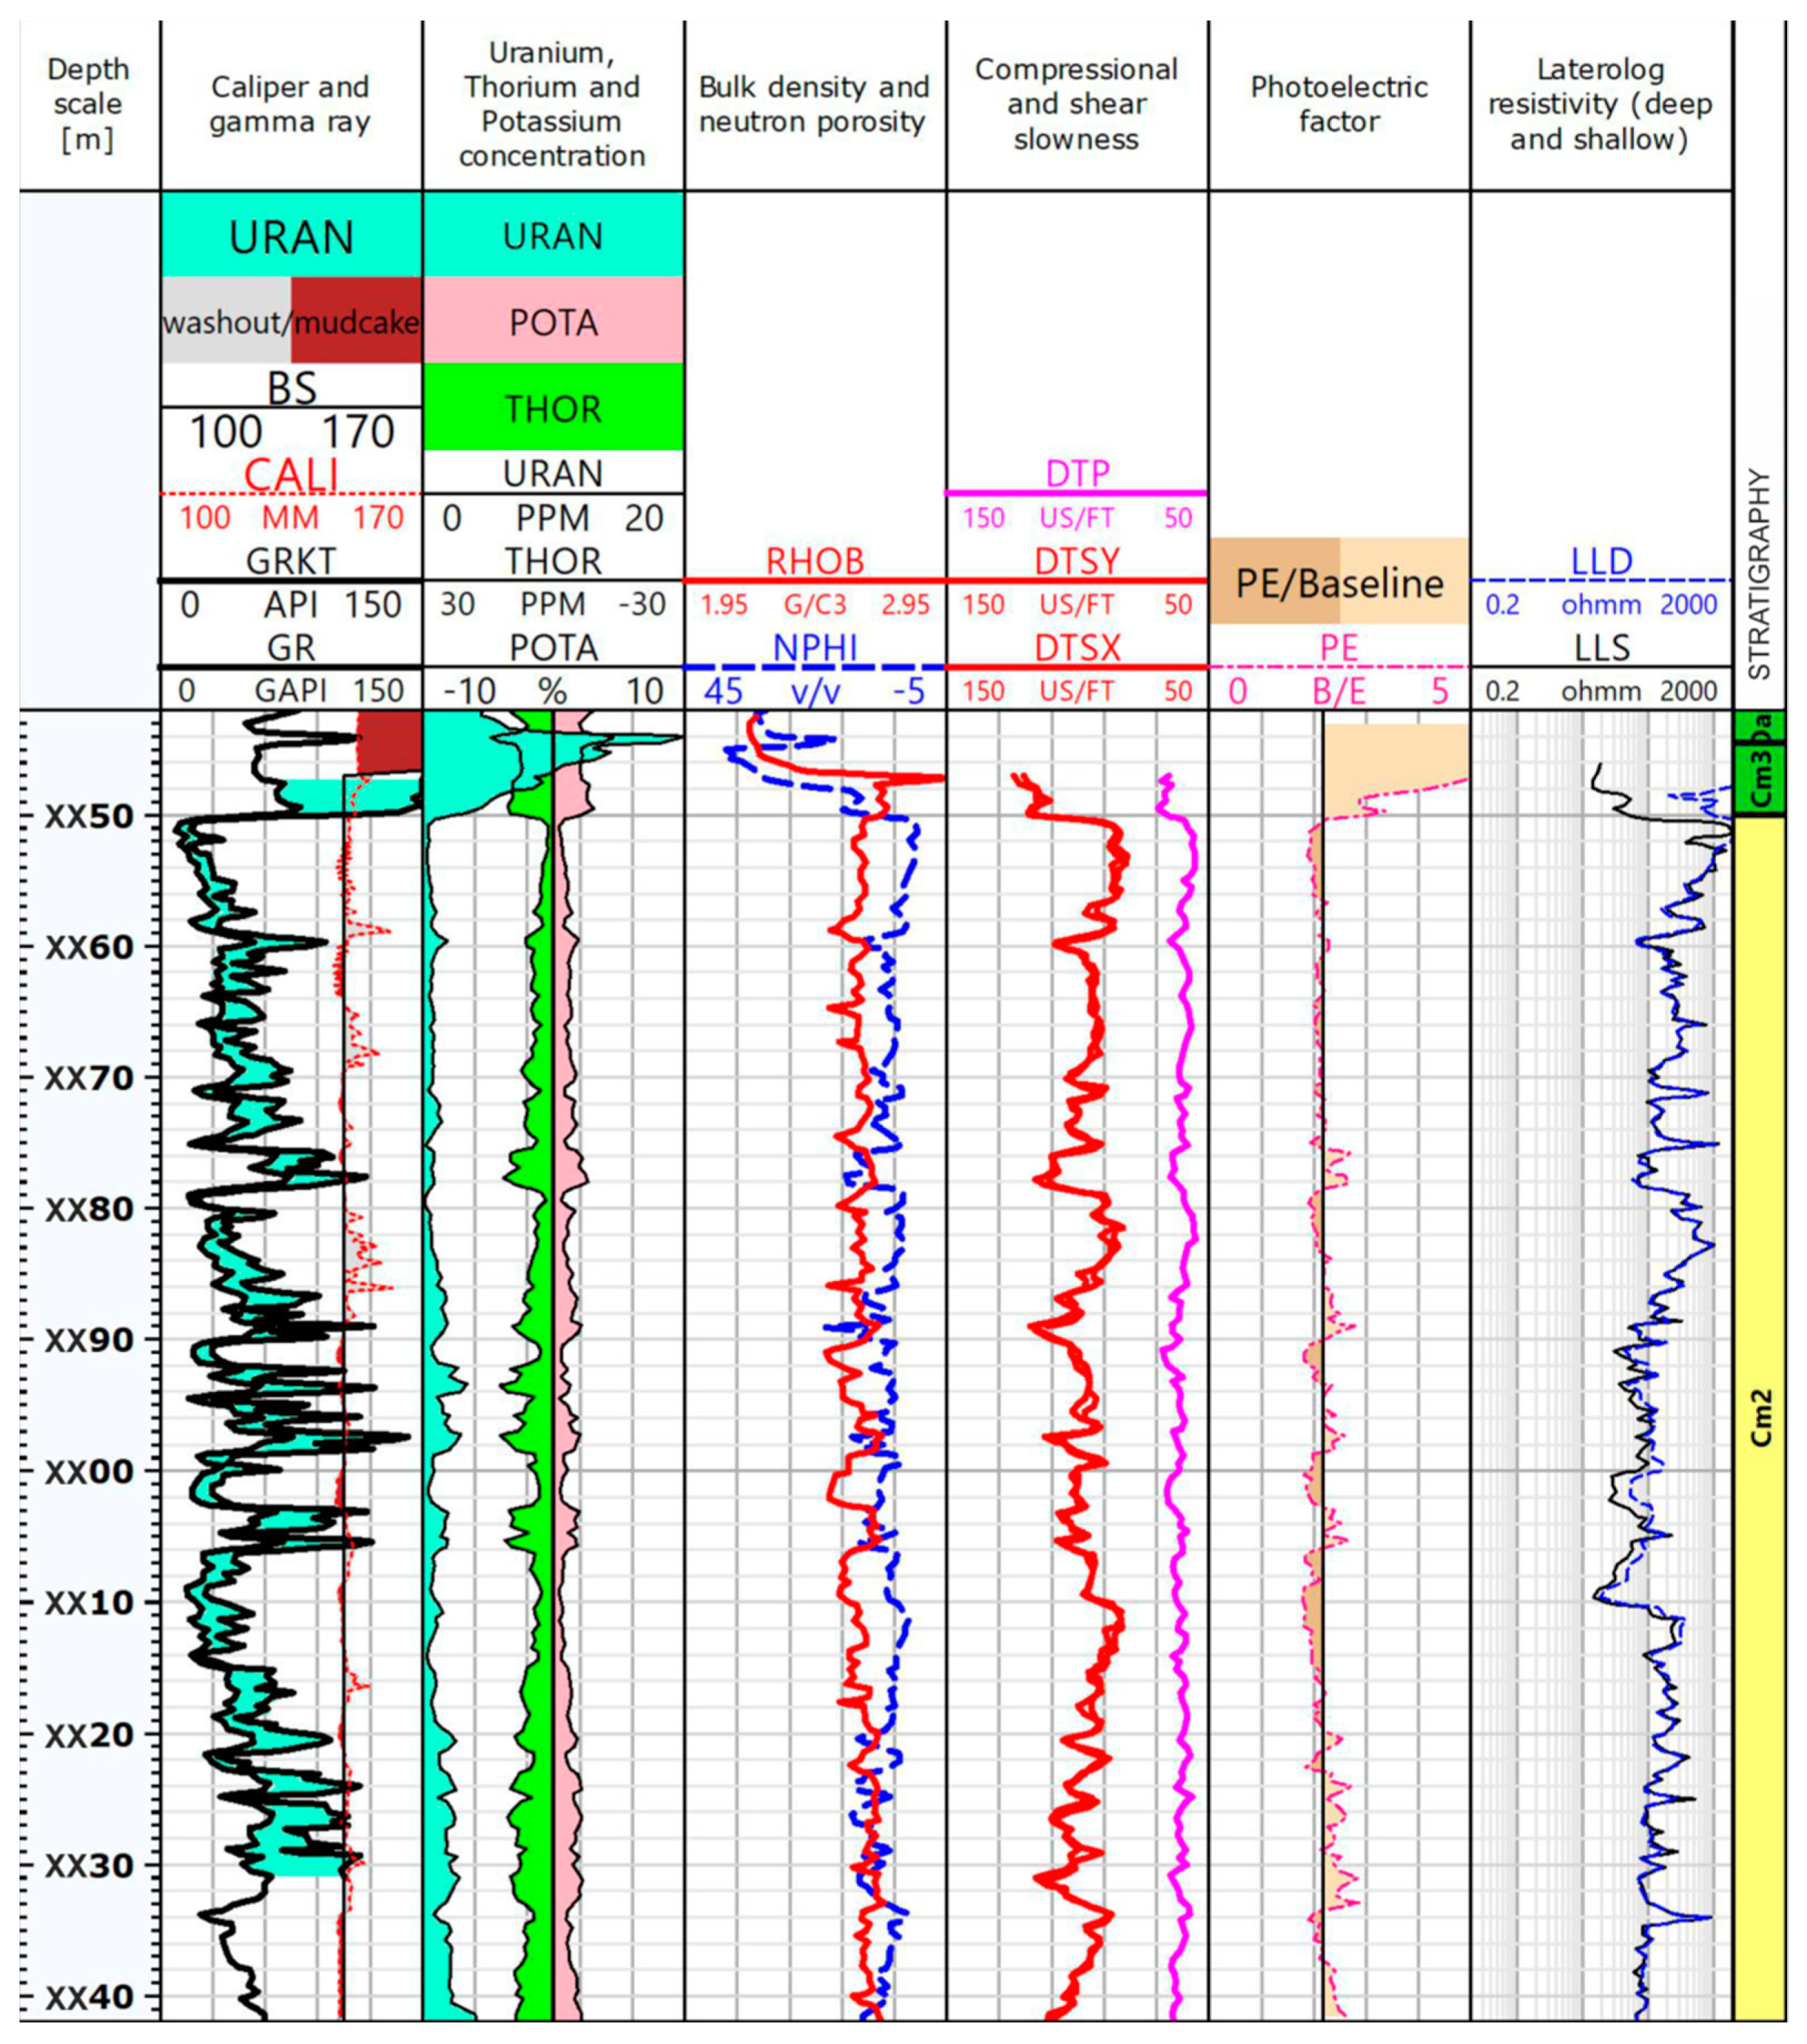
2.1. Relevant Input Data
2.2. Determination of Elastic Parameters
2.3. Calculation of the Brittleness Index (BI)
2.4. Determination of the Stress Field
3. Characterization of Petrophysical and Elastic Properties
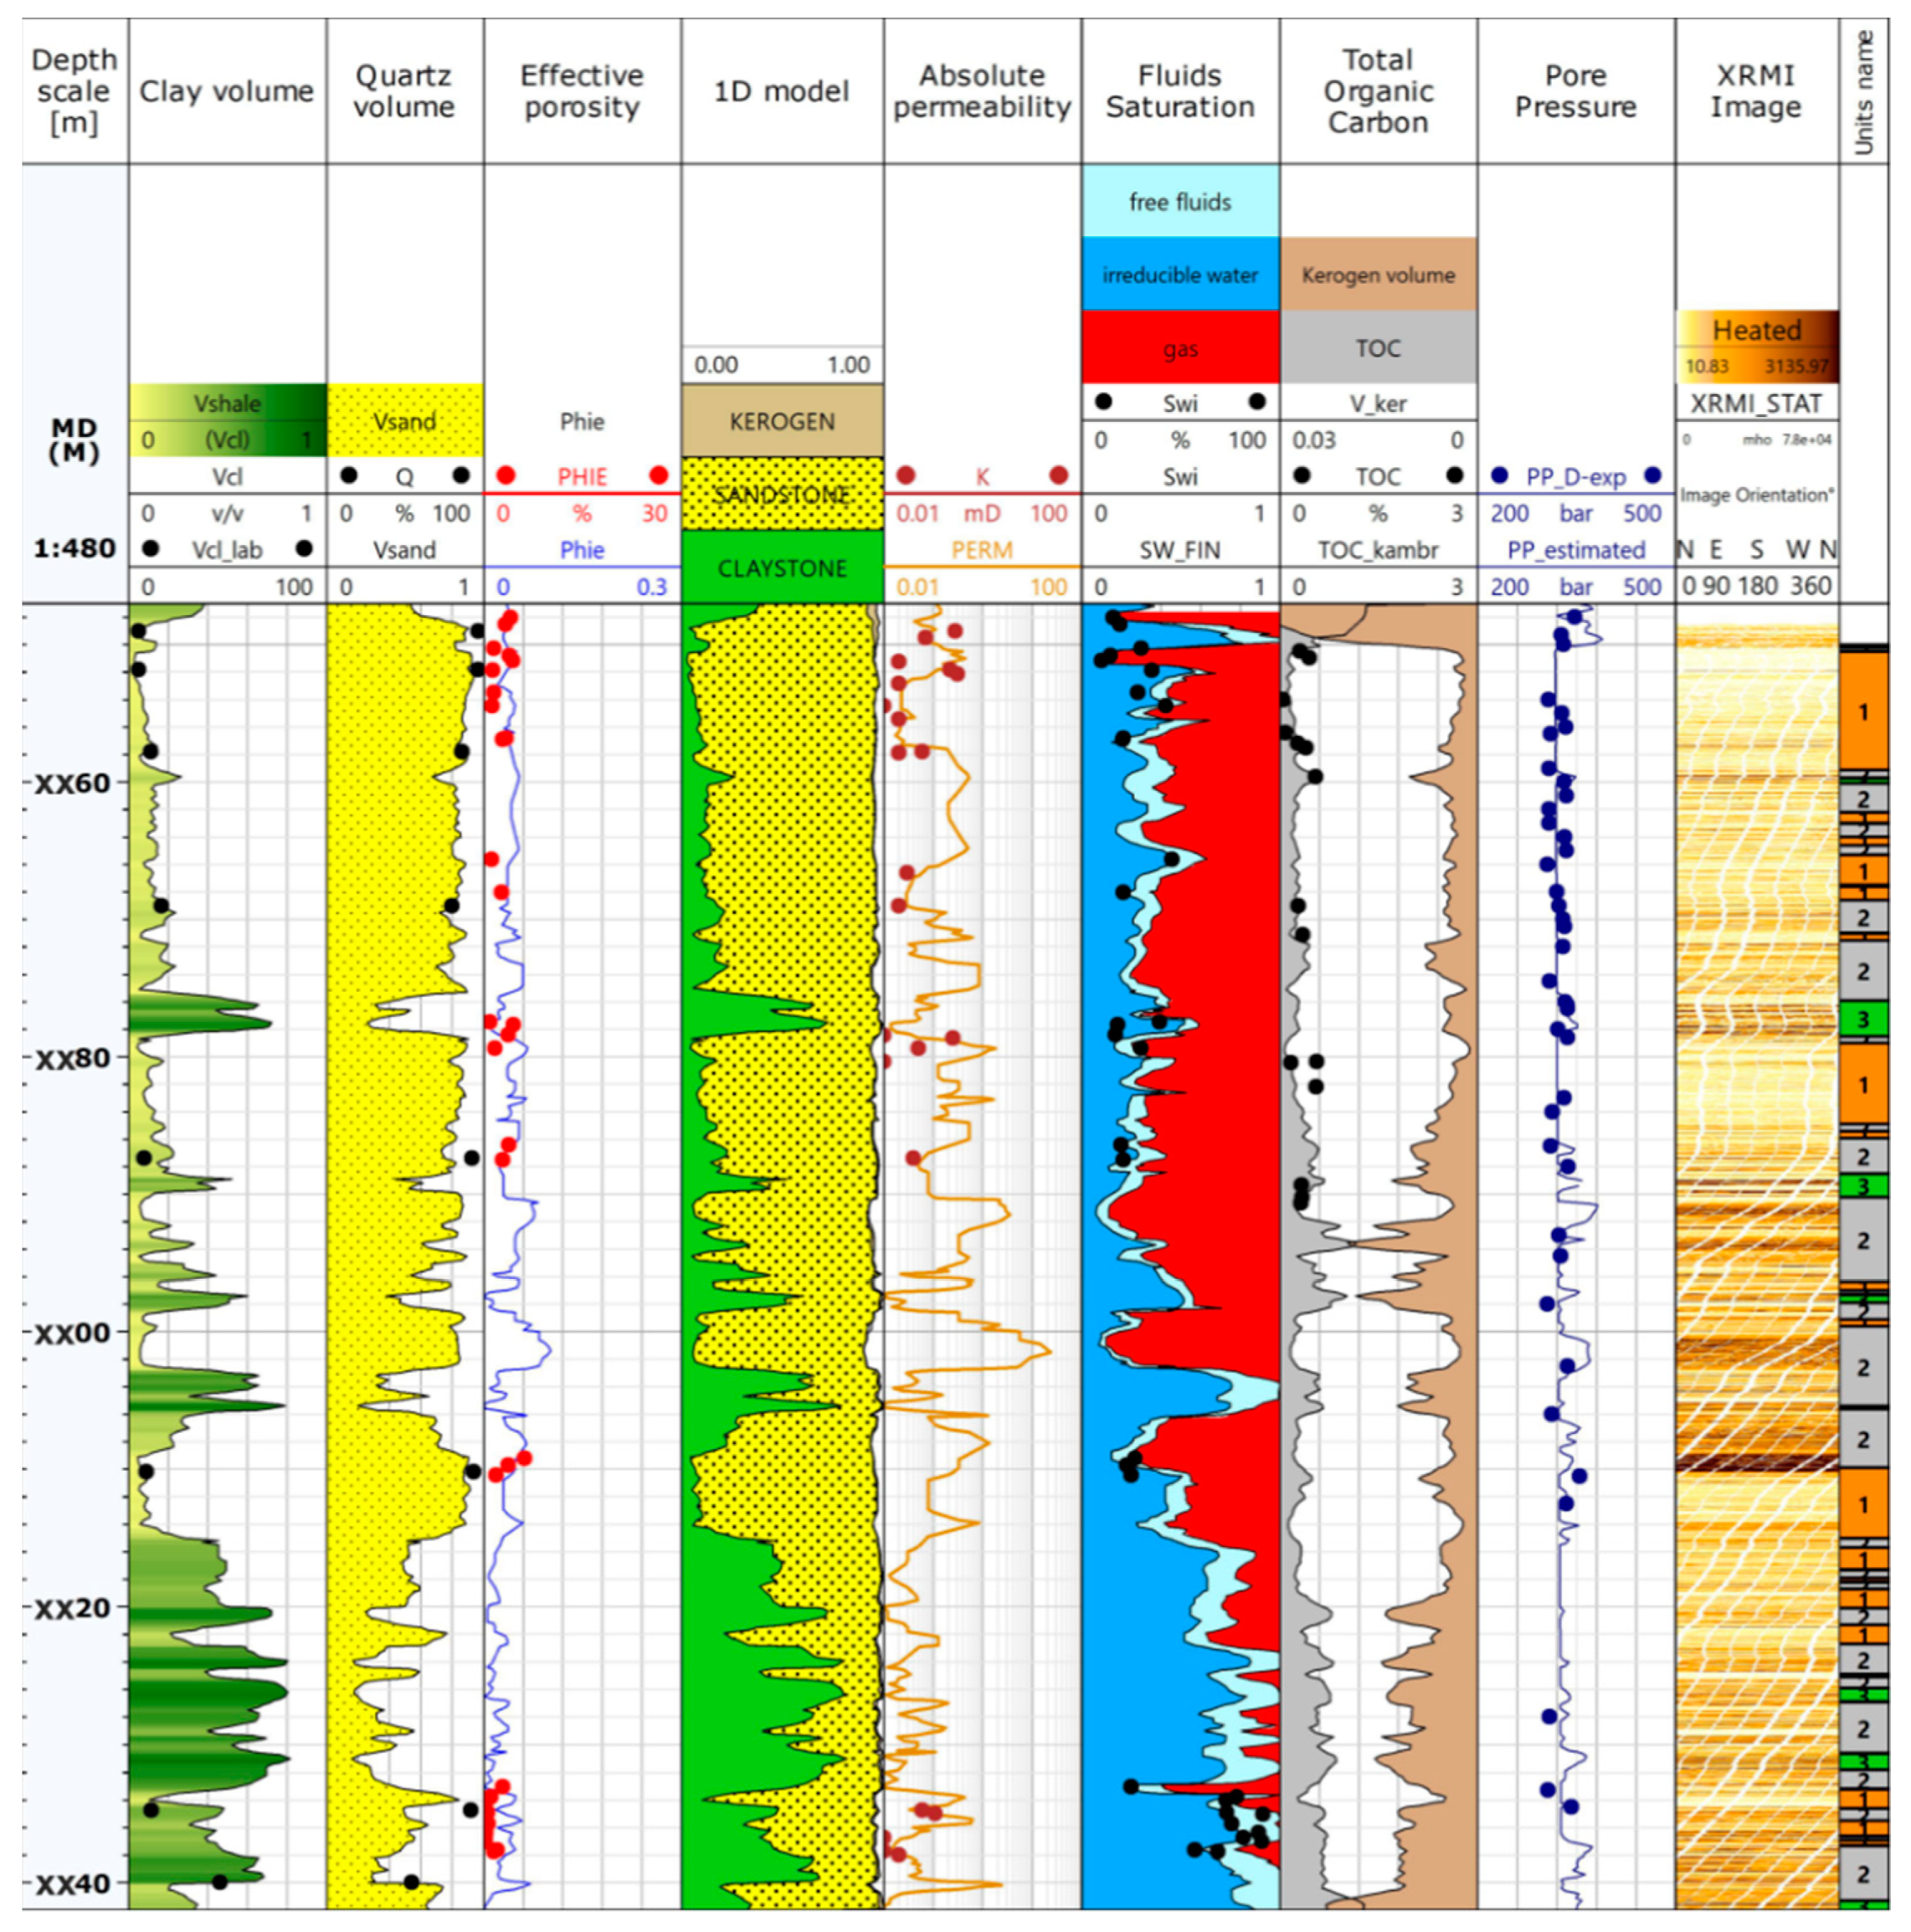
3.1. The Results of Petrophysical Interpretation
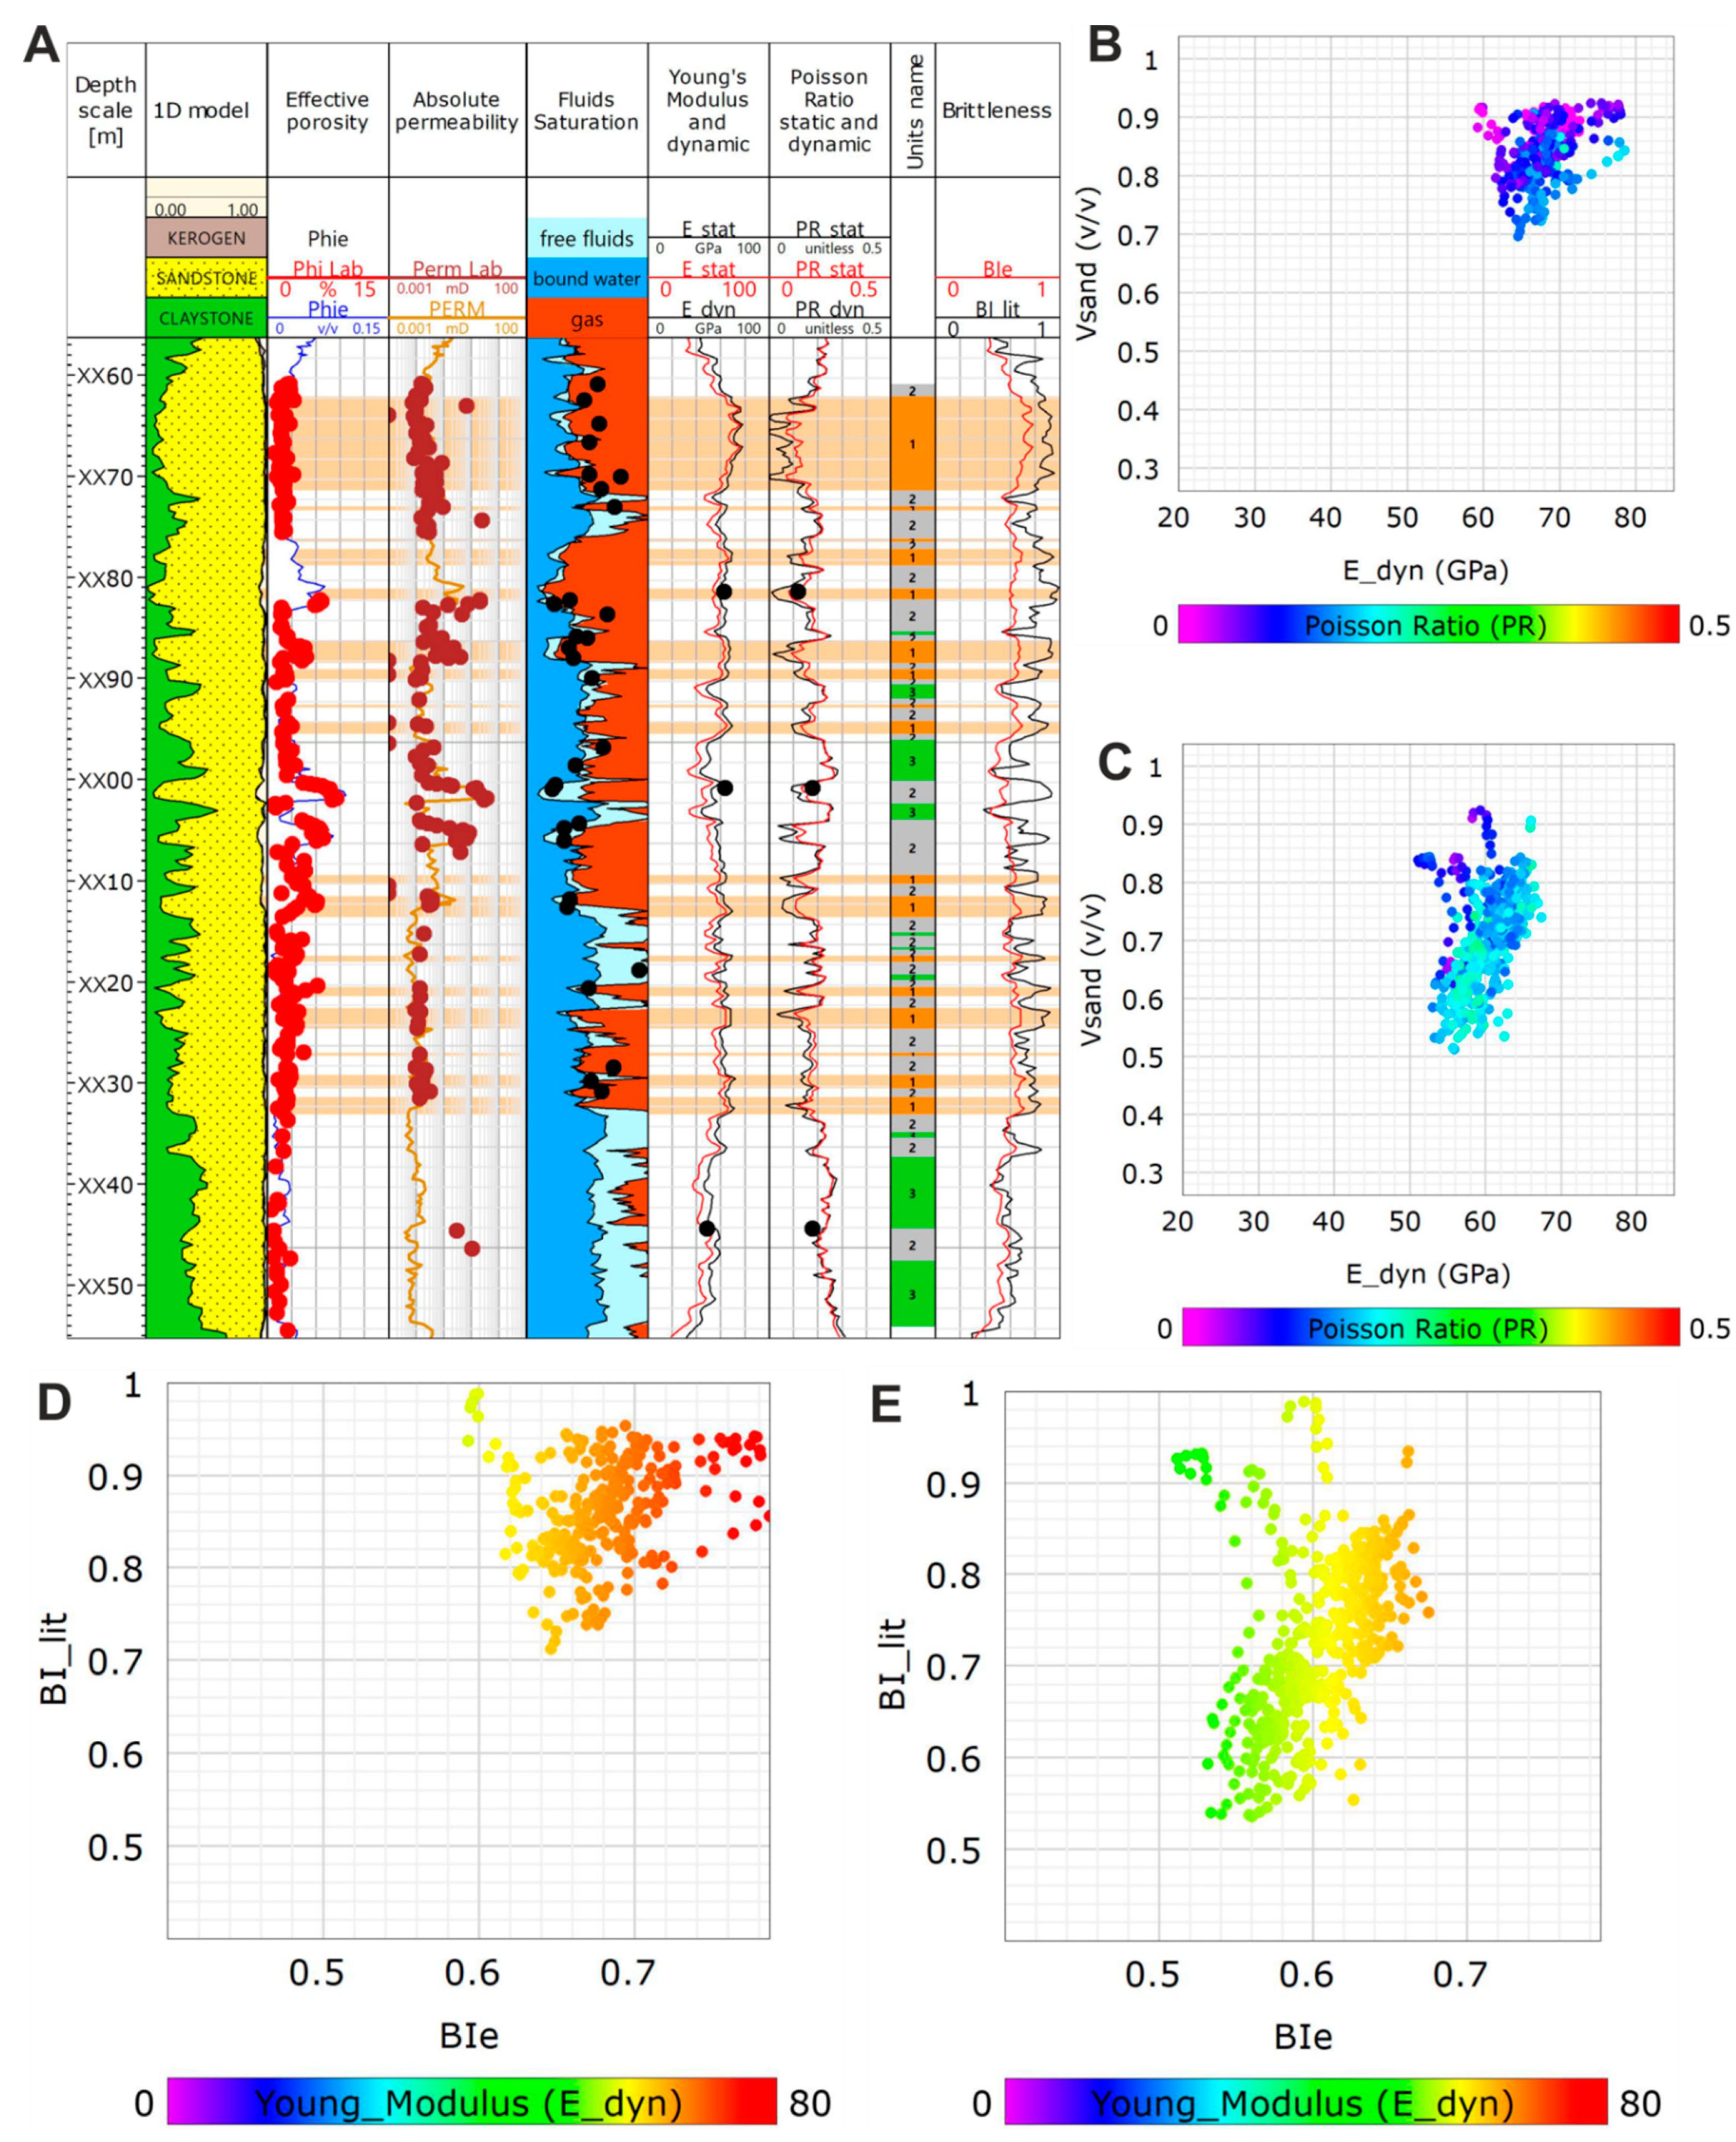
3.2. Characterization of Elastic Parameters and Brittleness Index
4. Characterization of the Stress Field
4.1. Estimation of Horizontal Stress Direction (Based on XRMI Images)
4.2. Stress Field and Fracturing Pressure
5. Conclusions
- -
- The highest gas saturation with low shale volume was found in the top and middle parts of the reservoir.
- -
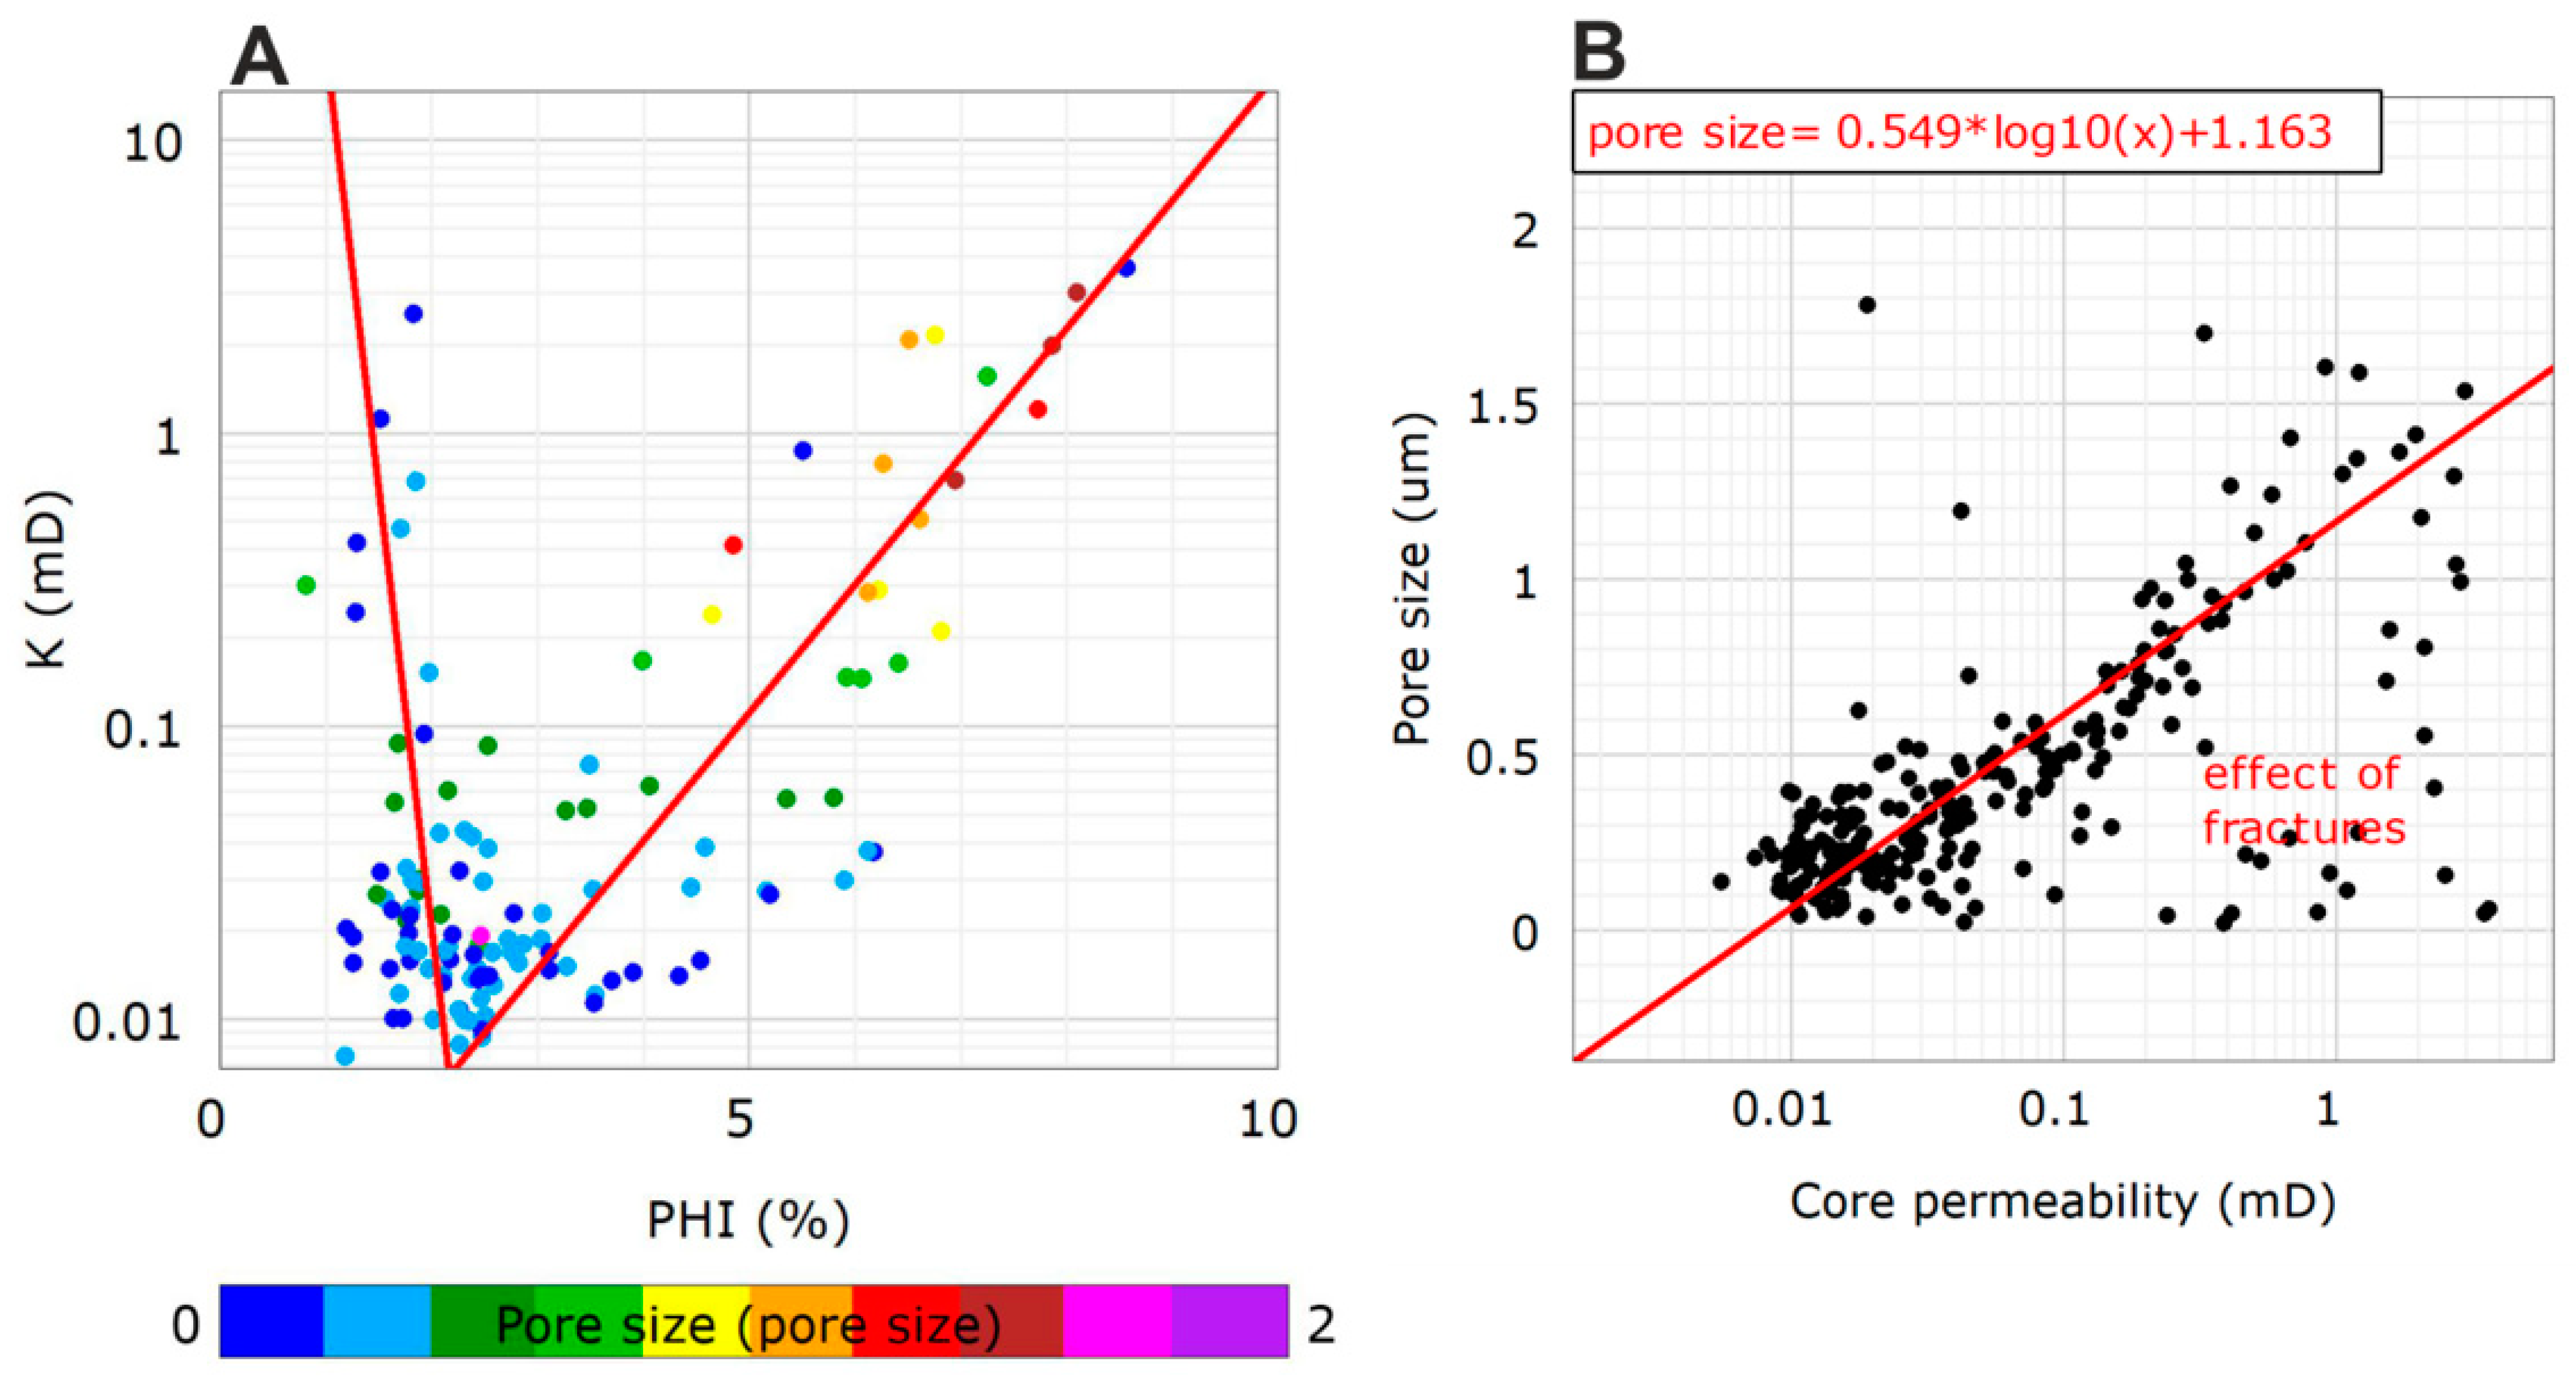
- The petrophysical properties of Middle Cambrian sandstones, such as effective porosity and permeability, show variability. Based on the interpreted porosity ranging from 2–10%, and permeability that mostly has values of a few millidarcy, not exceeding 100 mD, the analyzed reservoir is classified as tight sandstone requiring stimulation treatment for economic hydrocarbons production.
- -
- In the analyzed sandstone profile, within gas saturated zones, the best properties in terms of effective reservoir stimulation treatment are characterized by Young’s modulus valued ranging from 68–71 GPa, brittleness higher than BIe 0.69 and BI_it 0.8, and Poisson’s ratio values lower than 0.1
- -
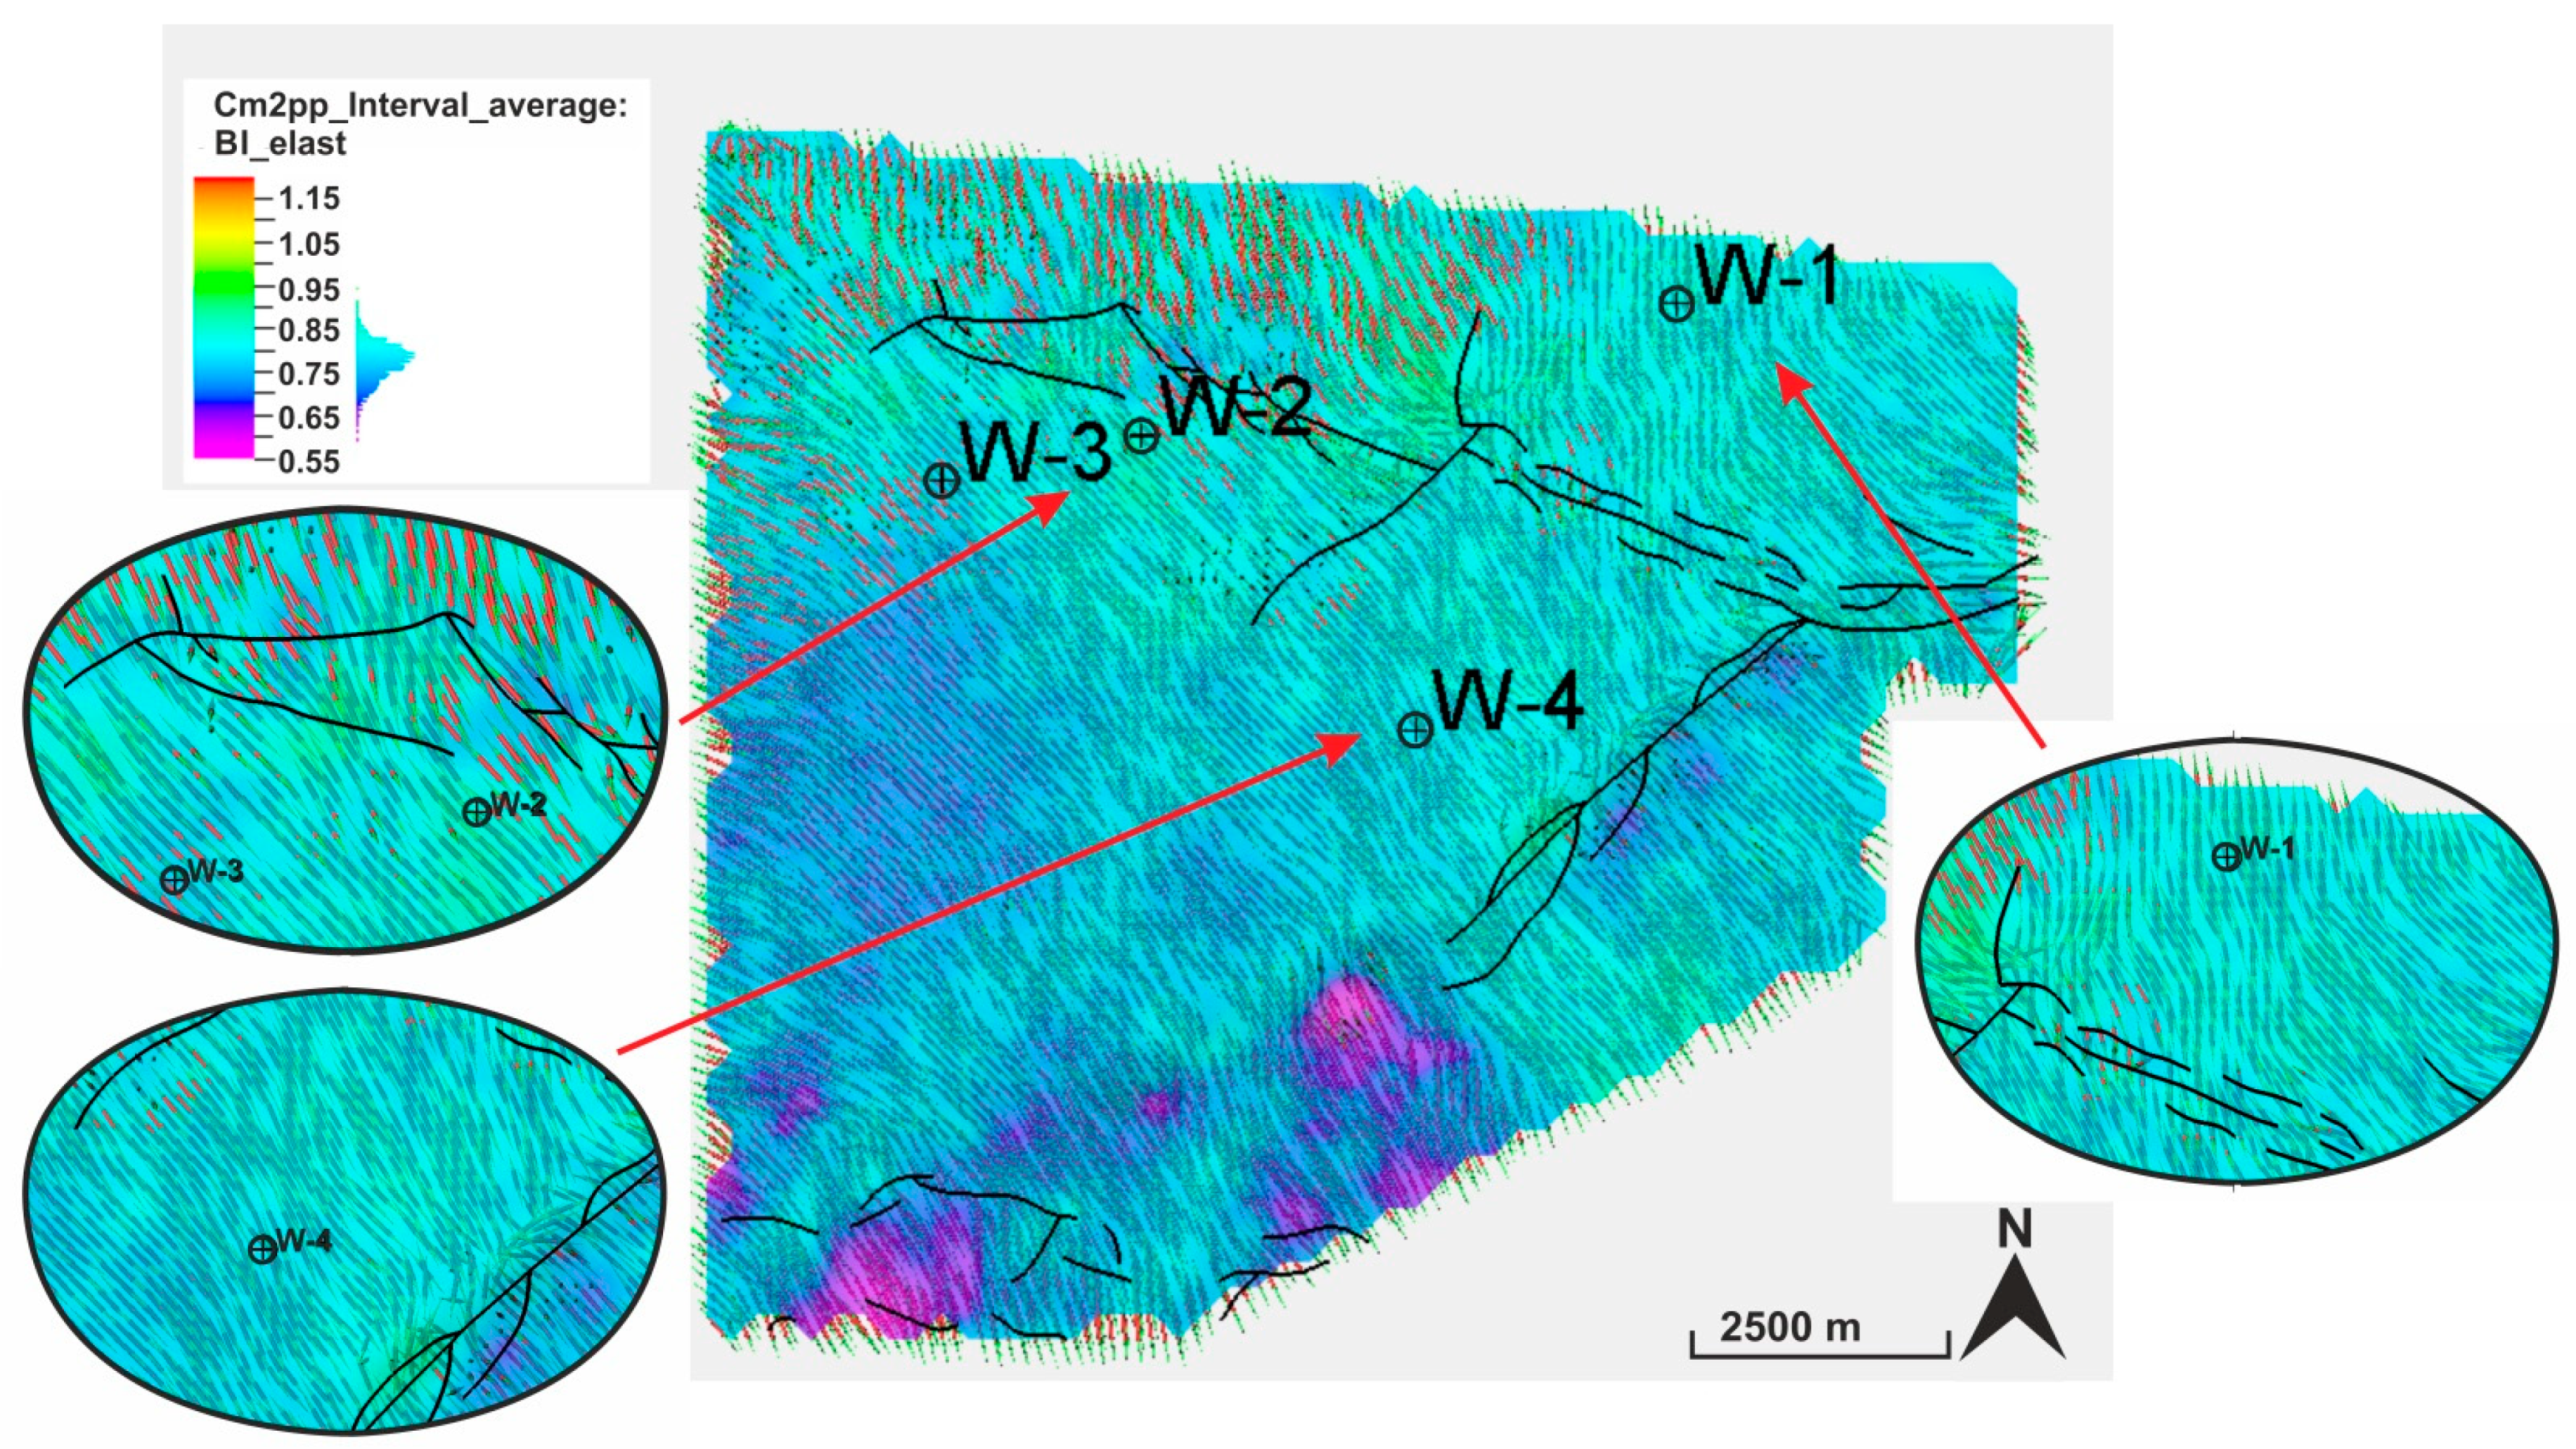
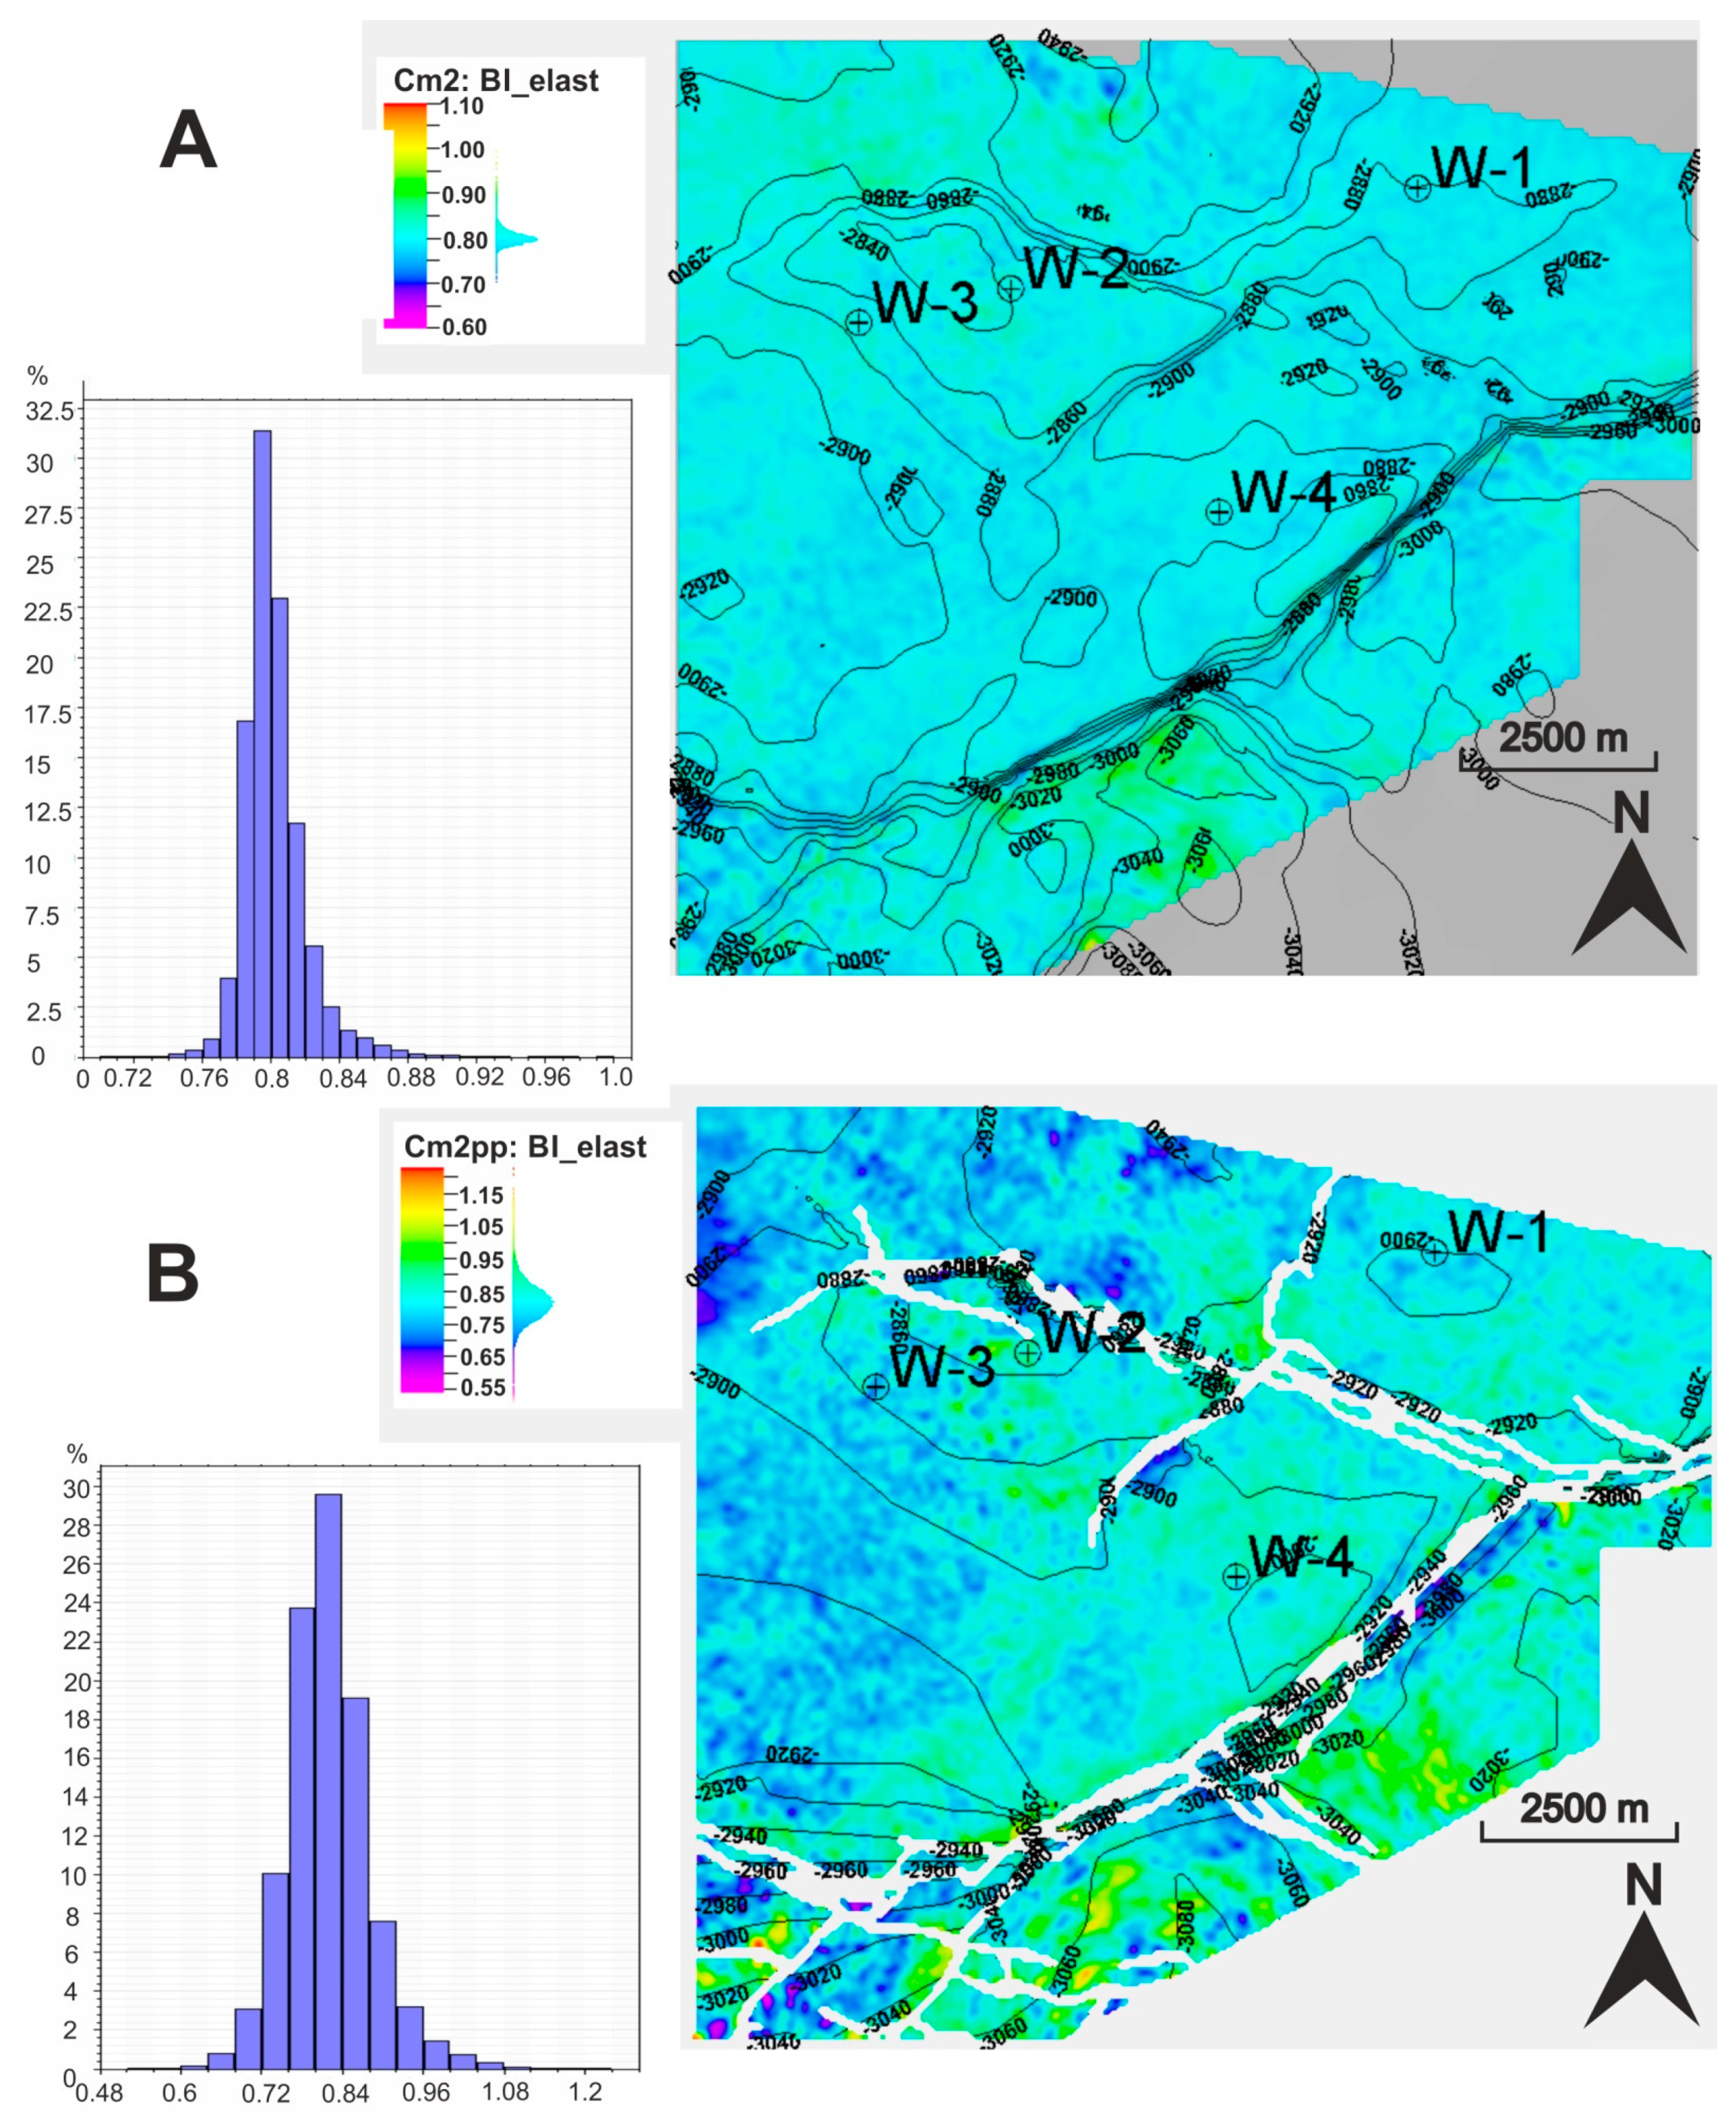
- The sediments of the Paradoxides Paradoxissimus interval of the Middle Cambrian age comprising quartzitic sandstones are, on average, more brittle compared to the entire Middle Cambrian sediments, with an average BI_e of 0.85. Cm2pp sandstones reveal a wide range of horizontal BI. The least-brittle sandstones are located in the northern part of the study area, while the sandstones with the highest brittleness are in the deeper buried area, located toward the south of the dislocation zones. The average brittleness of Middle Cambrian sediments is lowered by the contribution of less brittle component found especially in the top and bottom part in the profile of Cm2 sediments exhibiting an increased clay content.
- -
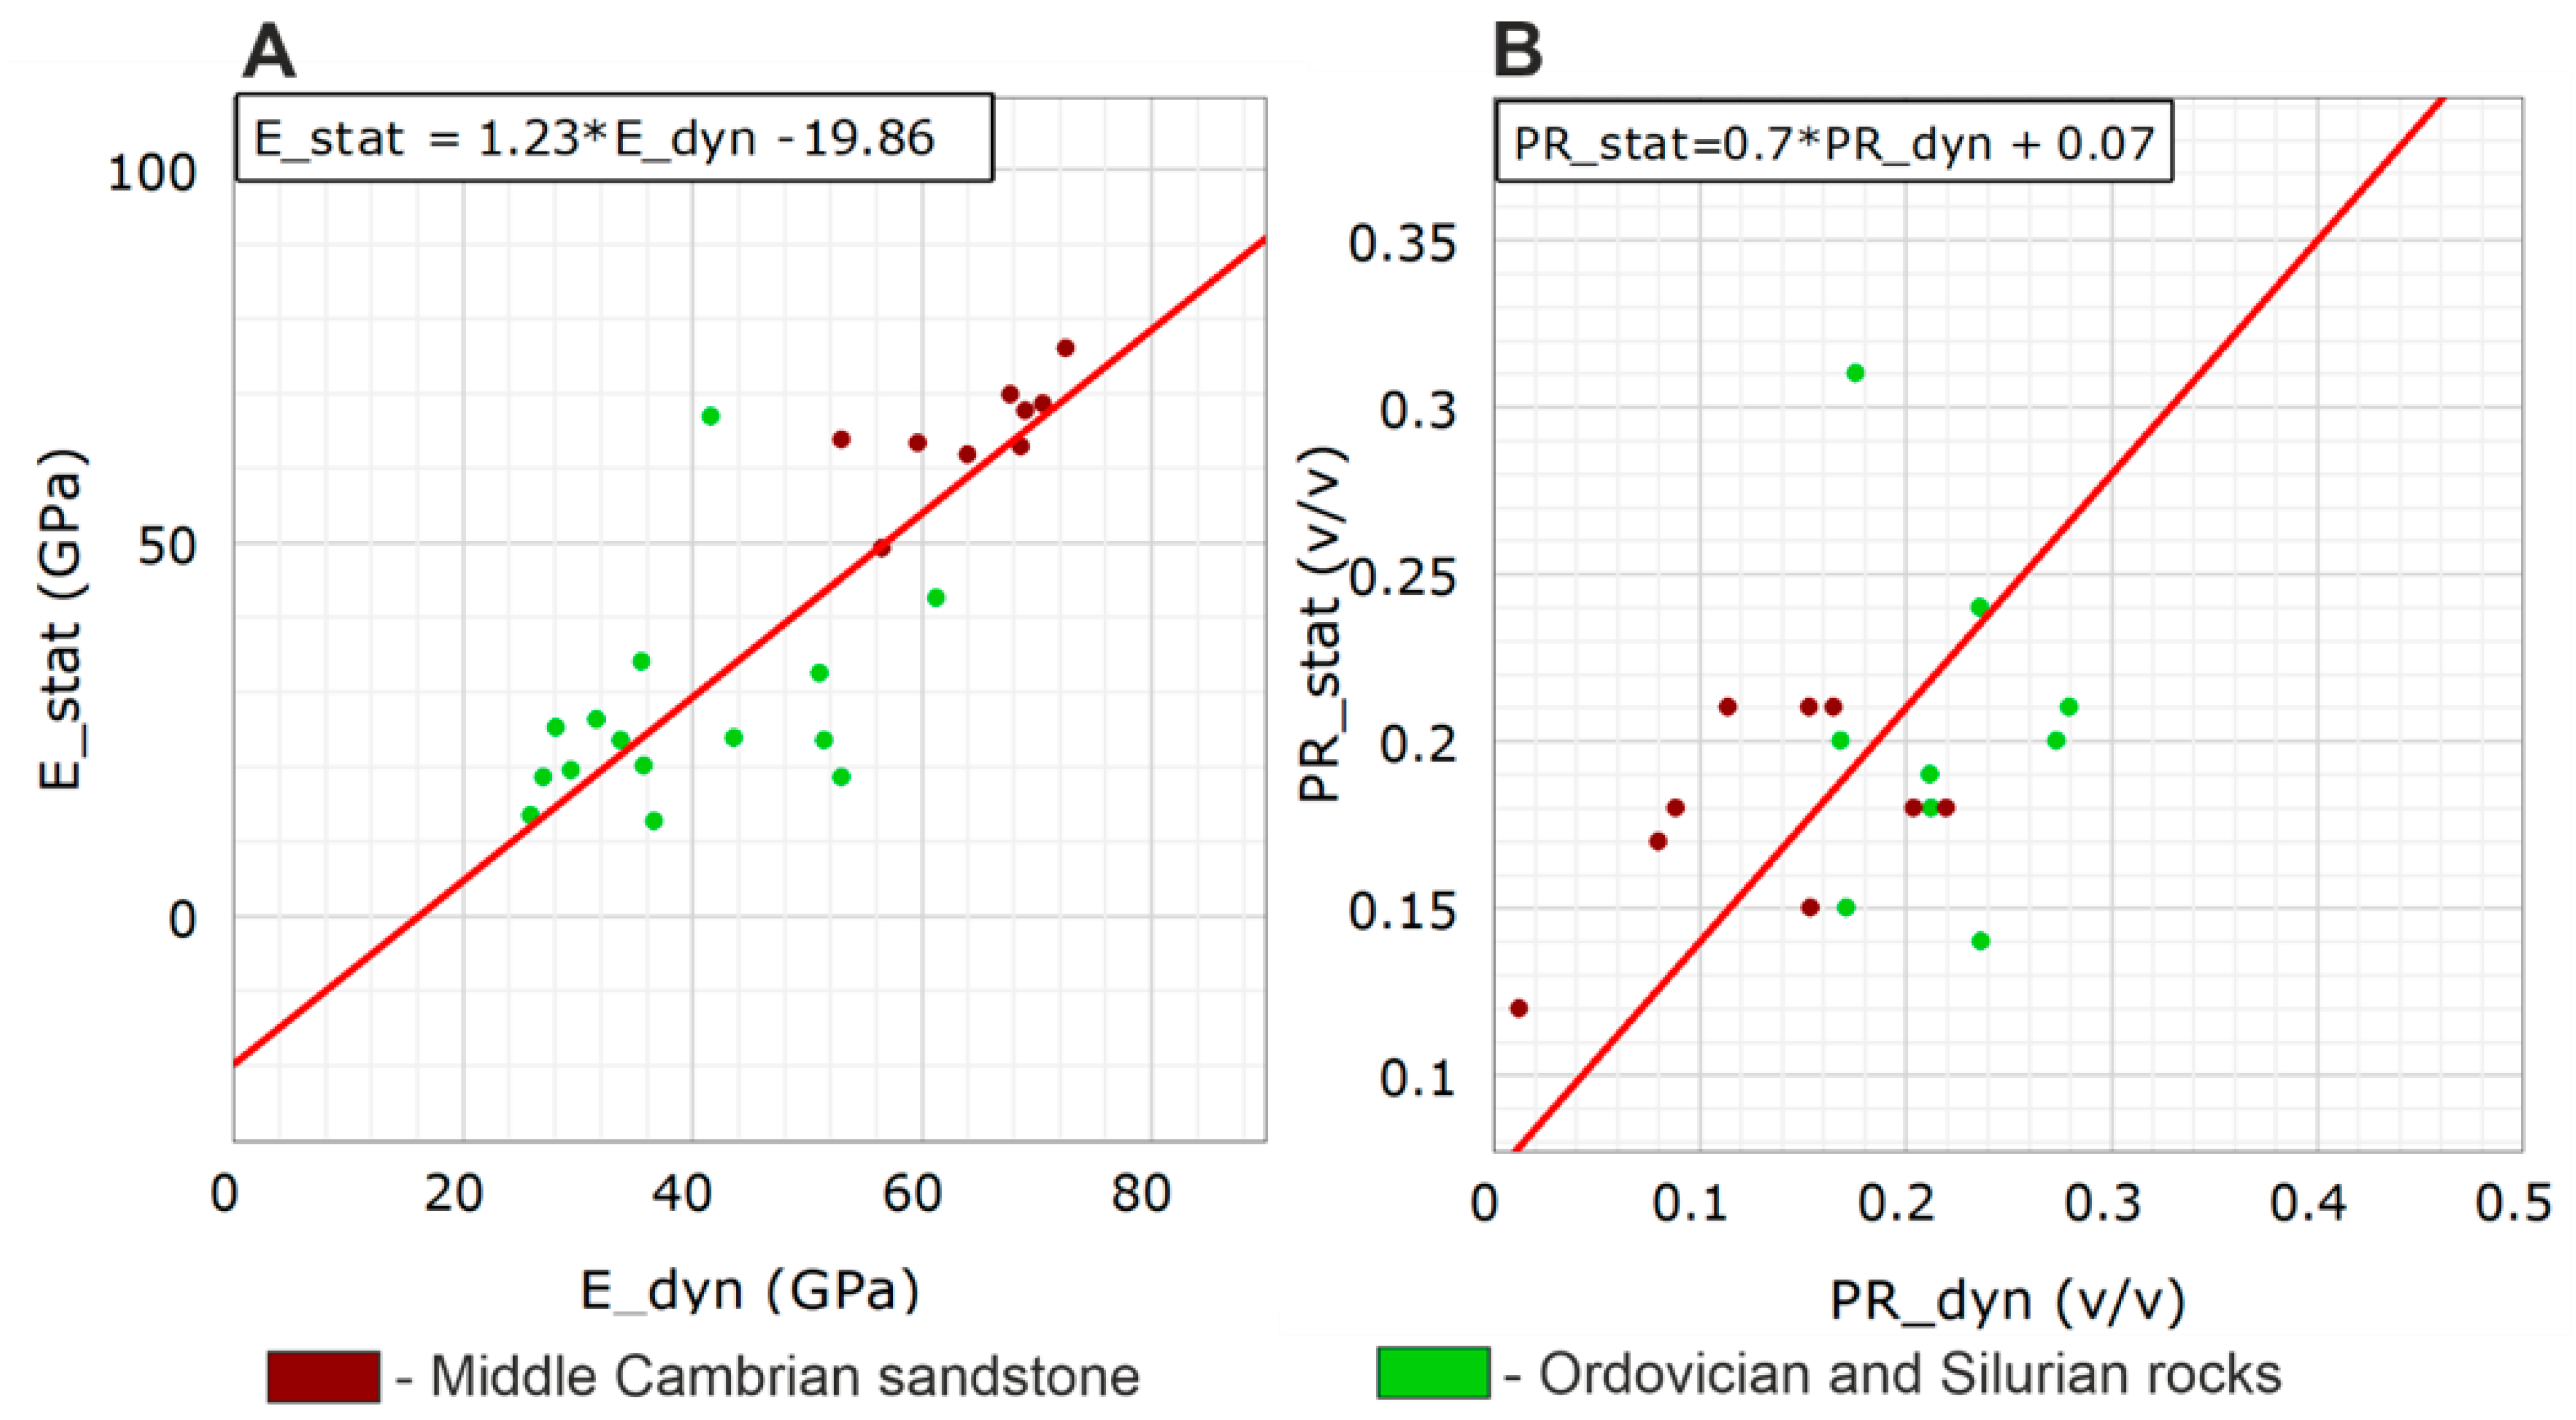
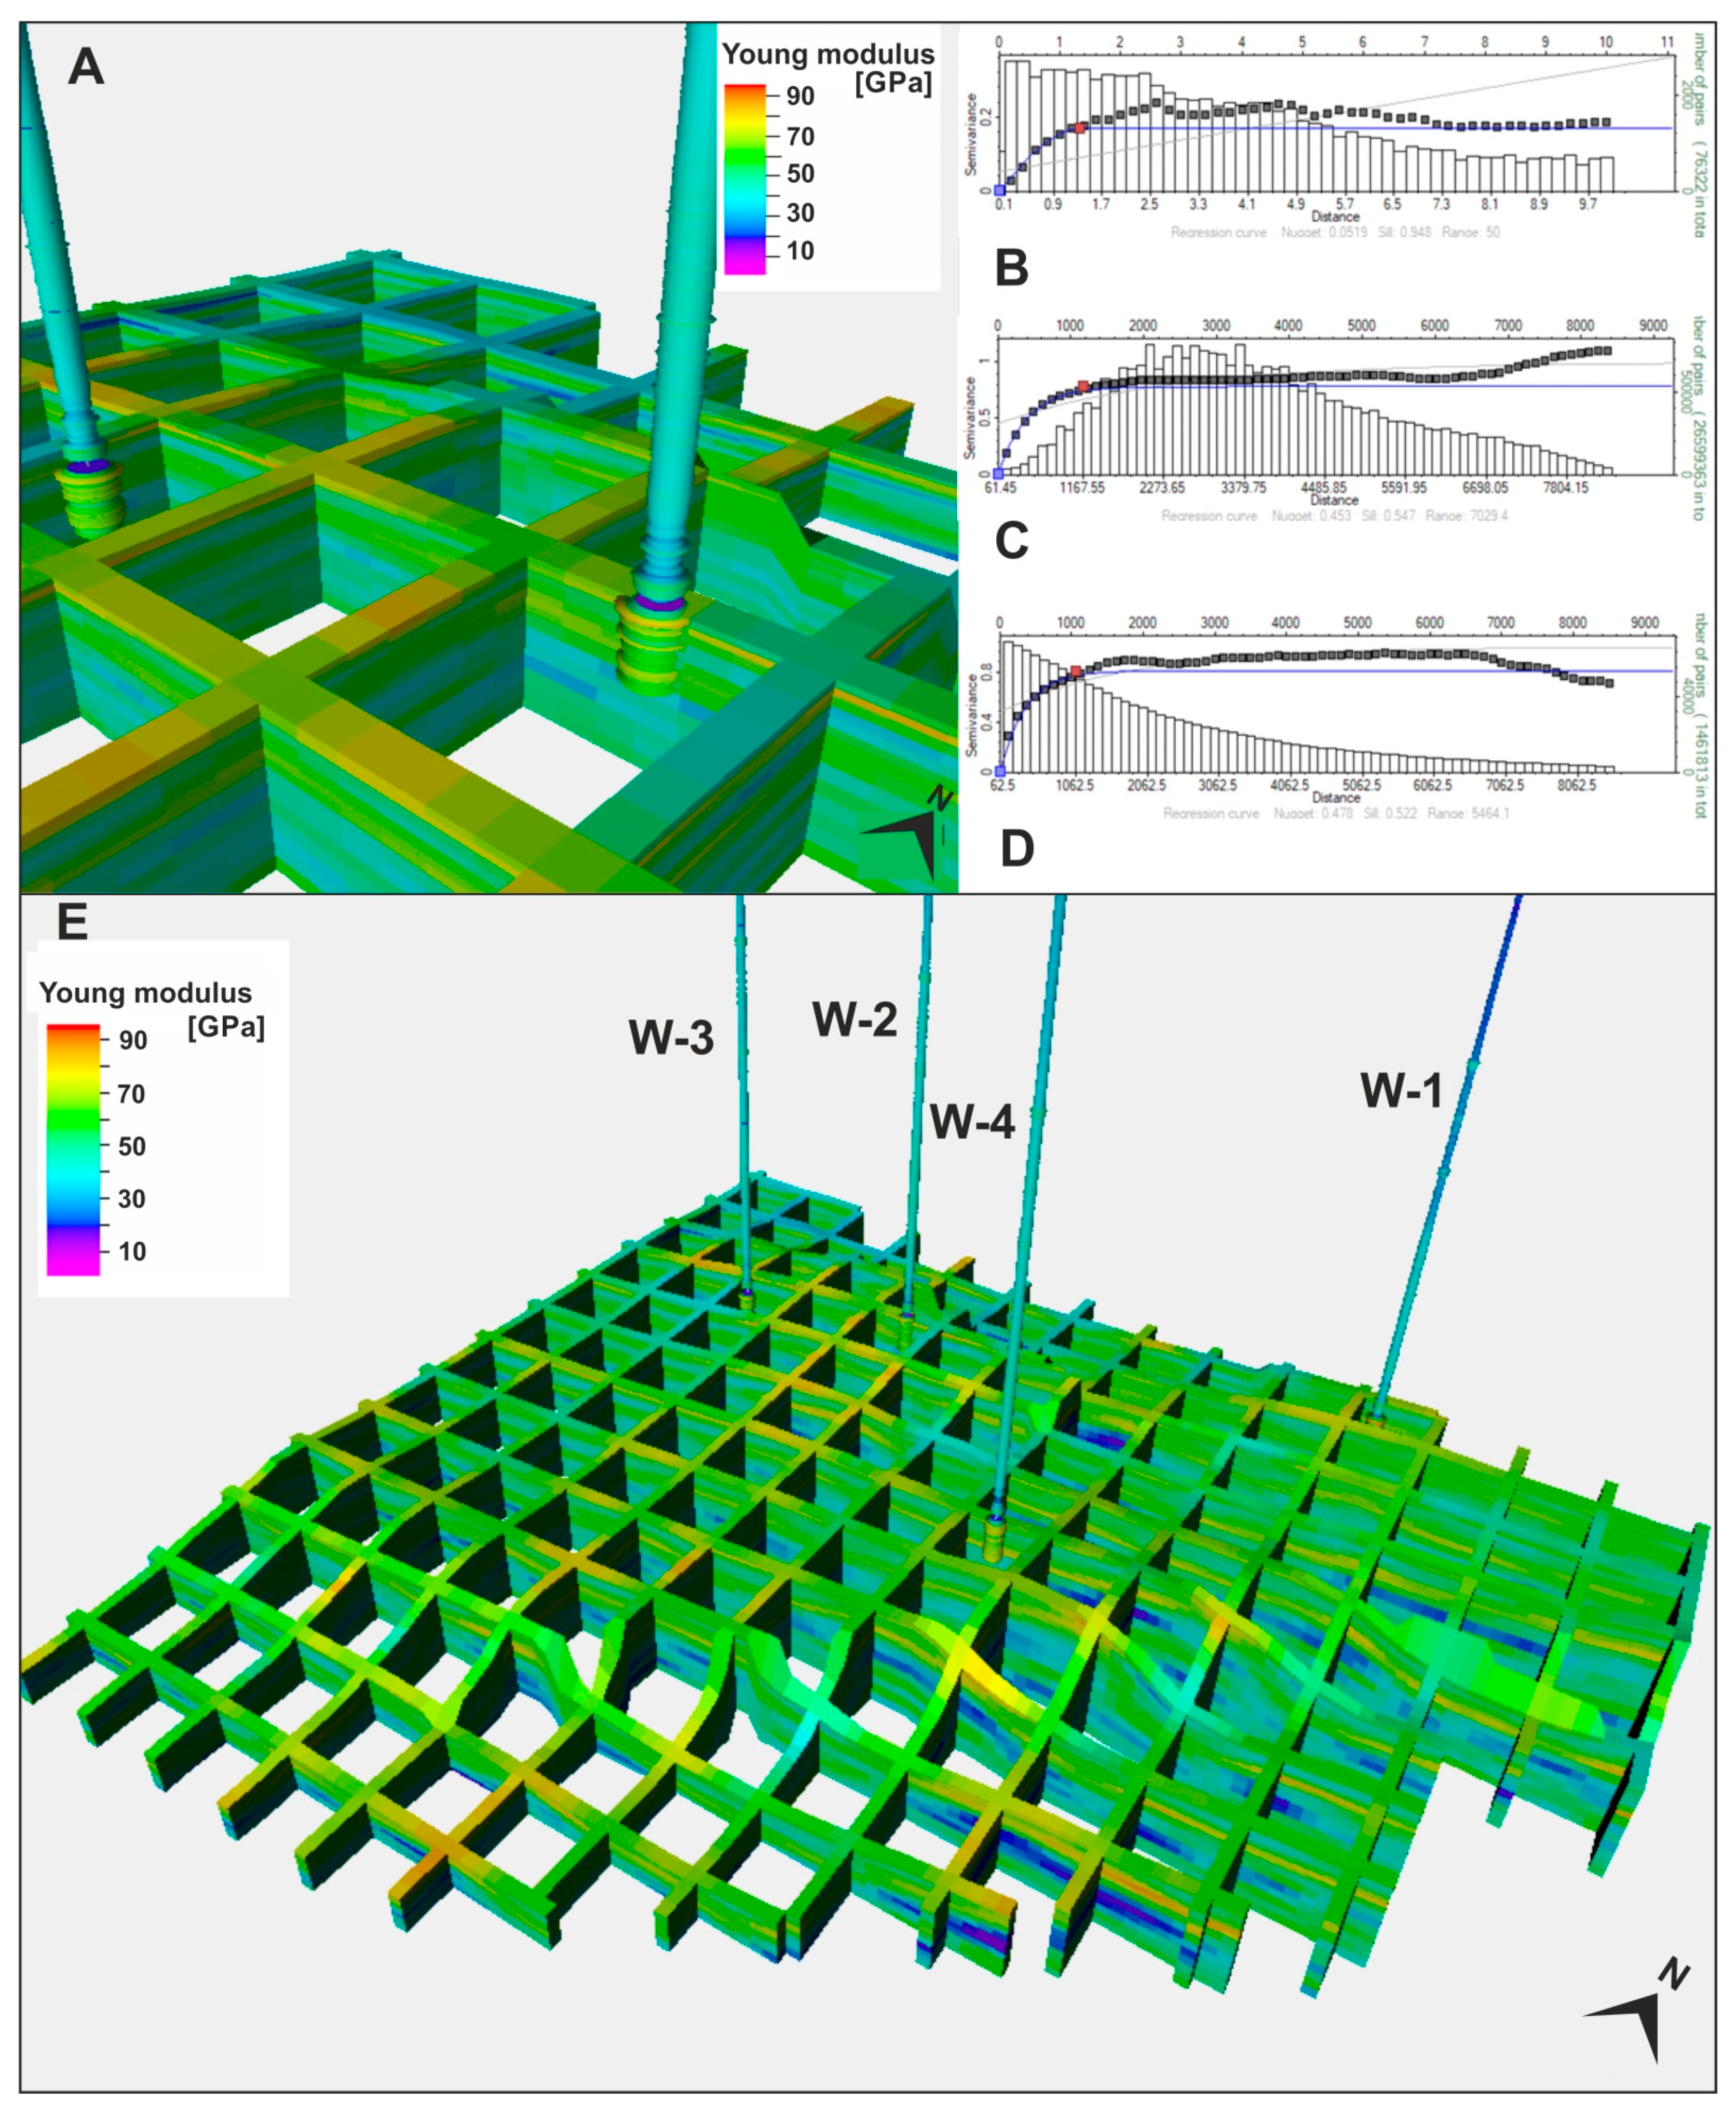
- Determined relationships between static and dynamic elastic properties in the Middle Cambrian quarzitic sandstones are the following: E_stat = 1.23 E_dyn − 19.86 and PR_stat = 0.7 PR_dyn + 0.07 for Young modulus and Poisson’s ratio, respectively. These relationships can be further used in the geomechanical analysis of sediments with similar lithology.
- -
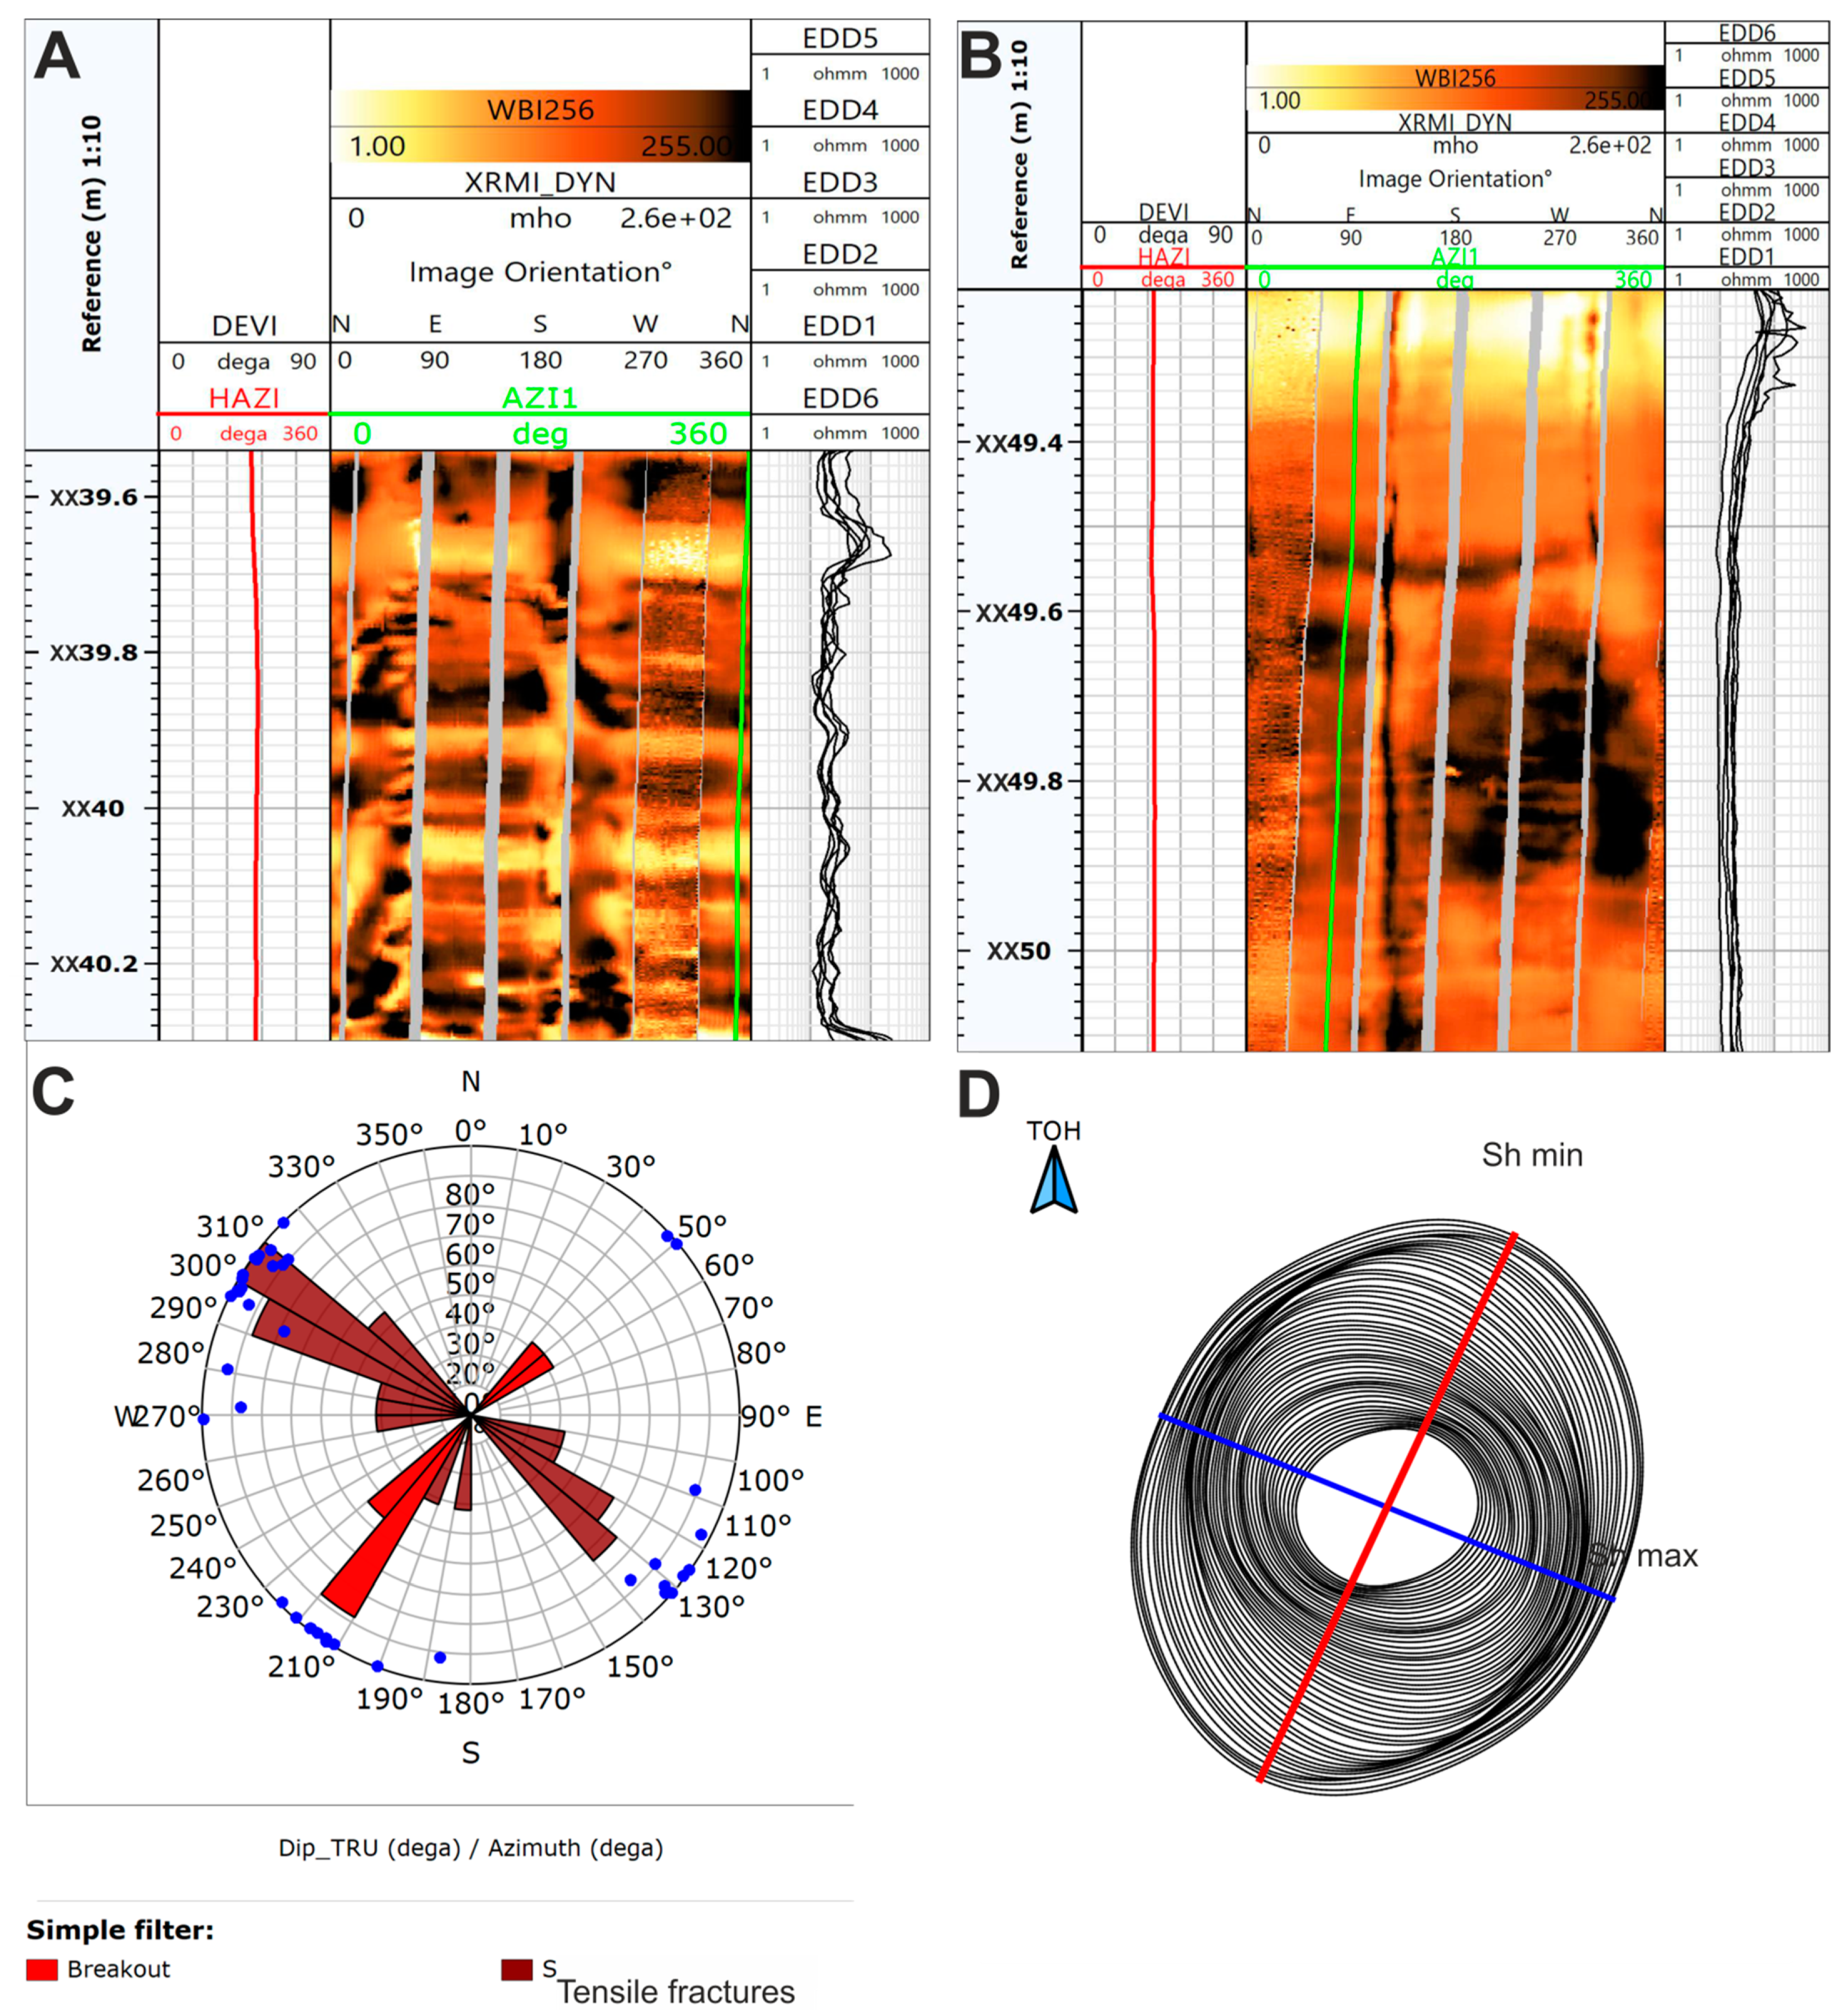
- The reverse tectonic regime in the study area affects the orientation of potentially generated hydraulic fractures, which tend to be oriented perpendicularly to the plane of existing faults. The variable direction of horizontal stresses calculated in geomechanical simulation should be considered when planning new horizontal boreholes.
- -
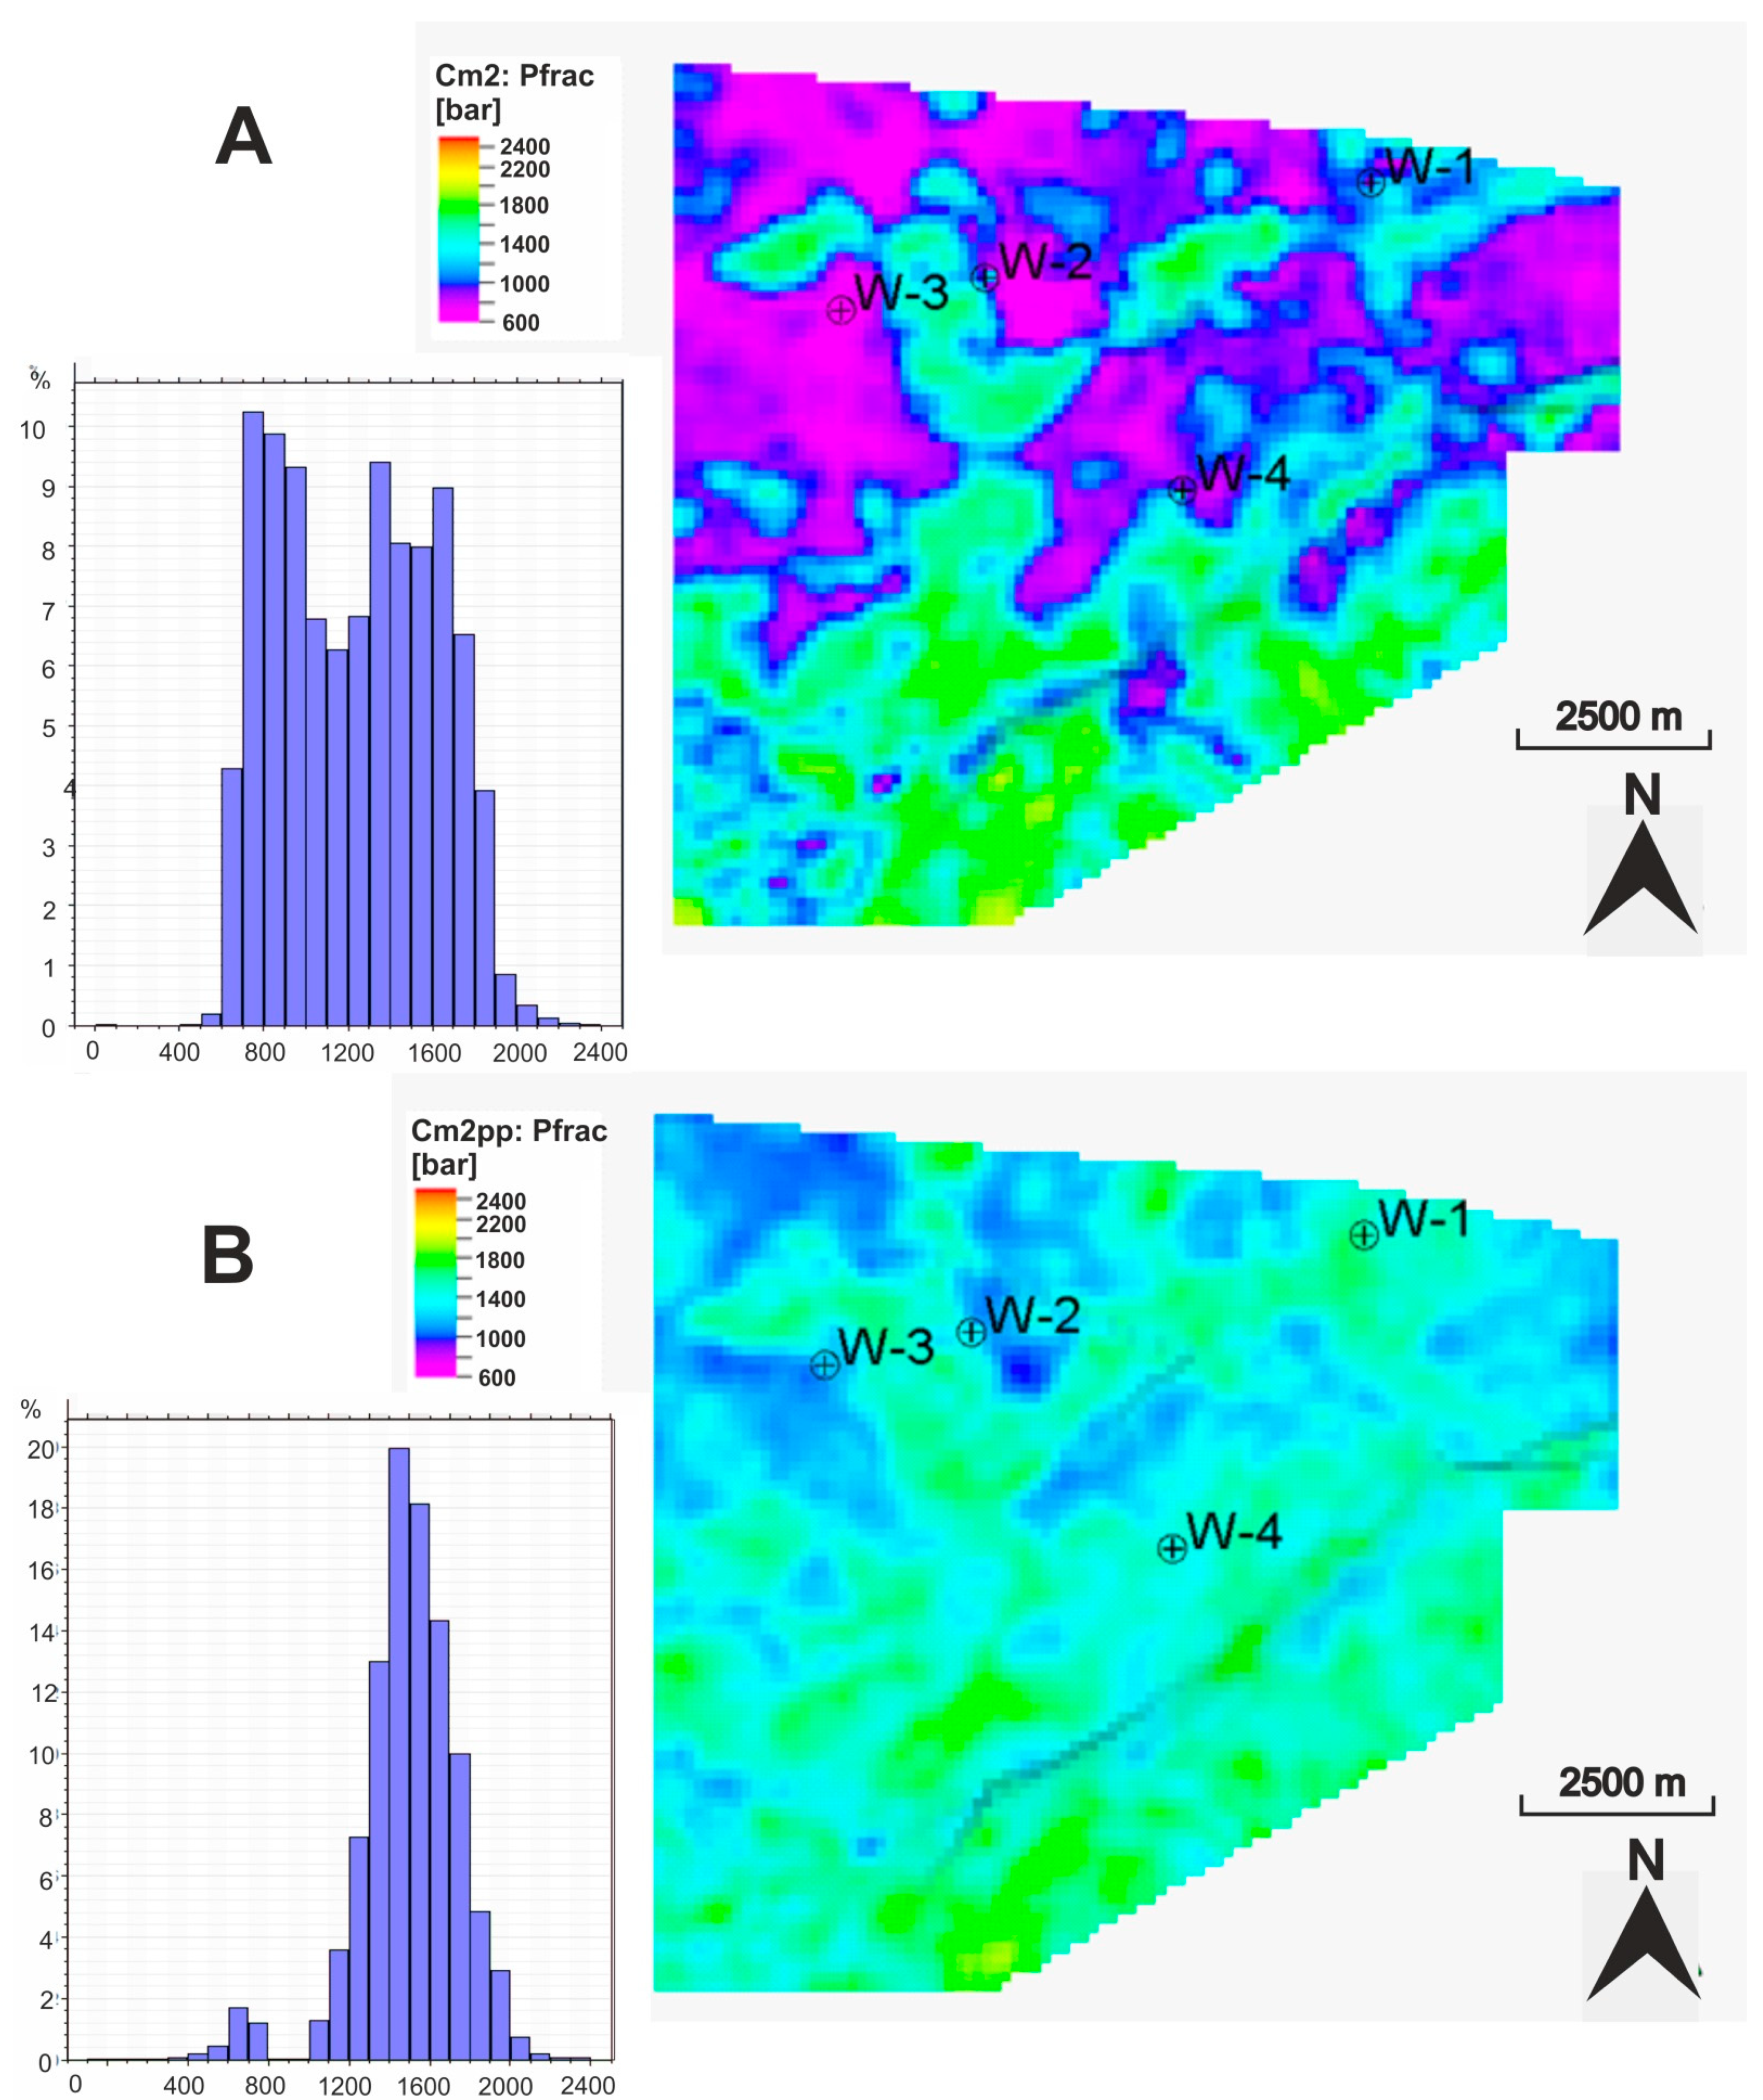
- Comparing the average values of fracturing pressure in the entire Cm2 interval and those in Cm2pp reservoir zone, it can be observed that the Paradoxides Paradoxissimus quartzitic sandstone formation, due to very high strength, requires the application of higher fracturing pressure (1200–2200 bars).
Author Contributions
Funding
Data Availability Statement
Conflicts of Interest
References
- Huang, J.; Ma, X.; Safari, R.; Mutlu, U.; McClure, M. Hydraulic Fracture Design Optimization for Infill Wells: An Integrated Geomechanics Workflow. In Proceedings of the 49th US Rock Mechanics/Geomechanics Symposium, San Francisco, CA, USA, 28 June–1 July 2015. [Google Scholar]
- Taghichian, A.; Hashemalhoseini, H.; Zaman, M.; Yang, Z.-Y. Geomechanical Optimization of Hydraulic Fracturing in Unconventional Reservoirs: A Semi-Analytical Approach. Int. J. Fract. 2018, 213, 107–138. [Google Scholar] [CrossRef]
- Iferobia, C.C.; Ahmad, M. A Review on the Experimental Techniques and Applications in the Geomechanical Evaluation of Shale Gas Reservoirs. J. Nat. Gas Sci. Eng. 2020, 74, 103090. [Google Scholar] [CrossRef]
- Podhalańska, T.; Waksmundzka, M.I.; Becker, A.; Roszkowska-Remin, J.; Dyrka, I.; Feldman-Olszewska, A.; Głuszyński, A.; Grotek, I.; Janas, M.; Karcz, P.; et al. Prospective Zones for Unconventional Hydrocarbon Resources in Cambrian, Ordovician, Silurian and Carboniferous Rocks of Poland: Integration of the Research Results. Przegląd Geologiczny 2016, 64, 1008–1021. [Google Scholar]
- Such, P.; Leśniak, G.; Mroczkowska-Szerszeń, M.; Dudek, L.; Cicha-Szot, R.; Spunda, K. Methodology of Pore Space Analysis in Shale Rocks. Pract. Nauk. Inst. Naft. Gazu 2017, 214, 1–154. [Google Scholar]
- Leśniak, G.; Sowiżdżał, K.; Stadtműller, M.; Lis-Śledziona AKaczmarczyk, W.; Słota-Valim, M.; Kasza, P. Wykonanie Niestandardowych Kompleksowych Bada N Petrofizycznych I Geomechanicznych Na Próbkach I Danych Z Dolnopaleozoicznych Łupków; Technical Report, Shalemech No. 3; INiG–PIB: Kraków, Poland, 2017. [Google Scholar]
- Jarzyna, J.; Bała, M.; Krakowska, P.; Puskarczyk, E.; Strzępowicz, A.; Wawrzyniak-Guz, K.; Więcław, D.; Ziętek, J. Shale Gas in Poland. In Advances in Natural Gas. Emerging Technologies; al Megren, H.A., Altamini, R.H., Eds.; BoD–Books on Demand: Norderstedt, Germany, 2017. [Google Scholar]
- Sowiżdżał, K.; Słoczyński, T.; Stadtműller, M.; Kaczmarczyk, W. Lower Palaeozoic Petroleum Systems of the Baltic Basin in Northern Poland: A 3D Basin Modeling Study of Selected Areas (onshore and offshore). Interpretation 2018, 6, SH117–SH132. [Google Scholar] [CrossRef]
- Stadtmuller, M.; Lis-Śledziona, A.; Słota-Valim, M. Petrophysical and Geomechanical Analysis of the Lower Paleozoic Shale Formation, North Poland. Interpretation 2018, 6, SH91–SH106. [Google Scholar] [CrossRef]
- Wilczynski, P.; Domonik, A.; Lukaszewski, P. Anisotropy of Strength and Elastic Properties of Lower Paleozoic Shales from the Baltic Basin, Poland. Energies 2021, 14, 2995. [Google Scholar] [CrossRef]
- Więcław, D.; Kotarba, M.J.; Kosakowski, P.; Kowalski, A. Habitat and Hydrocarbon Potential of the Lower Palaeozoic Source Rocks of the Polish Sector of the Baltic Basin. Geol. Q. 2010, 54, 159–182. [Google Scholar]
- Modliński, Z.; Podhalańska, T. Outline of the Lithology and Depositional Features of the Lower Paleozoic Strata in the Polish Part of the Baltic Region. Geol. Q. 2010, 54, 109–121. [Google Scholar]
- Bała, M. Charakterystyka parametrów sprężystych określonych Na Podstawie pomiarów Geofizyki Otworowej I Modelowań Teoretycznych W Wybranych Formacjach W Otworach Basenu bałtyckiego I Wierconych Na Szelfie. Nafta Gaz 2017, 73, 558–570. [Google Scholar] [CrossRef]
- Dadlez, R. Phanerozoic Basinal Evolution Along the Teisseyre-Tornquist Zone. Kwartalnik Geologiczny 1987, 31, 263–278, (In Polish with English Summary). [Google Scholar]
- Dadlez, R. Tectonics of the Southern Baltic. Kwartalnik Geologiczny 1990, 34, 1–20, (In Polish with English Summary). [Google Scholar]
- Jaworowski, K. Transgresja Morza Kambryjskiego W północnej Polsce. Pr. Inst. Geol. 1979, 94, 5–80. [Google Scholar]
- Jaworowski, K. Warunki Sedymentacji osadów Prekambru I Kambru W północnej Polsce. Przegląd Geologiczny 1982, 30, 220–224. [Google Scholar]
- Jaworowski, K. Facies Variability in the Cambrian Deposits from the Koscierzyna and Gdansk Sections (Pomeranian Caledonides Foreland, Northern Poland): A Comparative Study. Geol. Q. 2000, 44, 249–260. [Google Scholar]
- Kotarba, M.J.; Nagao, K. Molecular and Isotopic Compositions and Origin of Natural Gases from Cambrian and Carboniferous-Lower Permian Reservoirs of the Onshore Polish Baltic Region. Acta Diabetol. 2014, 104, 241–261. [Google Scholar] [CrossRef] [Green Version]
- Kosakowski, P.; Wróbel, M.; Poprawa, P. Hydrocarbon Generation and Expulsion Modelling for the Lower Palaeozoic Source Rocks in the Polish Part of the Baltic Region. Geol. Q. 2010, 54, 241–256. [Google Scholar]
- Kosakowski, P.; Kotarba, M.J.; Piestrzyński, A.; Shogenova, A.; Więcław, D. Petroleum Source Rock Evaluation of the Alum and Dictyonema Shales (Upper Cambrian-Lower Ordovician) in the Baltic Basin and Podlasie Depression (eastern Poland). Int. J. Earth Sci. 2016, 106, 743–761. [Google Scholar] [CrossRef]
- Poprawa, P.; Šliaupa, S.; Stephenson, R.; Lazauskien, J. Late Vendian–Early Palæozoic Tectonic Evolution of the Baltic Basin: Regional Tectonic Implications from Subsidence Analysis. Tectonophysics 1999, 314, 219–239. [Google Scholar] [CrossRef]
- Processing and interpretation of 3D seismic data from the study area. 2013; unpublished report.
- Schleicher, M.; Köster, J.; Kulke, H.; Weil, W. Reservoir and Source Rock Characterisation of the Early Palaeozoic in-Terval in the Peribaltic Syneclise, Northern Poland. J. Petrol. Geol. 1998, 21, 33–56. [Google Scholar] [CrossRef]
- Golonka, J.; Porębski, S.J.; Barmuta, J.; Papiernik, B.; Bębenek, S.; Barmuta, M.; Botor, D.; Pietsch, K.; Słomka, T. Palaeozoic Palaeogeography of the East European Craton (Poland) in the Framework of Global Plate Tectonics. Ann. Soc. Geol. Pol. 2019, 87, 10. [Google Scholar] [CrossRef] [Green Version]
- Leśniak, G.; Stadtmυller, M. Interpretation of the results of core material, cuttings and reservoir fluids (natural gas, crude oil) from W1, W-2, W-3 and W-4 boreholes in terms of hydrocarbons exploration in the Ordovician-Silurian shale formations. Unpublished report. 2012; Kraków. [Google Scholar]
- Herwanger, J.; Koutsabeloulis, N. Rock Physics for Geomechanics. In Seismic Geomechanics: How to Build and Calibrate Geomechanical Models Using 3D and 4D Seismic Data; EAGE Publications: Houten, The Netherlands, 2011; pp. 181–182. [Google Scholar]
- Jarvie, D.M.; Hil, R.J.; Ruble, T.E.; Pollastro, R.M. Unconventional Shale Gas System: The Mississippian Barnet Shale of North-Central Texas as One Model for Thermogenic Shale Gas Assessment. AAPG Bull. 2007, 91, 475–499. [Google Scholar] [CrossRef]
- Tingay, M.; Reinecker, J.; Birgit, M. Borehole Breakout and Drilling-Induced Fracture Analysis from Image Logs; World Stress Map Project– guidelines: Image Logs, Helmholtz Vent. Potsdam, GFZ.2008:pp. 1–18.
- Li, H.; Tang, H.; Qin, Q.; Zhou, J.; Qin, Z.; Fan, C.; Su, P.; Wang, Q.; Zhong, C. Characteristics, Formation Periods and Genetic Mechanisms of Tectonic Fractures in the Tight Gas Sandstones Reservoir: A Case Study of Xujiahe Formation in YB Area, Sichuan Basin. China J. Petrol. Sci. Eng. 2019, 178, 723–735. [Google Scholar] [CrossRef]
- Dubinya, N.V. An Overview of Wellbore Methods of Investigating Stress State of the Upper Layers of the Earth’s Crust. Izvestiya Phys. Solid Earth 2019, 55, 311–326. [Google Scholar] [CrossRef]
- Sone, H.; Zoback, M.D. Viscous Relaxation Model for Predicting Least Principal Stress Magnitudes Insedimentary Rock. J. Petrol. Sci. Eng. 2014, 124, 416–431. [Google Scholar] [CrossRef]
- Zoback, M.D.; Moos, D.; Mastin, L.G.; Anderson, R.N. Well Bore Breakouts and in Situ Stress. J. Geophys. Res. 1985, 90, 5523–5530. [Google Scholar] [CrossRef]
- Bell, J.S. Investigating Stress Regimes in Sedimentary Basins Using Information from Oil Industry Wireline Logs and Drilling Records. In Geological Applications of Wireline Logs; Hurst, A., Lovell, M., Morton, A., Eds.; Geological Society Special Publications: London, UK, 1990; Volume 48, pp. 305–325. [Google Scholar]
- Moos, D. In Situ Stress Measurements in the NPR Hole, Volume I - Results and Interpretations. In Off. Sci. Tech. Inf. Tech. Rep; 2001. Available online: https://www.osti.gov/servlets/purl/787831 (accessed on 5 August 2021). [CrossRef] [Green Version]
- Zoback, M.D.; Healy, J.H. In Situ Stress Measurements to 3.5 Km Depth in the Cajon Pass Scientific Research Drill Hole: Implications for the Mechanics of Crustal Faulting. J. Geophys. 1992, 97, 5039–5057. [Google Scholar] [CrossRef]
- Bell, J.S.; Gough, D.I. Northeast-Southwest Compressive Stress in Alberta: Evidence from Oil Wells. Earth Planet. Sci. Lett. 1979, 45, 475–482. [Google Scholar] [CrossRef]
- Zillur, R.; Adnan, A.A.-K.; Hamoud, A.A.-A.; Mahbub, S.A. Succesfull Drilling of Lateral Wells in Minimum Horizontal Stress Direction for Optimal Fracture Placement. Oil Gas. J. 2012, 110, 74–83. [Google Scholar]
- Wikel, K. Geomechanics: Bridging the Gap from Geophysics to Engineering in Unconventional Reservoirs. First Break 2011, 29, 71–80. [Google Scholar] [CrossRef]
- Terzaghi, K. Stress Conditions for the Failure of Saturated Concrete and Rock. In From Theory to Practice in Soil Mechanics; John Wiley and Sons: Hoboken, NJ, USA, 1945; pp. 181–197. [Google Scholar]
- Swabrick, R.E. Challenges of Porosity-Based Pore Pressure Prediction. CSEG Rec. 2002, 27, 75–77. [Google Scholar]
- Boer, L.; Sayers, C.; Nagy, Z.; Hooyman, P.J. Pore Pressure Prediction Using Well-Conditioned Seismic Velocities. First Break 2006, 24, 43–49. [Google Scholar]
- Bowers, G. Pore Pressure Estimation from Velocity Data: Accounting for Overpressure Mechanisms Besides Undercompaction. SPE Drill. Complet. 1995, 10, 89–95. [Google Scholar] [CrossRef]
- Sayers, C.M.; Johnson, G.M.; Denyer, G. Predrill Pore-Pressure Prediction Using Seismic Data. Geophysics 2002, 67, 1286–1292. [Google Scholar] [CrossRef]
- Bourgoyne, A.T.; Millheim, K.K.; Chenevert, M.E.; Young, F.S. Applied Drilling Engineering. Textbook Series; Society of Petroleum Engineers: Richardson, TX, USA, 1986; Volume 2. [Google Scholar]
- Bowman, T. Direct Method for Determining Organic Shale Potential from Porosity and Resistivity Logs to Identify Possible Resource Plays. In Proceedings of the AAPG Annual Convention & Exhibition, New Orleans, LA, USA, 11–14 April 2010. [Google Scholar]
- Li, M. Chapter 7—Prestack Seismic Inversion and Seismic Attribute Analysis. In Geophysical Exploration Technology; Li, M., Zhao, Y., Eds.; Elsevier: Amsterdam, The Netherlands, 2014; pp. 199–219. ISBN 9780124104365. [Google Scholar] [CrossRef]
- Zou, C. Calculation of Brittleness Index for Rock Elastic Parameters. In Unconventional Petroleum Geology, 2nd ed.; Zou, C., Ed.; Elsevier: Amsterdam, The Netherlands, 2017; ISBN 9780128122341. [Google Scholar] [CrossRef]
- Shogenov, K.; Shogenovaa, A.; Vizika-Kavvadiasb, O.; Nauroy, J.-F. Reservoir quality and petrophysical properties of Cambrian sandstones and their changes during the experimental modelling of CO2 storage in the Baltic Basin. Estonian J. Earth Sci. 2015, 64, 199–217. [Google Scholar] [CrossRef]
- Handin, J.; Hager, R.V. Experimental Deformation of Sedimentary Rocks under Confining Pressure: Tests at Room Temperature on Dry Samples. Bull. Am. Assoc. Pet. Geol. 1957, 41, 1–51. [Google Scholar]
- Wines, D.; Lilly, P. Estimates of Rock Joint Shear Strength in Part of the Fimiston Open Pit Operation in Western Australia. Int. J. Rock Mech. Min. Sci. 2003, 40, 929–937. [Google Scholar] [CrossRef]
- Smith, S.A.F.; Faulkner, D.R. Laboratory Measurements of the Frictional Properties of the Zuccale Low-Angle Normal Fault, Elba Island, Italy. J. Geophys. Res. Space Phys. 2010, 115, 115. [Google Scholar] [CrossRef]
- Kwaśniewski, M.; Rodriguez-Oitaben, P. Study on the Dilatancy Angle of Rocks in the Pre-Failure Domain. In Harmonizing Rock Engineering and the Environment; Qian, Q., Zhou, Y., Eds.; Taylor and Francis Group: London, UK, 2012; pp. 681–686. [Google Scholar]
- Pinazzi Da Silva Ribeiro, P.C.; Mello Oliveira, M.; Nelson, P. Correlation Between Uniaxial Compressive Strength and Brazilian Tensile Strength Using Different Rock Types. In Proceedings of the ISRM VII Brazilian Symposium on Rock Mechanics, Belo Horizonte, MG, Brazil, 19–26 October 2016. Paper Number: ISRM-SBMR-2016-01. [Google Scholar]
- Cheng, Y. Boundary Element Analysis of the Stress Distribution Around Multiple Fractures: Implications for the Spacing of Perforation Clusters of Hydraulically Fractured Horizontal Wells. In Proceedings of the SPE Eastern Regional Meeting, Charleston, WV, USA, 23–25 September 2009. [Google Scholar] [CrossRef]
- Gao, Q.; Cheng, Y.; Fathi, E.; Ameri, S. Analysis of Stress-Field Variations Expected on Subsurface Faults and Discontinuities in the Vicinity of Hydraulic Fracturing. Spe Reserv. Eval. Eng. 2016, 19, 54–69. [Google Scholar]
- Lavrov, A. Mechanisms and Diagnostics of Lost Circulation. In Lost Circulation; Elsevier BV: Amsterdam, The Netherlands, 2016; pp. 99–162. [Google Scholar] [CrossRef]


| W-1 | W-3 | W-4 | ||||||
|---|---|---|---|---|---|---|---|---|
| Sample ID | Young’s modulus | Poison ratio | Sample ID | Young’s modulus | Poison ratio | Sample ID | Young’s modulus | Poison ratio |
| GPA | unitless | GPA | unitless | GPA | unitless | |||
| 1 | 68.5116 | 0.21 | 1 | 63.2 | 0.12 | 1 | 66.78501 | 0.16 |
| 2 | 69.7472 | 0.21 | 2 | 63.7 | 0.18 | 2 | 61.75184 | 0.15 |
| 3 | 67.6272 | 0.21 | 3 | 49.1 | 0.18 | 3 | 62.79811 | 0.18 |
| 4 | 76.0011 | 0.17 | ||||||
| Well Name | Units Name | Average E_dyn | Average PR_dyn | Average BIe | Average Vcl | Average Vsand | Average Phie | Average Perm | Average BI_lit |
|---|---|---|---|---|---|---|---|---|---|
| GPa | unitless | unitless | v/v | v/v | v/v | mD | v/v | ||
| W-1 | 1. Tight sandstone | 68.669 | 0.133 | 0.687 | 0.155 | 0.813 | 0.032 | 0.015 | 0.832 |
| 2. Sandstone of higher porosity | 61.183 | 0.218 | 0.613 | 0.285 | 0.680 | 0.034 | 0.015 | 0.690 | |
| 3. Mudstone | 37.686 | 0.277 | 0.378 | 0.596 | 0.381 | 0.022 | 0.006 | 0.334 | |
| W-2 | 1. Tight sandstone | 68.615 | 0.115 | 0.687 | 0.159 | 0.812 | 0.029 | 0.068 | 0.833 |
| 2. Sandstone of higher porosity | 58.553 | 0.191 | 0.586 | 0.319 | 0.646 | 0.035 | 0.11 | 0.666 | |
| 3. Mudstone | 46.618 | 0.270 | 0.468 | 0.511 | 0.463 | 0.026 | 0.054 | 0.467 | |
| W-3 | 1. Tight sandstone | 67.934 | 0.091 | 0.680 | 0.129 | 0.846 | 0.024 | 0.018 | 0.862 |
| 2. Sandstone of higher porosity | 60.187 | 0.169 | 0.603 | 0.253 | 0.720 | 0.028 | 0.022 | 0.732 | |
| 3. Mudstone | 50.039 | 0.243 | 0.502 | 0.407 | 0.571 | 0.022 | 0.012 | 0.569 | |
| W-4 | 1. Tight sandstone | 71.620 | 0.166 | 0.717 | 0.213 | 0.757 | 0.031 | 0.011 | 0.778 |
| 2. Sandstone of higher porosity | 62.821 | 0.190 | 0.629 | 0.290 | 0.668 | 0.042 | 0.026 | 0.695 | |
| 3. Mudstone | 50.754 | 0.268 | 0.509 | 0.482 | 0.491 | 0.027 | 0.008 | 0.498 |
| Gradient σh | 0.0197 (MPa/m) |
| σH/σh | 1.16 |
| Azimuth σh (°) | 50.00 |
| Parameter (Unit) | Shales (Upper Boundary) | Middle Cambrian Sandstones (Reservoir) | Shales (Underburden) |
|---|---|---|---|
| Young’s modulus (GPa) | Seismically derived 3D model | Seismically derived 3D model | 25 |
| Poisson’s ratio | Seismically derived 3D model | Seismically derived 3D model | 0.35 |
| Rock density (g/cm3) | Seismically derived 3D model | Seismically derived 3D model | 2.42 |
| Biot constant | 1 | 1 | 1 |
| Porosity (%) | Seismically derived 3D model | Seismically derived 3D model | 8 |
| Unconfined compressive strenght UCS (MPa) | Seismically derived 3D model | Seismically derived 3D model | 40 |
| Tensile strength (MPa) | UCS/14.035 | UCS/13.703 | UCS/14.035 |
| Friction angle (°) | 30 | 35 | 30 |
| Dilation angle (°) | 5 | 0 | 5 |
| Parameter (Unit) | Cenozoic (Clays, Sands, Gravel) | Cretaceous (Claystone) | Jurassic (Mudstone) | Anhydrite | Rock Salt | Dolomite |
|---|---|---|---|---|---|---|
| Young modulus (GPa) | 0.1 | 1.5 | 5 | 55.5 | 1.4 | 83.81 |
| Poisson’s ratio | 0.3 | 0.31 | 0.15 | 0.26 | 0.44 | 0.2 |
| Rock density (g/cm3) | 1.9 | 2.6 | 2.27 | 2.85 | 2.17 | 2.82 |
| Biot constant | 1 | 1 | 1 | 1 | 1 | 0.75 |
| Porosity (%) | 15 | 12 | 12 | 0 | 0 | 8 |
| UCS (MPa) | 2.8 | 29 | 20 | 91.7 | - | 80 |
| Tensile (MPa) | UCS/14.035 | |||||
| Friction angle (°) | 30 | 30 | 22 | 29.4 | - | 45 |
| Dilation angle (°) | 5 | 5 | 5 | 5 | - | 5 |
| Cohesion (MPa) | - | - | - | - | 7.3 | - |
Publisher’s Note: MDPI stays neutral with regard to jurisdictional claims in published maps and institutional affiliations. |
© 2021 by the authors. Licensee MDPI, Basel, Switzerland. This article is an open access article distributed under the terms and conditions of the Creative Commons Attribution (CC BY) license (https://creativecommons.org/licenses/by/4.0/).
Share and Cite
Słota-Valim, M.; Lis-Śledziona, A. The Use of Well-Log Data in the Geomechanical Characterization of Middle Cambrian Tight Sandstone Formation: A Case Study from Eastern Pomerania, Poland. Energies 2021, 14, 6022. https://doi.org/10.3390/en14196022
Słota-Valim M, Lis-Śledziona A. The Use of Well-Log Data in the Geomechanical Characterization of Middle Cambrian Tight Sandstone Formation: A Case Study from Eastern Pomerania, Poland. Energies. 2021; 14(19):6022. https://doi.org/10.3390/en14196022
Chicago/Turabian StyleSłota-Valim, Małgorzata, and Anita Lis-Śledziona. 2021. "The Use of Well-Log Data in the Geomechanical Characterization of Middle Cambrian Tight Sandstone Formation: A Case Study from Eastern Pomerania, Poland" Energies 14, no. 19: 6022. https://doi.org/10.3390/en14196022
APA StyleSłota-Valim, M., & Lis-Śledziona, A. (2021). The Use of Well-Log Data in the Geomechanical Characterization of Middle Cambrian Tight Sandstone Formation: A Case Study from Eastern Pomerania, Poland. Energies, 14(19), 6022. https://doi.org/10.3390/en14196022